Article

Characteristics of Changes in Land Use Intensity in Xinjiang Under Different Future Climate Change Scenarios

1
Xinjiang Engineering Technology Research Center of Soil Big Data, Xinjiang Agricultural University, Urumqi 830052, China
2
Xinjiang Key Laboratory of Soil and Plant Ecological Processes, Xinjiang Agricultural University, Urumqi 830052, China
3
Institute of Natural Resources Planning of the Autonomous Region, Urumqi 830052, China
4
Key Laboratory of Coastal Science and Integrated Management, First Institute of Oceanography, Ministry of Natural Resources, Qingdao 266061, China
*
Authors to whom correspondence should be addressed.
Sustainability 2025, 17(10), 4322; https://doi.org/10.3390/su17104322
Submission received: 30 March 2025 / Revised: 28 April 2025 / Accepted: 7 May 2025 / Published: 9 May 2025

Abstract

:
Climate change drives land use intensity changes in Xinjiang, a typical inland arid region. There are relatively few studies on the changes in land use intensity under future climate change. For this purpose, this study adopts the Patch-level Land Use Simulation (PLUS) model and the Markov chain model, combined with shared socioeconomic pathways (SSPs). This study uses the PLUS model to make projections of land use/land cover (LULC) in Xinjiang under different climate scenarios for 2025–2060, constructs a land use intensity atlas to visualize regional spatial patterns, and analyzes the driving factors. The results show that under the SSP126 scenario, the cropland area decreases sharply while the forest, grassland, and water area expand rapidly. However, under the SSP245 and SSP585 scenarios, this trend is obviously reversed; the cropland area expands quickly, and the area of grassland and water decreases. In addition, under the SSP126 scenario, the management and control of LULC are strict, and it may be significantly affected by the conversion of cropland to forest, and the change of forest is relatively active. Under the SSP585 scenario, productivity increases, which may exacerbate the use of constructed land, and the change of constructed land is relatively active. Land use intensity may not significantly promote changes in land type proportions in the region. Population density and GDP are key drivers of land use intensity, showing relatively significant spatial heterogeneity. This study conducts research on the trend of LULC changes under different future climate scenarios, providing data support for the sustainable development of LULC and helping the government formulate different policies to cope with future LULC changes.

1. Introduction

The intensity of land use reflects the extent of human impact on land, serving as an effective means of measuring the degree of human activities and the corresponding land outputs resulting therefrom. Differences in land use intensity have significant implications for ecosystem services and functions [1]. The study of land use intensity is indispensable for expressing human–land relations more directly and reflecting the state of social development in each period. Additionally, land use/land cover (LULC), as a key indicator of human activity, is a prominent manifestation of global terrestrial changes [2]. LULC changes can be used to evaluate the development of a region and to allocate and utilize natural resources more rationally [3]. Land use intensity advances LULC studies from static mapping to dynamic pressure assessment, supporting sustainable land governance.
Land use intensity is influenced by both natural geographical and socioeconomic factors, which affect LULC changes and, consequently, land use intensity. The interaction of these factors collectively alters the efficiency, methods, and objectives of LULC [4]. Therefore, examining land use intensity changes in typical inland arid regions with temperate continental climates is crucial for promoting sustainable national spatial resource utilization. Previous research has applied various predictive models, such as the Cellular Automate–Markov Chain Model (CA–Markov); Patch-level Land Use Simulation (PLUS); Conversion of Land Use and its Effects at Small regional extent (CLUE-S); slope, land use, exclusion, urban extent, transportation, hill shade (SLEUTH); and Land Change Modeler (LCM) models [5,6,7,8,9]. The PLUS model has been used in arid regions, and the model can generate patches with high accuracy, enable the assignment of dynamic driver weights, and directly integrate CMIP6 climate data. This study incorporates socioeconomic factors and natural geographical factors to predict future LULC using the PLUS model. When combined with Coupled Model Intercomparison Project Phase 6 (CMIP6) data, this approach is of significant value in revealing the intensity of LULC changes in Xinjiang.
CMIP6 is a Global Climate Model Intercomparison Project (GCMIP) coordinated by the World Climate Research Program (WCRP), which aims to provide scientific projections of future climate change through integrated multi-model simulations. Although CMIP6 predictions are subject to localized topographic complexities that do not fully capture microclimate changes, their data are widely used in IPCC assessment reports and climate change studies [10]. In 2019, China committed to achieving “carbon neutrality” by 2060, a policy expected to have significant implications for LULC. The IPCC’s CMIP6 data provide a global framework for such predictions [11]. Previous studies have used SSP scenarios to simulate land use dynamics in regions like Inner Mongolia [12] and the Guangdong Area [13]. However, Xinjiang remains understudied in this regard despite facing unique challenges such as complex topography, diverse ecosystems, and fragile ecological conditions. The region’s land use intensity is generally low due to limited precipitation [14]. Therefore, simulating LULC under future climate scenarios in Xinjiang, incorporating potential socioeconomic shifts, is critical for understanding and managing the region’s land use intensity.
LULC changes can be reflected through the land use transition matrix, which indicates the direction and quantity of transitions between various land categories. Previous studies have primarily utilized the land use transition matrix for spatiotemporal analyses of LULC [15], driving force analysis [16], scenario simulations [17], and studies of land use dynamic degrees [18]. Most research has directly analyzed changes in land category areas using the matrix without exploring deeper potential relationships. For instance, during future periods, which land categories tend to transition into others? Do these transitions lead to significant changes in their regional proportions? Obviously, the information on LULC changes derived directly from the transformation matrix only reveals that the dynamic change process cannot fully answer these questions. However, intensity map (IM) modeling can be used to construct intensity maps and visualize key patterns of regional land use change [19]. So far, no one has used IM to study the intensity of land use in Xinjiang. Therefore, the IM model is required to perform an expanded analysis of land use intensity.
To explore the factors driving land use intensity, previous studies have applied methods such as Geographically Weighted Regression (GWR) [20], Multiscale GWR (MGWR) [21], Geographically and Temporally Weighted Regression (GTWR) [22], and logistic regression models [23]. However, traditional GWR models fail to account for spatial variability at different scales. The more advanced MGWR model has been used in recent studies to explore factors influencing urban resilience and urban expansion [24]. However, the driving mechanisms of land use intensity under climate change scenarios remain underexplored. Therefore, this study systematically analyzes these drivers using the MGWR model.
To date, no research has focused on land use intensity in Xinjiang’s arid regions under future climate scenarios. Therefore, this study represents a pioneering effort. Using the CMIP6–PLUS–IM–MGWR model, this research simulates multiple land use scenarios, predicts future LULC changes, and analyzes the intensity and drivers of land use. The findings will provide data support for anticipating future land use intensity in Xinjiang and offer theoretical guidance for managing these changes, particularly in the context of China’s dual-carbon policy.
This study aims to:
(1)
Explore the spatiotemporal heterogeneity of Xinjiang under three future SSP scenarios (SSP126, SSP245, SSP585) using a multi-source data and multi-temporal framework;
(2)
Characterize the evolution of land use intensity under future climate change scenarios;
(3)
Identify the driving mechanisms of land use intensity and propose sustainable development strategies for Xinjiang.

2. Materials and Methods

2.1. Study Area

Xinjiang covers an area of approximately 1.66 million km2 [25]. However, its population density is low, with only about 25 million inhabitants [26]. The region’s Gross Domestic Product (GDP) per capita is only CNY 0.0451 million, ranking 21st among China’s 31 provinces [27]. The geomorphology of the region is summarized as “three mountains and two basins”: the Altai Mountains, the Kunlun Mountains, and the Tian Shan Mountains dividing Xinjiang into north and south, with the Tarim Basin in the southern part of the region and the Junggar Basin in the northern part of the region being the first and second largest basins in China, respectively [28]. Xinjiang experiences an arid and semi-arid temperate continental climate, with limited water resources, an average annual precipitation ranging from 10 to 400 mm, and high evaporation [29]. The region’s natural environment is diverse and complex, with a fragile ecological system that has long faced challenges such as desertification and soil erosion. As urbanization accelerates and the population continues to grow, Xinjiang’s land resources are under increasing pressure [27]. Therefore, investigating land use intensity dynamics under future climate scenarios is critical for developing sustainable land management strategies in Xinjiang (Figure 1).

2.2. Data Sources and Processing

The data used in this study are sourced from various datasets, including basic geographic information and land use, socioeconomic, and future climate data in Xinjiang. (1) The basic geographic information and land use data were obtained from the Resource and Environment Science Data Center of the Chinese Academy of Sciences (www.resdc.cn) [30]. The land use data (30 m × 30 m; 2010, 2015, and 2020) are categorized into six types: cropland, forest, grassland, water, constructed land, and bare land. (2) The DEM data (30 m × 30 m; 2020) were sourced from the Geospatial Data Cloud, and slope data were derived from the DEM dataset. Soil type data (1 km × 1 km; 2010–2012) were obtained from the Food and Agriculture Organization (FAO) of the United Nations (https://www.fao.org). (3) Population distribution and GDP data (1 km × 1 km; 2019) were collected from previous studies [31]. (4) Road network data were extracted from OpenStreetMap (https://www.openstreetmap.org), with river system data obtained from China’s National Geographic Information Resource Service System (http://www.webmap.cn). (5) Future climate data were sourced from the Coupled Model Intercomparison Project (CMIP6) (https://esgf-data.dkrz.de), and we used the CNRM-CM6-1 model to provide future temperature and precipitation data for the SSP126, SSP245, and SSP585 scenarios, and then downscaled the CMIP6 data using the dynamic downscaling method [32]. (6) Potential evapotranspiration data (30 arcs; 2019) came from Zomer’s global dataset [33] (Table 1). To ensure the robustness of the model and consistency in spatial data accuracy, the Weather Research and Forecasting (WRF) method, along with ArcGIS 10.8’s clipping and resampling tools, was used to process the model’s driving factors, land use data, and CMIP6 data. In addition, a bi-linear interpolation method was used to resample all raster data to a 250 m × 250 m resolution [34].

2.3. Research Methodology

The research methodology can be divided into the following three steps, as shown in Figure 2. First, based on the LULC data from the historical period and combined with the corresponding driver data, the LULC model is used to simulate different development scenarios in Xinjiang in the future. Second, based on the LULC dataset from historical and future periods, the IM model is used to visualize the land use intensity and explore the trend of land use intensity transfer. Third, the MGWR model is used to analyze the driving factors of land use intensity.

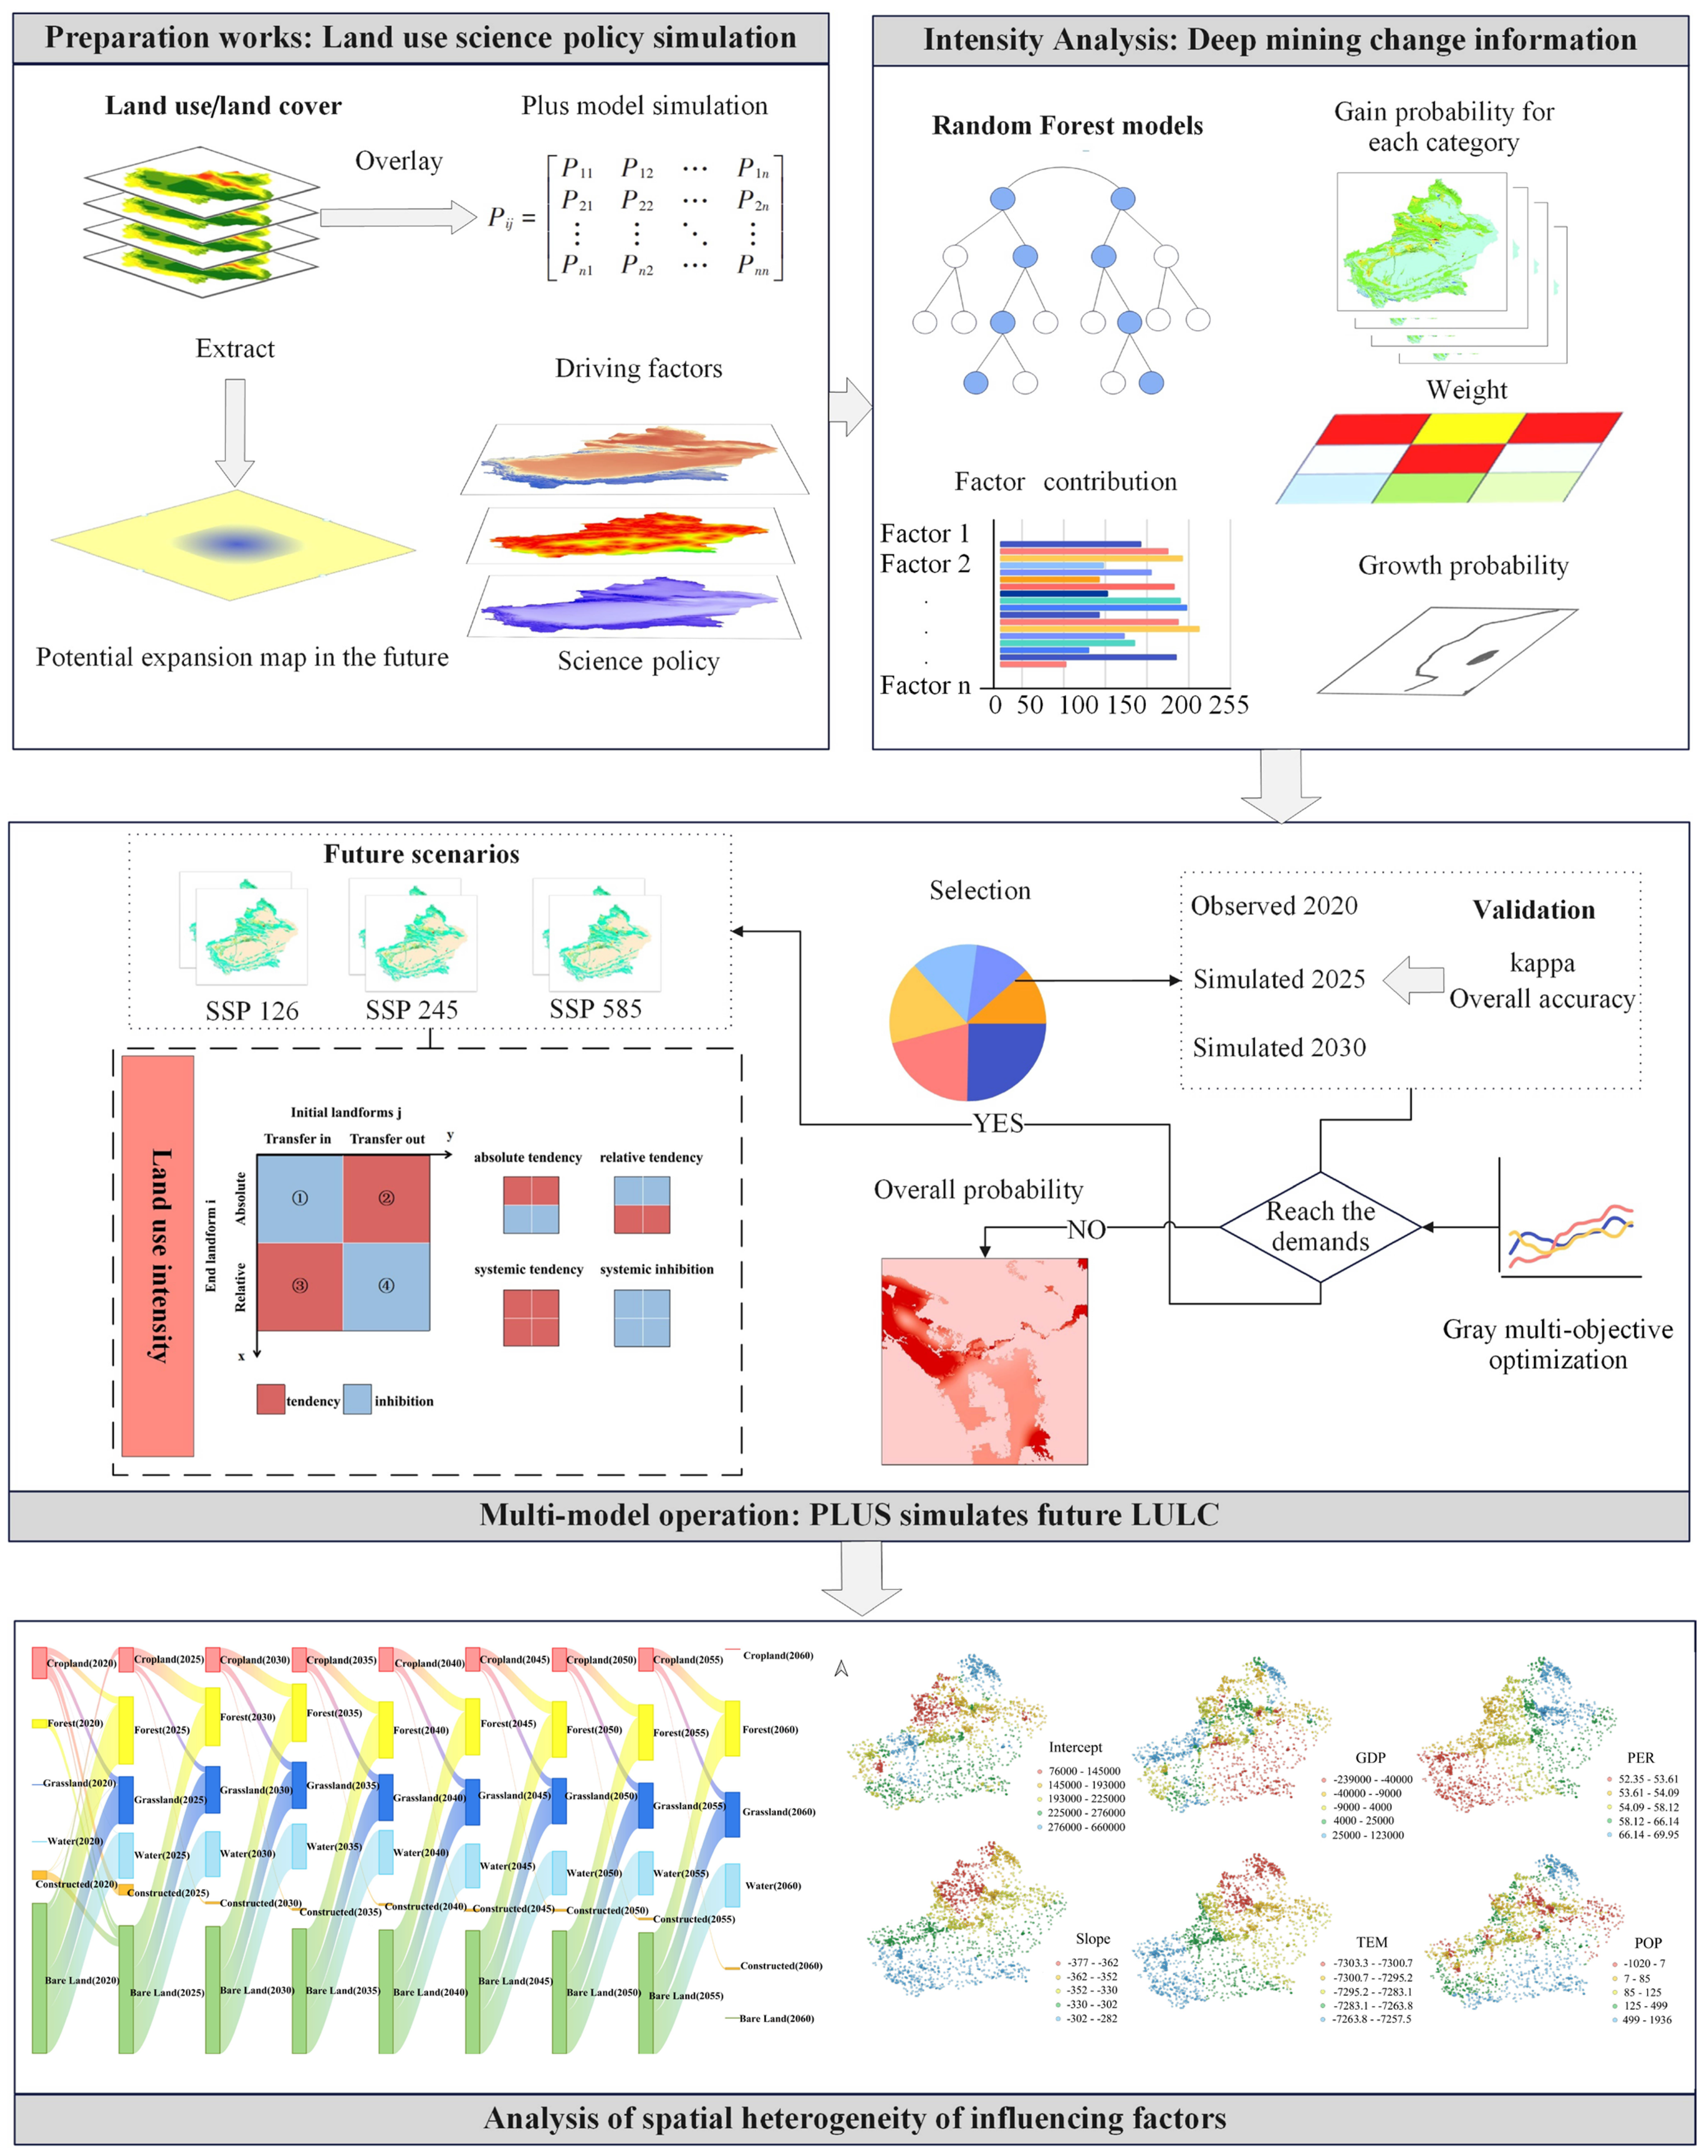
2.3.1. LULC Modeling Under Different Future Climate Scenarios

The latest CMIP6 has demonstrated that by using shared socioeconomic pathways (SSPs), it is possible to provide plausible projections of future global climate and socioeconomic changes. These SSP scenarios include SSP126, a green and sustainable development pathway where LULC is tightly regulated; SSP245, a path where LULC change is poorly controlled and social, economic, and technological trends follow historical patterns; and SSP585, a pathway where the global economy grows at a high rate and focuses more on fossil fuel development [35]. In the context of CMIP6, the Weather Research and Forecasting (WRF) model, serving as a dynamic downscaling tool, is applied to simulate regional climates with high resolution [36,37]. WRF is a mesoscale numerical weather prediction model that is designed for atmospheric research and operational forecasting applications. It employs non-hydrostatic compressible equations to simulate the atmosphere on a horizontal grid. In CMIP6, WRF is utilized as a dynamic downscaling tool to transform the relatively coarse resolution data output by General Circulation Models (GCMs) into high-resolution data so as to simulate more realistic climate changes [38].
In this study, we collected socioeconomic factors (Gross Domestic Product, Gross Primary Productivity, population, Net Primary Productivity) and natural factors (Digital Elevation Model, slope, Minimum Temperature, Soil type, precipitation, Waterways, Railways, secondary roads, main roads, Maximum Temperature, Temperature) to facilitate LULC simulation. The LEAS model employed a two-phase iterative process using land use data, where state changes in later-stage land use data served as indicators reflecting shifts in different land use patterns. We utilized the random forest (RF) algorithm to investigate the correlations between various land use patterns and multiple driving factors, deriving transition patterns for each land use type to evaluate their development potential. To estimate future land use demand under different climate change scenarios, this study leveraged historical land use data [39] (specifically, land use change data for Xinjiang in 2010, 2015, and 2020) and the Markov chain method [40]. The estimated demand was then input into the PLUS model as a parameter for future land use projections. The accuracy of land use demand estimation was validated using 2020 historical data. Additionally, LULC-influencing factors were input into the RF model as predictor variables to determine the development potential of each land use type. Upon confirming sufficient simulation accuracy, the study incorporated driving factors and land use demand (at 5-year intervals from 2020 to 2060) under different scenarios into the PLUS model. Based on 2020 LULC data, the model projected spatiotemporal changes in future land use distribution. By integrating the PLUS with CMIP6 data, this research achieved a more comprehensive and detailed simulation of future land use spatial allocation. Consequently, the projected land use patterns in this study provide deeper insights compared to prior research. Furthermore, within the PLUS model framework, when the neighborhood effect k of land use is set to 0, the transition probabilities of various land use types exhibit the following characteristics. The calculation formula is presented as follows [4,5]:
O P i , k 1 , t = P i , k 1 × r × μ k × D k t                   if   Ω i , k t = 0   and   r < P i , k 1 P i , k 1 × Ω i , k t × D k t                                                                               all   others
In Formula (1), the surface probability of each land type is P i , k 1 . r is a random value within the range of 0–1. μ k is the threshold for land use type k to generate a new kind. D k t denotes the influence of the demand for future land use type k. Ω i , k t denotes the neighborhood effects of the cells i . In this study, the parameter settings of the PLUS model are as follows: With the uniform sampling method, the number of decision trees is set to 50, and the sampling rate is 0.01. The number of features used to train the random forest model is 12, which is consistent with the number of driving factors. The adjustment of the model parameters is based on the model manual and the parameters set in previous studies in arid regions [4]. Therefore, by combining the PLUS model with CMIP6 data, a more comprehensive and detailed simulation of future LULC spatial distribution can be achieved.

2.3.2. Intensity Analysis Method

In order to study the intensity of land use, previous studies have primarily focused on calculating and comparing composite indices of land use intensity [41]. Therefore, intuitively visualizing land use intensity enables better identification of land classes. Based on this, this study draws on the framework of land use intensity analysis proposed by previous researchers to construct the criteria for judging the trend of land type conversion in absolute quantity. The IM model is adopted to build the land use change intensity atlas. The IM model is a spatial model used to analyze and visualize land use intensity. The IM model can intuitively present land use intensity in the form of a map, helping decision-makers and researchers better understand the spatial pattern and changing trends of land use intensity, which is obtained through the calculation of the IM model. The principles of the formulas are the same. Among them, the formula for the absolute transfer intensity is as follows [19]:
A I i n = C i n / ( Y t + 1 Y t ) i = 1 I C i n
In Formula (2), represents the absolute transfer-in intensity; i represents the land use type at the beginning of the period; n represents the land use type of the transferred type; C i n represents the land area of land use type i, which is transferred to land use type n within the time interval [ Y t , Y t + 1 ].
This study uses the land use transition matrix from 2020 to 2060 to calculate land use intensity and generate intensity maps in the IM model. Intensity analysis is divided into absolute and relative intensity. Absolute intensity measures the total number of transitions between land categories over time, while relative intensity examines how transition intensities affect land use structure. In both cases, values above the average indicate higher transition rates into or out of a category, while below-average values suggest inhibited transitions. The principles of tendency and inhibition in relative intensity align with those in absolute intensity. In addition, when both the absolute transfer-in and absolute transfer-out intensities have a tendency to be, it means that they have an absolute tendency to be. Similarly, a relative tendency is confirmed when relative transfer-in and transfer-out intensities both show a tendency. A systematic tendency is demonstrated only when both absolute and relative tendencies are simultaneously satisfied in the transformation process.

2.3.3. Analysis of Factors Influencing Land Use Intensity

Multiple factors influence the intensity of LULC change, and its underlying mechanisms are complex. Previous studies have primarily employed GWR to analyze driving factors [42]. However, with the increasing diversity of data modeling scenarios and the growing complexity of spatial data scales, the MGWR method, an advanced extension of GWR, offers improved robustness and generalization. Previous studies have shown that natural and socioeconomic factors are important factors affecting the intensity of land use. Therefore, in this study, we considered 10 different drivers of the natural geographic factors (such as DEM, slope, temperature, precipitation, Waterways, secondary roads, main roads, and evaporation) and socioeconomic factors (such as population and GDP). We resampled all data to a spatial resolution of 250 m × 250 m. In addition, due to differences in the range of values, normalization is necessary to eliminate scale effects. MGWR is applied to analyze the relationships between the independent and dependent variables. The dependent variable, land use intensity, classifies different land use types into six categories: bare land, forest, grassland, water areas, agricultural land, and constructed land. A grading index is set for each category (Table 2). A comprehensive index of land use intensity is used to express the land use intensity quantitatively and is calculated as follows [43,44]:
L j = 100 × i = 1 n A i × C i
L j represents the composite land use intensity index for a given land category; A i represents the grading index of land use degree at the i-th level; C i represents the percentage of the area of land use degree grading at the i-th level; n represents the number of land use degree grading. In addition, in order to ensure the consistency and accuracy of the data, the data resolution used for calculating the percentage of each land use type is 250 m × 250 m, and the data resolution after the intensity calculation also remains 250 m × 250 m.
Table 2. Classification series of land use degree.
TypeBare Land LevelForest, Grassland, and Water LevelAgricultural Land LevelConstructed Land Level
Land Use CategoriesBare LandForest, Grassland, and WaterCropland Constructed land
Grading Index1234

3. Analysis with Results

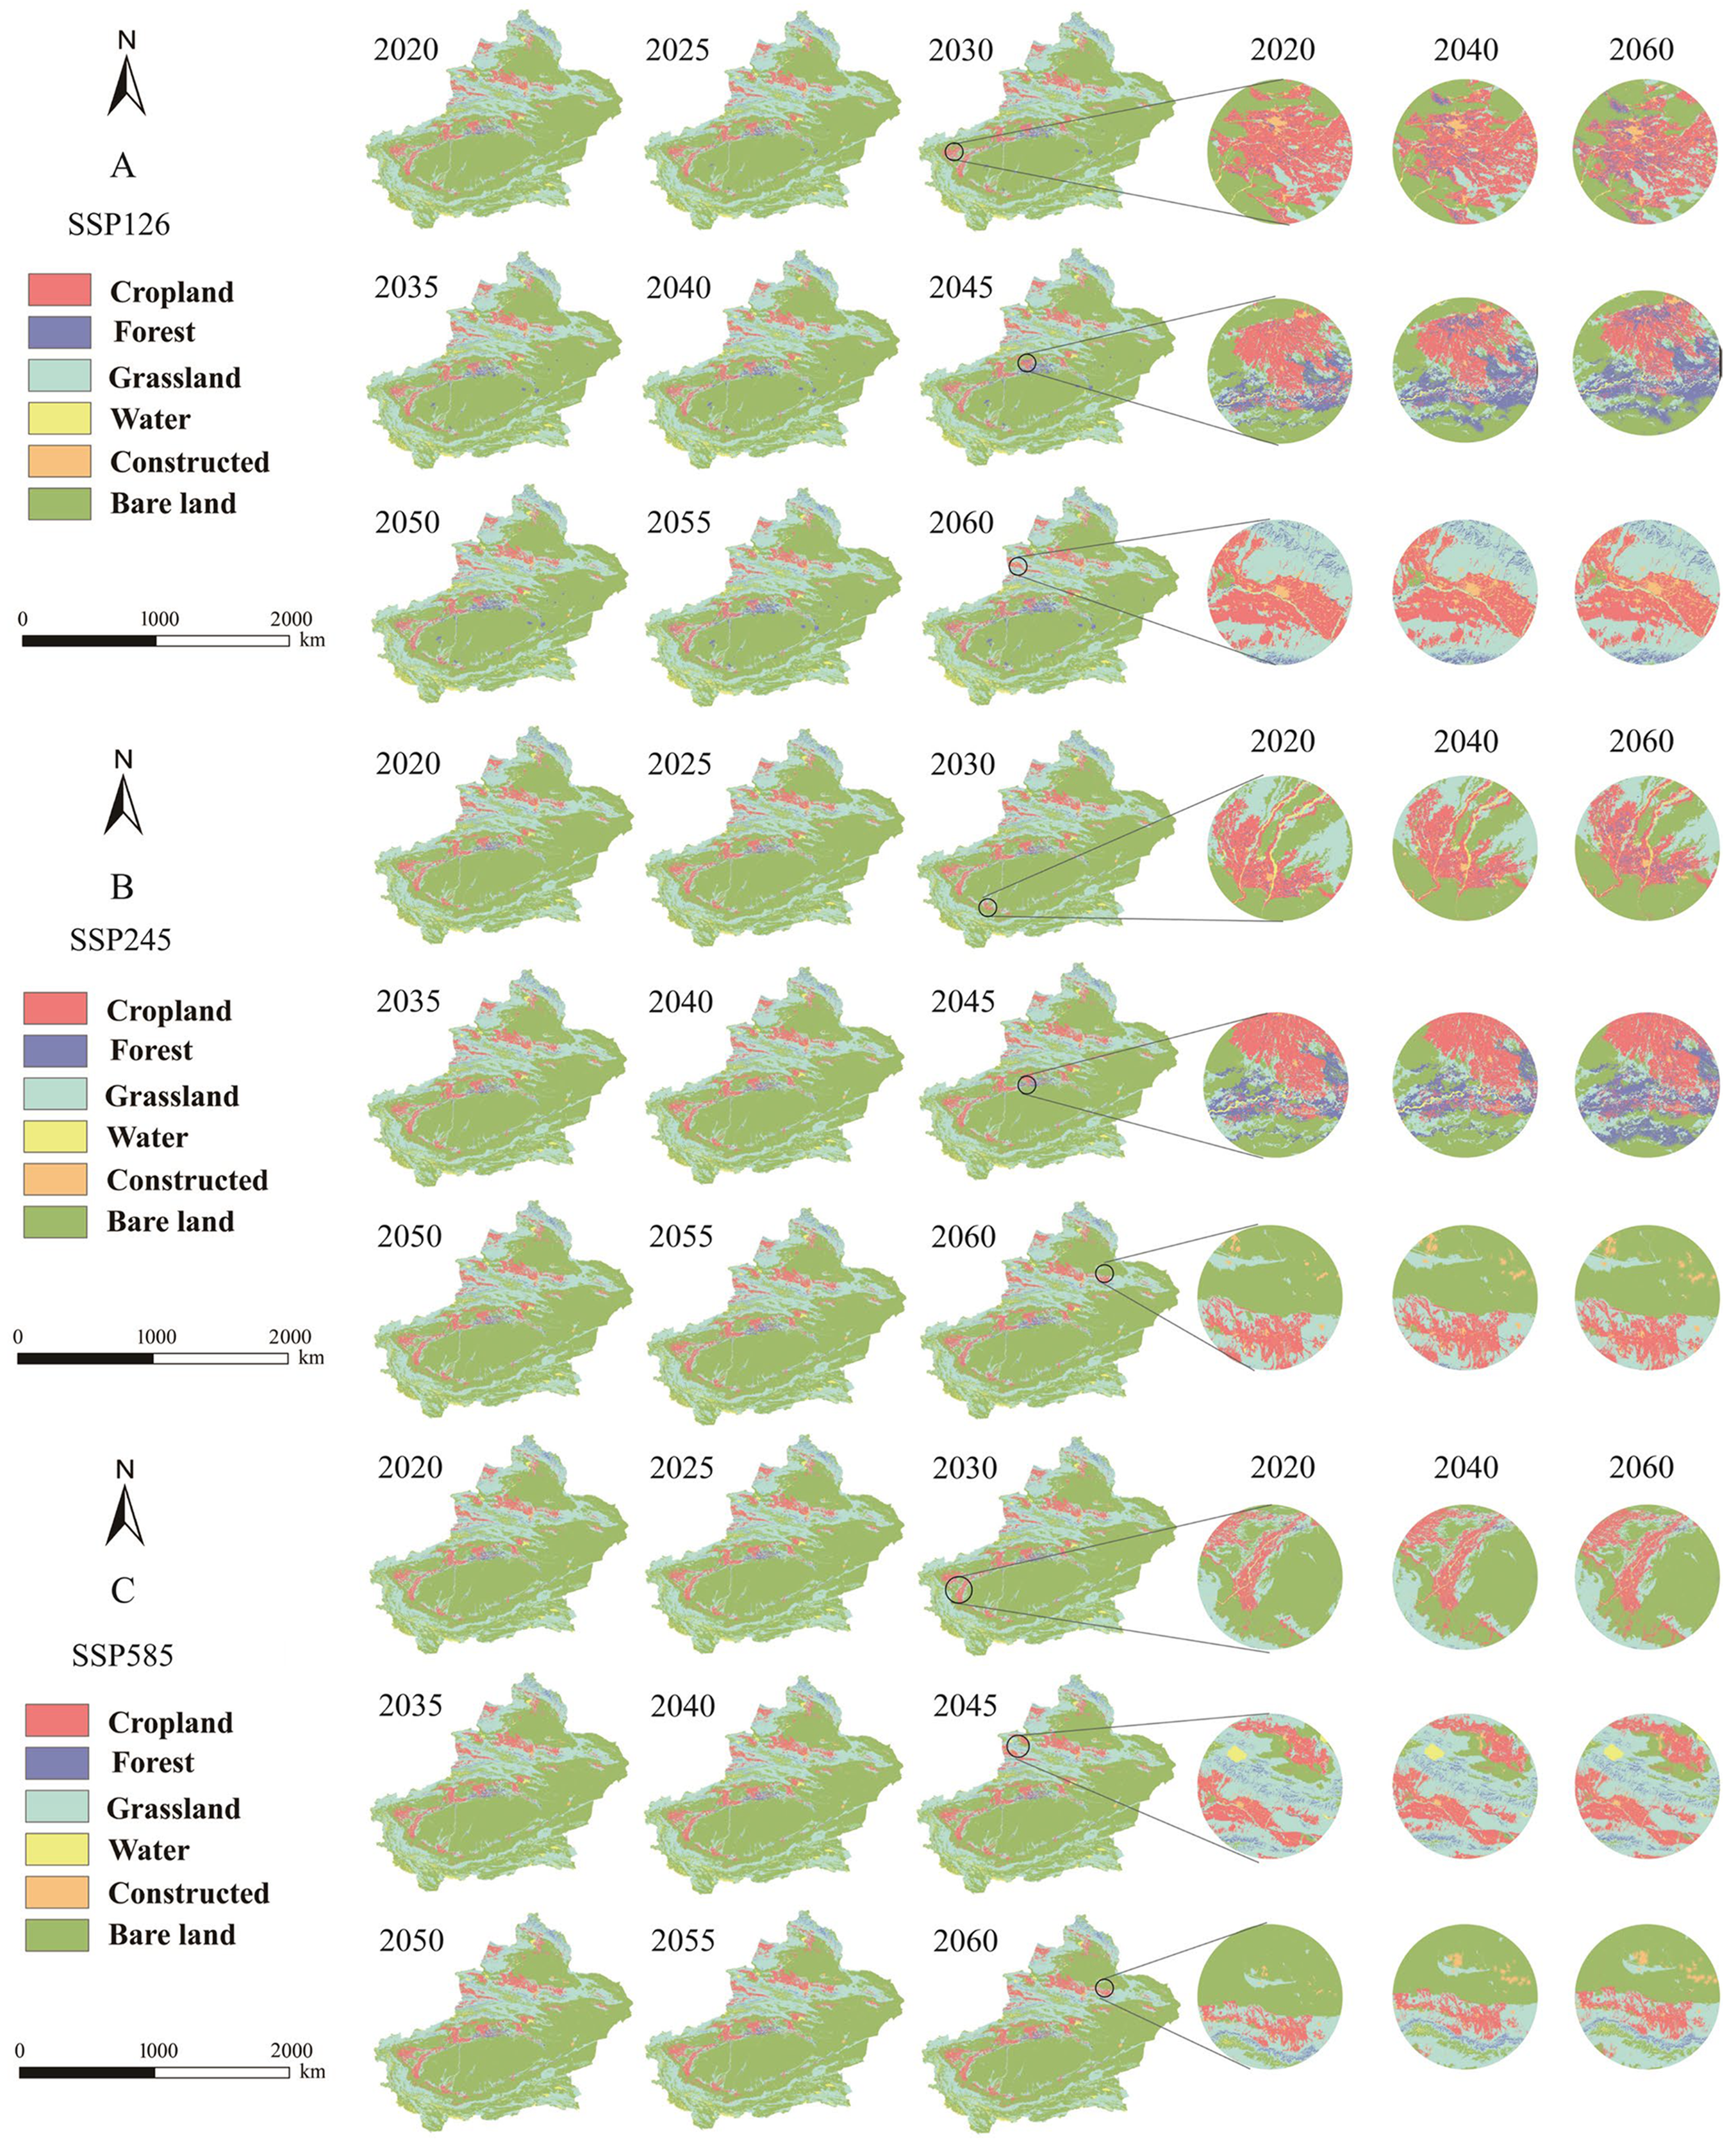
3.1. LULC Change Analysis

This study analyzes actual LULC data for 2015 and 2020 in comparison to LULC data for the same years after simulation based on the PLUS model. Some studies demonstrate that if a Kappa coefficient exceeds 0.75, the simulation accuracy is reliable [8]. This study calculated Kappa coefficients and accuracy values of 0.931 and 0.905, respectively, with overall accuracies of 0.964 and 0.949. These results indicate that the simulation outcomes in this study are highly reliable.
This study used the PLUS model to simulate LULC datasets for Xinjiang from 2025 to 2060, with five-year intervals, under different scenarios. The changes in the area of each LULC type under the three scenarios were calculated. Under the SSP126 scenario, compared to 2020, by 2060, forest, grassland, water, and constructed land are projected to show a slow expansion, with increases of 64.8%, 2.9%, 39.9%, and 6.5%, respectively. In contrast, cropland and bare land are expected to experience a gradual contraction, decreasing by 8.3% and 4%, respectively. Under the SSP245 scenario, compared to 2020, by 2060, cropland, forest, and constructed land are projected to expand slowly, with increases of 9.5%, 8.5%, and 22.1%, respectively. Grassland, water, and bare land are expected to gradually shrink, with reductions of 0.68%, 2.96%, and 0.96%, respectively. Under the SSP585 scenario, compared to 2020, by 2060, the LULC trends show a rapid expansion of cropland and constructed land, with increases of 30.9% and 50.6%, respectively. Meanwhile, forest, grassland, water, and bare land are expected to experience a slow contraction, with decreases of 4.99%, 2.15%, 4.74%, and 1.99%, respectively (Figure 3).
To explore the spatiotemporal flow differences of various land types in Xinjiang under the SSP126, SSP245, and SSP585 scenarios, this study calculates the areas of LULC from 2020 to 2060 and generates Sankey diagrams for each scenario. Under the SSP126 scenario, the forest area is projected to expand by 17,846.44 km2 by 2060, whereas the cropland area is expected to contract by 7475.25 km2. Under the SSP245 scenario, the area of constructed land is anticipated to increase by 2002.125 km2, while the water area is likely to decrease by 1031.25 km2. Under the SSP585 scenario, the cropland area is predicted to expand by 27,905.44 km2. The expansion of construction land will be particularly notable, with an area increase of approximately 4593.69 km2. In comparison, the water area is projected to shrink by 1649.3125 km2 (Figure 4).

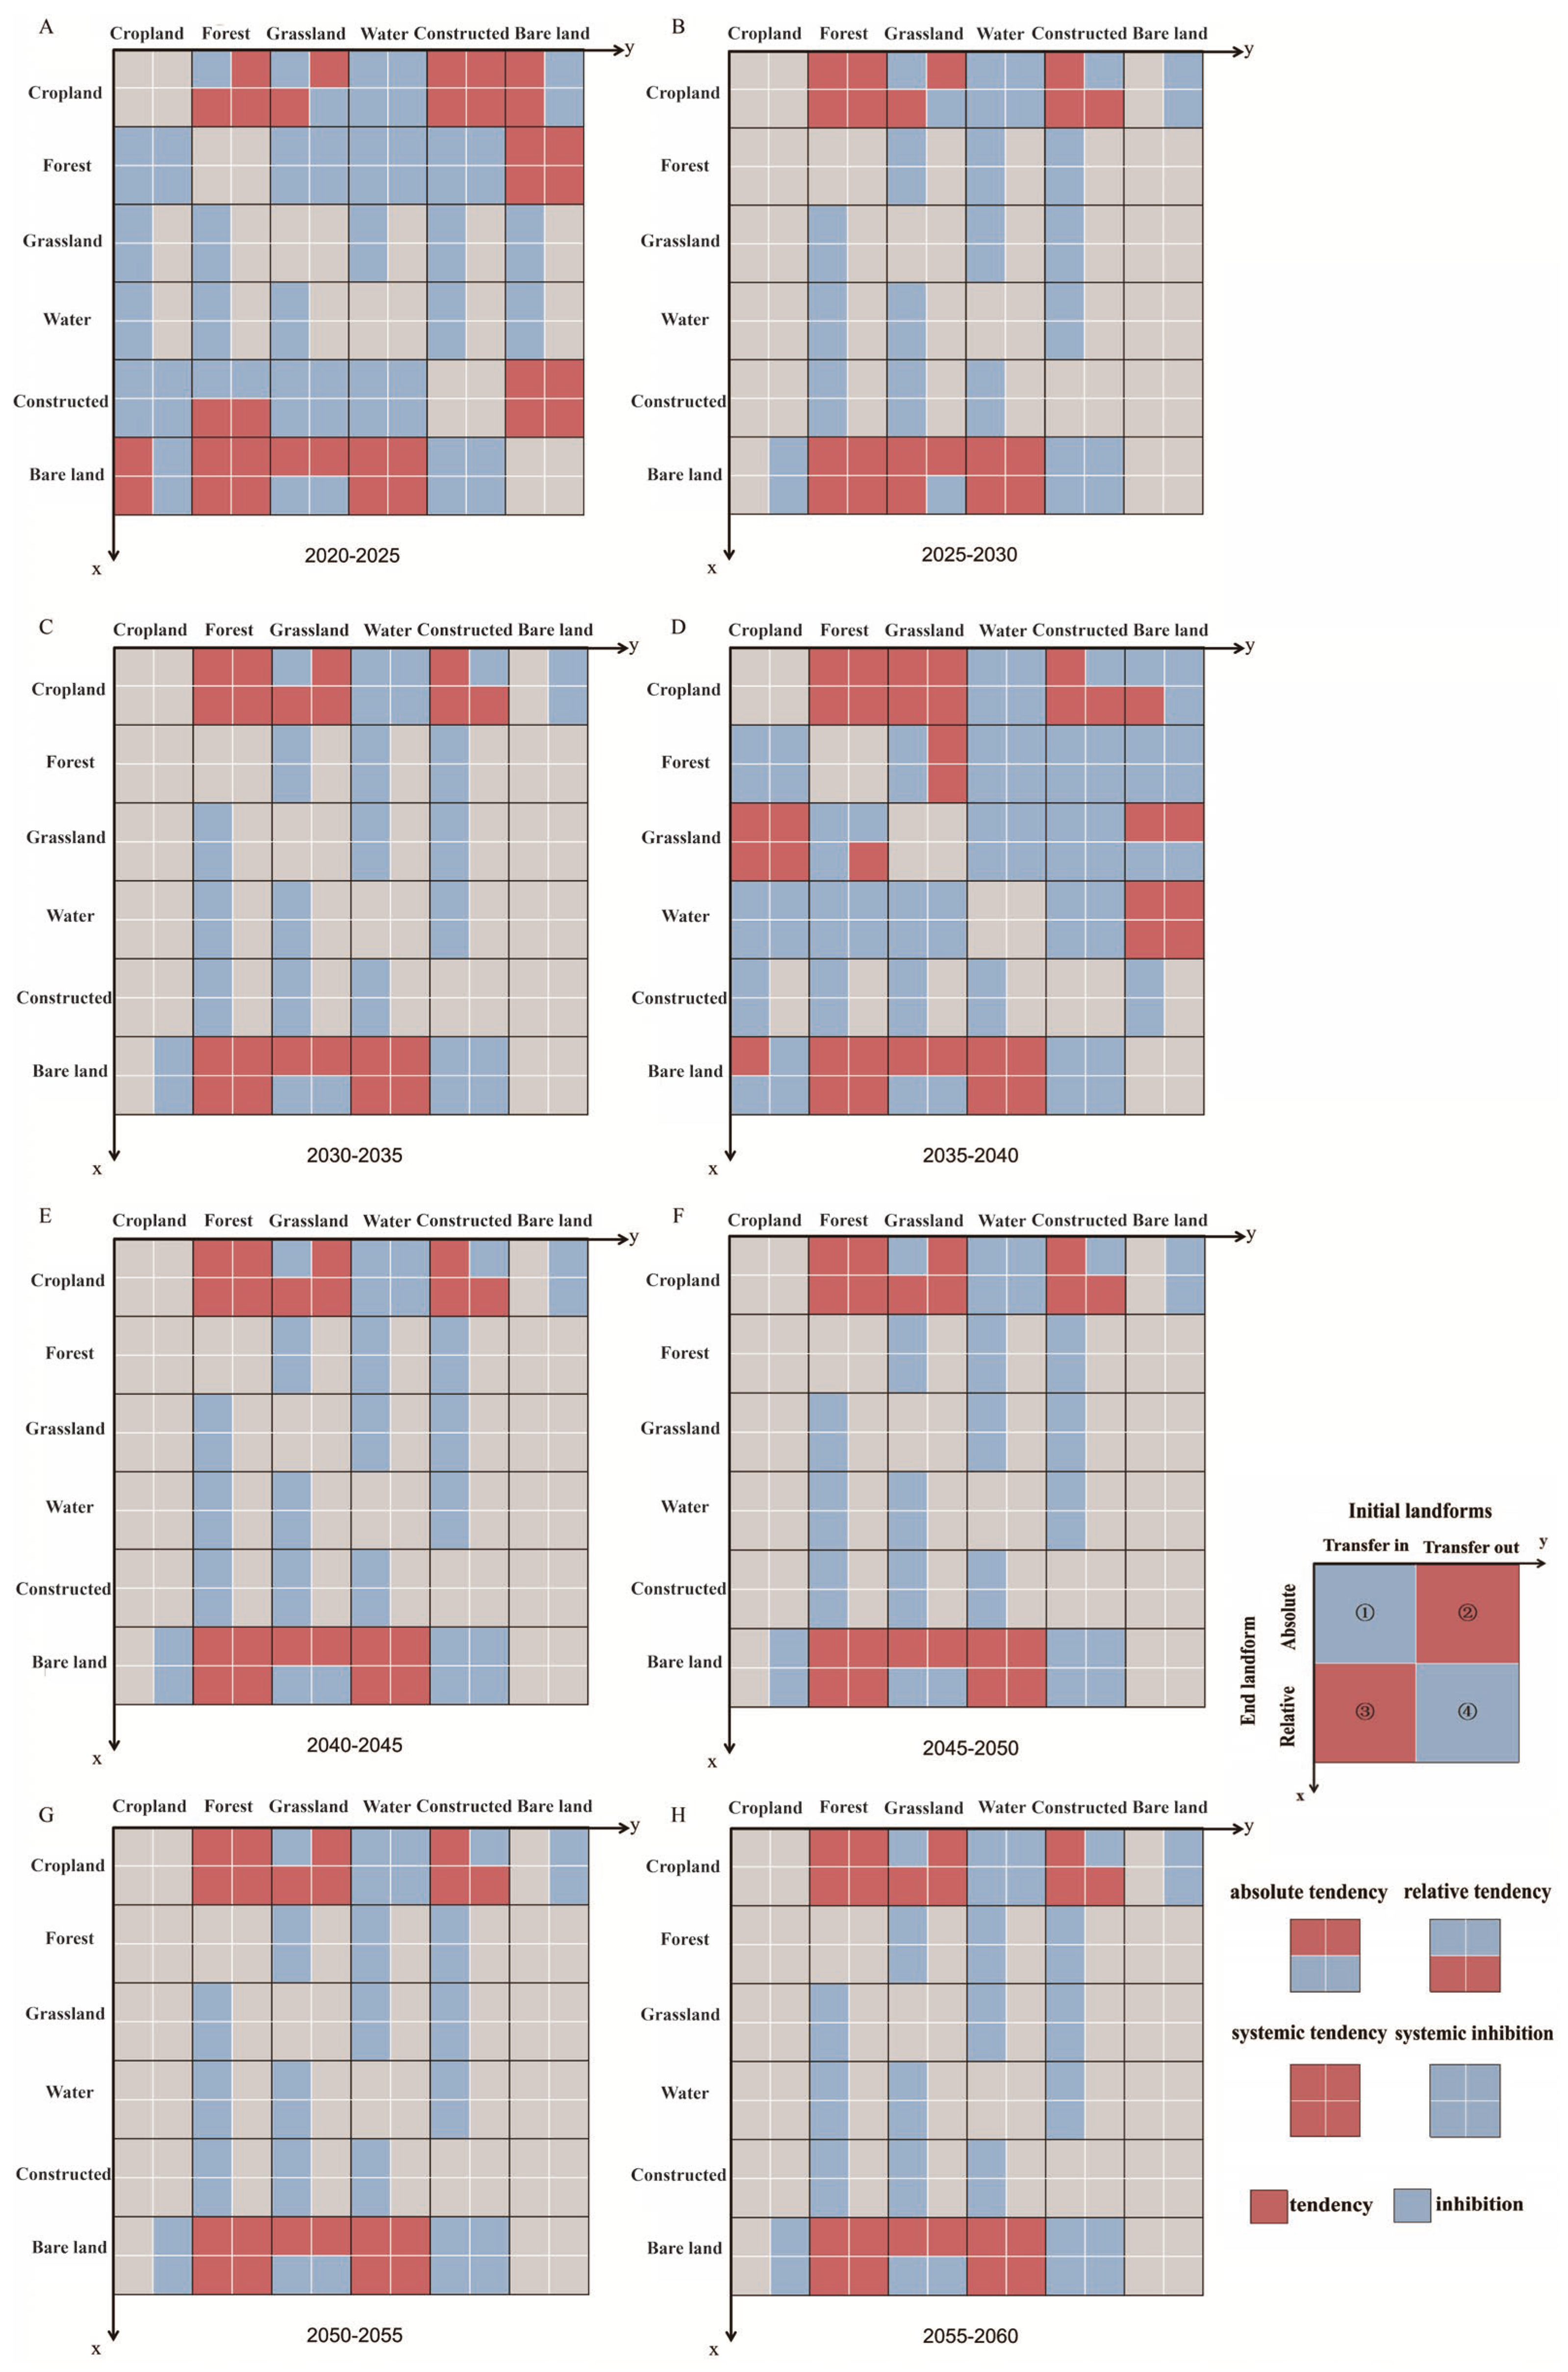
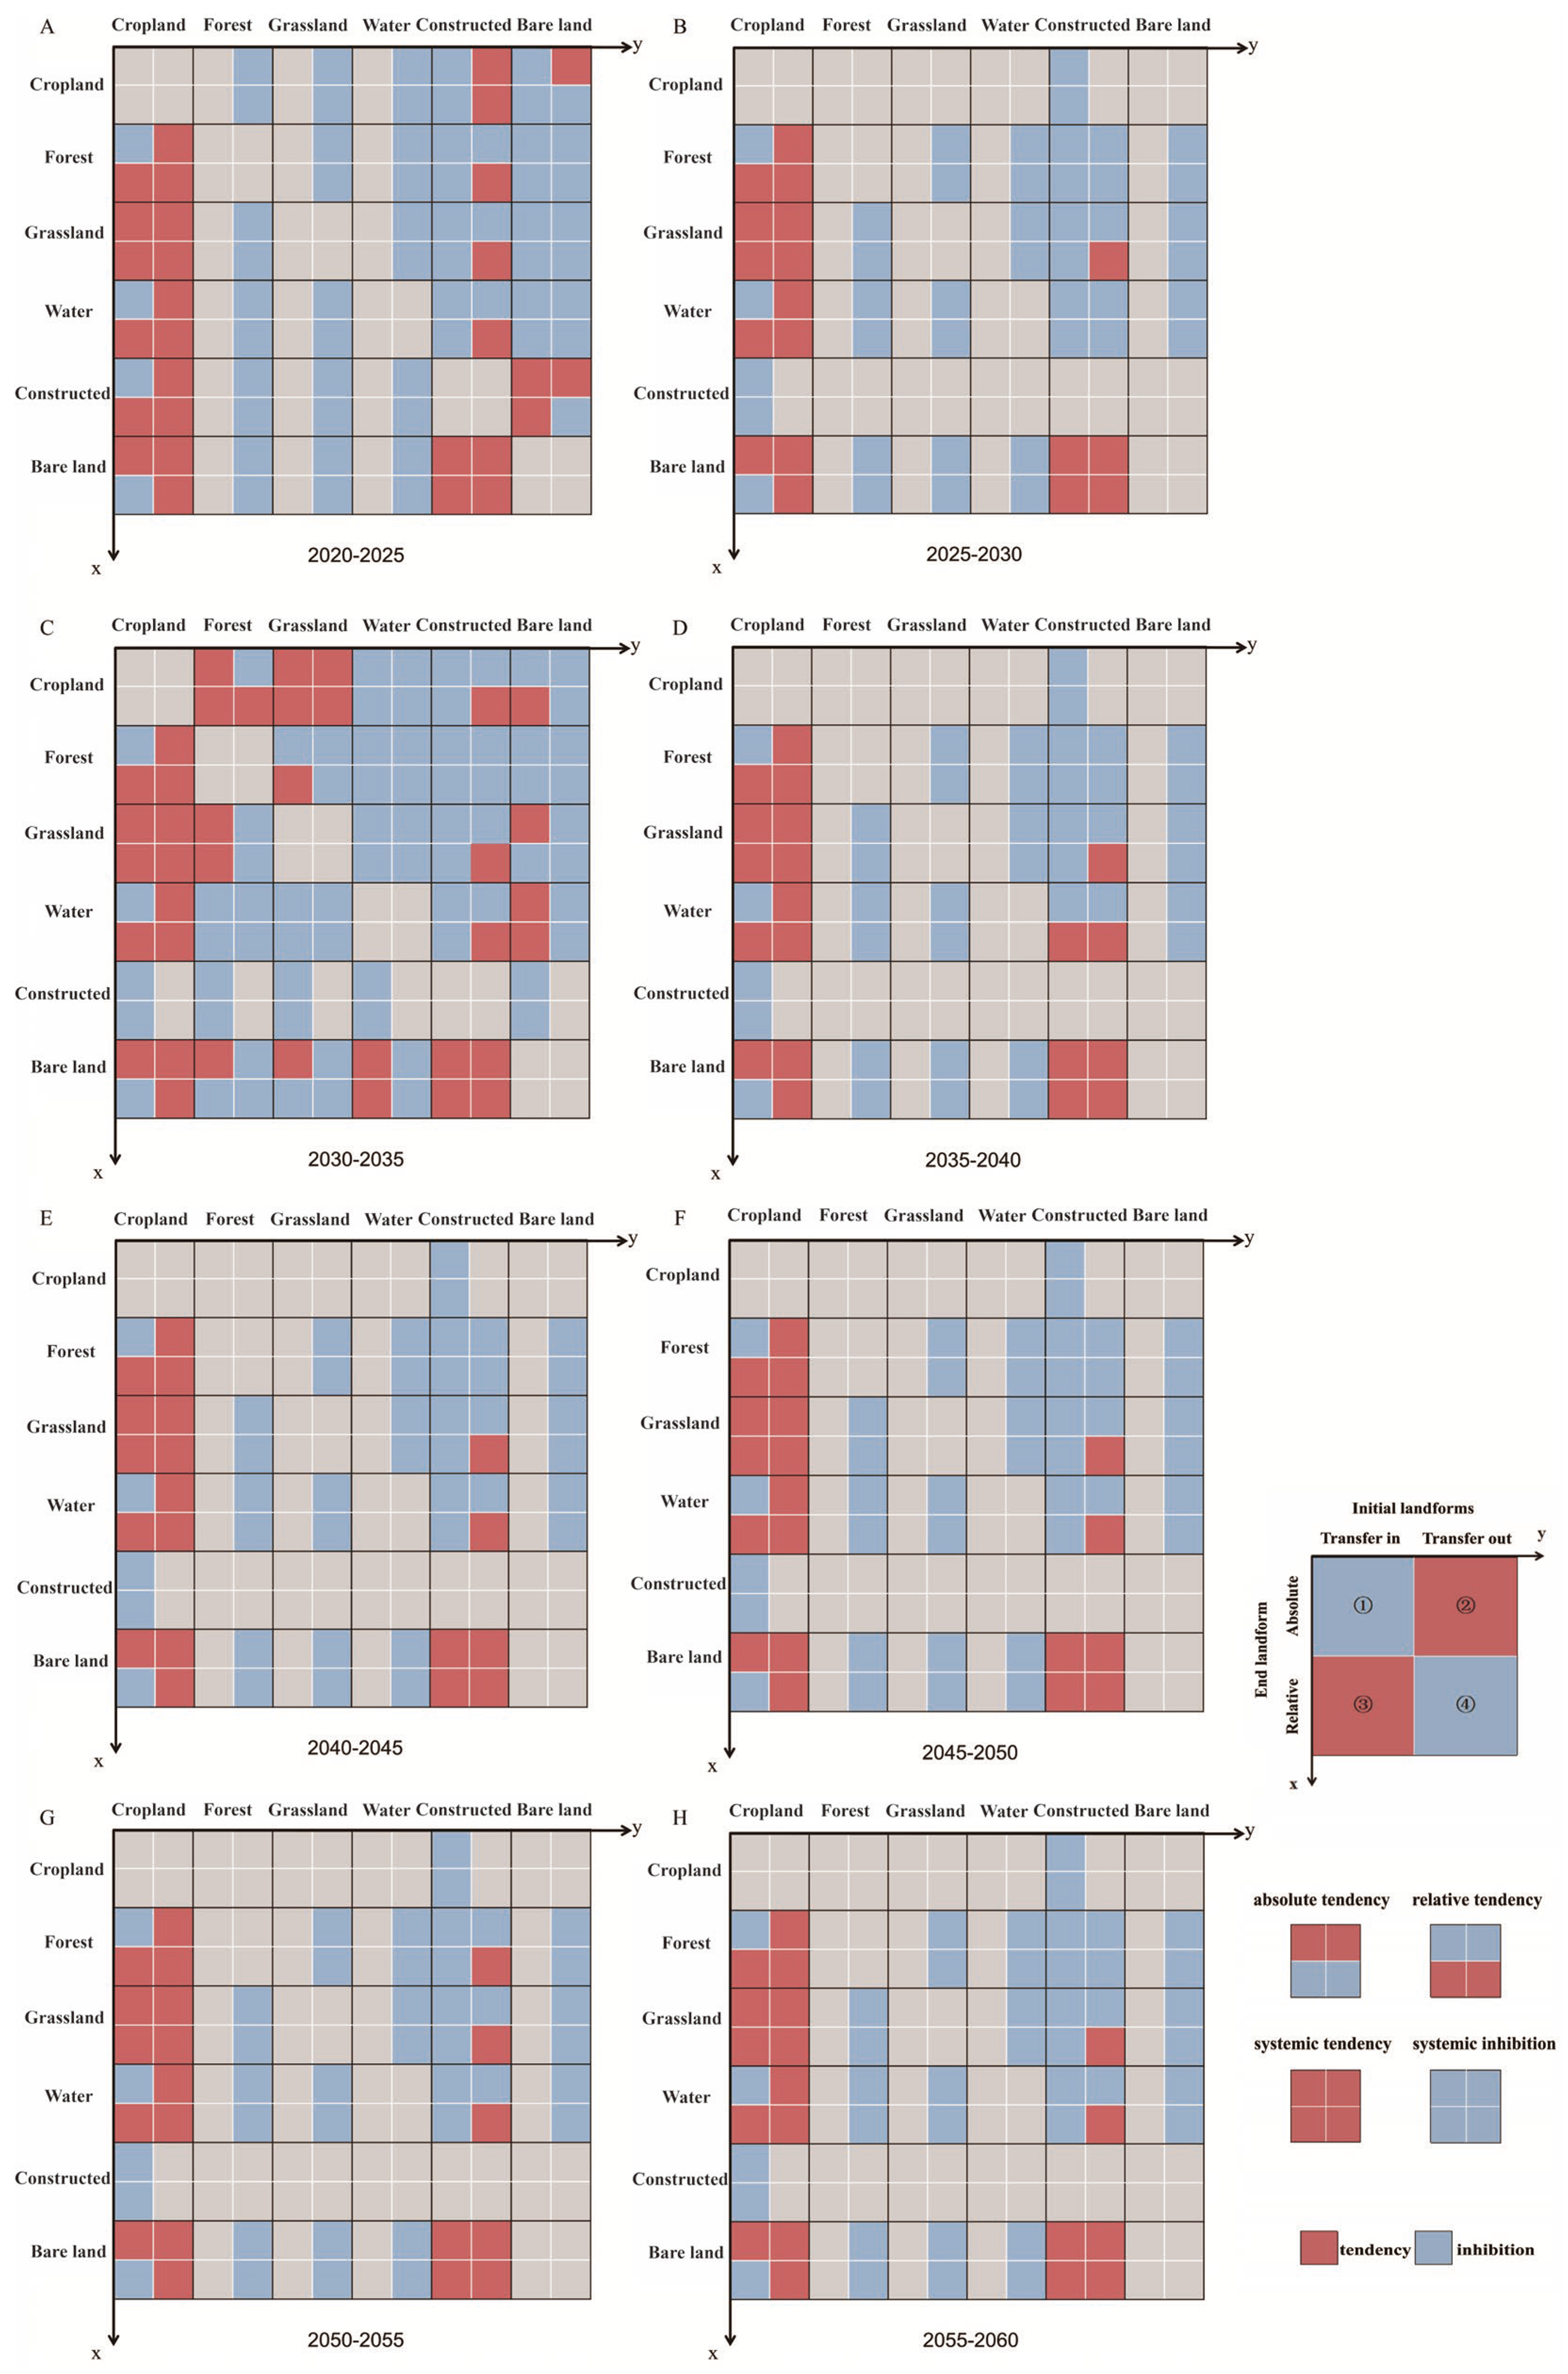
3.2. Land Use Intensity Map and Intensity Analysis

Between 2020 and 2060, under the SSP126 scenario, the land use intensity map of Xinjiang reveals varying transition characteristics among land types. From 2020 to 2060, the transition from bare land to grassland exhibits an absolute tendency. The transitions from bare land to forest and from bare land to water show a systematic tendency, while the transitions from cropland to water and from bare land to constructed land display systemic inhibition. Between 2025 and 2060, the conversion from cropland to constructed land demonstrates a relative tendency, while the conversion from cropland to forest demonstrates a systematic tendency. From 2020 to 2025, the conversion from cropland to constructed land demonstrates an absolute tendency, and the conversion from cropland to forest demonstrates a relative tendency. The transition from constructed land to forest demonstrates a relative tendency in comparison to previous studies on land use intensity in similar arid regions, such as those by Li et al. [39]. The trends observed in Zhou et al.’s study of the Loess Plateau [45] appear to be similar to the land use change trends in Xinjiang. However, while those studies also observed a trend of cropland expansion, this study finds a more prominent transition towards grassland restoration in SSP126, which may be linked to stricter land use regulations in the region (Figure 5).
Between 2020 and 2050, under the SSP245 scenario, Xinjiang’s land use intensity map shows that the transition from bare land to cropland exhibits an absolute tendency. At the same time, the transition from forest to cropland shows a relative tendency. The transition from bare land to constructed land demonstrates a systematic tendency, while the conversion from forest to constructed land exhibits systematic inhibition. These findings align with studies on the impacts of moderate socioeconomic development and land use management in the Yellow River Basin [46], where forest conversion to cropland is observed in response to changing agricultural policies but with some inhibition of constructed land expansion due to regulatory controls (Figure 6).
Between 2020 and 2060, under the SSP585 scenario, the land use intensity map of Xinjiang demonstrates diverse transition characteristics. From 2020 to 2060, the transition from bare land to cropland shows an absolute tendency, while the transitions from forest to cropland and from water to cropland display relative tendencies. The transitions from grassland to cropland and from bare land to constructed land demonstrate a systematic tendency. Compared to studies in semi-arid regions like those in North Africa [47], where rapid urbanization drives similar transitions from grassland to cropland, the relative tendency towards forest-to-cropland conversions in Xinjiang aligns with broader global trends under high-emission scenarios but also highlights local differences in the pace of cropland expansion due to water resource limitations (Figure 7).
To further explore land use intensity under different scenarios, this study selected three types of land transition characteristics across the three SSP scenarios. Under the SSP126 scenario, Xinjiang shows an absolute tendency in the conversion from bare land to grassland. In terms of absolute intensity, both the influx of grassland from bare land and the outflow of grassland to bare land exceed the average intensity. However, in relative intensity, both values are lower than the average, indicating that the absolute tendency does not significantly alter the LULC structure of the two land types within the region. This finding contrasts with studies in the Tianshan Mountains, where grassland restoration efforts under ecological programs have been more pronounced [48], suggesting that land quality improvement measures may significantly reduce the intensity of land use changes.
Under the SSP245 scenario, Xinjiang demonstrates a relative tendency for the conversion of forest to cropland. In terms of absolute intensity, cropland receives a smaller-than-average area from forest, while forest sends out a larger-than-average area to cropland. However, in terms of relative intensity, both the influx of cropland from forest and the outflow of forest to cropland exceed the average intensity. This suggests that although the absolute intensity of forest conversion is inhibited, this does not completely restrain the trend observed in relative intensity. This result mirrors findings from studies in other agricultural regions, such as the arid plains of Asia, where the expansion of agriculture often persists despite various conservation efforts [49].
Under the SSP585 scenario, Xinjiang exhibits a systematic tendency for the conversion from bare land to constructed land. Both in terms of absolute and relative intensity, the influx of constructed land from bare land and the outflow of bare land to constructed land exceed the average intensity. This leads to a substantial increase in the share of constructed land within the areas. This finding is consistent with global trends in highly urbanized regions, such as the Tarim Basin, where urban sprawl has been associated with the rapid expansion of constructed land [50]. However, it also highlights the unique challenges faced by Xinjiang in managing land use amidst growing urbanization pressures and limited water resources (Figure 8).
In summary, this study offers a detailed analysis of land use intensity and transitions in Xinjiang under three climate scenarios, contributing to the growing body of research on land use changes in arid regions. Comparing these results with studies from similar geographical contexts underscores the importance of considering local land use policies, water resource constraints, and ecological restoration efforts when assessing future land use dynamics. These comparisons not only strengthen this study’s conclusions but also highlight the need for more nuanced, context-specific approaches to land use planning and policy formulation.

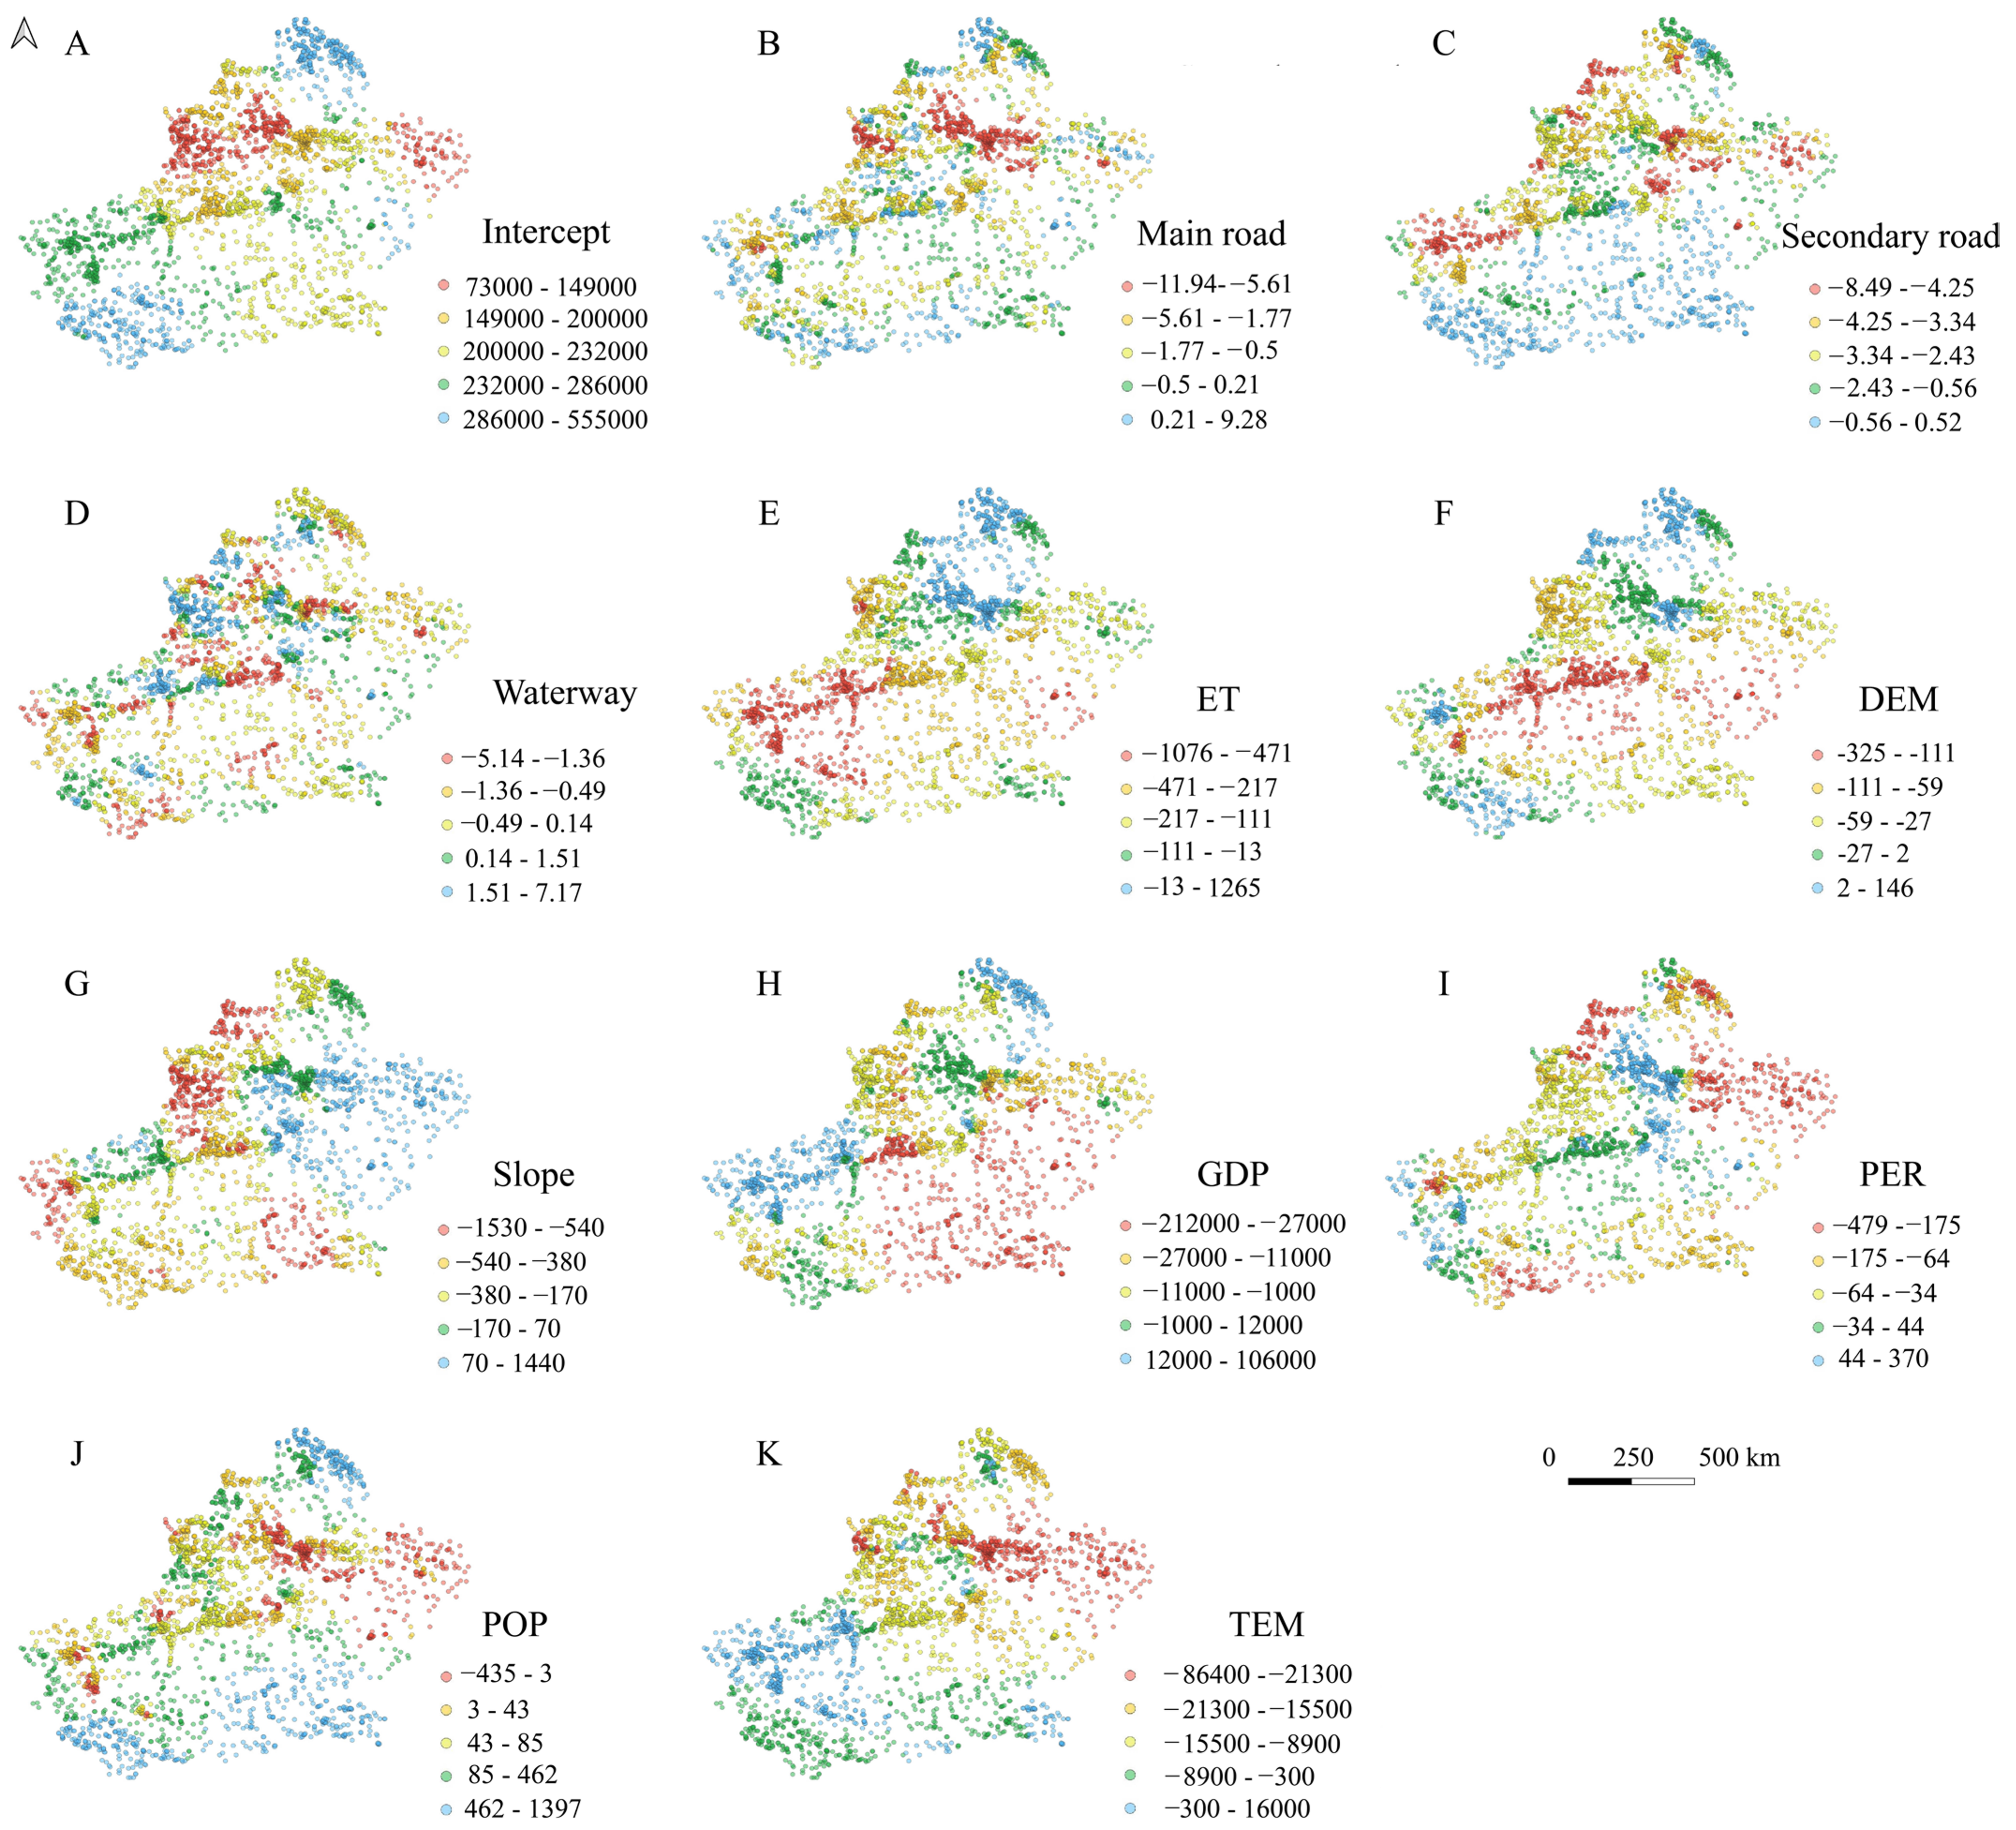
3.3. Spatial Heterogeneity Analysis of Driving Force

Under the SSP126 scenario, the Intercept reflects other location-related influencing factors, with regression coefficients of 76,000~660,000. The spatial characteristics of land use intensity are evident in the southwest–central region and the northern regions, where land use intensity is higher and more prominent near the central areas, gradually decreasing outward. The promoting effect is lowest in the northwest and southwest areas. This phenomenon aligns closely with prior research findings from the northern Tianshan region [51], where urban agglomeration development has driven significantly greater land use intensity in core areas compared to peripheral zones. GDP shows a generally negative impact on land use intensity, with a particularly pronounced effect in the southern region, with regression coefficients of −239,000~123,000. Positive effects are observed in the southwest and northern regions, with the influence gradually decreasing outward. This finding is consistent with previous studies of the Kashgar region [52], which have identified rapid economic growth and government policies as the primary drivers of dense urban expansion. Precipitation has a positive promoting effect on land use intensity, increasing from southwest to northeast, with regression coefficients of 52.35~69.95. This matches the conclusions of earlier studies, such as those by Feng et al. [53], who found that precipitation positively correlates with land use intensity in similarly arid regions, especially for agriculture. Population density shows a positive promoting effect, highest in the north and south, with the effect gradually decreasing toward the center, with regression coefficients of −1020~1936. This pattern is also consistent with the Urumqi study, where high population densities in urbanized regions were associated with increased land use intensity [54]. Temperature exerts a negative impact on land use intensity, with the negative influence increasing from southwest to northeast, with regression coefficients of −7303.3~−7257.5. This result is consistent with climate-related land use studies, such as those by Lyu et al. [55], which found that higher temperatures reduce available water resources and decrease land use intensity in arid zones (Figure 9).
Under the SSP245 scenario, the Intercept’s location characteristics show that the southern and northern regions have a more pronounced promoting effect on land use intensity and gradually decrease toward the central area, having the lowest impact in the northwest and northeast regions with regression coefficients of 73,000~555,000. This pattern is similar to studies in the western part of China [14], where the central and peripheral regions show differing levels of land use intensity driven by both socioeconomic factors and environmental conditions. The regression coefficients for the GDP range are −212,000~106,000, with the same trend of impact as SSP126. Precipitation exerts a generally suppressive effect on land use intensity, with inhibition weakening in the south and north, while the southwest and central regions show a positive promoting effect, with regression coefficients of −479~370. This pattern diverges slightly from studies in Xinjiang [49], where increased precipitation tends to encourage the use of land in drier regions, but it supports the notion that land use decisions are also influenced by regional water resource availability. The regression coefficients for the population range are −435~1397, with the same trend of effect as SSP126. Temperature has an adverse impact, with regression coefficients of −86,400~16,000, wherein the influence increases from the southwest and central regions toward the north and south, which reflects the general findings in studies of desertification in arid areas [56] where temperature increases exacerbate land degradation (Figure 10).
Under the SSP585 scenario, the regression coefficients for the Intercept range are 72,000~636,000, with the same trend of impact as SSP245. The regression coefficients for the GDP range are −100,900~64,400, with the same trend of impact as SSP126 and SSP245. Precipitation essentially exerts a suppressive effect on land use intensity, with inhibition weakening in the south and north, while the western and central regions show positive promoting effects with regression coefficients of −576~713. This pattern is consistent with land use studies in areas such as Kashgar [57], where precipitation is crucial for promoting vegetation growth, thus indirectly supporting agricultural and urban development. The regression coefficients for the population range are −712~1230, with the same trend of impact as SSP126 and SSP245. The regression coefficients for the Intercept range are −60,000~20,600, with the same trend of impact as SSP245 (Figure 11).

4. Discussion

4.1. Impact of LULC Changes Under Different Climate Scenarios

This study aims to analyze in-depth the spatial–temporal heterogeneity of land use intensity within a multi-source data and multi-temporal framework. It constructs a novel prediction model for land use intensity under future climate scenarios, clarifying the intensity of LULC changes in response to climate conditions. The findings provide theoretical support for land use policy in arid regions, both in Xinjiang and globally.
Since the beginning of the twenty-first century, China has not only promoted the economic development of the Xinjiang region but has also implemented ecological restoration programs [58], cropland protection policy [59], and the “Three Zones and Three Lines” national land plan [60], as well as returned cropland to forest and grassland [61]. An integrated approach has been adopted for the protection and restoration of mountains, rivers, forests, cropland, lakes, grasslands, and deserts. Previous studies have demonstrated the feasibility of using CMIP6 data to forecast future climate impacts; for example, scholars examined temperature and extreme precipitation responses to deforestation [62], and some scholars evaluated the effects of land cover and climate changes on runoff patterns [49]. Additionally, a study on the effects of cropland changes on the ecosystem service value (ESV) in Xinjiang shows a yearly increase in cropland at the expense of grassland and bare land [63]. However, under the SSP126 scenario, the cropland area in Xinjiang is projected to decrease by 8.3% from 2020 to 2060, contrary to the conclusions of this study. The reduction in cropland may result from ecological initiatives like reforestation, which may lead to significant forest expansion. A decline in cropland could pose threats to food security, degrade the ecological environment, and hinder rural economic development. To address these challenges, it is essential to enhance the quality of cropland, promote the development of high-standard cropland, and rigorously enforce food security and cropland protection policies to ensure the sustainable development of agriculture in arid regions.
Under the SSP245 and SSP585 scenarios, the cropland area in Xinjiang is projected to increase by 9.5% and 30.9%, respectively, from 2020 to 2060. This projected increase in cropland may be attributed to the expansion of oasis agriculture, where the intensity and scale of cropland expansion exceed those of reforestation efforts. Meanwhile, the water area is projected to decrease by 2.96% and 4.74%, respectively, likely due to increased water demand resulting from cropland and constructed land expansion. Previous studies analyzed LULC changes from 1990 to 2020, revealing marked changes, including increases in cropland and constructed land and decreases in forest, grassland, water, and bare land [64]. In this study, the constructed land area is projected to increase by 6.5%, 22.1%, and 50.6% under the SSP126, SSP245, and SSP585 scenarios, respectively, consistent with previous findings. This trend may be driven by urbanization, which necessitates increased urban land, often by converting rural collective land and wasteland into urban uses.
As Xinjiang is an inland arid region with limited water resources, the expansion of cropland and constructed land will lead to a surge in water demand. Effective planning and the use of water resources are essential, including wastewater recycling improvements, enhancing agricultural irrigation efficiency, and optimizing the use of constructed land by reusing abandoned urban areas and redeveloping old city sites to improve LULC efficiency.

4.2. Characteristics of Land Use Intensity Maps Under Different Climate Scenarios

This study examines land use intensity under three future climate scenarios: SSP126, SSP245, and SSP585. The SSP126 scenario emphasizes strict regulation of land use, promoting green, sustainable development and enhanced agricultural productivity. The SSP245 scenario represents a middle ground in terms of socioeconomic and technological progress, with limited land use regulation. Moderate regulation, slower deforestation, rapid productivity increases, and resource-intensive practices mark the SSP585 scenario. These scenarios lead to varying degrees of land use change, with distinct implications for future land use dynamics [35].
Land use intensity maps offer a visual representation of LULC patterns and the resulting shifts in land use structure. Previous studies on Xinjiang’s cropland expansion have consistently shown growth in cropland area over time [63]. In other regions, such as the Yangtze River urban agglomerations, multi-model analyses have highlighted the spatiotemporal characteristics and quality of urban expansion, revealing that urban areas continued to expand from 2000 to 2020 with distinct phase-based and spatial patterns [65].
This study reveals a significant conversion trend from bare land to forest under the SSP126 scenario. This finding presents an intriguing contrast with the results reported by Wang et al. in the Loess Plateau [66]: although both studies observed ecological restoration trends, our study area demonstrates a more pronounced suppression effect on built-up land conversion. This discrepancy may be attributed to the unique arid-region ecological baseline and differentiated policy instrument combinations in our study area. The observed intensification of land use under the SSP245 and SSP585 scenarios generally aligns with the simulation results from the PLUS model [67]. However, our study uncovers more complex spatial heterogeneity characteristics in the specific dimensions of intensification. These findings provide novel empirical evidence for deepening the understanding of regional land use response mechanisms within the SSP framework while simultaneously highlighting the necessity of localized calibration when applying global scenarios at regional scales. Future research should prioritize enhanced multi-model comparisons and integrate higher-resolution remote sensing data to improve the accuracy of land use change predictions.

4.3. Impact of Land Use Intensity Under Different Climate Scenarios

Land use intensity reflects the extent of human impact on land, providing insights into land use efficiency [68]. To better understand changes in land use intensity, this study integrates intensity maps with land use transition matrices. Previous studies have applied intensity analysis to evaluate system stability and consistency in LULC changes. For example, in Jinan, from 2005 to 2018, the conversion of cropland to constructed land exhibited steady patterns, while forest and other land types showed more stability [69]. In Foshan, predictions of future land use indicated that both cropland and constructed land would remain highly active under future development scenarios.
Under the SSP126 scenario, grassland conversion intensity was lower than the average, while forest conversion intensity was higher, suggesting more active land use. This contrasts with previous studies that found forest areas to be more stable, which may be influenced by policies such as “returning cropland to forest”. International studies have shown that land conversions, particularly to agriculture and forests, can increase during economic downturns [70]. Under the SSP245 scenario, cropland conversion intensity was lower than average, possibly due to financial challenges. Under the SSP585 scenario, constructed land conversion intensity was higher than average, reflecting greater urbanization and expansion.
The findings in this study align with previous research on land use intensity, although scenario-specific factors must be considered. For example, strict land use controls under SSP126, which may be influenced by “returning cropland to forest” policies, contrast with the more liberal land use dynamics of the other two scenarios. Additionally, previous research on LULC changes in the Xixian New Area revealed that urban land use efficiency increased significantly, with a positive correlation between land use intensity and regional economic development. In this case, cropland and forest areas decreased while constructed land expanded [71].
Consistent with these findings, this study found that under the SSP126 scenario, the conversion of bare land to grassland was large but inhibited, reflecting the effects of policy restrictions. Under the SSP245 scenario, the conversion of forest to cropland was smaller but still showed a tendency toward conversion. Under the SSP585 scenario, the conversion of bare land to constructed land was substantial, with both absolute and relative intensities exhibiting a systematic tendency. Therefore, absolute and relative intensities do not always correlate directly. A high absolute intensity of conversion does not necessarily imply significant changes in the regional land use proportions, and conversely, smaller-scale conversions can still exert a notable impact on land use structures.

4.4. Influence of Driving Force on Land Use Intensity

By constructing an indicator model and utilizing the MGWR model to analyze the spatial differentiation and driving mechanisms of land use intensity, the results indicate that all characteristic variables show both positive and negative regression signs, with significant spatial variations.
In all three scenarios, population and GDP have a relatively significant spatial heterogeneity. The current research suggests that population growth is one of the primary drivers for the increase in cropland area [16]. GDP and temperature have a negative impact on land use intensity. Concerning economic location, the rapid development of economic zones increased urban trade, and changes in industrial structure contributed to the growing demand for constructed land, leading to a gradual transition of cropland. As for temperature, rising temperatures exacerbate water scarcity and reduce runoff, which severely impacts changes in land use types, with climate fluctuations affecting cropland [55]. Meanwhile, precipitation has a positive influence on land use intensity; as global warming progresses, rising temperatures and the associated increase in moisture accelerate the pace of cropland expansion. However, under the SSP245 and SSP585 scenarios, industrialization intensifies, which may reduce the positive influence of precipitation on land use intensity. This could be due to environmental degradation and excessive industrial emissions, leading to phenomena such as acid rain. Notably, the adjusted R2 exceeds 0.8, outperforming conventional GWR models (R2 = 0.65) while the AICc remains below 6000, confirming the model’s robust reliability.

4.5. Outlook and Limitations

This study employs the CMIP6–PLUS–IM–MGWR model to simulate the spatial distribution of LULC changes under the SSP scenarios. However, applying the CMIP6–PLUS–IM–MGWR model in this context presents several challenges and potential limitations.
First, while the model incorporates multiple data sources, including CMIP6 climate projections and socioeconomic scenarios (SSPs), the accuracy of the predictions is inherently constrained by the uncertainties in climate models themselves. CMIP6, while the most comprehensive global climate projection model available, is subject to various sources of uncertainty, such as the variability of emission pathways and the limited resolution of regional climate predictions. The application of CMIP6 projections to arid regions like Xinjiang, which have highly localized and complex climatic conditions, may not fully capture microclimatic variations, particularly in remote areas where data density is low [72]. Second, the PLUS model used for simulating land use change is highly dependent on the availability and quality of historical land use data. In regions like Xinjiang, where remote and inaccessible areas present difficulties in land monitoring, these data can be sparse or outdated, potentially limiting the accuracy of future simulations [73]. Furthermore, the IM model, while innovative, assumes that land use intensity can be directly quantified from spatial data, which may not always align with local ecological and socioeconomic realities. For example, in areas with sparse population density and limited infrastructure, land use intensity may be influenced by factors such as local agricultural practices and migration patterns, which may not be fully captured by general spatial models [5]. Another limitation is the MGWR model, which, despite being more advanced than traditional GWR models, still assumes a certain uniformity in spatial data relationships across varying scales. While MGWR accounts for scale differences, it may not fully capture the complexity of interactions between land use intensity and environmental factors in Xinjiang, especially in areas where land use practices are evolving rapidly or where socioeconomic shifts are more pronounced. Additionally, the high variability in the region’s physical environment means that spatial heterogeneity in land use drivers could be more nuanced than the model can account for [13]. Finally, the application of SSP scenarios to Xinjiang’s future climate and land use projections introduces additional uncertainty. These scenarios are based on broader global assumptions that may not perfectly reflect the specific socioeconomic and policy-driven developments within Xinjiang. While SSP scenarios are valuable tools for projecting future trends, they may not fully account for local policy interventions or the unique demographic and economic changes occurring in the region, such as shifting agricultural practices or infrastructure development. This gap could lead to over-simplifications in predictions, especially given the region’s complex sociopolitical landscape.

5. Conclusions

This study developed an integrated CMIP6–PLUS–IM–MGWR modeling system, providing a groundbreaking decision-support tool for land use planning and climate adaptation policy formulation in arid regions. Through an empirical analysis of 40-year simulation data for Xinjiang, the research reveals fundamental patterns of land system evolution under SSP126, SSP245, and SSP585 scenarios, offering critical policy insights for regional sustainable development.
Under the SSP126 ecological priority scenario, the expansion of grassland and forest areas—particularly the pronounced changes in forest coverage driven by stringent land use controls, including cropland-to-forest conversion—corresponds with reduced cropland extent. These findings provide robust support for precisely delineating the “ecological-agricultural transition zone” along the northern Tianshan Mountains and implementing dynamic adjustment mechanisms for high-standard cropland construction criteria. The SSP245 balanced development scenario reveals concurrent decreases in grassland and water bodies alongside increases in cropland and forest, underscoring the imperative for enhanced water resource management. This necessitates establishing an integrated “water-land-oasis” coordination platform for the Tarim River Basin and institutionalizing regular updates to water conservation technologies. Under the SSP585 high-development scenario, constructed land expansion highlights the critical importance of urban land optimization strategies such as brownfield redevelopment, prompting the adoption of “tradable redevelopment quota” policies in metropolitan areas and the development of cross-border industrial park land use efficiency benchmarking systems. Furthermore, this study demonstrates that land use intensity does not exhibit consistent correlations with major compositional shifts in land cover types. Population density and GDP are key drivers of land use intensity in the region, and there is relatively significant spatial heterogeneity.
In conclusion, this research introduces a novel modeling approach by coupling the CMIP6, PLUS, IM, and MGWR models, providing a comprehensive framework for evaluating LULC changes and land use intensity in arid regions. The findings contribute to improving land use planning and policy development in such areas, offering valuable insights for sustainable development and climate adaptation strategies. For future research, extending the analysis to include additional climate scenarios or broader socioeconomic data could offer more nuanced insights into future land use trends and inform more robust policy recommendations for land management.

Author Contributions

H.W. and M.S. were responsible for the research design, analysis, and the manuscript’s design and review. L.H. drafted the manuscript and was responsible for data preparation, experiments, and analyses. K.Z. is responsible for preparing the data and guiding the experiments. J.T. and T.D. contributed to manuscript editing. Y.L. (Yunhao Li), S.W. and Y.L. (Yuwei Li). reviewed and polished the manuscript. All authors have read and agreed to the published version of the manuscript. The authors declare no conflicts of interest. All authors contributed to the article and approved the submitted version.

Funding

This research was financially supported by the National Key Research and Development Program of China (No. 2023YFD1901503-2) and the Major Science and Technology Special Projects in the Xianjiang Uygur Autonomous Region, China (No. 2023A02002), in part by the Xinjiang Tianchi Talent Program.

Institutional Review Board Statement

Not applicable.

Informed Consent Statement

Not applicable.

Data Availability Statement

The datasets generated for this study are available upon request from the corresponding author.

Conflicts of Interest

The authors declare no conflicts of interest.

References

  1. Dullinger, I.; Essl, F.; Moser, D.; Erb, K.; Haberl, H.; Dullinger, S. Biodiversity models need to represent land-use intensity more comprehensively. Glob. Ecol. Biogeogr. 2021, 30, 924–932. [Google Scholar] [CrossRef]
  2. Han, B.; Jin, X.; Sun, R.; Li, H.; Liang, X.; Zhou, Y. Understanding land-use sustainability with a systematical framework: An evaluation case of China. Land Use Policy 2023, 132, 106767. [Google Scholar] [CrossRef]
  3. Rao, Y.; Zhang, J.; Wang, K.; Jepsen, M.R. Understanding land use volatility and agglomeration in northern Southeast Asia. J. Environ. Manag. 2021, 278, 111536. [Google Scholar] [CrossRef] [PubMed]
  4. Shi, M.; Wu, H.; Jiang, P.; Zheng, K.; Liu, Z.; Dong, T.; He, P.; Fan, X. Food-water-land-ecosystem nexus in typical Chinese dryland under different future scenarios. Sci. Total Environ. 2023, 880, 163183. [Google Scholar] [CrossRef]
  5. Liang, X.; Guan, Q.F.; Clarke, K.C.; Liu, S.S.; Wang, B.Y.; Yao, Y. Understanding the drivers of sustainable land expansion using a patch-generating land use simulation (PLUS) model: A case study in Wuhan, China. Comput. Environ. Urban Syst. 2021, 85, 101569. [Google Scholar] [CrossRef]
  6. Shi, M.; Wu, H.; Jia, H.; Zhu, L.; Dong, T.; He, P.; Yang, Q. Temporal and spatial evolution and prediction of carbon stocks in Yili Valley based on MCE-CA-Markov and InVEST models. J. Agric. Resour. Environ. 2021, 38, 1010–1019. [Google Scholar]
  7. Akin, A.; Erdogan, N.; Berberoglu, S.; Cilek, A.; Erdogan, A.; Donmez, C.; Satir, O. Evaluating the efficiency of future crop pattern modelling using the CLUE-S approach in an agricultural plain. Ecol. Inform. 2022, 71, 101806. [Google Scholar] [CrossRef]
  8. Wang, Z.; Guo, M.; Zhang, D.; Chen, R.; Xi, C.; Yang, H. Coupling the Calibrated GlobalLand30 Data and Modified PLUS Model for Multi-Scenario Land Use Simulation and Landscape Ecological Risk Assessment. Remote Sens. 2023, 15, 5186. [Google Scholar] [CrossRef]
  9. Chaudhuri, G.; Clarke, K. The SLEUTH land use change model: A review. Environ. Resour. Res. 2013, 1, 88–105. [Google Scholar]
  10. O’Neill, B.C.; Tebaldi, C.; Van Vuuren, D.P.; Eyring, V.; Friedlingstein, P.; Hurtt, G.; Knutti, R.; Kriegler, E.; Lamarque, J.-F.; Lowe, J. The scenario model intercomparison project (ScenarioMIP) for CMIP6. Geosci. Model Dev. 2016, 9, 3461–3482. [Google Scholar] [CrossRef]
  11. Xu, Z. Towards carbon neutrality in China: A systematic identification of China’s sustainable land-use pathways across multiple scales. Sustain. Prod. Consum. 2024, 44, 167–178. [Google Scholar] [CrossRef]
  12. Liu, Y.; Chen, X.; Bai, Y.; Zeng, J. Evaluation of 22 CMIP6 model-derived global soil moisture products of different shared socioeconomic pathways. J. Hydrol. 2024, 636, 131241. [Google Scholar] [CrossRef]
  13. Chen, Y.; Zhu, M.; Zhou, Q.; Qiao, Y. Research on Spatiotemporal Differentiation and Influence Mechanism of Urban Resilience in China Based on MGWR Model. Int. J. Environ. Res. Public Health 2021, 18, 1056. [Google Scholar] [CrossRef] [PubMed]
  14. Huang, X.; Huang, X.; Liu, M.; Wang, B.; Zhao, Y. Spatial-temporal Dynamics and Driving Forces of Land Development Intensity in the Western China from 2000 to 2015. Chin. Geogr. Sci. 2020, 30, 16–29. [Google Scholar] [CrossRef]
  15. Ma, H. Spatiotemporal analysis of land use changes and their trade-offs on the northern slope of the Tianshan Mountains, China. Front. Ecol. Evol. 2022, 10, 1016774. [Google Scholar] [CrossRef]
  16. Tong, S.; Bao, G.; Rong, A.; Huang, X.; Bao, Y.; Bao, Y. Comparison of the Spatiotemporal Dynamics of Land Use Changes in Four Municipalities of China Based on Intensity Analysis. Sustainability 2020, 12, 3687. [Google Scholar] [CrossRef]
  17. Martin, Y.; Van Dyck, H.; Dendoncker, N.; Titeux, N. Testing instead of assuming the importance of land use change scenarios to model species distributions under climate change. Glob. Ecol. Biogeogr. 2013, 22, 1204–1216. [Google Scholar] [CrossRef]
  18. Zhu, G.; Xu, X.; Ma, Z.; Xu, L.; Porter, J.H. Spatial Dynamics and Zoning of Coastal Land-Use Change along Bohai Bay, China, during 1979–2008. J. Coast. Res. 2012, 28, 1186–1196. [Google Scholar]
  19. Li, S.; Gong, J.; Yang, J.; Chen, G.; Zhang, Z.; Zhang, M. Characteristics of Land Use/Land Cover Change Patterns in the Lanxi Urban Agglomeration—Based on the Intensity Analysis Framework. Resour. Sci. 2023, 45, 480–493. [Google Scholar]
  20. Li, T.; Jiang, H.; Jing, P.; Yu, Y.; Zhang, M.; Sang, H. A Data-Driven Study on the Impact of Land Use on Traffic Congestion Based on GWR Model. In Proceedings of the 20th COTA International Conference of Transportation Professionals (CICTP)—Advanced Transportation, Enhanced Connection, Xi’an, China, 14–16 August 2020; pp. 3051–3060. [Google Scholar]
  21. Zhu, H.; Ou, X.; Yang, Z.; Yang, Y.; Ren, H.; Tang, L. Spatiotemporal Dynamics and Driving Forces of Land Urbanization in the Yangtze River Delta Urban Agglomeration. Land 2022, 11, 1365. [Google Scholar] [CrossRef]
  22. Zhou, K.; Wang, X.; Wang, Z.; Hu, Y. Systematicity and Stability Analysis of Land Use Change-Taking Jinan, China, as an Example. Land 2022, 11, 1045. [Google Scholar] [CrossRef]
  23. Dandridge, C.; Stanley, T.; Kirschbaum, D.; Amatya, P.; Lakshmi, V. The influence of land use and land cover change on landslide susceptibility in the Lower Mekong River Basin. Nat. Hazards 2023, 115, 1499–1523. [Google Scholar] [CrossRef]
  24. Yang, D.; Zhang, P.; Jiang, L.; Zhang, Y.; Liu, Z.; Rong, T. Spatial change and scale dependence of built-up land expansion and landscape pattern evolution-Case study of affected area of the lower Yellow River. Ecol. Indic. 2022, 141, 109123. [Google Scholar] [CrossRef]
  25. Zhang, J.; Zhang, P.; Gu, X.; Deng, M.; Lai, X.; Long, A.; Deng, X. Analysis of Spatio-Temporal Pattern Changes and Driving Forces of Xinjiang Plain Oases Based on Geodetector. Land 2023, 12, 1508. [Google Scholar] [CrossRef]
  26. Zhang, L.; Lei, J.; Wang, C.; Wang, F.; Geng, Z.; Zhou, X. Spatio-temporal variations and influencing factors of energy-related carbon emissions for Xinjiang cities in China based on time-series nighttime light data. J. Geogr. Sci. 2022, 32, 1886–1910. [Google Scholar] [CrossRef]
  27. Zhang, F.; Wang, Y.; Jim, C.Y.; Chan, N.W.; Tan, M.L.; Kung, H.-T.; Shi, J.; Li, X.; He, X. Analysis of Urban Expansion and Human-Land Coordination of Oasis Town Groups in the Core Area of Silk Road Economic Belt, China. Land 2023, 12, 224. [Google Scholar] [CrossRef]
  28. Cai, T.; Luo, X.; Fan, L.; Han, J.; Zhang, X. The Impact of Cropland Use Changes on Terrestrial Ecosystem Services Value in Newly Added Cropland Hotspots in China during 2000–2020. Land 2022, 11, 2294. [Google Scholar] [CrossRef]
  29. Zheng, L.; Xia, Z.; Xu, J.; Chen, Y.; Yang, H.; Li, D. Exploring annual lake dynamics in Xinjiang (China): Spatiotemporal features and driving climate factors from 2000 to 2019. Clim. Change 2021, 166, 36. [Google Scholar] [CrossRef]
  30. Chen, W.; Chi, G.; Li, J. Ecosystem Services and Their Driving Forces in the Middle Reaches of the Yangtze River Urban Agglomerations, China. Int. J. Environ. Res. Public Health 2020, 17, 3717. [Google Scholar] [CrossRef]
  31. Chen, Y.; Guo, F.; Wang, J.; Cai, W.; Wang, C.; Wang, K. Provincial and gridded population projection for China under shared socioeconomic pathways from 2010 to 2100. Sci. Data 2020, 7, 83. [Google Scholar] [CrossRef]
  32. Hurtt, G.C.; Chini, L.; Sahajpal, R.; Frolking, S.; Bodirsky, B.L.; Calvin, K.; Doelman, J.C.; Fisk, J.; Fujimori, S.; Goldewijk, K.K.; et al. Harmonization of global land use change and management for the period 850-2100 (LUH2) for CMIP6. Geosci. Model Dev. 2020, 13, 5425–5464. [Google Scholar] [CrossRef]
  33. Zomer, R.J.; Xu, J.; Trabucco, A. Version 3 of the Global Aridity Index and Potential Evapotranspiration Database. Sci. Data 2022, 9, 409. [Google Scholar] [CrossRef]
  34. Shi, M.; Wu, H.; Jiang, P.; Shi, W.; Zhang, M.; Zhang, L.; Zhang, H.; Fan, X.; Liu, Z.; Zheng, K.; et al. Cropland Expansion Mitigates the Supply and Demand Deficit for Carbon Sequestration Service under Different Scenarios in the Future—The Case of Xinjiang. Agriculture 2022, 12, 1182. [Google Scholar] [CrossRef]
  35. Popp, A.; Calvin, K.; Fujimori, S.; Havlik, P.; Humpenoeder, F.; Stehfest, E.; Bodirsky, B.L.; Dietrich, J.P.; Doelmann, J.C.; Gusti, M.; et al. Land-use futures in the shared socio-economic pathways. Glob. Environ. Change—Hum. Policy Dimens. 2017, 42, 331–345. [Google Scholar] [CrossRef]
  36. Qiu, Y.; Hu, Q.; Zhang, C. WRF simulation and downscaling of local climate in Central Asia. Int. J. Climatol. 2017, 37, 513–528. [Google Scholar] [CrossRef]
  37. Bai, R.; Sun, J.; Yu, E.; Yu, S. Performance of the Weather Research and Forecasting model in simulating climate over northern Asia. Int. J. Climatol. 2022, 42, 10285–10307. [Google Scholar] [CrossRef]
  38. Xu, Z.; Han, Y.; Tam, C.-Y.; Yang, Z.-L.; Fu, C. Bias-corrected CMIP6 global dataset for dynamical downscaling of the historical and future climate (1979–2100). Sci. Data 2021, 8, 293. [Google Scholar] [CrossRef]
  39. Li, J.; Chen, X.; Kurban, A.; Van de Voorde, T.; De Maeyer, P.; Zhang, C. Coupled SSPs-RCPs scenarios to project the future dynamic variations of water-soil-carbon-biodiversity services in Central Asia. Ecol. Indic. 2021, 129, 107936. [Google Scholar] [CrossRef]
  40. Nor, A.N.M.; Corstanje, R.; Harris, J.A.; Brewer, T. Impact of rapid urban expansion on green space structure. Ecol. Indic. 2017, 81, 274–284. [Google Scholar] [CrossRef]
  41. Sun, Y.; Ge, X.; Liu, J.; Chang, Y.; Liu, G.-J.; Chen, F. Mitigating Spatial Conflict of Land Use for Sustainable Wetlands Landscape in Li-Xia-River Region of Central Jiangsu, China. Sustainability 2021, 13, 11189. [Google Scholar] [CrossRef]
  42. Ma, Y.; Mamitimin, Y.; Tiemuerbieke, B.; Yimaer, R.; Huang, M.; Chen, H.; Tao, T.; Guo, X. Spatiotemporal Characteristics and Influencing Factors of Urban Heat Island Based on Geographically Weighted Regression Model: A Case Study of Urumqi City. Land 2023, 12, 2012. [Google Scholar] [CrossRef]
  43. Wang, S.; Liu, J.; Zhang, Z.; Zhou, Q.; Zhao, X. Spatio-temporal Characteristics Analysis of Land Use in China. Acta Geogr. Sin. 2001, 631–639. [Google Scholar] [CrossRef]
  44. Ma, S.; Shi, M.; Yang, G.; Xu, X.; Yin, J. Spatio-temporal Dynamic Change Analysis of Land Use Based on GIS—Taking the Agricultural Reclamation Area of the Tarim Basin as an Example. Res. Soil Water Conserv. 2013, 20, 177–181. [Google Scholar]
  45. Zhou, X.; Zhou, Y. Spatio-Temporal Variation and Driving Forces of Land-Use Change from 1980 to 2020 in Loess Plateau of Northern Shaanxi, China. Land 2021, 10, 982. [Google Scholar] [CrossRef]
  46. Cheng, Y.; Chen, Y. Spatial and Temporal Characteristics of Land Use Changes in the Yellow River Basin from 1990 to 2021 and Future Predictions. Land 2024, 13, 1510. [Google Scholar] [CrossRef]
  47. Fathy, I.; Ahmed, A.; Abd-Elhamid, H.F. Integrated management of surface water and groundwater to mitigate flood risks and water scarcity in arid and semi-arid regions. J. Flood Risk Manag. 2021, 14, e12720. [Google Scholar] [CrossRef]
  48. Cai, P.; Hamdi, R.; Luo, G.; He, H.; Zhang, M.; Termonia, P.; De Maeyer, P. Agriculture intensification increases summer precipitation in Tianshan Mountains, China. Atmos. Res. 2019, 227, 140–146. [Google Scholar] [CrossRef]
  49. Rahman, M.; Islam, M.M.; Kim, H.-J.; Sadiq, S.; Alam, M.; Siddiqua, T.; Mamun, M.A.; Gazi, M.A.H.; Raju, M.R.; Chen, N.; et al. Assessing the Influence of Land Cover and Climate Change Impacts on Runoff Patterns Using CA-ANN Model and CMIP6 Data. ISPRS Int. J. Geo-Inf. 2023, 12, 401. [Google Scholar] [CrossRef]
  50. Mehriar, M.; Masoumi, H.; Mohino, I. Urban Sprawl, Socioeconomic Features, and Travel Patterns in Middle East Countries: A Case Study in Iran. Sustainability 2020, 12, 9620. [Google Scholar] [CrossRef]
  51. Luo, G.; Feng, Y.; Zhang, B.; Cheng, W. Sustainable land-use patterns for arid lands: A case study in the northern slope areas of the Tianshan Mountains. J. Geogr. Sci. 2010, 20, 510–524. [Google Scholar] [CrossRef]
  52. Maimaiti, B.; Chen, S.; Kasimu, A.; Mamat, A.; Aierken, N.; Chen, Q. Coupling and coordination relationships between urban expansion and ecosystem service value in kashgar city. Remote Sens. 2022, 14, 2557. [Google Scholar] [CrossRef]
  53. Feng, J.; Zhao, L.; Zhang, Y.; Sun, L.; Yu, X.; Yu, Y. Can climate change influence agricultural GTFP in arid and semi-arid regions of Northwest China? J. Arid Land 2020, 12, 837–853. [Google Scholar] [CrossRef]
  54. Qian, J.; Zhou, Q.; Chen, X.; Sun, B. A model-based analysis of spatio-temporal changes of the urban expansion in arid area of Western China: A case study in North Xinjiang economic zone. Atmosphere 2020, 11, 989. [Google Scholar] [CrossRef]
  55. Lyu, J.; Yin, S.; Sun, Y.; Wang, K.; Luo, P.; Meng, X. Flood Runoff Simulation under Changing Environment, Based on Multiple Satellite Data in the Jinghe River Basin of the Loess Plateau, China. Remote Sens. 2023, 15, 550. [Google Scholar] [CrossRef]
  56. Shao, W.; Zhang, Z.; Guan, Q.; Yan, Y.; Zhang, J. Comprehensive assessment of land degradation in the arid and semiarid area based on the optimal land degradation index model. Catena 2024, 234, 107563. [Google Scholar] [CrossRef]
  57. Du, Y.E.; Liu, B.; He, W.; Zhou, J. Temporal and Spatial Pattern Characteristics of Vegetation in Qaidam Basin and Its Response to Climate Change. In Proceedings of the 5th Annual International Conference on Information System and Artificial Intelligence (ISAI), Zhejiang, China, 22–23 May 2020. [Google Scholar]
  58. Hanchu, L.; Jie, F.; Baoyin, L.; Li, W.; Qin, Q. Practical exploration of ecological restoration and management of the mountains-rivers-forests-croplands-lakes-grasslands system in the Irtysh River Basin in Altay, Xinjiang. J. Resour. Ecol. 2021, 12, 766–776. [Google Scholar]
  59. Li, J.; Zhang, Z.; Ma, L.; Gu, Q.; Wang, K.; Xu, Z. Assessment on the impact of arable land protection policies in a rapidly developing region. ISPRS Int. J. Geo-Inf. 2016, 5, 69. [Google Scholar] [CrossRef]
  60. Wu, J.; Wang, C.; He, X.; Zhou, C.; Wang, H. Nonlinear Effects of Land-Use Conflicts in Xinjiang: Critical Thresholds and Implications for Optimal Zoning. Land 2024, 13, 612. [Google Scholar] [CrossRef]
  61. Yang, H.; Mu, S.; Li, J. Effects of ecological restoration projects on land use and land cover change and its influences on territorial NPP in Xinjiang, China. Catena 2014, 115, 85–95. [Google Scholar] [CrossRef]
  62. Zhang, M.; Gao, Y.H.; Zhang, L.; Yang, K.P. Impacts of anthropogenic land use and land cover change on climate extremes based on CMIP6-LUMIP experiments: Part II. Future period. Clim. Dyn. 2024, 62, 3669–3688. [Google Scholar] [CrossRef]
  63. Cai, T.; Zhang, X.; Xia, F.; Zhang, Z.; Yin, J.; Wu, S. The Process-Mode-Driving Force of Cropland Expansion in Arid Regions of China Based on the Land Use Remote Sensing Monitoring Data. Remote Sens. 2021, 13, 2949. [Google Scholar] [CrossRef]
  64. Wang, Y.; Shataer, R.; Zhang, Z.; Zhen, H.; Xia, T. Evaluation and Analysis of Influencing Factors of Ecosystem Service Value Change in Xinjiang under Different Land Use Types. Water 2022, 14, 1424. [Google Scholar] [CrossRef]
  65. Ning, Q.; Ouyang, X.; Liu, S. Spatio-Temporal Evolution and Quality Analysis of Construction Land in Urban Agglomerations in Central China. Front. Ecol. Evol. 2022, 10, 912127. [Google Scholar] [CrossRef]
  66. Wang, X.; Peng, S.; Wu, J.; Zheng, K.; Wang, S.; Shangguan, Z.; Deng, L. Simulation of the Key Ecosystem Services Changes in China’s Loess Plateau under Various Shared Socioeconomic Pathways Scenarios. Ecosyst. Health Sustain. 2024, 10, 0200. [Google Scholar] [CrossRef]
  67. Ai, X.; Zheng, X.; Zhang, Y.; Liu, Y.; Ou, X.; Xia, C.; Liu, L. Climate and land use changes impact the trajectories of ecosystem service bundles in an urban agglomeration: Intricate interaction trends and driver identification under SSP-RCP scenarios. Sci. Total Environ. 2024, 944, 173828. [Google Scholar] [CrossRef]
  68. Li, D.; Wang, X. Land-Use Change and Efficiency in Laos’ Special Economic Zones. Land 2021, 10, 1012. [Google Scholar] [CrossRef]
  69. Chen, L.; Ma, Y. Current and future characteristics of land use based on intensity analysis and PLUS model: A case study of Foshan city, China. SN Appl. Sci. 2023, 5, 83. [Google Scholar] [CrossRef]
  70. Tomao, A.; Mattioli, W.; Fanfani, D.; Ferrara, C.; Quaranta, G.; Salvia, R.; Salvati, L. Economic Downturns and Land-Use Change: A Spatial Analysis of Urban Transformations in Rome (Italy) Using a Geographically Weighted Principal Component Analysis. Sustainability 2021, 13, 11293. [Google Scholar] [CrossRef]
  71. Zhang, S.; Guan, Z.; Liu, Y.; Zheng, F. Land Use/Cover Change and Its Relationship with Regional Development in Xixian New Area, China. Sustainability 2022, 14, 6889. [Google Scholar] [CrossRef]
  72. Kim, S.; Kim, H.; Kim, K.; Jun, S.-M.; Hwang, S.; Kang, M.-S. Assessing the Hydroclimatic Movement under Future Scenarios Including both Climate and Land Use Changes. Water 2021, 13, 1120. [Google Scholar] [CrossRef]
  73. Tao, J.; Jiang, Q.; Zhang, X.; Huang, J.; Wang, Y.; Wu, W. From frequency to intensity—A new index for annual large-scale cropping intensity mapping. Comput. Electron. Agric. 2023, 215, 108428. [Google Scholar] [CrossRef]
Figure 1. Schematic location of the study area.
Sustainability 17 04322 g001
Figure 2. Flow chart of data processing and model operation steps.
Sustainability 17 04322 g002
Figure 3. LULC in Xinjiang during 2020−2060. (A) Spatial and temporal variation of LULC for the SSP126 scenario from 2020 to 2060; (B) spatial and temporal variation of LULC for the SSP245 scenario from 2020 to 2060; (C) spatial and temporal variation of LULC for the SSP585 scenario from 2020 to 2060.
Sustainability 17 04322 g003
Figure 4. LULC transfer matrix diagram in Xinjiang under different scenarios (2020–2060). (A) Alluvial plot of the land use–transfer matrix for the SSP126 scenario from 2020 to 2060; (B) alluvial plot of the land use–transfer matrix for the SSP245 scenario from 2020 to 2060; (C) alluvial plot of the land use–transfer matrix for the SSP585 scenario from 2020 to 2060.
Sustainability 17 04322 g004
Figure 5. The transfer atlas of land use intensity in Xinjiang. (AH) Land use intensity map for the SSP126 scenario from 2020 to 2060.
Sustainability 17 04322 g005
Figure 6. The transfer atlas of land use intensity in Xinjiang. (AH) Land use intensity map for the SSP245 scenario from 2020 to 2060.
Sustainability 17 04322 g006
Figure 7. The transfer atlas of land use intensity in Xinjiang. (AH) Land use intensity map for the SSP585 scenario from 2020 to 2060.
Sustainability 17 04322 g007
Figure 8. Intensity analysis of land use transfer in Xinjiang. (AD) Absolute and relative transitions in and out of land use intensity for the SSP126 scenario from 2020 to 2060; (EH) absolute and relative transitions in and out of land use intensity for the SSP245 scenario from 2020 to 2060; (IL) absolute and relative transitions in and out of land use intensity for the SSP585 scenario from 2020 to 2060.
Sustainability 17 04322 g008
Figure 9. (AK) Spatial patterns of multi-scale geographically weighted regression coefficients in the SSP126 scenario. (AK) The distribution of the driving force, Intercept, Main road, Secondary road, Waterway, ET, DEM, slope, GDP, PER, POP, TEM.
Sustainability 17 04322 g009
Figure 10. (AK) Spatial patterns of multi-scale geographically weighted regression coefficients in the SSP245 scenario. (AK) The distribution of the driving force, Intercept, Main road, Secondary road, Waterway, ET, DEM, slope, GDP, PER, POP, TEM.
Sustainability 17 04322 g010
Figure 11. (AK) Spatial patterns of multi-scale geographically weighted regression coefficients in the SSP585 scenario. (AK) The distribution of the driving force, Intercept, Main road, Secondary road, Waterway, ET, DEM, slope, GDP, PER, POP, TEM.
Sustainability 17 04322 g011
Table 1. Sources of data.
DataSub-DataSources
Land use dataLand useResource and Environment Science Data
Center, Chinese Academy of Sciences
http://www.resdc.cn/
Natural dataDEMGeospatial data clouds
http://www.gscloud.cn/
SlopeGeospatial data clouds
http://www.gscloud.cn/
Soil typeFood and Agriculture Organization of the United Nations
https://www.fao.org
Evapotranspiration datahttps://figshare.com/
Vector data for river systemsNational Catalog Service For Geographic Information
http://www.webmap.cn
Future climate dataCoupled Model Intercomparison Project Phase 6
https://esgf-data.dkrz.de
Socioeconomic dataFuture population density datahttps://figshare.com
Future GDP datahttps://figshare.com
Vector dataset of major roads, minor roadsOpen Street Map
https://www.openstreetmap.org
Disclaimer/Publisher’s Note: The statements, opinions and data contained in all publications are solely those of the individual author(s) and contributor(s) and not of MDPI and/or the editor(s). MDPI and/or the editor(s) disclaim responsibility for any injury to people or property resulting from any ideas, methods, instructions or products referred to in the content.

