Abstract
This paper introduces an innovative, environmentally sustainable, and climatic study analysing the impact of overhang depths on heating and cooling building energy demands in the Mediterranean Basin via dynamic energy simulations of a south-oriented reference residential building zone. The adopted bioclimatic approach aims at increasing building sustainability and suggests, for representative Köppen–Geiger climate subtypes, optimal overhang depths and climate-correlated depth domains. The definition of a large geoclimatic study based on 80 locations and the classification of results based on climate subtypes are two novelties introduced in this work. From the energy point of view, overhangs can reduce local building cooling needs by, on average, 27%, while decreasing the total final energy needs (QTOT) by 17%. A new approach is also introduced: comparing the energy reduction due to the addition of an overhang to commonly applied envelope retrofitting solutions, such as wall insulation or window substitutions. Overhangs show great potential in sites with arid climate subtypes and are more effective than other solutions in several locations. This study underlines the need to increase the adoption of passive cooling solutions by local retrofitting regulations in places with a Mediterranean climate, following a bio-regionalist approach able to increase the local buildings’ sustainable development.
1. Introduction
The European Green Deal and the Next Generation EU are in line with the European Union’s goals of climate neutrality by 2050 and reducing greenhouse gas (GHG) emissions by at least 55% by 2030 [1,2,3]. These policies are impacting the building sector, which alone is responsible for more than 40% of total primary energy needs [4]. Adherence to the guidelines will require not only improving the performance of new buildings but also retrofitting existing building stock [5,6]. Additionally, the EU EPBD context (Energy Performance of Buildings Directive) [4,7] supports the progressive inclusion in Member States’ (MS) regulations of higher energy efficiency parameters to reduce energy needs in the building sector. It is known that about 50% of a building’s energy needs are to meet the heating, cooling, and ventilation requirements for confined spaces [8]. In particular, these needs are correlated to three main building functions: i. climate and microclimate (site conditions); ii. envelope characteristics; and iii. active mechanisms, i.e., equipment [9,10]. For this reason, MS’s regulations support, for each climatic zone, on the one hand, the improvement of the equipment performance and, on the other hand, the installation of envelope thermal insulation in new and retrofitted buildings—see, for example, the Italian regulations on minimal requisites [11,12]. These actions focus on the need to curb energy needs, with a consequent emphasis on better thermal insulation rather than natural and passive cooling techniques. This statement is also valid for warmer climates, such as Mediterranean ones, where cooling should be a priority; e.g., Appendix B of the Italian decree 162/2015 on building energy performances and minimal requisites [11,13] defines the minimal envelope U-values based on heating thermal zones, not including seasonal summer impacts. Similarly, bioclimatic cooling solutions and correlated passive technologies are not supported by specific requirements—see, for example, ventilative cooling solutions—with a consequent recognised lack in current regulations [14,15]. Passive cooling strategies include methods to prevent, mitigate, or dissipate heat gain, such as shading systems, thermal mass, and heat sinks [16,17]. Our paper focuses on the first category, which includes fixed overhang solutions. This analysis is applied to the Mediterranean Basin, a region characterised by two main Köppen–Geiger climate groups [18]: arid (group B) and temperate (group C). In this territory, the geoclimatic applicability of passive technologies, primarily passive cooling ones, is firmly site-dependent, requiring specific regional studies for each solution [19,20,21]. In addition, the lack of heating-based retrofitting solutions for the Mediterranean climate requires new studies that compare the impact of different passive solutions on energy needs. This will involve local climatic results from the currently supported strategies, e.g., envelope retrofitting solutions. This paper analyses the impact of overhang shading solutions on energy demands and compares the main envelope retrofitting solutions, i.e., increasing window and wall thermal insulation, based on the local conditions of a set of representative Mediterranean locations.
1.1. State of the Art
1.1.1. General Background: The Importance of Fixed Shading
Heat gain prevention techniques, such as shading systems, are part of fundamental bioclimatic design principles, including active and fixed technologies [17,20,22,23]. While active shading can adapt to boundary conditions, fixed solutions, such as overhangs, need to be designed by considering the specific local conditions. In the Mediterranean climate, these involve minimising cooling loads while allowing for direct solar gain during the winter periods (i.e., without blocking natural light) [24,25]. Although several studies have recently investigated innovative movable shading solutions by studying control logic [26,27,28], including fuzzy logic [29], and design optimisation solutions, such as genetic algorithms [30,31,32], fixed shading is still essential. The latter type of solution, in fact, is not subject to user error, while movable shading systems are. Manual shading adaptations are ineffective if users only adjust the shading less than once a week or even once a month. In such cases, they mainly offer glare protection rather than solar gain control [33]. Furthermore, fixed shading does not require control and monitoring solutions, thereby limiting maintenance costs, potential failure, and damage to the mechanism [34]. Additionally, a recent study demonstrated the holistic efficiency of simple overhangs with respect to other shading solutions, looking at energy, greenhouse gas emissions, and costs [35]. Hence, fixed shading systems need to be further investigated. For these reasons, this paper focuses on fixed overhang shading systems.
1.1.2. Calculation Approaches and Performance Indicators
Fixed shading integration should be part of the building design process, allowing for architectural integration and providing a practical solution without additional cost. Most studies on shading systems refer to the maximisation of summer shading alone. Some also mention how to block direct solar radiation in winter [25,36] or visual comfort and lighting energy issues. However, overall, there are few analyses correlating the thermal and visual domains [37]. The majority of studies do not even consider building simulations. Bioclimatic charts such as the Givoni–Milne one [38,39], adopted for identifying the most locally suitable passive heating and cooling technologies in the early design phases, do not include shading systems. Nevertheless, simplified calculations can estimate shading hours, e.g., maximum air temperatures above 19.5 °C, as reported in bioclimatic chart results [40]. The Mazria chart [41], developed for North American locations, allows for the optimisation of overhang depth in relation to the site latitude and window geometries. However, this uses the sun’s coordinates and the window height to block the summer sun at noon; it does not solve building energy balances or consider diffuse radiation or local climatic conditions. Calculation approaches require the definition of overhang depths to block direct solar irradiation in summer while minimising solar shade in winter. Overhang depths can be calculated using diachronic analyses or specific synchronic checks in representative hours of the day and days of the year, e.g., the solstices. Design methodologies refer to monthly (or daily) average temperatures and/or solar irradiation intensity to define the required shading periods—see, for example [42,43,44]. Fixed shading shapes may be determined during the design phase by analysing different types of shading mask protractors—see, for example [36,41,45] and the Architectural Graphical Standards produced by the American Institute of Architects (AIA) [46]. However, these graphical approaches do not consider the energy impact on heating or cooling needs or correlate with specific building envelope characteristics. Finally, they do not generally include the effect on diffuse radiation, especially of high solar angles under overcast skies [47], and therefore, do not solve energy balance equations.
Several recent studies focus on the optimisation of shading systems by considering different visual comfort indicators, such as [48] in classrooms and [30] analysing the dynamic optimisation of Spatial Daylight Autonomy (sDA), Annual Sunlight Exposure (ASE), and the Daylight Glare Probability (DGP) in a Turkish climate. However, these papers focus on daylight and do not consider the strong impact of shading in balancing heat gains, which is the main focus of fixed shading systems and our paper. Among the few exceptions is [49], which optimises louvre shadings assuming Useful Daylight Illuminance (UDI) and cooling energy demands as key performance indicators (KPIs). In addition, Ref. [32] considers energy needs and visual comfort, although it focuses on the behavioural patterns of the occupants considering a single climate. Using a multi-objective genetic algorithm, Ref. [50] optimises a classroom shading system with respect to different orientations in Nanchang, China, considering visual and energy indicators.
Nevertheless, the main focus remains on cooling minimisation and, eventually, on limiting shading depths with respect to daylight performance indicators, with limited analyses of merged heating and cooling balances. Our paper proposes to consider overhang depth optimisation based on its effect on both heating and cooling and the consequent total energy demands. Our approach considers commercial overhang reproducible depths without using extremely costly parametric and mass-customised technologies, e.g., additive manufacturing or CNC (Computer Numerical Control), which may reproduce complex optimised shapes different from those currently adopted by professionals [35].
1.1.3. Research Gap 1: Wide-Scale Climatic Analyses
Recent studies adopting energy simulations mainly focus on a single location or a limited number of locations, while geoclimatic analyses on the potential applicability of shading and local optimal overhang depths are missing; see also [37]. Although several recent papers on shading optimisation extend their analyses to a small pool of locations (e.g., Ref. [51] analyses five Iranian sites, Ref. [52] studies five European cities focusing on PV shading, Ref. [53] concerns four Iranian sites, Ref. [54] includes three Turkish locations, and Ref. [55] studies two Iranian towns), they do not present deep territorial and climatic analyses. Our proposed study aims to fill this research gap through an innovative geoclimatic territorial analysis considering large sets of locations representative of the main Mediterranean climate subtypes (according to the Köppen–Geiger classification): desert and semi-arid climates (group B) and temperate climates (group C).
1.1.4. Research Gap 2: Envelope Interaction Analyses (Shading as an Alternative)
In addition, none of the abovementioned works assesses shading systems as an alternative to other envelope energy retrofitting technologies. In a few cases—see, for example [56]—the effect of adding shading is analysed while the envelope characteristics vary for each considered case. No study has compared cooling bioclimatic technology with envelope heating retrofitting, considering building characteristics as a fixed starting point—see, for example [35,57,58,59]. This latter challenge is part of a more extensive debate concerning the potential inclusion of passive cooling solutions in the technical application of current European Green Deal policies. Currently, EPBD-correlated regulations prioritise strategies that reduce heating energy needs. Additional studies are needed to support the inclusion of low-energy cooling policies [14,16,60].
We aim to fill this research gap by analysing the effect of overhang depth on energy demand. We also compare overhangs with different retrofitting conditions. This, to the knowledge of the authors, is a strong point of novelty, allowing us to compare the impact of simple shading with respect to more technologically complex retrofitting solutions, such as wall insulation or window substitution. Addressing this research gap is expected to contribute to the debate on the application of Passivhaus principles—e.g., the maximisation of solar gains and minimisation of heat losses, plus airtightness with mechanical ventilation; see [61]—to Mediterranean climates [62,63,64]. Bioclimatic principles have traditionally suggested the application of one of the following contradictory approaches: i. heat gain prevention; ii. mitigation; and iii. dissipation technologies, such as shading, thermal mass, and ventilative cooling [65,66,67].
1.2. This Paper’s Objectives and Organisation
This paper focuses on overhang climatic optimisation in the Mediterranean Basin, considering final energy needs for cooling (QC) and heating (QH), and studies the effect of overhang depth on the mentioned energy indicators for a typical residential thermal zone. This paper has two specific objectives, aiming at the identified methodological gaps in the literature:
- Objective 1: to study the geoclimatic applicability and optimal depth of overhangs in a large set of Mediterranean locations, analysing how shading can reduce energy demands in different Köppen–Geiger climate subtypes.
This objective addresses the lack of wide-scale climatic coverage studies. To pursue this objective, a sample residential building thermal zone is simulated in EnergyPlus 9.4 (see Section 2.1) in a set of 80 locations around the Mediterranean Basin (see Section 2.2), considering different overhang depths and four climate subtypes (20 locations each). For each site, the scenario minimising the energy needs for heating and cooling is assumed to be the optimal early design condition; see Section 2.3 for the methodological description. Section 3 discusses the optimal overhangs: in Section 3.1, the optimal overhang is evaluated for all four climatic groups in a building without insulation and with single glazing (Case 1), while in Section 3.2, the same analysis is conducted on different types of envelopes (Case 2 (insulation, single glazing), Case 3 (no insulation, double glazing), and Case 4 (insulation, double glazing)) to evaluate variations in optimal overhang depths.
- Objective 2: to study the impact that the addition of an overhang has on building energy demands, considering different envelope retrofitting conditions.
This objective addresses the lack of envelope interaction analyses. It focuses on studying the following:
- The differences between the shading system alone and other envelope retrofitting solutions (adding wall insulation, window changes, or both), to suggest potential paths to meeting the Mediterranean energy-saving regulations, wherein cooling needs are to be considered a priority.
- The impact of the overhang addition on energy needs in different envelope retrofitting cases.
The methodology adopted to pursue this second objective is described in Section 2.4, while results are given and discussed in Section 4. Finally, Section 5 reports the conclusions.
2. Materials and Methods
2.1. The Simulated Residential Thermal Zone
The analyses assumed a reference building thermal zone representing a standard room of a hypothetical residential unit simulated via EnergyPlus, a widely used tool supporting building energy analyses for different performance-driven optimisation analyses [68]. The room was 500 cm × 500 cm with a height of 300 cm and was assumed to be part of a larger building surrounded by other thermal zones at the same temperature. The internal walls and slabs were assumed to be adiabatic, which reduced the impact of boundary effects. The external façade facing south was not adiabatic. It had a large window 200 cm wide and 150 cm high (see Figure 1a) with a window-to-wall ratio of 20%, in line with the Italian national minimum requirements for air-illuminance factors [69].
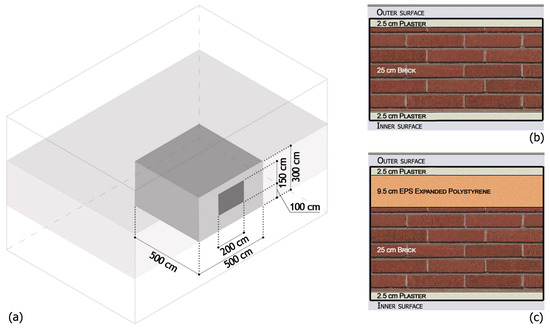
Figure 1.
(a) The selected sample building configuration; (b) wall stratigraphy in Cases 1 and 3; (c) wall stratigraphy in Cases 2 and 4.
The assumed outside reveal depth was 10 cm, and the window frame was made of wood. The exterior wall stratigraphy was defined in line with typical building construction typologies from before the 1970s for warm climates—e.g., [70,71]—and according to the TABULA (Typology Approach for BUiLding stock energy Assessment) construction database developed within the EU co-funded projects TABULA and EPISCOPE (Energy Performance Indicator Tracking Schemes for the Continuous Optimisation of Refurbishment Processes in European Housing Stocks), reporting National Building Typologies representing the residential building stock of MSs [72,73]. Among the different TABULA cases, the reference room was modelled on the multi-apartment residential buildings of the Italian database [74], aligning with the envelope thermal characteristics suggested by energy certification tools, such as TERMOLOG [75].
Four cases were defined to perform this geoclimatic analysis:
In addition to the presence or absence of the insulating layer, the four cases differed in terms of the window system: in Cases 1 and 2, a single clear glazing system was used, while in Cases 3 and 4, a double low-emissivity air-filled glass was adopted (see Table 1).

Table 1.
The four envelope cases considered (ins = insulation; Sgl = single glazing; Dbl = double glazing).
The shadow calculations in EnergyPlus were set to FullInteriorAndExteriorWithReflections using the pixel counting method, and windows were modelled by using the layer-by-layer approach—see also the recommendations in [37,76,77,78]. The artificial lighting system was calculated by applying a 150-lx illuminance threshold and linear dimmer control to include the natural light support. The virtual simulated illuminance sensor was positioned in the centre of the room, 76.2 cm from the ground.
An air exchange ratio per hour (ACH) of 0.5 was given, in line with the suggested essential infiltration and IAQ ventilation from the Italian technical standard UNI/TS 11300 [79]. Additionally, an IAQ (Indoor Air Quality) extra ventilation rate of 0.5 (l/(s m2)) was set following the occupancy profile in line with EN 16798-1 [80]. The described room was modelled and simulated in EnergyPlus [81].
A simple HVAC [82] model was set in EnergyPlus with ideal loads to reduce the impact of specific system choices on the results. Additionally, a winter seasonal COP (Coefficient of Performance) of 3.71 and a summer EER (Energy Efficiency Ratio) of 3.23 were chosen, considering a sample electrical split unit. For this paper, the efficiency values were retrieved by a commercial solution—see multisplit Daikin Siesta [83]. Fixed-efficiency coefficients are compatible with some EU national Energy Performance Certification (EPC) methodologies. This choice allowed us to compare heating and cooling energy needs directly, as both were based on electricity as the final energy source.
The occupancy profile was set using EN 16798-1:2019 [80] for residential apartment units, and the appliance schedules for internal gains were from the same source. The lighting system was activated only during those hours during which EN 16798-1 suggests lighting usage, i.e., avoiding sleeping hours. Schedules were differentiated for weekdays and weekends, with no vacation periods. Set points are assumed to align with values for residential buildings and comfort category II (normal level of expectation), which are mentioned in the same standard. They are set to be 20 °C in winter and 26 °C in summer.
2.2. The Set of Locations
To achieve this paper’s objective, a set of locations was selected to represent typical Mediterranean conditions. Hence, 20 sites were chosen for each of the main climate subtypes distributed along the Mediterranean Basin according to the Köppen–Geiger classification. In this paper, the first two Köppen–Geiger letters are considered, including the main climate group computed from temperature data (°C), excluding group B based on precipitation and temperature, and computing the seasonal precipitation type from seasonal cumulative monthly precipitation values (mm). Based on their climatic classification [18,84], as shown in Figure 2, sites characterised by a dry climate are mainly distributed along the southern Mediterranean territories (BW—dry and arid desert; BS—dry and semi-arid steppe), while the ones with a temperate climate are mainly along the northern Mediterranean Basin (Cs—temperate and dry summer; Cf—temperate and no dry season).
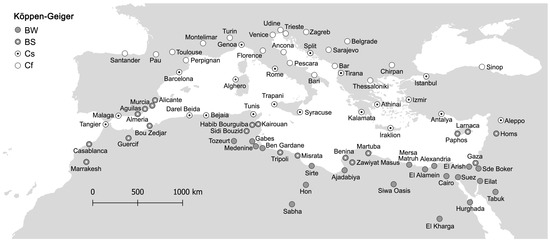
Figure 2.
Köppen–Geiger climatic classification for the selected locations [18,84].
EnergyPlus weather files (EPW) were generated via Meteonorm v8.2 [85], assuming the current reference period. Figure 3 illustrates the distributions of Heating Degree Days (HDD) and Cooling Degree Days (CDD). These indices were computed by adopting the climatic calculation approach defined by EUROSTAT [86]. HDDs were determined by adding up all the daily mean temperature differences from 18 °C when the daily temperature was below 15 °C. Similarly, the CDDs were calculated by adding up all the temperature differences, defined by subtracting from 21 °C the daily mean values when the latter was higher than 24 °C—see [86] for both equations. EUROSTAT and several national standards—see, for example, the Italian 10349-3:2016 [87] for HDD—recognise these climatic indicators as descriptors of the expected building local heating and cooling energy needs.
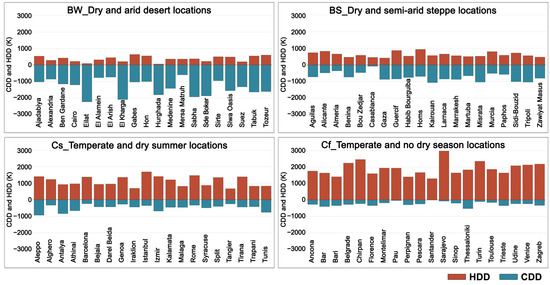
Figure 3.
The cooling and heating degree days, computed following the EUROSTAT methodology, of all the locations, grouped by the four climate subtypes.
It is interesting to note how locations in the same climate subtypes show similar HDD and CDD behaviours (see Figure 3 and Table 2): in BW sites, CDD values are predominant compared to HDD ones; in BS locations, CDD and HDD values are almost balanced; in Cs, HDD values are predominant in comparison with CDD; and finally, in Cf, CDD values are very low while HDD values are the highest.

Table 2.
CDD, HDD, and GHI minimum, maximum, and average values for the four climate subtypes.
The yearly sum of the hourly global horizontal irradiation (GHI) is also retrieved (kWh/m2-y)—see Figure 4 and Table 2—showing the expected territorial and climatic distribution: higher on average in southern locations and lower on average in northern ones.
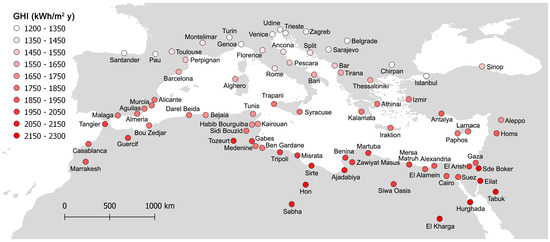
Figure 4.
GHI categorised values for the defined set of locations.
2.3. Optimising the Overhang Depth
The analyses focus on the effect of different overhang depths on the QC, QH, and QTOT of the simulated thermal zone. An overhang is added to the simulated window, varying its depth in a range compatible with most existing architectural integrated solutions, including fixed shading components, balconettes, and balconies. In addition to the original model without shading (i.e., overhang depth = 0 cm), eight different overhangs were added: 25 cm, 50 cm, 75 cm, 100 cm, 125 cm, 150 cm, 175 cm, and 200 cm—see Figure 5.
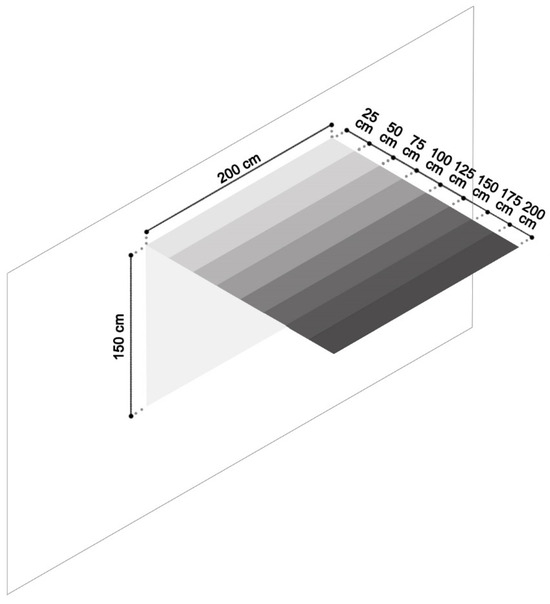
Figure 5.
The selected options of overhang depths (cm).
The optimal overhang depth for each site was selected from among the nine simulated overhang options, based on the one that minimised the given QTOT energy indicator.
2.4. Energy Demands Due to Optimal Overhang Compared to Envelope Retrofitting Actions
The impact of overhangs was also studied in relation to different envelope retrofitting actions by analysing the energy demands (QC, QH, and QTOT) for the four cases described in Section 2.1, with and without optimal shading. Three aspects were analysed to pursue this objective:
Firstly, in Section 4.1, we analyse variations in QTOT due to the addition of the optimised overhang in the reference building case without insulation and with single glazing (Case 1).
Section 4.2 compares the addition of an optimised overhang and the commonly used retrofitting interventions (the addition of external wall insulation and the substitution of window systems) to improve the thermal performance of buildings and reduce energy needs. The actual benefits of retrofitting systems in different climatic conditions are dubious, so we suggest comparing passive shading technology with the most common retrofit interventions with regard to QC and QH. To pursue this objective, we evaluated the variations in QTOT in the various retrofit interventions, i.e., envelopes with additional insulation, double glazing, or both (Case 2, Case 3, and Case 4), compared to the reference envelope, Case 1 (no insulation and single glazing).
Section 4.3 analyses the effect on the variation in QTOT by adding the optimal overhang in all envelope types to verify the impact of shading in combination with other technologies. For this reason, the overhang has been added to the three previous envelope retrofitting cases.
3. Overhang Depth Options
3.1. Cooling and Heating Energy Needs in Case 1 for Climate Subtypes
The entire simulated dataset for Case 1 (no insulation, single glazing), divided by climate subtypes, was analysed to study the impact of the different overhang depth options on QC and QH.
Figure 6 shows that, for all locations, QC and QH were, respectively, indirectly and directly proportional to the increase in overhang depth. In both cases, these trends were not linear. Moreover, Figure 6 underlines major differences between the four climate subtypes but similar trends among locations of the same subtype:
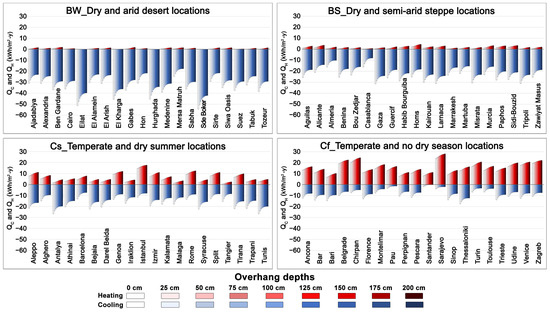
Figure 6.
QC and QH for the different simulated overhang depths for all locations, grouped by the four climate subtypes. Results underline visible differences between the four climate groups, but similar values within each subtype.
- BW sites showed very high QC (30.5 kWh/m2-y on average) as compared to the other three climate groups; the maximum value was 54.6 kWh/m2-y and never fell below 20 kWh/m2-y; the only exception was Mersa Matruh, which required 17.7 kWh/m2-y for an overhang of 200 cm. Conversely, QH (0.6 kWh/m2-y on average) was negligible because it was null in Eilat, El Kharga, Hurghada, Sde Boker, and Tabuk (always less than 0.2 kWh/m2-y) and almost null in the remaining locations (the highest heating values did not exceed 2 kWh/m2-y).
- BS locations showed similar energy demands with respect to BW sites, although QC (20.3 kWh/m2-y on average) was smaller and with limited QH (1.7 kWh/m2-y on average). These sites showed high QC, reaching a maximum value of 31.5 kWh/m2-y, and never fell below 10 kWh/m2-y, the only exception being the city of Casablanca (7.9 kWh/m2-y for 200 cm of overhang). Only three locations reached 31 kWh/m2-y in the options without an overhang (Gaza, Larnaca, and Tripoli). Conversely, QH was negligible because all locations always had values lower than 3.6 kWh/m2-y except in Homs (4.6 kWh/m2-y for 200 cm of overhang).
- Cs sites showed medium QC (14.2 kWh/m2-y on average) compared to the arid climate locations. QC reached a maximum value of 26.7 kWh/m2-y and never fell below 8 kWh/m2-y, except in Barcelona (7.3 kWh/m2-y for 200 cm of overhang). QH (6.3 kWh/m2-y on average) varied from 0.7 kWh/m2-y to 12.5 kWh/m2-y, except in Istanbul (17.7 kWh/m2-y for 200 cm of overhang).
- Cf sites had the lowest QC (7.2 kWh/m2-y on average) of the analysed climatic subtypes. For all locations, QC did not exceed 17.5 kWh/m2-y. On the other hand, QH (15.8 kWh/m2-y on average) had a maximum value of 24.6 kWh/m2-y except in Sarajevo, where it reached 28.1 kWh/m2-y for 200 cm of overhang.
The box and buffer graphs of Figure 7 analyse the distribution of QC and QH values for all locations and overhang depth options in the four climate subtypes. This clarifies the apparent differences between the four climates in terms of both heating and cooling energy needs. Representative quartile limits mainly did not overlap between the four subtypes, identifying direct correlations between climate and energy needs. The highest values present higher variations in the buffers and in the dimensions of the boxes, as expected. In particular:
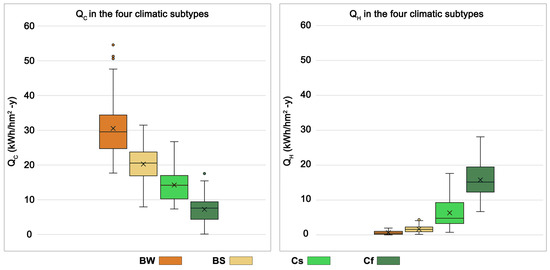
Figure 7.
Box and buffer statistical analysis of the QC and QH for all locations and all overhang depth options, grouped by the four climate subtypes. Results highlight clear statistical differences between the four climates in terms of both heating and cooling needs.
- BW sites highlight the compactness of the data included for the QC, in the range of 24.7–34.4 kWh/m2-y (for the first and third quartile limits, respectively), while the QH values were negligible, with the third quartile limit being 1 kWh/m2-y. Three outliers were present in the upper values for Sde Boker (with overhangs of 0 and 25 cm) and Eilat (without overhang), two locations without heating needs.
- The box plot for BS locations ranged from 16.9 to 23.8 kWh/m2-y for the QC and from 0.9 to 2.3 kWh/m2-y for the QH. Buffers (first and last quartile) showed a higher spread with respect to the central quartiles, in line with expectations.
- Cs sites showed most QC values between 10.2 and 17 kWh/m2-y, but with an upper buffer at 31.5 kWh/m2-y. For the QH, the first quartile was 3.3 kWh/m2-y, and the third was 9.3 kWh/m2-y, confirming the results of Figure 6. In this subtype, heating needs started to be evident, while the higher quartiles showed a higher spread of the data.
- Cf sites showed a 1–3 quartile cooling range of 9.4–4.4 kWh/m2-y, with a median of 7.6 kWh/m2-y, confirming the low QC values of Figure 6; similarly, the QH of Cf locations described a quartile box range of 12.3–19.5 kWh/m2-y and had a median of 15.2 kWh/m2-y. These locations had a significantly lower cooling requirement compared with the other subtypes, with a single outlier (Thessaloniki without overhang) having a higher QC (17.55 kWh/m2-y).
3.2. Optimal Overhang in Case 1
Table 3 shows the optimal overhang for all locations, considering their respective climatic subtypes, and Figure 8 illustrates the same results considering their geographical localisation. As expected, low to medium optimal overhang depths (up to 100 cm) belong to locations that are predominantly in the northern part of the Mediterranean Basin (north of Spain, France, northern and central Italy, Croatia, Serbia, Bulgaria, Albania, Greece, and Turkey). On the contrary, medium to high optimal overhang depths (above 100 cm) are mainly found in the southern part of the Mediterranean Basin (south of Spain, south of Italy, North Africa, and the Arabian Peninsula).

Table 3.
Optimal overhang depth for all locations grouped by the four climatic subtypes (cm).
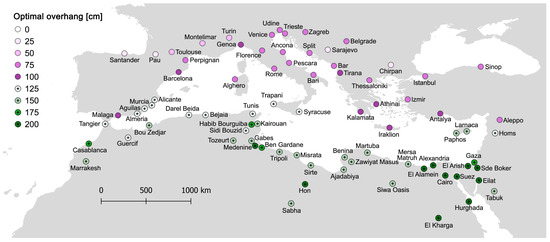
Figure 8.
Optimal overhang depth for all locations (cm).
The analysis of the optimal overhang of all the locations, divided by climatic groups, revealed a close correlation between the depth of the overhang and the climatic subtype (Figure 9). Only three optimal overhang options characterise each of the analysed climatic zones. The overhang depth increases as one passes from localities with a temperate climate to sites with arid steppe and desert climates:
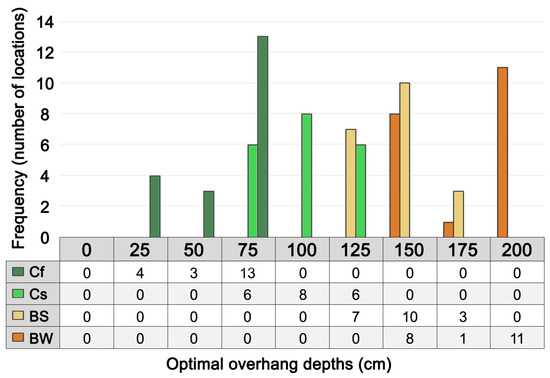
Figure 9.
Optimal overhang depth for all locations, grouped by the four climate subtypes (cm). Results underline specific distributions of the optimal depths in the four climate subtypes.
- BW locations were characterised by extended optimal overhang depths ranging between 105 cm and 200 cm. It is interesting to note that a length of 150 cm characterised 40% of the locations and a length of 200 cm suited 55%, while 175 cm was the optimum for only one location.
- BS locations showed overhang optimal depths of 125 cm (35% of the locations), 150 cm (50% of the locations), and 175 cm (15% of the locations).
- Cs sites showed overhang optimal depth options ranging between 75 cm and 125 cm, with the number of locations divided evenly between the three overhang options.
- Cf sites had the shortest overhang optimal depths, ranging between 25 cm and 75 cm, with most locations (65%) at 75 cm.
3.3. Optimal Overhang in the Different Envelopes
In order to investigate the interaction between overhangs and energy-saving effects due to the addition of wall insulation and window replacement, all analyses were also conducted for the other three envelope cases: Case 2 (insulation, single glazing), Case 3 (no insulation, double glazing), and Case 4 (insulation, double glazing). The analysis of the optimal overhang in Cases 2, 3, and 4 shows that the variations in depth were limited to a few locations reported in Table 4, confirming the optimal overhang depth of Case 1 for all other sites (Table 3).

Table 4.
All optimal overhang variations with respect to Case 1 (cm). The table underlines how variations in the building envelope impact the local optimal overhang depth in only 27% of the locations. Additionally, variations are limited to one overhang option (±25 cm) or two (±50 cm) in cases in which the maximum tested depth (200 cm) is reached.
Figure 10 analyses the impact of the different envelope variations on the optimal overhang distributions for different climate subtypes. The combined effect of the addition of insulation and window replacement in the three simulated cases has a limited impact on the variation in optimal overhang depths with respect to Case 1. The statistical analysis shows that the addition of insulation and the window replacement corroborated the results obtained in Section 3.1: there was a marked correlation between the depth of the optimal overhang and the climatic group. Moreover, each climatic group statistically corresponded to a defined range of optimal overhang depths:
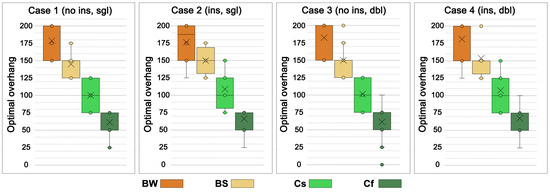
Figure 10.
Box and whisker statistical analysis of the optimal overhang depths for all locations grouped by the four climatic subtypes in Cases 1–4.
- BW had optimal shading depth in the first–third quartile range of 150 to 200 cm.
- BS ranged between 125 and 175 cm when wall insulation was added.
- Cs varied between 75 and 125 cm.
- Cf ranged between 50 and 75 cm.
The box and whisker plots below represent the minimum and maximum optimal overhang depths corresponding to the four analysed climatic groups, providing reference ranges that are valid for the preliminary design.
Geographical coordinates (latitude) were somewhat correlated with the optima (see Figure 8), in line with previous studies—e.g., the mentioned Mazria rule of thumb [41]. Nevertheless, the climatic subtype analyses presented here (Figure 9 and Figure 10) better identify clear trends in these optimal values, identifying four domains of depths, one per climate, that may be used to suggest early design overhang dimensions. The results of Figure 10 clarify this new outcome, identifying clear ranges with minimal statistical buffer variations. This preliminary definition can give guidance on whether to opt for simple and light technical elements, such as metal sheets or wooden panels, or more substantial elements, such as balconettes, balconies, or loggias. This also helps to establish technological integration strategies before detailed design phases and balances technical and compositional aspects.
4. Energy Demands: Optimal Overhang and Comparison with Other Retrofitting Interventions
4.1. Reduction of Energy Demands Due to Optimal Overhang in Case 1
The analyses carried out in all locations showed that the optimal overhang reduces the QTOT energy requirement (Figure 11), demonstrating that shading is a fundamental passive technology for reducing energy needs. The most significant impact on absolute energy savings occurred in cities in the southern part of the Mediterranean Basin, which have a higher cooling requirement.
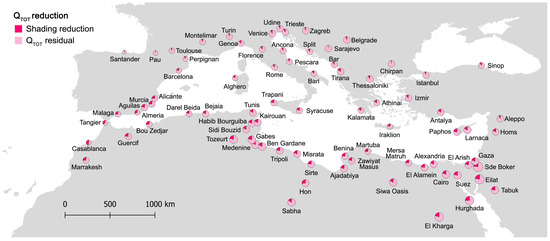
Figure 11.
Reduction of QTOT due to optimal overhang.
Figure 12 takes into consideration the choice of optimal overhang for all locations, divided into the four climatic groups. It can be seen that the climate groups have interesting relationships with the percentage ranges in terms of a reduction in both QC and QTOT:

Figure 12.
QC and QTOT reduction due to optimal overhang for all locations, grouped by the four climate subtypes.
- BW locations showed a significant energy saving of more than 1/5 of the total when overhangs were used; the reduction in QC (−23% on average) was similar to the QTOT reduction (−21% on average) because, in these locations, the incidence of QH was negligible. The minimum was seen in Sabha (−18% QC; −16% QTOT), and the maximum in Hon (−30% QC; −27% QTOT).
- BS sites had a significantly higher percentage of energy savings than BW locations due to the use of overhangs for QC reduction (−28% on average) and QTOT reduction (−23% on average). The minimum was seen in Larnaca (−22% QC; −17% QTOT), and the maximum in Almeria (−36% QC; −29% QTOT). Casablanca was an exception because its percentage reductions were significantly higher than in locations with the BS climate subtype (−50% QC; −46% QTOT).
- Cs locations showed a high percentage of energy savings for QC (−29% on average), but lower for QTOT (−16% on average). Some cities had lower or higher percentages of reduction than the majority of locations in climate group Cs: Aleppo (−19% QC; −8% QTOT), Istanbul (−6% QTOT), Barcelona (−40% QC), and Tangier (−44% QC; −34% QTOT);
- Cf sites showed a significant percentage reduction in energy requirements for QC (−30% on average), with a minimum of −25% in Thessaloniki and a maximum of −35% in Turin. The following are exceptions: Chirpan (−15% QC), Sarajevo (−21% QC), and Santander (−42% QC). The percentages of QTOT of the locations (−7% on average) formed a fairly compact range, from a minimum of 0% in Sarajevo to a maximum of −13% in Bari.
It is important to note that the percentage reduction of QC increased as QC decreased, moving from dry climatic subtypes to temperate climatic groups, because, in the latter, the values of QH were more significant with respect to those of QC. This shows that the use of overhangs is very efficient in dry climates where the QC values strongly impact QTOT. In addition, the analyses showed that the overhang is an essential passive technology even in temperate climates characterised by high QH values. Still, the optimal design of the overhang must be achieved by balancing QC and QH to obtain positive effects in the summer and minimise negative impacts in the winter.
The analyses show that, with the use of optimal overhangs, the reduction of QTOT in all locations was between 5% and 10% in 15 localities, 10% and 20% in 28 localities, and 20% and 30% in 30 localities. Five cities had reductions of less than 5%, and only two cities had reductions greater than 30%. Concerning QC, optimal overhangs allowed us to obtain the following range reduction percentages: 10% and 20% (in 4 localities), 20% and 30% (51 localities), and 30% and 40% (22 localities). No location had a QC reduction of less than 10%, and only three cities had one greater than 40%.
Although this paper does not include climate change analyses, there is expected to be a rise in temperatures in the Mediterranean Basin, with a consequent extension of B and Cs territories. This means that, in the near future, QC requirements will be greater than the QH ones, supporting the need for overhangs and other passive solutions.
4.2. Variation in Energy Demands Due to the Comparison of the Optimal Overhang with Each of the Retrofitting Interventions
This section explores the effects of different types of retrofitting, analysing the QTOT resulting from each single retrofitting action on a non-insulated and single-glazed envelope (Case 1). Taking as a reference the QTOT of Case 1, Figure 13 and Table 5 compare the QTOT reduction effects due to the following retrofitting interventions: i. optimal overhang addition in Case 1, ii. addition of wall insulation (Case 2), iii. glazing substitution (Case 3), and iv. addition of wall insulation plus glazing substitution (Case 4). In order to assess the effectiveness of the various solutions, the reductions in QTOT were evaluated individually for each retrofit in all locations and divided into climatic subtypes.
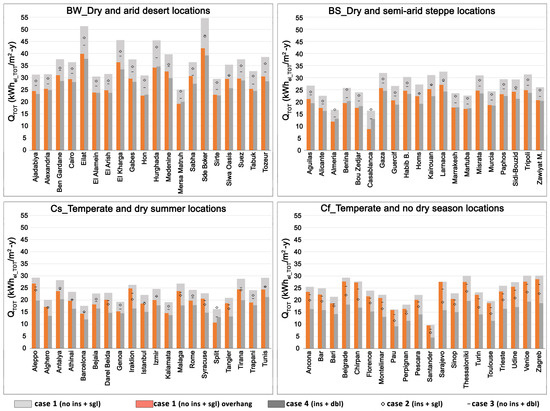
Figure 13.
QTOT of Case 1 with overhang, Case 2, Case 3, and Case 4 with respect to Case 1 for all localities, grouped by the four climate subtypes.

Table 5.
Difference in QTOT between the individual retrofitting interventions and Case 1 (kWh/m2-y).
In BW sites, the overhang addition or insulation plus double-glazing additions led to greater QTOT reductions than insulation addition or glazing substitution. With the exception of seven localities where the QTOT savings of Case 4 were slightly better than the overhang (>2 kWh/m2-y), the difference between the two interventions was limited (Δ1.4 kWh/m2-y on average).
In BS locations, Cases 2 and 3 reduced the QTOT, but in a limited way compared to the overhang addition or insulation plus double-glazing additions. From the comparison, it emerges that overhang produced slightly better results than Case 4 at six sites (Δ0.8 kWh/m2-y on average).
In Cs locations, Case 1 with overhang, Case 2, and Case 3 reduced the QTOT, but in a limited way compared to insulation plus double glazing. From the comparison, it emerges that Case 4 had slightly better results than the optimal overhang at all sites, with the exception of Tangier (Δ3.4 kWh/m2-y on average).
In Cf sites, Case 4 showed the best reductions in QTOT compared to the other cases. Different from the other subtypes, Cf locations had better results in terms of reducing QTOT due to the addition of insulation rather than replacing the glazing. As expected for this climate, Case 1, with the overhang addition, produced QTOT savings, especially compared with Case 4 (Δ7.4 kWh/m2-y on average).
Figure 14 shows, for the four subtypes, the effects of energy variation due to the different retrofit interventions compared with Case 1. In this analysis, the impacts of individual interventions are compared to the individual variations in QC and QH.
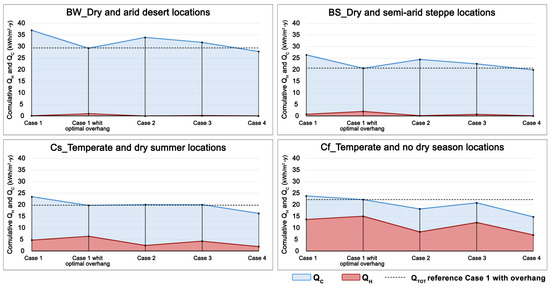
Figure 14.
Cumulative QH and QC (hence the upper line also identifies the QTOT) of Cases 1, 2, 3, and 4 without overhang with respect to Case 1 with optimal overhang for the four climate subtypes. The QTOT dashed line underlines the impact of the overhang compared to the other retrofitting solutions.
- Case 1 with optimal overhang vs. Case 1
As expected, for all four subtypes, compared with Case 1, the overhang addition resulted in a reduction in QC due to the positive effect of shading in the summer and a slight increase in QH due to the decrease in solar gains in winter. A solution to this is the adoption of mobile shading, but it must be considered that the performance of this technology is linked to user behaviour or, alternatively, to the use of expensive automatic systems that may experience maintenance problems. As for fixed overhangs, this result underlines the importance of designing an overhang not only according to its behaviour in the summer but also to the need to balance QC and QH in order to maximise the benefits and minimise the negative effects of this technology. In fact, the balancing of QC and QH allows for obtaining important reductions in QTOT, especially in the BW, BS, and Cs subtypes (BW sites: −21% QTOT, of which −23% due to QC and +2% to QH; BS sites: −23% QTOT, of which −27% due to QC and +5% to QH; Cs sites: −16% QTOT, of which −23% due to QC and +7% to QH; Cf sites: −6% QTOT, of which −13% due to QC and +7% to QH).
- Case 1 with optimal overhang vs. Case 2 and Case 3
When comparing the effects on QTOT of Case 1 with optimal overhang with Cases 2 and 3, the analyses show the different behaviour of these three technologies in the four subtypes. Adding insulation led to good results in terms of reducing QH. The QC reduction is attenuated compared to adding overhangs. For this reason, in BW and BS sites, the overhang addition is preferable to Case 2. In Cs sites, the two technologies had a similar reduction effect on QTOT, a consequence of the improvement in QH due to insulation and a lower QC. This corresponds to a better overhang performance in QC and lower performance in QH. In the Cf subtype, the effect of adding insulation allowed for greater reductions in QTOT than the overhang—QH was a higher percentage of QTOT. The averages of QTOT percentages below are calculated as the change in QTOT, QC, and QH of Case 2 compared to Case 1 with an overhang (BW sites: +17% QTOT, of which +20% due to QC and −3% to QH; BS sites: +22% QTOT, of which +31% due to QC and −9% to QH; Cs sites: +4% QTOT, of which +24% due to QC and −20% to QH; Cf sites: −18% QTOT, of which +13% due to QC and −31% to QH). Case 3 showed a similar behaviour to Case 2 in terms of the reduction of QTOT but differed in its components: replacing the glass reduced the QC a little more than the addition of insulation, but had only a minor reduction effect on the QH. From the comparison of Cases 2 and 3, it is evident that Case 3 was preferable in both BW and BS. In Cs, Cases 2 and 3 had similar QTOT reduction values. In Cf sites, Case 2 produced better reductions of QTOT. The comparison between the overhang addition and the glazing substitution showed that, in BS and BW, the overhang was preferable. In the Cs sites, the two technologies had similar effects on QTOT, while in Cf, the best results in terms of QTOT reduction were obtained with Case 3. The average QTOT percentages below were calculated as the change in QTOT, QC, and QH of Case 3 compared to Case 1 with an overhang (BW sites: +9% QTOT, of which +12% due to QC and −3% to QH; BS sites: +11% QTOT, of which +17% due to QC and −6% to QH; Cs sites: +3% QTOT, of which +14% due to QC and −11% to QH; Cf sites: −7% QTOT, of which +6% due to QC and −13% to QH).
- Case 1 with optimal overhang vs. Case 4
The reduction in QTOT in Case 4 was due to the enhancement of the positive effects and the minimisation of the adverse effects previously described, resulting from the insulation addition and the glazing replacement. The results in Figure 14 show that the reduction in QTOT in the BS subtype resulting from the two technologies was similar: in the BW and Cs subtypes, Case 4 had slightly lower QTOT reduction results; in the Cf subtype, Case 4 had better QTOT reductions than for the overhang. The averages of QTOT percentages below are calculated as the change in QTOT, QC, and QH of Case 4 compared to Case 1 with overhang (BW sites: −4% QTOT, of which −1% due to QC and −3% to QH; BS sites: −1% QTOT, of which +8% due to QC and −9% to QH; Cs sites: −16% QTOT, of which +6% due to QC and −22% to QH; Cf sites: −34% QTOT, of which +4% due to QC and −38% to QH).
The results show that overhang technology is always recommended in dry subtypes. In temperate climates, although Case 4 led to greater QTOT reduction values with respect to the overhang, this may not be sufficient to justify the extent of the intervention. The addition of an overhang can be more advantageous than Case 4, considering that the latter is an expensive retrofitting solution in terms of construction and maintenance and involves much higher costs.
In the Mediterranean Basin, local bioclimatic solutions, such as energy-efficient passive cooling technologies, can be very effective and should be considered in addition to (or alternatively, for warmer locations) heating-dominated retrofit solutions. These results show that overhang technology, which incurs very low construction and maintenance time and costs compared to the other interventions examined, is very effective in the Mediterranean climate and should be included in future regulations.
4.3. Variation in Energy Demands Due to the Impact of Optimal Overhang Associated with Other Retrofitting Interventions
We evaluated the impact of the addition of an overhang on different types of envelopes to assess whether it had benefits when its action was combined with the presence or absence of insulation and single or double glazing.
The results in Table 6 show the percentage reduction in QTOT by comparing, in the four cases and for all locations grouped by climate subtype, the final energy needs without an overhang with the ones with the optimised overhang depth. The results show that overhang technology has diversified effects on energy reduction in relation to insulation, type of glazing, or both:

Table 6.
Case 1 (no ins, Sgl), Case 2 (ins, Sgl), Case 3 (no ins, Dbl), and Case 4 (ins, Dbl) in all localities, grouped by the four climate subtypes: comparison of percentage reduction in QTOT due to the addition of an overhang with the same case without an overhang. Results highlight that wall-insulation addition generally increases the overhang QTOT reduction, while the improvement of the window g-factor reduces the shading impact.
- In Case 1, the average reduction in reference QTOT due to the optimal overhang confirms the analysis in Section 4.1, which indicated the major impact of overhangs on energy savings in a building without insulation and with single glazing.
- In Case 2, which corresponds to an insulated building to which the optimal overhang was added, the QTOT reductions compared to Case 1 increased in a range between +6% and +7%. The rise in the overhang impact when insulation was present aligned with the expected thermophysical behaviour of a highly insulated confined space, where heat gains are stored, reducing losses and exposing the building to overheating risk.
- In Case 3, characterised by the presence of double glazing to which the optimal overhang was added, QTOT reductions compared to Case 1 decreased in the range between −4% and −5% in BW, BS, and Cs but decreased to −2% in Cf. The replacement of the single glass with double glazing reduced the window’s U-value. On the other hand, it limited the solar gains due to a lower g-factor, which reduces the percentage of energy savings in climatic subtypes with high QH values and reduces the need for additional shading.
- In Case 4, which corresponds to a building in which insulation and double glazing are combined when adding the optimal overhang, the QTOT values compared with Case 1 increased progressively from dry to temperate climate zones in a range between +1% and +3%. Combining both interventions reduced the general QTOT both with and without the overhang. However, the relative impact of shading was maintained in line with Case 1, with slight improvements that rose progressively from hotter to colder climate subtypes.
Figure 15 analyses the reductions in QTOT due to the individual retrofitting interventions examined for each subtype. This allows us to compare this reduction with that obtained with the overhang addition in Case 1 and with the effect of the overhang addition on the individual cases. The addition of the overhang significantly improved the reduction in QTOT for all subtypes of the Mediterranean Basin. This QTOT reduction was higher in localities with dry climates, while in temperate climates, the decrease in QTOT was attenuated:
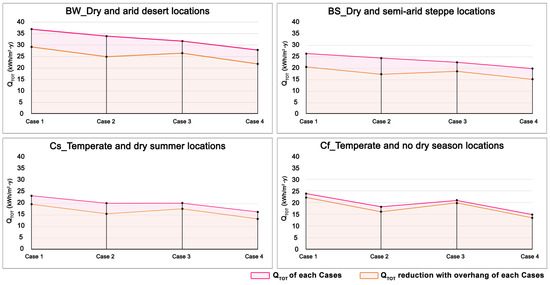
Figure 15.
Case 1 (no ins, Sgl), Case 2 (ins, Sgl), Case 3 (no ins, Dbl), and Case 4 (ins, Dbl) in the four climate subtypes: a comparison of QTOT in each case with QTOT reduction due to the addition of an overhang to the same case.
- BW: −21% on average of all localities in four cases (Case 1: −21%; Case 2: −27%; Case 3: −17%; Case 4: −22%).
- BS: −24% on average of all localities in four cases (Case 1: −23%; Case 2: −30%; Case 3: −18%; Case 4: −25%).
- Cs: −18% on average of all localities in four cases (Case 1: −16%; Case 2: −23%; Case 3: −13%; Case 4: −19%).
- Cf: −8% on average of all localities in four cases (Case 1: −7%; Case 2: −12%; Case 3: −5%; Case 4: −10%).
It has been demonstrated that overhang technology obtains significant results in terms of total QTOT reduction, even when associated with other technologies, especially in the presence of thermal insulation. This is because wall insulation brings benefits in terms of QH reduction. At the same time, an optimised overhang allows QC to be reduced in the summer without compromising the benefits in the winter, thanks to the balance between QC and QH.
The percentage reduction in QTOT derived from the addition of an optimal overhang is more relevant than the other retrofitting solutions considered due to the nature of the technology itself. Overhang technology has a low environmental impact due to the use of fewer materials. The costs and construction and maintenance time are also significantly lower than for the other considered technologies. Research into this point should be expanded in future works, including embodied energy and cost optimisation studies.
5. Conclusions
This paper aimed to identify optimal overhang depths and assess their impact on building energy demands in the Mediterranean Basin, balancing heating and cooling energy demands. The results addressed the two objectives with the following primary outcomes and considerations:
- Adopting overhangs is strongly recommended in dry climatic subtypes (BW and BS Köppen–Geiger climate subtypes) characterised by high QC values. However, adopting this passive technology is also highly advantageous in temperate climates, where it can obtain QC savings above 30% (Cs and Cf). A correct overhang design balancing QC and QH reaps the benefits of this passive technology. The QTOT reductions are very significant: −21% on average in BW sites, −23% in BS, −16% in Cs, and −7% in Cf.
- For a window 1.5 m high, optimal overhang depth ranges were identified for the four climate subtypes: 150–200 cm for BW locations, 125–150 cm for BS (extended to 175 cm for Case 2), 75–125 cm for Cs, and 50–75 cm for Cf (decreasing to 25 cm in colder locations). Identifying these optimal depth ranges helps building designers in the preliminary design phases, allowing for a significant reduction in QTOT.
- The comparison between overhangs and other retrofitting solutions underlined the following results: In the BW and BS sites, the overhang addition resulted in a similar reduction in the QTOT of Case 4 (wall insulation and double glass) and better results compared with Cases 2 (wall insulation and single glass) and 3 (no wall insulation and double glass), identifying how simple passive cooling solutions, such as heat gain prevention via fixed shading systems, can be an alternative. Case 4 is more beneficial in Cs locations than the overhang alone. However, the latter showed a better or similar QTOT reduction for Cases 2 and 3. Finally, in Cf, the increase in thermal insulation dominated. This result highlights the need to include shading systems and other passive cooling solutions in current regulations as alternatives to the current incentivised technologies focused on applying colder climate solutions to the Mediterranean zone.
- The overhang addition can be combined with other retrofitting solutions, and its high potential in reducing QTOT was maintained in the four cases considered: −21% (BW, on average for all four cases), −24% (BS), −18% (Cs), and −8% (Cf). These results are, on average, higher than the ones retrieved above for Case 1 alone. This is because the overhang had a higher impact in terms of reducing QTOT when high thermal insulation was applied (Cases 2 and 4). The results suggest that the energy impact of the overhang addition must be analysed in relation to other potential retrofitting solutions. Splitting the energy evaluation of each technology may be misleading and even risk decreasing the expected energy balance, i.e., inducing high overheating phenomena. Different technologies, including passive ones, have mutual interactions that can enrich or limit building performance. Buildings are like organisms; all parts and technical elements participate in a holistic system. The sooner different technologies, especially climate-friendly ones such as overhangs, are integrated into design phases, the better their effects on increasing the energy performance of a building.
The results underline how optimised overhangs can result in energy advantages in the Mediterranean Basin, especially in BW, BS, and Cs climates. Natural cooling techniques should be part of the regional technological toolkit and included in new regulations. If thermal insulation and window substitution are well-supported choices in building energy bonuses and regulations, other technologies with similar benefits and with reduced complexity, time, and costs must also be considered.
The recommended approach involves some limitations. In the future, it will be important to experiment with variations in terms of building reference shapes, orientations (studies on overhangs mainly focus on south facades, where this fixed shading solution is most suitable [25,43,56]), and thermal characteristics, including variations in the geometrical dimensions of spaces and windows and correlated length/depth/height ratios and window-to-wall ratios. Sensitivity analyses of U-values and thermal masses can also be conducted in the future. Similarly, variations in the HVAC characteristics and in the internal gains, here retrieved by the EN 16798-1 standard ones [80], can be included to study the impact of those simulation inputs on the results. Potentially, researchers could include additional aspects such as life cycle analyses, cost optimisation scenarios, and parametric and machine learning-driven optimisation logic. A future paper is under development on this last point, focusing on developing rule-of-thumb equations. Moreover, additional potential works could analyse the impact of large overhangs on local microclimates, considering, for example, their potential effects on wind and airflows influencing, for example, natural ventilation potentials or the creation of additional microclimates under overhangs. Finally, additional studies may focus on integrating energy and Indoor Environmental Quality (IEQ) KPIs, supporting multi-optimisation strategies and integrating multi-simulation methodologies and tools, as suggested in a recent review paper [68] and demonstrated by newly developed dynamic simulation platforms including the EnergyPlus engine [88,89].
Nevertheless, this paper’s main outcomes suggest that heat gain prevention techniques are fundamental for the Mediterranean climate in several locations, even surpassing in impact the currently recommended retrofitting. It is essential, at least as an alternative to transplanting these colder climate technological visions to hotter locations, to support the inclusion of overhangs in regulations and incentivising policies in hotter climates, especially considering that climate change will expand the current southern European climate subtypes to central Europe.
Author Contributions
Conceptualization, C.T.; methodology, G.C. and C.T.; data curation, C.T. and G.C.; writing—original draft preparation, C.T. and G.C.; writing—review and editing, G.C. and C.T.; visualization, C.T. All authors have read and agreed to the published version of the manuscript.
Funding
This research received no external funding.
Institutional Review Board Statement
Not applicable.
Informed Consent Statement
Not applicable.
Data Availability Statement
The simulation result dataset is available upon request from the authors.
Conflicts of Interest
The authors declare no conflicts of interest.
Abbreviations
The following abbreviations are used in this manuscript:
| ACH | Air exchange ratio for hours |
| ASE | Annual Sunlight Exposure |
| BS | dry and semi-arid steppe (Köppen–Geiger classification) |
| BW | dry and arid desert (Köppen–Geiger classification) |
| CDD | Cooling Degree Days |
| Cf | temperate and no dry season (Köppen–Geiger classification) |
| CNC | Computer Numerical Control |
| COP | Coefficient of Performance |
| Cs | temperate and dry summer (Köppen–Geiger classification) |
| Dbl | double glazing |
| DGP | Daylight Glare Probability |
| EER | Energy Efficiency Ratio |
| EPBD | Energy Performance of Buildings Directive |
| EPC | Energy Performance Certification |
| EPISCOPE | Energy Performance Indicator Tracking Schemes for the Continuous Optimisation of Refurbishment Processes in European Housing Stock |
| EPW | EnergyPlus weather files |
| EU | European Union |
| GHG | Greenhouse Gas |
| GHI | Global Horizontal Irradiation (cumulative values in this paper) |
| HDD | Heating Degree Days |
| HVAC | Heating, Ventilation, and Air Conditioning |
| IAQ | Indoor Air Quality |
| IEQ | Indoor Environmental Quality |
| ins | insulation |
| KPI | Key Performance Indicator |
| MS | Member State |
| no ins | no insulation |
| QC | cooling energy demands (final) |
| QH | heating energy demands (final) |
| QTOT | total energy demands (final) |
| R2 | Coefficient of determination |
| sDA | Spatial Daylight Autonomy |
| Sgl | single glazing |
| TABULA | Typology Approach for BUiLding stock energy Assessment |
| UDI | Useful Daylight Illuminance |
References
- European Commission. The European Green Deal 2019. COM (2019) 640 Final. Available online: https://eur-lex.europa.eu/legal-content/EN/TXT/?uri=CELEX:52019DC0640 (accessed on 2 May 2025).
- European Commission. The European Green Deal: Striving to Be the First Climate-Neutral Continent. Available online: https://commission.europa.eu/strategy-and-policy/priorities-2019-2024/european-green-deal_en (accessed on 11 August 2024).
- European Union. Next Generation EU. Available online: https://next-generation-eu.europa.eu/index_en (accessed on 11 August 2024).
- European Union. Directive (EU) 2024/1275 of the European Parliament and of the Council of 24 April 2024 on the Energy Performance of Buildings (Recast); European Union: Brussels, Belgium, 2024; Volume 32024L1275, p. 68. [Google Scholar]
- European Commission. Renovation Wave. Available online: https://energy.ec.europa.eu/topics/energy-efficiency/energy-efficient-buildings/renovation-wave_en (accessed on 11 August 2024).
- European Commission; Directorate Generale for Energy; Directorate C—Renewables, Research and Innovation, Energy Efficiency. Stakeholder Consultation in the Renovation Wave Initiative; European Commission: Ispra, Italy, 2020; p. 61. [Google Scholar]
- The European Parliament; the European Council. Directive (EU) 2018/844 of the European Parliament and of the Council of 30 May 2018 Amending Directive 2010/31/EU on the Energy Performance of Buildings and Directive 2012/27/EU on Energy Efficiency; European Union: Brussels, Belgium, 2018; Volume 32018L0844. [Google Scholar]
- Logue, J.M.; Sherman, M.H.; Walker, I.S.; Singer, B.C. Energy Impacts of Envelope Tightening and Mechanical Ventilation for the U.S. Residential Sector. Energy Build. 2013, 65, 281–291. [Google Scholar] [CrossRef][Green Version]
- Allen, E. How Buildings Work: The Natural Order of Architecture, 3rd ed.; Oxford University Press: Oxford, UK; New York, NY, USA, 2005; ISBN 978-0-19-516198-4. [Google Scholar]
- Chiesa, G. Optimisation of Envelope Insulation Levels and Resilience to Climate Changes/Ottimizzazione Dei Livelli Di Isolamento e Loro Resilienza Rispetto al Cambia Mento Climatico. In Sustainable Technologies for the Enhancement of the Natural Landscape and of the Built Environment/Tecnologie Sosteibili per la Valorizzazione del Paesaggio Naturale e del Costruito; Lucianoeditore: Napoli, Italy; CiTTAM: Napoli, Italy, 2019; pp. 339–372. ISBN 978-88-6026-254-7. [Google Scholar]
- Ministro Sviluppo Economico; Ministro dell’Ambiente e della Tutela del Territorio e del Mare; Ministro delle Infrastrutture e dei Trasporti; Ministro della Salute; Ministro della Difesa. DECRETO 162 del 26 Giugno 2015—Applicazione Delle Metodologie di Calcolo Delle Prestazioni Energetiche e Definizione Delle Prescrizioni e dei Requisiti Minimi degli Edifici; Ministro Sviluppo Economico: Roma, Italy, 2015; Volume 162/2015.
- Presidente Della Repubblica. Attuazione Della Direttiva (UE) 2018/844, Che Modifica la Direttiva 2010/31/UE Sulla Prestazione Energetica Nell’edilizia e la Direttiva 2012/27/UE Sull’efficienza Energetica, Della Direttiva 2010/31/UE, Sulla Prestazione Energetica Nell’edilizia, e Della Direttiva 2002/91/CE Relativa al Rendimento Energetico Nell’edilizia; Senate of the Republic Chamber of Deputies: Rome, Italy, 2020; Volume DL 48/2020. [Google Scholar]
- Ministro Sviluppo Economico. Decreto 162/20156—Appendice B (Allegato 1, Capitolo 4) Requisiti Specifici per gli Edifici Esistenti Soggetti a Riqualificazione Energetica.; Ministro Sviluppo Economico: Rome, Italy, 2015; Volume 162/2015 All1 Cap4, pp. 1–6.
- Plesner, C. IEA EBC—Annex 62—Status and Recommendations for Better Implementation of Ventilative Cooling in Standards, Legislation and Compliance Tools; Aalborg University: Aalborg, Denmark, 2018; p. 53. [Google Scholar]
- Plesner, C.; Pomianowski, M. Ventilative Cooling in Standards, Legislation and Compliance Tools. In Innovations in Ventilative Cooling; Chiesa, G., Kolokotroni, M., Heiselberg, P., Eds.; PoliTO Springer Series; Springer International Publishing: Cham, Switzerland, 2021; pp. 53–78. ISBN 978-3-030-72384-2. [Google Scholar]
- Chiesa, G.; Kolokotroni, M.; Heiselberg, P. Innovations in Ventilative Cooling; Springer International Publishing: Cham, Switzerland, 2021; ISBN 978-3-030-72385-9. [Google Scholar]
- Santamouris, M.; Asimakopolous, D. (Eds.) Passive Cooling of Buildings; James and James: London, UK, 1996. [Google Scholar]
- Kottek, M.; Grieser, J.; Beck, C.; Rudolf, B.; Rubel, F. World Map of the Köppen-Geiger Climate Classification Updated. Meteorol. Z. 2006, 15, 259–263. [Google Scholar] [CrossRef] [PubMed]
- Chiesa, G. Calculating the Geo-Climatic Potential of Different Low-Energy Cooling Techniques. Build. Simul. 2019, 12, 157–168. [Google Scholar] [CrossRef]
- Givoni, B. Passive and Low Energy Cooling of Buildings; Van Nostrand Reinhold: New York, NY, USA, 1994. [Google Scholar]
- Cook, J. (Ed.) Passive Cooling; MIT Press: Cambridge, MA, USA, 1989. [Google Scholar]
- Santamouris, M. (Ed.) Advances in Passive Cooling; Earthscan: London, UK, 2007. [Google Scholar]
- Chiesa, G. (Ed.) Bioclimatic Approaches in Urban and Building Design; PoliTO Springer Series; Springer International Publishing: Cham, Switzerland, 2021; ISBN 978-3-030-59327-8. [Google Scholar]
- DeKay, M.; Brown, G.Z.; DeKay, M. Sun, Wind & Light: Architectural Design Strategies, 3rd ed.; Wiley: Hoboken, NJ, USA, 2014; ISBN 978-0-470-94578-0. [Google Scholar]
- Olgyay, V.; Olgyay, A.; Lyndon, D.; Olgyay, V.W.; Reynolds, J.; Yeang, K. Design with Climate: Bioclimatic Approach to Architectural Regionalism; New and Expanded Edition; Princeton University Press: Princeton, NJ, USA, 2015; ISBN 978-0-691-16973-6. [Google Scholar]
- Chaudhary, G.; Goia, F.; Grynning, S. Simulation and Control of Shading Systems for Glazed Facades; IOP Conference Series: Earth and Environmental Science 352; IOP Publishing Ltd.: Bristol, UK, 2019. [Google Scholar]
- da Silva, P.C.; Leal, V.; Andersen, M. Influence of Shading Control Patterns on the Energy Assessment of Office Spaces. Energy Build. 2012, 50, 35–48. [Google Scholar] [CrossRef]
- Konstantoglou, M.; Tsangrassoulis, A. Dynamic Operation of Daylighting and Shading Systems: A Literature Review. Renew. Sustain. Energy Rev. 2016, 60, 268–283. [Google Scholar] [CrossRef]
- Chiesa, G.; Di Vita, D.; Ghadirzadeh, A.; Muñoz Herrera, A.H.; Leon Rodriguez, J.C. A Fuzzy-Logic IoT Lighting and Shading Control System for Smart Buildings. Autom. Constr. 2020, 120, 103397. [Google Scholar] [CrossRef]
- Özdemir, H.; Çakmak, B.Y. Evaluation of Daylight and Glare Quality of Office Spaces with Flat and Dynamic Shading System Facades in Hot Arid Climate. J. Daylighting 2022, 9, 197–208. [Google Scholar] [CrossRef]
- Alsharif, R.; Arashpour, M.; Golafshani, E.; Rashidi, A.; Li, H. Multi-Objective Optimization of Shading Devices Using Ensemble Machine Learning and Orthogonal Design of Experiments. Energy Build. 2023, 283, 112840. [Google Scholar] [CrossRef]
- Li, L.; Ma, Q.; Gao, W.; Wei, X. Incorporating Users’ Adaptive Behaviors into Multi-Objective Optimization of Shading Devices: A Case Study of an Office Room in Qingdao. Energy Build. 2023, 301, 113683. [Google Scholar] [CrossRef]
- O’Brien, W.; Kapsis, K.; Athienitis, A.K. Manually-Operated Window Shade Patterns in Office Buildings: A Critical Review. Build. Environ. 2013, 60, 319–338. [Google Scholar] [CrossRef]
- Meagher, M. Responsive architecture and the problem of obsolescence. Archnet-IJAR 2014, 8, 95–104. [Google Scholar] [CrossRef]
- Dokhanian, F.; Mohajerani, M.; Estaji, H.; Nikravan, M. Shading Design Optimization in a Semi-Arid Region: Considering Energy Consumption, Greenhouse Gas Emissions, and Cost. J. Clean. Prod. 2023, 428, 139293. [Google Scholar] [CrossRef]
- Olgyay, V.; Olgyay, A. (Eds.) Solar Control & Shading Devices; Princeton University Press: Princeton, NJ, USA, 1976; ISBN 978-0-691-08186-1. [Google Scholar]
- Stevanovic, S. Overhang Design Methods: Optimal Thermal and Daylighting Performance (SpringerBriefs in Architectural Design and Technology); Springer Nature: Singapore, 2022; ISBN 978-981-19301-1-9. [Google Scholar]
- Milne, M.; Givoni, B. Architectural Design Based on Climate. In Energy Conservation Through Building Design; Watson, D., Ed.; McGraw Hill: New York, NY, USA, 1979; pp. 96–113. [Google Scholar]
- Givoni, B. Man, Climate, and Architecture; Elsevier Architectural Science Series; Elsevier: Amsterdam, The Netherlands, 1969; ISBN 978-0-444-20039-6. [Google Scholar]
- Liggett, R.; Milne, M. Climate Consultant, 6.0; UCLA Energy Design Tools Group: Los Angeles, CA, USA, 2017. [Google Scholar]
- Mazria, E. The Passive Solar Energy Book; Rodale Press: Emmaus, PA, USA, 1979; ISBN 978-0-87857-260-1. [Google Scholar]
- Grosso, M. Dinamica Delle Ombre; Celid: Torino, Italy, 1986; ISBN 978-88-7661-120-9. [Google Scholar]
- Grosso, M. (Ed.) Il Raffrescamento Passivo Degli Edifici, 4th ed.; Maggioli: Sant’Arcangelo di Romagna: Milan, Italy, 2017; ISBN 8891622204. [Google Scholar]
- Novell, B.J. Passive Cooling Strategies. ASHRAE J. 1983, 25, 12. [Google Scholar]
- McWatters, K.; Haberl, J. A Procedure for Plotting the Sun-Path Diagram, and Shading Mask Protector. J. Sol. Energy Eng. 1995, 117, 153–156. [Google Scholar] [CrossRef]
- Ramsey, C.; Sleeper, H. (Eds.) AIA Architectural Graphic Standards, 6th ed.; John Wiley and Sons: New York, NY, USA, 1970; ISBN 0-471-70780-5. [Google Scholar]
- Rempel, A.R.; Rempel, A.W.; McComas, S.M.; Duffey, S.; Enright, C.; Mishra, S. Magnitude and Distribution of the Untapped Solar Space-Heating Resource in U.S. Climates. Renew. Sustain. Energy Rev. 2021, 151, 111599. [Google Scholar] [CrossRef]
- Mangkuto, R.A.; Koerniawan, M.D.; Hensen, J.L.M.; Yuliarto, B. Optimization of Daylighting Design Using Self-Shading Mechanism in Tropical School Classrooms with Bilateral Openings. J. Daylighting 2022, 9, 117–136. [Google Scholar] [CrossRef]
- Khidmat, R.P.; Fukuda, H.; Paramita, B.; Koerniawan, M.D.; Kustiani, K. The Optimization of Louvers Shading Devices and Room Orientation under Three Different Sky Conditions. J. Daylighting 2022, 9, 137–149. [Google Scholar] [CrossRef]
- Wang, Y.; Yang, W.; Wang, Q. Multi-Objective Parametric Optimization of the Composite External Shading for the Classroom Based on Lighting, Energy Consumption, and Visual Comfort. Energy Build. 2022, 275, 112441. [Google Scholar] [CrossRef]
- Talaei, M.; Sangin, H. Multi-Objective Optimization of Energy and Daylight Performance for School Envelopes in Desert, Semi-Arid, and Mediterranean Climates of Iran. Build. Environ. 2024, 255, 111424. [Google Scholar] [CrossRef]
- Baghoolizadeh, M.; Nadooshan, A.A.; Raisi, A.; Malekshah, E.H. The Effect of Photovoltaic Shading with Ideal Tilt Angle on the Energy Cost Optimization of a Building Model in European Cities. Energy Sustain. Dev. 2022, 71, 505–516. [Google Scholar] [CrossRef]
- Yao, B.; Salehi, A.; Baghoolizadeh, M.; Khairy, Y.; Baghaei, S. Multi-Objective Optimization of Office Egg Shadings Using NSGA-II to Save Energy Consumption and Enhance Thermal and Visual Comfort. Int. Commun. Heat Mass Transf. 2024, 157, 107697. [Google Scholar] [CrossRef]
- Kirimtat, A.; Manioğlu, G. A Simulation-Based Performance Evaluation of New Generation Dynamic Shading Devices with Multi-Objective Optimization. J. Build. Eng. 2024, 90, 109322. [Google Scholar] [CrossRef]
- Talaei, M.; Sangin, H. Thermal Comfort, Daylight, and Energy Performance of Envelope-Integrated Algae-Based Bioshading and Static Shading Systems through Multi-Objective Optimization. J. Build. Eng. 2024, 90, 109435. [Google Scholar] [CrossRef]
- Stevanović, S.; Stevanović, D.; Dehmer, M. On Optimal and Near-Optimal Shapes of External Shading of Windows in Apartment Buildings. PLoS ONE 2019, 14, e0212710. [Google Scholar] [CrossRef]
- De Luca, F.; Sepúlveda, A.; Varjas, T. Multi-Performance Optimization of Static Shading Devices for Glare, Daylight, View and Energy Consideration. Build. Environ. 2022, 217, 109110. [Google Scholar] [CrossRef]
- Ossen, D.R.; Hadman Ahmad, M.; Madros, N.H. Simulation Based Optimization of Overhang Dimensions with Architectural Materials. J. Asian Archit. Build. Eng. 2005, 4, 563–570. [Google Scholar] [CrossRef]
- Sghiouri, H.; Mezrhab, A.; Karkri, M.; Naji, H. Shading Devices Optimization to Enhance Thermal Comfort and Energy Performance of a Residential Building in Morocco. J. Build. Eng. 2018, 18, 292–302. [Google Scholar] [CrossRef]
- Pomianowski, M. D1.1—EPC Regional Report; Aalborg University: Aalborg, Denmark, 2020; p. 66. Available online: https://edyce.eu/wp-content/uploads/2021/01/E-DYCE_D1.1_EPC_regional_report_18.12.2020_Final.pdf (accessed on 2 May 2025).
- Passive House Institute Passive House Requirements. Available online: https://passiv.de/en/02_informations/02_passive-house-requirements/02_passive-house-requirements.htm (accessed on 5 March 2025).
- Schnieders, J. Passive Houses in South West Europe; Passivhaus Institut: Darmstadt, Germany, 2009; p. 336. [Google Scholar]
- Costanzo, V.; Fabbri, K.; Piraccini, S. Stressing the Passive Behavior of a Passivhaus: An Evidence-Based Scenario Analysis for a Mediterranean Case Study. Build. Environ. 2018, 142, 265–277. [Google Scholar] [CrossRef]
- Borrallo-Jiménez, M.; LopezDeAsiain, M.; Esquivias, P.M.; Delgado-Trujillo, D. Comparative Study between the Passive House Standard in Warm Climates and Nearly Zero Energy Buildings under Spanish Technical Building Code in a Dwelling Design in Seville, Spain. Energy Build. 2022, 254, 111570. [Google Scholar] [CrossRef]
- Chiesa, G. Early Design Strategies for Passive Cooling of Buildings: Lessons Learned from Italian Archetypes. In Sustainable Vernacular Architecture; Sayigh, A., Ed.; Innovative Renewable Energy; Springer International Publishing: Cham, Switzerland, 2019; pp. 377–408. ISBN 978-3-030-06184-5. [Google Scholar]
- Ferrari, G. Duecento Cinquanta Tavole. In L’architettura Rusticana Nell’arte Italiana: Dalla Capanna Alla Casa Medievale; Hoepli: Millano, Italy, 1925. [Google Scholar]
- Pagano, G.; Guarniero, D. Quaderni della Triennale. In Architettura Rurale Italiana; Hoepli: Milan, Italy, 1936. [Google Scholar]
- Wu, S.; Zhou, P.; Xiong, Y.; Ma, C.; Wu, D.; Lu, W. Strategies for Driving the Future of Educational Building Design in Terms of Indoor Thermal Environments: A Comprehensive Review of Methods and Optimization. Buildings 2025, 15, 816. [Google Scholar] [CrossRef]
- Decreto Ministeriale 5 Luglio 1975 “DM 75” (g.u. 18-7-1975, n. 190): Altezza Minima ed ai Requisiti Igienico Sanitari Principali dei Locali D’abitazione; Istituto Poligrafico dello Stato: Roma, Italy, 1975; Available online: https://www.gazzettaufficiale.it/eli/gu/1975/07/18/190/sg/pdf (accessed on 2 May 2025).
- Caleca, L. Architettura Tecnica (Technical Architecture), 4th ed.; Dario Flaccovio: Palermo, Italy, 2009. [Google Scholar]
- Chudley, R. Chudley and Greeno’s Building Construction Handbook, 13th ed.; CRC Press LLC: New York, NY, USA, 2024; ISBN 978-1-03-249288-9. [Google Scholar]
- Loga, T.; Stein, B.; Diefenbach, N. TABULA Building Typologies in 20 European Countries—Making Energy-Related Features of Residential Building Stocks Comparable. Energy Build. 2016, 132, 4–12. [Google Scholar] [CrossRef]
- Loga, T.; Diefenbach, N.; Stein, B. Typology Approach for Building Stock Energy Assessment. Main Results of the TABULA Project—Final Project Report; IWU Institut Wohnen und Umwelt: Darmstadt, Germany, 2012; p. 43. [Google Scholar]
- TABULA. EPISCOPE TABULA WebTool. Available online: https://webtool.building-typology.eu/#bm (accessed on 27 July 2022).
- Logica Soft. Termolog 15 Software. 2025. Available online: https://www.logical.it/software-termotecnica/ (accessed on 2 May 2025).
- U.S. Department of Energy. EnergyPlusTM Version 24.2.0 Documentation. Engineering Reference; U.S. Department of Energy: Washington, DC, USA, 2024.
- De Almeida Rocha, A.P.; Reynoso-Meza, G.; Oliveira, R.C.L.F.; Mendes, N. A Pixel Counting Based Method for Designing Shading Devices in Buildings Considering Energy Efficiency, Daylight Use and Fading Protection. Appl. Energy 2020, 262, 114497. [Google Scholar] [CrossRef]
- Jones, N.; Greenberg, D.; Pratt, K. Fast Computer Graphics Techniques for Calculating Direct Solar Radiation on Complex Building Surfaces. J. Build. Perform. Simul. 2011, 5, 300–312. [Google Scholar] [CrossRef]
- UNI; CTI. UNI/TS 11300-1—Prestazioni Energetiche degli Edifici—Parte 1: Determinazione del Fabbisogno di Energia Termica Dell’edificio per la Climatizzazione Estiva ed Invernale; Ufficio Centrale CTI: Milan, Italy, 2014. [Google Scholar]
- EN 16798-1:2019; Energy Performance of Buildings. Ventilation for Buildings. Indoor Environmental Input Parameters for Design and Assessment of Energy Performance of Buildings Addressing Indoor Air Quality, Thermal Environment, Lighting and Acoustics. Module M1-6. CEN: Newark, DE, USA, 2019; ISBN 978 0 580 85868 0.
- DOE. NREL EnergyPlusTM; DOE: Washington, DC, USA, 2024. [Google Scholar]
- U.S. Department of Energy. EnergyPlus Engineering Reference; U.S. Department of Energy: Washington, DC, USA, 2021.
- Daikin Air Conditioning Italy S.p.A. Dichiarazione del Costruttore per Impianti di Climatizzazione in Pompa Calore; Daikin Air Conditioning Italy S.p.A: Milan, Italy, 2020. [Google Scholar]
- Beck, H.E.; Zimmermann, N.E.; McVicar, T.R.; Vergopolan, N.; Berg, A.; Wood, E.F. Present and Future Köppen-Geiger Climate Classification Maps at 1-Km Resolution. Sci. Data 2018, 5, 180214. [Google Scholar] [CrossRef]
- Meteotest, A.G.; Remund, J.; Müller, S.; Schmutz, M.; Barsotti, D.; Graf, P.; Cattin, R. Meteonorm 8. Handbookpart II: Theory, v.8.2 2023; Meteotest AG: Bern, Switzerland, 2023. [Google Scholar]
- EUROSTAT. Heating and Cooling Degree Days—Statistics 2021; EUROSTAT: Luxembourg, 2021. [Google Scholar]
- UNI 10349-3:2016; Riscaldamento e Raffrescamento degli Edifici—Dati Climatici—Parte 3: Differenze di Temperature Cumulate (Gradi Giorno) ed Altri Indicatori Sintetici (Heating and Cooling of Buildings—Climatic Data—Part 3: Accumulated Temperature Differences (Degree-Days) and Other Indices). UNI: Milan, Italy, 2016.
- Chiesa, G.; Fasano, F.; Grasso, P. A New Tool for Building Energy Optimization: First Round of Successful Dynamic Model Simulations. Energies 2021, 14, 6429. [Google Scholar] [CrossRef]
- Chiesa, G.; Pizzuti, S.; Zinzi, M. A New Approach to Assess the Building Energy Performance Gap: Achieving Accuracy through Field Measurements and Input Data Analysis. J. Build. Eng. 2025, 102, 111941. [Google Scholar] [CrossRef]
Disclaimer/Publisher’s Note: The statements, opinions and data contained in all publications are solely those of the individual author(s) and contributor(s) and not of MDPI and/or the editor(s). MDPI and/or the editor(s) disclaim responsibility for any injury to people or property resulting from any ideas, methods, instructions or products referred to in the content. |
© 2025 by the authors. Licensee MDPI, Basel, Switzerland. This article is an open access article distributed under the terms and conditions of the Creative Commons Attribution (CC BY) license (https://creativecommons.org/licenses/by/4.0/).