1. Introduction
Nutrition plays a fundamental role in public health, directly influencing economic development and the quality of life of populations [
1,
2,
3]. In a context marked by multiple challenges, such as food inequality, rapid urbanization, and the increasing prevalence of non-communicable diseases (e.g., diabetes, obesity, and cardiovascular diseases), adapting international nutritional standards to regional contexts is a necessity [
4]. According to the Food and Agriculture Organization (FAO) and World Health Organization (WHO), sustainable dietary models are an essential solution for addressing current global challenges, including food disparities, urbanization, and the rising incidence of non-communicable diseases. Tailoring these standards to local realities ensures effectiveness and relevance [
5,
6,
7].
To clearly define what constitutes a healthy food basket, the FAO has developed a conceptual framework based on three progressive levels of dietary quality which is used in food cost and affordability analyses:
- (1)
Energy-sufficient food baskets, which provide the minimum caloric intake required for survival but do not ensure nutritional adequacy or long-term health;
- (2)
Nutrient-adequate food baskets, which supply sufficient energy and appropriate levels of essential macronutrients and micronutrients yet may not follow recommended proportions between food groups or reflect cultural preferences;
- (3)
Healthy food baskets, which align with international dietary guidelines, promote long-term health, and ensure a balanced intake across all food groups.
While none of these ideal food baskets fully reflect current consumption patterns, they serve as analytical benchmarks to assess whether current incomes and food expenditures are sufficient to support adequate nutrition. They also help to identify the gap between real-world food choices—often shaped by taste, convenience, or culture—and what is needed for optimal health and well-being [
5,
8,
9].
The Republic of Moldova, a lower-middle-income country undergoing economic transition with pronounced rural–urban disparities and persistent cultural dietary patterns, faces significant challenges in food and nutritional security [
5,
8,
10,
11,
12], especially regarding the affordability of healthy diets and the rising burden of non-communicable diseases [
13]. These challenges are further exacerbated by discrepancies between international dietary recommendations and local food preferences, highlighting the need for an integrated approach that considers both nutritional values and economic and cultural sustainability [
14,
15,
16].
Thus, the aim of this research was to design a healthy food basket (HFB) model adapted to the nutritional needs of the Moldovan population based on international dietary standards. The objective was to provide a scientifically grounded reference model to support the development of public nutrition policies aligned with national context. This study contributes to the evidence base for integrating cultural adaptability with nutritional adequacy, aiming to strengthen food and nutrition security in the Republic of Moldova.
2. Research Methodology
2.1. Defining Methodological Objectives
The primary objective of this research was to develop and validate a healthy food basket (HFB) model tailored to the population of the Republic of Moldova, accounting for the distinct energy and nutritional needs of each demographic group. Unlike studies based on dietary intake data or national nutrition surveys, this model relies on estimative calculations derived from food composition data and standard demographic values, in accordance with international methodologies.
2.2. Calculation of Ideal Body Weight
The ideal body weight (
IBW) was determined using the inverse equation of the body mass index (
BMI) [
17,
18] based on the following formula:
where
BMI represents the body mass index, expressed in kilograms per square meter (kg/m
2) and
H represents the height, expressed in meters (m).
The average height data for the population of the Republic of Moldova were sourced from global reference datasets. The mean values used in this research were 1.75 m for men and 1.63 m for women [
19], providing an accurate basis for determining the IBW across the studied demographic groups.
Based on these average height values, the following standardized approach was applied. This method, based on an optimal BMI of 22 kg/m2, is widely used in international studies for nutritional modeling and diet standardization (e.g., the FAO, WHO, and EFSA). The value of 22 represents the approximate average of the normal BMI range (18.5–24.9 kg/m2) and is particularly recommended when population-specific anthropometric data are not available.
2.3. Determination of Daily Energy Requirements
The daily energy requirements (DERs) were calculated by integrating the resting metabolic rate (
RMR) and the physical activity level (PAL) using the updated Harris–Benedict equations proposed by Pavlidou et al. (2023), which demonstrated improved accuracy for both sexes and BMI categories (
R2 = 0.95 for males and 0.86 for females) [
20]:
where
RMR is the resting metabolic rate, expressed in kilocalories (kcal);
w represents the body weight, measured in kilograms (kg);
h represents the height, measured in meters (
m), and a represents the age in years.
These revised equations were selected due to their validation on a large sample of Caucasian adults (n = 722) with a wide BMI range (17–48 kg/m2), including individuals with controlled metabolic conditions. Their improved performance compared with other predictive models (e.g., Mifflin–St. Jeor, (FAO, WHO, and UNU)) makes them particularly appropriate for the Moldovan population, which is characterized by Eastern European dietary and anthropometric profiles.
The HFB models were developed for four distinct demographic groups: adult men and women (aged 45 years) and retired men and women (aged 70 years). These age groups were selected in accordance with the national classification used for calculating the minimum subsistence level, as defined in the official methodological guide. Given the absence of a national food composition database in the Republic of Moldova, the nutritional content of local food products was estimated using food composition tables recognized and commonly used at the regional level for standardized nutritional assessments. To enhance international methodological relevance, the European Food Composition Data Platform (EFSA, 2024) was also consulted [
21]. This stratification allowed accurate estimation of energy and nutrient needs by both sex and age, and it reflects national population patterns and nutritional vulnerabilities [
21].
The daily energy requirements were subsequently determined using the following formula:
Here, the physical activity level (
PAL) was set to 1.6, corresponding to a moderately active lifestyle [
22,
23,
24,
25]. This value was derived based on an ideal body mass index (
BMI) of 22 kg/m
2 and the average height of Moldovan adults (1.75 m for men and 1.63 m for women). The corresponding body weight was calculated to estimate energy requirements using the revised Harris–Benedict equation. The choice of
PAL = 1.6 is supported by the FAO, EFSA, and national literature and is frequently applied in population-level nutritional assessments. This level also reflects the typical lifestyle patterns observed among the adult population in the Republic of Moldova, as documented in national reports and recent doctoral research [
12,
22,
23,
24,
25].
Furthermore, a
PAL of 1.6 is widely used as a standard reference value in international food basket and diet modeling studies (e.g., the FAO, IOM, and CoNA), ensuring methodological alignment and comparability when population-specific physical activity data are unavailable [
26].
This approach enabled a more precise estimation of energy requirements for each demographic group.
2.4. Calculation of Macronutrient Proportion
The macronutrient proportions within the HFB models were established in accordance with the dietary reference value (DRV) recommendations of the European Food Safety Authority (EFSA) and FAO [
22,
27,
28,
29]. These were calculated based on the daily energy requirements (DERs) for each age group—10–20% of energy from proteins, 30% from lipids, and 55% from carbohydrates—which fall within the AMDR and DRV ranges recommended by the EFSA and FAO. This distribution was selected as a balanced example aligned with international recommendations. The energy distribution was determined using the following formula:
where the specific energy values were fixed at 4 kcal/g for proteins and carbohydrates and 9 kcal/g for lipids. This calculation provided precise values for each macronutrient tailored to the nutritional requirements of the analyzed demographic groups.
2.5. Classification and Selection of Foods
This classification approach was adapted from the FAO’s healthy diet basket (HDB), which consists of six core food groups derived from food-based dietary guidelines (FBDGs). While the FAO HDB is not nutrient-driven, it has been shown to meet approximately 95% of the recommended nutrient intakes on average. The current study contextualized this framework to reflect the dietary habits, cultural context, and market realities specific to the Republic of Moldova. Additionally, the 11-group structure of the national minimum consumption food basket (MCFB), approved by a government decision [
15], was used as a supplementary reference. The resulting seven-group model ensures nutritional relevance, local representativity, and methodological consistency with international guidance.
The food products included in the HFB were grouped based on nutritional similarities and local food preferences (
Table 1):
The selection was based on the following criteria.
Nutritional composition: The nutrient and energy content of bread and bakery products was sourced from previous research [
30,
31,
32]. For other food products, the majority of the macronutrient values were obtained directly from the food labels of products available on the market. Missing information, particularly regarding micronutrient content, was supplemented using regional food composition data traditionally employed for nutritional assessments in Moldova. Additionally, the European Food Composition Data Platform (EFSA, 2024) was consulted to enhance the accuracy and relevance of nutrient estimations for key food products [
33].
Economic availability: The selection of food groups prioritized items representing nearly 80% of the annual food budget, according to the structure provided by the National Bureau of Statistics and the government of the Republic of Moldova’s decisions [
15,
34]. These food categories reflect both the highest economic share and year-round availability.
Sustainability: Products available year-round and those produced locally were selected to reduce import dependency and support domestic production.
Moreover, the selection of food groups and portion sizes was based on an integrated rationale that considered the cultural and dietary context of the Republic of Moldova, international nutritional classification principles, market availability, and energy proportionality. Portion sizes were not chosen arbitrarily but derived from the average energy requirements of each demographic group and proportionally distributed across food groups according to the energy density of each. Additionally, diversity was ensured by including a minimum number of items per group, and the selected products were representative of and affordable for the general population (
Table 2).
Here, ERFC is the equivalent content based on reference foods (edible portion).
Certain groups and products were excluded from the HFB, such as sugar and confectionery products, due to their limited contribution to nutritional benefits; boiled sausages and semi-processed meat products, due to their high content of additives and low nutritional value; and margarine, as a result of its high trans-fat content.
These items were originally present in the national minimum consumption food basket (MCFB), established by Government Decision No. 285/2013 [
15]. While our study did not directly analyze the CAMC, it used this structure as a starting point. Their exclusion from the HFB models represents a deliberate methodological enhancement to align with updated nutritional recommendations and promote healthier diets.
2.6. Validation of Nutritional Adequacy
The mean adequacy ratio (MAR) is a composite diet quality index commonly used to evaluate the overall adequacy of nutrient intake at the individual or population level. It assesses how well a given diet meets current recommended intake levels for a selected group of micronutrients. Although several versions of this indicator exist, the MAR has gained increasing recognition as a summary measure of nutrient adequacy and dietary quality [
37,
38,
39]. It has been positively associated with other quality indicators such as dietary diversity, nutrient density, and food group balance [
40,
41], as well as health-related outcomes [
42]. In this study, the MAR was applied to validate the nutritional adequacy of the HFB models developed for various demographic groups, offering a transparent and population-relevant indicator aligned with international dietary guidelines.
The nutritional validation of the HFB models was conducted using the mean adequacy ratio (
MAR) indicator, which evaluates the extent to which the estimated nutrient intake meets the DRV. The calculation formula is as follows:
where
NAR is the nutrient adequacy ratio is calculated by
Here, NI is the nutrient intake, which is the estimated daily intake of a specific micronutrient provided by the HFB calculated using the dietary reference values (DRVs) recommended by the EFSA and FAO, according to their nutrient evaluation framework, and DRV is the dietary reference value for the respective nutrient.
The DRV values applied in this study were adopted from the European Food Safety Authority (EFSA) guidelines. To ensure terminological consistency and scientific transparency, the following reference levels were used: population reference intakes (PRIs), reference intake (RI), and adequate intake (AI), depending on the nutrient and data availability. These values reflect the official European dietary standards as defined by the EFSA’s Panel on Dietetic Products, Nutrition and Allergies (NDA), and they were systematically applied in all nutrient calculations [
23,
27,
43].
Although the DRV values were adopted without modifications from international sources (the EFSA, FAO, and WHO), the required nutrient intake per HFB was adapted to the Moldovan context. This adaptation took into account the average height, body weight, BMI, and ideal body mass of the national adult population. These factors informed the total energy requirements, upon which the nutrient targets were proportionally based.
To prevent indicator distortion, micronutrient intakes were capped at 1 (or 100% when expressed as a percentage) [
44]. This standardized approach, based on the NAR and MAR methods and international nutrient standards, enabled a transparent, comparable, and population-relevant assessment of the HFB models’ nutritional adequacy.
2.7. Statistical Analysis
Standard calculations related to nutrient adequacy and food basket cost estimations were conducted using spreadsheet-based methods, in accordance with international approaches applied in food and nutrition modeling. Given the descriptive and normative nature of the present study, advanced inferential statistical techniques were not required. However, future research may include more complex statistical treatment in the context of empirical validation and scenario-based modeling.
2.8. Methodological Limitations
The main limitations include reliance on secondary data for food composition, which may lack certain micronutrient details, potentially affecting the accuracy of the developed HFB models. Additionally, the absence of a pilot study, which would have validated the feasibility and practical applicability of the HFB under real-life conditions, represents a significant limitation. These limitations underscore the need for future research involving longitudinal evaluations and addressing economic and sustainability aspects, such as analyzing the life cycle of food products to ensure the broader applicability of the HFB.
3. Results
The Results section provides a detailed analysis of the obtained energy and nutritional values, emphasizing their relevance to the development of HFB models tailored to the specific needs of the population in the Republic of Moldova.
The following subsections present the daily energy requirements and nutritional distribution, followed by an analysis of macro- and micronutrient intake, validation of the models through the MAR, and other relevant indicators.
3.1. Calculation of Energy and Nutritional Requirements
The daily energy requirement (DER) values, calculated using the Harris–Benedict equations for a moderate physical activity level (
PAL = 1.6), are presented in
Table 3. This table presents the key variables and coefficients used in the calculations, providing a foundation for evaluating and interpreting the results. These values reflect the specific energy needs of each demographic group, as described in the methodology. The table provides a concise overview of the variables and coefficients used in the calculations, strengthening the detailed foundation for result evaluation and interpretation. This process incorporates essential demographic and physiological factors, ensuring precise adaptation to nutritional requirements.
This analytical process highlights the importance of including essential demographic and physiological factors in the development of HFB models. Consequently, the HFB models based on these estimates significantly contribute to the design of personalized and balanced food policies, supporting public health by addressing the needs of each demographic category.
3.2. Macronutrient Intake and Their Energy Contribution in the Developed HFB Options
The results section provides a detailed analysis of the obtained energy and nutritional values, emphasizing their relevance for the development of HFB models tailored to the specific needs of the population in the Republic of Moldova. The results are presented according to the demographic groups defined in the methodology, allowing a comparative analysis by sex and age.
3.2.1. Macronutrient Intake and Their Energy Contribution per HFB
Proteins contributed 14.6–14.9% of the total energy value, equivalent to 76.9–99 g per day, depending on the demographic group (
Table 4). These values exceed the minimum threshold of 0.83 g protein/kg body weight recommended by the EFSA and align with the reference range of 10–20% established by the FAO and EFSA [
23]. Protein intake supports metabolic, muscular, and regenerative functions, making it essential for maintaining health [
45,
46].
Lipids accounted for 28.7–30.1% of the total energy value, corresponding to 69.2–89 g per day. The proportions obtained adhere to the reference ranges of 20–35% set by the FAO and EFSA, highlighting a balanced intake of essential fatty acids. This balance is important for metabolic functions and cardiovascular health.
Carbohydrates represented 53.5–55.3% of the total energy value, equivalent to 284.9–368 g per day. These proportions comply with the recommended ranges of 45–60% (EFSA) and 45–65% (FAO), ensuring the energy required for daily physical activity. Notably, the carbohydrate proportion was higher compared with other regions, such as Nordic countries, where the average carbohydrate intake ranges between 42% and 48% of daily energy [
47,
48,
49,
50]. This difference may reflect cultural dietary patterns in Moldova, where carbohydrate-rich foods such as bread, cereals, and potatoes are staple components of the diet [
30,
51,
52]. Additionally, the higher proportion of carbohydrates aligns with the energy demands of the population, particularly in rural areas, where physical activity levels are often higher. However, this balance must be carefully managed to mitigate risks associated with excessive carbohydrate intake, such as the prevalence of non-communicable diseases like diabetes and obesity [
53,
54,
55].
Daily fiber intake ranged from 33.3 g to 40 g, reflecting a significant contribution to digestive health and nutritional balance. This value underscores the inclusion of fiber-rich sources, such as vegetables, fruits, and whole grains, within the HFB structure [
56,
57].
Table 4.
Customized macronutrient distribution and energy contribution in the developed HFB models by demographic group, with comparisons to the FAO and EFSA standards.
Table 4.
Customized macronutrient distribution and energy contribution in the developed HFB models by demographic group, with comparisons to the FAO and EFSA standards.
| | Unit. | Developed HFB | DRV |
|---|
| Nutrients | m | w | rm | rw | EFSA | FAO |
|---|
| Proteins | %, of TEV | 14.8 | 14.9 | 14.6 | 14.9 | 10–20 | 10–35 |
| g | 99 | 80.9 | 90.2 | 76.9 | 0.83g/kg body weight | |
| Lipids | %, of TEV | 30.0 | 30.0 | 30.1 | 30.1 | 20–35 | 20–35 |
| g | 89 | 72.3 | 82.7 | 69.2 | | |
| Carbohydrates | %, of TEV | 55.2 | 55.1 | 55.3 | 55.0 | 45–60 | 45–65 |
| g | 368 | 289.8 | 341.3 | 284.9 | | |
| Fiber | g | 40 | 34.8 | 37.2 | 33.3 | 23.1–27.0 | |
| Total Energy Value (TEV) | kcal | 2670 | 2170 | 2470 | 2070 | Women: 1839–2149 | Men:
2269–2675 | 2330 |
The total energy value aligned with the specific needs of each demographic group, calculated to be 2670 kcal for adult men, 2470 kcal for retired men, 2170 kcal for adult women, and 2070 kcal for retired women. These values adhere to the reference ranges established by the EFSA, which are 2269–2675 kcal for men and 1839–2149 kcal for women [
23]. The reduced energy values for the retired groups were a result of the age-adjusted calculations of the RMR and body weight, aligned with the physiological decline in energy needs associated with aging.
3.2.2. Macronutrient Intake and Energy Contribution per Food Group in the Developed HFB Models
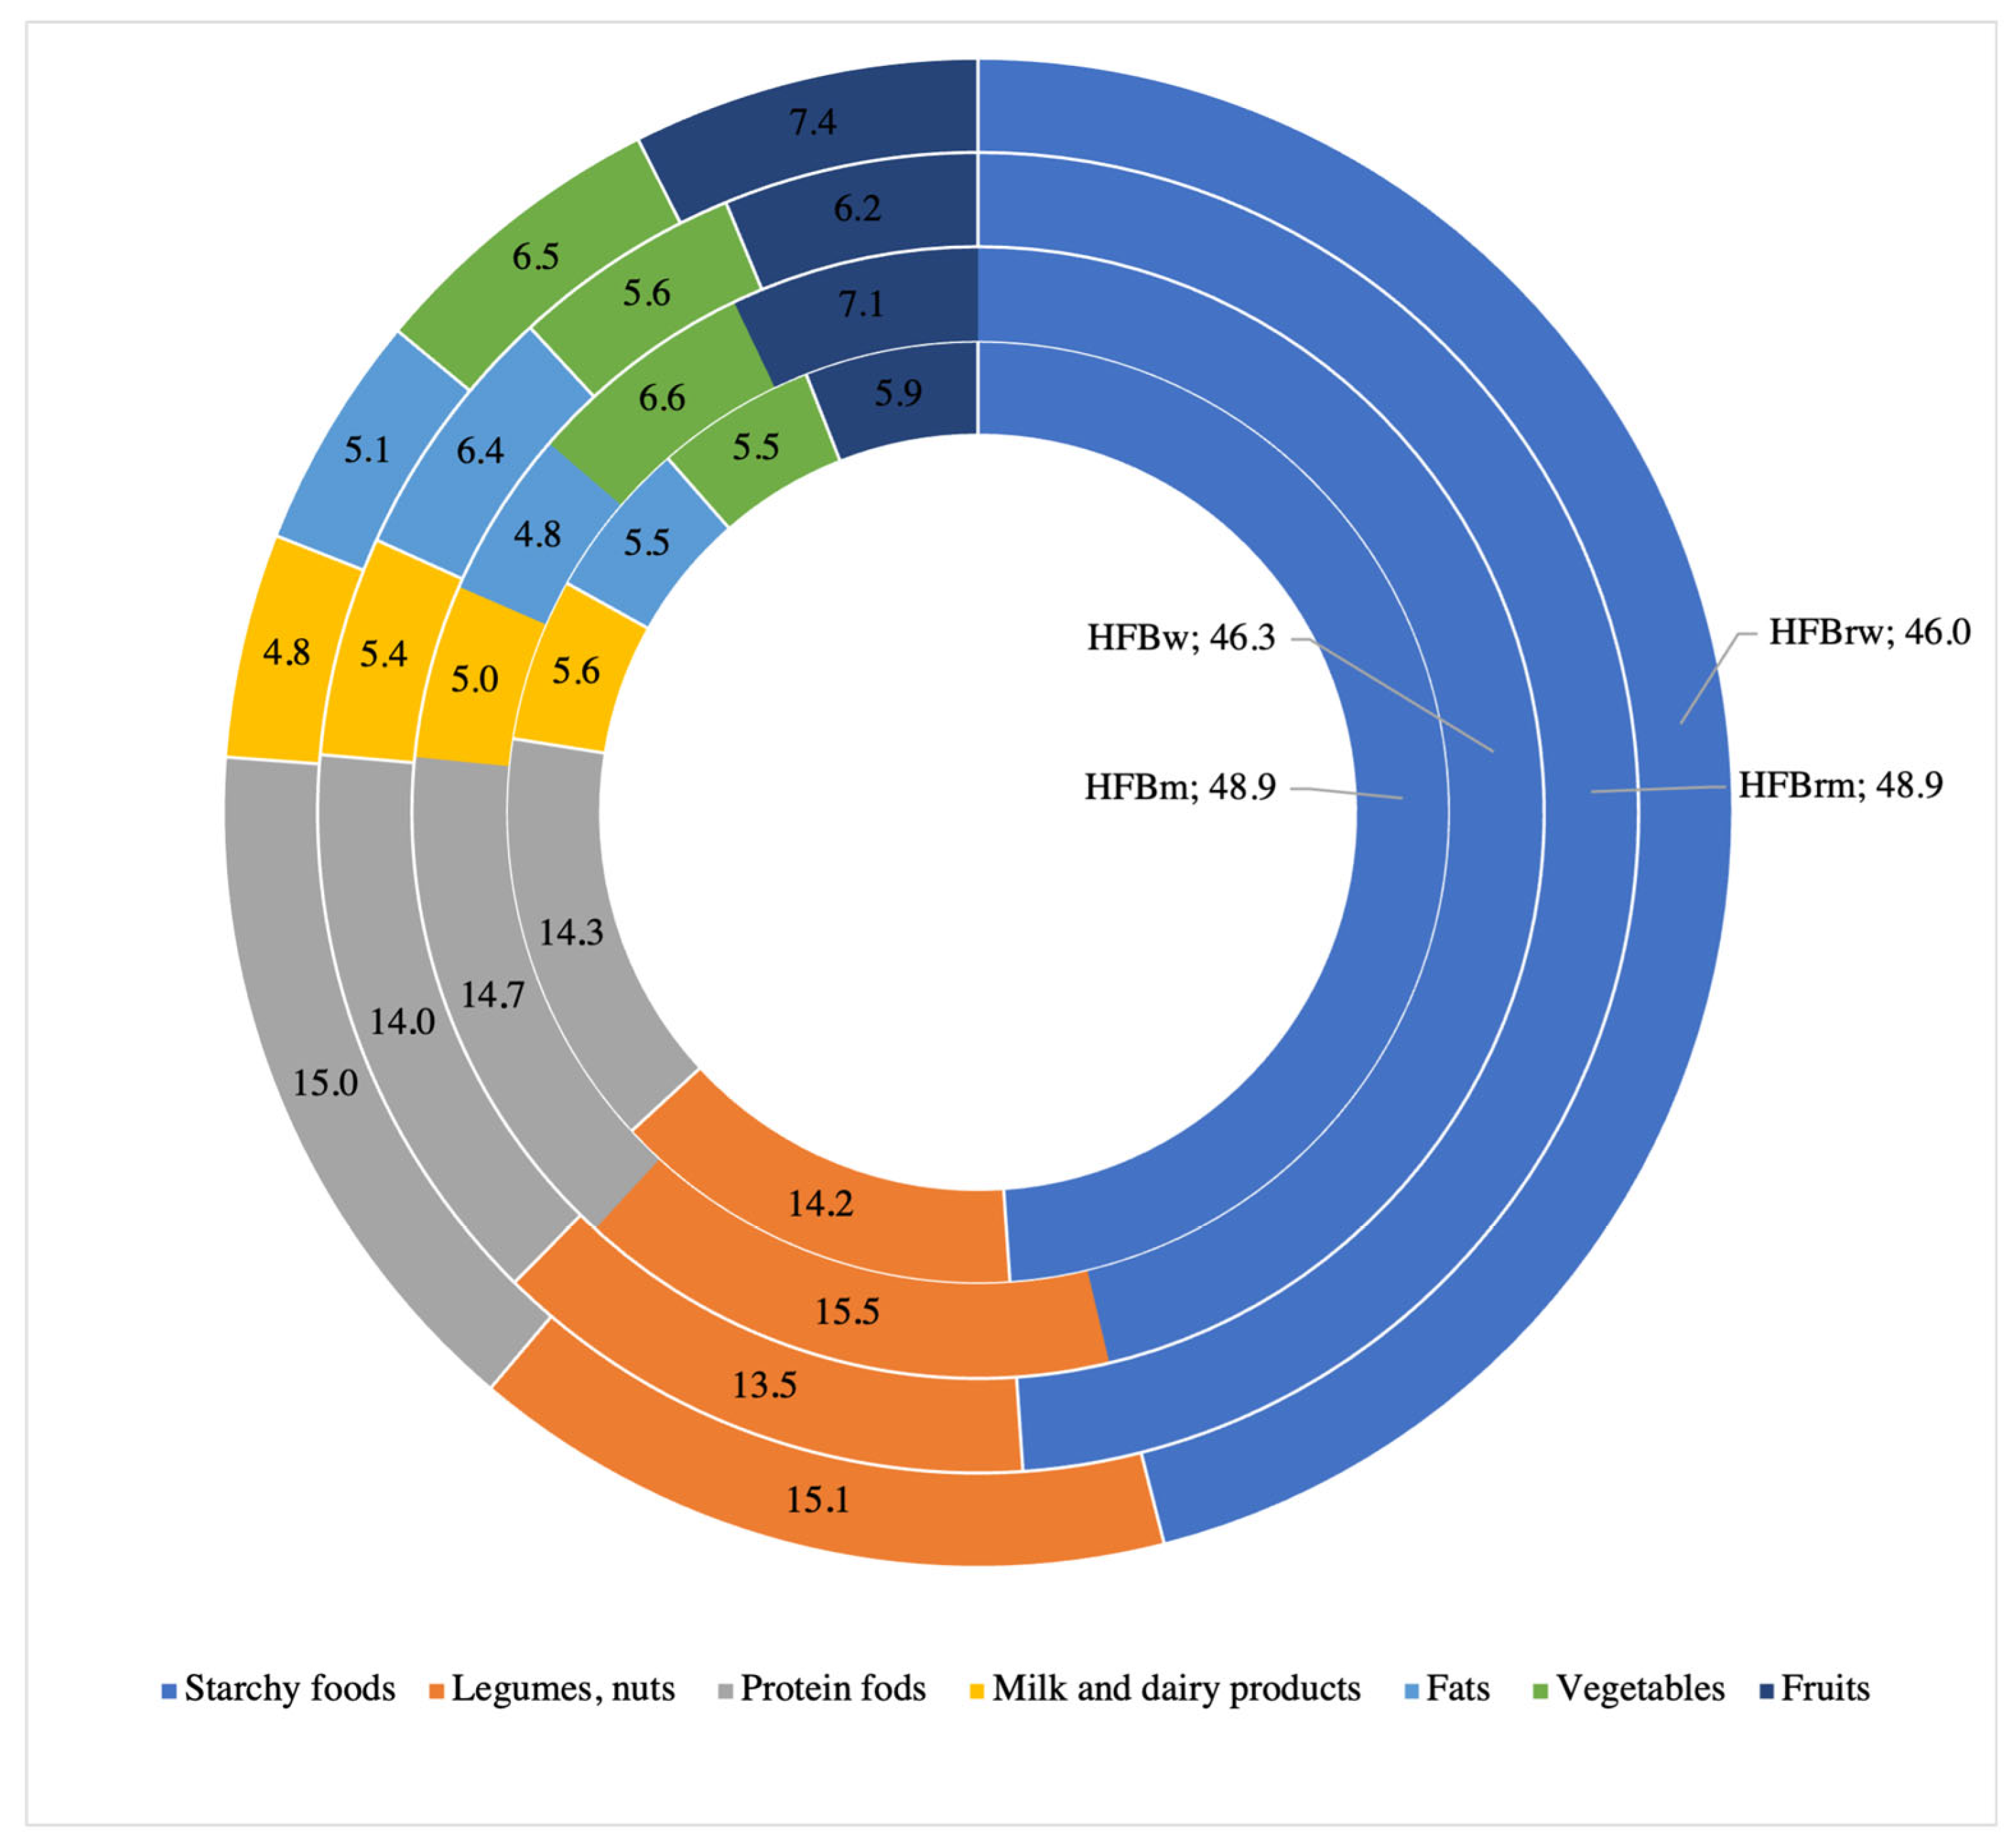
The analysis of energy distribution and macronutrients in the healthy food basket (HFB) models revealed significant variations among food groups, tailored to the specific characteristics of each demographic category. Starchy foods dominated the energy structure across all categories, contributing on average approximately 46–49% of the TEV (
Figure 1), highlighting their role as the primary energy source.
Legumes and nuts represented an important source of proteins and healthy fats, with an energy contribution ranging between 13 and 15%. Protein-rich foods (meat, fish, and eggs) accounted for 14–15% of the TEV, reflecting their essential role in maintaining muscle mass and metabolic functions. Vegetables and fruits complemented the nutritional balance of the HFB models, providing approximately 12–14% of daily energy alongside a consistent fiber intake (30–40 g/day). Dairy products and fats, while contributing less energy (4–6%), added nutritional diversity and supported dietary balance.
The demographic differences reveal that for men, the energy structure was dominated by starchy foods (48.9% of TEV), followed by protein-rich foods (14.3%) and legumes and nuts (14.2%), with a total energy intake of 2670 kcal/day. For women, starchy foods contributed 46.3% of TEV, while legumes and nuts accounted for 15.5%, slightly higher than in men, with a total TEV of 2170 kcal/day.
The distribution of macronutrients and the energy structure of the food groups confirmed compliance with international EFSA and FAO standards. The HFB models were balanced and adaptable, providing an adequate intake of energy and essential nutrients for public health. The dominance of starchy foods, coupled with diverse sources of fiber and protein, ensured dietary optimization tailored to demographic requirements.
3.3. The Micronutrient Intake in the Developed HFB Options
Analysis of the micronutrient distribution in the healthy food basket (HFB) models confirmed optimal alignment with international nutritional requirements, providing a detailed perspective on their contribution to public health (
Table 5). These models ensure a diversified intake of essential vitamins and minerals tailored to the specific nutritional needs of different demographic categories. This balance helps prevent nutritional deficiencies, supporting metabolic and immune health.
For B-complex vitamins, thiamine (B1) ranged from 4.4 mg to 5.9 mg per day, with the highest value recorded in men. Riboflavin (B2) values ranged between 5.3 mg and 6.7 mg, while niacin (B3) levels varied from 14.4 mg to 18.1 mg. These values demonstrate adequate coverage of daily requirements for these vitamins, which are essential for energy metabolism. A slight reduction in intake was observed for women and retirees, reflecting the dietary adjustment to lower energy needs. Vitamin C intake, ranging from 199 mg to 212.5 mg, significantly exceeded the recommended daily requirements, reflecting the predominant role of vegetables and fruits in the diet and their contribution to immune support.
Key minerals such as potassium (K), calcium (Ca), magnesium (Mg), phosphorus (P), and iron (Fe) demonstrated values tailored to the needs of each demographic category. Potassium, ranging from 3300.8 mg to 3889.3 mg per day, highlights the significant contribution of vegetables and fruits to the diet. Calcium values ranged from 569.9 mg for retired women to 702.3 mg for men, suggesting the inclusion of fortified foods or dietary supplements to meet international recommendations for bone health. Iron intake averaged 23.5 mg for retired women and 29.5 mg for men, meeting daily requirements and reducing the risk of anemia. Sodium values, ranging from 540.2 mg to 679.3 mg, remained below the recommended maximum limits, reflecting a healthy approach to salt consumption through a preference for unprocessed foods.
Table 5 illustrates the average values of the micronutrients for each demographic group. The relatively large deviations observed reflect the diversity of food products included in the HFB models and the variability in nutrient content across sources. This variability underscores the importance of a diverse dietary structure to ensure adequate micronutrient intake for all demographic groups, contributing to the prevention of nutritional deficiencies and the promotion of long-term health.
3.4. Validation of Nutritional Adequacy Using the MAR Method
Validation of nutritional intake through the MAR method represents a crucial step in assessing the compliance of healthy food basket (HFB) models with international nutritional requirements. This section provides a detailed exploration of the method used and the results obtained, offering a solid foundation for diet optimization.
3.4.1. Nutrient Adequacy Ratio (NAR)
The nutrient adequacy ratio (NAR) provides an essential perspective on the compliance of diets included in the healthy food basket (HFB) models with international nutritional requirements.
Table 6 shows that the NAR values demonstrated the HFB’s ability to provide optimal micronutrient intake across demographic categories.
Thiamine (B1) recorded NAR values between 1.08 and 1.10, indicating excellent coverage of nutritional requirements and supporting carbohydrate and amino acid metabolism. This consistency across demographic categories highlights a uniform distribution of thiamine sources in the diet. Riboflavin (B2) showed significantly high values (3.30–4.16), reflecting a surplus intake that supports metabolic demands but might require adjustment to avoid excess. Niacin (B3) and vitamin C (ascorbic acid) reached NAR values of 1.03–1.06 and 1.84–2.16, respectively. Vitamin C intake, driven by fruits and vegetables, emphasizes its antioxidant benefits and immune support.
Sodium (Na) showed low NAR values (between 0.36 and 0.45), reflecting a deliberate strategy to reduce salt intake and aligning with recommendations to prevent hypertension. Potassium (K) intake, with NAR values of 0.9–1.1, supports electrolyte balance and cardiovascular health. Calcium (Ca) intake, however, showed a deficit, with NAR values of 0.6–0.7, which is particularly concerning for elderly individuals. Magnesium (Mg) and phosphorus (P) showed high values (1.5–1.6 and 2.7–3.5, respectively), indicating balanced nutrient distributions, while iron (Fe) intake (1.5–3.3) effectively prevents anemia, especially in men.
3.4.2. The Mean Adequacy Ratio (MAR) Indicator
The MAR indicator demonstrates the strong alignment of HFB models with international nutritional requirements. Most micronutrients, including thiamine (B
1), riboflavin (B
2), niacin (B
3), vitamin C, magnesium, phosphorus, and iron, showed MAR values of one, confirming sufficient intake across all demographic categories (
Table 7).
However, the calcium (0.60–0.74) and potassium (0.94) intakes indicated the need for dietary adjustments in specific groups, such as retired women, to address potential deficiencies. Similarly, the reduced sodium intake (0.36–0.45) aligns with strategies to support cardiovascular health but may require careful monitoring to maintain electrolyte balance.
4. Discussions
4.1. Methodological Alignment and National Contextualization
The relevance of the healthy food basket (HFB) models developed in this study is highlighted by their alignment with the DRVs established by international institutions such as the EFSA, FAO, and WHO. This alignment ensures global comparability and supports the integration of HFBs into public health initiatives aimed at improving food security and nutrition.
A key element reinforcing the relevance of these models is the use of the mean adequacy ratio (MAR) indicator, which is widely recognized in the specialized literature and global nutritional policies. The MAR values obtained confirm that most of the analyzed nutrients met or exceeded the reference values, demonstrating the ability of HFBs to fulfill the nutritional needs of diverse demographic categories.
The inclusion of traditional products such as salted or raw pork fat and kefir enhances the cultural adaptability of the HFB models, aligning them with local preferences while maintaining compliance with nutritional standards. At the same time, the significant proportions of fruits, vegetables, and whole grains aligned with the WHO and FAO recommendations, thereby strengthening the scientific foundation of the models.
Compared with international HFB models developed under FAO and EFSA guidance, the Moldovan version preserves the methodological structure but integrates national particularities. These include the use of real food assortments already consumed by the population, seasonal and economic availability, and national anthropometric data for portion sizing (average height, ideal body weight, and BMI = 21.7). These adaptations enhance public health relevance without altering the model’s compatibility with international dietary standards.
4.2. Energy and Macronutrient Distribution in HFB Models
The HFB models aligned with the FAO and WHO recommendations, balancing carbohydrates, proteins, and lipids optimally. Carbohydrates, primarily represented by starchy foods, constituted the main energy source, providing 46.0–48.9% of the total daily energy. While this proportion aligns with global recommendations, the quantities included in the HFB (340.7–467 g/day) exceeded the FAO’s recommendations (322 g/day) [
47,
48,
49], reflecting national dietary practices rather than methodological deviation.
Legumes and nuts, contributing 13.5–14.2% of the total energy, exceeded the FAO’s recommendations (10–12%), but their increased share aligns with traditional consumption patterns and supports the inclusion of affordable, plant-based protein sources.
The energy intake from meat and dairy products ranged between 14 and 15% of the daily energy, adhering to the DRV limits. However, the energy contribution from dairy (4.8–5.6%) was lower than that suggested by FAO HFB models (approximately 10%), reflecting economic constraints and observed consumption behavior. This imbalance could be addressed by promoting the consumption of affordable, calcium-rich dairy options, depending on market feasibility and population preferences.
With an energy contribution ranging between 5.5 and 7.4%, fruits and vegetables met the WHO’s minimum intake of 400 g/day, but their caloric value remained slightly below the FAO’s estimates for this group. This is primarily due to their naturally low energy density and may warrant targeted interventions to improve accessibility and regular consumption, particularly among low-income groups.
Thus, the energy and macronutrient distribution in the HFB models reflects both alignment with international guidelines and adaptation to the Moldovan population’s dietary realities, including economic, cultural, and physiological factors.
4.3. Compliance of Micronutrient Intake with Dietary Requirements
Analysis of the micronutrient intake in the developed HFB models revealed a high level of compliance with the DRVs, supporting their nutritional adequacy for various demographic categories [
23,
27]. The MAR indicator confirmed a balanced intake of essential vitamins and minerals.
For the vitamins, thiamine (B1) showed NAR values of 1.08–1.10, indicating complete adequacy, primarily due to the consumption of starchy foods and legumes. Riboflavin (B2) demonstrated a significant surplus, with NAR values ranging between 3.30 and 4.16, reflecting the consistent contribution of protein-rich foods in the diet. Niacin (B3), with NAR values of 1.03–1.06, was confirmed for optimal compliance, supported by starchy products and animal-based foods. Vitamin C exceeded the recommended requirements, with NAR values ranging from 1.84 to 2.16, emphasizing the importance of fruits and vegetables in immune health and protection against oxidative stress.
For the minerals, the sodium intake fell below the recommended levels, with NAR values of 0.36–0.45. This reflects a deliberate dietary strategy to reduce consumption, aligning with recommendations for preventing hypertension and cardiovascular diseases [
61,
62].
However, it should also be noted that table salt was not included among the modeled products, and the reported sodium values reflect only naturally occurring content. While this aligns with international guidelines aiming to reduce chronic disease risk, excessively low intakes—particularly below 1500 mg/day—may pose clinical risks, especially among older adults [
63,
64]. Hyponatremia, the most common electrolyte imbalance in clinical practice, is associated with increased mortality, cognitive impairment, bone demineralization, and falls, even in mild or chronic cases [
65,
66,
67]. Thus, sodium reduction strategies should be carefully balanced, considering both excess and deficiency risks, and supported through appropriate nutritional education and guidance.
Potassium, with NAR values of 0.9–1.1, indicated near-ideal intake, supporting cardiovascular health [
68]. Conversely, calcium showed a relative deficit, with NAR values of 0.6–0.7, highlighting the need for adjustments for vulnerable groups, particularly postmenopausal women. Increasing the intake of dairy or calcium-rich plant foods could mitigate this deficit. Magnesium, with consistent NAR values above 1 (1.5–1.6), ensured optimal metabolic functioning, while phosphorus, with NAR values of 2.7–3.5, supported bone mineralization and metabolic processes. The iron intake, with NAR values ranging from 1.5 to 3.3, was sufficient to prevent deficiencies, including anemia, meeting population needs effectively.
Thus, the HFB models were well aligned with international nutritional requirements, providing a balanced intake for most essential micronutrients. Although the models successfully ensured adequacy for most key nutrients, minor gaps in micronutrient coverage remain which are similar to those observed in international diet models [
26,
48]. These gaps do not undermine the validity of the models but rather highlight the need for complementary public health strategies to support their implementation, such as nutritional education and improved access to culturally acceptable sources of critical micronutrients for vulnerable groups.
4.4. Validation Through the Mean Adequacy Ratio and Public Health Implications
The MAR serves as a robust tool for assessing the nutritional quality of HFB models, based on international dietary reference standards such as those developed by the EFSA and FAO [
37,
38,
39,
40,
41].
Rather than assessing individual nutrients, the MAR offers a synthetic overview of the model’s ability to meet population-level micronutrient needs.
The high MAR values obtained (ranging from 0.89 to 0.92 for the 10 nutrients evaluated) indicate that the developed HFB models offer balanced and adequate nutrient coverage for population-level needs.
This validation is particularly relevant for public health planning, as it confirms that nutrient requirements can be met without dependence on fortified or ultra-processed products.
However, some micronutrient gaps remain. The calcium and sodium intakes, for example, showed MAR values below the recommended thresholds (0.60–0.74 and 0.36–0.45, respectively). These deficits suggest the need for targeted dietary adjustments through increased consumption of calcium-rich foods such as dairy, leafy greens, legumes, and fortified products, as well as reducing the salt intake through culinary strategies.
The inclusion of culturally appropriate foods, such as kefir and slănină, enhances model acceptability without compromising nutritional quality. Kefir supports calcium intake and digestive health, while slănină, though calorie-dense, is consumed in moderation and reflects local dietary patterns.
The validated MAR outcomes demonstrate that the HFB models align with national consumption habits while ensuring a high level of nutritional adequacy. From a policy perspective, they provide a credible and realistic basis for nutrition interventions aimed at reducing micronutrient deficiencies, supporting metabolic health, and promoting sustainable food practices.
However, as the HFB model is based on deterministic optimization rather than population-based sampling, no statistical tests (e.g., t-test or ANOVA) could be applied to assess the significance of observed deviations from the FAO or EFSA benchmarks. Future studies should explore this aspect using empirical consumption data.
4.5. Integration of Cultural Specificity and Food Sustainability in HFB Models
The development of the healthy food basket (HFB) models for the Republic of Moldova incorporates both nutritional standards and local dietary realities, ensuring cultural relevance and sustainability. The selection of foods reflects Moldova’s culinary identity and social practices. Fermented dairy products such as kefir are included for their nutritional value and wide consumption, while the presence of slănină (salted pork fat), although limited in quantity, reflects traditional eating habits without compromising overall dietary quality.
These items were selected not only for their nutritional contributions but also for their cultural and historical relevance. Kefir represents the industrial form of the traditional “chișleag”, a spontaneously fermented milk still widely prepared in rural Moldovan households and valued for its natural probiotic properties. Salted pork fat, although included in limited quantities, reflects Moldova’s gastronomic heritage and remains part of the official list of basic food products, as defined by Government Decision No. 285/2013 [
15]. Its inclusion ensures alignment with the actual consumption patterns and the structure of the current minimum consumption basket used in national food security and social protection policies.
Traditional food choices in Moldova reflect a long-standing adaptation to the natural environment and agrarian cycles. Ethnographic research highlights that rural dietary patterns evolved as a rational response to climate, resource availability, and seasonal constraints, resulting in a culturally coherent, sustainable food system. Kefir (chișleag) and salted pork fat in particular exemplify this continuity, serving as functional, affordable, and symbolically significant elements of the Moldovan diet.
Legumes and nuts, frequently consumed during religious fasting periods, are an important part of the dietary landscape. Their inclusion in the HFB supports both cultural specificity and ecological sustainability due to their low environmental impact compared with animal-based foods.
The exclusion of margarine, confectionery, and other processed foods rich in trans fats or added sugars reinforces the alignment of the HFB with international health guidelines and contributes to the long-term nutritional well-being of the population.
Moreover, the plant-based component of the HFB—including cereals, vegetables, and fruits—accounts for approximately 50% of the total energy intake, supporting both nutritional diversity and environmental resilience.
However, the lower caloric contribution of fruits compared with the FAO reference models reflects limitations in accessibility and affordability, which may require policy adjustments to improve fruit availability for all population groups.
By integrating locally consumed foods, ecological criteria, and cultural dietary practices, the Moldovan HFB models provide a sustainable and socially coherent framework for promoting public health. These models can also serve as a reference for other countries seeking to align national food baskets with both global standards and local food systems.
This research has already addressed three key pillars of sustainability—nutritional, economic, and cultural—in the development of healthy food baskets tailored to the Moldovan context. While the inclusion of plant-based and locally sourced foods supports ecological sustainability [
8,
26,
48], this study does not provide a full environmental assessment, such as a life cycle analysis (LCA) or ecological footprint evaluation. Future research should incorporate such tools to strengthen the scientific foundation of the HFB’s environmental dimension and to support the development of sustainability-focused food policies.
4.6. Economic Accessibility and Implementation Potential
The Moldovan HFB models differ from international ones by explicitly incorporating affordability criteria grounded in real-life market data and government-defined consumption baskets. All food items were selected based on their inclusion in the official list of socially important goods (Government Decision No. 285/2013) [
14,
15], national production, and year-round availability.
Instead of using theoretical reference foods or the cheapest products per group, the model includes widely available and commonly consumed items that reflect real household purchasing patterns. This enhances the credibility of the model and improves the likelihood of its adoption in national policy frameworks.
Moreover, reliance on locally produced foods reduces exposure to international price volatility and promotes national food security. The use of real price data ensures that the HFB remains economically viable for the general population, particularly for vulnerable groups. This evidence-based affordability approach increases the implementation potential of the HFB models and distinguishes the Moldovan framework from standardized international models lacking localized economic calibration.
These findings are supported by results from a separate national study conducted in 2024–2025, which assessed the cost and affordability of the healthy food basket (HFB) using the same methodological framework [
32]. The analysis revealed that 78.6% of the Moldovan population cannot afford the HFB without reallocating non-food expenditures, and over 50% cannot afford the minimum consumption food basket (MCFB).
Using official food quantity norms from Government Decision No. 285/2013 [
15] and average consumer prices, the study confirmed that all HFB options exceeded the international affordability threshold (defined as 52% of the minimum income or USD 2.15/day) [
32].
These results highlight the structural limitations of affordability, despite the nutritional and ecological validity of the HFB models. To ensure real-world applicability, future implementation must be accompanied by targeted social and fiscal interventions that improve access for low-income households.
However, it should be noted that the referenced complementary national affordability study did not include regional economic variations within Moldova. Considering such regional economic disparities in future research is crucial to accurately capturing the heterogeneity of living standards across the country. This would enable the development of more targeted, equitable, and practically relevant food policy recommendations.
Despite the potential of the healthy food basket (HFB) models, several barriers may limit their practical implementation in the Republic of Moldova. First, economic accessibility remains a significant obstacle; vulnerable groups, particularly in rural areas, often face difficulties affording the HFB without reallocating essential expenditures. Targeted social support programs and subsidies for key nutritious foods could alleviate this barrier. Second, the lack of a systematic and mandatory nutrition education program contributes to persistent unhealthy dietary habits and limits public acceptance of models like the HFB. Introducing structured nutrition education curricula across educational levels is a crucial initial step. Third, widespread misinformation and aggressive marketing of ultra-processed foods challenge public adherence to healthy eating guidelines. Regulatory frameworks promoting accurate food information and responsible marketing practices are needed. Finally, the absence of a centralized national institution dedicated to food and nutrition security results in fragmented efforts and policy incoherence. Establishing a National Council for Food and Nutrition Security would enhance strategic coordination and support the long-term success of HFB models.
Recognizing and addressing these barriers early is essential for translating the HFB framework into sustainable public health gains.
The Moldovan HFB models may serve as practical tools for integrating nutritional adequacy and affordability into national food policies. They can inform the periodic revision of the minimum consumption basket (Government Decision No. 285/2013), support the development of food-based dietary guidelines (FBDG), and guide public programs targeting food assistance and price regulation. Their structure also enables assessment of nutrition-sensitive fiscal and regulatory strategies.
4.7. Study Limitations and Future Directions
This study provides valuable insights into the development of healthy food baskets (HFBs) for the Republic of Moldova but is subject to several limitations. The reliance on existing nutritional and economic data overlooks regional and seasonal variability, potentially limiting its applicability. Statistical averages fail to fully address the needs of specific demographic groups, such as athletes or individuals with unique dietary requirements. The MAR methodology, while robust, requires adjustments to better reflect local cultural practices, such as the consumption of pork fat and kefir. While a complementary national study assessed the cost and affordability of the HFB models, this manuscript does not present a detailed economic breakdown, which limits the depth of discussion regarding household-level financial feasibility.
Additionally, although the revised Harris–Benedict equations were selected due to their improved predictive accuracy across BMI categories and for both sexes (R2 = 0.95 for men and 0.86 for women), they remain estimative tools. Their application may have limited precision in individuals with extreme obesity or unregulated metabolic conditions, which should be considered when interpreting RMR-based energy estimates.
Moreover, fat-soluble vitamins (A, D, E, and K) were not estimated in this study due to the limited availability of accurate compositional data in national or regional food composition sources. This limitation may have influenced the completeness of micronutrient coverage and should be addressed in future assessments through targeted analysis or improved data availability.
Future research should expand the database to include regional and seasonal data, conduct studies on public perception and adoption of HFBs, and perform detailed economic analyses of food sustainability, including modeling implementation costs across different socioeconomic groups.
In addition, the portion sizes proposed in this study were developed in alignment with the normative quantities established for the minimum consumption food basket (MCFB) in the Republic of Moldova, based on national minimal nutritional standards and cost considerations. Although this methodological approach enables comparability between the HFB and the MCFB models, it does not directly reflect real-world consumption patterns, as no comprehensive dietary surveys have been conducted in Moldova to date [
32]. Therefore, future research efforts foresee the validation and adjustment of these portion sizes through dedicated local dietary intake studies, employing methods such as culturally adapted food frequency questionnaires (FFQs), repeated 24-h dietary recalls across seasons, or direct monitoring of food consumption in representative population samples. Implementing these studies will enable a more accurate capture of real consumption patterns, seasonal variations, and regional specificities, thereby enhancing the applicability and relevance of the HFB models.
Pilot studies and tailored nutritional guidelines could further validate the HFBs and enhance their practicality. Comparisons with international models will provide additional insights, supporting the creation of more sustainable food policies for Moldova. This approach can optimize HFBs and facilitate their implementation as effective public health solutions.
5. Conclusions
The present study demonstrated that the healthy food basket (HFB) models developed for the Republic of Moldova offer a practical solution for aligning local diets with international nutritional standards. The use of the MAR indicator confirmed that most essential vitamins and minerals, including vitamins B1, B2, B3, and C, as well as minerals like iron, magnesium, and phosphorus were well represented. However, deficiencies in calcium and sodium, which were particularly observed among retired women, highlight the need for adjustments to better address specific nutritional requirements.
The integration of traditional foods, such as kefir and pork fat, enhanced the cultural adaptability of the HFB models, increasing their acceptability among the population. This approach combines nutritional requirements with cultural specificity and promotes economic sustainability, offering a replicable solution for other regions with similar socioeconomic conditions. The proposed HFB models support global efforts to reduce malnutrition while encouraging a transition to sustainable diets.
This study’s limitations include the use of secondary data and the absence of a longitudinal analysis of the models’ impact on population health. Furthermore, the lack of a detailed assessment of costs and the ecological impact of the HFB limits the understanding of its long-term applicability. Future research should focus on practical validation of these models through pilot studies, extending them to other demographic categories, and incorporating more sophisticated methods for economic and ecological sustainability analysis.
This study provides a solid foundation for developing national food policies that are adapted to and aligned with international standards, contributing to public health and food sustainability both locally and globally. The proposed HFB models demonstrate potential for implementation in similar regions, offering a practical and adaptable solution for improving population nutrition.


