Abstract
Solar energy is a free and promising renewable energy source. However, due to its intermittent problems, a heat accumulation unit is usually required to balance the seasonal differences between solar energy supply and heat energy demand. The filling technology can be used to form the heat energy accumulation unit and store or extract solar energy through a heat exchanger. An experiment and a simulation were carried out to study the heat accumulation and discharge process of a filling body with a heat accumulation unit in this study. The effects of the velocity of the heat transfer medium, the beginning temperature of the filling body, the heat accumulation and the discharge temperature, the heat accumulation and the discharge time ratio, and the additional proportion of CPCM on heat transfer performance were analyzed. The results show the following. The beginning temperature of the filling body has a greater impact on the heat accumulation capacity and a smaller impact on the heat discharge capacity. The heat accumulation capacity increases by 141% and the heat discharge capacity decreases by 10.6% when the beginning temperature decreases from 55 °C to 25 °C. The heat accumulation capacity increases with the rise of the heat accumulation temperature, and the heat discharge capacity has a large increase when the heat accumulation temperature is changed from 70 °C to 80 °C. The heat accumulation capacity of the first 200 min accounts for 83.3% of the heat accumulation capacity of the 400 min; in other words, the heat accumulation capacity can reach more than 80% at half of the heat accumulation time. The filling body with 20% additional CPCM stores 93.7% and discharges 55% more heat than the conventional filling body. The research results will provide guidance for the seasonal accumulation of solar energy using underground space and offer significant support for promoting sustainable energy solutions.
1. Introduction
In recent years, the depletion of fossil fuels and greenhouse gas emissions has promoted the development of clean energy and renewable energy. Solar energy is a free and promising renewable energy source. However, due to its intermittent problems, energy storage systems are usually required to balance the seasonal differences between solar energy supply and thermal energy demand. Seasonal energy storage systems have been shown to effectively solve this problem [1,2,3]. In summer, the waste heat of solar collectors and nearby facilities can be stored in the heat accumulation medium and discharged when needed in winter. This system can not only be used to store renewable energy, such as solar energy, but it also can be used for industrial waste heat recovery and nuclear waste heat recovery. Borehole Thermal Energy Storage (BTES) is the most commonly used ground coupling technology for building heating or refrigeration [4]. BTES is also an effective technology to solve the problems of solar energy fluctuation and seasonality, and it has been successfully applied to regional heating [5]. Shen [6] simulated BTES operation for one year to study the effects of soil thermal conductivity, soil-volume-specific heat, initial soil temperature, and the relative surface area of storage on the energy efficiency of BTES. Catolico [7] developed a three-dimensional transient coupled fluid flow and heat transfer model to investigate the fluid flow and heat transfer processes in soils, aiming to improve the heat extraction efficiency of the BTES system. The BTES solar heating system used in the Drake Landing Solar Community in Canada has been running for more than 15 years, in which solar energy provides more than 90% of community heating and the energy efficiency coefficient reaches more than 30 [8]. The economy of the long-term use of a solar energy BTES system is superior to the traditional ground source heat pump system.
The economy of the BTES system is affected by many factors. In particular, increasing the drilling depth will greatly increase the drilling cost (accounting for 40–50% of the total BTES system), which impedes the further development of the BTES system [9]. The underground space formed by mining offers natural Thermal Energy Storage (TES). Geological exploration data before mining can provide a detailed reference for the development of a deep TES system, which saves the cost of exploration and drilling. At the same time, the pipelines, electromechanical facilities, and roadway engineering formed in mining save a lot of time and cost for the construction of a deep TES system. Therefore, some scholars have combined TES with filling mines to construct Filling Heat Exchangers (BFHEs) to extract deep geothermal energy with the help of existing mine projects [10]. Ghoreishi et al. [11] combined BTES with a filling body for the first time, used the filling body to store geothermal energy, and extracted it from the ground through the heat exchanger, which demonstrated the possibility of recovering geothermal energy using BFHEs. It is estimated that a typical Canadian underground mine can generate 20 MW of available heat energy per year, saving CAD (Canadian dollars) 3.5 million (replacing natural gas heating) or CAD (Canadian dollars) 11 million (replacing electrical heating). China has a lot of available underground space. According to Xie et al. [12], the available underground space of mines in China is approximately 1.56 × 10¹⁰ m3, and it is projected to increase to 2.58 × 10¹⁰ m3 by 2030. The underground space in mines provides basic conditions for large-scale TES. Rock Cavern Thermal Energy Storage (CTES) utilizes former rock caverns, which are originally intended for oil storage, as a form of TES. Oulu oil storage is now filled with water, which is used as the waste heat of the factory for seasonal heat storage. In 1988, the Oxelösund Cave, which has a volume of 200,000 m3, was converted into TES to store waste heat generated by the SSAB steel works. While the feasibility of CTES has been demonstrated, its cost is still too high to replace other hot water storage systems. However, rebuilding existing caves or abandoned mines is economically feasible [13]. Liu Lang et al. [10,14] proposed the functional filling technology of heat storage and release, established the overall scheme and collaborative system of deposit–geothermal collaborative mining, and guided the simultaneous construction of BFHEs in the filling process, which provided the technical and technological support for large-scale underground heat storage and geothermal energy extraction.
Zhang et al. [15] studied the heat transfer performance of a horizontal U-tube through numerical simulation and analyzed the influence of the beginning temperature and the diameter of the buried pipe on its performance. In order to improve the heat storage capacity of BFHEs, Zhang et al. [16] filled the phase change material (PCM) between the inner and outer tubes of a casing heat exchanger. The results show that the addition of PCM between casings can significantly increase the heat storage capacity, and the heat storage capacity increases by 155.2 kJ on average within 10 h compared with the traditional filling body. Based on the similarity theory, Zhao et al. [17] conducted a laboratory-scale BFHE heat transfer experiment. The results show that the heat release capacity and outlet temperature of BFHEs increase with the rise of pipe spacing, pipe length, flow rate, and the surrounding rock temperature, but the low thermal conductivity of the filling body limits the improvement of BFHEs’ performance. In order to overcome the problem of low thermal conductivity of traditional filling materials, Zhao et al. [18] used solid wastes, such as natural flake graphite and copper slag, to replace a part of the tailings to improve the thermal conductivity and thermal diffusivity of the filling body. The experimental results show that the total efficiency of the filling body containing 10% natural flake graphite increases by 31.6% under a surrounding rock temperature of 55 °C. To improve the heat storage capacity and thermal conductivity, composite phase change material (CPCM) was added to the filling body. Zhang et al. [19] used paraffin to replace a part of the tailings, and the thermal conductivity, density, and compressive strength decreased by 25.6%, 12.3%, and 18.7%, respectively, but the specific heat capacity increased by 12.5%. Zhang et al. [20] prepared CaCl2·6H2O/expanded vermiculite shape stabilized phase change material (CEV) and added it to the filling body. After adding 12% CEV, the sensible heat storage and latent heat storage capacity increased by at least 12.74% and 218.97%, respectively. But, the thermal conductivity and compressive strength generally decreased. Li et al. [3] studied the seasonal heat storage and heat release performance of full-scale horizontal parallel straight tube BFHEs using a numerical method. The results show that a coal mine BFHE can provide about 23 GWh of heat per year, and the average thermal energy recovery rate is about 60%. Liu [21] conducted experimental investigations of the mechanical and thermal properties of heat storage functional backfill bodies (HSFBB) mixed with varying contents of low-leakage standard phase change materials (FSPCM) and established a phase change heat storage/release experimental platform to systematically assess the thermal conductivity characteristics of HSFBB. Kazazo [22] has developed a novel colloidal solution by dispersing a core–shell composite structure of phase change materials in water aimed at achieving thermal conversion and storage of solar radiation. Comparative performance analysis of different phase change materials and shell materials indicates that this solution exhibits significant potential in enhancing thermal conductivity, thereby facilitating the advancement of next-generation solar energy technologies toward a net zero future. Afaynou [23] employed a partial filling method to design a heat sink for cooling protruding electronic components attached to a metal fin. The results indicated that the partial filling strategy can effectively enhance the overall thermal management performance of phase change material (PCM)-based heat sinks. Zhao [24] presented a solar-assisted backfill coupled heat exchanger system (SABCHE-SHS) that integrates a seasonal thermal storage mechanism, enabling the storage of solar energy during non-heating periods while enhancing the efficiency of thermal storage and extraction. The results indicated that this system demonstrates excellent thermal management performance over ten years of operation. The performance optimization of solar air collectors integrated with phase change materials (SAC-PCM) relies on accurate heat transfer models. Traditional models overlook the temperature differences between PCM melting and solidification. Zhang [25] introduced super cooling phenomena to refine the mathematical model, significantly reducing temperature deviation errors, and investigated the impact of design parameters on heat transfer and efficiency.
However, current research on the thermal storage of a filling body is often limited to geothermal energy, and research on the application of a filling body to store solar energy is lacking. Therefore, the operating parameters and conditions involved in the previous research may not be applicable. It is necessary to explore the relevant parameters and operating conditions of a solar energy accumulation system. In this study, a filling body coupled with a heat exchanger will be used to realize the accumulation and utilization of solar energy (Figure 1). The filling slurry (water, cement, tailings, and CPCM) was poured into the box of the buried heat exchanger to form a filling body with 10% CPCM. Laboratory-scale experiments were carried out to study the temperature change and the heat accumulation and release performance of the filling body. The effects of the velocity of the heat transfer medium, the beginning temperature of the filling body, the heat accumulation and release temperature, the heat accumulation and release time ratio, and the additional proportion of CPCM on heat transfer performance were analyzed. The research results will provide guidance for the seasonal accumulation of solar energy using underground space.
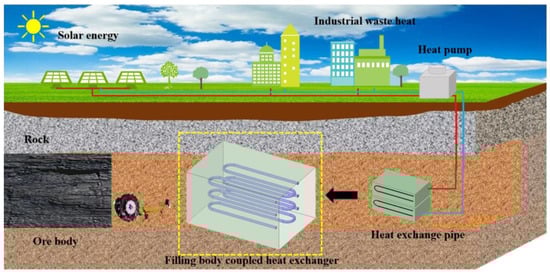
Figure 1.
Principal diagram of accumulation and utilization of solar energy using filling body coupled with heat exchanger in mine [17].
As illustrated in Figure 1, a filling body coupled with a heat exchanger is constructed. Heat preservation materials and heat exchange pipes are arranged in advance within the goaf to facilitate effective heat management of the heat exchange unit during subsequent operational phases. The filling slurry is then transported to the goaf through a pipeline, where it solidifies to form a composite phase change filling body. Both solar energy and industrial waste heat can be stored within the composite phase change filling body to achieve seasonal heat accumulation. In winter, the stored heat is extracted for applications like domestic hot water and heating, thereby enabling functional utilization of underground space and seasonal accumulation of solar energy.
2. Experimental Apparatus
2.1. Experimental System and Heat Transfer Units
Figure 2 shows the experimental principal diagram of heat accumulation and discharge of the filling body with CPCM. The experimental system is mainly composed of three parts: the water system, the filling body coupled with a heat exchanger, and the data acquisition system. The water system is composed of an air-cooling chiller, a constant temperature box, and a peristaltic pump, which can provide the hot and cold fluid for the heat accumulation and discharge of the filling body and realize the control and adjustment of the temperature and the velocity of the heat transfer medium. The PXI temperature measurement system of National Instruments (NI), which possesses the advantages of high precision, high reliability, and stability, is selected as the data acquisition system. LabVIEW software is widely used in many fields for its powerful data processing and analysis capabilities, its good stability, and its compatibility, and it is used here for data collection and preservation [17,18,26,27].
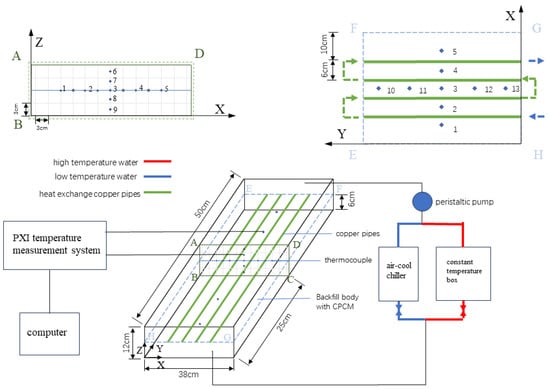
Figure 2.
The experimental schematic diagram of heat accumulation and discharge of the filling body [17].
In the experimental box (L × W × H = 500 × 380 × 120 mm), the thermocouple (the arrangement of measuring points is shown in Figure 2) and the heat transfer copper pipes (the inner diameter is 4 mm, the wall thickness is 1 mm, and the length is 60 cm) were both pre-arranged. A filling slurry with a cement–sand ratio of 1:4 and a slurry concentration of 72% was prepared by using tailings from a gold mine in Shaanxi, PO.42.5 cement, water, and CPCM (PA/EG, paraffin/expanded graphite, instead of a tailings mass fraction of 10%). The filling slurry was poured into the experimental box. After 28 days of standing in the curing room, the slurry was solidified into a filling body with certain strength. The experimental box was removed, and the heating plate was pasted around the filling body. Then, the 20 mm thick B1 grade insulation material was pasted to reduce the interference of the external environment in the heat transfer process [17,18,26].
2.2. Experimental Steps and Parameter Testing
The experimental platform built in this study is shown in Figure 3. The experimental condition is displayed in Table 1. Synthetically considering the temperatures of solar hot water, tap water, and the ground temperatures at various depths, the operating temperature parameters in Table 1 are selected. This careful selection of temperature parameters can ensure that the operating conditions of the system are closer to those in actual engineering. During the experiment, the beginning temperature of the filling body was controlled through temperature control and the heating plate. When the beginning temperature of the filling body and the temperature of the heat transfer medium reached the set experimental value, the peristaltic pump and the valve were opened to start the experiment. During the experiment, the temperature of each measuring point was recorded every 30 s, and the experimental time was 10 h. The experiment was divided into two stages. The first stage was the heat accumulation stage. The heat of high-temperature water was stored in the filling body through the heat exchanger. The second stage was the heat discharge stage. The low-temperature water extracted heat from the filling body through the heat exchanger. After the experiment, the heating plate was opened to restore the temperature of the filling body. The single factor analysis method was used to study the heat accumulation and discharge process of the filling body.

Figure 3.
Experimental platform.

Table 1.
Experimental conditions.
The main parameters measured in the experiment were the temperature of the filling body and the temperature and velocity of the heat transfer medium. The temperature of the filling body was measured using thermocouples arranged internally. One thermocouple was arranged at the inlet and outlet of the heat exchanger to detect the change in inlet and outlet temperature, which was convenient for calculating the heat transfer temperature difference. Another thermocouple was placed in the laboratory to detect the change in room temperature. The temperature was measured using a K-type thermocouple (±0.1 °C), and the data were collected using a PXI temperature measurement module. The velocity of the heat transfer medium was controlled by the speed of the BR8000Y35 (±0.5%) peristaltic pump.
2.3. Heat Accumulation and Discharge Capacity
The heat accumulation and discharge process of the filling body with CPCM is shown in Figure 4. In the first stage, the heat of high-temperature fluid is stored in the filling body through the heat exchanger, and and are calculated through (1) and (2), respectively [18]:
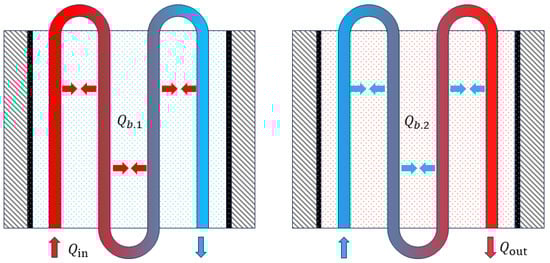
Figure 4.
Heat accumulation and discharge process of filling body [28].
In the second stage, the low-temperature fluid extracts heat from the filling body through the heat exchanger, and and are calculated through (3) and (4), respectively:
where is the specific heat capacity, is the density, is the velocity of the heat transfer medium, is the volume of the filling body, is the temperature (°C) of the filling body at one moment, and is the temperature (°C) of the filling body at the next moment. The subscripts and are the filling body and the heat transfer medium, and the subscripts 1 and 2 are the heat accumulation stage and the heat discharge stage, respectively.
2.4. Error Analysis
The uncertainties of the measured parameters are associated with the measurement devices and sensors, and the uncertainties of the calculated parameters are estimated by following the propagation of error suggested by Moffat [29].
The error transmission coefficient of heat transfer capacity is as follows:
The accuracy of the thermocouple is given as ±0.1 °C. The velocity of the heat transfer medium is given as ±0.5%. The beginning temperature is 45 °C, the velocity is 0.5 m/s, and the heat accumulation capacity of first hour is analyzed. This moment, , is 89.9 °C, is 87.2 °C, and the maximum relative error is calculated to be 5.26%.
3. Establishment and Verification of Model
The seasonal heat accumulation of the filling body with composite phase change material is a complex three-dimensional unsteady heat transfer process characterized by multiple modes of heat transfer and the coupling of several areas. To facilitate the solution of the model, the following assumptions are made:
- (1)
- The influence of thermal radiation and underground seepage on heat transfer is neglected;
- (2)
- The filling material and the phase change material are uniformly mixed and exhibit isotropic properties;
- (3)
- At the end of the heat accumulation and discharge process, the temperature of the filling body is evenly distributed;
- (4)
- The contact thermal resistance between the filling body and the heat transfer tube is neglected.
3.1. Mathematical Model
Considering the heat transfer process of the filling body coupled with the heat exchanger, the mathematical model is divided into the following three areas [18]:
- (1)
- Filling body area
The energy conservation equation of the filling body:
- (2)
- Surrounding rock area
- (3)
- Heat transfer medium area [30,31]
Continuity equation:
Momentum equation:
Energy equation:
Equation of turbulent kinetic energy:
3.2. Definition of Boundary Conditions
This study involves two types of boundary conditions in the modeling process. The external boundary of the surrounding rock is defined as having a constant wall temperature, with the corresponding surrounding rock temperature specified. The front and back of the filling body are associated with the inlet and outlet of the heat exchanger, making it infeasible to model the surrounding rock at these locations. Given that the front and back of the filling body occupy a relatively small boundary area, they are defined as adiabatic boundaries. Furthermore, the model addresses the interfaces among three zones: the surrounding rock, the filling body, and the heat exchange fluid.
Initial conditions
where is the ground temperature corresponding to the depth of surrounding rock, and it is also the beginning temperature of the filling body and the surrounding rock, °C.
Boundary conditions of surrounding rock:
3.3. Model Reliability Verification
According to the experimental setup, a three-dimensional unsteady heat transfer model (as shown in Figure 5) has been established to analyze the active heat accumulation and discharge process of the filling body containing composite phase change materials. The thermophysical parameters of materials are shown in Table 2. The parameters come from the test results of our research, referring to the study [26]. The model consists of approximately 1,000,000 computational grids, with a time step for calculations set at 10 s. The finite volume method is employed, utilizing the SIMPLE algorithm for velocity and pressure coupling, while the energy equation is solved using a second-order upwind difference scheme. The temperature measurements taken from within the filling body serve as an index for comparison between the simulation results and the experimental data, thereby verifying the accuracy and validity of the numerical model for the filling body with composite phase change materials.
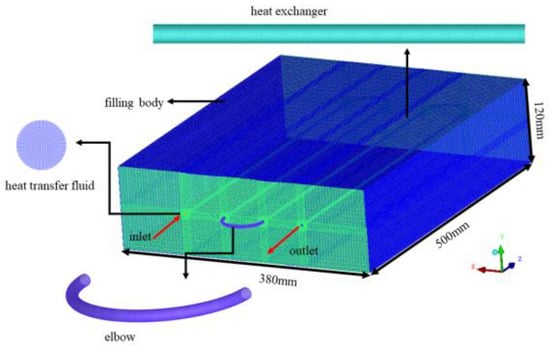
Figure 5.
Geometry model and grid division of filling body coupled with heat exchanger [26].
In this study, three measuring points (1, 3, and 6) inside of the filling body are selected to compare the experimental and simulated temperature values. As shown in Figure 6, the temperature changes at the experimentally measured points are consistently lower than those at the numerically simulated points, with the difference becoming more pronounced as proximity to the boundary increases. Analyzing the reasons for this discrepancy, it is evident that the beginning temperature of the filling body does not reach a uniform state at the beginning of the heat accumulation process; thus, higher temperatures are observed near the heat exchange pipeline and the boundary area of the heating plate. During the experiment, the experimental box remained stationary in the laboratory. Although insulation measures were implemented, some heat leakage still occurred. This heat loss was exacerbated by higher temperatures in the filling block, leading to increased error. After detailed evaluation, it was determined that the temperature measurement at the points exhibits a maximum deviation of 16.7%, a minimum deviation of 1.2%, and an average deviation of 6.7%. Generally, the deviation between the numerical simulation results and the experimental results is considered acceptable within 20%. The deviation falls within an acceptable error range, thus verifying the accuracy and validity of the simulation.
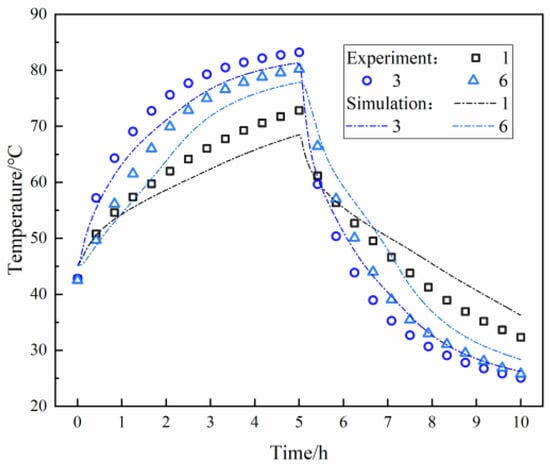
Figure 6.
Comparison of experimental and simulation results.
Table 2.
Thermophysical parameters of materials [32].
Table 2.
Thermophysical parameters of materials [32].
| Materials | Density | Specific Heat Capacity (J/(g·°C)) | Heat Conductivity (W/(m·°C)) |
|---|---|---|---|
| Tailings | 3500 | 1.09 | 3.20 |
| Water | 998 | 4.186 | 0.59 |
| P.O 42.5 | 2800 | 8.4 | 0.6 |
| Paraffin | — | Figure 7 | 0.28 |
| CPCM | — | Figure 7 | — |
| Filling body (0%) | 1656 | Figure 7 | 0.6959 |
| Filling body (10%) | 1474 | Figure 7 | 0.833 |
| Filling body (20%) | 1361 | Figure 7 | 0.8978 |
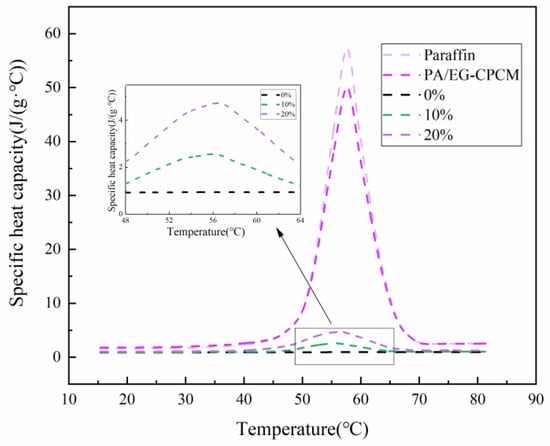
Figure 7.
The specific heat capacity of materials with temperature [28].
4. Experimental Results and Analysis
The investigation focused on evaluating the influence of key parameters, including the velocity of the heat transfer medium, the beginning temperature of the filling body, the heat accumulation and the discharge temperature, and the heat accumulation and the discharge time ratio on the temperature distribution as well as the heat accumulation and discharge performance of the filling body. This analysis offers a comprehensive understanding of the heat behavior and efficiency of a filling body coupled with a heat exchanger under varying operational conditions.
4.1. Temperature Change of Measuring Points
Under the default experimental conditions, the temperature changes of measuring points at different positions in the filling body with 10% CPCM were analyzed. Figure 8 shows the change of temperature of each measuring point with the heat accumulation and discharge time. Due to the symmetrical arrangement of thermocouples in the filling body, the temperature change trend of corresponding measuring points during the heat accumulation and discharge process is similar. Therefore, the measuring points 1, 2, 3, 6, 7, 10, 11, 12, and 13 are described in the subsequent analysis.
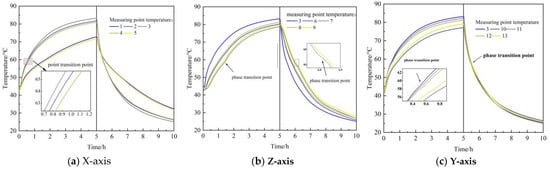
Figure 8.
Temperature change of measuring points in filling body.
At the end of heat accumulation (5 h), the temperature of measuring points 1, 2, and 3 in the x-axis direction increases to 72.85 °C, 81.69 °C, and 83.22 °C, respectively. The temperature of measuring points 3, 7, and 6 in the Z-axis direction increases to 83.22 °C, 80.21 °C, and 78.75 °C, respectively. The analysis shows that the heat source is the heat exchanger; measuring points 2 and 3 are located between the heat exchanger, while measuring point 1 is at the edge of the filling body, so the temperature of measuring point 1 is lower. The temperature of measuring points 3, 7, and 6 decreases with the rise of the distance from the heat exchanger.
At the end of heat discharge (10 h), the temperature of measuring points 1, 2, and 3 in the x-axis direction decreases to 32.34 °C, 26.16 °C, and 25.09 °C, and the decrement is 40.51 °C, 55.53 °C, and 58.13 °C, respectively. The temperature of measuring points 3, 7, and 6 in the Z-axis direction decreases to 25.09 °C, 25.78 °C, and 26.83 °C, and the decrement is 58.13 °C, 54.43 °C, and 51.92 °C, respectively. The heat discharge temperature drops with the rise of the distance from the heat exchanger.
The measuring points 3, 10, 11, 12, and 13 in the Y-axis direction are all located on the center line in the Y-axis direction and between the heat exchanger, so the temperature change trend is the same. In the heat accumulation stage, the closer it is to the two ends of the Y-axis, the lower the temperature, which is caused by heat leakage. The temperature difference among them is small during the heat discharge process.
4.2. Influence of Fluid Velocity on Heat Transfer
Figure 9 shows the influence of heat transfer medium velocity on the temperature distribution in the filling body. Taking the example of central point 3, when the velocity is 0.3 m/s, 0.5 m/s, and 0.7 m/s, the temperature rise is 32.3 °C, 32.6 °C, and 35.1 °C within 0–2.5 h and 5.0 °C, 5.6 °C, and 4.2 °C within 2.5–5 h, and the total temperature rise is 37.3 °C, 38.2 °C, and 39.3 °C in the heat accumulation stage. The temperature drop is 48.4 °C, 50.4 °C, and 50.9 °C within 5–7.5 h and 8.1 °C, 7.7 °C, and 8.3 °C within 7.5–10 h, and the total temperature drop is 56.5 °C, 58.1 °C, and 59.2 °C in the heat discharge stage. The total temperature change during heat transfer process rises with the rise of velocity, but the velocity has little effect on the temperature of the filling body. When the velocity is 0.5 m/s, the temperature of measuring points 3, 7, 6, and 1 rises to 77.6 °C, 73.8 °C, 71.0 °C, and 64.1 °C within 0–2.5 h, and it rises to 83.2 °C, 81.2 °C, 79.7 °C, and 72.8 °C within 2.5–5 h in the heat accumulation stage. The temperature increment of the measuring points decreases with the rise of its distance from the heat exchanger. During the whole heat accumulation period, the temperature rise of measuring points 3, 7, 6, and 1 accounts for 85.4%, 79.5%, 75%, and 68.6% within 0–2.5 h, respectively. The proportion of temperature rise within 0–2.5 h to the total temperature rise decreases with the rise of the distance between the measuring point and the heat exchanger, which also means that the thermal resistance will affect the heat transfer process.
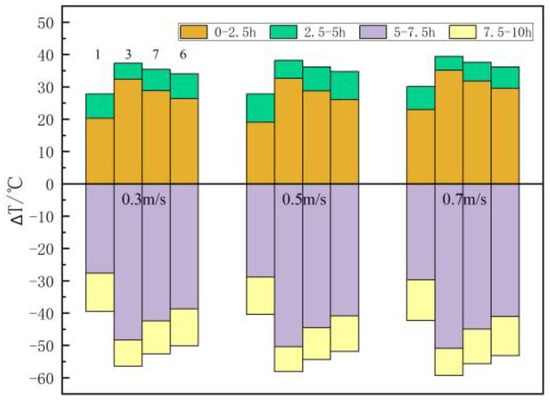
Figure 9.
The influence of heat transfer medium velocity on the temperature of measuring points.
Figure 10 shows the influence of heat transfer medium velocity on the outlet temperature. The outlet temperature greatly changes in the initial stage and gradually tends to be stable with the heat transfer time. In the heat accumulation stage, the outlet temperature rises with the rise of velocity. In the heat discharge stage, the outlet temperature decreases with the rise of velocity. The outlet temperature is 23.29 °C, 21.94 °C, and 21.33 °C at 6 h, it is 21.62 °C, 20.64 °C, and 20.45 °C at 8 h, and it is 20.9 °C, 20.6 °C, and 20.5 °C at 10 h when the velocity is 0.3 m/s, 0.5 m/s, and 0.7 m/s. The outlet temperature decreases by 1.96 °C, 1.17 °C, and 0.4 °C at 6, 8, and 10 h when the velocity rises from 0.3 m/s to 0.7 m/s. The difference in the outlet temperature caused by the change of velocity gradually decreases with the heat transfer process.
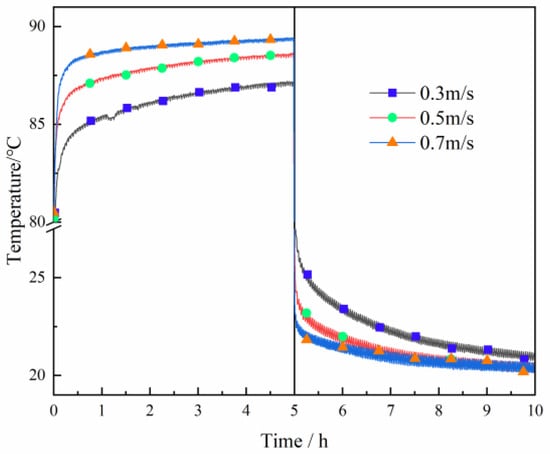
Figure 10.
The change of outlet temperature with different heat transfer medium velocities.
4.3. Influence of the Beginning Temperature of the Filling Body on Heat Transfer
Figure 11 shows the influence of the beginning temperature of the filling body on the temperature distribution in the filling body. The higher the beginning temperature, the smaller the temperature rise in the heat accumulation stage. Taking the example of central point 3, when the beginning temperature is 25 °C, 35 °C, 45 °C, and 55 °C, the temperature rise is 45.4 °C, 38.2 °C, 31 °C, and 25.5 °C within 0–2.5 h and it is 9.2 °C, 7.3 °C, 5.4 °C, and 3.5 °C within 2.5–5 h, and the total temperature rise is 54.6 °C, 45.5 °C, 36.4 °C, and 29 °C, respectively, in the heat accumulation stage. The data show that the total temperature rise decreases by an average of 8.5 °C for every 10 °C rise in the beginning temperature. The temperature drop is 48.4 °C, 47.1 °C, 45.8 °C, and 49.7 °C within 5–7.5 h and 6.8 °C, 7.9 °C, 9.1 °C, and 8.4 °C within 7.5–10 h, and the total temperature drop is 57.2 °C, 55 °C, 54.9 °C, and 58.1 °C, respectively, in the heat discharge stage. The data show that the difference in temperature rise is larger within 0–5 h, and the difference in temperature drop is smaller within 5–10 h under the influence of the beginning temperature of the filling body. The analysis shows that the beginning temperature difference causes a large difference in temperature rise within 0–5 h; while the 0–5 h heat accumulation stage weakens the influence of the beginning temperature on heat discharge, the temperature drop difference in the 5–10 h heat discharge stage is small. It is thus clear that the beginning temperature of the filling body has a great influence on the heat accumulation process, but it has little effect on the heat discharge process.
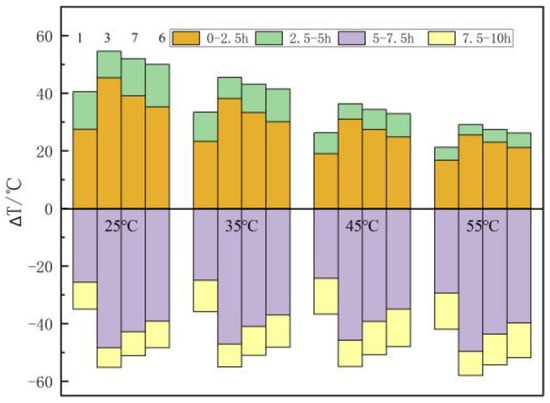
Figure 11.
The influence of the beginning temperature of the filling body on the temperature of the measuring points.
Figure 12 shows the influence of the beginning temperature of the filling body on heat accumulation and discharge capacities. The heat accumulation capacity decreases and the heat discharge capacity rises with the rise of the beginning temperature. When the beginning temperature is 25 °C, 35 °C, 45 °C, and 55 °C, the heat accumulation capacity is 1951 kJ, 1738 kJ, 1401 kJ, and 808 kJ, and the heat discharge capacity is 1766 kJ, 1838 kJ, 1917 kJ, and 1977 kJ, respectively. The heat accumulation capacity rises by 141%, and the heat discharge capacity decreases by 10.6% when the beginning temperature of the filling body decreases from 55 °C to 25 °C. It is thus clear that the beginning temperature of the filling body has a greater impact on the heat accumulation capacity and a smaller impact on the heat discharge capacity. The analysis shows that at a certain heat accumulation temperature, the decrease of the beginning temperature of the filling body can raise the heat transfer temperature difference between the high-temperature fluid and the filling body so as to raise the heat accumulation capacity; moreover, the decrease of the beginning temperature of the filling body makes it easier for the phase change material to span the whole phase change period, making full use of the latent heat of the phase change, thus leading to a substantial rise in heat accumulation capacity. The rise of heat accumulation capacity means the rise of heat accumulation density under a certain volume of the filling body. However, in the process of heat discharge, because there is always a region outside of the action range of the heat transfer medium in the filling body, the heat in this region is difficult to extract and utilize within a limited heat discharge time. The greater the heat accumulation density, the more difficult it is to extract heat; that is, with the decrease of the beginning temperature of the filling body, the heat discharge capacity decreases.
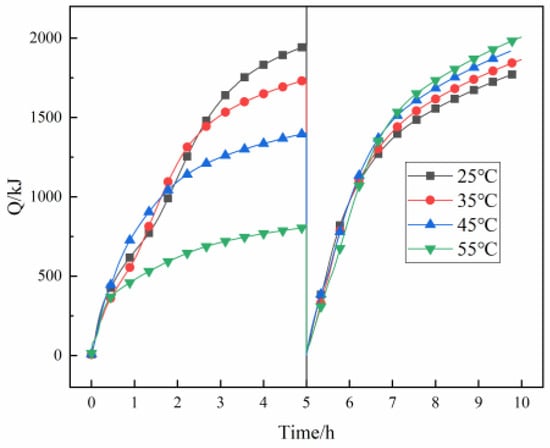
Figure 12.
The change in heat accumulation and discharge capacities with the beginning temperature of the filling body.
From Figure 12, it can also be seen that the heat accumulation capacity curves of different beginning temperatures of the filling body intersect in the heat accumulation stage. The analysis shows that the phase change temperature range of CPCM is 55–60 °C. The phase change stage is 0–1 h, and the heat accumulation rate is large when the beginning temperature is 55 °C. The heat accumulation rate decreases rapidly when the phase change process is over. When the beginning temperature is 45 °C, 0–1 h is the sensible heat transfer stage, and 1–2 h is the phase change heat transfer stage, which always maintains a high heat accumulation rate. When the beginning temperature is 35 °C and 25 °C, in the early stage, the sensible heat transfer stage takes a long time. In the phase change stage, the heat accumulation rate is high, and the heat accumulation capacity curve finally intersects. At the same time, it also shows that the appropriate beginning temperature should be selected to make the temperature of the filling body higher than the phase change temperature during heat accumulation so that the PCM can make full use of its latent heat accumulation capacity.
4.4. Influence of Heat Accumulation and Discharge Temperatures on Heat Transfer
Figure 13 shows the influence of heat accumulation and discharge temperatures on the temperature distribution in the filling body. The rise of heat accumulation temperature enhances the temperature change of the filling body during the heat transfer process, and the decrease of heat discharge temperature enhances the temperature drop during the heat discharge process. Taking the example of central point 3, when the heat discharge temperature is 20 °C and the heat accumulation temperature is 70 °C, 80 °C, and 90 °C, the temperature rise is 18.1 °C, 25.5 °C, and 31 °C within 0–2.5 h and 3.3 °C, 4.3 °C, and 5.4 °C within 2.5–5 h, and the total temperature rise is 21.4 °C, 29.8 °C, and 36.4 °C, respectively, in the heat accumulation stage. The temperature drop is 35.7 °C, 42.7 °C, and 45.8 °C within 5–7.5 h and 6.3 °C, 7.3 °C, and 9.1 °C within 7.5–10 h, and the total temperature drop is 42 °C, 50 °C, and 54.9 °C, respectively, in the heat discharge stage. For every 10 °C rise in the heat accumulation temperature, the total temperature rise increases by an average of 7.5 °C during the heat accumulation process, and the total temperature drop increases by an average of 6.45 °C during the heat discharge process. When the heat accumulation temperature is 90 °C and the heat discharge temperature is 20 °C, 15 °C, and 10 °C, the temperature drop is 45.8 °C, 52.2 °C, and 55 °C within 5–7.5 h and 9.1 °C, 9.3 °C, and 10 °C within 7.5–10 h, and the total temperature drop is 54.9 °C, 61.5 °C, and 65 °C, respectively, in the heat discharge stage. For every 5 °C decrease in the heat discharge temperature, the total temperature drop increases by an average of 5.05 °C. The change of heat accumulation temperature will affect the temperature of the filling body during the whole heat transfer process, thus affecting the heat accumulation and discharge performance, while the change of heat discharge temperature only affects the heat discharge performance.
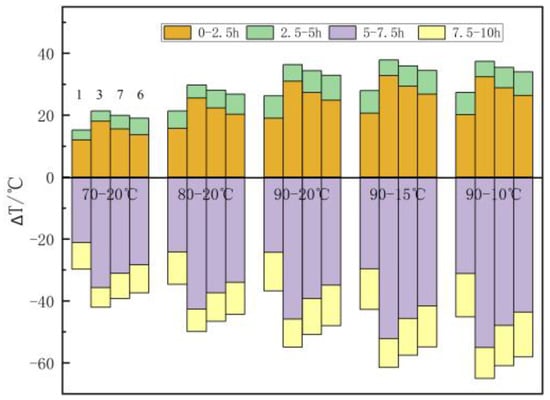
Figure 13.
The influence of heat accumulation and discharge temperatures on the temperature of the measuring points.
Figure 14 shows the influence of heat accumulation and discharge temperatures on the heat accumulation and discharge capacities. When the heat discharge temperature is 20 °C and the heat accumulation temperature is 70 °C, 80 °C, and 90 °C, the heat accumulation capacity is 832 kJ, 1193 kJ, and 1401 kJ and the heat discharge capacity is 1409 kJ, 1742 kJ, and 1774 kJ, respectively. The heat accumulation capacity increases with the rise of heat accumulation temperature, and the heat discharge capacity has a large increase when the heat accumulation temperature is changed from 70 °C to 80 °C. The analysis shows that the temperature of the filling body is difficult to bring higher than the phase change temperature to fully store the latent heat when the heat accumulation temperature is 70 °C. This leads to a small heat transfer rate and low heat transfer capacity. When the heat accumulation temperature is 90 °C and the heat discharge temperature is 20 °C, 15 °C, and 10 °C, the heat accumulation capacity is about 1400 kJ, and the heat discharge capacity is 1774 kJ, 2075 kJ, and 2168 k, respectively. The heat discharge capacity increases with the decrease in heat discharge temperature. The heat discharge capacity increases by 301 kJ and 93 kJ when the heat discharge temperature decreases from 20 °C to 15 °C and from 15 °C to 10 °C. The difference in heat discharge capacity is small when the heat discharge temperature is changed from 15 °C to 10 °C. The analysis shows that the heat discharge of the filling body is not sufficient when the heat discharge temperature is 20 °C. When the heat discharge temperature further decreases, the heat discharge is more sufficient, the heat discharge capacity increases, and the heat discharge increment decreases.
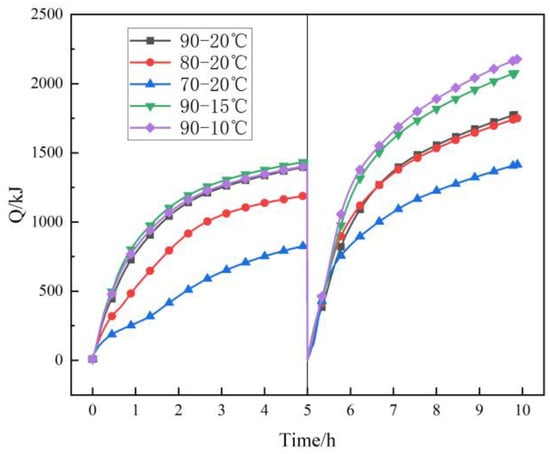
Figure 14.
The change of heat accumulation and discharge capacities with heat accumulation and discharge temperatures.
4.5. Influence of Heat Accumulation and Discharge Time Ratio on Heat Transfer
Figure 15 shows the influence of heat accumulation and the discharge time ratio on the temperature distribution of the filling body (the total time is 10 h, 600 min). The temperature rise of heat accumulation increases with the rise of heat accumulation time. Taking the example of central point 3, when the heat accumulation and discharge time ratio is 1:2, 2:3, 1:1, 3:2, and 2:1, the temperature rise is 32.28 °C, 34.46 °C, 36.96 °C, 38.03 °C, and 39.26 °C, respectively, at the end of heat accumulation (200 min, 240 min, 300 min, 360 min, and 400 min). The temperature of the measuring point increases from 45 °C to 77.28 °C, and the temperature rise is 32.28 °C when the heat accumulation time is 200 min. The temperature of the measuring point increases from 77.28 °C to 84.26 °C when the heat accumulation time is from 200 min to 400 min, and the temperature rise is only 6.98 °C in the latter 200 min, the temperature rise of the first 200 min accounted for 82.2% of the total temperature rise. At the end of heat discharge (400 min, 360 min, 300 min, 240 min, and 200 min), the temperature drop is 54.86 °C, 55.88 °C, 56.89 °C, 54.86 °C, and 53.5 °C, respectively. For different heat accumulation and discharge time ratios, the difference in temperature drop is small, which is caused by the heat transfer temperature difference at the beginning of heat discharge and the heat discharge time.
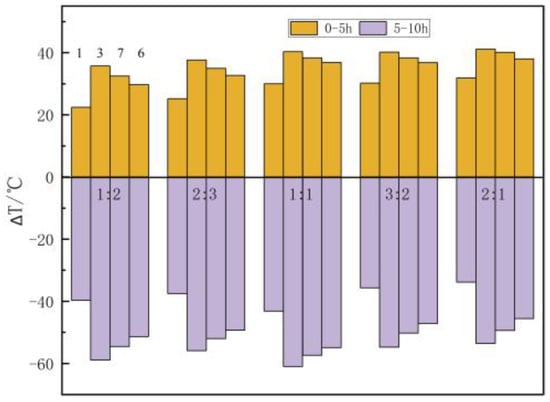
Figure 15.
The influence of heat accumulation and discharge time ratio on the temperature of measuring points.
Figure 16 shows the influence of heat accumulation and the discharge time ratio on heat accumulation and discharge capacities. The heat accumulation capacity increases with the rise of heat accumulation and the discharge time ratio. When the heat accumulation and discharge time ratio is 1:2, 2:3, 1:1, 3:2, and 2:1, the heat accumulation capacity is 1471 kJ, 1530 kJ, 1580 kJ, 1650 kJ, and 1765 kJ, and the heat discharge capacity is 2079 kJ, 1954 kJ, 1978 kJ, 2052 kJ, and 1956 kJ, respectively. The heat accumulation capacity of the first 200 min (the heat accumulation and discharge time ratio is 1:2) accounts for 83.3% of the heat accumulation capacity of the 400 min (the heat accumulation and discharge time ratio is 2:1). It is clear that the heat accumulation capacity can reach more than 80% at half of the heat accumulation time. The analysis shows that in the initial stage of heat accumulation, the temperature difference between the heat transfer medium and the filling body is great, resulting in a significant increase in heat accumulation capacity. However, the increased rate gradually diminishes as the heat accumulation process proceeds. Therefore, it is very important to select the appropriate heat accumulation time and to try to keep the heat accumulation time within the stage where the heat accumulation capacity increases significantly.
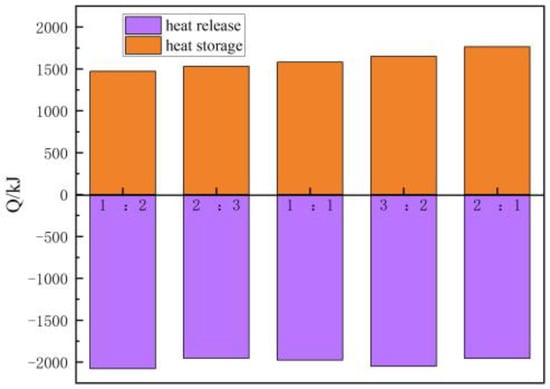
Figure 16.
The change in heat accumulation and discharge capacities with heat accumulation and discharge time ratio.
5. Simulation Results and Analysis
In this study, the influence of the additional proportion of CPCM on the heat transfer performance of the filling body coupled with a heat exchanger was studied through numerical simulation. Figure 17 shows the variation in the average temperature of the filling body with time under different additional proportions of CPCM. The figure shows that the average temperature of the filling body obviously decreases with the rise of the additional proportion of CPCM in the heat accumulation stage. When the additional proportion of CPCM is 0%, 10%, and 20%, the average temperature of the filling body is 73 °C, 71.5 °C, and 67.8 °C, respectively, at the end of heat accumulation. The analysis shows that the temperature of the filling body continues to rise in the heat accumulation stage, the CPCM begins to melt, and the heat is stored in the form of latent heat when the temperature rises to the liquid phase point of CPCM. The greater the additional proportion of CPCM, the greater the latent heat accumulation capacity, and the lower the temperature of the filling body. As the heat discharge process continues, the average temperature of the filling body significantly decreases, and the greater the additional proportion of CPCM, the smaller the temperature drop of the filling body in the heat discharge stage. When the additional proportion of CPCM is 0%, 10%, and 20%, the temperature drop of the filling body is 41.7 °C, 38.7 °C, and 31.4 °C, respectively, in the heat discharge stage. The analysis shows that the temperature of the filling body continues to decrease in the heat discharge stage. When the temperature decreases to the solid phase point of CPCM, the CPCM begins to solidify, and the latent heat is discharged, the temperature drop of the filling body becomes slow. The greater the additional proportion of CPCM, the greater the latent heat discharged, and the slower the temperature drop of the filling body, the smaller the temperature drop.
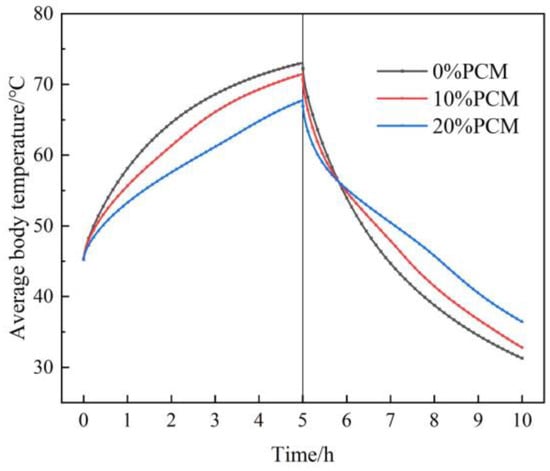
Figure 17.
The variation in average temperature of the filling body under different additional proportions of CPCM.
Figure 18 shows the variation in the liquid phase fraction with time under different additional proportions of CPCM. The figure shows that the liquid phase fraction obviously increases with the heat accumulation time and decreases with the heat discharge time. In the heat accumulation stage, the greater the additional proportion of CPCM, the lower the liquid phase fraction at the same heat accumulation time, and the longer it takes for the phase change material to completely melt. In the heat discharge stage, the greater the additional proportion of CPCM, the longer it takes for the phase change material to completely solidify. When the additional proportion of CPCM is 10% and 20%, the time for phase change materials to completely melt is 2.7 h and 4.0 h, respectively, in the heat accumulation stage, and the time to completely solidify is 7.4 h and 8.2 h, respectively, in the heat discharge stage.
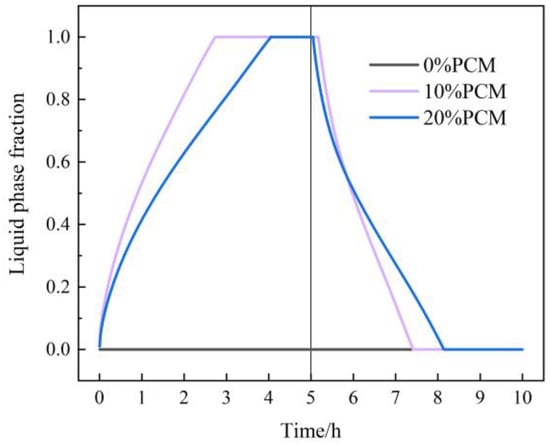
Figure 18.
The variation in liquid phase fraction under different additional proportions of CPCM.
Figure 19 shows the variation in heat transfer capacity with time under different additional proportions of CPCM. The figure shows that the heat transfer capacity significantly increases with the rise of additional proportions of CPCM. When the additional proportion of CPCM is 0%, 10%, and 20%, the heat accumulation capacity is 934 kJ, 1342 kJ, and 1809 kJ, and the heat discharge capacity is 1247 kJ, 1576 kJ, and 1933 kJ, respectively. The filling body with an additional 20% CPCM stores 93.7% and discharges 55% more heat than the conventional filling body. The analysis shows that the greater the additional proportion of CPCM, the more heat is needed to complete the phase change; that is, the more heat is stored or discharged in the form of latent heat, and the latent heat slows down the decrease of the heat transfer temperature difference and the heat transfer rate, which is more conducive to heat transfer. Moreover, the filling body with CPCM not only improves the thermal conductivity but also greatly improves the heat transfer capacity and ultimately improves the performance of the heat exchanger system, reflecting significant advantages in energy efficiency, economic benefits, and environmental sustainability.
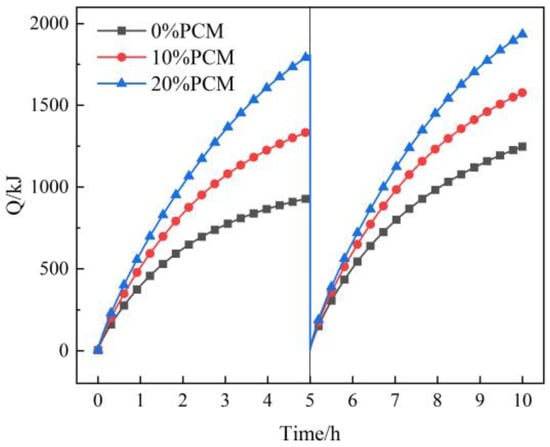
Figure 19.
The variation in heat transfer capacity under different additional proportions of CPCM.
6. Conclusions
Current research on the heat accumulation of the filling body is often limited to geothermal energy, and research on the application of the filling body to store solar energy is lacking. In this paper, based on the seasonal accumulation of solar energy using underground space, the experimental apparatus of the filling body coupled with a heat exchanger was built, and a three-dimensional unsteady heat transfer model was established to investigate the heat accumulation and discharge process of a filling body with CPCM. The effects of the velocity of the heat transfer medium, the beginning temperature of the filling body, the heat accumulation and the discharge temperature, the heat accumulation and the discharge time ratio, and the additional proportion of CPCM on heat transfer performance were analyzed. The main conclusions are as follows.
The heat accumulation capacity increases by 141% and the heat discharge capacity decreases by 10.6% when the beginning temperature of the filling body decreases from 55 °C to 25 °C. The appropriate beginning temperature should be selected to make the temperature of the filling body higher than the phase change temperature during heat accumulation so that the PCM can make full use of its latent heat accumulation capacity.
When the heat discharge temperature is 20 °C and the heat accumulation temperature is 70 °C, 80 °C, and 90 °C, the increment of heat accumulation capacity is 361 kJ and 208 kJ and the increment of heat discharge capacity is 333 kJ and 32 kJ, successively. The heat accumulation capacity increases with the rise of heat accumulation temperature, and the heat discharge capacity has a large increase when the heat accumulation temperature is changed from 70 °C to 80 °C. Under the condition of heat accumulation temperature of 90 °C, the increment of heat discharge capacity is 301 kJ and 93 kJ, successively, when the heat discharge temperature decreases from 20 °C to 15 °C and from 15 °C to 10 °C.
The heat accumulation capacity increases with the rise of heat accumulation and the discharge time ratio. The heat accumulation capacity of the first 200 min accounts for 83.3% of the heat accumulation capacity of the 400 min. It is clear that the heat accumulation capacity can reach more than 80% at the half of heat accumulation time. Therefore, it is very important to select the appropriate heat accumulation time and to try to keep the heat accumulation time within the stage where the heat accumulation capacity increases significantly.
The heat transfer capacity significantly increases with the rise of the additional proportion of CPCM. When the additional proportion of CPCM is 0%, 10%, and 20%, the heat accumulation capacity is 934 kJ, 1342 kJ, and 1809 kJ, and the heat discharge capacity is 1247 kJ, 1576 kJ, and 1933 kJ, respectively. The filling body with 20% additional CPCM stores 93.7% more heat and discharges 55% more heat than the conventional filling body. The addition of 20% CPCM as filling body enhanced the heat storage capacity by 93.7% and the heat discharges by 55% relative to conventional filling body. In other words, the filling body with CPCM can improve the performance of the heat exchanger system.
In engineering applications, the heat transfer of the filling body coupled with the heat exchanger occurs in an underground, high-temperature, thermal environment. However, due to the limitations of experimental conditions, it is challenging to fully replicate the actual working conditions in underground space, and heat loss is inevitable. Furthermore, there will be cracks and groundwater seepage in the actual filling body. So, the influence of cracks and seepage on heat transfer can be considered, and heat loss during heat transfer can be further studied in the future. Although this study has some shortcomings, it can still provide references for subsequent research and point out the direction for further efforts.
Author Contributions
Conceptualization, Q.L.; data curation, X.Z.; formal analysis, X.W. and Q.L.; investigation, J.S.; methodology, Q.L.; resources, X.Z.; supervision, X.Z.; validation, X.W.; writing—original draft, X.W. and Q.L.; writing—review and editing, X.Z., J.S. and H.Y. All authors have read and agreed to the published version of the manuscript.
Funding
This research was funded by the National Natural Science Foundation of China (Nos. 51974225, 52274063, 52004207, 52104148), Shaanxi Provincial Department of Science and Technology (2022JM-173), and Shaanxi Provincial Department of Education (No. 21JP077).
Institutional Review Board Statement
Not applicable.
Informed Consent Statement
Not applicable.
Data Availability Statement
Data are contained within the article.
Conflicts of Interest
Author Qingjiang Liu was employed by the company SiACT Power Co., Ltd. The remaining authors declare that the research was conducted in the absence of any commercial or financial relationships that could be construed as a potential conflict of interest.
References
- Khatri, R.; Goyal, R.; Sharma, R.K. Advances in the developments of solar cooker for sustainable development: A comprehensive review. Renew. Sustain. Energy Rev. 2021, 145, 111166. [Google Scholar] [CrossRef]
- Alva, G.; Liu, L.; Huang, X.; Fang, G. Thermal energy storage materials and systems for solar energy applications. Renew. Sustain. Energy Rev. 2017, 68, 693–706. [Google Scholar] [CrossRef]
- Li, B.; Zhang, J.; Ghoreishi-Madiseh, S.A.; de Brito, M.A.R.; Deng, X.; Kuyuk, A.F. Energy performance of seasonal thermal energy storage in underground backfilled stopes of coal mines. J. Clean. Prod. 2020, 275, 122647. [Google Scholar] [CrossRef]
- Aktaş, A.; Kirçiçek, Y. (Eds.) Chapter 6—Solar Thermal Systems and Thermal Storage. In Solar Hybrid Systems; Academic Press: Cambridge, MA, USA, 2021; pp. 127–137. [Google Scholar]
- Zhang, H.; Hou, H.J. Simulation and Analysis of Performance of Seasonal Borehole Thermal Energy Storage. J. Eng. Thermophys. 2022, 43, 1148–1154. [Google Scholar]
- Shen, H.; Cao, Z.; Klemes, J.J. Numerical Study on Heat Transfer and Performance of Seasonal Borehole Thermal Energy Storage. Heat Transf. Eng. 2023, 44, 2027–2039. [Google Scholar] [CrossRef]
- Catolico, N.; Ge, S.; McCartney, J.S. Numerical Modeling of a Soil-Borehole Thermal Energy Storage System. Vadose Zone J. 2016, 15, 1–17. [Google Scholar] [CrossRef]
- Mesquita, L.; McClenahan, D.; Thornton, J.; Carriere, J.; Wong, B. Drake Landing Solar Community: 10 Years of Operation. In Proceedings of SWC2017/SHC2017; International Solar Energy Society: Abu Dhabi, United Arab Emirates, 2017; pp. 1–12. [Google Scholar] [CrossRef]
- Elhashmi, R.; Hallinan, K.P.; Chiasson, A.D. Low-energy opportunity for multi-family residences: A review and simulation-based study of a solar borehole thermal energy storage system. Energy 2020, 204, 117870. [Google Scholar] [CrossRef]
- Zhang, B.; Xue, P.; Liu, L.; Huan, C.; Wang, M.; Zhao, Y.; Qin, X.; Yang, Q. Exploration on the method of ore deposit geothermal energy synergetic mining in deep backfill mines. J. China Coal Soc. 2021, 46, 2824–2837. [Google Scholar]
- Ghoreishi-Madiseh, S.A.; Hassani, F.; Abbasy, F. Numerical and experimental study of geothermal heat extraction from backfilled mine stopes. Appl. Therm. Eng. 2015, 90, 1119–1130. [Google Scholar] [CrossRef]
- Xie, H.; Zhao, J.W.; Zhou, H.W. Secondary utilizations and perspectives of mined underground space. Tunn. Undergr. Space Technol. 2020, 96, 103129. [Google Scholar] [CrossRef]
- Paksoy, H.Ö.; Beyhan, B. 22—Thermal energy storage (TES) systems for greenhouse technology. In Advances in Thermal Energy Storage Systems; Cabeza, L.F., Ed.; Woodhead Publishing: New Delhi, India, 2015; pp. 533–548. [Google Scholar] [CrossRef]
- Lang, L.; Jie, X.; Bo, Z.; Xiaoyan, Z.; Mei, W.; Huafu, Q.; Liu, C. Basic theories and applied exploration of functional backfill in mines. J. China Coal Soc. 2018, 43, 1811–1820. [Google Scholar] [CrossRef]
- Zhang, X.-Y.; Liu, L.; Liu, L.; Liu, L.; Jia, Y.-H. Numerical simulation of heat release performance of filling body under condition of heat extracted by fluid flowing in buried tube. J. Cent. South Univ. 2019, 26, 2160–2174. [Google Scholar] [CrossRef]
- Zhang, X.; Zhao, M.; Liu, L. Numerical simulation on heat storage performance of backfill body based on tube-in-tube heat exchanger. Constr. Build. Mater. 2020, 265, 120340. [Google Scholar] [CrossRef]
- Zhao, Y.; Liu, L.; Wen, D. Experimental study of horizontal ground heat exchangers embedded in the backfilled mine stopes. Geothermics 2022, 100, 102344. [Google Scholar] [CrossRef]
- Zhao, Y.; Liu, L.; Wen, D. Recycling waste material for backfill coupled heat exchanger systems in underground stopes of mines. Energy Build. 2022, 256, 111703. [Google Scholar] [CrossRef]
- Zhang, X.; Xu, M.; Liu, L. Experimental study on thermal and mechanical properties of cemented paste backfill with phase change material. J. Mater. Res. Technol. 2020, 9, 2164–2175. [Google Scholar] [CrossRef]
- Zhang, X.; Cao, T.; Liu, L. Experimental study on thermal and mechanical properties of tailings-based cemented paste backfill with CaCl2·6H2O/expanded vermiculite shape stabilized phase change materials. Int. J. Miner. Metall. Mater. 2023, 30, 250–259. [Google Scholar] [CrossRef]
- Liu, Y.; Min, L.; Zhang, S. Study on the thermal-mechanical properties and heat transfer characteristics of low leakage heat storage functional backfill body. J. Energy Storage 2024, 94, 112257. [Google Scholar] [CrossRef]
- Kazazo, O.; Abu-Nada, E. Thermal performance of nano-architected phase change energetic materials for a next-generation solar harvesting system. Energy Convers. Manag. 2025, 327, 119541. [Google Scholar] [CrossRef]
- Afaynou, I.; Faraji, H.; Choukairy, K. Heat transfer enhancement of phase-change materials (PCMs) based thermal management systems for electronic components: A review of recent advances. Int. Commun. Heat Mass Transf. 2023, 143, 106690. [Google Scholar] [CrossRef]
- Zhao, Y.; Lu, X.; Liu, L. Evaluation of thermal efficiency of solar-assisted backfill coupled heat exchanger with seasonal heat storage system. J. Energy Storage 2025, 114, 115809. [Google Scholar] [CrossRef]
- Zhang, J.; Zhang, N.; Zhang, Z. Numerical study of the heat transfer of a solar air collector integrated phase change material with supercooling. J. Energy Storage 2025, 117, 116158. [Google Scholar] [CrossRef]
- Zhang, X.; Wen, D.; Zhao, Y. Thermal-mechanical properties heat transfer process of heat storage/energy storage backfill body in mine. J. China Coal Soc. 2021, 46, 3158–3171. [Google Scholar]
- Wang, M.; Kong, D.; Liu, L. In Situ Conductive Heating for Thermal Desorption of Volatile Organic-Contaminated Soil Based on Solar Energy. Sustainability 2024, 16, 8565. [Google Scholar] [CrossRef]
- Liu, Q. Study on Thermal Behavior of Composite Phase Change Filling Body in Seasonal Heat Storage; Xi’an University of Science and Technology: Xi’an, China, 2024. [Google Scholar]
- Moffat, R.J. Describing the uncertainties in experimental results. Exp. Therm. Fluid Sci. 1988, 1, 3–17. [Google Scholar] [CrossRef]
- Pu, L.; Xu, L.; Qi, D. Structure optimization for horizontal ground heat exchanger. Appl. Therm. Eng. 2018, 136, 131–140. [Google Scholar] [CrossRef]
- Pu, L.; Xu, L.; Zhang, S. Optimization of ground heat exchanger using microencapsulated phase change material slurry based on tree-shaped structure. Appl. Energy 2019, 240, 860–869. [Google Scholar] [CrossRef]
- Du, Q. Thermal-Mechanical Properties of Phase Change Backfill Materials Containing Paraffin/Expanded Graphite; Xi’an University of Science and Technology: Xi’an, China, 2023. [Google Scholar]
Disclaimer/Publisher’s Note: The statements, opinions and data contained in all publications are solely those of the individual author(s) and contributor(s) and not of MDPI and/or the editor(s). MDPI and/or the editor(s) disclaim responsibility for any injury to people or property resulting from any ideas, methods, instructions or products referred to in the content. |
© 2025 by the authors. Licensee MDPI, Basel, Switzerland. This article is an open access article distributed under the terms and conditions of the Creative Commons Attribution (CC BY) license (https://creativecommons.org/licenses/by/4.0/).