Article

The Dynamics of Concrete Recycling in Circular Construction: A System-Dynamics Approach in Sydney, Australia

Institute of Transport and Logistics, The University of Sydney, Camperdown, NSW 2006, Australia
*
Author to whom correspondence should be addressed.
Sustainability 2025, 17(10), 4282; https://doi.org/10.3390/su17104282
Submission received: 1 April 2025 / Revised: 27 April 2025 / Accepted: 29 April 2025 / Published: 8 May 2025

Abstract

:
Concrete demolition waste represents a critical bottleneck in achieving a circular economy for the construction sector. This study develops a system-dynamics model that couples material flows with economic and logistical feedback to quantify how cost structures affect concrete recycling in the Sydney (Australia) metropolitan area. The model is calibrated with (i) official New South Wales 2020–2021 construction-and-demolition waste statistics, (ii) concrete consumption data scaled from state infrastructure reports, and (iii) parameters elicited from structured interviews with recycling contractors and plant operators. Scenario analysis systematically varies recycling-plant fees, landfill levies, and transport costs to trace their nonlinear impacts on three core performance metrics: recycling rate, cumulative landfill mass, and virgin gravel extraction. Results reveal distinct cost tipping points: a 10% rise in landfill-logistics costs or a 25% drop in recycling logistics costs shifts more than 95% of concrete waste into the recycling stream, cutting landfill volumes by up to 47% and reducing virgin aggregate demand by 5%. Conversely, easing landfill costs by 25% reverses these gains, driving landfill dependency above 99% and increasing gravel extraction by 39%. These findings demonstrate that carefully calibrated economic levers can override logistical inefficiencies and accelerate circular construction outcomes. The system-dynamics framework offers policymakers and industry stakeholders a decision-support tool for setting landfill levies, recycling subsidies, and infrastructure investments that jointly minimize waste and conserve natural resources.

1. Introduction

The world faces an urgent need to address escalating environmental degradation, resource depletion, and climate change. In response, the paradigm of a circular economy has emerged as a transformative approach to sustainable development, one that rethinks the entire life cycle of products and materials to decouple economic growth from the consumption of finite resources [1,2]. The circular economy emphasizes principles such as designing out waste, keeping materials in use for longer, and regenerating natural systems [3,4,5]. These concepts are increasingly being applied across various sectors, including the construction industry. However, progress toward circularity remains limited: as of 2022, only about 9% of all materials consumed globally are recycled or obtained from secondary sources [6]. The construction sector is a major driver of this resource challenge. It contributes roughly 13% of global GDP and employs about 7% of the world’s working population [7], yet it is notorious for its massive consumption of raw materials and energy. The building and construction industry alone uses an estimated 30–50% of all raw materials worldwide [8] and is responsible for around 37% of energy-related carbon emissions [9]. With the global middle class projected to grow by about 2 billion people in the next decade [10], construction activity and its environmental impacts are set to rise further. Applying circular economy principles in this industry offers a promising path to mitigate these impacts by reducing waste sent to landfills, lowering greenhouse gas emissions, conserving natural resources, and even creating new jobs [6,11,12].
An emerging paradigm in the sector is circular construction, which applies circular economy principles to building and infrastructure lifecycles. The goal of circular construction is to establish a closed-loop system in which building materials are designed for longevity and are continually reused or recycled instead of being disposed of [13]. Achieving this vision requires coordinated efforts across the construction supply chain, including changes in consumer behavior, the adoption of new waste processing and recycling technologies, and the increased use of recycled materials [14]. Key strategies span from circular design of buildings [15,16], improved waste-management practices [11,17], and refurbishment or adaptive reuse of structures [18], to holistic lifecycle thinking and assessment [19,20]. Advancing circular construction promises not only environmental gains and resource conservation but also cost savings, efficiency improvements, and innovation opportunities for the construction industry [21,22].
In the Australian context, construction and demolition (C&D) waste represents a significant environmental burden. For example, New South Wales alone generates about 9.8 million tons of C&D waste per year, of which roughly 79.6% is currently recycled [16,23]. A large portion of this waste comes from concrete: approximately 29 million cubic meters of concrete are used annually in Australia [24], and once structures are demolished, concrete debris constitutes a major waste stream. Recycling this material into recycled aggregate concrete (RAC) has emerged as a sustainable alternative to landfilling, offering notable economic and environmental benefits [25,26,27]. However, practical challenges remain—for instance, high logistics costs and the additional carbon footprint associated with the extra cement often needed in RAC production still hinder wider adoption [28,29].
The concrete recycling supply chain is also complex, involving multiple stakeholders from waste generators and recyclers to concrete manufacturers and construction contractors [30]. Typically, concrete waste is collected from demolition and construction sites, then processed to remove contaminants and produce RCA that meets the required specifications for use in new concrete mixes [31]. Despite the clear environmental and economic rationale for circular construction, there remains a notable lack of comprehensive guidance on how the construction industry can effectively implement and navigate this transition. Many firms and local authorities are uncertain about the specific strategies and investments needed to move toward a circular model, leaving a gap between high-level circular economy goals and on-the-ground practices. Among the various factors influencing C&D waste-management outcomes, economic drivers are frequently identified as the most critical determinants of whether materials are recycled or landfilled [32,33,34,35]. In line with this insight, a number of studies have employed system-dynamics modeling to evaluate the impact of economic and policy interventions on construction waste management. For instance, researchers have used system dynamics to examine the benefits of waste reduction programs [4], to assess the economic outcomes of waste minimization strategies [36], and to identify optimal waste disposal fees or landfill levies that would incentivize recycling [37]. Other studies have highlighted the importance of operational improvements such as better waste sorting and classification [38] and explored cross-regional strategies (e.g., coordinating landfill charges and waste transport) to enhance overall waste-management efficiency [39]. These efforts demonstrate the value of dynamic modeling in understanding how various policy and economic levers can influence waste generation and recycling rates in the construction sector.
Nevertheless, to our knowledge, no prior study has explicitly examined how recycling costs, landfill fees, and logistics costs interact dynamically—through nonlinear feedback loops—to collectively shape recycling and landfilling rates in the construction industry. This represents a critical research gap. Understanding these intertwined factors in a systemic way is essential for devising effective recycling policies and business strategies. However, existing research has largely considered them in isolation. A holistic investigation is needed that integrates both economic incentives and logistical operations, capturing their interdependencies to identify key leverage points for increasing concrete recycling and reducing reliance on landfills.
In this paper, we address the above gap by developing a system-dynamics model of the concrete recycling supply chain, using Sydney, Australia, as a case study. The model captures the coupled, nonlinear feedback relationships between recycling costs, landfill charges, logistics expenses, and the resulting recycling and landfill rates. Using this model, we simulate how changes in these economic and operational factors propagate through the system over time, quantitatively evaluating their impacts on concrete recycling performance. This approach allows us to identify the critical factors that drive recycling outcomes and to explore how adjustments in cost structures or infrastructure could shift the balance away from landfilling and toward greater recycling. To our knowledge, this work is the first comprehensive analysis of these interacting factors in a circular construction context using a system-dynamics lens. The insights derived from our modeling have direct practical value for decision-makers. For policymakers in Sydney and beyond, the results illustrate how different policy levers—such as landfill levies, recycling subsidies, or investments in recycling logistics—can significantly influence recycling rates, thereby informing more effective waste management and circular economy strategies. For industry stakeholders, understanding the dynamic interplay of costs and logistics can guide more economically viable and efficient practices in waste collection, material processing, and the utilization of recycled aggregates. Ultimately, by highlighting strategies to achieve higher concrete recycling rates and reduce dependency on landfills, our study contributes to broader efforts to align the construction sector with circular economy principles and sustainability goals.
The remainder of this paper is structured as follows. Section 2 describes the methodology, including the development and validation of the system-dynamics model that underpins our analysis. Section 3 presents the scenario design and simulation results and discusses their policy implications. Finally, Section 4 concludes the paper with a summary of key findings, an outline of the study’s limitations, and recommendations for future research.

2. Methods

This section outlines the methodological framework of our study, emphasizing the System-Dynamics (SD) approach used to examine the complex interactions in Sydney’s concrete recycling system. We first provide an overview of System-Dynamics modeling, then describe the development of our model, including key equations and parameters and the formulation of two interconnected sub-models.

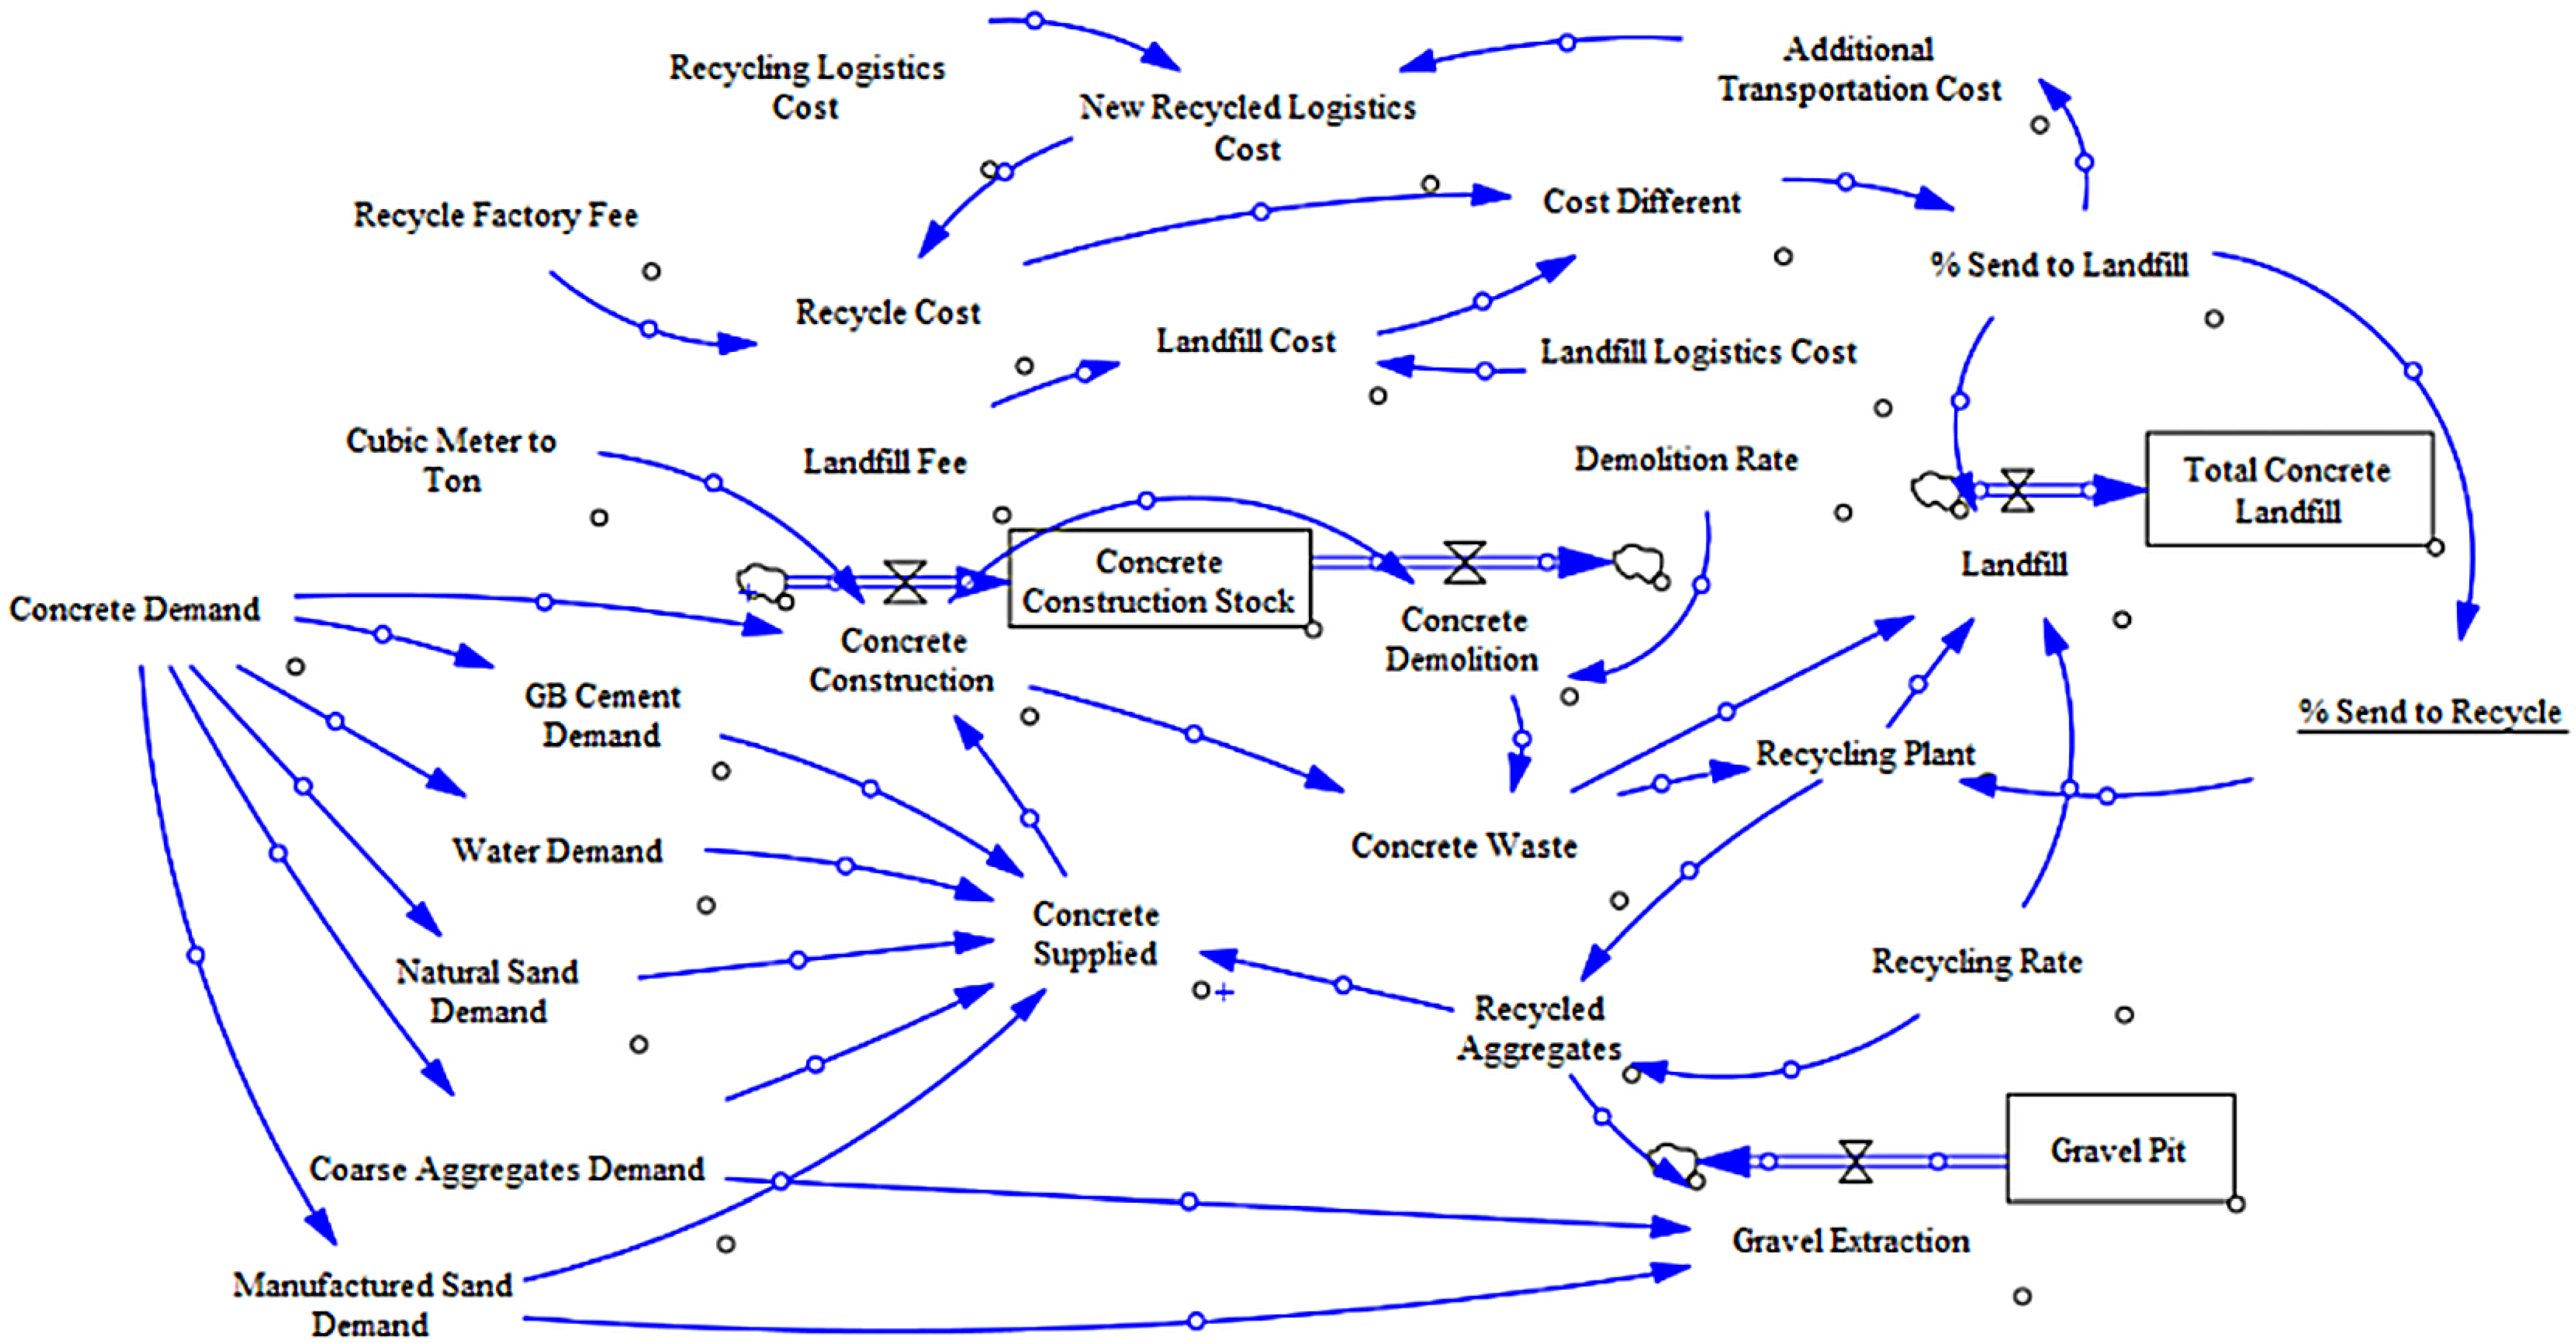
2.1. Development of the System-Dynamics Model for the Concrete Supply Chain

System Dynamics is a modeling methodology for analyzing complex systems and their evolution over time. It synthesizes elements of systems theory, control theory, and information theory to provide a framework for understanding and solving systemic issues [40]. An SD model is built to mimic real-world system behavior with the goal of revealing the system’s underlying structure and key variables rather than reproducing the system in exact detail. The modeling process is problem-driven, focusing on specific questions and well-defined objectives [4].
The development of an SD model typically begins by defining the system boundaries and identifying the main components and their interconnections. Next, one identifies the feedback loops in the system, which represent the causal relationships among components that govern the system’s behavior over time [41]. The following step involves constructing a computer-based representation of the system using specialized software. In this study, we used Vensim, a widely used tool for building and simulating SD models across domains such as business, economics, energy, environment, and healthcare [42]. The model is built using stocks, flows, and feedback loops, and it simulates the system’s behavior over time. Simulation results are then analyzed to understand the system’s dynamics and key driving factors [43]. Finally, insights from the model inform policy recommendations aimed at improving system performance.
In this study, we developed a System-Dynamics model tailored to our research objectives: investigating how recycling cost, landfill cost, and logistics cost collectively influence the recycling rate and landfill rate in the construction industry. The model is intended to improve understanding of the current level of circularity in Sydney’s construction sector and to explore how policy interventions could reshape the system toward greater sustainability. Figure 1 presents a schematic of the material flow in the construction industry with a focus on the concrete supply chain. The structure of this flow and the relationships between components were informed by literature, industry reports, and interviews with industry experts.

2.2. Model Formulation

We constructed two interconnected sub-models for the Sydney concrete recycling system: the Concrete Production sub-model and the Concrete Recycling Choice sub-model. Together, these sub-models capture the material flows, economic factors, and decision processes that drive recycling behavior in the construction industry. In the following subsections, each component of the model is explained along with its key parameters, assumptions, and governing equations.

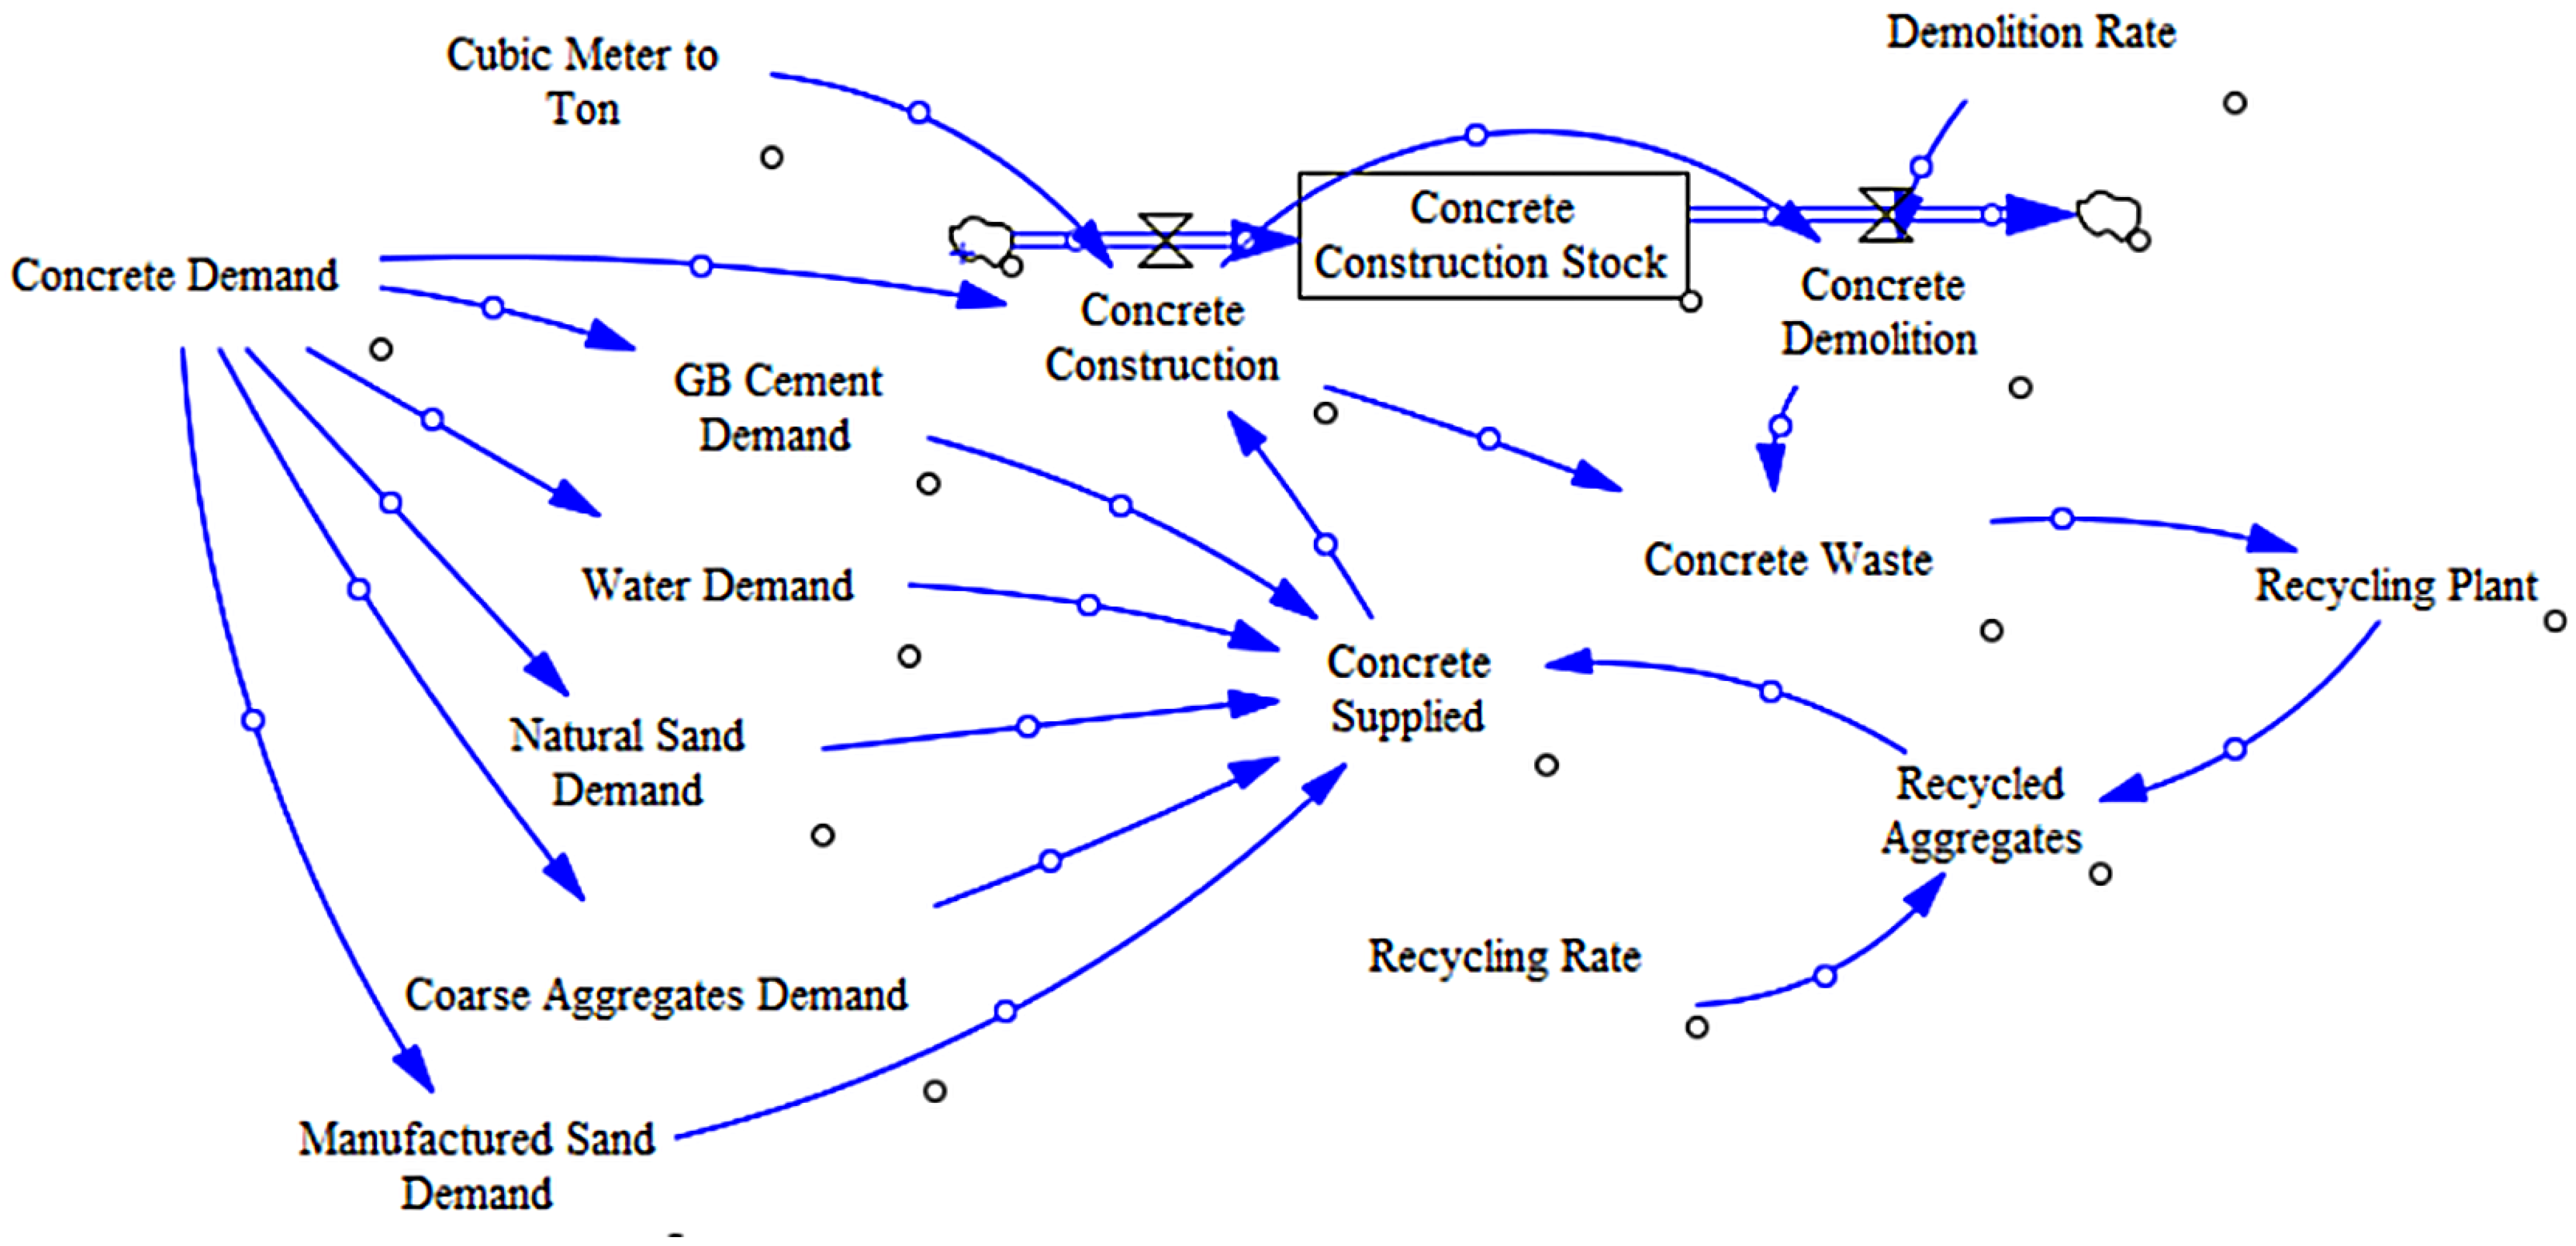
2.2.1. Sydney Concrete Production Model

Figure 2 illustrates the concrete production process in our model of Sydney’s construction sector. In this framework, new concrete construction increases the stock of in-use concrete, while demolition of concrete structures reduces that stock. Both construction and demolition activities generate concrete waste, which can either be sent to landfill or processed into recycled aggregate. The recycled aggregate is then available for use in producing new concrete, closing the materials loop.
The dynamics of concrete construction in the model are driven by the interplay between concrete demand and supply. According to industry data, New South Wales (NSW) consumes approximately 9.5 million m 3 of premixed concrete annually [44]. To estimate Sydney’s concrete consumption, we scaled this figure by 66% to reflect Sydney’s share of the NSW population. We assumed an annual growth in concrete demand of about 2%, and the model assumes that supply always rises to meet this demand. In other words, any increase in concrete demand triggers a corresponding increase in the supply of all constituent materials required for concrete production, ensuring that demand is fully satisfied.
The specific concrete mix chosen to represent concrete production in Sydney was Street Pavements N20 concrete. The concrete mix ratio we used was documented by [45] (Table 1). The selection of this particular type of concrete as the representative was guided by an analysis of its composition. Notably, it is one of the more commonly used types of concrete in terms of quantity, and it exhibits a compatibility with recycled aggregate. This compatibility is particularly relevant in the current landscape, where a significant proportion of recycled aggregates are incorporated into street pavement or road base construction [38].
On the waste generation side, data from the Australian Government’s Department of Climate Change, Energy, the Environment and Water indicate that NSW generated about 9.8 million tons of C&D waste in 2020–2021 [23]. In formulating our model, we consulted recycling industry professionals who indicated that a well-designed recycling plant could achieve about a 90% recycling efficiency for incoming C&D waste. We further assumed that roughly 50% of the total C&D waste stream is composed of concrete waste. Using the modeled concrete construction activity as an index of overall construction activity, we derived the corresponding concrete demolition rate such that the model’s annual concrete waste generation aligns with these figures. Specifically, the demolition rate was calibrated so that the amount of concrete waste produced in the model corresponds to 50% of the total C&D waste (9.8 Mt), and this waste is processed with a 90% recycling efficiency under baseline conditions (as described next).

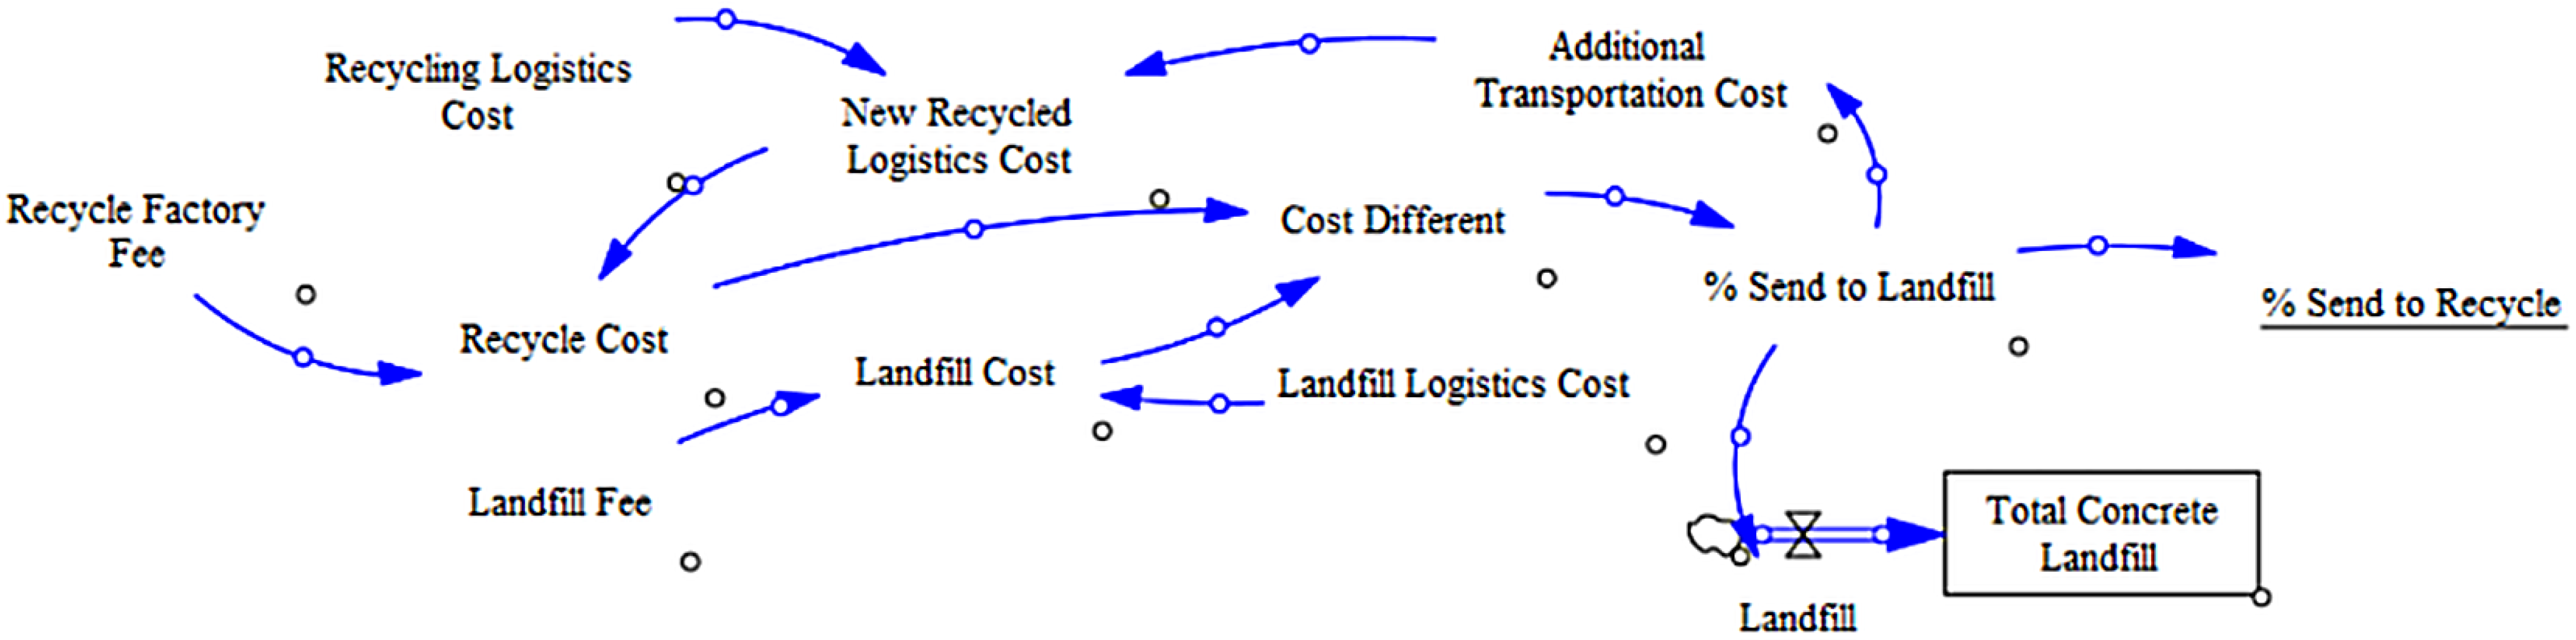
2.2.2. Sydney Concrete Recycling Choice Model

Figure 3 depicts the decision-making sub-model for how concrete waste is handled (recycling vs. landfill) in Sydney. In this component, we consider the total costs associated with recycling and landfilling, including both the processing fees and logistics (transportation) costs for each option. Based on industry input, we estimated baseline values for the recycling logistics cost (transportation cost to a recycling facility) and the landfill-logistics cost (transportation cost to a landfill site). The parameters for Recycle Factory Fee ($80 per ton), Recycling Logistics Cost ($445 per ton), Landfill Fee ($147 per ton), and Landfill-Logistics Cost ($450 per ton) used in this study are based on representative assumptions derived from consultations with local industry experts and available industry reports. It is important to note that these fees and costs can vary significantly across different locations within Sydney due to varying transport distances, local market conditions, facility capacities, and operational practices. These, combined with typical recycling facility fees and landfill tipping fees, yield a total recycling cost and a total landfill cost for a unit of waste. The decision of whether a demolition contractor chooses to recycle concrete waste or send it to landfill is modeled as a function of the difference between these two total costs.
According to national waste data, approximately 80% of C&D waste in Australia is directed to recycling, and about 90% of the waste that is sent to recycling facilities is successfully processed into recycled materials [23]. Applying these ratios, we estimate that roughly 89% of C&D waste (0.80/0.90 ≈ 0.89) is initially sent to recycling facilities, with the remaining 11% disposed in landfill under current conditions. We assume that, in general, companies will choose the more economical disposal route. In other words, for about 11% of the waste, landfilling remains the cheaper option and thus is chosen. To represent this behavior in the model, we employed a binary logit choice function that determines the fraction of waste sent to landfill versus recycling based on the cost difference between the two options. The logistic function was calibrated so that at the baseline cost values (i.e., where the average total landfill cost is slightly lower than the total recycling cost), it reproduces this roughly 89% recycle vs. 11% landfill split observed in practice. The resulting function is:
Waste Sent to Landfill % = 1 1 + exp 1.5869 + 0.0829612 × Δ Cost .
It is important to note that changes in one cost can influence the other indirectly through logistics behavior. For instance, if rising landfill fees prompt more companies to choose recycling (making landfilling less attractive economically), the average transportation distance for those companies might increase since they forego nearby landfills in favor of more distant recycling facilities. In our model, this effect is captured by an additional transportation cost ($4.20/ton/km) term that increases as the fraction sent to recycling grows (reflecting the need to use longer routes when the nearest disposal site is bypassed). This means that an increase in landfill fees while encouraging recycling, can inadvertently raise the average logistics cost for recycling routes. Such feedback ensures that the model realistically accounts for the trade-off between disposal fees and transportation efficiency.

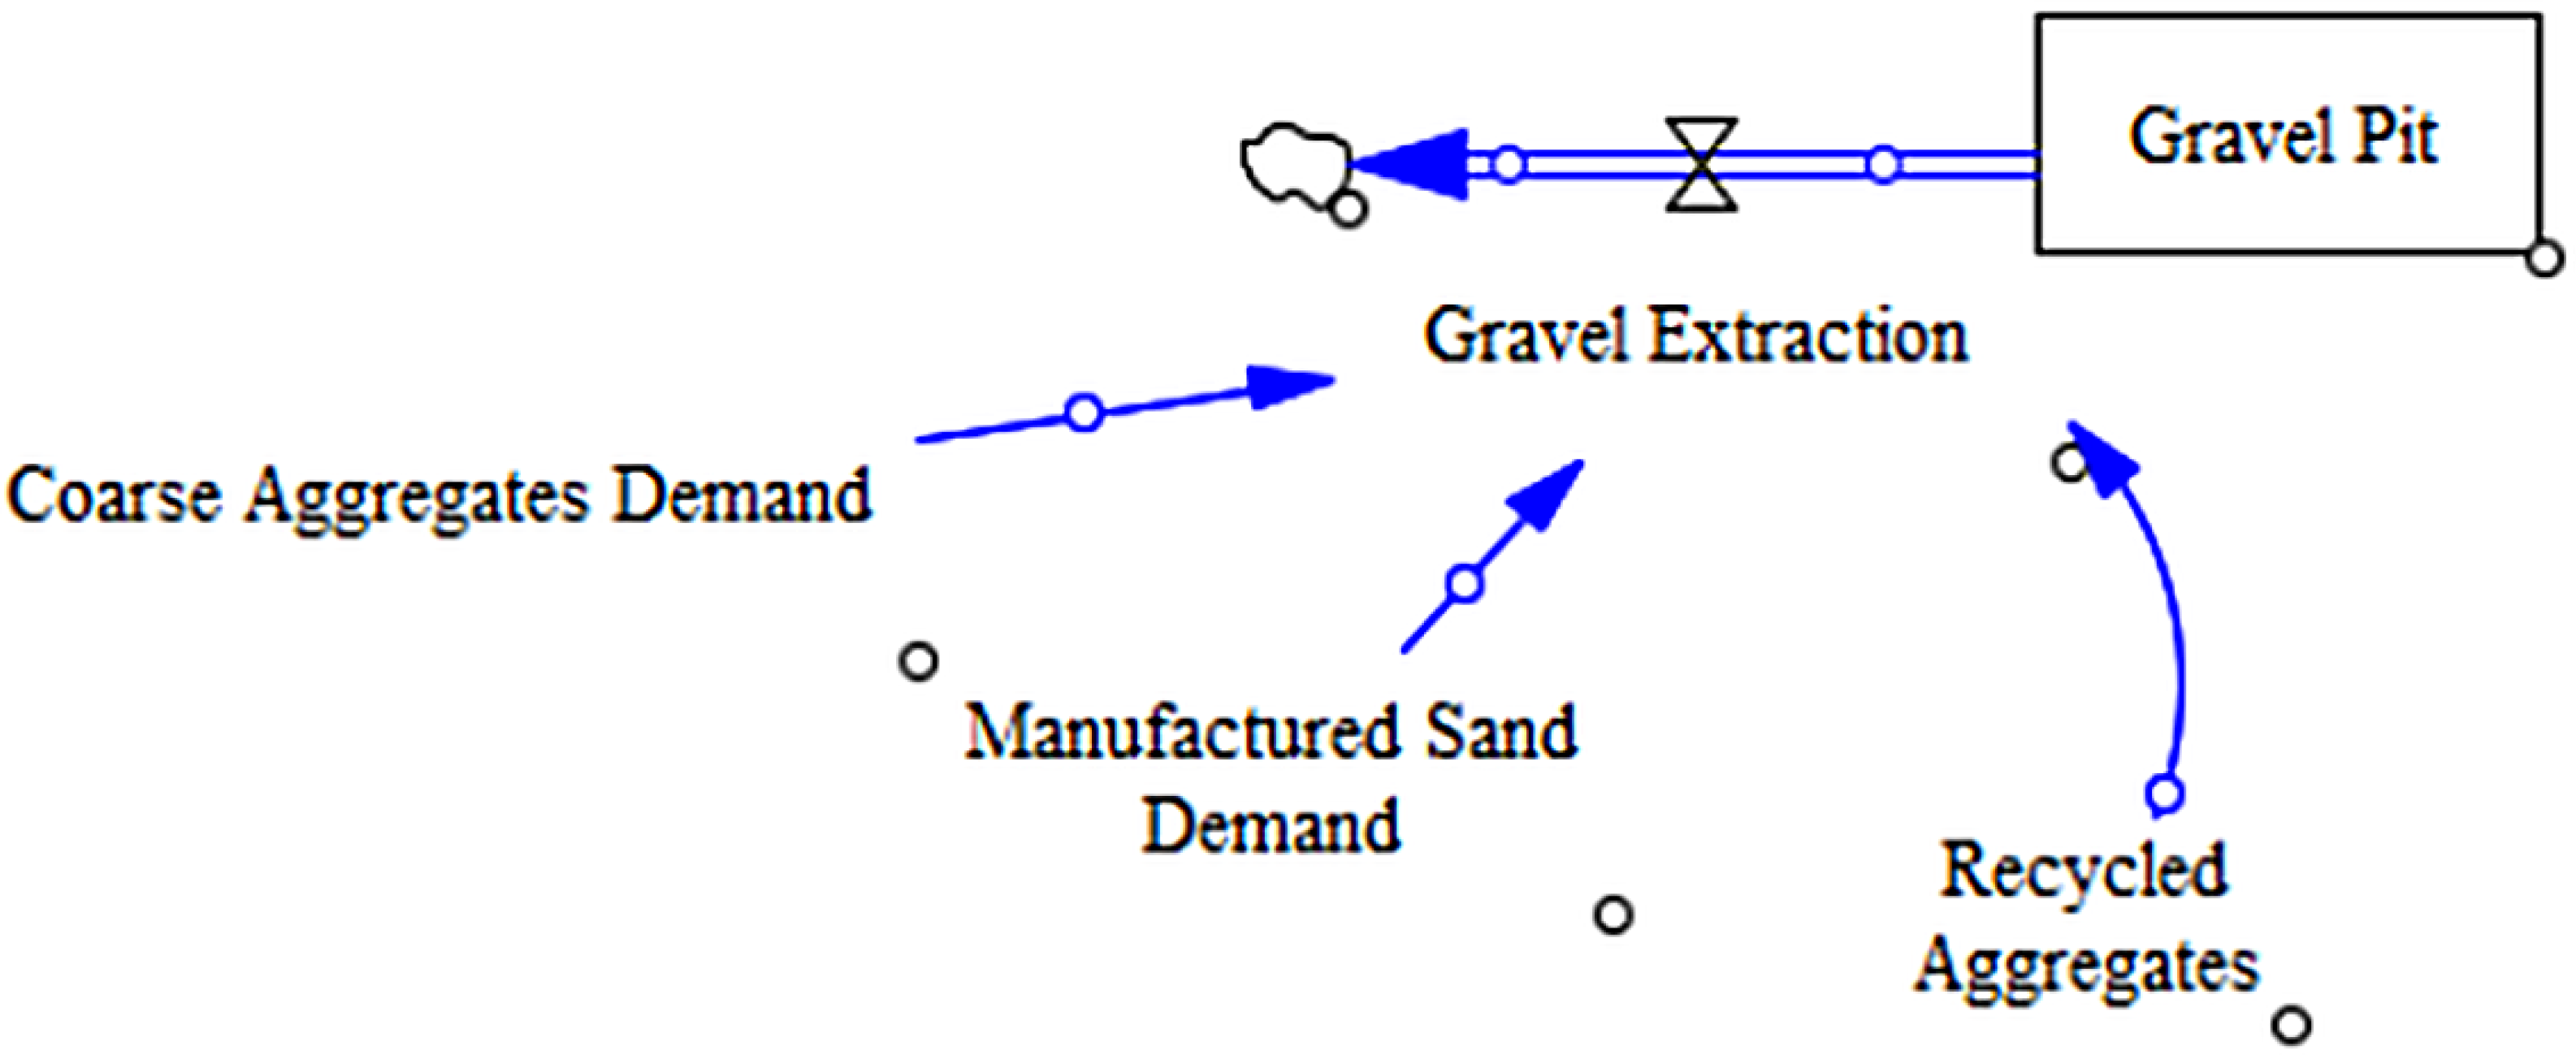
2.2.3. Integration of Sub-Models and Gravel Extraction Calculation

Finally, we integrated the concrete production and recycling choice sub-models to capture the complete circular flow and its effects on natural resource extraction. As illustrated in Figure 4, recycled aggregate generated from the recycling choice sub-model directly feeds into the concrete production model. Concurrently, any aggregate demand not satisfied by recycled materials—specifically coarse aggregate and manufactured sand—necessitates virgin gravel extraction from gravel pits. In this study, we assume an initial total gravel pit resource of 100 million tons. Gravel extraction is thus calculated as the difference between the total aggregate required for concrete production and the available recycled aggregate. This integration enables the model to monitor the depletion of the gravel resource stock over time, reflecting its non-renewable nature. Consequently, reductions in gravel extraction resulting from higher recycling rates directly extend gravel pit longevity. By connecting these sub-models, the approach allows a comprehensive analysis of how varying waste-management scenarios affect recycling performance, landfill volumes, and virgin material consumption.

2.3. Model Validation and Empirical Grounding

Although the system-dynamics model is conceptual in structure, we undertook several steps to ensure empirical fidelity and practical relevance:
  • Data Calibration: Key model parameters were derived from authoritative sources, including official C&D waste statistics from New South Wales (2020–2021), infrastructure usage reports, and detailed interviews with local recycling contractors and plant operators. This ensures that the model reflects actual material flows and economic structures observed in the Sydney metropolitan context.
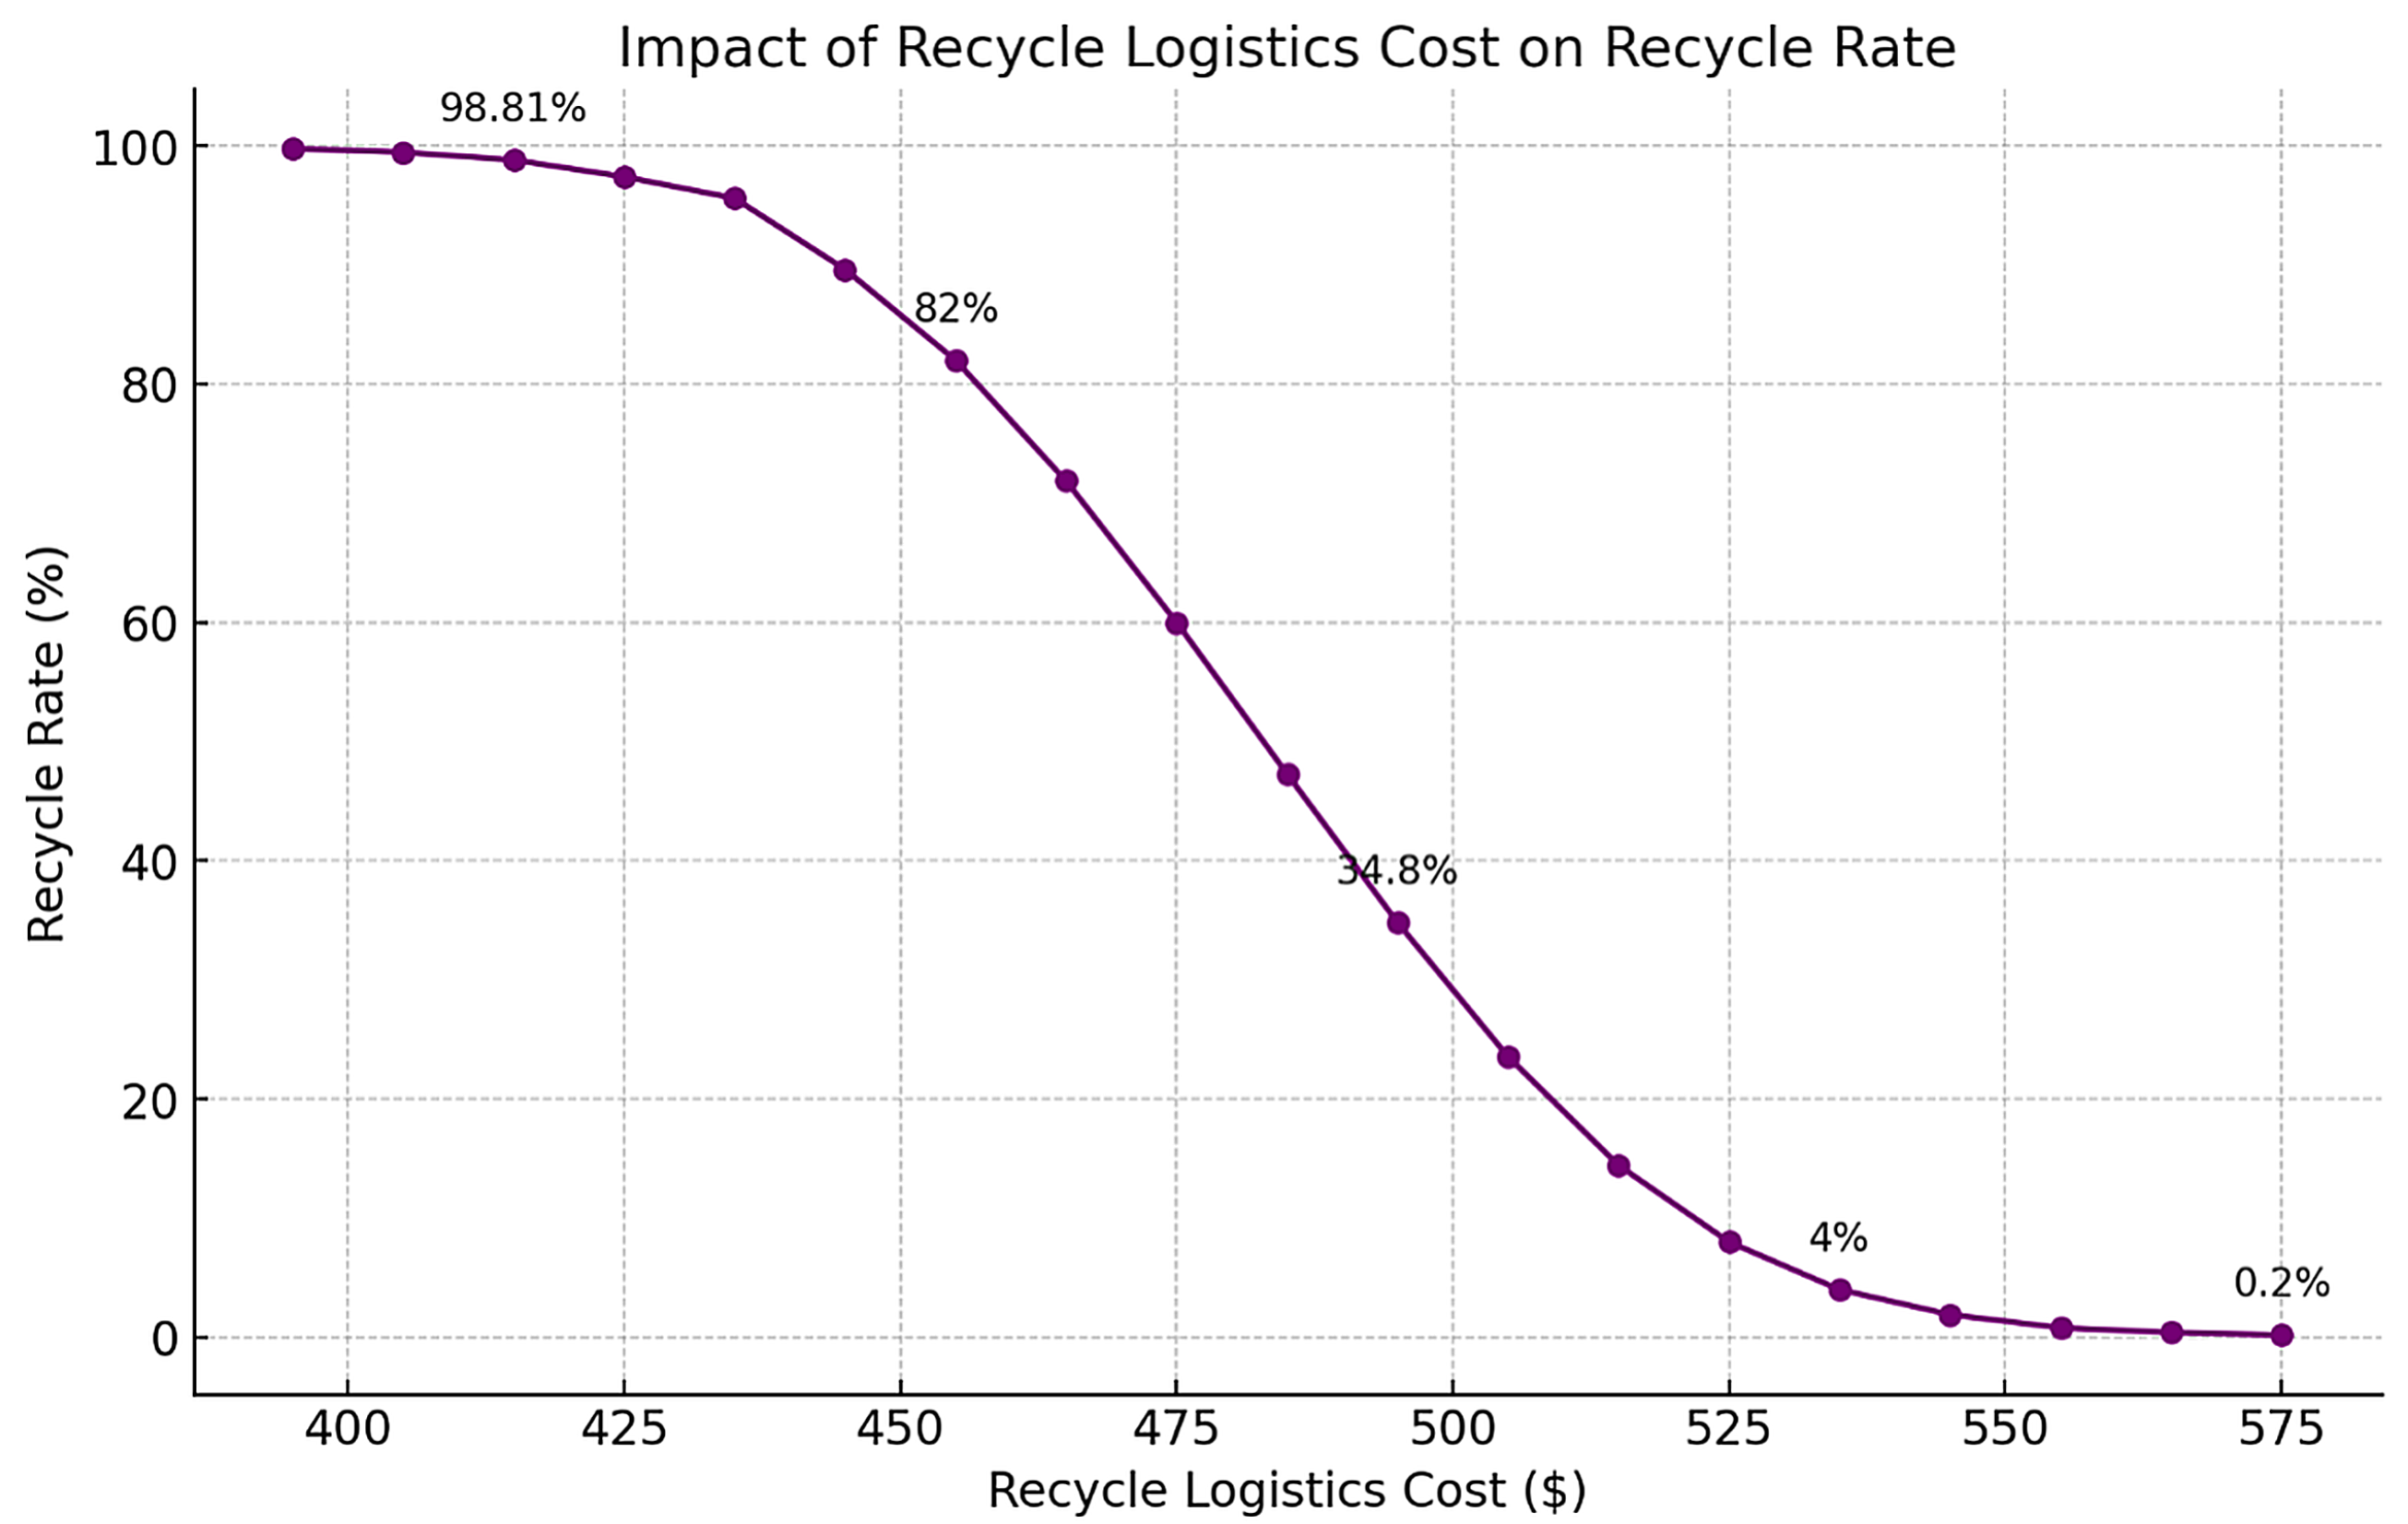
  • Behavioral Realism: The logit-based routing function was calibrated to match observed waste-management behaviors, achieving an equilibrium where approximately 89% of waste is recycled—consistent with national C&D recycling performance data.
  • Face Validity via Stakeholder Review: Model structures and simulation outputs were cross-validated through iterative consultation with industry stakeholders, providing qualitative feedback to align model assumptions with ground realities.
  • Scenario Realism: Simulation scenarios were constructed using realistic ranges for landfill and recycling costs, informed by industry reports and local fee schedules. This ensures that policy insights derived from the model are implementable under plausible economic conditions.

3. Scenario Results and Discussion

In this section, we present the findings from our SD model simulations and discuss their implications. We first describe the scenario analysis approach and then detail the results, showing how various cost changes affect recycling rates, landfill accumulation, and gravel extraction. Finally, we discuss the broader implications of these results for policy development and industry practices in the context of circular construction.

3.1. Scenario Analysis

After constructing and validating the SD model of Sydney’s concrete supply chain, we conducted a series of scenario simulations to investigate the interrelationships between recycling costs, landfill costs, and logistics costs. The primary objective was to elucidate how changes in these economic factors, both individually and in combination, influence key outcomes such as the recycling rate, landfill rate, total landfill mass, and gravel extraction. We designed a range of scenarios by varying the logistics costs for recycling and landfilling around the baseline values. These scenarios included, for example, a 10% increase in the landfill-logistics cost, a 10% increase in the recycling logistics cost, a 25% decrease in either the landfill or recycling logistics cost, as well as more extreme combined changes like a 50% decrease in both costs or a 100% increase in both. This set of scenarios provides a comprehensive examination of the system’s sensitivity to cost fluctuations. Such cost changes can realistically occur due to policy interventions (e.g., higher landfill levies or new recycling subsidies) or market forces (e.g., changes in fuel prices affecting transport costs or adjustments in recycling facility fees). By exploring these what-if cases, we capture the complex interplay of economic and regulatory factors within the waste-management system.
The outcomes of these scenarios at the end of the simulation period are summarized in Table 2 and Table 3. Each scenario represents a specific adjustment in recycling and/or landfill-logistics costs, and the table records the resulting values of several pertinent metrics. The columns in Table 2 and Table 3 are defined as follows:
  • Scenario: A brief description of the cost variation applied (e.g., “Landfill-logistics cost +10%” or “Both costs 50 % ”), with a base case included for reference.
  • Recycling Cost: The total recycling cost in that scenario (including recycling facility fee plus recycling logistics cost, in $ per ton). This reflects how changes in recycling practices or policies alter the cost structure for recycling concrete waste.
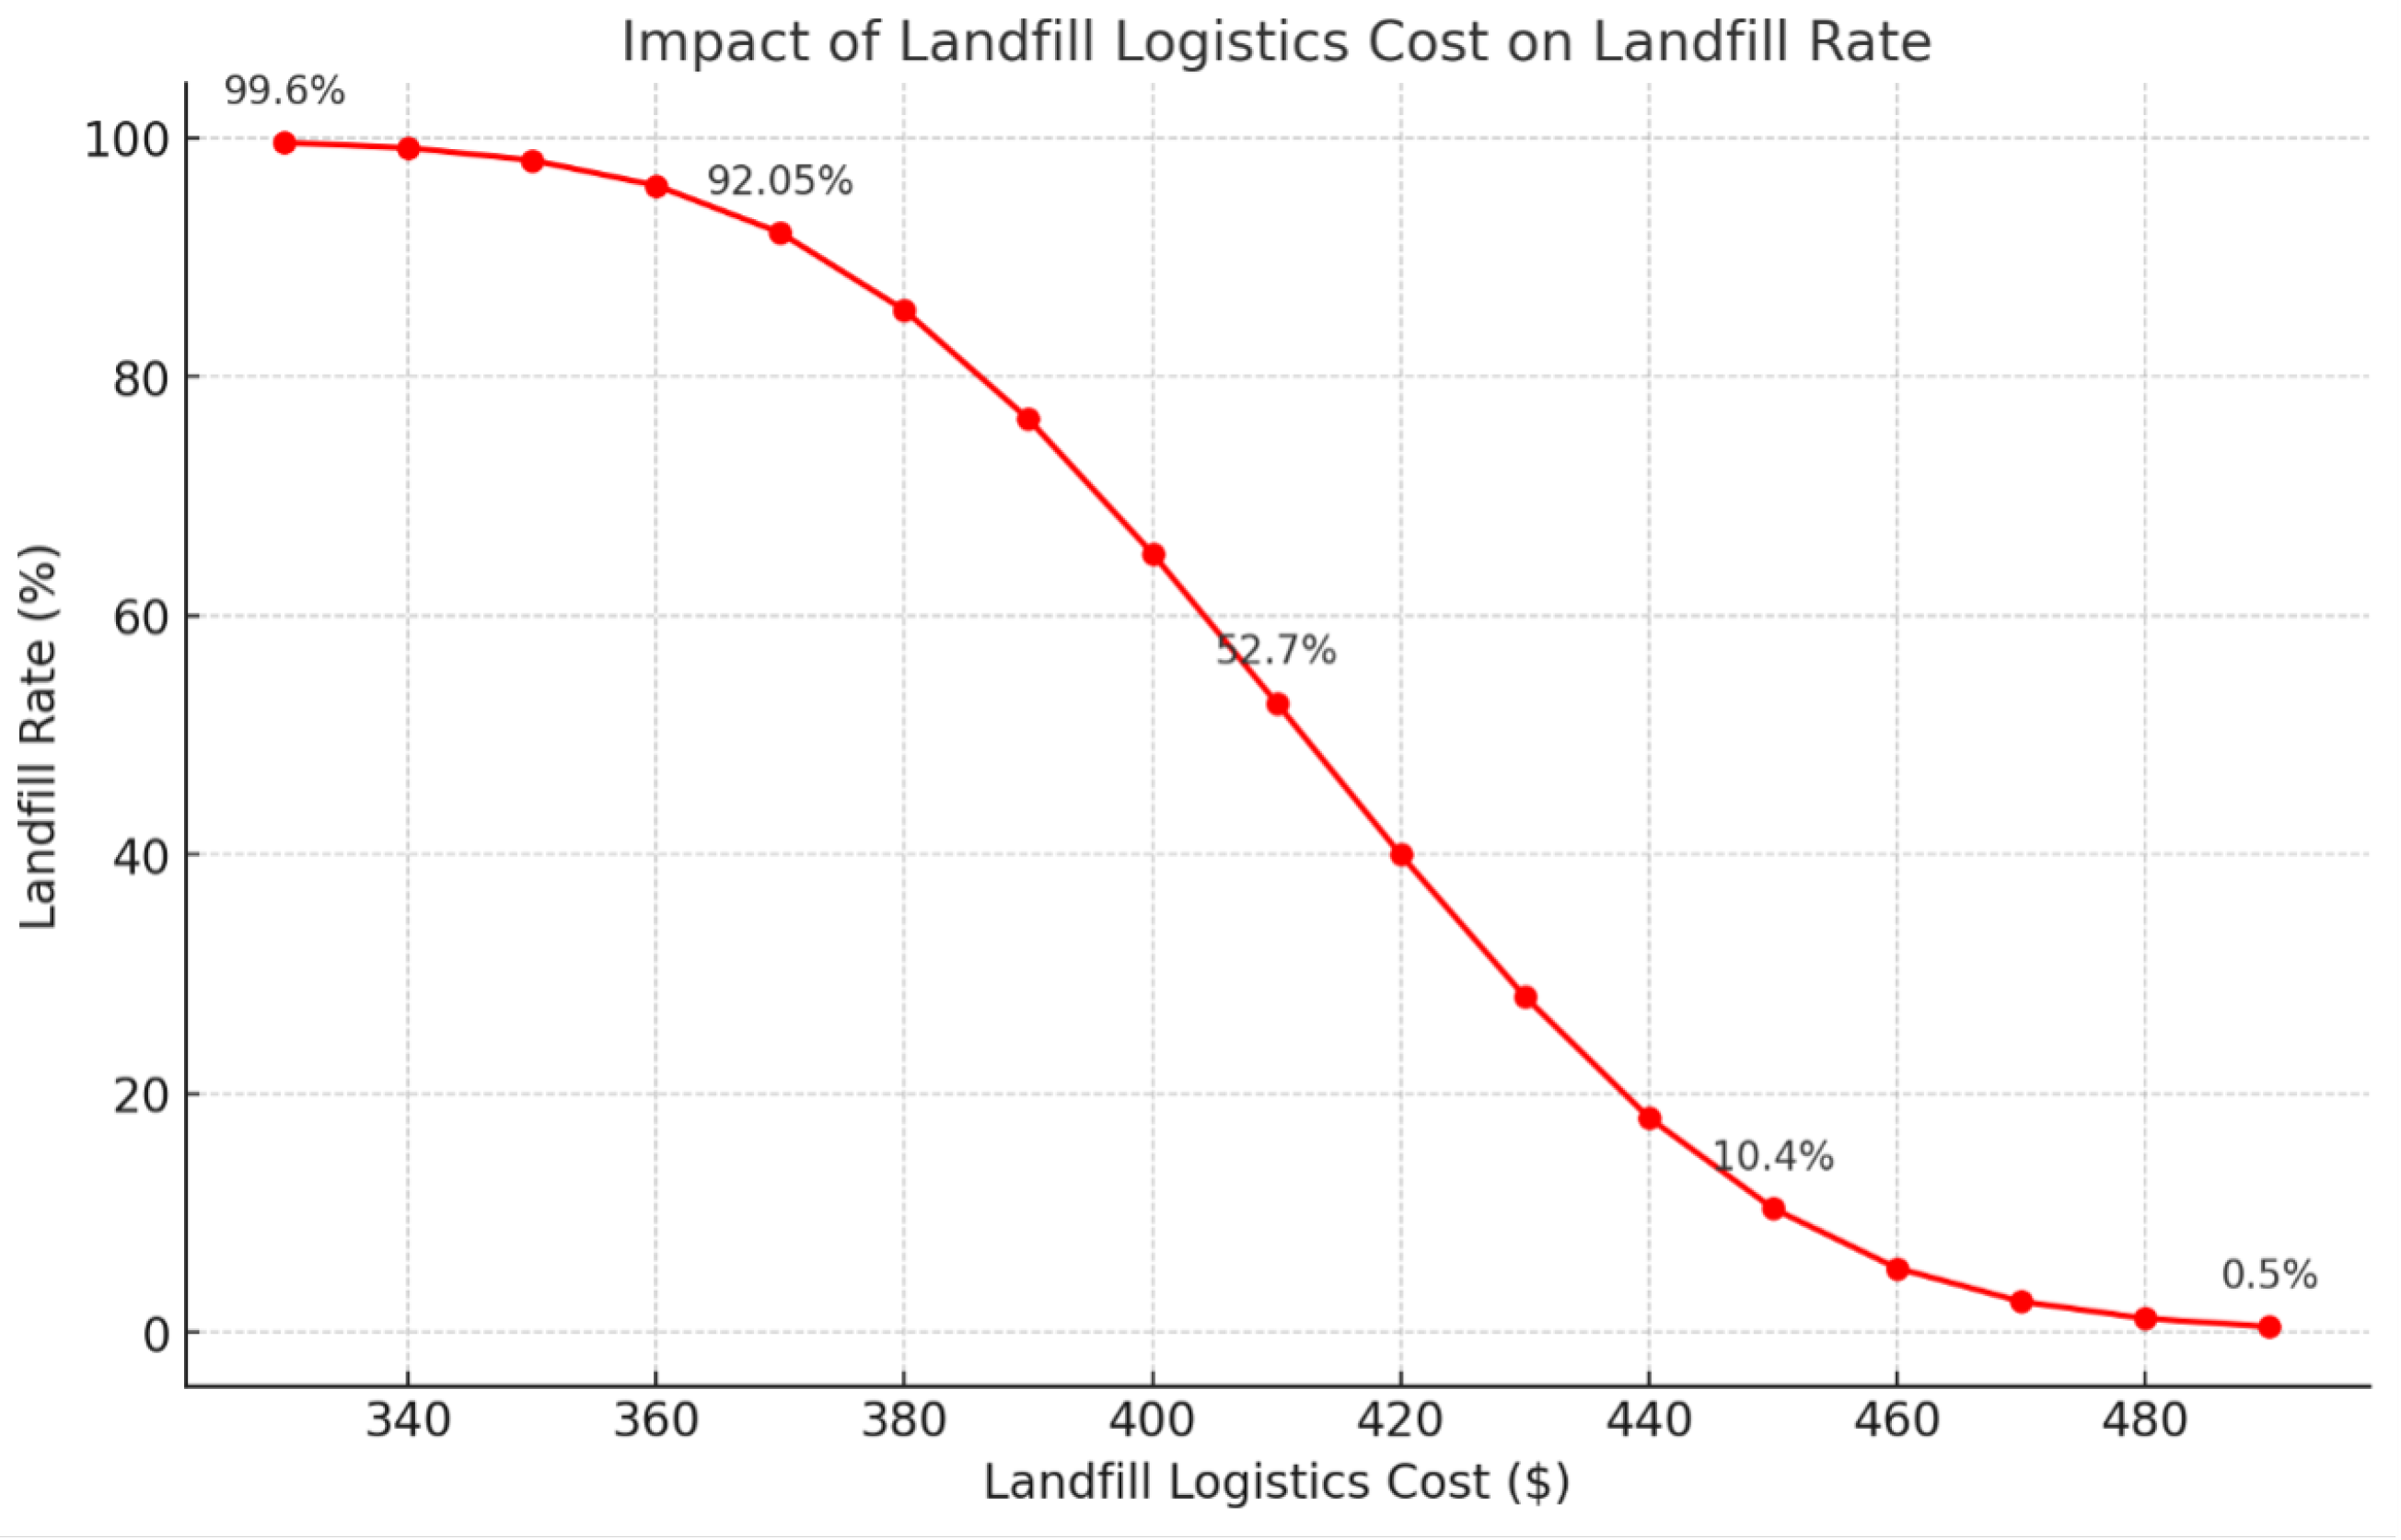
  • Landfill Cost: The total landfill disposal cost in that scenario (including landfill tipping fee plus landfill-logistics cost, in $ per ton). This shows the sensitivity of landfill expenses to changes in transport costs or fees.
  • Cost Difference: The difference between the recycling cost and the landfill cost (Recycling minus Landfill, in $). This metric indicates the economic incentive or disincentive for choosing recycling over landfilling. A positive value means recycling is more expensive than landfilling (discouraging recycling), while a negative value means recycling is cheaper (encouraging recycling).
  • % Sent to Recycle: The percentage of concrete waste directed to recycling facilities under the scenario. The logit choice model determines this and indicates how responsive the recycling uptake is to the cost difference.
  • % Sent to Landfill: The percentage of concrete waste sent to landfills in the scenario. (Since all waste must go either to recycling or landfill, this value is essentially 100 % minus the above recycling percentage).
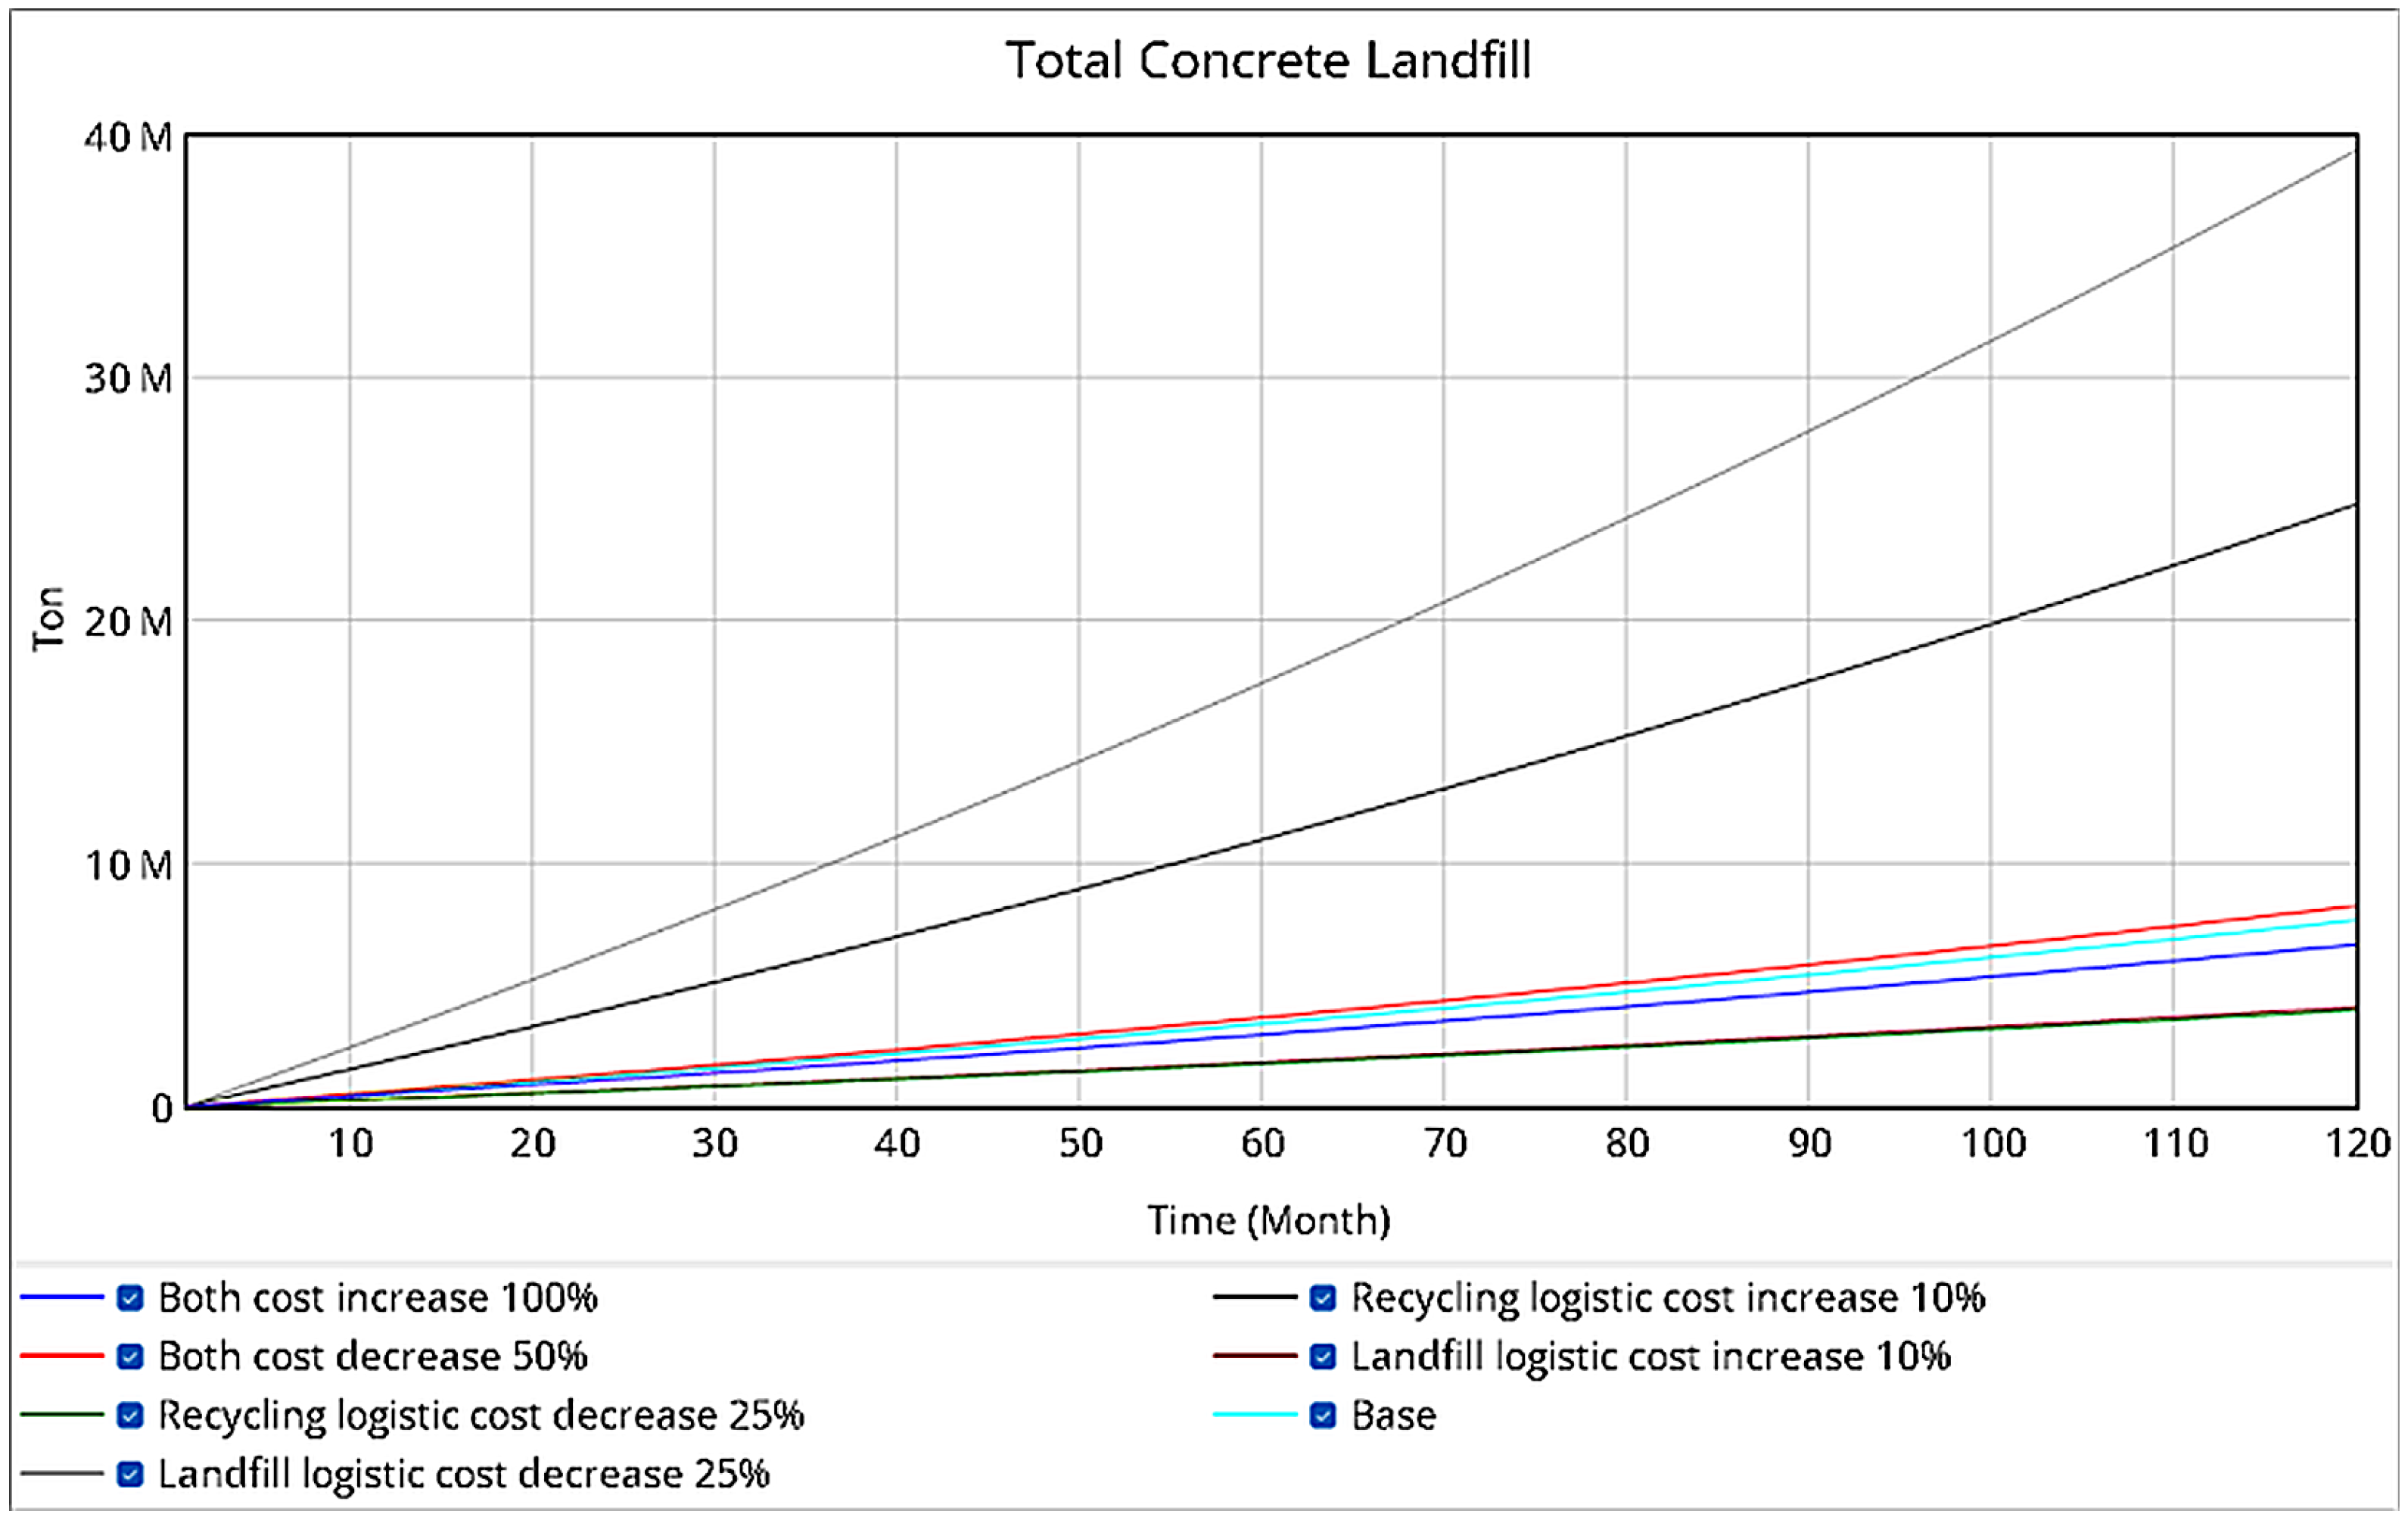
  • Total Landfill (Million tons): The cumulative quantity of concrete waste (in million tons) that has been landfilled over the 120-time steps simulation. This provides a measure of the long-term landfill burden under each scenario.
  • Total Landfill / Base: The total landfilled waste normalized to the base scenario (unitless ratio). A value below 1 indicates less landfill accumulation than the baseline, while a value above 1 indicates more.
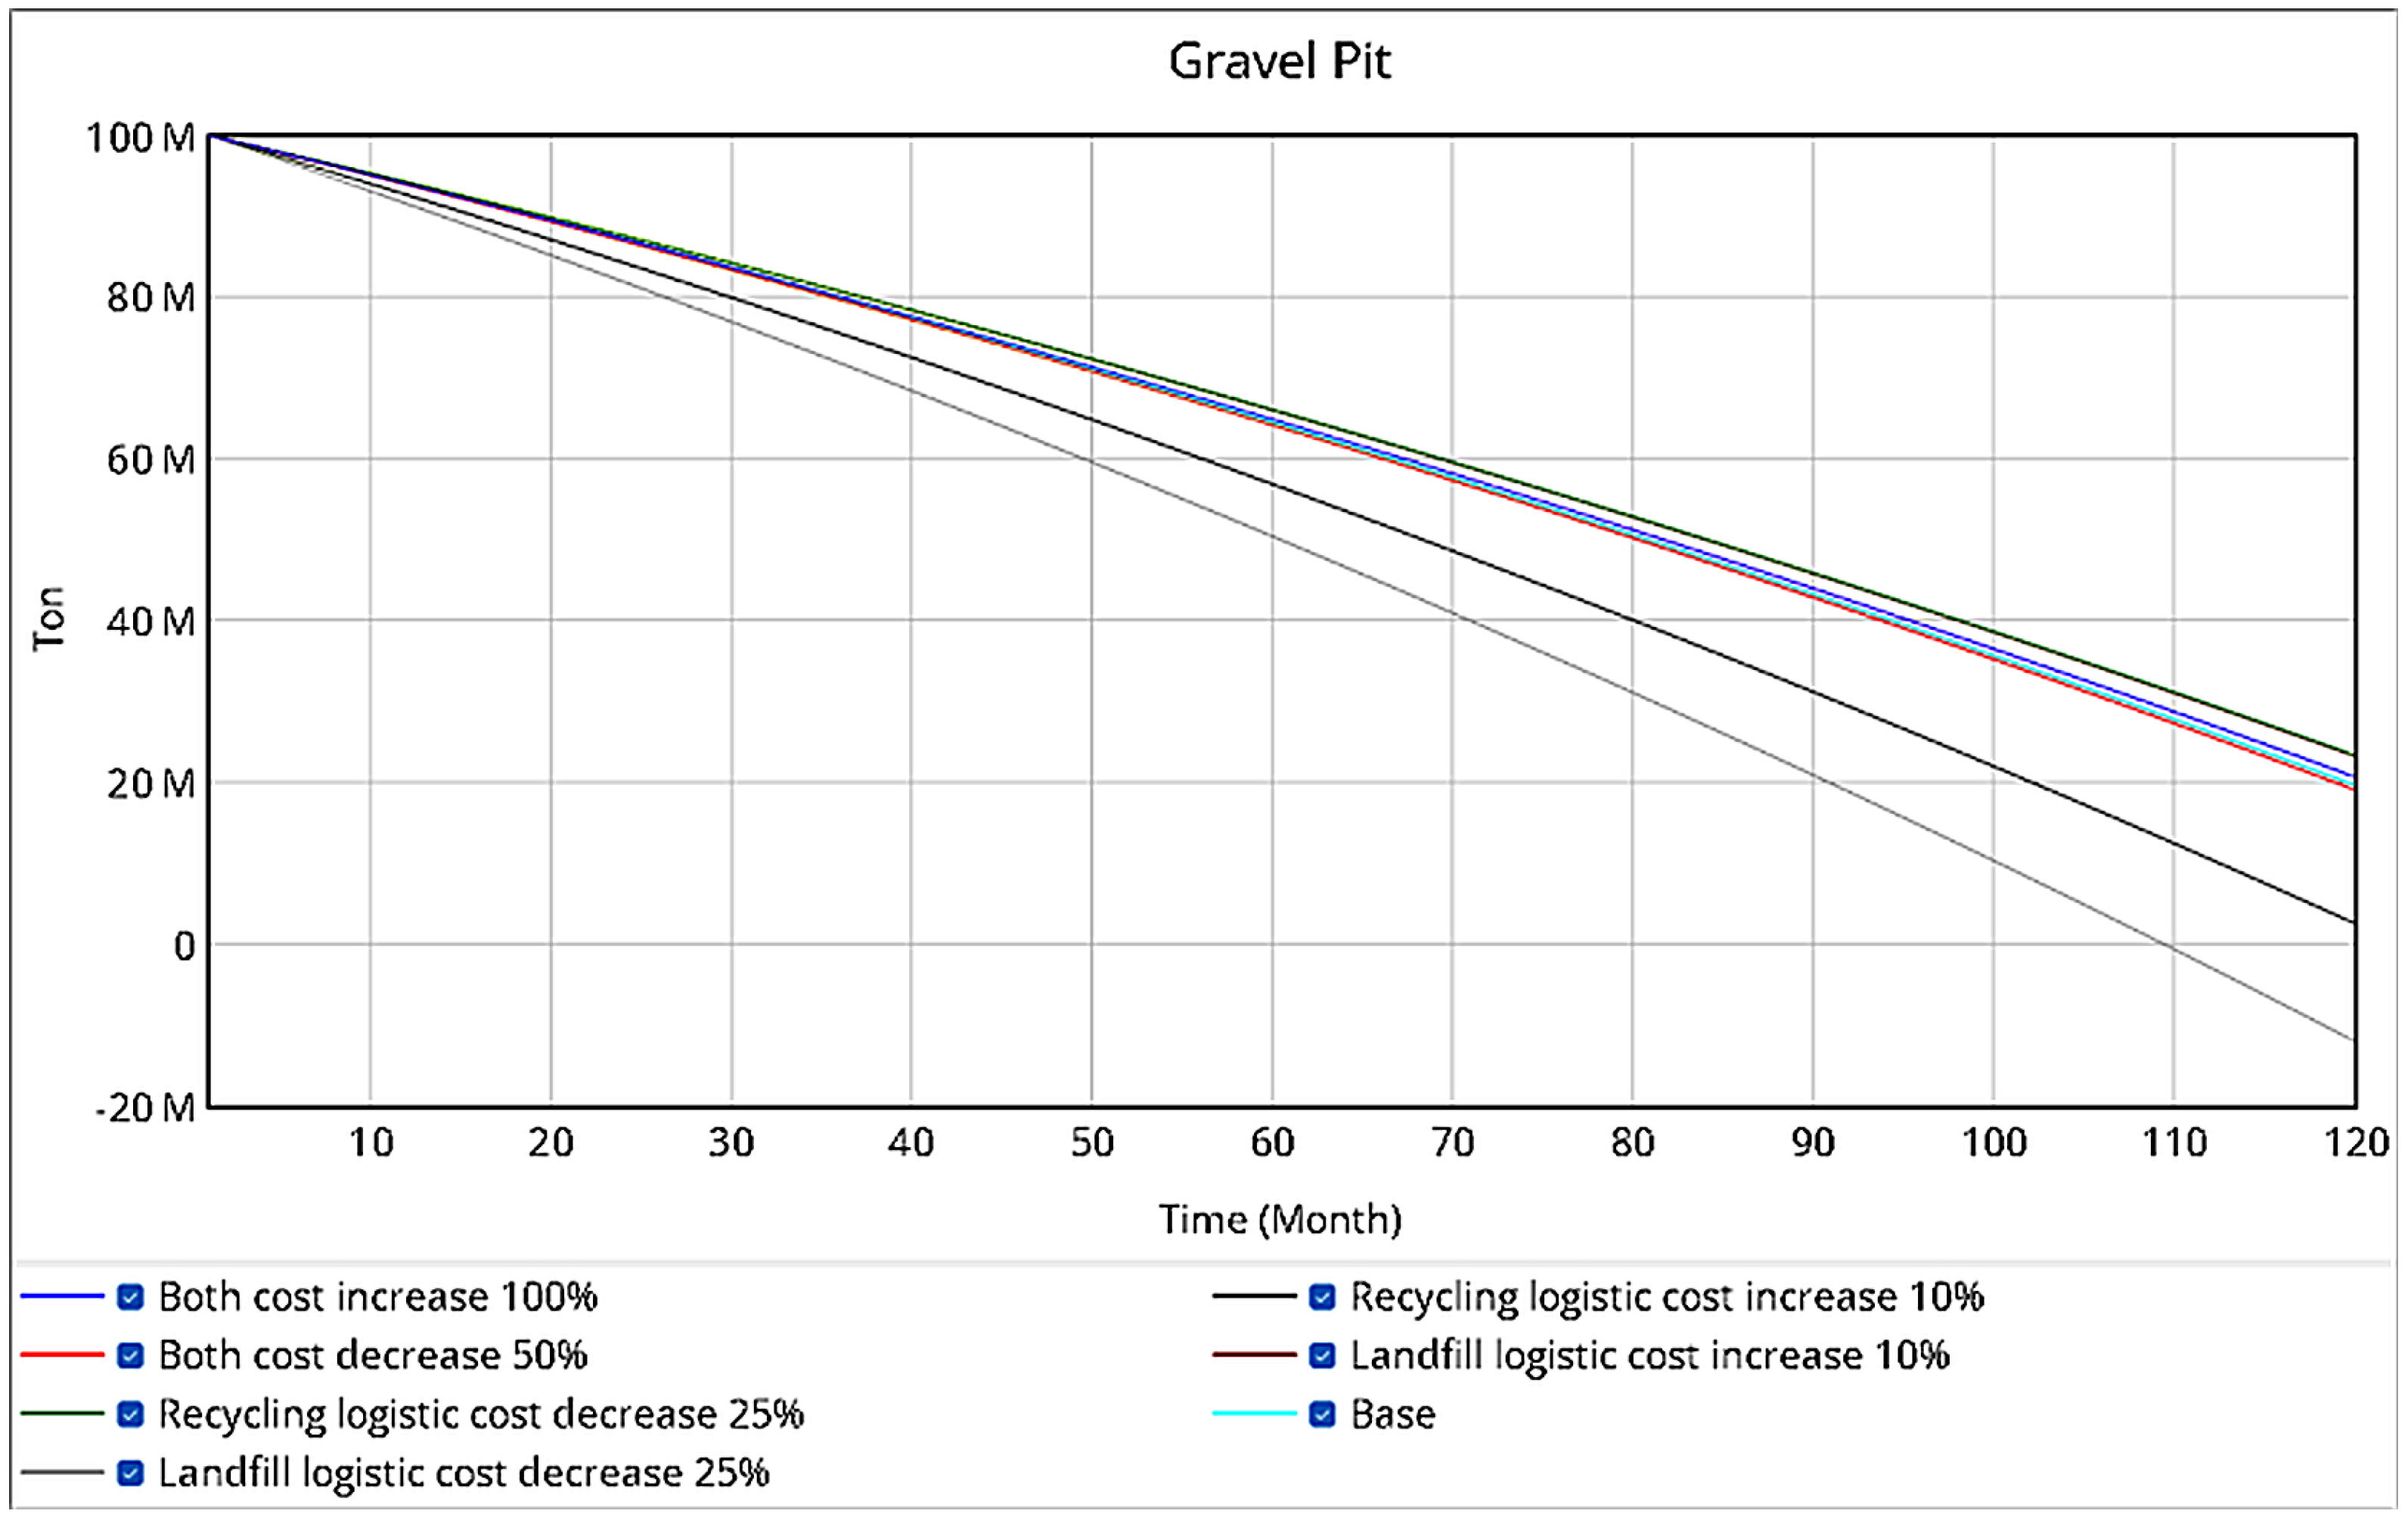
  • Gravel Pit Balance (Million tons): The remaining gravel resource in pits at the end of the simulation. This reflects how much virgin gravel has been conserved or depleted relative to the initial amount, highlighting the linkage between recycling rates and the consumption of natural aggregates.
  • Total Gravel Extraction (Million tons): The total amount of virgin gravel extracted over the 120 time steps. This is inversely related to the use of recycled aggregate—higher recycling of aggregate leads to lower gravel extraction.
  • Total Gravel Extraction / Base: The gravel extraction amount normalized to the base scenario (unitless). This helps compare how each scenario increases or decreases the reliance on virgin materials relative to the baseline.

3.2. Results

To ensure the credibility of the results, all simulations are grounded in empirically derived parameters and validated behavioral assumptions. The cost structures, routing shares, and recycling efficiencies used in the scenarios closely mirror those observed in practice. This empirical foundation strengthens the model’s value as a decision-support tool, enabling policymakers and stakeholders to explore the likely consequences of changes in fees, subsidies, and logistics strategies within a realistic operational framework. The simulations reveal significant economic and environmental impacts stemming from changes in recycling and landfill-logistics costs. Below, we detail the results for the various scenarios grouped by the type of cost variation.

3.2.1. Effects of Recycling and Landfill Cost Changes

Individual Cost Variations

Adjusting the landfill-logistics cost has a dramatic effect on waste-management outcomes. For instance, a 10% increase in the landfill-logistics cost (from the baseline $450 to $495 per ton) causes the vast majority of concrete waste to be recycled, with 99.6% of material being diverted from landfill. In this scenario, the total concrete waste sent to landfill over 120 time steps drops to only about 4.09 million tons, and the cumulative gravel extraction is reduced to approximately 76.74 million tons (since more recycled aggregate is available to replace virgin aggregate). Conversely, a 25% decrease in the landfill-logistics cost (to $337.5) makes landfilling far more attractive economically, resulting in a recycling rate of only about 0.7%. In that case, virtually all waste goes to landfill, leading to about 39.35 million tons of landfill accumulation and a corresponding increase in total gravel extraction to roughly 112 million tons (as recycled aggregate supply plummets when recycling is not utilized).
Changes in the recycling logistics cost exhibit an analogous influence in the opposite direction. A 10% increase in the recycling logistics cost (from $445 to roughly $489.5) significantly suppresses recycling activity, and only about 41.6% of the waste is recycled under this scenario. Consequently, the landfill accumulation rises to 24.78 million tons, and total gravel extraction increases to around 97.44 million tons compared to the baseline. In contrast, making recycling logistics more economical greatly boosts recycling. For example, a 25% reduction in the recycling logistics cost (to about $333.8) yields an almost complete shift to recycling—nearly all waste is recycled in this scenario, with only 3.96 million tons ending up in landfills. Such a scenario of very low recycling cost results in a substantial decrease in landfill burden (around half of the base case landfill mass) and a corresponding reduction in the need for virgin gravel extraction.

Combined Cost Variations

When both recycling and landfill costs are altered simultaneously, the outcomes depend on the balance of those changes. If both logistics costs are reduced by 50%, the recycling rate remains high but actually dips slightly to about 87.97% (compared to 89.64% in the base case). In this scenario, because landfilling has also become much cheaper, some waste that would have been recycled in the base case is now landfilled despite the lower recycling cost. This leads to a total landfill mass of about 8.25 million tons over 120 time steps (higher than the 7.66 million tons in the base case) and a slight increase in gravel extraction due to the marginally lower use of recycled aggregate. In the opposite extreme, a simultaneous 100% increase in both landfill and recycling logistics costs (doubling each to very high levels) pushes the recycling rate up to roughly 92.42%. Here, although recycling has become more costly, landfilling has become prohibitively expensive, resulting in more waste being recycled than in the base case. The total landfill accumulation in this scenario falls to about 6.66 million tons (slightly below the base case), and the total gravel extraction is about 1% less than in the base scenario. These combined scenarios underscore a somewhat counter-intuitive result of uniformly lowering all disposal-related costs can reduce the incentive to recycle (since landfilling also becomes cheap), whereas uniformly raising costs penalizes landfilling more and thus can actually improve recycling rates and conservation of virgin materials.
Figure 5 provides a time-series comparison of the total concrete landfill mass under select scenarios against the base case. The base case (no cost change) results in 7.66 million tons of concrete in landfills over the 10-year period. The trajectory shifts notably under different cost conditions: for example, the scenario with both recycling and landfill costs doubled yields a slightly lower landfill curve, ending at 6.66 million, whereas halving both costs produces a higher curve ending at 8.25 million. The scenarios with one cost changed and not the other show even more pronounced deviations—most notably, the landfill-logistics cost-reduction scenario increases the landfill accumulation to over 39 million tons, while the recycling cost-reduction scenario drives it down to under 4 million tons. These results highlight how sensitive landfill outcomes are to the relative economics of recycling vs. disposal. In summary, making recycling financially attractive (either by raising landfill costs or lowering recycling costs) can drastically reduce landfill use, whereas making landfilling cheaper has the opposite effect, even if recycling costs also drop.
As shown in Figure 6, the knock-on effect of reducing landfill waste is a decrease in the demand for new gravel from pits, but this effect is less dramatic than the changes in landfill mass. In our model, concrete aggregate is only one of several uses for gravel, meaning that even if all concrete waste is recycled, there is still ongoing gravel extraction for other purposes (or to make up other parts of the concrete mix). Thus, while higher recycling rates do lead to lower gravel extraction, the reduction in gravel demand is moderate in comparison to the large swings in landfill usage. For instance, the scenario that nearly eliminates concrete landfilling (recycling logistics cost 25 % ) still requires some gravel extraction because recycled aggregate replaces only the coarse aggregate portion of new concrete, and other constituents (like sand or other aggregate used outside concrete production) continue to draw on natural resources. Nonetheless, every increase in recycling does correspond to some savings in gravel: the scenario with the highest recycling (and lowest landfill) shows the least gravel extracted, whereas the scenario with massive landfilling draws heavily on gravel pits.
The above findings confirm that the model behaves in line with real-world expectations that increasing the relative cost of a waste-management route tends to discourage its use. When recycling becomes cheaper (or landfills become more expensive), recycling rates climb and landfill use drops, and vice versa. Importantly, these results underscore the necessity of maintaining an optimal cost ratio between recycling and landfill options to achieve desirable outcomes—high recycling rates and minimal gravel extraction. Our analysis suggests that careful management of the balance between recycling costs and landfill costs can effectively serve as a lever to counteract inefficiencies in logistics. Even in situations where logistics costs are inherently high (for example, if transport distances are large or fuel prices surge), a well-chosen differential between landfill fees and recycling incentives can still yield high recycling uptake. In practice, this means that strategic financial planning—such as adjusting fees, subsidies, or taxes in the waste disposal system—can mitigate operational inefficiencies and ensure that sustainability goals are met. For instance, if geographical constraints make transportation costly, policymakers could increase landfill levies or provide recycling subsidies to tilt the cost ratio in favor of recycling, thereby overcoming the logistics disadvantage. In summary, managing the economic balance between recycling and landfilling emerges as a crucial strategy for promoting sustainable practices in circular construction and concrete waste management.

3.2.2. Impacts of Logistics Costs on Recycling, Landfilling, and Gravel Extraction

In addition to the scenario end-point comparisons above, our model results provide insight into the continuous relationships between cost variables and system outcomes. Figure 7, Figure 8 and Figure 9 illustrate these relationships by varying one cost factor while holding others constant.
Figure 7, Figure 8 and Figure 9 further illustrate the continuous, nonlinear relationships between logistics costs and system behavior.
As recycling logistics cost decreases, the recycling rate follows an S-shaped curve—remaining minimal above $550, but surpassing 90% when cost falls below $400. A critical tipping point lies near $485, beyond which recycling sharply accelerates. Correspondingly, landfill volume plummets from over 39 Mt to under 4 Mt as recycling becomes cheaper.
The landfill rate exhibits an inverse pattern with respect to landfill-logistics cost. When landfill transport cost is high (e.g., $490), nearly all waste is recycled. However, lowering this cost below $400 rapidly increases landfill dependence, with almost full landfilling occurring at $330.
These relationships confirm the model’s behavioral validity: disposal decisions are highly cost-sensitive, and tipping points amplify the policy impact of even modest cost shifts. Strategically adjusting either landfill fees or recycling subsidies can drive the system toward sustainable outcomes, provided the cost differential remains favorable to recycling.

3.3. Discussion and Implications

The system-dynamics modeling results reveal key nonlinear behaviors in the concrete recycling system, offering several insights for policy and practice. Most notably, we identify a strongly nonlinear relationship between cost variables and recycling or landfilling outcomes. Unlike linear assumptions in simpler models, our findings suggest that marginal changes in cost can trigger disproportionately large shifts—sometimes exponential—in system behavior. This highlights the potential for tipping points, where a critical cost differential can rapidly accelerate recycling rates. Recognizing and targeting such thresholds can inform more effective pricing strategies, such as landfill levies or recycling subsidies.
A second key insight is the importance of maintaining an optimal cost ratio between recycling and landfill disposal. The model shows that recycling can be maximized without excessive overall costs if this balance is carefully managed. Policymakers can use this information to calibrate economic levers—subsidies, fees, or taxes—so contractors are nudged toward recycling, even under varying market or operational conditions. These relationships are suitable for integration into decision-support tools, helping waste authorities predict how pricing changes will affect recycling uptake.
Beyond costs, logistics inefficiencies—such as long transport distances or outdated vehicle fleets—play a critical role. Our model shows that well-calibrated economic incentives can mitigate these inefficiencies, allowing high recycling rates even under suboptimal conditions. In the short to medium term, such incentives can offset logistics constraints, while infrastructure upgrades may gradually reduce the need for them.
However, policy changes must consider system-wide ripple effects. For instance, increasing landfill fees may unintentionally shift waste to distant recycling sites, thereby raising transport-related emissions. This calls for complementary measures—such as improved siting of recycling facilities and enhanced transport infrastructure—to ensure sustainability gains are not offset by logistical burdens.
Our modeling scope focuses on current industry norms, particularly the use of recycled aggregates in low-strength concrete. However, the framework is adaptable as it can accommodate future shifts, such as expanded use of recycled materials in high-strength applications. This flexibility makes the model a valuable tool for exploring long-term scenarios, including those driven by technological innovation or regulatory changes.
Future research could focus on optimizing logistics in tandem with economic incentives. For example, integrating route optimization tools or improving fleet efficiency could reduce transport costs and enhance the cost-effectiveness of recycling. Similarly, innovations that lower recycling process costs—whether through technology, centralized processing, or new business models—could reinforce the economic viability of circular practices.
In sum, this study advances a more integrated understanding of cost, logistics, and technology in circular construction. It offers actionable insights for designing effective, adaptive policies and underscores the importance of aligning economic instruments with infrastructure and operational strategies. Such alignment is critical for achieving a sustainable, circular economy in the construction sector.

4. Limitations and Future Research

This study, while offering new quantitative insight into concrete recycling dynamics, is subject to several limitations. First, key inputs—such as contractors’ price elasticities and average haul distances—were derived from a limited set of industry interviews and secondary reports; richer, project-level data would sharpen numerical estimates of tipping points. Second, the model is calibrated exclusively for the Sydney metropolitan area, and its transferability to regions with different regulatory regimes, infrastructure layouts, or market structures remains untested. Third, we focused on a representative N20 concrete mix and excluded other demolition materials and high-strength concrete applications, thereby abstracting from possible interactions in mixed waste streams. Fourth, landfill levies and recycling fees were treated as exogenous and time-invariant, whereas real-world policy instruments evolve and may respond endogenously to market conditions. Finally, our assessment is restricted to material flow and resource-extraction outcomes; lifecycle carbon emissions associated with transport and processing were not quantified.
Future work can address these gaps in several ways. Integrating high-resolution transport-cost datasets, time series waste statistics, and spatially explicit demolition logs would improve calibration and validate the robustness of cost thresholds. Applying the framework to other jurisdictions—such as Melbourne, Auckland, or Singapore—would facilitate cross-regional comparison and test the model’s generalizability. Coupling the system dynamics core with GIS-based facility siting and vehicle routing optimization could reveal how spatial reconfiguration of recycling infrastructure alters both economic and environmental outcomes. Incorporating agent-based or discrete choice modules would capture behavioral heterogeneity among contractors while embedding life cycle carbon accounting would allow joint evaluation of cost, material flow, and climate impacts. Finally, extending the material scope to multi-material C&D streams and high-strength recycled aggregate concrete would present a more holistic picture of circular construction strategies. Collectively, these avenues promise to enhance the predictive accuracy and policy relevance of the model, advancing efforts to achieve a fully circular construction economy.

5. Conclusions

This work developed a calibrated system dynamics model to examine how economic and logistical cost structures determine the fate of concrete demolition waste in Sydney’s construction sector. Three core insights emerge:
  • Cost tipping points. A 10% increase in landfill-logistics costs or a 25% decrease in recycling logistics costs diverts more than 95% of concrete waste to recycling, cutting cumulative landfill mass by almost one-half and lowering virgin gravel extraction by 56%.
  • Leverage for policy and industry. Aligning landfill levies, recycling subsidies, and facility-siting decisions with these thresholds offers a near-term, evidence-based pathway to accelerate circular construction goals without large infrastructure outlays.
  • Robustness and limitations. While qualitative patterns are stable, absolute magnitudes depend on spatial variability in transport distances and on contractors’ price responsiveness; parameter refinement remains a priority.
In the practical implications, the model furnishes a decision support tool for (i) policymakers to set cost differentials that nudge behavior toward recycling and (ii) firms to prioritize investments in transport optimization and recycled aggregate supply chains. While the system dynamics framework developed in this study is broadly adaptable, we caution that the specific numerical thresholds and behavioral assumptions are calibrated to the Sydney context. The effectiveness of landfill levies or recycling subsidies, for example, may vary significantly in regions with different cultural norms, legal structures, infrastructure maturity, or economic constraints. Thus, direct policy transferability is limited without local recalibration. We recommend that future applications of the model in other jurisdictions incorporate region-specific data and engage local stakeholders to account for socio-institutional variations in waste-management behavior and regulatory enforcement. Further work can involve extending the framework with geospatial optimization, heterogeneous behavioral modules, and lifecycle carbon accounting, which will sharpen its predictive accuracy and widen its applicability to multi-material demolition streams and other metropolitan contexts. In summary, the study demonstrates that modest, well-targeted fiscal measures can overcome logistical frictions, substantially reduce landfill dependency, and conserve finite resources—thereby advancing the construction sector toward a genuinely circular economy.

Author Contributions

Conceptualization, Z.W. and M.G.H.B.; Methodology, Z.W. and M.G.H.B.; Software, Z.W.; Validation, Z.W.; Writing—original draft, Z.W.; Writing—editing, M.G.H.B., J.B. and G.G.; Supervision, M.G.H.B., J.B. and G.G. All authors have read and agreed to the published version of the manuscript.

Funding

This research received no external funding.

Institutional Review Board Statement

Not applicable.

Informed Consent Statement

Not applicable.

Data Availability Statement

The data will be available upon the request.

Acknowledgments

The authors gratefully acknowledge insightful discussions on construction waste recycling with Mark Dimmock, and colleagues from Bingo Industries.

Conflicts of Interest

The authors declare no conflicts of interest.

References

  1. Babbitt, C.W.; Gaustad, G.; Fisher, A.; Chen, W.Q.; Liu, G. Closing the loop on circular economy research: From theory to practice and back again. Resour. Conserv. Recycl. 2018, 135, 1–2. [Google Scholar] [CrossRef]
  2. Murray, A.; Skene, K.; Haynes, K. The Circular Economy: An Interdisciplinary Exploration of the Concept and Application in a Global Context. J. Bus. Ethics 2017, 140, 369–380. [Google Scholar] [CrossRef]
  3. Bao, Z. Developing circularity of construction waste for a sustainable built environment in emerging economies: New insights from China. Dev. Built Environ. 2023, 13, 100107. [Google Scholar] [CrossRef]
  4. Ding, Z.; Zhu, M.; Tam, V.W.Y.; Yi, G.; Tran, C.N.N. A system dynamics-based environmental benefit assessment model of construction waste reduction management at the design and construction stages. J. Clean. Prod. 2018, 176, 676–692. [Google Scholar] [CrossRef]
  5. Luthra, S.; Mangla, S.K.; Sarkis, J.; Tseng, M.L. Resources melioration and the circular economy: Sustainability potentials for mineral, mining and extraction sector in emerging economies. Resour. Policy 2022, 77, 102652. [Google Scholar] [CrossRef]
  6. Neuhold, M. Why the Circular Economy Is Transforming Traditional Logistics; EY: London, UK, 2022. [Google Scholar]
  7. Ryfan. Construction Conundrum; Ryfan: Spruce Grove, AB, Canada, 2018. [Google Scholar]
  8. Yarra City Council. Raw Material Consumption in Construction. 2020. Available online: https://www.yarracity.vic.gov.au/residents/bins-waste-recycling-and-cleaning/recycling-and-rubbish/what-to-put-your-bins/what-you-can-recycle#:~:text=Recycling%20through%20your%20kerbside%20bins,lime%2Dgreen%20lidded%20FOGO%20bin (accessed on 4 March 2025).
  9. United Nations Environment Programme. 2021 Global Status Report for Buildings and Construction: Towards a Zero-Emission, Efficient, and Resilient Buildings and Construction Sector; Technical Report; United Nations Environment Programme: Nairobi, Kenya, 2021. [Google Scholar]
  10. Norouzi, M.; Chàfer, M.; Cabeza, L.; Jiménez, L.; Boer, D. Circular economy in the building and construction sector: A scientific evolution analysis. J. Build. Eng. 2021, 44, 102704. [Google Scholar] [CrossRef]
  11. Gasik-Kowalska, N.; Koper, A. Green Concrete Production Technology with the Addition of Recycled Ceramic Aggregate. Sustainability 2025, 17, 3028. [Google Scholar] [CrossRef]
  12. Wu, J.; Ye, X.; Cui, H. Recycled Materials in Construction: Trends, Status, and Future of Research. Sustainability 2025, 17, 2636. [Google Scholar] [CrossRef]
  13. Ghaffar, S.H.; Burman, M.; Braimah, N. Pathways to circular construction: An integrated management of construction and demolition waste for resource recovery. J. Clean. Prod. 2020, 244, 118710. [Google Scholar] [CrossRef]
  14. Kirchherr, J.; Reike, D.; Hekkert, M. Conceptualizing the circular economy: An analysis of 114 definitions. Resour. Conserv. Recycl. 2017, 127, 221–232. [Google Scholar] [CrossRef]
  15. Rios, F.C.; Grau, D.; Bilec, M. Barriers and Enablers to Circular Building Design in the US: An Empirical Study. J. Constr. Eng. Manag. 2021, 147, 1–17. [Google Scholar] [CrossRef]
  16. Friedman, A. Housing Design for Circular Economy and Sustainability. Sustainability 2025, 17, 2921. [Google Scholar] [CrossRef]
  17. Shooshtarian, S.; Maqsood, T.; Caldera, S.; Ryley, T. Transformation towards a circular economy in the Australian construction and demolition waste management system. Sustain. Prod. Consum. 2022, 30, 89–106. [Google Scholar] [CrossRef]
  18. Gonz, A.; Sendra, C.; Herena, A.; Rosquillas, M.; Vaz, D. Resources, Conservation & Recycling Advances Methodology to assess the circularity in building construction and refurbishment activities. Resour. Conserv. Recycl. Adv. 2021, 12, 200051. [Google Scholar] [CrossRef]
  19. Grupe, V.; Tollin, N.; Andreas, P.; Birkved, M.; Holmboe, T. What are the challenges in assessing circular economy for the built environment? A literature review on integrating LCA, LCC and S-LCA in life cycle sustainability assessment, LCSA. J. Build. Eng. 2022, 50, 104203. [Google Scholar] [CrossRef]
  20. McNeil-Ayuk, N.; Jrade, A. Integrating Building Information Modeling and Life Cycle Assessment to Enhance the Decisions Related to Selecting Construction Methods at the Conceptual Design Stage of Buildings. Sustainability 2025, 17, 2877. [Google Scholar] [CrossRef]
  21. Dahlbo, H.; Bachér, J.; Lähtinen, K.; Jouttijärvi, T.; Suoheimo, P.; Mattila, T.; Sironen, S.; Myllymaa, T.; Saramäki, K. Construction and demolition waste management—A holistic evaluation of environmental performance. J. Clean. Prod. 2015, 107, 333–341. [Google Scholar] [CrossRef]
  22. Ellingsen, E. Designing buildings, using biology. Scientist 2007, 3, 97–107. [Google Scholar]
  23. Australian Government Department of Climate Change Energy the Environment and Water. Waste and Resource Recovery Data Hub—National Waste Data Viewer; DCCEEW: Parramatta, NSW, Australia, 2022. [Google Scholar]
  24. Cement Concrete & Aggregates Australia. Concrete Overview; Cement Concrete & Aggregates Australia: Mascot, Australia, 2023. [Google Scholar]
  25. Tam, V.W.Y.; Soomro, M.; Evangelista, A.C.J. A review of recycled aggregate in concrete applications (2000–2017). Constr. Build. Mater. 2018, 172, 272–292. [Google Scholar] [CrossRef]
  26. Ohemeng, E.A.; Ekolu, S.O. Comparative analysis on costs and benefits of producing natural and recycled concrete aggregates: A South African case study. Case Stud. Constr. Mater. 2020, 13, e00450. [Google Scholar] [CrossRef]
  27. Zhao, Y.; Goulias, D.; Tefa, L.; Bassani, M. Life cycle economic and environmental impacts of cdw recycled aggregates in roadway construction and rehabilitation. Sustainability 2021, 13, 8611. [Google Scholar] [CrossRef]
  28. Hameed, M.; Chini, A.R. Impact of Transportation on Cost, Energy, and Particulate Emissions for Recycled Concrete Aggregate; Technical Report; University of Florida: Gainesville, FL, USA, 2013. [Google Scholar]
  29. Marinković, S.; Dragaš, J.; Ignjatović, I.; Tošić, N. Environmental assessment of green concretes for structural use. J. Clean. Prod. 2017, 154, 633–649. [Google Scholar] [CrossRef]
  30. Shooshtarian, S.; Caldera, S.; Maqsood, T.; Ryley, T. Using recycled construction and demolition waste products: A review of stakeholders’ perceptions, decisions, and motivations. Recycling 2020, 5, 31. [Google Scholar] [CrossRef]
  31. Tam, V.W.Y. Comparing the implementation of concrete recycling in the Australian and Japanese construction industries. J. Clean. Prod. 2009, 17, 688–702. [Google Scholar] [CrossRef]
  32. Alsheyab, M.A.T. Recycling of construction and demolition waste and its impact on climate change and sustainable development. Int. J. Environ. Sci. Technol. 2022, 19, 2129–2138. [Google Scholar] [CrossRef]
  33. European Environment Agency. Construction and Demolition Waste: Challenges and Opportunities in a Circular Economy; European Environment Agency: Copenhagen, Denmark, 2019. [Google Scholar] [CrossRef]
  34. Hua, C.; Liu, C.; Chen, J.; Yang, C.; Chen, L. Promoting construction and demolition waste recycling by using incentive policies in China. Environ. Sci. Pollut. Res. 2022, 29, 53844–53859. [Google Scholar] [CrossRef] [PubMed]
  35. Liu, J.; Liu, Y.; Wang, X. An environmental assessment model of construction and demolition waste based on system dynamics: A case study in Guangzhou. Environ. Sci. Pollut. Res. 2020, 27, 37237–37259. [Google Scholar] [CrossRef]
  36. Hao, J.; Yuan, H.; Liu, J.; Chin, C.S.; Lu, W. A model for assessing the economic performance of construction waste reduction. J. Clean. Prod. 2019, 232, 427–440. [Google Scholar] [CrossRef]
  37. Mak, T.M.W.; Chen, P.C.; Wang, L.; Tsang, D.C.W.; Hsu, S.C.; Poon, C.S. A system dynamics approach to determine construction waste disposal charge in Hong Kong. J. Clean. Prod. 2019, 241, 118309. [Google Scholar] [CrossRef]
  38. Wang, B.; Yan, L.; Fu, Q.; Kasal, B. A Comprehensive Review on Recycled Aggregate and Recycled Aggregate Concrete. Resour. Conserv. Recycl. 2021, 171, 105565. [Google Scholar] [CrossRef]
  39. He, L.; Yuan, H.; Wu, H. Collaborative mechanism for promoting the cross-regional management of construction and demolition waste. J. Clean. Prod. 2022, 372, 133706. [Google Scholar] [CrossRef]
  40. Forrester, J.W. System dynamics, systems thinking, and soft OR. Syst. Dyn. Rev. 1994, 10, 245–256. [Google Scholar] [CrossRef]
  41. Li, X.; Wang, C.; Kassem, M.; Liu, Y.; Ali, K. Study on Green Building Promotion Incentive Strategy Based on Evolutionary Game between Government and Construction Unit. Sustainability 2022, 14, 10155. [Google Scholar] [CrossRef]
  42. Jones, L. Vensim and the development of system dynamics. In Discrete-Event Simulation and System Dynamics for Management Decision Making; Wiley Blackwell: Hoboken, NJ, USA, 2014; Volume 9781118349, pp. 215–247. [Google Scholar] [CrossRef]
  43. Jia, S.; Liu, X.; Yan, G. Dynamic analysis of construction and demolition waste management model based on system dynamics and grey model approach. Clean Technol. Environ. Policy 2018, 20, 2089–2107. [Google Scholar] [CrossRef]
  44. Staff Writer. Demand for Concrete Expected to Rise over Next Five Years—Report. Roads & Infrastructure Magazine, 12 June 2018. [Google Scholar]
  45. Mohammadi, J.; South, W. Life cycle assessment (LCA) of benchmark concrete products in Australia. Int. J. Life Cycle Assess. 2017, 22, 1588–1608. [Google Scholar] [CrossRef]
Figure 1. Sydney concrete supply chain.
Sustainability 17 04282 g001
Figure 2. Sydney concrete production model.
Sustainability 17 04282 g002
Figure 3. Sydney concrete recycling choice model.
Sustainability 17 04282 g003
Figure 4. Gravel pit extraction.
Sustainability 17 04282 g004
Figure 5. Total Concrete Landfill under different scenarios.
Sustainability 17 04282 g005
Figure 6. Gravel Pit remain.
Sustainability 17 04282 g006
Figure 7. Impact of Recycle Logistics Cost on Recycle Rate.
Sustainability 17 04282 g007
Figure 8. Impact of Recycle Logistics Cost on Total Landfill.
Sustainability 17 04282 g008
Figure 9. Impact of Landfill-logistics cost on Landfill Rate.
Sustainability 17 04282 g009
Table 1. Equations in SD model.
VariablesTypeUnitEquations
Concrete DemandDatam3/
GB Cement DemandAuxiliaryTon ( 240 × Concrete Demand ) / 1000
Water DemandAuxiliaryTon ( 165 × Concrete Demand ) / 1000
Natural Sand DemandAuxiliaryTon ( Concrete Demand × 380 ) / 1000
Coarse Aggregates DemandAuxiliaryTon ( 1000 × Concrete Demand ) / 1000
Manufactured Sand DemandAuxiliaryTon ( 450 × Concrete Demand ) / 1000
Concrete SuppliedAuxiliarym3 GB Cement Demand / 240 + Water Demand / 165 + Natural Sand Demand / 380 + ( Coarse Aggregates Demand Recycled Aggregates / 1000 ) + Recycled Aggregates / 1000 + Manufactured Sand Demand / 450
Concrete ConstructionAuxiliaryTon MIN ( Concrete Demand , Concrete Supplied ) × Cubic Meter to Ton
Cubic Meter to TonConstant 2.235
Concrete Construction StockLevelTon Concrete Construction Concrete Demolition
Concrete DemolitionAuxiliaryTon Concrete Construction × Demolition Rate
Demolition RateAuxiliary 0.457666 × 0.5
Concrete WasteAuxiliaryTon Concrete Demolition + 1 × 10 7 × Concrete Construction
Recycling PlantAuxiliaryTon% Send to Recycle × Concrete Waste
Recycled AggregatesAuxiliaryTon Recycling Plant × Recycling Rate
Recycling RateConstant 0.9
Gravel ExtractionAuxiliaryTon Manufactured Sand Demand + Coarse Aggregates Demand Recycled Aggregates
Gravel PitLevelTon Gravel Extraction
Recycle Factory FeeConstant$80
Recycling Logistics CostConstant$445
Recycle CostAuxiliary$ New Recycled Logistics Cos t + Recycle Factory Fee
New Recycled Logistics CostAuxiliary$ Recycling Logistics Cos t + Additional Transportation Cos t
Additional Transportation CostAuxiliary$ ( 1 %   Send   to   Landfill ) × 30
Landfill FeeConstant$147
Landfill CostAuxiliary$ Landfill Fee + Landfill - Logistics Cos t
Landfill-Logistics CostConstant$450
Cost DifferentAuxiliary$ Recycle Cos t Landfill Cos t
% Send to LandfillAuxiliary 1 / ( 1 + exp ( ( 1.5869 ( 0.0829612 ) × Cos t Different ) ) )
% Send to RecycleAuxiliary 1 %   Send   to   Landfill
LandfillAuxiliary Concrete Waste × %   Send   to   Landfill + ( 1 Recycling Rate ) × Recycling Plant
Total Concrete LandfillLevel Landfill
Table 2. Scenario comparison at time step 120—cost inputs and routing shares.
ScenariosRecycling
Cost
($/t)
Landfill
Cost
($/t)
Recycling
Rate
(%)
Landfill
Rate
(%)
Landfill logistic +10%44549599.600.40
Recycling logistic +10%489.545041.5858.42
Landfill logistic −25%445337.50.7099.30
Recycling logistic −25%333.8450100.00.00
Both cost −50%222.522587.9712.03
Both cost +100%89090092.427.58
Base case44545089.6410.36
Table 3. Scenario comparison at time step 120—landfill and gravel outcomes.
ScenariosTotal
Landfill
(Mt)
Landfill
vs. Base
(ratio)
Gravel Pit
Balance
(Mt)
Gravel Ext.
vs. Base
(ratio)
Landfill logistic +10%4.090.5323.260.956
Recycling logistic +10%24.783.232.561.213
Landfill logistic −25%39.355.14−12.001.394
Recycling logistic −25%4.090.5323.380.954
Both cost −50%8.251.0819.091.007
Both cost +100%6.660.8720.680.988
Base case7.661.0019.681.000
Disclaimer/Publisher’s Note: The statements, opinions and data contained in all publications are solely those of the individual author(s) and contributor(s) and not of MDPI and/or the editor(s). MDPI and/or the editor(s) disclaim responsibility for any injury to people or property resulting from any ideas, methods, instructions or products referred to in the content.

