Article

Transition Pathways for Low-Carbon Steel Manufacture in East Asia: The Role of Renewable Energy and Technological Collaboration

1
Graduate School of International Studies, Yonsei University, Seoul 03722, Republic of Korea
2
College of Environmental Science and Engineering, Peking University, Beijing 100871, China
3
Institutes of Science and Development, Chinese Academy of Sciences, Beijing 100190, China
4
Faculty of Environment and Life, Beijing University of Technology, Beijing 100124, China
*
Author to whom correspondence should be addressed.
Sustainability 2025, 17(10), 4280; https://doi.org/10.3390/su17104280
Submission received: 18 March 2025 / Revised: 1 May 2025 / Accepted: 2 May 2025 / Published: 8 May 2025

Abstract

:
As the core region of global steel production and consumption, the zero-carbon transition of China, Japan, and South Korea is crucial for global climate goals and industrial chain sustainability. Hydrogen-based direct reduction iron (H-DRI) production, powered by renewable energy, is a promising pathway for reducing carbon emissions. This study compares the competitive dynamics of hydrogen-based steel production in China, Japan, and South Korea, with a particular focus on the levelized cost of energy (LCOE), levelized cost of hydrogen (LCOH), and levelized cost of steel (LCOS) as key metrics for evaluating the economic viability of green hydrogen-based steel production. And then compares and analyzes the competitiveness of China, Japan, and South Korea in hydrogen-based steel production, focusing on the role of green hydrogen and renewable energy in shaping the future steel industry. This study examines the impact of technological advancements, resource endowments, and policy support on H-DRI production. It highlights the importance of offshore wind power in Japan and South Korea, where its development plays a key role in reducing the cost of green hydrogen production and providing a stable electricity supply for H-DRI production. However, the high capital expenditures (CAPEXs) and labor costs associated with offshore wind power in these countries make importing relevant technologies and products from China a more cost-effective option. This study also explores the strategic importance of international cooperation and technology transfer, emphasizing the potential for China, Japan, and South Korea to strengthen bilateral collaboration in green hydrogen and H-DRI technologies. Such cooperation supports the region’s steel decarbonization efforts and enhances its global competitiveness. The integration of offshore wind power and hydrogen production technologies offers new opportunities for energy cooperation in East Asia, with China playing a key role in providing low-cost green energy solutions.

1. Background

Global climate change has emerged as one of the most urgent challenges of the 21st century. According to the Intergovernmental Panel on Climate Change (IPCC), achieving carbon neutrality globally by 2050 should limit the global temperature increase to 1.5 °C under the Paris Agreement.
The iron and steel industry (ISI), as a foundational sector, is responsible for approximately 7–9% of global CO2 emissions, making it one of the largest sources of industrial CO2 emitters [1]. In 2022, global crude steel production reached 1.885 billion tons, with an estimated 1.8 tons of CO2 emitted per ton of steel produced. The World Steel Association (WSA) reports that global steel production in 2023 was approximately 2.12 billion tons, with China accounting for about 50%, Japan for 5–6%, and South Korea for approximately 4–5%. Together, these three countries represent nearly 60% of global steel production, positioning them as critical players in the global steel market. The estimated steel-related emissions of China, Japan, and South Korea are 740 million tons, 23 million tons, and 15 million tons, respectively [2]. Consequently, the green transformation of the ISI is crucial for achieving global climate targets. As the leading steel producers, China, Japan, and South Korea are actively promoting technological innovations and policy support to facilitate the sustainable development of this sector.
To achieve this transformation, emerging green steel production technologies, such as the electric arc furnace (EAF) steel-making process, hydrogen-based direct reduction iron combined with electric arc furnace (H-DRI-EAF), and carbon capture and storage (CCS), have been developed [3]. These technologies reduce carbon emissions and optimize energy efficiency, contributing to the steel industry’s transition to low-carbon production. The existing literature has demonstrated that these technologies can enable near-zero emissions in the ISI [4,5,6]. Concurrently, the demand for zero-carbon steel is growing globally, especially in regions like Europe and North America, where there is an increasing preference for environmentally friendly products.
However, the production cost of near-zero-carbon steel remains higher than that of traditional blast furnace–basic oxygen furnace (BF-BOF) steel, primarily due to the higher costs of raw materials. Zero-carbon steel production via the H-DRI-EAF steel-making process requires a stable supply of high-grade iron ore, green hydrogen, and zero-carbon electricity, while EAF production necessitates a steady supply of scrap steel and zero-carbon electricity. The requirement for these raw materials results in higher production costs, leading steel companies to continue producing high-emission but cheaper BF-BOF steel in pursuit of greater profits. The primary raw material for the EAF steel-making process is scrap; the crude steel produced from EAF is mainly used in construction since the quality is relatively low and cannot meet the requirements of certain industries, such as the automotive sector.
Moreover, the future availability of scrap steel remains uncertain. The H-DRI-EAF process is expected to become an ideal substitute for the BF-BOF process with higher quality, particularly when affordable green electricity and green hydrogen are available.
However, variations in resource endowment, technological development, and industrialization stages have led different countries to adopt distinct pathways and strategies for H-DRI production. Increasingly, research is being conducted to reassess the location of production facilities and optimize the supply chain configurations for renewable energy, green hydrogen, and H-DRI-EAF technologies, with the aim of maximizing the use of locally available resources. Some studies have explored cost-optimized H-DRI-EAF production, primarily focusing on regions such as the UK and Northern Europe [7,8]. On a global scale, Lopez et al. [9] and others have studied the global energy demand for renewable energy-based steel production and projected decarbonization pathways for the steel sector. The common conclusion is that renewable energy will have the potential to attract industry.
Additionally, Trollip et al. assessed opportunities for supplying near-zero-carbon iron from South Africa to Europe [10]. And the potential of Australia to emerge as a near-zero-carbon steel producer has also been widely explored [11,12]. A common assumption across these studies is that the future scale of production will be linked to the location of existing production facilities. Historically, steel manufacturing sites have been strategically situated near resources such as iron ore deposits or ports [13]. However, the future geographical location of zero-carbon steel production also relies on climate and geological conditions that can support renewable energy-based production. As such, regions with abundant and affordable renewable energy resources will be crucial in supporting zero-carbon steel production.
Despite the significant role of China, Japan, and South Korea in global steel production, there is a lack of detailed analysis on the potential for future zero-carbon steel production in these countries, considering regional resource differences. Research in China has already demonstrated that the steel industry can achieve near-zero emissions by 2050, largely driven by the rapid expansion of renewable energy [4,5]. Australia, with its abundant renewable energy resources, particularly solar and wind energy, has the potential to generate approximately 5.29 gigawatts of energy [14], offering sustainable solutions for remote regions with high electricity transmission costs and meeting local energy needs.
However, Japan and South Korea face natural resource constraints that limit their potential for renewable energy development relative to China. Consequently, Japan and South Korea are more likely to import zero-carbon products such as green hydrogen or green steel from countries like Australia [11,15,16]. However, the long transportation distances involved significantly increase costs. At present, renewable energy development in Japan and South Korea is primarily focused on solar energy, but research suggests that offshore wind energy may become a more competitive technology. This could offer additional potential for green electricity production in the coastal regions of Japan and South Korea. Simultaneously, China, with its potential to produce inexpensive green electricity, green hydrogen, and green steel, and its geographical proximity to Japan and South Korea, may emerge as a more economical source for importing these products [4,5].
As global concern about climate change intensifies, the steel industry, as a major source of carbon emissions, faces substantial pressure to reduce its emissions. In response to this challenge, the H-DRI-EAF steel-making process, alongside green energy (green electricity and green hydrogen), is considered one of the key pathways for achieving a low-carbon transition in the steel sector.
Therefore, this study aims to fill the gap in the existing literature by examining how different technological choices impact the economic feasibility of H-DRI production across various regions. Specifically, this research tests the hypothesis that the combination of abundant renewable energy resources and cost-effective technologies can enhance the cost-effectiveness and potential of the H-DRI-EAF production and consumption chain in China, Japan, and South Korea. The H-DRI-EAF supply chain configurations are set for representative time periods (2020–2050) and varied according to the spatial location of raw material supply, with each configuration covering renewable energy supply, green hydrogen supply, and transportation. This study offers valuable insights for future technological, commercial, and policy decisions in China, Japan, and South Korea.

2. Methodology

This chapter constructs a model for the international minimum production cost of H-DRI-EAF in the ISI, aiming to explore the production competitiveness of H-DRI-EAF in China, South Korea, and Japan under the carbon neutrality target, as well as how international transportation can facilitate a more cost-effective H-DRI-EAF production method.
According to the study by Jiang et al. [17] Inner Mongolia, Fujian, and the western regions of China are expected to become the main H-DRI-EAF production bases [16]. In South Korea, most of the crude steel is produced in Busan (POSCO), which is also the largest port city in the country. In Japan, steel production is primarily concentrated in the Tokyo Bay, Nagoya, and Hiroshima regions. Therefore, this study assumes that the future production of H-DRI-EAF will involve both local production and imports. By calculating the levelized steel-making costs for the three countries and combining them with a transportation model, this study further derives the future capacity layout of zero-carbon steel production in major East Asian countries.

2.1. Scenario Setting

Renewable energy plays a critical role in shaping the scenario settings for the H-DRI and EAF steel-making processes. The cost of renewable energy largely depends on technological advancements. As these technologies mature, the cost of renewable energy is expected to significantly decline. By 2050, ISI is projected to achieve near-zero emissions, and the development of renewable energy technologies will be a critical factor influencing the cost of zero-carbon steel production. Varying degrees of technological progress will lead to different production pathways toward zero-carbon steel.
In the baseline scenario, we assume that the costs of offshore wind projects will moderately decrease over the coming decades, based on estimates from the U.S. National Renewable Energy Laboratory (NREL). Many studies have shown that technological progress is happening faster than expected [18]. Furthermore, research in China has confirmed that the cost of technologies manufactured in China will significantly decrease in the future. As a result, neighboring countries are likely to be attracted by the lower technology costs and choose to purchase these technologies. Therefore, in the advanced scenario, Japan and South Korea are expected to adopt Chinese technologies, leading to even greater cost reductions.
Baseline Scenario: This refers to the technological progress in China, Japan, and South Korea following the paths outlined by their respective national policies.
Advanced Scenario: This scenario assumes that China’s related technologies rapidly progress and its international influence grows. In this scenario, Japan and South Korea choose to adopt the fast-developing technologies from China to produce H-DRI-EAF, thereby significantly reducing the investment costs of various technologies and raw material consumption. The key descriptions of the scenarios are shown in Table 1.

2.2. Model Description

The levelized cost was proposed by the National Renewable Energy Laboratory (NREL) in the United States in 1995. It was initially used to calculate the cost of electricity generation after leveling the costs and power generation over the project’s lifecycle. Specifically, it is the present value of the total cost over the lifecycle divided by the present value of the electricity generated during the same period. The levelized cost of energy (LCOE) is widely used for comparing electricity generation technologies [18]. This study uses the LCOE to represent the energy (renewable electricity) supply cost for steel production and green hydrogen production. Based on different levels of LCOE, the levelized cost of green hydrogen (LCOH) and the levelized cost of steel (LCOS) are calculated. Finally, the international transportation LCOS is computed by combining these with the international transportation cost matrix.
LCOE = C A P E X t + O P E X t A n n u a l   e l e c t r i c i t y   p r o d u c t i o n = C A P E X i , t + t = 1 n O P E R X ( 1 + j ) t t = 1 n A n n u a l   e l e c t r i c i t y   p r o d u c t i o n ( 1 + j ) t
The LCOE for China is derived from the existing literature [19]. The future potential for offshore wind energy in Japan and South Korea is expected to significantly grow. The LCOE of offshore wind power will greatly influence the LCOH in the future. The assessment of available wind energy resources is crucial for the development of offshore wind farms [20,21,22].
The relevant wind energy data are sourced from local meteorological monitoring towers, with the assumption that long-term wind speed and wind direction will not undergo significant changes. Satellite observation data, numerical simulation methods, and reanalysis data are also extensively used to estimate the available wind energy resources. The technical parameters for offshore wind energy production, such as wind speed, wind direction, turbine specifications (e.g., cut-in wind speed, cut-out wind speed, and turbine capacity), and distance from the coastline, are provided by relevant studies. Furthermore, studies have also evaluated the installation costs of wind turbines, infrastructure costs, and electrical cable installation costs to assess the economic feasibility of offshore wind farms [23,24,25].
The capital expenditure (CAPEX) of an offshore wind power project mainly includes equipment procurement and installation, construction engineering costs, other expenses (such as sea area usage fees and project construction management fees), and interest costs during the construction period. In wind power projects, equipment procurement and installation engineering costs typically account for 75% to 80% of the total investment, with equipment procurement costs accounting for about 65% to 70% of the total investment. And the construction costs and other expenses each account for approximately 10% of the total investment [26,27]. Additionally, the cost of offshore wind power projects is influenced by various factors, such as the project’s location, water depth, distance from the coast, and marine environmental conditions.
The operation and maintenance costs (OPERXs) of offshore wind power projects primarily include maintenance, insurance, wages, etc. The insurance premium rate is generally set at 0.25% of the total investment [28]. According to wind power design standards, the maintenance rate (including parts, materials, repair, and maintenance costs) should be between 1.5% and 2.0% [29]. This study assumes that in the future, wind power technologies in China will expand into international markets due to their lower costs. Therefore, Japan and South Korea are expected to adopt Chinese wind power technologies in order to save fixed costs. However, due to higher labor costs in Japan and South Korea, it is assumed that the operation and maintenance cost rate will be 4%.
The capacity parameters are a key factor to calculate the LCOE of offshore wind power projects, primarily involving installed capacity, expected annual utilization hours, and the power plant’s self-utilization rate. The expected annual utilization hours of the project are set based on the average annual utilization hours of typical offshore areas in China, Japan, and South Korea. The key parameter to calculate the LCOE is shown in Table 2. In addition, the self-utilization rate of the power plant is set to 2% in this study.
The LCOH is primarily determined by the LCOE and the operating efficiency of the electrolyzer. The electrolyzer’s operational lifetime is set to 20 years, with complete replacement of the equipment upon reaching the specified service life.
This study does not consider energy storage issues nor the coupling with wind power. Therefore, the electrolyzer’s operating hours are aligned with the wind energy generation hours, ranging from 2500 to 3200 h. The electricity cost is calculated based on the LCOE in different nations, and labor costs are assumed based on the employment of a full-time worker. The water consumption is assumed to be 12 kg of water required to produce 1 kg of hydrogen. Maintenance and other operational costs are assumed to be 2% and 1% of the capital cost, respectively [30,31].
The LCOH is given as the following equation, and the relevant parameters are shown in Table 3.
LCOH = C A P E X t + O P E X t + E l e c t r i c i t y t A n n u a l   h y d r o g e n   p r o d u c t i o n
The LCOS of H-DRI-EAF is mainly determined by the iron ore, industrial electricity prices, and LCOH. The high-grade iron ore required for H-DRI-EAF is currently primarily imported from Australia and Brazil [32], and the imported price comes from the nations’ database. EAF is the main production equipment. Currently, since EAF requires preheating, it can only operate in a continuous working state, so the electricity supply for this part comes from the local power grid. Studies indicate that the electricity grids of China, Japan, and South Korea will achieve zero carbon emissions by 2050. Compared to BF-BOF ironmaking technology, the H-DRI-EAF production technology has a lower cost and has been proven to have little impact on the LCOS. Therefore, it is assumed that the CAPEX of H-DRI-EAF remains unchanged, and the OPEX is 2% of the CAPEX. The data required for the related CAPEX are shown in Table 4, and the LCOS calculation is as follows:
LCOS = C A P E X t + O P E X t + M a t e r i a l t + E l e c t r i c i t y g t A n n u a l   s t e e l   p r o d u c t i o n

2.3. H-DRI Transport

Dry bulk carriers are used to transport iron ore or steel. The Panamax vessels are widely used for transportation since they are classified as a minor bulk commodity. The prices from relevant international shipping companies indicate that transportation over longer distances results in higher unit transportation costs.

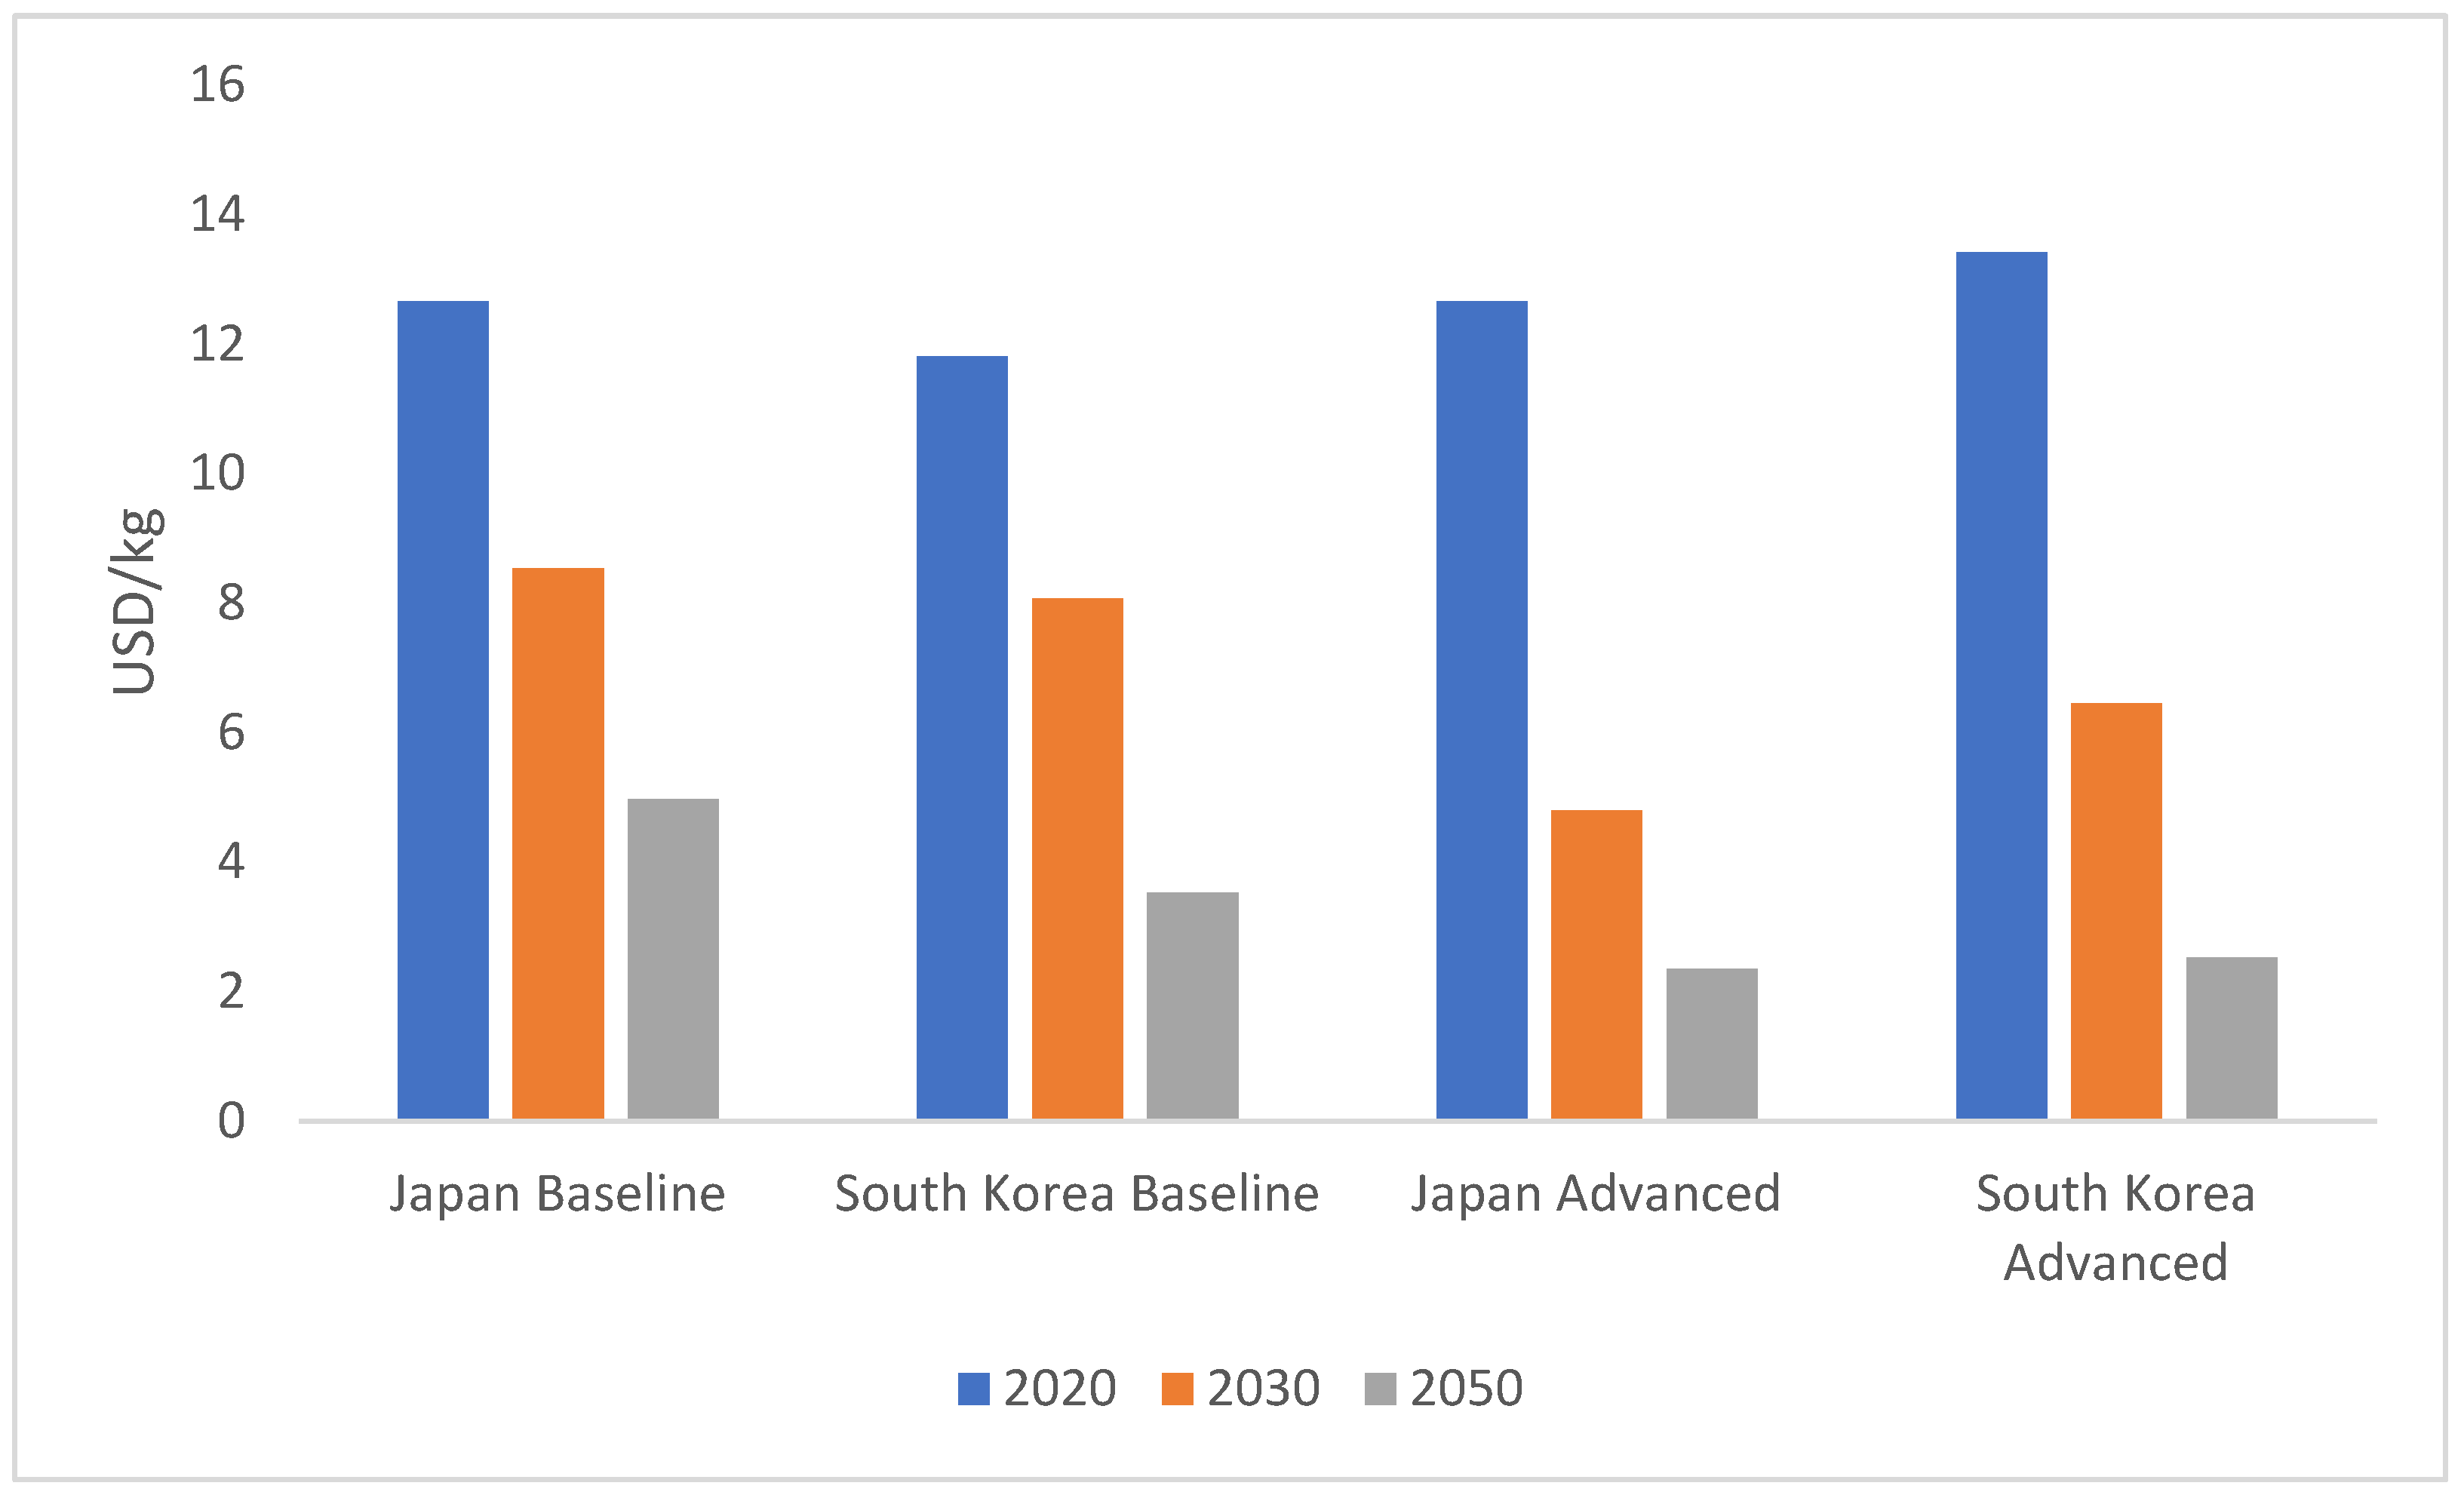
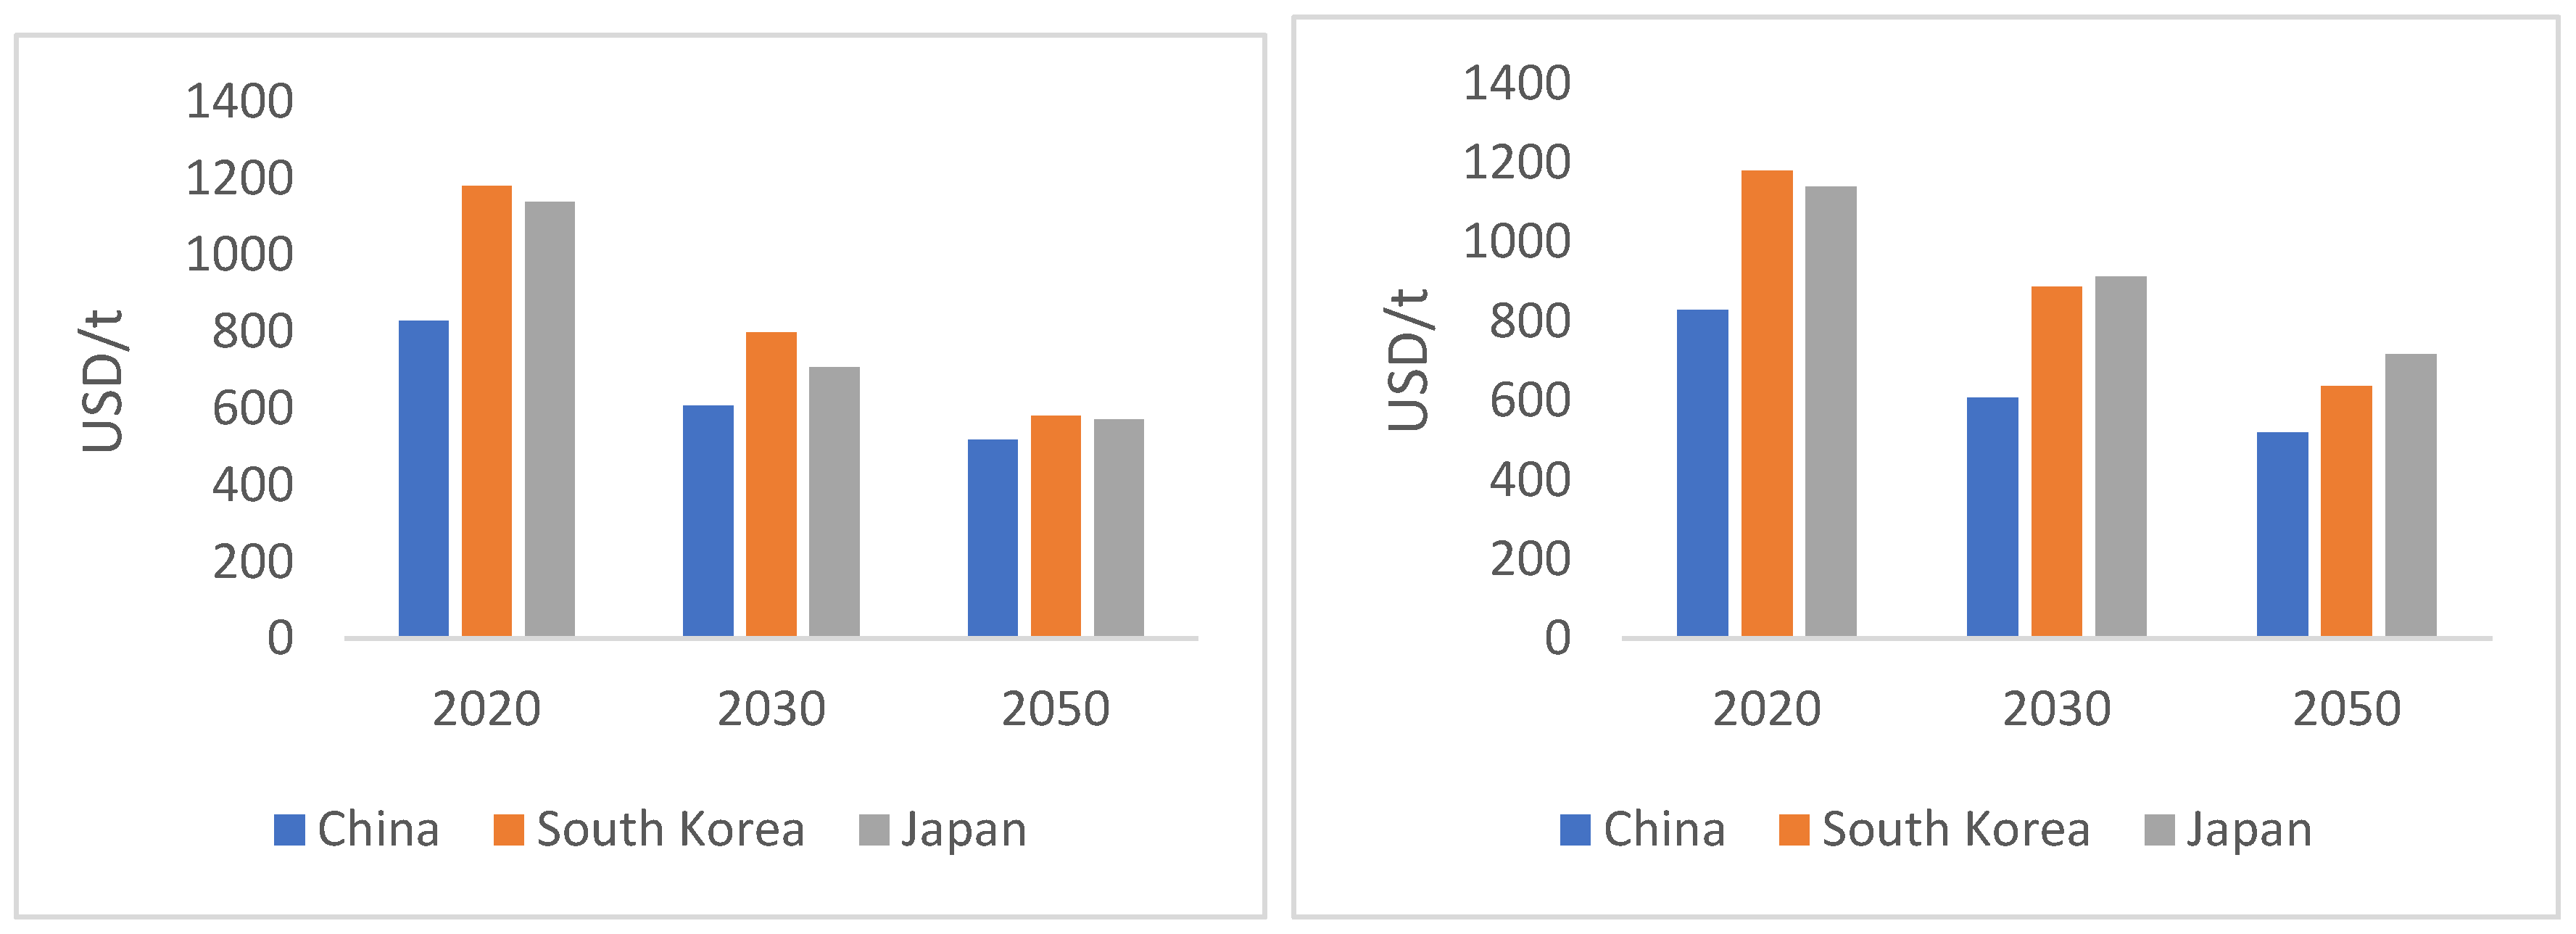
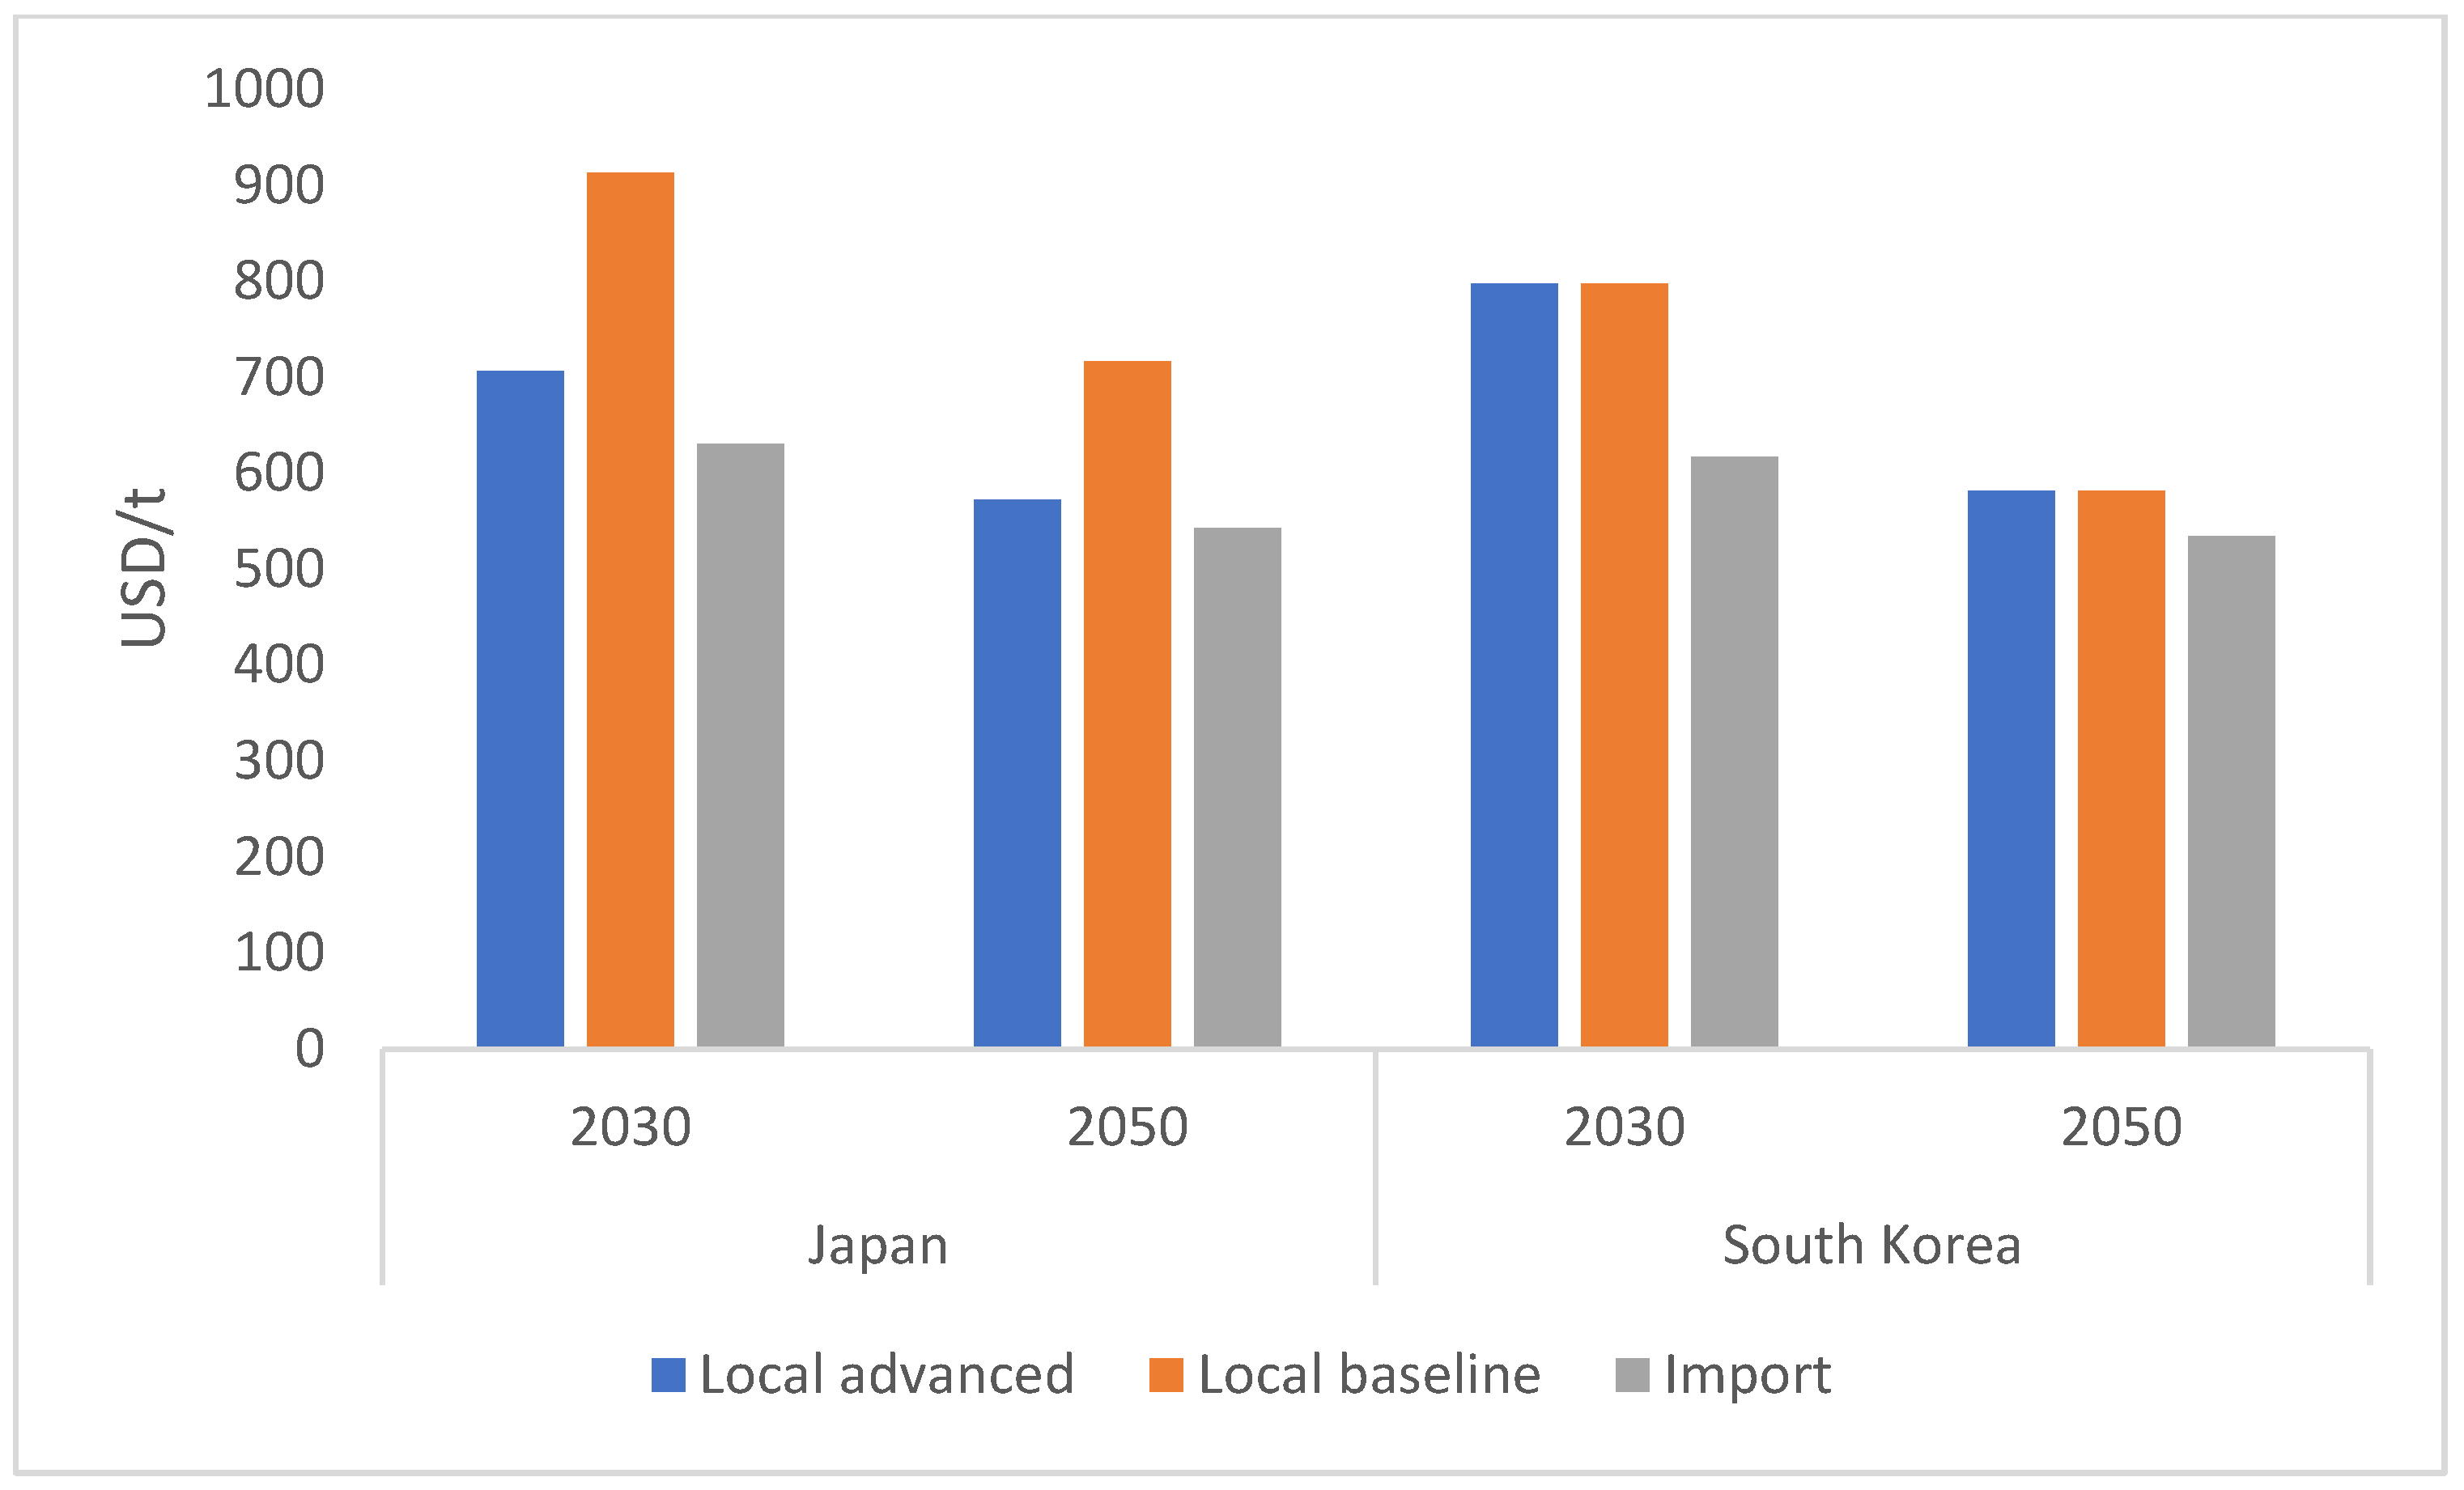
3. Results and Discussion

The decline in future technology CAPEX is already confirmed. While the exact extent of the decrease is difficult to estimate, there is evidence to suggest that the actual reduction rates for the LCOS and LCOH are faster than the results predicted in the literature.
Figure 1 indicates the changes in the LCOS for Japan and South Korea, which are clearly evident. As the technology CAPEX decreases, the LCOS also experiences a significant reduction. In all scenarios, offshore wind energy in Japan and South Korea is expected to demonstrate a clear cost advantage compared to other renewable energy technologies.
In the Baseline scenario, compared to 2020, Japan’s LCOS in 2030 and 2050 will decrease by approximately 25% and 50%, respectively. South Korea’s LCOS in 2030 and 2050 will decrease by 23% and 56%, respectively.
In the advanced scenario, with the introduction of China’s offshore wind technology, the LCOS in Japan and South Korea is expected to even more significantly decrease. Compared to 2020, Japan’s LCOS in 2030 and 2050 will decrease by approximately 60% and 75%, respectively. South Korea’s LCOS in 2030 and 2050 will decrease by 46% and 70%, respectively.
The current study also indicated that South Korea’s offshore wind energy LCOE will drop by 40% by 2025 and 55% by the end of 2035 with cost reductions gained from experience and economies of scale [33]. This aligns with our calculation results, confirming the inevitability of a significant reduction in the LCOS for offshore wind energy in the future.
Figure 2 illustrates the future LCOH for Japan and South Korea. With the decline in the CAPEX and LCOE, the LCOH also shows a significant reduction. In Japan, under the baseline scenario, the LCOH is expected to decrease by 30% in 2030 and 60% in 2050. In the advanced scenario, the LCOH will decrease by 60% in 2030 and 80% in 2050. The Japanese government has set a low-carbon hydrogen supply price target, predicting that the price will be USD 3 per kilogram in 2030 and decrease to USD 2 per kilogram by 2050 [34]. According to the International Energy Agency, the cost of producing green hydrogen from renewable energy in Japan is expected to be USD 6 per kilogram in 2030 due to the high renewable electricity costs in Japan [35]. The results show that this target can only be achieved in the advanced scenario. South Korea’s LCOH reduction pathway is similar to that of Japan, and under the advanced scenario, South Korea could achieve approximately USD 2 per kilogram of green hydrogen production by 2050.
Some regions in China have abundant renewable energy resources. In 2023, the cost of solar hydrogen production in Inner Mongolia has reached 2.7 USD/kg, and it is expected that by 2050, the LCOH will decrease to 1.3 USD/kg. In the production of H-DRI, it is undeniable that the expensive green hydrogen impacts the LCOS.
Figure 3 shows the difference in the LCOS between China, Japan, and South Korea under the advanced scenario (left) and baseline scenario (right). It is clearly visible that as the LCOH decreases, the gap in the LCOS between Japan, South Korea, and China decreases. Especially in the advanced scenario, the LCOS among the three countries is not significant.
Figure 4 illustrates the cost difference between locally produced H-DRI in Japan and South Korea and H-DRI imported from China in 2030 and 2050. Since China is geographically closer to Japan and South Korea, the shipping costs are relatively low.
In the baseline scenario, the LCOS of locally produced H-DRI in Japan and South Korea is significantly higher than that of China’s LCOS in both years, making it more cost-effective to import H-DRI produced in China for steel production. However, in the advanced scenario, the cost difference between locally produced and imported H-DRI becomes smaller, reducing the advantage of importing from China in both years.
Figure 5 shows the cost structure of the LCOS for local production and importation of H-DRI in Japan and South Korea under the advanced scenario. It is evident that the decrease in the LCOH has reduced the LCOS. Notably, while the reduction in the LCOE leads to a decrease in the LCOH, it does not directly affect the LCOS in this study. The main reason is that the EAF needs to continuously operate because it requires a large amount of heat during its operation, with temperatures typically ranging from 1600 °C to 1800 °C. Continuous operation significantly saves energy. Therefore, the proportion of electricity costs in the LCOS does not decrease with the reduction in the LCOE. Since there is a significant potential for a reduction in the LCOS of renewable energy electricity in the future, it is possible that EAFs could be directly connected to renewable energy systems, enabling the use of lower-cost renewable energy.
Based on the result, the reduction in the LCOS is primarily attributed to the decrease in the LCOE of offshore wind power. Renewable energy-driven hydrogen production plays a critical role in the decarbonization of various industries. In South Korea, approximately 70% of the land is mountainous, which limits the available arable land for wind energy development. Given these geographic constraints, the development of offshore wind farms in proximity to the Korean peninsula is widely regarded as an essential measure for achieving the nation’s renewable energy targets. Offshore wind power generation presents significant advantages, as the installation of wind turbines at sea yields higher energy production due to the superior quality of wind resources offshore compared to onshore [36,37]. South Korea benefits from substantial offshore wind energy potential, largely due to its extensive coastline and favorable geographical positioning. With the nation surrounded by the sea on three sides, its coastline stretches approximately 12,000 km, with the western and southern coasts identified as key areas for offshore wind power development. Similarly, Japan ranks sixth globally in terms of marine area, with offshore wind energy potential estimated at 1600 GW [38]. According to the U.S. Department of Energy, numerous floating offshore wind farms are currently being planned in East and Southeast Asia, including projects in mainland China (68 MW), Japan (1028 MW), and South Korea (9457 MW). While cost remains the primary challenge for energy developers, this study demonstrates that the significant reduction in the cost of relevant technologies in China will make a substantial contribution to advancing offshore wind power development in Japan and South Korea. Moreover, with access to affordable renewable energy, both Japan and South Korea can expect a marked reduction in the LCOH and LCOS.
In 2030, the hydrogen cost for locally produced H-DRI in Japan and South Korea accounts for the highest proportion of the LCOS. However, by 2050, iron ore becomes the main factor contributing to the high cost of H-DRI. High-grade iron ore is required for H-DRI production. High-grade iron ore contains a higher percentage of iron, which means less hydrogen is needed for reduction, helping to reduce energy consumption and improve production efficiency. Currently, the reserves of high-grade iron ore are limited, and some studies indicate that the available reserves of high-grade iron ore may not be sufficient to support global H-DRI production. However, some industry experts suggest that there may be potential to replace it with low-grade iron ore, which could lead to more economical H-DRI production and reduce reliance on imported resources.
The H-DRI steel-making process plays a crucial role in reducing emissions within the ISI. When using green hydrogen and renewable electricity, the H-DRI production process can achieve net-zero carbon emissions. According to Oda et al. [39], due to the global shortage of scrap steel supply, EFS will be unable to meet the future demand for crude steel. In this situation, how to produce and consume affordable, clean H-DRI will be a key direction to study.
An increasing number of studies suggest the possibility of future industrial migration. The consensus reached is that industries will migrate to regions with abundant renewable energy resources. While Japan and South Korea are industrialized countries, they are relatively poor in natural resources. This is true not only for key mineral resources such as iron ore, coal, and natural gas, but also, due to the limited land resources, large-scale solar energy installations are not feasible.
Therefore, the economic production of H-DRI in the future will depend on technological advancements or international imports.
To effectively promote the deployment of hydrogen-based steel-making technologies across East Asia, international technical cooperation will play a vital role. In addition to bilateral dialogues, mechanisms such as regional policy coordination, joint research and demonstration projects, and the establishment of a technology-sharing platform can help align standards, reduce duplication of efforts, and lower the overall cost of innovation.
Japan and Australia have extensive cooperation in many fields, including energy, technology, and economics, especially in clean energy and green hydrogen. With Australia’s abundant renewable energy resources and Japan’s commitment to developing a hydrogen economy, the cooperation between the two countries is becoming increasingly close. Relevant research has also demonstrated the potential for importing hydrogen and H-DRI from Australia to Japan [15,40]. However, Australia’s solar energy LCOE is still higher than that of China, as the procurement of photovoltaic modules mainly relies on imports, which results in higher costs for its PV systems. This leads to both higher LCOH in Australia and higher LCOS for H-DRI production compared to China. Furthermore, research by Cao et al. also indicates that the transportation cost of H-DRI from Australia to Japan is high. According to the International Energy Agency [35], the cost of transporting low-carbon hydrogen from Australia to Japan by 2030 is estimated to be USD 5.5 per kilogram. These estimates suggest that reducing transportation costs will be challenging. Therefore, relying on local production of green hydrogen with low-cost LCOS or directly importing H-DRI from China will be a more economical option for Japan and South Korea.
Another reason Japan and South Korea’s LCOE, LCOH, and LCOS are higher than China’s is the relatively high labor costs, particularly in the installation and maintenance of relevant equipment. However, with the advancement of technology and AI, the future industrial production chain can achieve automation through robotics, which will significantly reduce costs.
The decarbonization of the ISI exhibits profound and multifaceted synergies with the United Nations’ Sustainable Development Goals (SDGs). Advanced decarbonization strategies implemented through industrial sustainability innovation demonstrate substantial contributions toward achieving SDG 7 (Affordable and Clean Energy), SDG 9 (Industry, Innovation, and Infrastructure), SDG 12 (Responsible Consumption and Production), and SDG 13 (Climate Action). Furthermore, the trilateral technology-sharing mechanism established among China, Japan, and South Korea exemplifies effective implementation of SDG 17 (Partnerships for the Goals). This systemic transformation has engendered an integrated implementation framework that creates a positive feedback loop connecting industrial decarbonization, energy system transition, and workforce transformation, representing a novel paradigm for SDGs’ attainment in heavy industries.

4. Conclusions

This study calculated and compared the LCOE, LCOH, and LCOS for China, Japan, and South Korea.
This study reached the following conclusions:
The renewable power-based H-DRI steel-making process will drive the decarbonization of ISI, fundamentally transforming the traditional supply chain. In addition to technological transfer, global steel trade means that the geographical distribution of resources is closely linked to the decarbonization process in the industry.
Technological and resource differences have a certain impact on H-DRI production. The competitiveness of China, Japan, and South Korea in H-DRI production is mainly determined by their respective resource endowments, technological development levels, and policy support.
The role of offshore wind power in promoting the H-DRI in Japan and South Korea. Due to their geographical advantages, both Japan and South Korea have large potential for offshore wind power development. Currently, the high CAPEX and labor costs for offshore wind power in Japan and South Korea remain expensive, and importing relevant technology from China can be an effective pathway to reduce costs.
Due to the relative scarcity of natural resources in Japan and South Korea, they are forced to import relevant products. While the transportation cost of green hydrogen remains high, the transportation cost of H-DRI and wind equipment is lower, allowing Japan and South Korea more freedom to choose the goods they import.

Author Contributions

Conceptualization: W.J.; methodology, W.J. and T.J. and H.D.; software: W.J.; validation, T.J.; formal analysis, W.J. and P.X., investigation, W.J., T.J. and S.C.; resources, W.J.; data curation, W.J. and P.X.; writing—original draft preparation, W.J.; writing—review and editing, T.J.; visualization, S.C.; supervision, T.J. and H.D. All authors have read and agreed to the published version of the manuscript.

Funding

This work is part of a project that is supported by the Global Energy Interconnection Group Co., Ltd. under grant No. [SGGE0000JJJS2400070].

Institutional Review Board Statement

Not applicable.

Informed Consent Statement

Not applicable.

Data Availability Statement

The original contributions presented in this study are included in the article. Further enquiries can be directed to the corresponding author.

Conflicts of Interest

The authors declare no conflict of interest.

References

  1. Zhang, J.; Shen, H.; Chen, Y.; Meng, J.; Li, J.; He, J.; Guo, P.; Dai, R.; Zhang, Y.; Xu, R.; et al. Iron and steel industry emissions: A global analysis of trends and drivers. Environ. Sci. Technol. 2023, 57, 16477–16488. [Google Scholar] [CrossRef] [PubMed]
  2. Worldsteel. Crude Steel Production and 2023 Global Crude Steel Production Totals. 2023. Available online: https://worldsteel.org/ (accessed on 1 January 2025).
  3. Zhang, X.; Jiao, K.; Zhang, J.; Guo, Z. A review on low carbon emissions projects of steel industry in the World. J. Clean. Prod. 2021, 306, 127259. [Google Scholar] [CrossRef]
  4. Jiang, W.; Jung, T.; Dai, H.; Xiang, P. Technology portfolio assessment for near-zero emission iron and steel industry in China. Adv. Clim. Change Res. 2023, 143, 469478. [Google Scholar] [CrossRef]
  5. Ren, M.; Lu, P.; Liu, X.; Hossain, M.; Fang, Y.; Hanaoka, T.; O’Gallachoir, B.; Glynn, J.; Dai, H. Decarbonizing China’s iron and steel industry from the supply and demand sides for carbon neutrality. Appl. Energy 2021, 298, 117209. [Google Scholar] [CrossRef]
  6. Ren, L.; Zhou, S.; Peng, T.; Ou, X. A review of CO2 emissions reduction technologies and low-carbon development in the iron and steel industry focusing on China. Renew. Sustain. Energy Rev. 2021, 143, 110846. [Google Scholar] [CrossRef]
  7. Pimm, A.; Cockerill, T.; Gale, W. Energy system requirements of fossil-free steelmaking using hydrogen direct reduction. J. Clean. Prod. 2021, 312, 127665. [Google Scholar] [CrossRef]
  8. Toktarova, A.; Göransson, L.; Johnsson, F. Design of clean steel production with hydrogen: Impact of electricity system composition. Energies 2021, 14, 8349. [Google Scholar] [CrossRef]
  9. Lopez, G.; Farfan, J.; Breyer, C. Trends in the global steel industry: Evolutionary projections and defossilisation pathways through power-to-steel. J. Clean. Prod. 2022, 375, 134182. [Google Scholar] [CrossRef]
  10. Trollip, H.; McCall, B.; Bataille, C. How green primary iron production in South Africa could help global decarbonization. Clim. Policy. 2022, 22, 236–247. [Google Scholar] [CrossRef]
  11. Gielen, D.; Saygin, D.; Taibi, E.; Birat, J. Renewables-based decarbonization and relocation of iron and steel making: A case study. J. Ind. Ecol. 2020, 24, 1113–1125. [Google Scholar] [CrossRef]
  12. Wood, T.; Dundas, G.; Ha, J. Start with Steel. 2020. Available online: https://grattan.edu.au/wp-content/uploads/2020/05/2020-06-Start-with-steel.pdf (accessed on 1 January 2025).
  13. Devlin, A.; Kossen, J.; Goldie-Jones, H.; Yang, A. Global green hydrogen-based steel opportunities surrounding high quality renewable energy and iron ore deposits. Nat. Commun. 2023, 14, 2578. [Google Scholar] [CrossRef] [PubMed]
  14. GeoScience_Australia. Australian Energy Resource Assessment. 2014. Available online: https://arena.gov.au/assets/2018/08/australian-energy-resource-assessment.pdf (accessed on 1 January 2023).
  15. Cao, T.; Sugiyama, M.; Ju, Y. Prospects of regional supply chain relocation for iron & steel industry decarbonization: A case study of Japan and Australia. Resour. Conserv. Recycl. 2024, 209, 107804. [Google Scholar]
  16. Choi, H.; Lee, H.; Han, J.; Roh, K. Revisiting the cost analysis of importing liquefied green hydrogen. Int. J. Hydrog. Energy 2024, 82, 817–827. [Google Scholar] [CrossRef]
  17. Jiang, W. Decarbonization Pathways, Regional Layout Analysis of Chinese Iron and Steel Industry Under Carbon Neutrality Goals. Ph.D. Thesis, Yonsei University, Seoul, Republic of Korea, 2025. Available online: https://library.yonsei.ac.kr/search/detail/CATTOT000002229499 (accessed on 24 February 2025).
  18. Karim, S.; Faissal, A. National renewable energy laboratory. In Handbook of Algal Biofuels; Elsevier: Amsterdam, The Netherlands, 2022; pp. 599–613. [Google Scholar]
  19. Jiang, K.; Xiang, P.; He, C.; Feng, S.; Liu, C.; Tan, X.; Chen, S.; Dai, C.; Deng, L. Analysis of the impact of zero carbon power on China’s industrial sector layout. Glob. Energy Internet 2021, 4, 511. [Google Scholar] [CrossRef]
  20. Shields, M.; Beiter, P.; Nunemaker, J.; Cooperman, A.; Duffy, P. Impacts of turbine and plant upsizing on the levelized cost of energy for offshore wind. Appl. Energy 2021, 298, 117189. [Google Scholar] [CrossRef]
  21. Lee, J.; Xydis, G. Floating offshore wind projects development in South Korea without government subsidies. Clean Technol. Environ. Policy 2024, 26, 1587–1602. [Google Scholar] [CrossRef]
  22. Song, S.; Lin, H.; Sherman, P.; Yang, X.; Nielsen, C.P.; Chen, X.; McElroy, M. Production of hydrogen from offshore wind in China and cost-competitive supply to Japan. Nat. Commun. 2021, 12, 6953. [Google Scholar] [CrossRef]
  23. Johnston, B.; Foley, A.; Doran, J.; Littler, T. Levelised cost of energy, A challenge for offshore wind. Renew. Energy 2020, 160, 876–885. [Google Scholar] [CrossRef]
  24. Martinez, A.; Iglesias, G. Site selection of floating offshore wind through the levelised cost of energy: A case study in Ireland. Energy Convers. Manag. 2022, 266, 115802. [Google Scholar] [CrossRef]
  25. Yoon, S.; Kim, S.; Yoon, G.; Yi, J. Comparison of LCOE of the Southwest Offshore Wind Farm According to Types and Construction Methods of Supporting Structures. J. Korean Soc. Coast. Ocean. Eng. 2023, 35, 57–66. [Google Scholar] [CrossRef]
  26. Hussein, N.; Abokersh, M.; Christoph, K.; Schlegl, T. Electricity Cost from Renewable Energy Technologies in Egypt; Raunhofer Institute for Solar Energy Systems ISE: Freiburg, Germany, 2016. [Google Scholar]
  27. Tu, C. Economic Analysis and Development Policy Research of Wind Power Projects. Master’s Thesis, North China Electric Power University, Beijing, China, 2019. [Google Scholar]
  28. Kost, C.; Shammugam, S.; Fluri, V.; Peper, D.; Memar, A.D.; Schlegl, T. Levelized Cost of Electricity Renewable Energy Technologies; Fraunhofer ISE: Freiburg, Germany, 2021. [Google Scholar]
  29. Wang, Y. Technology cost curve for climate change mitigation in electric power sector. In Low Carbon Technology and Policy in China Power Sector; Kwan Kung Press: Beijing, China, 2011. [Google Scholar]
  30. Minutillo, M.; Perna, A.; Forcina, A.; Di Micco, S.; Jannelli, E. Analyzing the levelized cost of hydrogen in refueling stations with on-site hydrogen production via water electrolysis in the Italian scenario. Int. J. Hydrogen Energy 2021, 46, 13667–13677. [Google Scholar] [CrossRef]
  31. Xiang, P.; Jiang, K.; Wang, J.; He, C.; Chen, S.; Jiang, W. Evaluation of LCOH of conventional technology, energy storage coupled solar PV electrolysis, and HTGR in China. Appl. Energy 2024, 353, 122086. [Google Scholar] [CrossRef]
  32. Millner, R.; Rothberger, J.; Rammer, B.; Boehm, C.; Sterrer, W.; Ofner, H.; Chevrier, V. MIDREX H2—The Road to CO2-Free Direct Reduction. In Proceedings of the AISTech, 2021, Nashville, TN, USA, 29 June–1 July 2021; 2021. [Google Scholar]
  33. Robert, L. South Korea Offshore Wind Market Overview. Analyst Presentation. 2017. Available online: https://www.asiawind.org/wp-content/uploads/2018/01/07-MAKE-Consulting-Robert-Liew-20-slides.pdf (accessed on 1 January 2025).
  34. The Ministry of Economy Trade and Industry of Japan (METI). The Strategic Road Map for Hydrogen and Fuel Cells. 2019. Available online: https://www.eu-japan.eu/sites/default/files/publications/docs/hydrogen_and_fuel_cells_in_japan.pdf (accessed on 26 February 2025).
  35. IEA. International Energy Agency. Offshore Wind Outlook 2019. World Energy Outlook Special Report; IEA: Paris, France, 2019. [Google Scholar]
  36. Papadopoulos, P.; Fallahi, F.; Yildirim, M.; Ezzat, A.A. Joint optimization of production and maintenance in offshore wind farms: Balancing the short-and long-term needs of wind energy operation. IEEE Trans. Sustain. Energy 2023, 15, 835–846. [Google Scholar] [CrossRef]
  37. Armijo, J.; Philibert, C. Flexible production of green hydrogen and ammonia from variable solar and wind energy. Case study of Chile and Argentina. Int. J. Hydrogen Energy 2020, 45, 1541–1558. [Google Scholar] [CrossRef]
  38. Ministry of Environment, Study of Potential for the Introduction of Renewable Energy (2011) Summary. Available online: https://www.env.go.jp/earth/report/h23-03/summary_en.pdf (accessed on 15 January 2023).
  39. Oda, J.; Akimoto, K.; Tomoda, T. Long-term global availability of steel scrap. Resour. Conserv. Recycl. 2013, 81, 81–91. [Google Scholar] [CrossRef]
  40. Rezaei, M.; Akimov, A.; Gray, E.M. Techno-economics of renewable hydrogen export: A case study for Australia-Japan. Appl. Energy 2024, 374, 124015. [Google Scholar] [CrossRef]
Figure 1. LCOS in Japan and South Korea in different scenarios.
Sustainability 17 04280 g001
Figure 2. LCOH of Japan and South Korea.
Sustainability 17 04280 g002
Figure 3. LCOS of China, Japan, and South Korea.
Sustainability 17 04280 g003
Figure 4. Cost difference between locally produced H-DRI in Japan and South Korea and imported H-DRI.
Sustainability 17 04280 g004
Figure 5. Cost composition of different production processes (Unit:USD/t).
Sustainability 17 04280 g005
Table 1. Scenario description.
Scenario Renewable EnergyHydrogen Production
BaselineCAPEX decrease 30%CAPEX decrease 30%
AdvancedCAPEX decrease 60%CAPEX decrease 60%
Table 2. Key parameters of offshore wind energy.
China Fujian ProvinceSouth Korea (South Sea)Japan
Average annual utilization hours (h)310026002500
Average annual wind speed (m/s)10.898.58.4
Water depth50–1005–3050–100
Wind power density/m2>500>500>500
Table 3. Relevant parameters of OPERX of LCOH.
South KoreaJapan
Electricity (USD/KWh)LCOELCOE
Water (USD/t)0.560.6
Labor(USD/full time)3600036000
Table 4. CAPEX of different technologies.
202020302050
ChinaS. KoreaJapan ChinaS. KoreaJapan ChinaS. KoreaJapan
Wind (USD/KW)170045005000120021002700120015001700
Electrolyze (USD/KW)120012001287800830830450480480
SF-EAF (USD/t)33.52
Disclaimer/Publisher’s Note: The statements, opinions and data contained in all publications are solely those of the individual author(s) and contributor(s) and not of MDPI and/or the editor(s). MDPI and/or the editor(s) disclaim responsibility for any injury to people or property resulting from any ideas, methods, instructions or products referred to in the content.

