Article

Mechanisms of Cu2+ Immobilization Using Carbonyl Iron Powder–Biochar Composites for Remediating Acidic Soils from Copper Sulfide Mining Areas

1
School of Energy and Mechanical Engineering, Jiangxi University of Science and Technology, Nanchang 330013, China
2
School of Software Engineering, Jiangxi University of Science and Technology, Nanchang 330013, China
*
Authors to whom correspondence should be addressed.
Sustainability 2025, 17(10), 4281; https://doi.org/10.3390/su17104281
Submission received: 2 April 2025 / Revised: 3 May 2025 / Accepted: 6 May 2025 / Published: 8 May 2025

Abstract

Soil heavy metal contamination poses critical challenges to ecological sustainability in mining regions, particularly in acidic soils from copper sulfide mines. This study developed a sustainable remediation strategy using a carbonyl iron powder–biochar composite (CIP@BC) derived from agricultural waste (rice husk) and industrial byproducts. The composite was synthesized through an energy-efficient mechanical grinding method at a 10:1 mass ratio of biochar to carbonyl iron powder, aligning with circular economy principles. Material characterization revealed CIP particles uniformly embedded within biochar’s porous structure, synergistically enhancing surface functionality and redox activity. CIP@BC demonstrated exceptional Cu2+ immobilization capacity (910.5 mg·g−1), achieved through chemisorption and monolayer adsorption mechanisms. Notably, the remediation process concurrently improved key soil health parameters. Soil incubation trials demonstrated that 6% CIP@BC application elevated soil pH from 4.27 to 6.19, reduced total Cu content by 29.43%, and decreased DTPA-extractable Cu by 67.26%. This treatment effectively transformed Cu speciation from bioavailable to residual fractions. Concurrent improvements in electrical conductivity (EC), cation exchange capacity (CEC), soil organic matter (OM), and soil water content (SWC) collectively highlighted the composite’s multifunctional remediation potential. This study bridges environmental remediation with sustainable land management through an innovative waste-to-resource approach that remediates acidic mine soils. The dual functionality of CIP@BC in contaminant immobilization and soil quality restoration provides a scalable solution.

1. Introduction

Urbanization and industrial expansion drive escalating heavy metal contamination in soils, critically hindering global progress toward the UN’s Sustainable Development Goals [1]. Global statistics reveal approximately 10 million contaminated soil sites worldwide, of which over 50% are attributed to heavy metal pollution [2]. Industrial clusters and mining zones are particularly prone to elevated contamination levels, with pollutant loads often exceeding regulatory thresholds by several orders of magnitude [3]. Beyond localized hotspots, toxic metal contamination exhibits widespread impacts, affecting 14% to 17% of global agricultural land and exposing an estimated 90 million to 1.4 billion people to heightened ecological and public health risks [4]. Compounding these challenges, the Food and Agriculture Organization (FAO) projects that without immediate remediation efforts, up to 90% of global soil resources may face degradation by 2050, driven synergistically by soil erosion, indiscriminate agrochemical use, and industrial emissions [5]. Aligning with China’s environmental context, the first national soil pollution survey jointly conducted by the Ministry of Ecology and Environment and the Ministry of Natural Resources in 2014 revealed significant findings: agricultural land demonstrated a 19.4% heavy metal-exceeding-standard rate, reaching alert level [6]. Cadmium contamination exhibited a 7% detection rate, displaying distinct spatial heterogeneity characteristics and cross-basin pollution diffusion patterns.
Heavy metal pollutants pose complex ecological risks due to their biotoxicity, environmental persistence, and bioaccumulation potential [7]. These contaminants exhibit extremely low degradation rates during natural mineralization processes and prolonged half-lives in soil systems, creating persistent ecological stress [8]. Copper sulfide mining activities expose sulfide minerals to air. Under the catalytic action of water and oxygen, the exposed sulfides oxidize into sulfuric acid and free metal ions. This process causes a dual environmental impact: soil acidification and the migration of heavy metals [9]. High concentrations of heavy metals can produce plant toxicity and endanger the viability of plants [10]. Chronic Cu exposure triggers phenotypic plasticity in plants, with leaf chlorosis and root biomass reduction being predominant stress responses [11]. Within plant tissues, the interconversion between elemental Cu0 and Cu2+ enhances the generation of highly toxic reactive oxygen species (ROS) and hydroxyl radicals [12]. These radicals can oxidize and degrade critical biomolecules, including DNA, proteins, RNA, lipids, and other essential cellular components [13]. Excessive copper accumulation in soil further disrupts microbial communities and decomposer activity, thereby threatening soil biodiversity. A recent meta-analysis by Karimi et al. demonstrated that repeated applications of copper-based fungicides reduced soil microbial activity by 30%, suppressed reproduction in Collembola and enchytraeids by 50%, and decreased earthworm biomass by 15% [14]. Developmental impairments in juvenile earthworms and reduced cocoon production were observed even at soil copper concentrations below 9 mg·kg−1, while concentrations reaching 16 mg·kg−1 significantly inhibited earthworm reproduction and population viability [15]. Furthermore, soilborne copper bioaccumulates through trophic transfer, posing threats to environmental and human health. Chronic exposure may disrupt copper homeostasis in humans, potentially triggering severe pathologies [16]. Mir et al. [17] quantified heavy metal levels in vegetables, identifying lettuce as a hyperaccumulator (83.71 mg·kg−1), with chromium posing the highest carcinogenic risk. Cu overload in humans may cause liver dysfunction and multi-organ damage [18]. Mechanistic studies by Wang et al. [19] demonstrated that Cu2+ induces mitochondrial apoptosis through oxidative stress and targets lipoic acid-modified TCA cycle proteins, a process termed “cuproptosis.” When Cu2+ leached from soil enters water systems, it causes systemic failure of aquatic self-purification mechanisms [20]. Elevated Cu concentrations severely threaten aquatic organisms, impairing their growth, reproduction, and survival [21]. In developmental toxicity studies, Li et al. [22] exposed zebrafish larvae to Cu overload, revealing a 2.8-fold reduction in T-cell counts, 35% increase in apoptosis, and significant inhibition of cell proliferation. Pang et al. [23] investigated the bioenrichment potential of nano-CuPc in low-trophic aquatic organisms, It was found that after 48 h of incubation, about 10% of the cells in the algal population were attached to nano-CuPC and there was biological enrichment. Cu functions as a crucial micronutrient in plants, with tissue concentrations of 5–30 mg·kg−1 being optimal for growth [24].
Biochar (BC) is a carbon-rich material produced by pyrolyzing agricultural and forestry waste under oxygen-limited conditions. It exhibits a porous structure, high specific surface area, abundant surface functional groups, and superior adsorption capacity. Growing soil pollution concerns have intensified research on biochar for heavy metal immobilization, organic pollutant degradation, and soil ecosystem restoration [25,26,27]. Xu et al. [28] embedded biochar interlayers at 40 cm depth in saline–alkali wasteland soil. A three-year field trial demonstrated that applying biochar at rates < 45 mg·hm−2 reduced groundwater evaporation during non-cultivation periods, decreasing soil salinity by 13.14–49.62%. The interlayer also effectively inhibited surface salt accumulation. Huang et al. [29] developed sulfur-modified biochar, showing a 2.3-fold increase in Cd adsorption capacity and 68% lower desorption compared to pristine biochar. Applying 1% sulfur-modified biochar increased soil pH by 0.5 units and reduced bioavailable Cd by 42–57%, confirming its remediation potential. Su et al. [30] investigated the effectiveness of manganese-modified bamboo biochar for soil improvement and heavy metal immobilization. They found that after adding manganese-modified bamboo biochar, soil pH decreased by 0.08–0.70, organic matter content increased by 8.00–45.13%, and alkali-hydrolysable nitrogen content increased by 1.84–5.78%. Pb, As, Cd and Cu were reduced by 21.25–58.65%, 7.76–34.02%, 36.44–46.50%, and 3.13–35.21%, respectively.
Carbonyl iron powder (CIP) is an ultrafine spherical iron powder with strong reducibility and unique magnetic properties [31]. It serves as an iron supplement, battery material, and other industrial applications [32]. However, CIP’s low electrical resistivity and thermal instability above 170 °C lead to rapid oxidation and significant eddy current losses, severely degrading high-frequency performance. Current research focuses on surface modification strategies and dielectric–magnetic composite fabrication to enhance oxidation resistance and reduce eddy current effects [33,34]. At present, there are few studies on soil remediation using CIP [35]. This study developed a novel biochar composite material (CIP@BC) to investigate Cu2+ adsorption mechanisms and assess its remediation potential in acidic soils from a sulfide copper mining area in Jiangxi Province. The research establishes an eco-friendly soil restoration strategy that integrates contaminant immobilization with soil health recovery, aligning with green mining initiatives. The methodology advances three UN Sustainable Development Goals: ensuring water quality through reduced metal mobility (SDG 6), enabling resource-efficient material production (SDG 12), and restoring degraded terrestrial ecosystems (SDG 15).

2. Materials and Methods

2.1. Materials

Soil samples were collected from a sulfide copper mine located in Jiujiang City, Jiangxi Province, China (115°49′32″ E, 29°41′26″ N). The mining area currently spans approximately 5 km2, with an exploitation permit covering 1.45 km2. The region is characterized by a humid low-mountain landscape surrounded by lakes on three sides, and exhibits severe surface weathering of soils. Prolonged mining and smelting activities have resulted in scattered tailing piles and acidic drainage channels, with sparse vegetation prevalent in the dumping sites. The surface soil is classified as red soil, derived from the weathering of acidic magmatic rocks, exhibiting acidic pH. According to the China Soil Database, soils in this region are characterized by a heavy texture dominated by silt (40–50%) and clay (15–25%) fractions, consistent with the pedogenic processes of subtropical red soil formation. After removing soil surface impurities, soil samples were collected by five-point cross sampling. Five sampling points were identified in the selected sampling area, and soil samples were collected from 0 to 20 cm depth at each sampling point using a soil drill. The five collected soil samples were thoroughly mixed, packed into a sealed bag, and brought back to the laboratory for use. Prior to the formal experiments, the collected soil samples were naturally air-dried, homogenized to remove coarse debris, and sieved through a 2.5-mm mesh screen for particle size standardization. The basic physical and chemical properties of copper sulfide acid soil are shown in Table 1. The total Cu content in soil was 2398.29 mg·kg−1, which far exceeded the limit value specified in the secondary standard of soil environmental quality [36].

2.2. Material Preparation

Rice husk-derived biochar was prepared through controlled pyrolysis. Raw rice husks were sequentially cleaned with deionized water and dried at 90 °C in a forced-air drying oven. Pyrolysis was conducted in a tubular furnace under continuous nitrogen flow with the following thermal parameters: target temperature 700 °C, heating rate 10 °C·min−1, and 4 h dwell time. The resultant biochar was naturally cooled to ambient temperature, then pulverized through a 100-mesh sieve. The final biochar exhibited a pH of 10.22 and elemental composition of 78.7% C, 2.85% H, and 11.4% O. CIP was procured from Hebei Chuancheng Metal Materials Co., Ltd. (Handan, China). Scanning electron microscopy characterization revealed its unique onion-like layered morphology with particle diameters ranging 1–5 μm (Figure 1).
To systematically evaluate the effect of precursor ratios on Cu2+ adsorption performance, composite materials were synthesized through mechanical milling of rice husk-derived biochar and carbonyl iron powder. This protocol employed a stainless steel mortar and pestle system [37]. The preparation of biochar composites was conducted through two mechanical distinct milling approaches. For the dry-milling method, precisely weighed biochar and CIP with predetermined mass ratios (1:1, 5:1, 10:1) were placed in a glass beaker. The mixture underwent ultrasonic dispersion (15 min, 40 kHz) to achieve homogeneity before being transferred to a stainless steel mortar. Continuous grinding was performed for 1 h with periodic directional alternation of the pestle. In the wet-milling variant, 30 mL anhydrous ethanol was introduced into the beaker prior to the ultrasonic treatment, maintaining identical subsequent processing steps. Post-grinding, the ethanol-containing composites were filtered through quantitative filter paper, dried in an oven at 60 °C until constant weight, and stored in airtight containers. Iron loading capacity, a critical process parameter, was regulated by adjusting the CIP/BC mass ratios. Adsorption experiments in 1 g·L−1 Cu2+ solutions revealed that the 10:1 dry-milled composite achieved maximum adsorption capacity (Qmax = 910.5 mg·g−1), which was accordingly designated CIP@BC for subsequent characterization (Table 2).

2.3. Experimental Design

2.3.1. Adsorption Kinetics and Isotherm Studies

Adsorption kinetic experiments were conducted in 50 mL conical flasks containing 20 mg BC or CIP@BC with 30 mL Cu2+ solution (30 mg·L−1). The initial pH was adjusted to 6.0 ± 0.1 using 0.1 M HNO3/NaOH solutions. Under controlled temperature (25 ± 0.5 °C) and agitation (150 rpm), aliquots were collected at predetermined intervals (5, 10, 30 min; 1, 2, 4, 6, 9, 12, 18, 24 h) through 0.22 μm nylon syringe filters. Residual Cu2+ concentrations were quantified via ICP-OES. For adsorption isotherms, parallel experiments employed Cu2+ solutions with gradient concentrations (5–50 mg·L−1) under identical operational conditions until equilibrium attainment. All measurements were conducted in triplicate.

2.3.2. Soil Incubation Trial

The soil used in the experiment was the aforementioned acidic soil from copper sulfide mining areas, exhibiting characteristic acidity and elevated copper contamination levels. Two kilograms of crushed, sieved, and air-dried acidic soil were placed into plastic pots (12 cm in height and 21 cm in outer diameter) for incubation. Based on previous research findings from our group and cost considerations, biochar amendments within 0–6% demonstrated positive effects on heavy metal immobilization. As detailed in Table 3, the experiment included three replicates per treatment group, totaling 18 experimental pots. The CIP@BC composite was applied at five dosage levels relative to soil mass—0 (CK group), 1% (BP1 group), 2% (BP2 group), 4% (BP3 group), and 6% (BP4 group)—while pristine biochar was added at 6% soil mass (BC group). Precisely weighed amounts of materials were added to soil-containing pots according to designated ratios, then homogenized using a small mixing tool with thorough mixing for no less than 15 min to ensure uniformity and experimental reliability.
The soil was gravimetrically watered every 48 h to maintain moisture at 60–70% of field capacity (FC). Pots were systematically repositioned weekly to minimize microenvironmental heterogeneity induced by light gradients and air currents. All soil-containing pots were incubated under controlled indoor conditions for 120 days, with temperature stabilized at 25 ± 5 °C. Post-experiment soil samples were collected, dried at 105 °C for 6–8 h, and subsequently analyzed for physicochemical properties, total Cu content, and Cu speciation. All measurements were conducted in triplicate.

2.4. Chemical Analysis

2.4.1. Performance Characterization

BC, CIP, and CIP@BC samples were collected for characterization studies. The pH values were determined at a solid-to-water ratio of 1:20 (w/v) using a calibrated pH meter. X-ray diffraction patterns were acquired on a Malvern Panalytical Empyrean diffractometer with CuKα radiation, employing a scanning rate of 2°·min−1 over a 5–90° 2θ range. Morphological characterization was performed using a scanning electron microscope (SEM, Zeiss EVO18, Tokyo, Japan) equipped with an EDS detector. Surface functionality analysis was conducted via Fourier-transform infrared spectroscopy in ATR mode, comparing pre-adsorption and post-adsorption chemical states.

2.4.2. Data Processing

The adsorption effectiveness of BC and CIP@BC for Cu2+ in solution is expressed using equilibrium adsorption capacity Qe and removal efficiency E, as shown in the following formulas:
Q e = ( C 0 C e ) V m
E = C 0 C e C 0 × 100 %
The quasi-first-order adsorption kinetics equation is:
l n ( Q e Q t ) = l n Q e k 1 t
The quasi-second-order adsorption kinetics equation is:
t Q t = 1 k 2 Q e 2 + t Q e
The Langmuir isotherm adsorption model equation is:
1 Q e = 1 Q m + 1 k L Q m C e
The Freundlich isotherm adsorption model equation is:
l n Q e = l n k F + 1 n l n C e
t is the time of adsorption. Qt represents the amount of Cu2+ adsorbed by the adsorbent at time t. Qm is the maximum concentration of Cu2+ adsorbed by the adsorbent. Qe represents the concentration of Cu2+ adsorbed by the adsorbent at adsorption saturation. k1 and k2 are first-order and second-order rate constants for adsorption, respectively. kL is the Langmuir model’s equilibrium constant for adsorption. kF is Freundlich model’s capacity index for adsorption. 1/n represents the strength of adsorption by the absorbent material. C0 is the initial concentration of the solution. Ce is the concentration of the concentrated solution at saturation of adsorption. The equations for Qe, E, adsorption kinetics, and adsorption thermodynamics can be found in Zhang et al. [38] and Haladu et al. [41].
Soil moisture content was calculated using the formula [42]:
S W C = S o i l   w e i g h t   b e f o r e   d r y i n g S o i l   w e i g h t   a f t e r   d r y i n g S o i l   w e i g h t   a f t e r   d r y i n g × 100 %

3. Results and Discussion

3.1. Characterization Analysis of CIP@BC

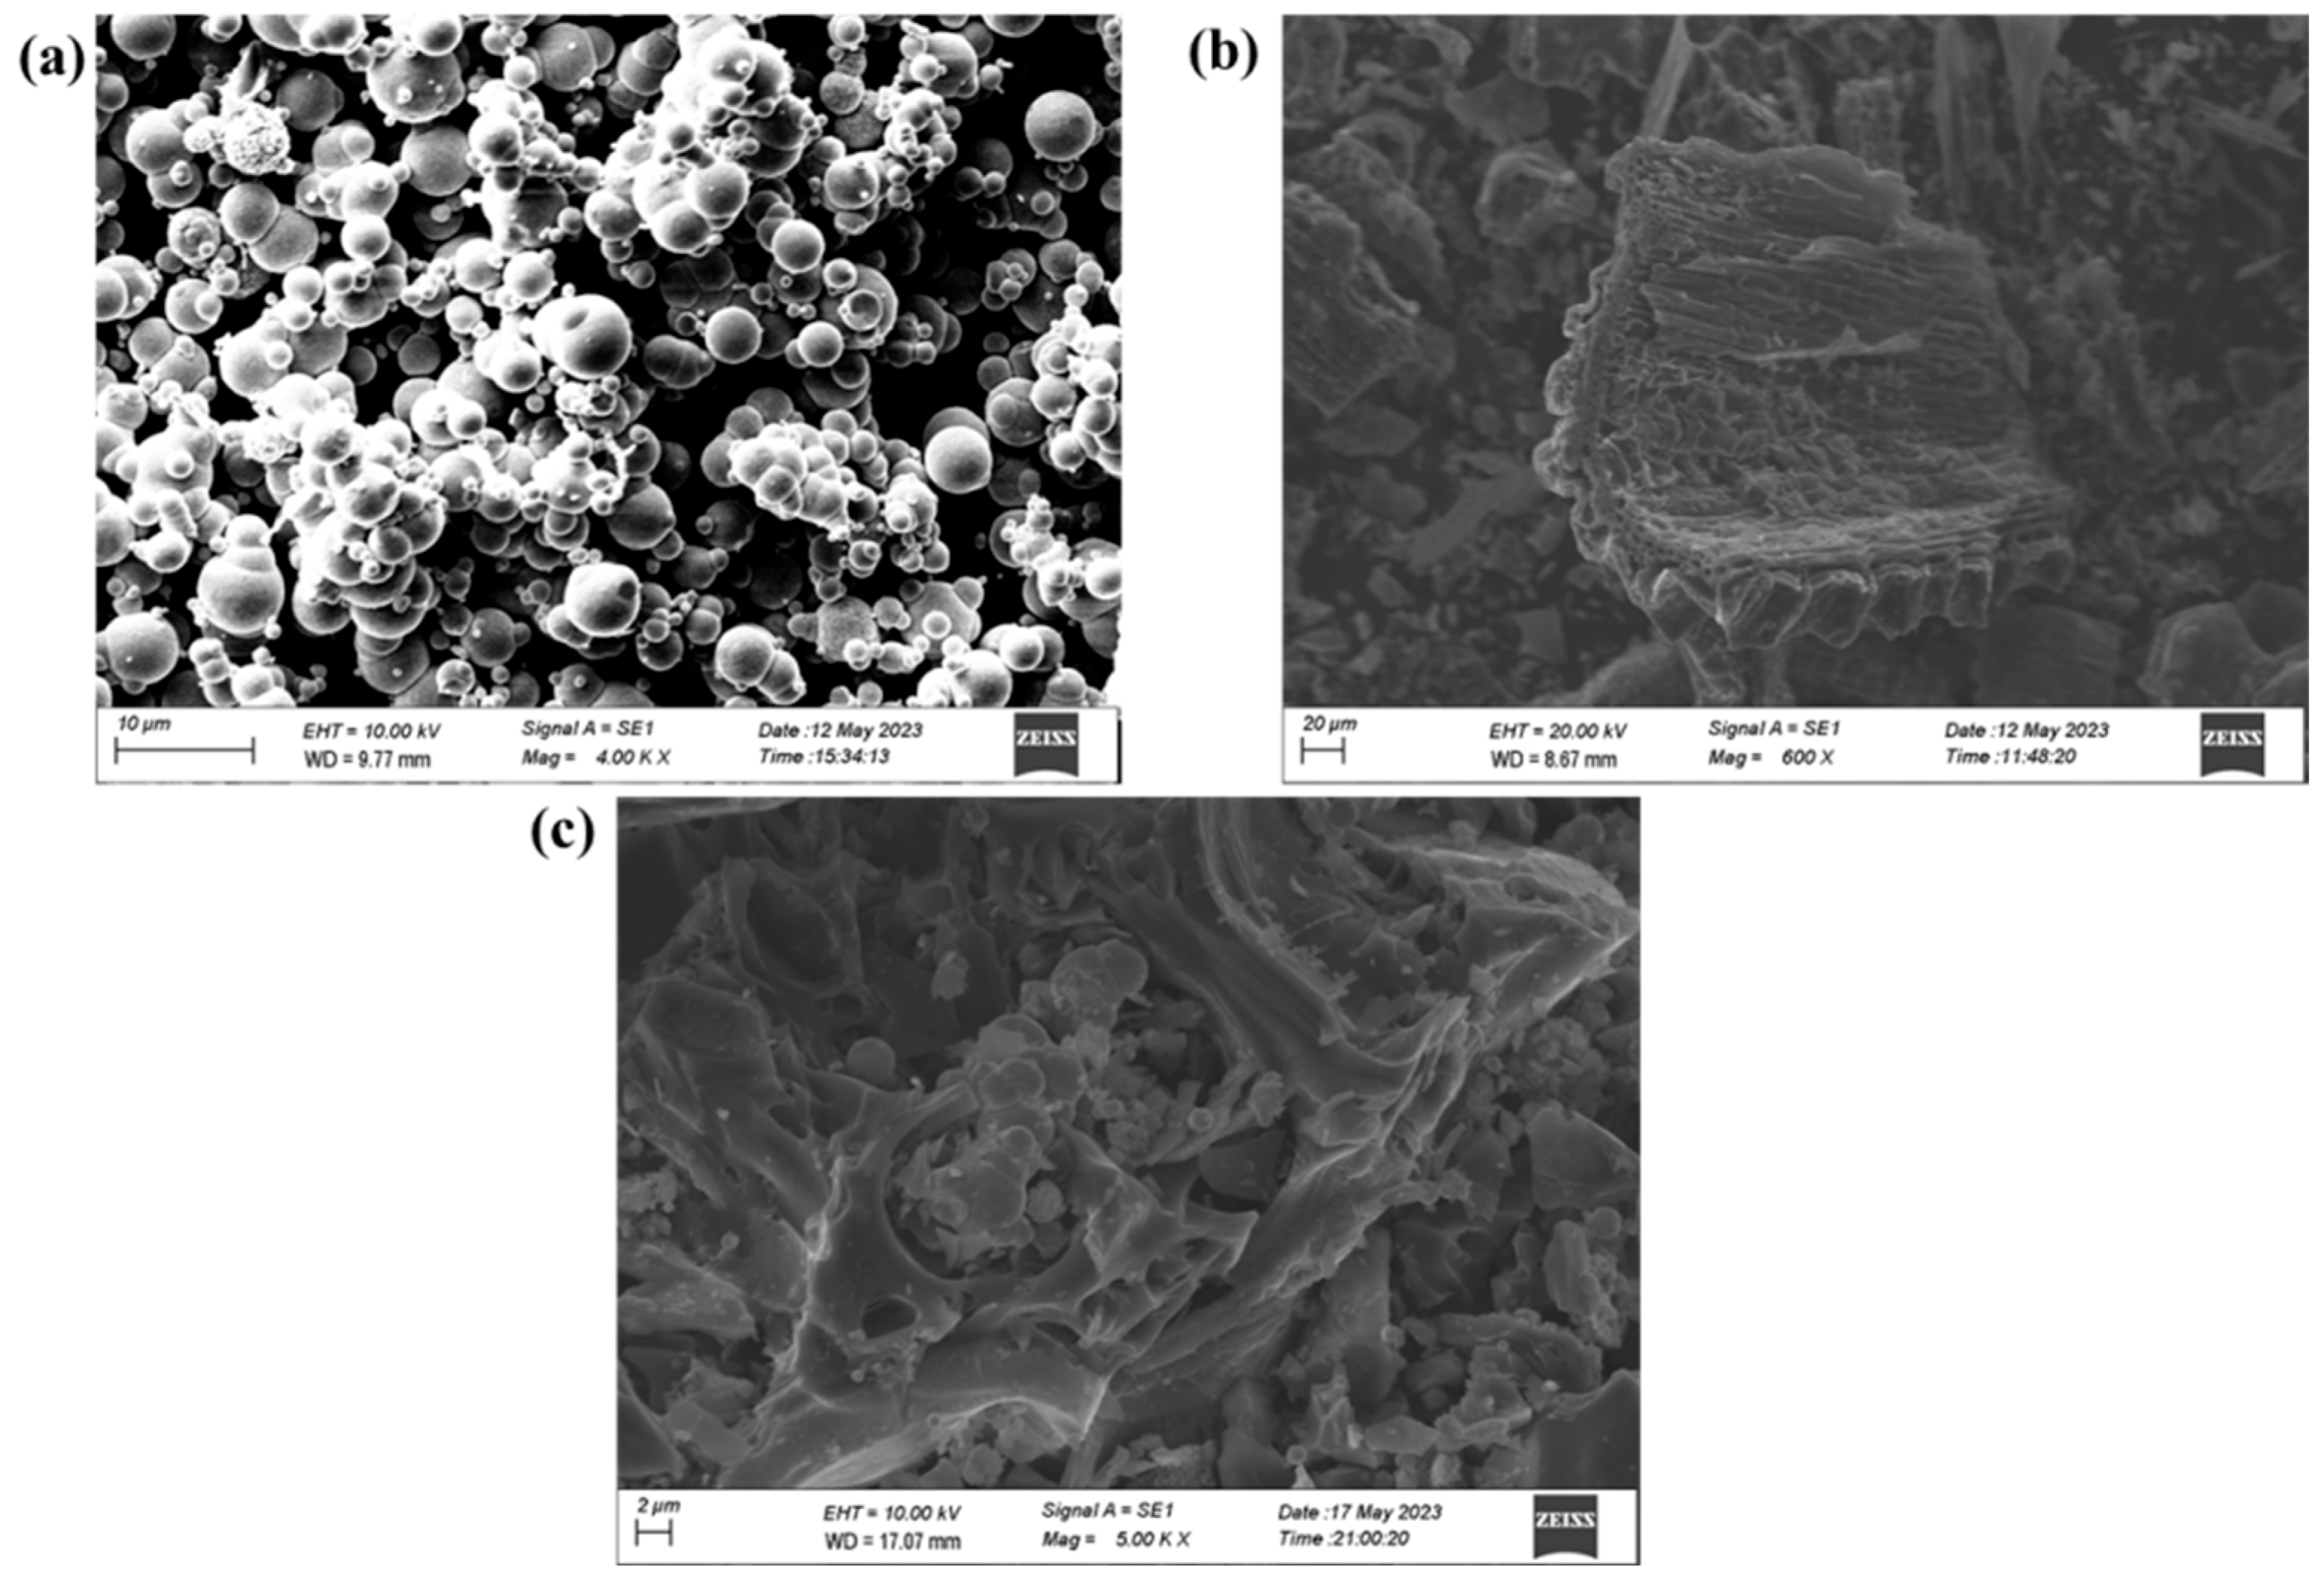
3.1.1. Micromorphology

Figure 1 presents the morphological evolution revealed through SEM imaging. Figure 1a depicts CIP exhibiting spherical particulates forming chain-like aggregates. This agglomeration arises from: (1) nanoscale particle dimensions and consequent high surface energy driving spontaneous agglomeration to minimize interfacial energy; (2) magnetic dipole interactions between adjacent metallic particles enhancing cluster formation. Figure 1b displays the microstructural characteristics of rice husk-derived biochar through SEM analysis. The outer skin tissue of rice husks has a corrugated structure, and previous studies have shown that these particles are silica [43]. The internal structure of rice husk is destroyed due to high temperature, and abundant pore structure is formed during high-temperature cracking, showing the characteristics of mesoporous and microporous [44]. The porous structure increases the specific surface area of biochar and provides abundant adsorption sites for the adsorption of heavy metal ions, which enables biochar to trap Cu2+ in its pores through van der Waals forces [45]. Figure 1c shows the CIP@BC composite microstructure. Spherical particles of uniform size (1–5 μm) are embedded within biochar’s pores, consistent with the original CIP particle dimensions. The loading of carbonyl iron powder changes the surface structure of biochar, the particle size of the composite decreases, the surface becomes rougher, and the specific surface area is further increased [46]. CIP and BC were closely bonded without obvious falling off, indicating good compatibility.

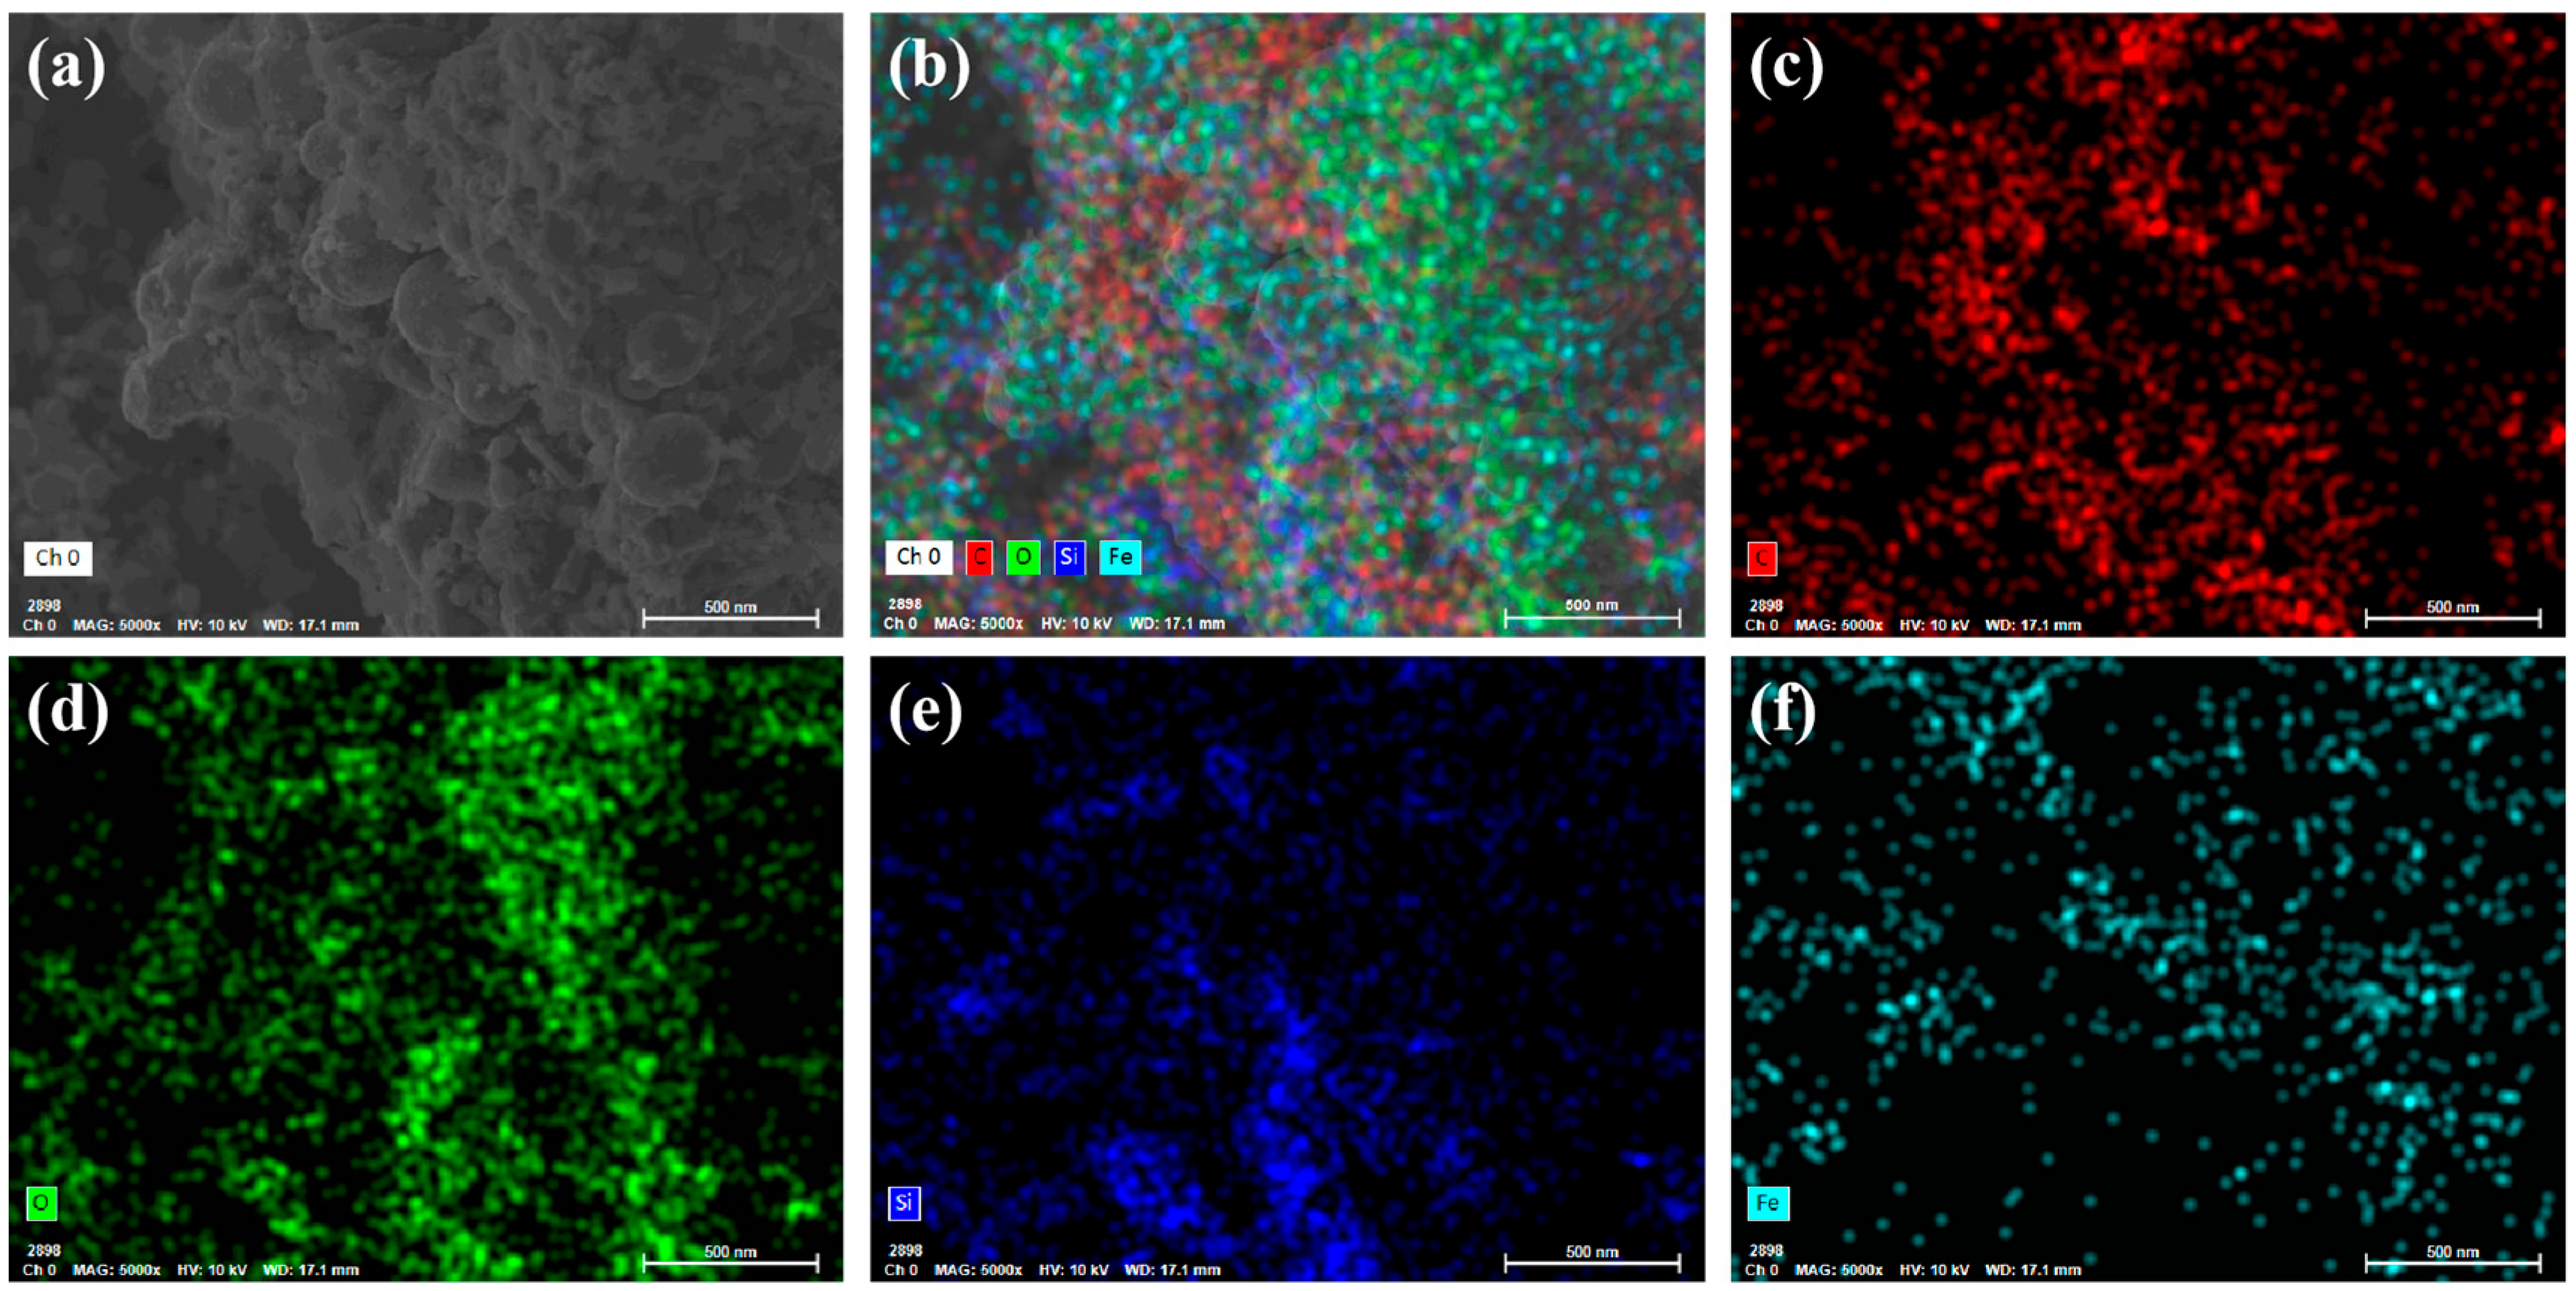
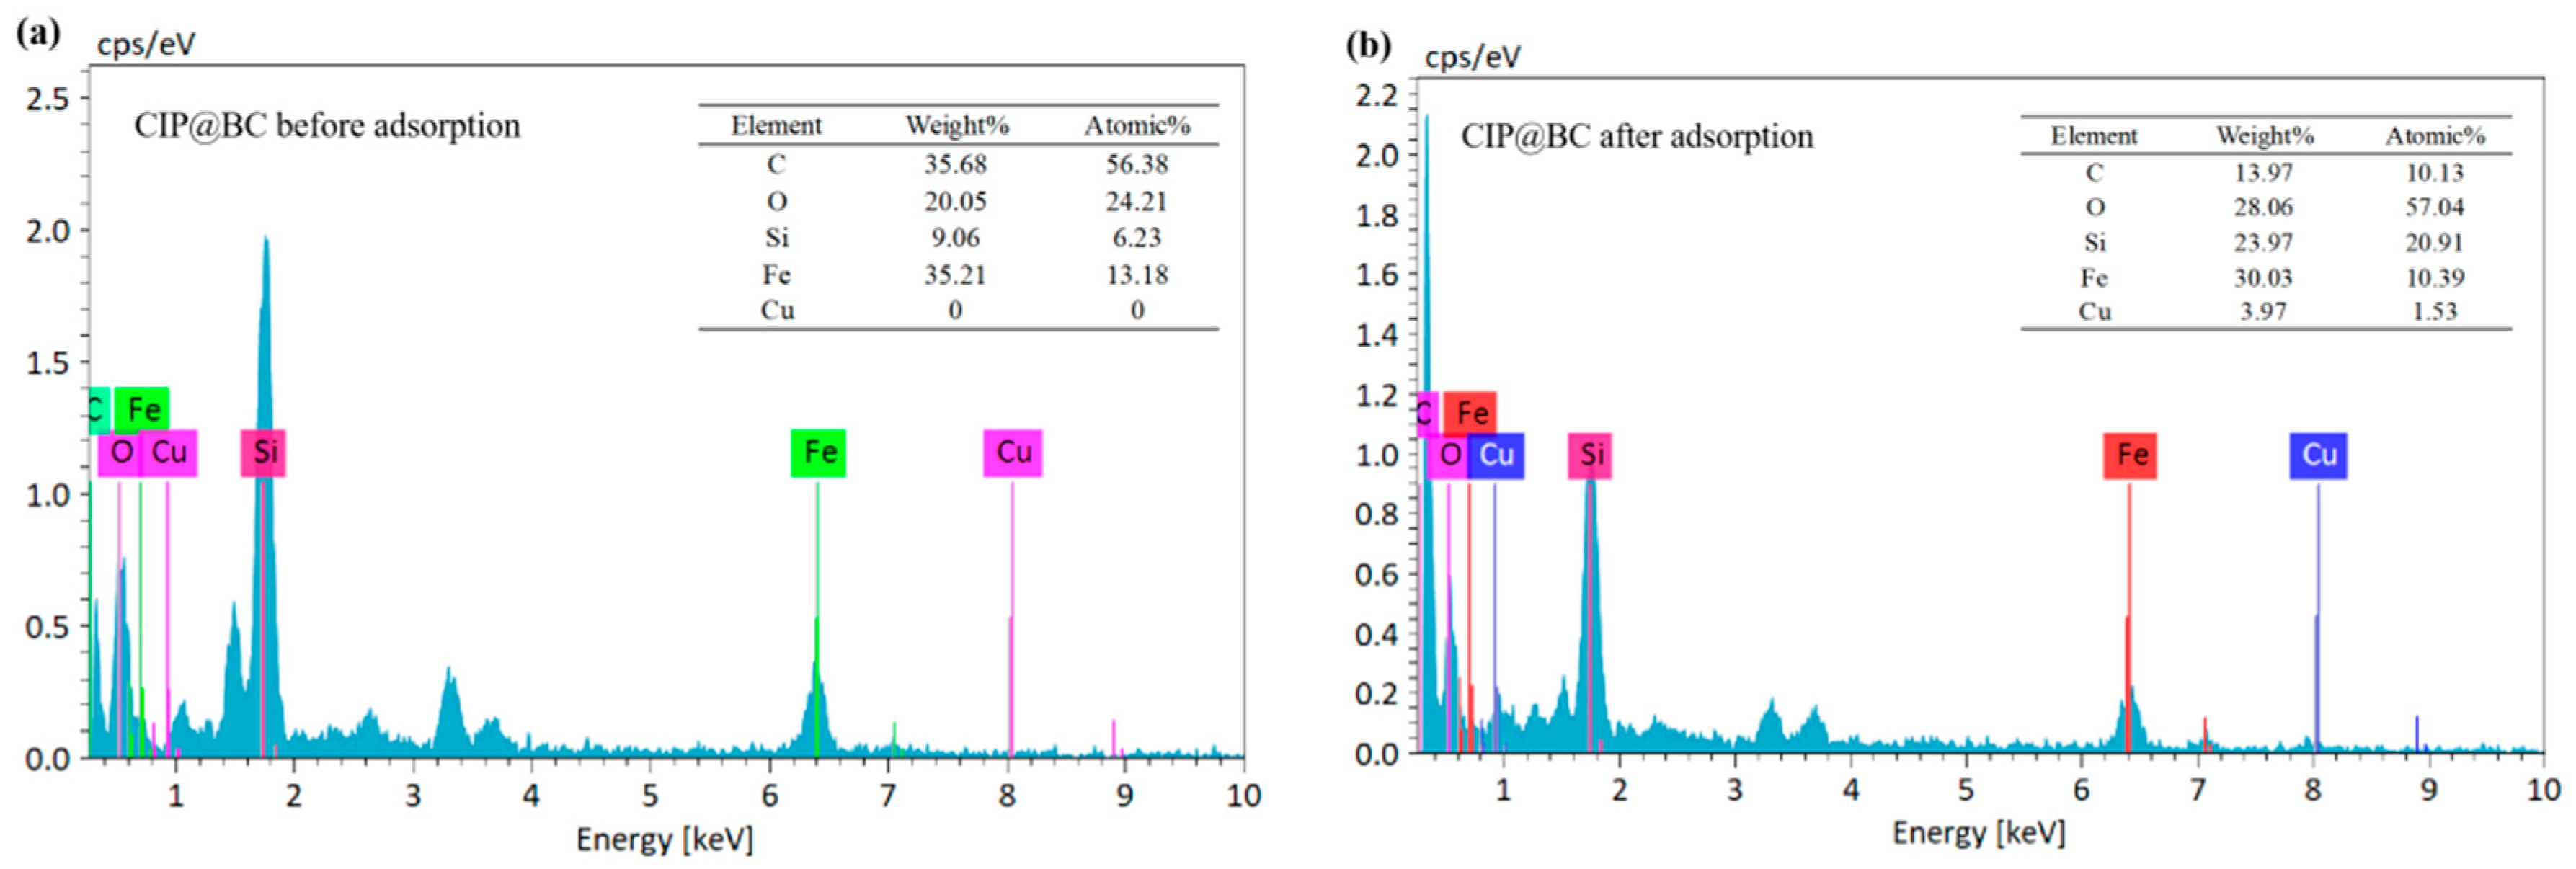
3.1.2. Element Composition

Elemental distribution analysis was conducted to visualize the dispersion of CIP within the CIP@BC composite. As demonstrated in Figure 2, the homogeneous spatial distribution of iron elements confirms uniform CIP loading on the composite surface. This observation substantiates BC’s effectiveness in suppressing CIP particle agglomeration [47].
EDS analysis of the CIP@BC composite before and after Cu2⁺ adsorption reveals elemental distribution changes (Figure 3). Pre-adsorption analysis identified C (56.38%), O (24.21%), Si (6.23%), and Fe (13.18%) as primary constituents. The dominant C content originates from BC’s carbon matrix, while O derives from oxygen-containing surface functional groups (e.g., hydroxyl and carboxyl groups). Fe corresponds to CIP particles, and Si originates from amorphous silica in rice husk epidermal cell layers. During pyrolysis, silicate structures undergo dehydration–condensation reactions, forming a porous Si–C composite structure. Studies indicate that rice husks contain 15–20% silicon, with 85% retained post-pyrolysis as cristobalite and tridymite within the BC matrix [48,49].
EDS analysis conducted after the adsorption experiments (Figure 3) revealed the presence of Cu with an atomic percentage of 3.97%, confirming the successful adsorption of Cu2⁺ by the CIP@BC composite. Variations in elemental composition were observed: C content decreased from 56.38% to 10.13%, likely due to chemical interactions between surface carbon atoms and Cu2⁺, forming new complexes. The Fe atomic ratio declined from 13.18% to 10.39%, suggesting surface chemical reactions of CIP during adsorption that led to partial Fe dissolution. Increases in Si and O content correlate with localized EDS point sampling of BC’s outer layers, where SiO2 particles are densely distributed.

3.1.3. Phase and Crystal Structure

XRD characterization of pristine BC and CIP@BC composites was performed to elucidate their crystalline structures and phase compositions (Figure 4). The BC pattern exhibits a broad diffraction peak at 22°, characteristic of amorphous graphitic carbon, consistent with previous reports on pyrolyzed biomass-derived carbon materials [50]. This feature confirms BC’s predominantly amorphous nature with short-range ordered carbon domains. The CIP diffractogram displays three distinct peaks at 2θ = 44.67°, 65.02°, and 82.33°, indexed to the (110), (200), and (211) planes of α-Fe, respectively [51]. These reflections confirm CIP’s face-centered cubic crystalline structure. The crystalline structure of carbonyl iron powder gives it high stability and specific physical and chemical properties, such as magnetism and reducibility.
XRD analysis of the CIP@BC composite revealed no emergent diffraction peaks, confirming the absence of new crystalline phases formed through chemical reactions between CIP and BC during synthesis. This indicates CIP is physically immobilized on BC’s surface through non-covalent interactions. The physical loading strategy preserves CIP’s intrinsic redox activity and magnetic properties while leveraging BC’s porous structure and adsorption sites. This synergistic configuration provides an optimal platform for Cu immobilization, combining CIP’s reductive capacity with BC’s adsorptive functionality. XRD analysis of CIP@BC after Cu2+ adsorption revealed characteristic peaks of CuCl2 [52]. The standard reduction potential hierarchy confirms the thermodynamic feasibility of Cu2+ immobilization via redox mechanisms [53], as shown in Equation (8). This potential gradient drives the electron transfer from CIP to Cu2+.
E ( C u ) = + 0.34 V > E ( F e ) = 0.44 V ( 298 K )
Previous studies have elucidated the pH-dependent mechanisms of Cu2+ removal by Fe0. Under acidic conditions (pH = 4), the immobilization of Cu2+ predominantly occurs through direct reductive precipitation [54,55,56], with the reaction mechanism described by Equation (9). However, under near-neutral conditions (pH = 6), dissolved oxygen triggers an oxidative pathway, shifting the mechanism toward coprecipitation/adsorption [56] processes, as illustrated in Equation (10). During the adsorption experiments conducted in this study, the initial solution pH was maintained at 6.0 ± 0.1, effectively precluding the formation of copper oxides such as Cu2O. This observation is consistent with the characterization of CuCl2 in the XRD patterns presented in Figure 4c.
F e 0 + 2 C u 2 + + H 2 O F e 2 + + C u 2 O + 2 H +
C u 2 O + 2 H + 2 C u 2 + + H 2 O

3.1.4. Functional Groups

Fourier-transform infrared spectroscopy (FTIR) was employed to characterize the interactions between metal ions and surface functional groups, identifying the active sites involved in Cu2+ adsorption on CIP@BC. The FTIR spectra of CIP@BC before and after Cu2+ adsorption are shown in Figure 5. Prior to adsorption, CIP@BC exhibited an absorption peak near 3445 cm−1 corresponding to the stretching vibration of hydroxyl groups [57]. The abundant hydroxyl groups on the biochar surface possess strong hydrophilicity and provide active sites for metal ion adsorption. The C=O functional groups were attributed to the peak near 1630 cm−1, primarily originating from carboxyl and carbonyl groups on the biochar surface [58], which exhibit acidity and can participate in complexation reactions with metal ions [59]. The C-O functional groups were associated with a distinct peak at 1099 cm−1, mainly derived from oxygen-containing groups such as alcohols, phenols, and ethers on the biochar surface [60]. The C-H functional groups were linked to a characteristic peak at 789 cm−1 [61]. The bending vibration of Si-O-Si produced a band at 468 cm−1 [62], related to the silica framework in the outer layer of rice husks [63]. No Fe-O stretching vibrations were detected, confirming the absence of iron oxide functional group formation during the CIP loading process [64].
Following heavy metal adsorption, changes in peak positions and intensities were observed in the CIP@BC FTIR spectra. The intensity of the O-H stretching vibration at 3445 cm−1 decreased, likely due to complexation between hydroxyl groups and Cu2+ ions [65]. After adsorption, the peak near 1630 cm−1 shifted to 1599 cm−1 with reduced intensity, indicating electron loss in carbonyl groups [66], while the C-H vibration shifted to a higher wavenumber. Although no chemical bonding was observed during the adsorption process, the attenuation of FTIR bands after the reaction between CIP@BC and Cu2+ suggests the involvement of functional groups in Cu2+ removal [67].

3.2. Analysis of Cu2+ Adsorption Properties of CIP@BC Composite

3.2.1. Cu2+ Adsorption Kinetics Analysis of CIP@BC Composite

The adsorption kinetic data were fitted using quasi-first-order and quasi-second-order kinetic models, with the fitting results illustrated in Figure 6 and Table 4. The adsorption of Cu2+ onto BC and CIP@BC exhibited two distinct phases. During the initial rapid phase, adsorption capacity increased sharply due to abundant active sites on the composite surfaces, approaching saturation thresholds. Van der Waals interactions between BC and Cu2+ dominated this stage, facilitating rapid ion capture from the aqueous phase. As adsorption progressed, the rate gradually decreased and stabilized at equilibrium, attributed to the occupation of high-affinity sites and increased resistance to further Cu2+ binding at residual sites. The quasi-second-order model demonstrated superior fitting accuracy (R2 = 0.999) compared to the quasi-first-order model (R2 ≥ 0.804), with the theoretical maximum adsorption capacity (Qe) closely aligning with experimental values. These results suggest that Cu2+ adsorption onto CIP@BC is governed by chemisorption mechanisms involving electron sharing/transfer processes, such as ion exchange, electrostatic interactions, and surface complexation [68,69]. The equilibrium adsorption capacity (Qe = 43.271 mg·g−1) and rate constant (k2 = 0.002 g·(mg·min)−1) indicate enhanced Cu2+ affinity for CIP@BC compared to pristine biochar, albeit with slower kinetics, likely due to prolonged reaction times required for redox-mediated immobilization. A Cu2+ removal efficiency of 86.76% was achieved, validating the remediation potential of CIP@BC for heavy metal-laden systems.

3.2.2. Isothermal Adsorption Analysis of Cu2+ for CIP@BC Composite

Adsorption isotherm experiments were conducted to elucidate the underlying mechanisms, with experimental data fitted using Langmuir and Freundlich models. As shown in Table 5, the Langmuir model exhibited a higher coefficient of determination compared to the Freundlich model, indicating monolayer adsorption of Cu2+ on CIP@BC surfaces. This result demonstrates that Cu2+ adsorption occurs via homogeneous site interactions, with binding limited to energetically equivalent surface sites. The absence of multilayer adsorption confirms that the process is governed by chemisorption mechanisms rather than physical accumulation, occurring exclusively on the adsorbent’s external surfaces [70].
The Langmuir maximum adsorption capacity (Qm) represents the monolayer coverage capacity per unit mass of adsorbent, reflecting the composite’s ultimate Cu2+ sequestration potential. The Langmuir equilibrium constant (kL) correlates with adsorption affinity, where higher kL values indicate stronger adsorbent–adsorbate interactions. Fitting results yielded Qm = 442.48 mg·g−1, demonstrating CIP@BC’s superior Cu2+ adsorption capacity. The fitted kL value of CIP@BC is 0.036 L·mg−1, indicating that its affinity for monolayer adsorption of Cu2+ in solution is lower than that of BC.
The adsorption mechanisms of CIP@BC for Cu2⁺ primarily involve four synergistic pathways (Figure 7), s follows. (1) Electrostatic attraction: BC inherently carries negative surface charges, exhibiting electrostatic attraction toward cationic Cu2+ species in solution. (2) Physical adsorption: The hierarchical porous structure of BC enables physical entrapment of Cu2+ via van der Waals interactions and pore-filling mechanisms. (3) Functional group interactions: Oxygen-containing moieties (-OH, C=O, COO-) participate in surface complexation, with FTIR-observed band shifts confirming ligand–metal coordination. (4) Redox reactions: CIP’s metallic Fe0 reduces Cu2+ to Cu+, but due to the high pH of the solution, CuCl2 is eventually formed.

3.3. CIP@BC Influence on Physical and Chemical Properties of Soil

3.3.1. Analysis of Soil pH and Conductivity Changes

Soil pH modulation by CIP@BC amendments is demonstrated in Figure 8. The CK group maintained strong acidity (pH = 4.51), consistent with initial soil sampling data. Increasing CIP@BC dosage induced significant pH elevation (R = 0.835, p < 0.01), with the BP4 group and BC group treatments rising pH to 6.19 and 6.18, respectively, representing increases of 1.68 and 1.67 units compared to untreated soil (p < 0.05).
The pH elevation mechanism of CIP@BC composites in acidic copper sulfide mine soils is primarily attributed to synergistic mechanisms. The elevated pH of CIP@BC composites originates from alkaline substances generated during BC production [71]. During biomass pyrolysis under high-temperature and oxygen-limited conditions, organic components undergo thermal decomposition, forming alkaline materials [71]. These substances neutralize acidic components in soil by consuming H⁺, thereby increasing soil pH [72]. Surface functional groups on BC, such as phenolic hydroxyl and carboxyl groups, undergo protonation/deprotonation reactions that exchange with H+ in soil, thereby modulating soil pH [73]. The reductive properties of Fe0 enable gradual oxidation in oxidizing soil environments [74]. During this process, Fe⁰ atoms lose electrons, while H⁺ ions accept electrons, collectively reducing H+ concentration and elevating soil pH. The oxidation process can be described by the following mathematical equation [75]:
4 F e + O 2 + 4 H + 4 F e 2 + + 2 H 2 O
Soil electrical conductivity (EC), a key parameter reflecting soluble salt content, reached 1043.87 μS·cm−1 in the CK group. The EC exhibited an initial decrease followed by an increase with the addition of CIP@BC composites. In the BP1 group, EC declined to 554.57 μS·cm−1, representing a 46.87% reduction compared to CK. However, when the CIP@BC dosage increased to 6%, EC of the BP4 group rose to 1421 μS·cm−1. The BC treatment group showed a similar EC value of 1408.17 μS·cm−1, with no significant difference observed between the BP4 and BC groups (p > 0.05). The porous structure and high surface area of BC enable effective adsorption of soil ions [76,77], reducing soluble salt concentrations and EC at low CIP@BC dosages. Higher amendment levels introduce soluble components that elevate ionic strength, increasing EC [78]. Moderate elevation of soil EC enhances soil ion-exchange capacity and nutrient availability, while excessive EC levels may adversely affect plant growth [79]. In this study, the addition of CIP@BC composites regulated soil EC within a reasonable range, effectively balancing salt stress mitigation and physicochemical property improvement [80]. This controlled EC modulation facilitated beneficial soil structural modifications without inducing phytotoxic ionic concentrations, thereby optimizing soil conditions for ecological restoration in acidic mine tailings.

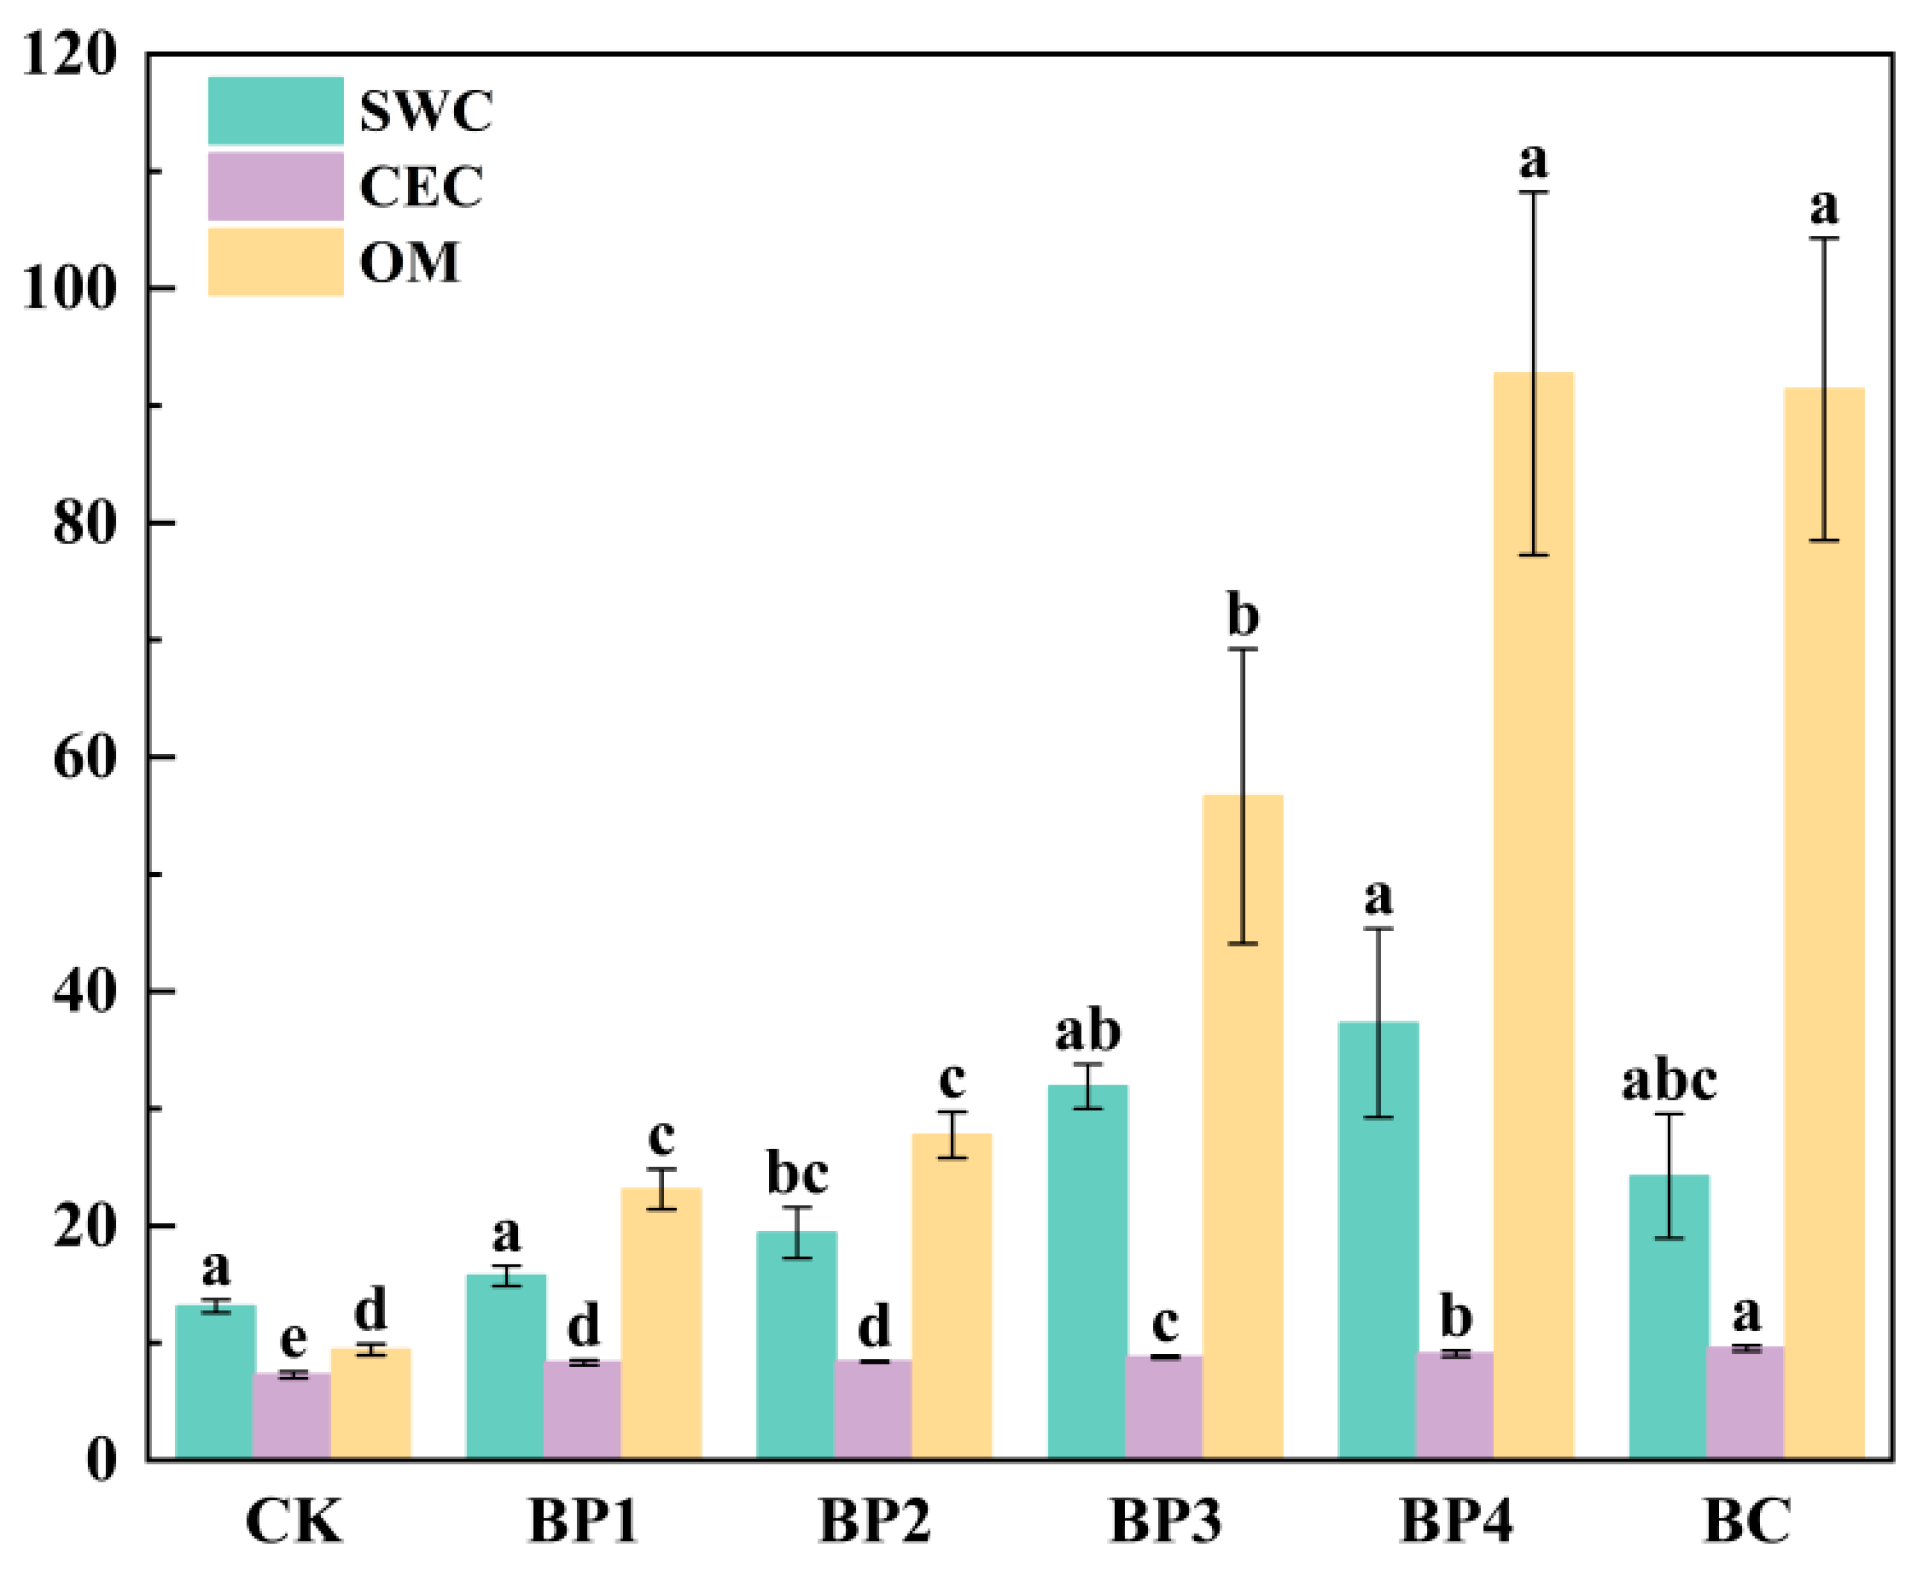
3.3.2. Analysis of Soil Moisture Content, Cation Exchange Capacity, and Organic Matter Change

The variations in key soil physicochemical parameters across experimental treatment groups—including soil water content (SWC), cation exchange capacity (CEC), and organic matter content (OM)—are comparatively presented in Figure 9. SWC is a critical factor influencing soil fertility and plant growth. It increased by 13.15%–37.31% with CIP@BC amendments, demonstrating the composite’s potential for soil water retention and nutrient preservation. Under equivalent mass ratios, CIP@BC outperformed pristine BC by 13.08% in SWC improvement. This enhancement arises from BC’s porous structure and physical adsorption mechanisms that retain water molecules within surface micropores and mesopores [81]. The incorporation of CIP may further modulate BC’s pore architecture, indirectly augmenting SWC through improved water-holding capacity and hydraulic conductivity in amended soils.
CEC is a key indicator of nutrient retention and supply. It increased from 7.28 cmol+·kg−1 to 9.09 cmol+·kg−1 in BP4 group, reflecting a 1.81 cmol+·kg−1 enhancement. This improvement stems from BC’s negatively charged surface, generated by deprotonation of oxygen-containing functional groups, which electrostatically adsorbs exchangeable cations [82]. The incorporation of CIP may further modulate BC’s electron cloud density through magnetic interactions, amplifying cation adsorption efficiency [83]. Elevated CEC enhances soil nutrient buffering, aligning with the observed pH–CEC correlation and corroborating prior studies [84].
OM is a crucial indicator of soil fertility. It was critically low in the acidic soil (8.97 mg·kg⁻1), classified as grade 5 (lowest tier) under national soil nutrient standards [85]. The addition of CIP@BC significantly increased OM levels, with BP3, BP4, and BC treatment groups elevating OM to grade 1 (highest tier) [85]. This enhancement primarily stems from BC’s inherent carbon-rich composition, which directly contributes to OM through its stable organic carbon content [86]. Furthermore, CIP@BC may stimulate microbial activity, accelerating the decomposition of BC and native soil organic materials [87]. During this process, microbial metabolism generates intermediate products and humic substances, further augmenting OM [88]. These synergistic effects highlight CIP@BC’s dual capacity to replenish organic matter and enhance nutrient cycling in degraded acidic soils.

3.4. Effect of CIP@BC Composite on Soil Cu Content

3.4.1. Analysis of Soil Total Cu Content Change

Boxplot analysis (Figure 10) demonstrated significant variations in total copper content among different soil treatments. Color gradients from purple (CK) to beige (BC) visually represent amendment intensity. The initial Cu content was 2398.29 mg·kg−1.
The boxplot medians (Q2) demonstrate a hierarchical decline in Cu levels across treatment groups. Notably, the CK group’s marginal decline underscores Cu’s recalcitrance to natural attenuation in soils, portending enduring ecotoxicity risks [89]. CIP@BC treatments induced dose-dependent Cu immobilization: the BP1 group decreased Cu to 2259.41 mg·kg−1 (5.79% reduction), BP2 group to 1939.20 mg·kg−1 (18.11%), BP3 group to 1805.50 mg·kg−1 (23.76%), and BP4 group to 1671.38 mg·kg−1 (29.43%). The BC group (6% pristine biochar) achieved comparable Cu reduction (1677.68 mg·kg−1, 29.16% decrease), showing no significant difference from BP4 (p > 0.05). The interquartile range (IQR) is a statistical measure that quantifies the dispersion of data within a boxplot, represented by the range between the 25th (Q1) and 75th (Q3) percentiles. BP3 exhibited the most condensed Cu distribution with a flattened box (IQR = 150.46 mg/kg), whereas BP1 demonstrates had the tallest box (IQR = 223.12 mg/kg) and longest whiskers, indicating broader data spread.
The negatively charged surface of BC enhances electrostatic adsorption of cationic Cu2⁺ through soil colloid interactions upon incorporation [90]. The magnetic properties of CIP may further strengthen metal immobilization via magnetically enhanced interfacial interactions between CIP@BC and Cu ions. Additionally, abundant active functional groups (-OH, -COOH, -C=O) on the CIP@BC surface facilitate ion-exchange reactions with Cu2+ in soil solution, effectively immobilizing Cu through surface complexation [91]. The representative reaction can be expressed as follows [92]:
2 R C O O H + C u 2 + C u ( R C O O ) 2 + 2 H +

3.4.2. Analysis of Changes in Soil Cu Content of Different Forms

The speciation distribution of heavy metals in soil determines their bioavailability and mobility, with different forms posing varying ecological and human health risks. Based on BCR sequential extraction data, soil Cu can be categorized into four fractions: acid-soluble Cu (F1), reducible Cu (F2), oxidizable Cu (F3), and residual Cu (F4) [93]. Higher proportions of F1, F2, and F3 fractions indicate greater heavy metal bioavailability and environmental pollution potential. Among these, F1 represents the most bioavailable form, readily assimilated by plants. In contrast, F4 is biologically inert and non-bioavailable. Consequently, an increased proportion of F4 Cu directly correlates with reduced metal bioavailability in soil.
The percentage distribution of copper chemical speciation in soil is illustrated in Figure 11. From the perspective of Cu speciation transformation, the CK group exhibited a high proportion of F1, accounting for approximately 17% of the total Cu content. It represents a highly bioavailable form that is readily absorbed by plants. The contents of the F1, F2, and F3 fractions decreased with increasing amendment dosage, while F4 showed the opposite trend. When the CIP@BC addition reached 6% (BP4 group), the F1 content decreased to 13.57%, F2 to 30.46%, and F3 to 7.64%, and F4 increased to 48.32%. This indicates that CIP@BC promotes the transformation of Cu from bioavailable forms (F1–F3) to the less bioavailable residual form (F4), thereby reducing the bioavailability of Cu in acidic soils. For the 6% pristine BC treatment group, the F1, F3, F2, and F4 contents were 13.87%, 6.09%, 29.62%, and 50.42%, respectively. Compared to the CK group, these values changed by +21.17%, +52.03%, +26.61%, and −71.81%.
Biochar demonstrates remarkable immobilization capacity for Cu through its abundant oxygen-containing functional groups and high specific surface area, where Cu2⁺ ions are adsorbed via electrostatic attraction and subsequently chelated by surface functional groups, ultimately forming stable organo-mineral complexes [94]. The application of CIP@BC composites enhanced soil available silicon content, promoting the formation of stable silicate precipitates with heavy metals [95] and thereby increasing the proportion of F4.

3.4.3. Determination of Available Copper Speciation in Soil

The variations in DTPA-extractable Cu concentrations across different control groups in acidic soils are presented in Table 6. In the CK group, the acidic sulfide copper mine soil exhibited an exceptionally high DTPA-extractable Cu concentration of 147.51 mg/kg, demonstrating significant mobility and biotoxicity of Cu in the soil. Regarding remediation efficacy, all treatment groups showed varying degrees of reduction in leachable Cu content after applying different proportions of remediation materials, with distinct magnitude differences. The BP4 group achieved a 67.26% decrease in extractable Cu, indicating superior remediation performance. This was followed by the BC group, with a 65.88% reduction. These effects may originate from the CIP@BC and BC treatments altering soil physicochemical properties, thereby influencing plant-available Cu fractions [94], a finding consistent with the heavy metal speciation shifts under varying conditions illustrated in Figure 11. The experimental results demonstrate that copper (Cu) was progressively transformed into a relatively stable state during the remediation process, with the CIP@BC treatment achieving statistically significant reductions in Cu biotoxicity and phytoavailability in contaminated soils [96].

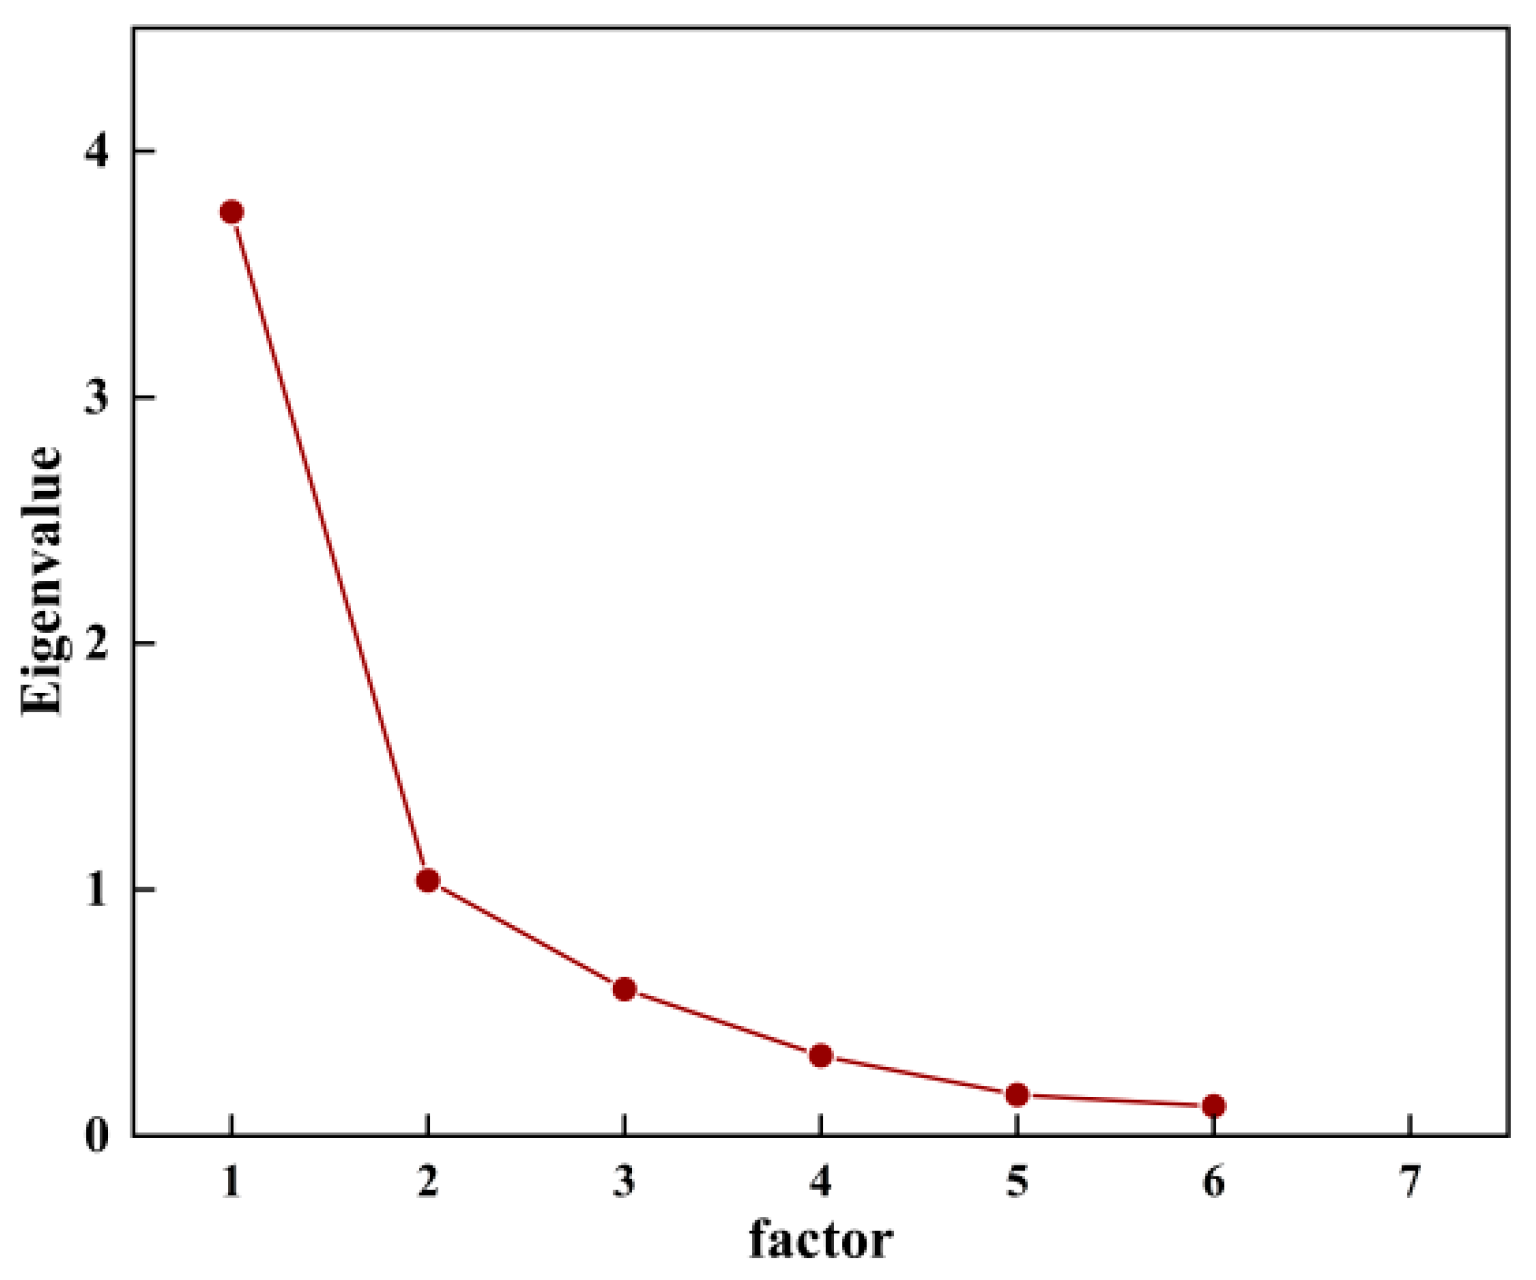
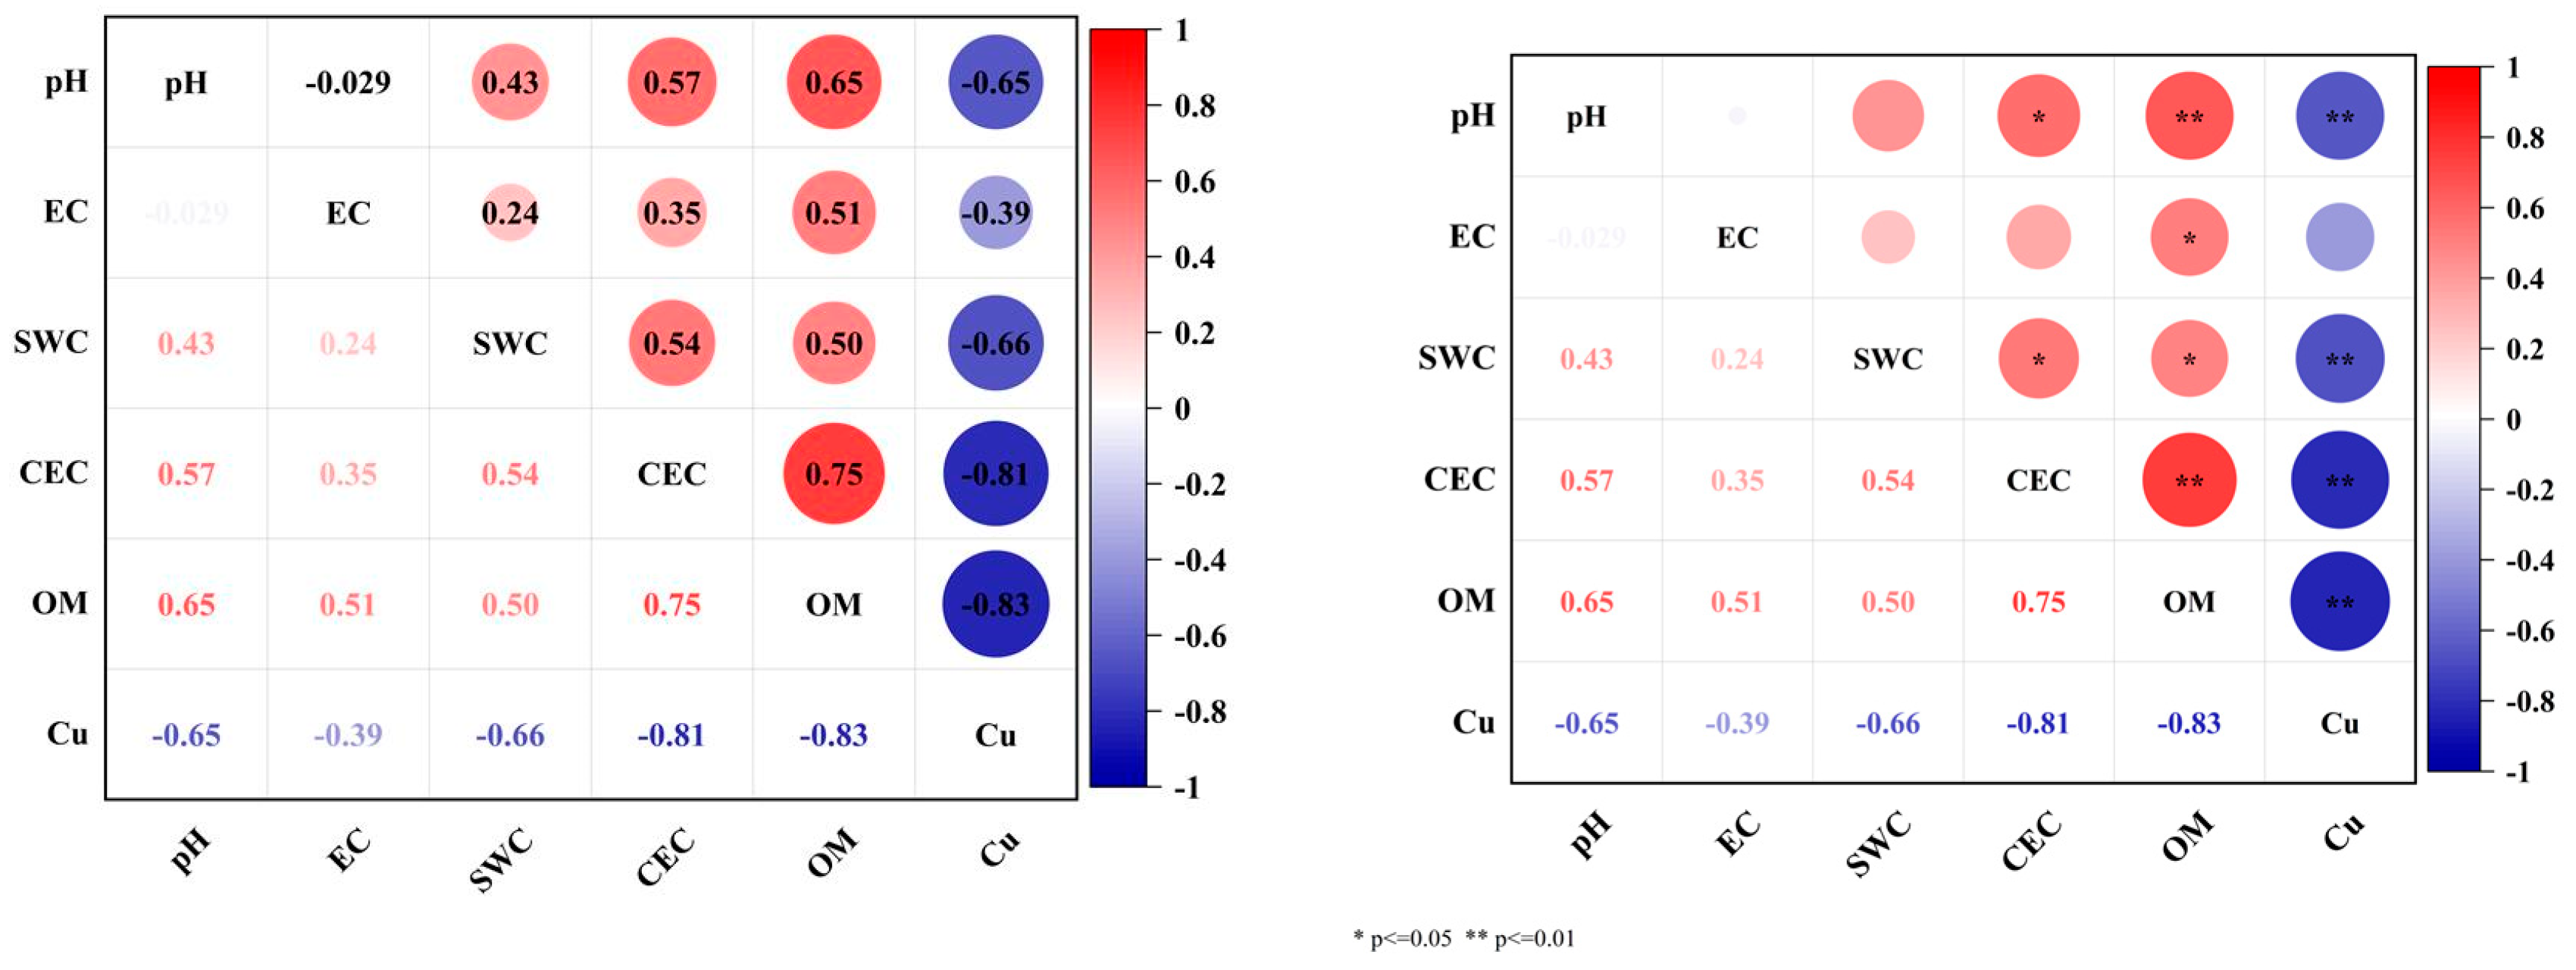
3.4.4. Analysis of the Relationship Between Soil Physical and Chemical Properties and Soil Cu Content

Principal component analysis (PCA) of six soil parameters (pH, EC, SWC, CEC, OM, and total Cu content) was validated by a Kaiser–Meyer–Olkin (KMO) value of 0.775 and statistical significance on Bartlett’s test of sphericity (p < 0.01). This confirms data suitability for dimensionality reduction. Two principal components with eigenvalues >1 were extracted, cumulatively explaining 79.85% of the total variance. The interpretation of the first two principal components covered most of the information of the original variable, and the variance of the rest was relatively small. The obtained rubble diagram is shown in Figure 12 and the factor component score coefficient matrix is shown in Formulas (13) and (14). Soil pH, moisture content, cation exchange capacity, organic matter and total Cu content have a large load in Formula (13), which are 0.268, 0.201, 0.233, 0.225 and 0.253, respectively. The soil conductivity has a large load in Formula (14), and the value is 0.831.
F 1 = 0.268 p H + 0.04 E C + 0.201 S W C + 0.233 C E C + 0.225 O M 0.253 C u
F 2 = 0.487 p H + 0.831 E C 0.052 S W C + 0.016 C E C + 0.136 O M 0.011 C u
Pearson correlation analysis between soil physicochemical properties and total Cu content (Figure 13) revealed significant negative correlations (p < 0.01) between total Cu and soil pH, SWC, CEC, and OM. This may be due to the increased ability of soil to retain metal cations with increasing pH. This reduced the mobility of Cu in the soil [97]. The improvement in soil physical and chemical properties reduced soil heavy metal pollution, and there was a mutual promoting relationship between soil physical and chemical properties. OM content exhibited significant positive correlations with both CEC and pH (p < 0.01). Humic substances—key OM components—possess high negative charge density, enabling strong electrostatic adsorption of Ca2+, K+, and Mg2+. This ionic retention mechanism directly enhances soil CEC [97] while buffering pH fluctuations through proton exchange reactions. OM also positively correlated with electrical conductivity and SWC (p < 0.05), likely due to microbial decomposition releasing soluble ions and aggregate formation improving water retention. CEC showed positive correlations with SWC and pH (p < 0.05), as higher CEC buffers pH fluctuations through H+ adsorption–desorption while improved SWC stabilizes ion-exchange equilibria [98]. These interlinked mechanisms collectively enhance soil remediation under CIP@BC treatment.

4. Conclusions

This study investigated the remediation of acidic copper sulfide mine soils using CIP@BC, focusing on Cu2+ adsorption mechanisms and improvements in soil quality. SEM showed that CIP particles were uniformly dispersed within biochar pores, forming spherical structures. EDS confirmed effective Cu2+ immobilization and the post-adsorption Cu atomic ratio increased to 1.53%. XRD analysis identified α-Fe characteristic peaks in CIP@BC, verifying that CIP was successfully loaded without compromising the structure. FTIR spectra indicated weakened hydroxyl and carboxyl peaks after adsorption, confirming ligand participation in Cu2+ complexation. Adsorption kinetics followed a quasi-second-order model (R2 > 0.99), reaching equilibrium within 60 min, while isotherm data aligned with the Langmuir model (Qₘ = 442.48 mg·g−1), indicating monolayer chemisorption dominance. In pot experiments, CIP@BC significantly improved soil properties: pH increased from 4.27 to 6.19, water content rose by 1.43-fold, and CEC improved from 7.28 to 9.09 cmol·kg−1. EC initially decreased, then increased with higher amendment doses. At 6% CIP@BC application, significant copper immobilization was achieved: total Cu content decreased by 29.43%, with acid-soluble Cu fractions declining from 17% to 13.57%. Concurrently, residual Cu fractions increased to 48.32%, accompanied by a 67.26% reduction in DTPA-extractable Cu. These metrics collectively demonstrate the composite’s effective Cu stabilization capacity. Multivariate analysis identified soil pH (component loading = 0.268) and EC (loading = 0.831) as primary remediation indicators. Pearson correlation analysis revealed significant negative correlations (p < 0.01) between total Cu and soil pH, water content, CEC, and organic matter, highlighting CIP@BC’s dual role in metal immobilization and soil quality enhancement. These findings demonstrate CIP@BC’s potential for sustainable remediation of heavy metal-contaminated acidic soils.
This study preliminarily elucidates the physicochemical mechanisms of Cu2+ immobilization by CIP@BC and its effects on copper content and speciation in contaminated soils. However, three critical limitations warrant further investigation. First, potential ecological risks arise from the release of Fe0 during in situ remediation. Fe0 exhibits multi-trophic toxicity: at concentrations of 500–1500 mg·kg−1 [99], earthworms show reduced reproduction and increased mortality, accompanied by concentration-dependent DNA damage [100]. Yang et al. [101] developed a Hill-type dose–response model to assess soil ecosystem health risks induced by zero-valent iron. Their analysis revealed that metal ion exposure significantly increased the body burden and developmental toxicity in Caenorhabditis elegans. Furthermore, the study documented a dose-dependent rise in infertility risks. Gong et al. [102] demonstrated that starch-stabilized nanoscale zero-valent iron (S-nZVI) at >1000 mg·kg−1 exacerbates plant oxidative damage and growth inhibition, linked to decreased activities of antioxidant enzymes (SOD, CAT, POD) and cell wall structural alterations. Second, microbial communities exhibit differential tolerance to Fe0. Sulfidized nZVI suppressed Actinobacteria proliferation [103], while conventional nZVI reduced Alphaproteobacteria abundance in treated soils [104]. Future work will systematically analyze CIP@BC’s impacts on soil bacterial diversity, including OTU counts, α-diversity indices, and phylum/genus-level taxonomic composition. Third, current composite synthesis methods lack innovation in recyclability. Although magnetic separation enables Fe0 recovery, its economic feasibility remains limited [105]. Subsequent research will prioritize developing size-engineered magnetic composites to address this technical constraint.

Author Contributions

Writing—original draft preparation, S.W.; conceptualization, J.X.; project administration, M.H.; data curation, X.W.; methodology, H.Q. All authors have read and agreed to the published version of the manuscript.

Funding

This work was funded by the Key R&D Program of Jiangxi Province, China (20212BBG73013) and Jiangxi Province Graduate Innovation Special Fund Project [YC2023-S677].

Institutional Review Board Statement

Not applicable.

Informed Consent Statement

Not applicable.

Data Availability Statement

The authors confirm that the data supporting the findings of this study are available within the article. The authors will supply the relevant data in response to reasonable requests. For further data on this study, please contact Jinchun Xue (xuejinchun@jxust.edu.cn).

Conflicts of Interest

The authors declare no conflicts of interest.

Abbreviations

The following abbreviations are used in this manuscript:
BCrice husk biochar
CIPcarbonyl iron powder
CIP@BCcarbonyl iron powder–biochar composite
OMorganic matter
SWCsoil water content
ECelectrical conductivity
CECcation exchange capacity
F1acid-soluble Cu
F2reducible Cu
F3oxidizable Cu
F4residual Cu

References

  1. Wu, Q.H.; Zhou, H.C.; Tam, N.F.Y.; Tian, Y.; Tan, Y.; Zhou, S.; Li, Q.; Chen, Y.H.; Leung, J.Y.S. Contamination, toxicity and speciation of heavy metals in an industrialized urban river: Implications for the dispersal of heavy metals. Mar. Pollut. Bull. 2016, 104, 153–161. [Google Scholar] [CrossRef]
  2. Zhao, X.X.; Zhang, J.X.; Ma, R.J.; Luo, H.; Wan, T.; Yu, D.Y.; Hong, Y.Q. Worldwide Examination of Magnetic Responses to Heavy Metal Pollution in Agricultural Soils. Agriculture 2024, 14, 702. [Google Scholar] [CrossRef]
  3. Modis, K.; Vatalis, K.I. Assessing the Risk of Soil Pollution around an Industrialized Mining Region Using a Geostatistical Approach. Soil Sediment Contam. 2013, 23, 63–75. [Google Scholar] [CrossRef]
  4. Hou, D.Y.; Jia, X.Y.; Wang, L.; McGrath, S.P.; Zhu, Y.G.; Hu, Q.; Zhao, F.J.; Bank, M.S.; O’Connor, D.; Nriagu, J. Global soil pollution by toxic metals threatens agriculture and human health. Science 2025, 388, 316–321. [Google Scholar] [CrossRef] [PubMed]
  5. Smith, P.; Poch, R.M.; Lobb, D.A.; Bhattacharyya, R.; Alloush, G.; Eudoxie, G.D.; Anjos, L.H.C.; Castellano, M.; Ndzana, G.M.; Chenu, C.; et al. Status of the World’s Soils. Annu. Rev. Environ. Resour. 2024, 49, 73–104. [Google Scholar] [CrossRef]
  6. Liu, Z.Y.; Yin, Y.Y.; Zhang, Y.; Shi, S.G. Legal System of Soil Pollution Remediation in China and Its Regulation and Guidance to Soil Pollution Remediation. Sustainability 2023, 15, 11504. [Google Scholar] [CrossRef]
  7. Rashid, A.; Schutte, B.J.; Ulery, A.; Deyholos, M.K.; Sanogo, S.; Lehnhoff, E.A.; Beck, L. Heavy Metal Contamination in Agricultural Soil: Environmental Pollutants Affecting Crop Health. Agronomy 2023, 13, 1521. [Google Scholar] [CrossRef]
  8. Khan, M.; Nizamani, M.M.; Asif, M.; Kamran, A.; He, G.D.; Li, X.Y.; Yang, S.W.; Xie, X. Comprehensive approaches to heavy metal bioremediation: Integrating microbial insights and genetic innovations. J. Environ. Manag. 2025, 374, 123969. [Google Scholar] [CrossRef]
  9. Wang, X.J.; Xue, J.C.; He, M.; Qi, H.; Wang, S.T. The Effects of Vermicompost and Steel Slag Amendments on the Physicochemical Properties and Bacterial Community Structure of Acidic Soil Containing Copper Sulfide Mines. Appl. Sci. 2024, 14, 1289. [Google Scholar] [CrossRef]
  10. Ghuge, S.A.; Nikalje, G.C.; Kadam, U.S.; Suprasanna, P.; Hong, J.C. Comprehensive mechanisms of heavy metal toxicity in plants, detoxification, and remediation. J. Hazard. Mater. 2023, 450, 131039. [Google Scholar] [CrossRef]
  11. Fraudentali, I.; Rodrigues-Pousada, R.A.; Angelini, R.; Ghuge, S.A.; Cona, A. Plant Copper Amine Oxidases: Key Players in Hormone Signaling Leading to Stress-Induced Phenotypic Plasticity. Int. J. Mol. Sci. 2021, 22, 5136. [Google Scholar] [CrossRef] [PubMed]
  12. Shabbir, Z.; Sardar, A.; Shabbir, A.; Abbas, G.; Shamshad, S.; Khalid, S.; Natasha; Murtaza, G.; Dumat, C.; Shahid, M. Copper uptake, essentiality, toxicity, detoxification and risk assessment in soil-plant environment. Chemosphere 2020, 259, 127436. [Google Scholar] [CrossRef] [PubMed]
  13. Shahid, M.; Shamshad, S.; Rafiq, M.; Khalid, S.; Bibi, I.; Niazi, N.K.; Dumat, C.; Rashid, M.I. Chromium speciation, bioavailability, uptake, toxicity and detoxification in soil-plant system: A review. Chemosphere 2017, 178, 513–533. [Google Scholar]
  14. Karimi, B.; Masson, V.; Guilland, C.; Leroy, E.; Pellegrinelli, S.; Giboulot, E.; Maron, P.A.; Ranjard, L. Ecotoxicity of copper input and accumulation for soil biodiversity in vineyards. Environ. Chem. Lett. 2021, 19, 2013–2030. [Google Scholar] [CrossRef]
  15. Helling, B.; Reinecke, S.A.; Reinecke, A.J. Effects of the Fungicide Copper Oxychloride on the Growth and Reproduction of Eisenia fetida (Oligochaeta). Ecotoxicol. Environ. Saf. 2000, 46, 108–116. [Google Scholar] [CrossRef]
  16. Hou, D.Y.; O’Connor, D.; Igalavithana, A.D.; Alessi, D.S.; Luo, J.; Tsang, D.C.W.; Sparks, D.L.; Yamauchi, Y.; Rinklebe, J.; Ok, Y.S. Metal contamination and bioremediation of agricultural soils for food safety and sustainability. Nat. Rev. Earth Environ. 2020, 1, 366–381. [Google Scholar]
  17. Mir, A.R.; Pichtel, J.; Hayat, S. Copper: Uptake, toxicity and tolerance in plants and management of Cu-contaminated soil. Biometals 2021, 34, 737–759. [Google Scholar] [PubMed]
  18. Teschke, R. Copper, Iron, Cadmium, and Arsenic, All Generated in the Universe: Elucidating Their Environmental Impact Risk on Human Health Including Clinical Liver Injury. Int. J. Mol. Sci. 2024, 25, 6662. [Google Scholar] [CrossRef]
  19. Wang, Y.D.; Yan, Q.S.; Shi, Y.; Long, M. Copper Toxicity in Animals: A Review. Biol. Trace Elem. Res. 2024, 1–12. [Google Scholar] [CrossRef]
  20. Anggayasti, W.L.; Salamah, L.N.; Rizkymaris, A.; Yamamoto, T.; Kurniawan, A. The role of ion charge density and solubility in the biosorption of heavy metals by natural biofilm matrix of polluted freshwater: The cases of Mg(II), Cr(VI), and Cu(II). Environ. Pollut. Bioavailab. 2023, 35, 2220571. [Google Scholar] [CrossRef]
  21. Cain, D.; Croteau, M.N.; Luoma, S. Bioaccumulation dynamics and exposure routes of Cd and Cu among species of aquatic mayflies. Environ. Toxicol. Chem. 2011, 30, 2532–2541. [Google Scholar] [CrossRef] [PubMed]
  22. Li, L.Y.; Shi, J.H.; Liu, W.Y.; Luo, Y.; Gao, S.; Liu, J.X. Copper overload induces apoptosis and impaired proliferation of T cell in zebrafish. Aquat. Toxicol. 2024, 267, 106808. [Google Scholar] [CrossRef] [PubMed]
  23. Pang, C.F.; Skjolding, L.M.; Selck, H.; Baun, A. A “point-of-entry” bioaccumulation study of nanoscale pigment copper phthalocyanine in aquatic organisms. Environ. Sci. Nano 2021, 8, 554–564. [Google Scholar] [CrossRef]
  24. Wuana, R.A.; Okieimen, F.E. Heavy Metals in Contaminated Soils: A Review of Sources, Chemistry, Risks and Best Available Strategies for Remediation. ISRN Ecol. 2011, 2011, 402647. [Google Scholar] [CrossRef]
  25. Lehmann, J.; Rillig, M.C.; Thies, J.; Masiello, C.A.; Hockaday, W.C.; Crowley, D. Biochar effects on soil biota—A review. Soil Biol. Biochem. 2011, 43, 1812–1836. [Google Scholar] [CrossRef]
  26. Zhang, L.X.; Chang, L.; Liu, H.J.; Alquiza, M.D.P.; Li, Y.F. Biochar application to soils can regulate soil phosphorus availability: A review. Biochar 2025, 7, 13. [Google Scholar] [CrossRef]
  27. Xu, L.; Zhao, F.F.; Peng, J.B.; Ji, M.F.; Li, B.L. A Comprehensive Review of the Application and Potential of Straw Biochar in the Remediation of Heavy Metal-Contaminated Soil. Toxics 2025, 13, 69. [Google Scholar] [CrossRef]
  28. Xu, Q.; Xu, Y.B.; Xia, H.J.; Han, H.; Li, M.S.; Gong, P.; Wang, C.X.; Li, Y.F.; Li, P.F.; Liu, H.G. Mitigation of soil salinity by biochar and halophytes. Geoderma 2025, 454, 117191. [Google Scholar] [CrossRef]
  29. Huang, T.Z.; Imran. Mitigating cadmium contamination in soil using Biochar, sulfur-modified Biochar, and other organic amendments. Int. J. Phytoremediation 2025, 27, 874–887. [Google Scholar] [CrossRef]
  30. Su, J.Z.; Guo, Z.L.; Zhang, M.Y.; Xie, Y.M.; Shi, R.; Huang, X.F.; Tuo, Y.; He, X.H.; Xiang, P. Mn-modified bamboo biochar improves soil quality and immobilizes heavy metals in contaminated soils. Environ. Technol. Innov. 2024, 34, 103630. [Google Scholar] [CrossRef]
  31. Sista, K.S.; Dwarapudi, S.; Kumar, D.; Sinha, G.R.; Moon, A.P. Carbonyl iron powders as absorption material for microwave interference shielding: A review. J. Alloys Compd. 2021, 853, 157251. [Google Scholar] [CrossRef]
  32. Li, L.Y.; Gao, Z.; Li, A.K.; Yi, J.H.; Ge, Y.C. Fabrication of carbonyl iron powder/SiO2-reduced iron powder/SiO2 soft magnetic composites with a high resistivity and low core loss. J. Magn. Magn. Mater. 2018, 464, 161–167. [Google Scholar] [CrossRef]
  33. Peng, J.; Wang, D.W.; Cheng, Z.Y.; Yang, M.F.; Liu, J.T.; Wang, M. Improving microwave absorption performance of carbonyl iron powder by regulating geometric dimensions and electromagnetic-dielectric synergism. Compos. Part A Appl. Sci. Manuf. 2025, 190, 108719. [Google Scholar] [CrossRef]
  34. Yang, S.Y.; Wang, F.; Zhang, Z.; Liu, Z.M.; Zhang, J.L.; Jiang, K.Y. Effect of Ball-Milling Process on Microwave Absorption Behaviors of Flaky Carbonyl Iron Powders. Materials 2023, 16, 4397. [Google Scholar] [CrossRef] [PubMed]
  35. Guan, X.N.; Xu, X.N.; Kuniyoshi, R.; Zhou, H.H.; Zhu, Y.F. Electromagnetic and mechanical properties of carbonyl iron powders-PLA composites fabricated by fused deposition modeling. Mater. Res. Express 2018, 5, 115303. [Google Scholar] [CrossRef]
  36. Zhou, Q.X.; Teng, Y.; Liu, Y. A study on soil-environmental quality criteria and standards of arsenic. Appl. Geochem. 2017, 77, 158–166. [Google Scholar] [CrossRef]
  37. Zhang, P.; Liu, C.Q.; Yu, L.; Hou, H.Q.; Sun, W.M.; Ke, F. Synthesis of benzimidazole by mortar-pestle grinding method. Green Chem. Lett. Rev. 2021, 14, 610–617. [Google Scholar] [CrossRef]
  38. Zhang, X.; Xue, J.C.; Han, H.Q.; Wang, Y. Study on improvement of copper sulfide acid soil properties and mechanism of metal ion fixation based on Fe-biochar composite. Sci. Rep. 2024, 14, 247. [Google Scholar] [CrossRef]
  39. Nicolaou, E.; Philippou, K.; Anastopoulos, I.; Pashalidis, I. Copper Adsorption by Magnetized Pine-Needle Biochar. Processes 2019, 7, 903. [Google Scholar] [CrossRef]
  40. Gai, C.; Gai, C.; Guo, Y.; Guo, Y.; Peng, N.; Peng, N.; Liu, T.; Liu, T.; Liu, Z.; Liu, Z. N-Doped biochar derived from co-hydrothermal carbonization of rice husk and Chlorella pyrenoidosa for enhancing copper ion adsorption. RSC Adcances 2016, 6, 53713–53722. [Google Scholar] [CrossRef]
  41. Haladu, S.A.; Al-Hamouz, O.C.S.; Ali, S.A. Adsorption of Cd2+ and Cu2+ ions from aqueous solutions by a cross-linked polysulfonate-carboxylate resin. Arab. J. Chem. 2019, 12, 2597–2607. [Google Scholar] [CrossRef]
  42. Kumar, D. Analytical Techniques and Instrumental Methods in Soil, Plant and Water Analysis, 1st ed.; NIPA: New Delhi, India, 2022; p. 138. [Google Scholar]
  43. Li, Y.P.; Zhao, M.Y.; Yan, H.Q.; Chen, Y.N.; Liu, Y.H.; Jiang, H.J.; Chen, L.; Hou, S.Z.; Chi, N.P.; Jia, S.Y. Silica from rice husk for sludge-based biochar modification: As a novel adsorbent for lead. J. Water Process Eng. 2024, 60, 105218. [Google Scholar] [CrossRef]
  44. Cuong, D.V.; Liu, N.L.; Nguyen, V.A.; Hou, C.H. Meso/micropore-controlled hierarchical porous carbon derived from activated biochar as a high-performance adsorbent for copper removal. Sci. Total Environ. 2019, 692, 844–853. [Google Scholar] [CrossRef]
  45. Carrasco, J.; Klimes, J.; Michaelides, A. The role of van der Waals forces in water adsorption on metals. J. Chem. Phys. 2013, 138, 024708. [Google Scholar] [CrossRef]
  46. Hou, D.B.; Cui, X.D.; Liu, M.; Qie, H.T.; Tang, Y.M.; Leng, W.P.; Luo, N.; Luo, H.L.; Lin, A.J.; Yang, W.J.; et al. Degradation of trichloroethylene by biochar supported nano zero-valent iron (BC-nZVI): The role of specific surface area and electrochemical properties. Sci. Total Environ. 2024, 908, 168341. [Google Scholar] [CrossRef] [PubMed]
  47. Zhou, S.H.; Wang, L.P.; Zhang, Q.Y.; Cao, Y.; Zhang, Y.A.; Kang, X.D. Enhanced Cr(VI) removal by biochar-loaded zero-valent iron coupled with weak magnetic field. J. Water Process Eng. 2022, 47, 102732. [Google Scholar] [CrossRef]
  48. Wang, M.; Tafti, N.D.; Wang, J.J.; Wang, X.D. Effect of pyrolysis temperature on Si release of alkali-enhanced Si-rich biochar and plant response. Biochar 2021, 3, 469–484. [Google Scholar] [CrossRef]
  49. Wang, X.Y.; Zhai, M.; Guo, H.K.; Panahi, A.; Dong, P.; Levendis, Y.A. High-temperature pyrolysis of biomass pellets: The effect of ash melting on the structure of the char residue. Fuel 2021, 285, 119084. [Google Scholar] [CrossRef]
  50. Wang, Y.Y.; You, L.C.; Lyu, H.H.; Liu, Y.X.; He, L.L.; Hu, Y.D.; Luo, F.C.; Yang, S.M. Role of biochar-mineral composite amendment on the immobilization of heavy metals for Brassica chinensis from naturally contaminated soil. Environ. Technol. Innov. 2022, 28, 102622. [Google Scholar] [CrossRef]
  51. Xie, H.; Zhou, Y.Y.; Ren, Z.W.; Wei, X.; Tao, S.P.; Yang, C.Q. Enhancement of electromagnetic interference shielding and heat-resistance properties of silver-coated carbonyl iron powders composite material. J. Magn. Magn. Mater. 2020, 499, 166244. [Google Scholar] [CrossRef]
  52. Krumpolec, R.; Homola, T.; Cameron, D.C.; Humlícek, J.; Caha, O.; Kuldová, K.; Zazpe, R.; Prikryl, J.; Macak, J.M. Structural and Optical Properties of Luminescent Copper(I) Chloride Thin Films Deposited by Sequentially Pulsed Chemical Vapour Deposition. Coatings 2018, 8, 369. [Google Scholar] [CrossRef]
  53. Tarekegn, M.M.; Hiruy, A.M.; Dekebo, A.H. Nano zero valent iron (nZVI) particles for the removal of heavy metals (Cd2+, Cu2+ and Pb2+) from aqueous solutions. RSC Adv. 2021, 11, 27084. [Google Scholar] [CrossRef] [PubMed]
  54. Yoshino, H.; Kurosu, S.; Yamaguchi, R.; Kawase, Y. A phenomenological reaction kinetic model for Cu removal from aqueous solutions by zero-valent iron (ZVI). Chemosphere 2018, 200, 542–553. [Google Scholar] [CrossRef] [PubMed]
  55. Qin, H.J.; Li, J.X.; Bao, Q.Q.; Li, L.N.; Guan, X.H. Role of dissolved oxygen in metal(loid) removal by zerovalent iron at different pH: Its dependence on the removal mechanisms. RSC Adv. 2016, 6, 50144–50152. [Google Scholar] [CrossRef]
  56. Li, S.L.; Wang, W.; Liang, F.P.; Zhang, W.X. Heavy metal removal using nanoscale zero-valent iron (nZVI): Theory and application. J. Hazard. Mater. 2017, 322, 163–171. [Google Scholar] [CrossRef]
  57. Jaiswal, J.; Dhayal, M. Preparation of 2D coatings of functionally graded chitosan-gold nanocomposite through in-situ reduction in cationic and anionic environments: Application for inhibiting hepatocellular carcinoma cells response. Mater. Chem. Phys. 2020, 243, 122663. [Google Scholar] [CrossRef]
  58. Wu, B.; Peng, D.H.; Hou, S.Y.; Tang, B.C.; Wang, C.; Xu, H. Dynamic study of Cr(VI) removal performance and mechanism from water using multilayer material coated nanoscale zerovalent iron. Environ. Pollut. 2018, 240, 717–724. [Google Scholar] [CrossRef]
  59. Wang, C.J.; Qiao, J.X.; Yuan, J.D.; Tang, Z.T.; Chu, T.Z.; Lin, R.F.; Wen, H.T.; Zheng, C.; Chen, H.L.; Xie, H.J.; et al. Novel chitosan-modified biochar prepared from a Chinese herb residue for multiple heavy metals removal: Characterization, performance and mechanism. Bioresour. Technol. 2024, 402, 130830. [Google Scholar] [CrossRef]
  60. Su, H.J.; Fang, Z.Q.; Tsang, P.E.; Fang, J.Z.; Zhao, D.Y. Stabilisation of nanoscale zero-valent iron with biochar for enhanced transport and in-situ remediation of hexavalent chromium in soil. Environ. Pollut. 2016, 214, 94–100. [Google Scholar] [CrossRef]
  61. Wang, H.L.; Tian, L.; Kang, K.; Zhang, B.; Li, G.M.; Zhang, K.Q. Characterization of Ultrasonic-Induced Wettability Alteration under Subsurface Conditions. Langmuir 2022, 38, 514–522. [Google Scholar] [CrossRef]
  62. Qian, L.B.; Zhang, W.Y.; Yan, J.C.; Han, L.; Chen, Y.; Ouyang, D.; Chen, M.F. Nanoscale zero-valent iron supported by biochars produced at different temperatures: Synthesis mechanism and effect on Cr(VI) removal. Environ. Pollut. 2017, 223, 153–160. [Google Scholar] [CrossRef] [PubMed]
  63. Asadi, H.; Ghorbani, M.; Rezaei-Rashti, M.; Abrishamkesh, S.; Amirahmadi, E.; Chen, C.R.; Gorji, M. Application of Rice Husk Biochar for Achieving Sustainable Agriculture and Environment. Rice Sci. 2021, 28, 325–343. [Google Scholar] [CrossRef]
  64. He, R.; Yuan, X.Z.; Huang, Z.L.; Wang, H.; Jiang, L.B.; Huang, J.; Tan, M.J.; Li, H. Activated biochar with iron-loading and its application in removing Cr (VI) from aqueous solution. Colloids Surf. A-Physicochem. Eng. Asp. 2019, 579, 123642. [Google Scholar] [CrossRef]
  65. Sun, M.; Ma, M.M.; Lv, B.; Yao, Q.X.; Gao, J.W.; Wang, R.C.; Zhang, Y.J.; Ma, X.X. Pyrolysis characteristics of ethanol swelling Shendong coal and the composition distribution of its coal tar. J. Anal. Appl. Pyrolysis 2019, 138, 94–102. [Google Scholar] [CrossRef]
  66. Dave, D.; Chauhan, K.; Khimani, A.; Soni, K.; Vaidya, Y. Photocatalytic degradation of low-density polythene using protein-coated titania nanoparticles and Lactobacillus plantarum. Environ. Technol. 2023, 44, 619–630. [Google Scholar] [CrossRef]
  67. Ahmad, S.Z.; Salleh, W.N.W.; Ismail, A.F.; Yusof, N.; Yusop, M.Z.M.; Aziz, F. Adsorptive removal of heavy metal ions using graphene-based nanomaterials: Toxicity, roles of functional groups and mechanisms. Chemosphere 2020, 248, 126008. [Google Scholar] [CrossRef]
  68. Wang, G.F.; Su, X.; Hua, Y.Y.; Ma, S.J.; Wang, J.; Xue, X.Q.; Tao, Q.; Komarneni, S. Kinetics and thermodynamic analysis of the adsorption of hydroxy-Al cations by montmorillonite. Penn. State Univ. Dept Ecosyst. 2016, 129, 79–87. [Google Scholar] [CrossRef]
  69. Regazzoni, A.E. Adsorption kinetics at solid/aqueous solution interfaces: On the boundaries of the pseudo-second order rate equation. Colloids Surf. A Physicochem. Eng. Asp. 2020, 585, 124093. [Google Scholar] [CrossRef]
  70. Wu, Z.; Ji, Y.; Zhang, K.; Jing, L.; Zhao, T.Y. On the Use of the Multi-Site Langmuir Model for Predicting Methane Adsorption on Shale. Energies 2024, 17, 4990. [Google Scholar] [CrossRef]
  71. Wei, B.L.; Peng, Y.C.; Jeyakumar, P.; Lin, L.X.; Zhang, D.L.; Yang, M.Y.; Zhu, J.N.; Lin, C.S.K.; Wang, H.L.; Wang, Z.T.; et al. Soil pH restricts the ability of biochar to passivate cadmium: A meta-analysis. Environ. Res. 2023, 219, 115110. [Google Scholar] [CrossRef]
  72. Arwenyo, B.; Varco, J.J.; Dygert, A.; Brown, S.; Pittman, C.U.; Mlsna, T. Contribution of modified P-enriched biochar on pH buffering capacity of acidic soil. J. Environ. Manag. 2023, 339, 117863. [Google Scholar] [CrossRef]
  73. Liu, Y.; Guo, K.Y.; Zhao, Y.Z.; Li, S.H.; Wu, Q.F.; Liang, C.F.; Sun, X.; Xu, Q.F.; Chen, J.H.; Qin, H. Change in composition and function of microbial communities in an acid bamboo (Phyllostachys praecox) plantation soil with the addition of three different biochars. For. Ecol. Manag. 2020, 473, 118336. [Google Scholar] [CrossRef]
  74. Ellery, S.; Ellery, W.; Tsikos, H.; Dunlevey, J. Depression wetland formation by redox-driven iron and silica cycling. Wetl. Ecol. Manag. 2024, 32, 191–206. [Google Scholar] [CrossRef]
  75. Chathura de Alwis, C.; Perrine, K.A. In Situ PM-IRRAS at the Air/Electrolyte/Solid Interface Reveals Oxidation of Iron to Distinct Minerals. J. Phys. Chem. A 2020, 124, 6735–6744. [Google Scholar] [CrossRef]
  76. Zhang, Y.J.; Ren, M.; Tang, Y.M.; Cui, X.D.; Cui, J.; Xu, C.B.; Qie, H.T.; Tan, X.; Liu, D.P.; Zhao, J.S.; et al. Immobilization on anionic metal(loid)s in soil by biochar: A meta-analysis assisted by machine learning. J. Hazard. Mater. 2022, 438, 129442. [Google Scholar] [CrossRef] [PubMed]
  77. Manirakiza, E.; Gagnon, B.; Ziadi, N. Soil and plant cations as affected by application of wood ash, biochar, and papermill biosolids. Agron. J. 2025, 117, e21714. [Google Scholar] [CrossRef]
  78. Gondek, M.; Weindorf, D.C.; Thiel, C.; Kleinheinz, G. Soluble Salts in Compost and Their Effects on Soil and Plants: A Review. Compos. Sci. Util. 2020, 28, 59–75. [Google Scholar] [CrossRef]
  79. Wang, C.S.; Wang, H.Q.; Wang, W.; Liang, C.Z.; Liu, H.M.; Wang, L.X. The salt secretion of leaves promotes the competitiveness of Reaumuria soongarica in a desert grassland. BMC Plant Biol. 2022, 22, 85. [Google Scholar] [CrossRef]
  80. Luo, K.; Li, Y.Q.; Guan, X.Y.; Zhang, X.F. Effects of Biochar with Different Particle Sizes on Soil Physicochemical Properties and Vertical Transport of Selenium and Cadmium. Eurasian Soil Sci. 2023, 56, 1999–2008. [Google Scholar] [CrossRef]
  81. Bian, X.; Ren, Z.L.; Zeng, L.L.; Zhao, F.Y.; Yao, Y.K.; Li, X.Z. Effects of biochar on the compressibility of soil with high water content. J. Clean. Prod. 2024, 434, 140032. [Google Scholar] [CrossRef]
  82. Ghorbani, M.; Amirahmadi, E.; Bernas, J.; Konvalina, P. Testing Biochar’s Ability to Moderate Extremely Acidic Soils in Tea-Growing Areas. Agronomy 2024, 14, 533. [Google Scholar] [CrossRef]
  83. Gao, C.; Fan, J.; Zhang, X.J.; Gong, Z.W.; Tan, Z.Y. Sediment metals adhering to biochar enhanced phosphorus adsorption in sediment capping. Water Sci. Technol. 2021, 84, 2057–2067. [Google Scholar] [CrossRef]
  84. Wang, Y.; Zhong, B.; Shafi, M.; Ma, J.W.; Guo, J.; Wu, J.S.; Ye, Z.Q.; Liu, D.; Jin, H.X. Effects of biochar on growth, and heavy metals accumulation of moso bamboo (Phyllostachy pubescens), soil physical properties, and heavy metals solubility in soil. Chemosphere 2019, 219, 510–516. [Google Scholar] [CrossRef] [PubMed]
  85. Wang, X.J.; Xue, J.C.; Qi, H.; Wang, S.T.; Wang, Y. Remediation of acidic soils in copper sulfide mines through combined plant amendments and their effects on soil bacterial community structure. Water Air Soil Pollut. 2024, 235, 141. [Google Scholar] [CrossRef]
  86. Šimanský, V.; Horák, J.; Lukac, M. Addition of Biochar and Fertiliser Drives Changes in Soil Organic Matter and Humic Substance Content in Haplic Luvisol. Land 2024, 13, 481. [Google Scholar] [CrossRef]
  87. Song, P.P.; Liu, J.; Ma, W.J.; Gao, X.Y. Remediation of cadmium-contaminated soil by biochar-loaded nano-zero-valent iron and its microbial community responses. J. Environ. Chem. Eng. 2024, 12, 112311. [Google Scholar] [CrossRef]
  88. Zheng, X.M.; Xu, W.H.; Dong, J.; Yang, T.; Shangguan, Z.C.; Qu, J.; Li, X.; Tan, X.F. The effects of biochar and its applications in the microbial remediation of contaminated soil: A review. J. Hazard. Mater. 2022, 438, 129557. [Google Scholar]
  89. Madibekov, A.; Ismukhanova, L.; Opp, C.; Saidaliyeva, Z.; Zhadi, A.; Sultanbekova, B.; Kurmanova, M. Spatial Distribution of Cu, Zn, Pb, Cd, Co, Ni in the Soils of Ili River Delta and State Natural Reserve “Ili-Balkhash”. Appl. Sci. 2023, 13, 5996. [Google Scholar] [CrossRef]
  90. Tan, Z.X.; Yuan, S.N.; Hong, M.F.; Zhang, L.M.; Huang, Q.Y. Mechanism of negative surface charge formation on biochar and its effect on the fixation of soil Cd. J. Hazard. Mater. 2020, 384, 121370. [Google Scholar] [CrossRef]
  91. Wang, X.; Ma, S.; Wang, X.; Cheng, T.; Dong, J.; Feng, K. The Mechanism of Cu2+ Sorption by Rice Straw Biochar and Its Sorption–Desorption Capacity to Cu2+ in Soil. Bull. Environ. Contam. Toxicol. 2022, 109, 562–570. [Google Scholar] [CrossRef]
  92. Zheng, R.X.; Zhao, W.L.; Li, H.Q.; Hu, H.B.; Lin, T.; Chen, W.; Song, Y.F. Pyrazole-3,5-dicarboxylic acid intercalated LDH: A highly selective structured adsorbents for Cu2+ ions removal. Sep. Purif. Technol. 2024, 346, 127532. [Google Scholar] [CrossRef]
  93. Saracoglu, S.; Soylak, M.; Elçi, L. Extractable Trace Metals Content of Dust from Vehicle Air Filters as Determined by Sequential Extraction and Flame Atomic Absorption Spectrometry. J. Aoac Int. 2009, 92, 1196–1202. [Google Scholar] [CrossRef] [PubMed]
  94. Yang, S.F.; Dong, Z.J.; Zhu, B.; Yan, X.M.; Huang, J.H.; Xie, X.; Chang, Z.F.; Tian, S.L.; Ning, P. Feasibility and solidification mechanism study of self-sustaining smoldering remediation for copper and lead-contaminated soil. Environ. Res. 2024, 250, 118498. [Google Scholar] [CrossRef]
  95. Jan, S.; Bhardwaj, S.; Singh, B.; Kapoor, D. Silicon efficacy for the remediation of metal contaminated soil. 3 Biotech 2024, 14, 212. [Google Scholar]
  96. Yang, W.C.; Li, Q.; He, Y.H.; Xi, D.D.; Arinzechi, C.; Zhang, X.M.; Liao, Q.; Yang, Z.H.; Si, M.Y. Synergistic Cr(VI) reduction and adsorption of Cu(II), Co(II) and Ni(II) by zerovalent iron-loaded hydroxyapatite. Chemosphere 2023, 313, 137428. [Google Scholar] [CrossRef]
  97. Sun, Q.W.; Yang, H.F.; Feng, X.D.; Liang, Y.H.; Gao, P.; Song, Y.L. A novel iron-based composite modified by refinery sludge for fixing Pb, Zn, Cu, Cd, and As in heavy metal polluted soil: Preparation, remediation process and feasibility analysis. J. Environ. Chem. Eng. 2023, 11, 111233. [Google Scholar] [CrossRef]
  98. Frank, T.; Zimmermann, I.; Horn, R. Lime application in marshlands of Northern Germany-Influence of liming on the physicochemical and hydraulic properties of clayey soils. Soil Tillage Res. 2020, 204, 104730. [Google Scholar] [CrossRef]
  99. Keenan, C.R.; Goth-Goldstein, R.; Lucas, D.; Sedlak, D.L. Oxidative Stress Induced by Zero-Valent Iron Nanoparticles and Fe(II) in Human Bronchial Epithelial Cells. Environ. Sci. Technol. 2009, 43, 4555–4560. [Google Scholar] [CrossRef] [PubMed]
  100. Yirsaw, B.D.; Mayilswami, S.; Megharaj, M.; Chen, Z.L.; Naidu, R. Effect of zero valent iron nanoparticles to Eisenia fetida in three soil types. Environ. Sci. Pollut. Res. 2016, 23, 9822–9831. [Google Scholar] [CrossRef]
  101. Yang, Y.F.; Cheng, Y.H.; Liao, C.M. In situ remediation-released zero-valent iron nanoparticles impair soil ecosystems health: A C. elegans biomarker-based risk assessment. J. Hazard. Mater. 2016, 317, 210–220. [Google Scholar] [CrossRef]
  102. Gong, X.M.; Huang, D.L.; Liu, Y.G.; Zeng, G.M.; Wang, R.Z.; Wan, J.; Zhang, C.; Cheng, M.; Qin, X.; Xue, W.J. Stabilized Nanoscale Zerovalent Iron Mediated Cadmium Accumulation and Oxidative Damage of Boehmeria nivea (L.) Gaudich Cultivated in Cadmium Contaminated Sediments. Environ. Sci. Technol. 2017, 51, 11308–11316. [Google Scholar] [CrossRef] [PubMed]
  103. Liu, N.; Zhang, Y.F.; Zheng, C.L.; Tang, C.L.; Guan, J.; Guo, Y.G. Sulfidated nanoscale zero valent iron for in situ immobilization of hexavalent chromium in soil and response of indigenous microbes. Chemosphere 2023, 344, 140343. [Google Scholar] [CrossRef] [PubMed]
  104. Wu, S.L.; Cajthaml, T.; Semerád, J.; Filipová, A.; Klementová, M.; Skála, R.; Vítková, M.; Michálková, Z.; Teodoro, M.; Wu, Z.X.; et al. Nano zero-valent iron aging interacts with the soil microbial community: A microcosm study. Environ. Sci. Nano 2019, 6, 1189–1206. [Google Scholar] [CrossRef]
  105. Singh, R.; Misra, V.; Singh, R.P. Removal of Cr(VI) by Nanoscale Zero-valent Iron (nZVI) From Soil Contaminated with Tannery Wastes. Bull. Environ. Contam. Toxicol. 2012, 88, 210–214. [Google Scholar] [CrossRef]
Figure 1. SEM images of CIP (a), BC (b) and CIP@BC composite (c).
Sustainability 17 04281 g001
Figure 2. The composition (a,b) of elements C (c), O (d), Si (e), and Fe (f) of CIP@BC.
Sustainability 17 04281 g002
Figure 3. EDS analysis of CIP@BC composites before (a) and after (b) adsorption. The lower curve represents the elemental content distribution profile obtained through point scanning analysis, while the upper-right table presents the corresponding mass ratios and atomic ratios of distinct elements.
Sustainability 17 04281 g003
Figure 4. XRD patterns of BC (a), CIP (b), and CIP@BC composite (c).
Sustainability 17 04281 g004
Figure 5. FTIR diagram of CIP@BC composite.
Sustainability 17 04281 g005
Figure 6. Fitting curves of quasi-first-order dynamic model (a) and quasi-second-order dynamic model (b).
Sustainability 17 04281 g006
Figure 7. Adsorption mechanism diagram.
Sustainability 17 04281 g007
Figure 8. Changes in soil pH and conductivity. Letters a to d indicate significant differences between different treatment groups (p < 0.05).
Sustainability 17 04281 g008
Figure 9. Soil moisture content, cation exchange, and organic matter. Groups that do not share the same letter are significantly (p < 0.05) different from each other.
Sustainability 17 04281 g009
Figure 10. Variations in Cu content across different treatments in acidic soil. Columns with the same letters are not significantly different.
Sustainability 17 04281 g010
Figure 11. Proportional map of various morphological components of Cu in acidic soil.
Sustainability 17 04281 g011
Figure 12. Lithotripsy diagram.
Sustainability 17 04281 g012
Figure 13. Pearson correlation analysis of soil physicochemical properties and total content of heavy metal Cu in soil.
Sustainability 17 04281 g013
Table 1. Physicochemical properties of soils.
ProjectDetection Value
Soil pH4.27
Moisture content (%)13.15
Electrical conductivity (μS·cm−1)774.60
Organic matter (mg·kg−1)8.87
Cation exchange capacity (cmol+·kg−1)8.65
Total Cu content (mg·kg−1)2398.29
Acid-soluble Cu content (mg·kg−1)349
Reducible Cu content (mg·kg−1)252
Oxidizable Cu content (mg·kg−1)801
Residual Cu content (mg·kg−1)582
Table 2. Comparison of adsorption capacity of different biochar materials.
AdsorbentExperimental Conditions (pH; Temperature; Dosage; Initial Cu2+ Concentration Range)Adsorption Capacity (mg·g−1)References
Fe–biochar composite5.5; 25 °C; 2 g·L−1;
10–1000 mg·L−1
276.12[38]
Magnetized pine-needle biochar2–10; 23 ± 2 °C; 0.01 g;
10−5–9 × 10⁻³ mol·L−1
63.5[39]
Rice husk biochar5; 30 °C; 1–10 g·L−1;
20 mg·L−1
13.12[40]
N-doped biochar derived from co-hydrothermal carbonization of rice husk and Chlorella pyrenoidosa29.11
Rice husk biochar6; 25 °C; 1 g·L−1; 1 g·L−1633.5This research
Carbonyl iron powder218.25
Composite material prepared by wet grinding when the mass ratio of biochar to carbonyl iron powder is 1:1651
Composite material prepared by dry grinding when the mass ratio of biochar and carbonyl iron powder is 1:1623.25
Composite material prepared by wet grinding when the mass ratio of biochar to carbonyl iron powder is 5:1243
Composite material prepared by dry grinding when the mass ratio of biochar and carbonyl iron powder is 5:1718.5
Composite material prepared by wet grinding when the mass ratio of biochar to carbonyl iron powder is 10:1910.5
Composite material prepared by dry grinding when the mass ratio of biochar and carbonyl iron powder is 10:1 (CIP@BC)860.25
Table 3. Variable settings of soil culture tests.
GroupBC (w/w)CIP@BC (w/w)
CK00
BP101
BP202
BP304
BP406
BC60
Table 4. Parameters of adsorption kinetic models.
MatterExperimental Maximum Adsorption Capacity/(mg·g−1)Quasi-First-Order Kinetic ModelQuasi-Second-Order Kinetic Model
Qek1R2Qek2R2
BC26.5051.9201.460 × 10−30.80426.5460.0030.999
CIP@BC43.3802.8627.547 × 10−40.91243.2710.0020.999
Table 5. Isothermal adsorption line parameters.
MatterLangmuir Isothermal Adsorption ModelFreundlich Isothermal Adsorption Model
QmkLR2kF1/nR2
BC44.5830.4830.9800.24119.4500.489
CIP@BC442.4780.0360.9880.62319.4070.957
Table 6. Available Cu fractions in soils under different treatments. Statistical significance is denoted by differing letters (p < 0.05).
GroupsCKBP1BP2BP3BP4BC
DTPA-Cu147.51 ± 11.62 a100.84 ± 9.93 b90.40 ± 4.46 b67.59 ± 7.21 c48.30 ± 2.16 d50.33 ± 3.91 d
Disclaimer/Publisher’s Note: The statements, opinions and data contained in all publications are solely those of the individual author(s) and contributor(s) and not of MDPI and/or the editor(s). MDPI and/or the editor(s) disclaim responsibility for any injury to people or property resulting from any ideas, methods, instructions or products referred to in the content.

