Article

A Sustainable Multi-Criteria Optimization Approach for the Energy Retrofit of Collective Housing in Algeria Using the ELECTRE III Tool

by
Nesrine Chabane
1,
Abderahemane Mejedoub Mokhtari
1,
Malika Kacemi
2,
Zouaoui R. Harrat
3,*,
Nahla Hilal
4,*,
Naida Ademović
5 and
Marijana Hadzima-Nyarko
6
1
Laboratoire Matériaux, Sols et Thermique (LMST), Faculty of Architecture and Civil Engineering, University of Science and Technology of Oran Mohamed Boudiaf (USTO-MB), 1505 El Menaouer, Oran 31000, Algeria
2
Laboratoire Métropole Architecture Urbanisme Société (LAMAUS), Faculty of Architecture and Civil Engineering, University of Science and Technology of Oran Mohamed Boudiaf (USTO-MB), 1505 El Menaouer, Oran 31000, Algeria
3
Laboratoire des Structures et Matériaux Avancées dans le Génie Civil et Travaux Publics, Djilllali Liabes University, Sidi Bel Abbes 22000, Algeria
4
Scientific Affairs Department, University of Fallujah, Fallujah 31002, Iraq
5
Faculty of Civil Engineering, University of Sarajevo, Patriotske lige St. 30, 71000 Sarajevo, Bosnia and Herzegovina
6
Faculty of Civil Engineering and Architecture Osijek, Josip Juraj Strossmayer University of Osijek, Vladimir Preloga St. 3, 31000 Osijek, Croatia
*
Authors to whom correspondence should be addressed.
Sustainability 2025, 17(10), 4273; https://doi.org/10.3390/su17104273
Submission received: 27 March 2025 / Revised: 27 April 2025 / Accepted: 6 May 2025 / Published: 8 May 2025
(This article belongs to the Section Green Building)

Abstract

:
This study proposes a sustainable multi-criteria optimization framework for the energy retrofit of collective residential buildings in Algeria, particularly those constructed between the 1970s and 1980s. Through on-site surveys, energy consumption analysis, and seasonal temperature measurements, the high energy demand of these buildings was confirmed. Using EnergyPlus simulations based on Meteoblue weather data, 16 retrofit strategies were assessed—incorporating various insulating materials applied internally or externally (via rendering or cladding). The ELECTRE III decision-making tool was employed, supported by the Simos Revised Framework (SRF) for weighting environmental, economic, and social criteria. Results demonstrate that all strategies significantly reduce energy demand—by up to 72.5%, with reductions reaching 94.4% in winter and 43.5% in summer, depending on insulation type and placement. Improvements in indoor thermal comfort were also observed, with exterior insulation beneath cladding offering the best performance during winter, while exterior rendering also proved effective in the summer. The ELECTRE III analysis identified rock wool and polyurethane with fiber cement cladding as optimal insulation solutions. The proposed approach supports national energy policies and aligns with the Sustainable Development Goals (SDGs), offering a replicable model for large-scale building retrofits in similar climatic and architectural contexts.

1. Introduction

Buildings represent a major sector in global energy consumption, accounting for 30% to 50% of total energy demand worldwide. This demand continues to rise, particularly in developing economies, where the annual growth rate is estimated at 3.2%, compared to 1.1% in developed nations [1,2]. In Algeria, the residential and tertiary sectors together consume 47% of the country’s total energy and contribute 21% of greenhouse gas emissions [3]. Forecasts suggest that energy demand in Algeria’s housing sector will escalate from 117.4 TWh/year in 2008 to 413.4 TWh/year by 2050 [4]. In response to this growing challenge, the Algerian government launched the National Energy Efficiency Program (NEEP), which aims to retrofit 100,000 homes annually by 2030. The program focuses primarily on enhancing building envelopes through the insulation of walls, roofs, and windows, with 80% of costs subsidized by the National Fund for Energy Efficiency (NFEE) [5]. However, the program lacks specific guidance on intervention methods and the optimal selection of insulation materials.
Energy retrofitting is widely recognized as a cost-effective strategy for reducing both energy consumption and CO2 emissions [6]. Improvements in insulation and airtightness are particularly significant contributors to these reductions [7]. In the Algerian context, research has largely focused on the role of the building envelope in improving energy efficiency [8]. For instance, Bentoumi et al. [9] demonstrated that applying insulation to roofs and floors can reduce heating energy consumption by 55% and air-conditioning demand by 18%. Similarly, Ahn et al. [10] showed that modifying the U-value of windows in poorly insulated buildings can lead to reductions in energy demand ranging from 7.9% to 16.7%. Despite these contributions, further investigation is still needed, particularly concerning the positioning of insulation and the comparative effectiveness of internal versus external retrofitting.
In recent years, the research focus has broadened to include more comprehensive retrofit strategies. Shu et al. [11], for example, explored large-scale retrofitting in smart and connected communities, identifying research opportunities in building design, mechanical systems, and human-centered approaches. Desvallées [12] highlighted the challenge of combining energy efficiency with social inclusion, particularly in southern Europe, where social housing providers tend to prioritize envelope retrofitting over renewable energy solutions—sometimes at the expense of addressing deeper issues of energy poverty. In Algeria, Djafri et al. [13] emphasized the urgency of improving housing quality, given the country’s ongoing housing shortage. Benmicia [14] also underlined the need for residential energy retrofits tailored to local thermal comfort needs. Elsewhere, Taylor et al. [15] analyzed the impact of retrofitting in Florida’s multifamily housing sector and reported substantial electricity savings, while Hens [16] demonstrated through long-term observation that improvements in insulation, airtightness, and heating systems often yield greater benefits than the installation of solar panels.
Further studies have underscored the pivotal role of insulation techniques in improving building energy performance. Zhang et al. [17,18] reported that external wall insulation can reduce heating loads by approximately 30%. Ozel [19] examined the influence of insulation placement, concluding that internal insulation results in the smallest phase shift, whereas external insulation yields the lowest decrement factor. Al-Sanea and Zedan [20] highlighted the substantial impact of insulation under transient thermal conditions. Nevertheless, despite their demonstrated benefits, natural insulation materials remain underutilized, primarily due to functional limitations and the limited availability of research on their real-world applications [21].
This study focuses on energy retrofitting through building envelope insulation, specifically investigating the impact of insulation positioning on energy consumption and evaluating a range of retrofit strategies. Although prior research has examined energy optimization based on cost and life-cycle performance, comparative assessments—particularly between rendering and cladding in external insulation applications—remain scarce. Bridging this gap is essential for refining retrofit practices and improving the effectiveness of insulation strategies. This study targets prefabricated houses built in Algeria during the 1970s and 1980s, a period when construction techniques resulted in buildings with high energy demand and limited thermal performance. These structures, concentrated in some of Algeria’s most energy-intensive regions, represent a strategic priority for intervention under the country’s national energy efficiency framework.
The selection of appropriate retrofit strategies is a complex decision-making problem shaped by the interplay of environmental, economic, and social considerations. In this context, Multiple Criteria Decision Analysis (MCDA) methods are widely used to assist decision makers in evaluating and comparing alternatives. Among these methods, partial aggregation techniques such as ELECTRE (Elimination and Choice Expressing Reality) and PROMETHEE II (Preference Ranking Organization METHod for Enrichment Evaluation) have proven to be particularly effective [22,23]. For example, PROMETHEE II has been successfully applied in Italy to assess both the economic and environmental performance of nearly zero-energy buildings (NZEBs) [24]. In Algeria, Seddiki et al. [5] applied the PROMETHEE GDSS framework to evaluate retrofitting strategies for heritage buildings, while Daniel et al. [25] employed ELECTRE TRI for categorizing residential retrofit solutions. Despite their usefulness, classification methods such as ELECTRE TRI can sometimes fall short in providing the precision needed for robust decision making in retrofit projects.
In this regard, ELECTRE III represents a more advanced ranking methodology, offering greater flexibility and precision in prioritizing retrofit alternatives [26]. Several authors, including Salminen et al. [27] and Kokaraki et al. [28], have recommended ELECTRE III over methods such as SMART and PROMETHEE, particularly for sustainability-focused assessments. Its ability to handle uncertainty and address the incomparability between alternatives makes ELECTRE III especially suited to the complex nature of energy retrofit decisions [29,30]. Notably, the method has already been applied in the context of office building rehabilitation. One study, supported by the Swiss Academy of Engineering Sciences (SATW), used ELECTRE III to rank façade intervention scenarios [31]. Similarly, the European Joule-Thermie Office project employed ELECTRE III for multi-criteria evaluations, incorporating criteria such as energy performance, environmental impact, indoor environmental quality, and cost [32].
Despite these promising examples, the use of ELECTRE III in energy retrofit studies remains limited. For instance, Catalina et al. [33] applied the method to compare renewable energy systems for individual buildings, and Almeida et al. [34] developed a five-criteria model for selecting facade retrofit solutions—although their analysis did not fully account for dynamic factors such as energy consumption, CO2 emissions, or economic costs. Given the method’s comprehensive and structured evaluation capabilities, ELECTRE III is particularly well-suited for this research.
In contrast to previous studies, which often rely on static or partial evaluation criteria, this research combines dynamic energy simulations with the ELECTRE III method to compare a variety of retrofit scenarios. This study also integrates the Simos Revised Framework (SRF) to assign weights to criteria in a coherent and structured manner. A key strength of this work lies in its investigation of different insulation configurations, including both internal and external solutions. The selected evaluation criteria reflect the environmental, social, and economic priorities specific to the Algerian context, ultimately providing a decision-support tool tailored to local needs.
To address this research objective, the remainder of this paper is structured as follows:
  • Section 2 presents the methodology, detailing both analytical and experimental components;
  • Section 3 discusses the case study;
  • Section 4 presents and discusses the results;
  • Section 5 provides the conclusions and outlines future research directions.

2. Methodology and Tools

2.1. The Methodological Approach

The proposed approach addresses both quantitative and qualitative aspects related to building rehabilitation. As shown in the flowchart of Figure 1, the work is structured into three main sections with corresponding sub-steps. First, an analytical section is conducted in which the energy performance of buildings in their initial state is evaluated (Steps 1–4). This evaluation requires both a preliminary diagnosis and a comprehensive assessment to verify compliance with the Algerian Thermal Regulations (RETA code) [35], a national regulatory framework that establishes the minimum performance thresholds for residential energy efficiency. Introduced in 1999 and derived from Law No. 99-09, RETA is supported by technical documents that define seasonal requirements—DTR C3-2 for winter conditions [36] and DTR C3-4 for summer conditions [37]. These regulations directly influence the retrofit decision-making process by defining whether a proposed intervention meets the required thermal performance standards. Only retrofit strategies that achieve compliance with RETA and DTR benchmarks are considered viable under national policy and are eligible for financial support through the National Fund for Energy Efficiency (NFEE). Accordingly, the assessment phase included a detailed analysis of four years of gas and electricity billing records, supplemented by resident questionnaires. These provided insights into occupancy patterns, household appliance use, ventilation practices, perceived thermal comfort, and the number of occupants—factors essential for accurate simulation and strategy selection within the regulatory framework.
Next, a range of rehabilitation solutions is proposed to improve energy efficiency and reduce energy consumption and CO2 emissions (step 5). These solutions are designed to enhance the building envelope, including insulation of walls, roofs, and windows, in accordance with RETA and DTR guidelines. The final section introduces a decision-support method, ELECTRE III, to rank the alternatives and provide recommendations (step 6).
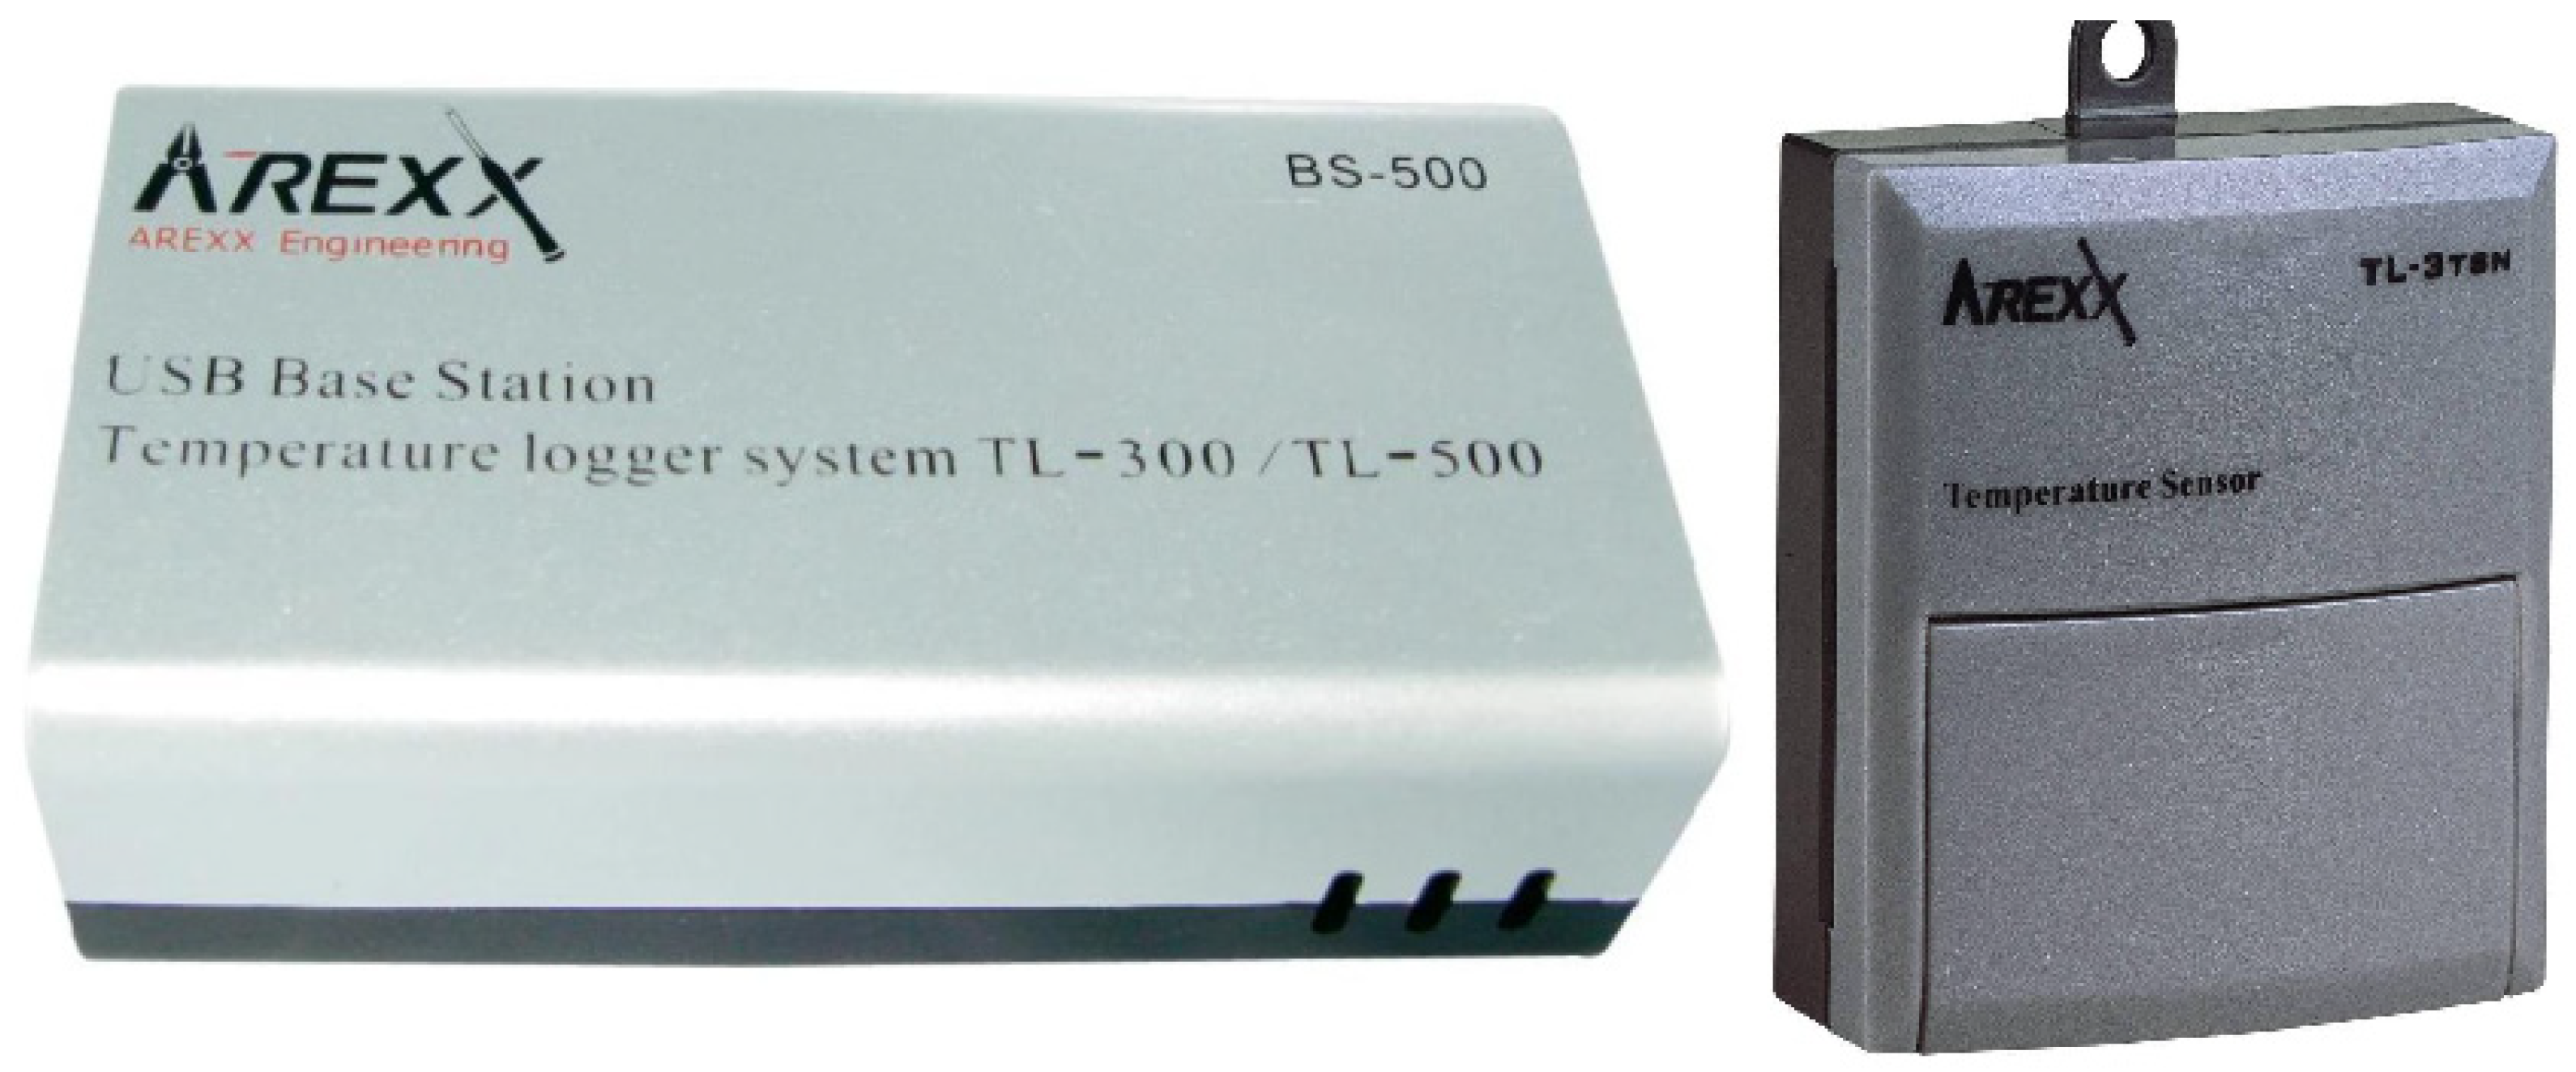
Building design parameters, indoor conditions, and weather data were obtained from Meteoblue [38] and integrated into the EnergyPlus software 9.2 [39] to generate the simulation model. To validate the model, indoor air temperature readings were collected and compared with simulation predictions. For experimental measurements, wireless ambient temperature sensors (Figure 2) were employed to monitor indoor air temperature. These sensors (Arexx, Zwolle, The Netherlands) featured an integrated temperature probe and a high-frequency radio transmitter, which relayed data to the BS-500 recording system via radio frequency (RF). The sensors operated within a measurement range of −30 °C to 80 °C, with an effective transmission range of approximately 50 m (up to 100 m in open areas).

2.2. Decision-Support Method: ELECTRE III

ELECTRE III is a multi-criteria decision-making (MCDM) method designed for complex problems involving conflicting criteria, such as evaluating energy retrofit strategies for collective housing. It enables the comparative assessment of different alternatives using both qualitative and quantitative data. The method’s structured approach aids in identifying globally beneficial solutions, making it relevant across fields concerned with sustainability, public policy, and strategic urban planning.
The following section presents the conceptual framework and computational steps, emphasizing clarity in the role and purpose of each element of the methodology.

Conceptual Framework of the ELECTRE III Method

The ELECTRE III method was applied using the ULaval software 0.6.28 [40], enabling the comparison of retrofit strategies based on predefined criteria. These criteria cover aspects for three insulation configurations: interior insulation, exterior cladding, and exterior rendering. The selected criteria encompass environmental, economic, and social dimensions, as illustrated in Figure 2. Performance data were sourced from published comparisons [20,41,42,43,44] and various regulatory and technical documents [45,46,47].
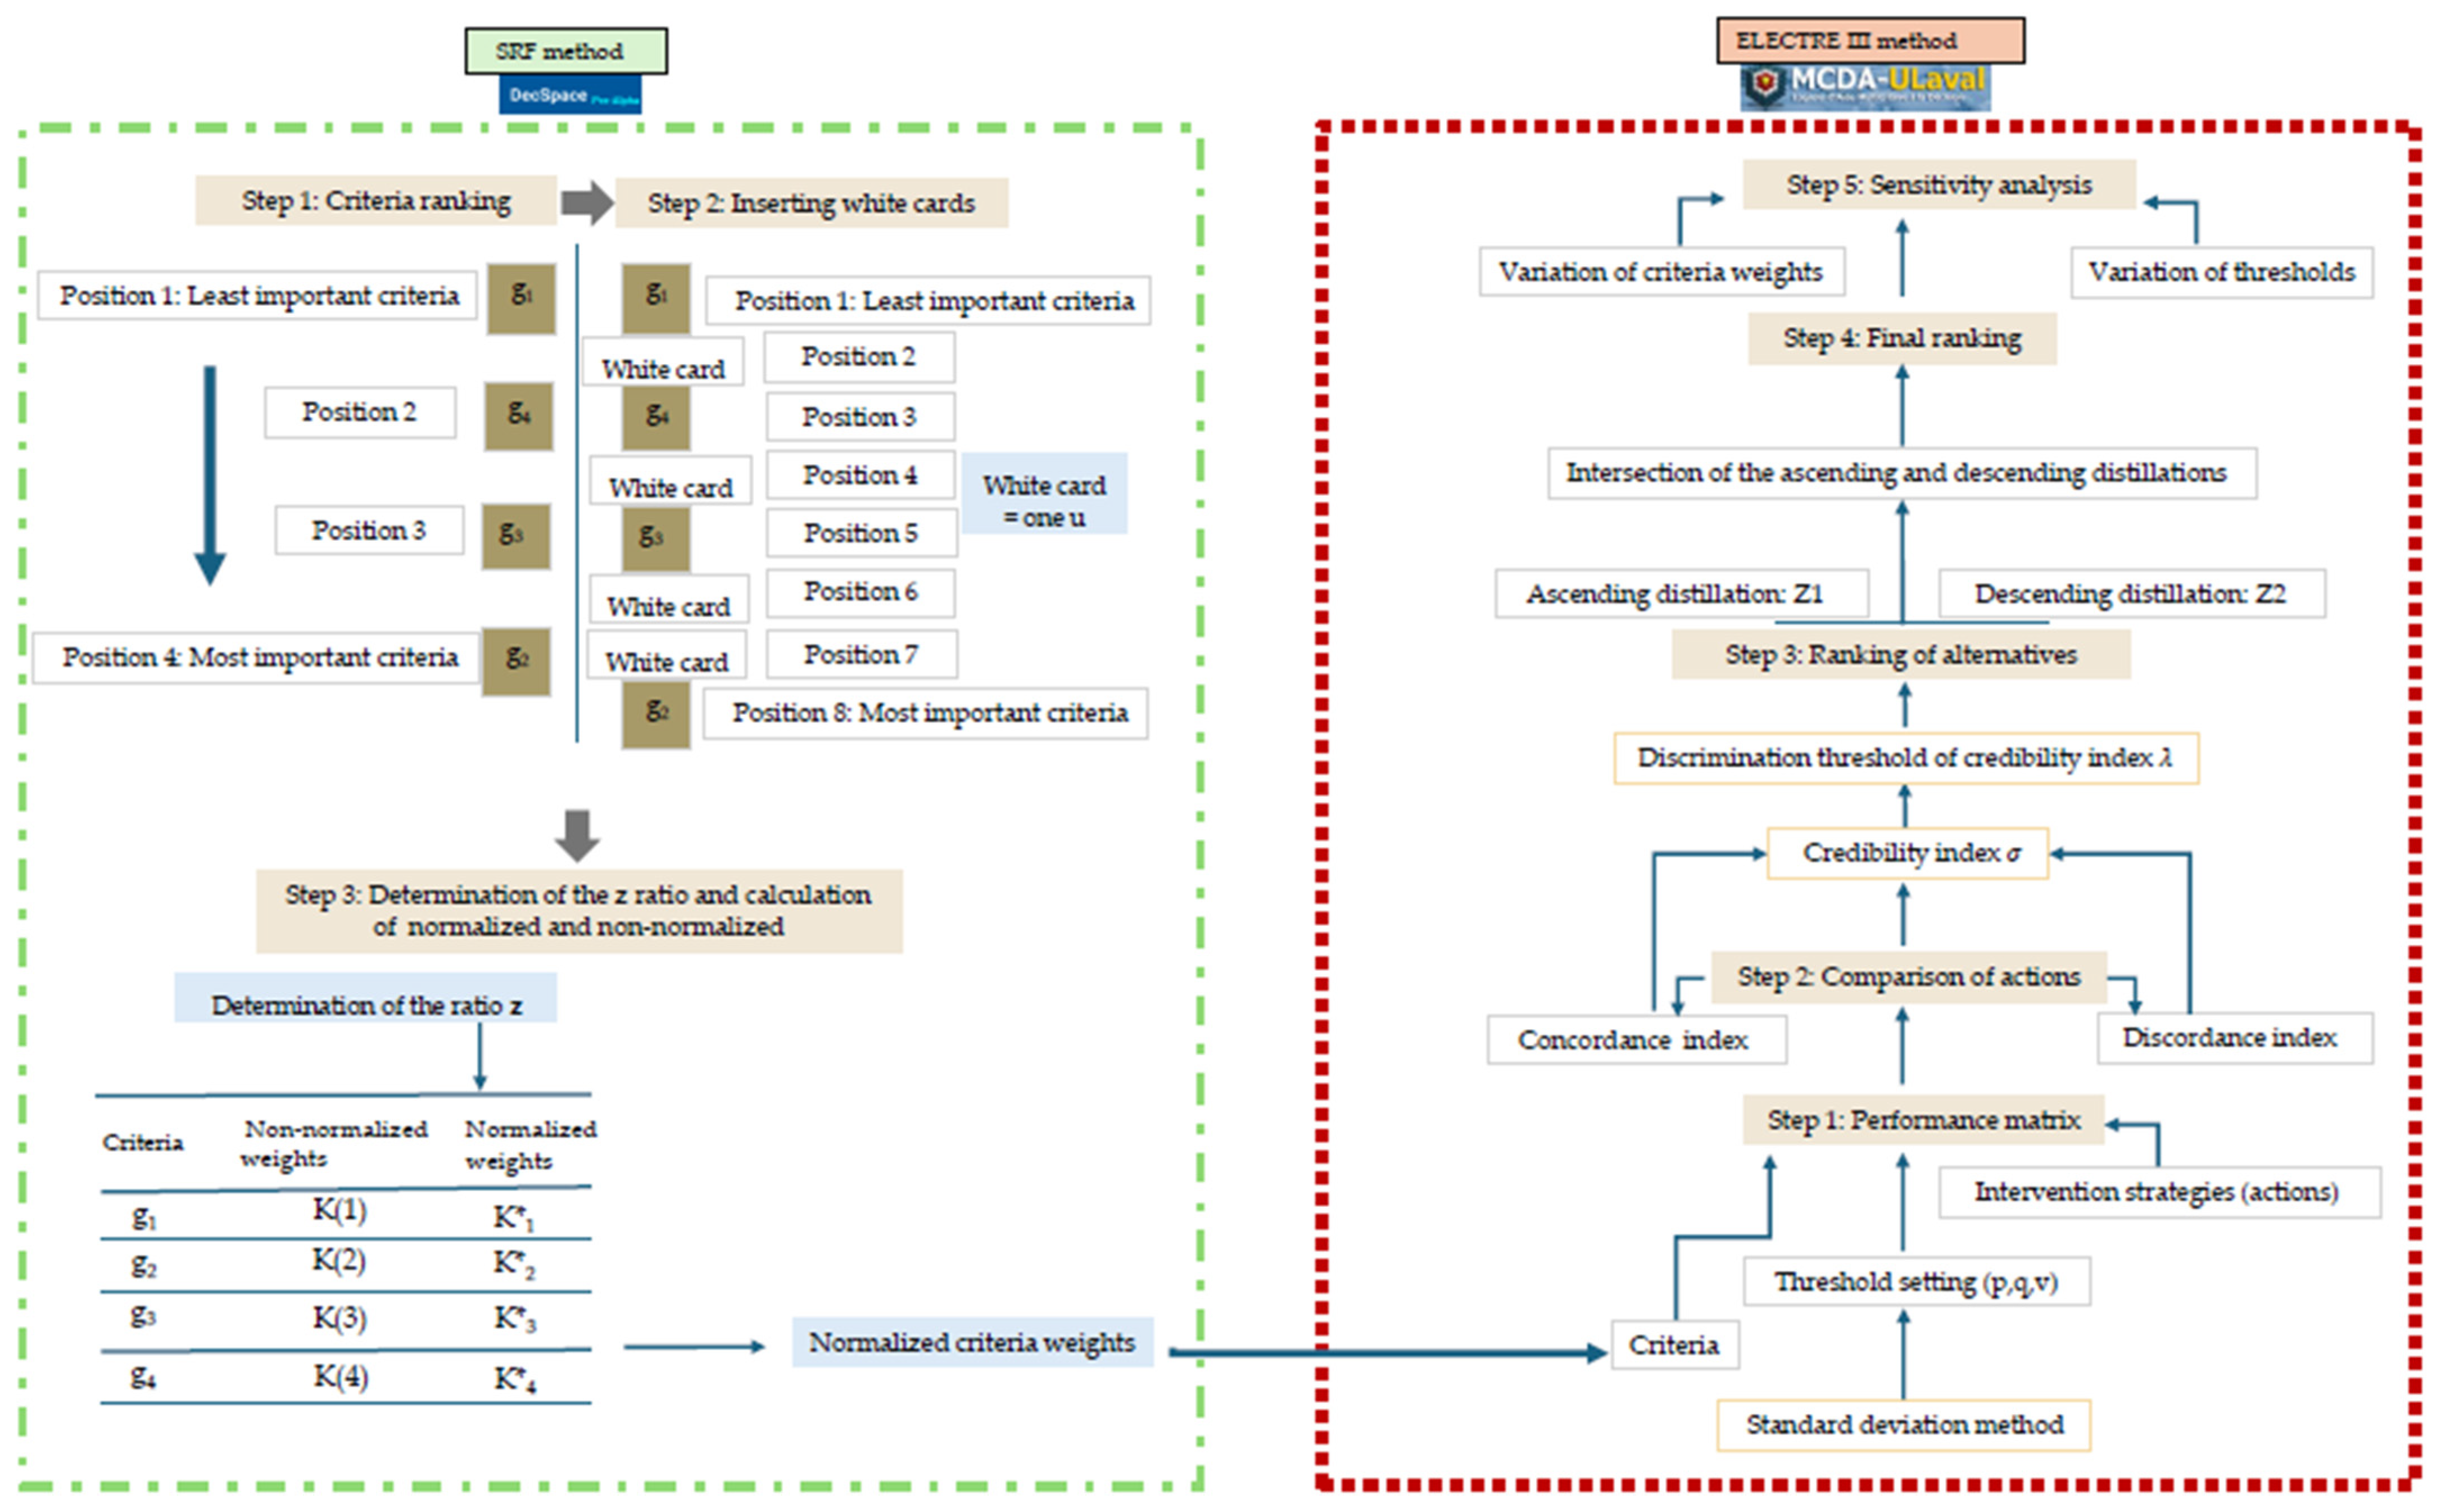
The methodology, outlined in Figure 3, follows these steps:
(1) 
Performance Matrix Construction:
Following the approach outlined by Figueira et al. [48], the process begins by defining two finite and consistent sets: A and F. The set A = a 1 , a 2 a m represents the potential solutions to the problem, while F = j = 1 n with n 3 , consists of the pseudo-criteria used to evaluate each alternative.
The next step involves constructing the performance matrix g j a i where strategies (S) are organized in rows and criteria in columns. Each criterion is assigned a weight to reflect its relative importance, as determined by the decision maker.
(2) 
Weighting the Criteria:
To establish these weights, the Simos Revised Framework (SRF) method is applied (Figure 3). This approach requires the decision maker to rank a set of criteria cards from least to most important. Blank cards are placed between criteria cards to create gaps, which increase by one or more u units each time, thereby refining the ranking.
Each criterion must be assigned a numerical importance to reflect its influence in the decision-making process. These values begin as non-normalized weights, denoted k(r), which simply represent how the decision maker initially perceives the importance of each criterion based on their ranking. These values stem from an intuitive ranking process, where the decision maker prioritizes each criterion based on their subjective judgment. However, these raw values do not yet sum to 1 or 100, so they require normalization. Let w j represent the coefficient of relative importance for criterion g j , ensuring that the sum of all coefficients satisfies j = 1 n w j = 1 . A detailed explanation of the SRF method is provided by Figueira and Roy [49].
z = ( i = 0 ( q 1 ) T i ) p ( i = 0 ( p 1 ) 1 + i ) q
where, z is the fraction between the sum of the weights (ranks) of the most important criteria rated q and those of the least important rated p with T total number of cards.
This coefficient (z) is used in the revised Simos’ procedure to recalculate the new numerical value of the unit u:
u = z 1 e
  e = r = 1 n ¯ 1 e r   and   e r = e r + r
where n ¯ : number of equivalence classes, e r is the number of blank cards between cards r and r + 1 (criterion cards).
From the non-normalized weights k r we deduce the normalized weights:
k = k r ;   K = i = 1 n k i  
where k i is the non-normalized weight of criterion gi of rank r:
k i * = 100   ×   k i k
where,   k i * is non-standardized weight with decimals.
Normalized weights need to be rounded to whole numbers using numerical calculation techniques to approximate the decimal places to determine weights with whole numbers whose total is equal to 100.
To define the preference thresholds that determine how alternatives are judged against each other, ELECTRE III requires statistical insights into the performance data. Specifically, the method computes the arithmetic mean (μ) and standard deviation (σ) for each criterion. These statistical values help calibrate thresholds that distinguish between weak preferences, strict preferences, and vetoes. According to Roy and Bouyssou [50], the three comparison thresholds are added to the matrix; ( p j g j ( a i ) ) is the strict preference threshold,   q j ( g j a i ) is the weak preference threshold, and v j ( g j ( a i ) ) is the veto threshold for each of the actions a i varying from 1 to n. The performance distribution of   g   j ( a i ) actions has an arithmetic mean value of μ and a standard deviation value of:
σ = 1 n 2 i = 1 n ( g j ( a i ) μ ) 2
v j = γ   ×   σ
q j = α   ×   σ
p j = β   ×   σ
Equations (7)–(9) utilize predefined percentage values, where γ is initially set at 50%, α at 5%, and β at 10%. The performance objective can be either maximization or minimization.
Each comparison is the binary outranking relationship noted S j on A × A to construct a subset R = a 1 , a 2 ; a 1 , a 3 ; ; ( a m , a n ) of each pseudo-criterion according to the preference thresholds determined. The method uses the two thresholds noted q j ( g j a i ) , p j ( g j a i ) to compare them to the value of the numerical difference between the two performances of two actions a 1   and   a 2 as well as to all other pairs. Once thresholds are defined, the method assesses how much better or worse one alternative is compared to another. This is captured by outranking relationships using the thresholds. To illustrate the influence of thresholds on decision making, consider two retrofit strategies evaluated on the economic cost criterion. Suppose Strategy A costs 1000 DZD and Strategy B costs 1050 DZD. If the weak preference threshold (q) is 60 DZD and the strong preference threshold (p) is 100 DZD:
  • If the cost difference is below q (e.g., 50 DZD), the two strategies are considered indifferent.
  • If the cost difference falls between q and p (e.g., 70 DZD), a weak preference is expressed.
  • If the difference exceeds p (e.g., 120 DZD), a strong preference is established.
  • If the difference exceeds the veto threshold (e.g., 350 DZD), the alternative is considered unacceptable, and the outranking is blocked.
This framework enables the method to incorporate the decision maker’s tolerance for uncertainty or imprecision, reflecting more realistic decision behaviors.
Equations (10)–(13) describe these pairwise decision rules, guiding how to interpret the comparison between two actions under a given criterion. According to Figueira [48], preferences are defined as follows:
g j a 1   g j a 2   >   p j ( g j ( a 2 ) )   a 1 P j   a 2
q j ( g j a 2 )   <   g j a 1 g j   a 2     p j ( g j ( a 2 ) )   a 1 Q j a 2   hesitation   between   I j   and   P j
q j ( g j ( a 1 ) )     g j a 1 g j a 2   q j ( g j a 2 a 1   I j a 2
Equations (10)–(12) highlight that a 1   is at least as good   a 2 for criterion j.
a 1   S j a 2   with   S j =   P j Q j I j
(3) 
Concordance and Discordance Indices:
The method next evaluates how many criteria support the outranking assertion between two alternatives. This is called the concordance index.
According to Stephan [51] partial concordance is relative to each criterion j by comparing all pairs of actions in set A. It is defined for j by:
  c j ( a 1 , a 2 ) = 1 , i f   g j ( a 1 ) + q j   g j ( a 2   ) 0 , i f   g j ( a 1 ) + p j   g j ( a 2   ) o t h e r w i s e ,   g j a 1 + p j g j a 2 p j   q j
The global concordance indices C ( a i ,   a j ) on the m rows and m columns for any ( a i , a j )   A × A , therefore allowing all comparisons of all pairs of actions. The next step in the method is to determine the global concordance indices between each of the action pairs evaluated by the set of all criteria and defined by Equation (15). C S ( a 1 , a 2 )   = {j: a 1 S j a 2 } forms the group of criteria favorable to the assertion a 1 S   a 2 and C Q ( a 1 , a 2 ) = { j : a 1 Q j a 2 } is the group hesitating between indifference and opposition:
C ( a 1 , a 2 ) = j   Є   C S ( a 1 , a 2 ) W j + j   Є   C Q ( a 1 , a 2 ) W j φ j
φ j = g j ( a 1 ) g j ( a 2 ) + p j ( g j ( a 1 ) ) p j ( g j ( a 1 ) )   q j ( g j ( a 1 ) )
The veto threshold plays a crucial role in the discordance calculation. It represents a performance level so poor that, regardless of favorable outcomes in other criteria, the alternative is considered unacceptable. It acts as a hard constraint, effectively nullifying the outranking relation if violated. Discordance expresses opposition to the assertion a 1 S   a 2 with the veto threshold, which can at the same time be weakened to avoid the overly unfair exclusion of positive results acquired by   a 1 . The partial discordance index is expressed by Equation (17):
d j a 1 , a 2 = 1 , i f   g j a 2 >   g j a 1 + v j ( g j ( a 1 ) ) 0 , i f   g j a 2     g j a 1 + p j ( g j ( a 1 ) ) o t h e r w i s e , g j a 1 g j a 2 + p j ( g ( a 1 ) ) p j ( g j ( a 1 ) ) v j ( g j ( a 1 ) )
However, not all criteria may agree. Some may strongly oppose the outranking relation—especially when the performance difference violates the veto threshold. This opposition is captured by the discordance index, defined in Equation (17). A high discordance can cancel out the concordance and prevent outranking.
(4) 
Credibility Index and Final Ranking:
The result of the distillation procedure is typically a partial preorder: a ranking system where alternatives are compared in pairs, but not all pairs are strictly ranked. Some alternatives may be incomparable or deemed equivalent, reflecting indifference or hesitation. This partial ordering is more realistic for complex, multi-criteria problems than a rigid total order. For instance, a partial preorder in ELECTRE III means that Strategy A might be ranked higher than B, and B higher than C—but A and C may remain incomparable if evidence is inconclusive. This reflects real-world uncertainty.
For the credibility index, according to Stephan [51], each pair of ordered actions a 1 , a 2 A × A is evaluated by criteria g j F to judge the assertion a 1 S j a 2 . It is characterized by a credibility index σ s a 1 , a 2 [ 0 , 1 ] :
  σ s a 1 , a 2 = C a 1 , a 2 j = 1 n T j a 1 , a 2 ,   j   Є   D c
With
D c a 1 , a 2   = j   Є   F :   d j ( a 1 , a 2 )   >   C a 1 , a 2
And
T j a 1 , a 2 = 1 d j a 1 , a 2 1 C a 1 , a 2
If and only if
  d j a 1 , a 2   >   C a 1 , a 2
And
T j a 1 , a 2 = 1   when   d j a 1 , a 2     C a 1 , a 2 ,   So   σ s a 1 , a 2 = C a 1 , a 2  
According to Roy and Bouyssou [50], it is first necessary to construct the square matrix of credibility indices with values varying from [0, 1] using the above Equations (20)–(22). A credibility index discrimination threshold s(λ) with λ = σ s ( a 1 , a 2 ) is applied to the indices to determine a set of hierarchical equivalence classes D included in A. A top-down distillation results in a ranking from the best to the least good alternative in a complete preorder Z1, while a bottom-up distillation, following a similar iterative process but starting from the least good to the best, produces Z2, a complete preorder constructed by antagonistic action. A partial preorder Z, resulting from the intersection of Z1 and Z2, provides the final ranking. A partial pre-order Z resulting from the intersection of Z1 and Z2 gives the final ranking.
(5) 
Sensitivity Analysis:
In ELECTRE III, a monotonic function ensures evaluation consistency by maintaining a logical and predictable relationship between criterion performance and ranking. Specifically, an improvement in a criterion’s value—such as reduced CO2 emissions or lower energy consumption—should result in a stable or improved ranking for the corresponding alternative. This prevents scenarios where a better-performing strategy is unjustifiably ranked lower than a weaker one. For example, if Strategy A is ranked above Strategy B and A subsequently improves its insulation performance, monotonicity guarantees that A will retain its position above B, unless B also improves.
In the context of sensitivity analysis, the monotonic function is used to regulate the discrimination threshold applied to the credibility index, ensuring that as the index increases, so does the level of preference. This mechanism allows ELECTRE III to maintain the relative coherence of rankings under changes to threshold parameters. The discrimination threshold is typically modeled using a linear monotonic function:
s(λ) = α + βλ
where the parameters are commonly set to α = 0.3 and β = −0.15. Adjusting these values allows exploration of how sensitive the ranking is to variations in credibility, further reinforcing the robustness and interpretability of the decision-making process.

3. Case Study

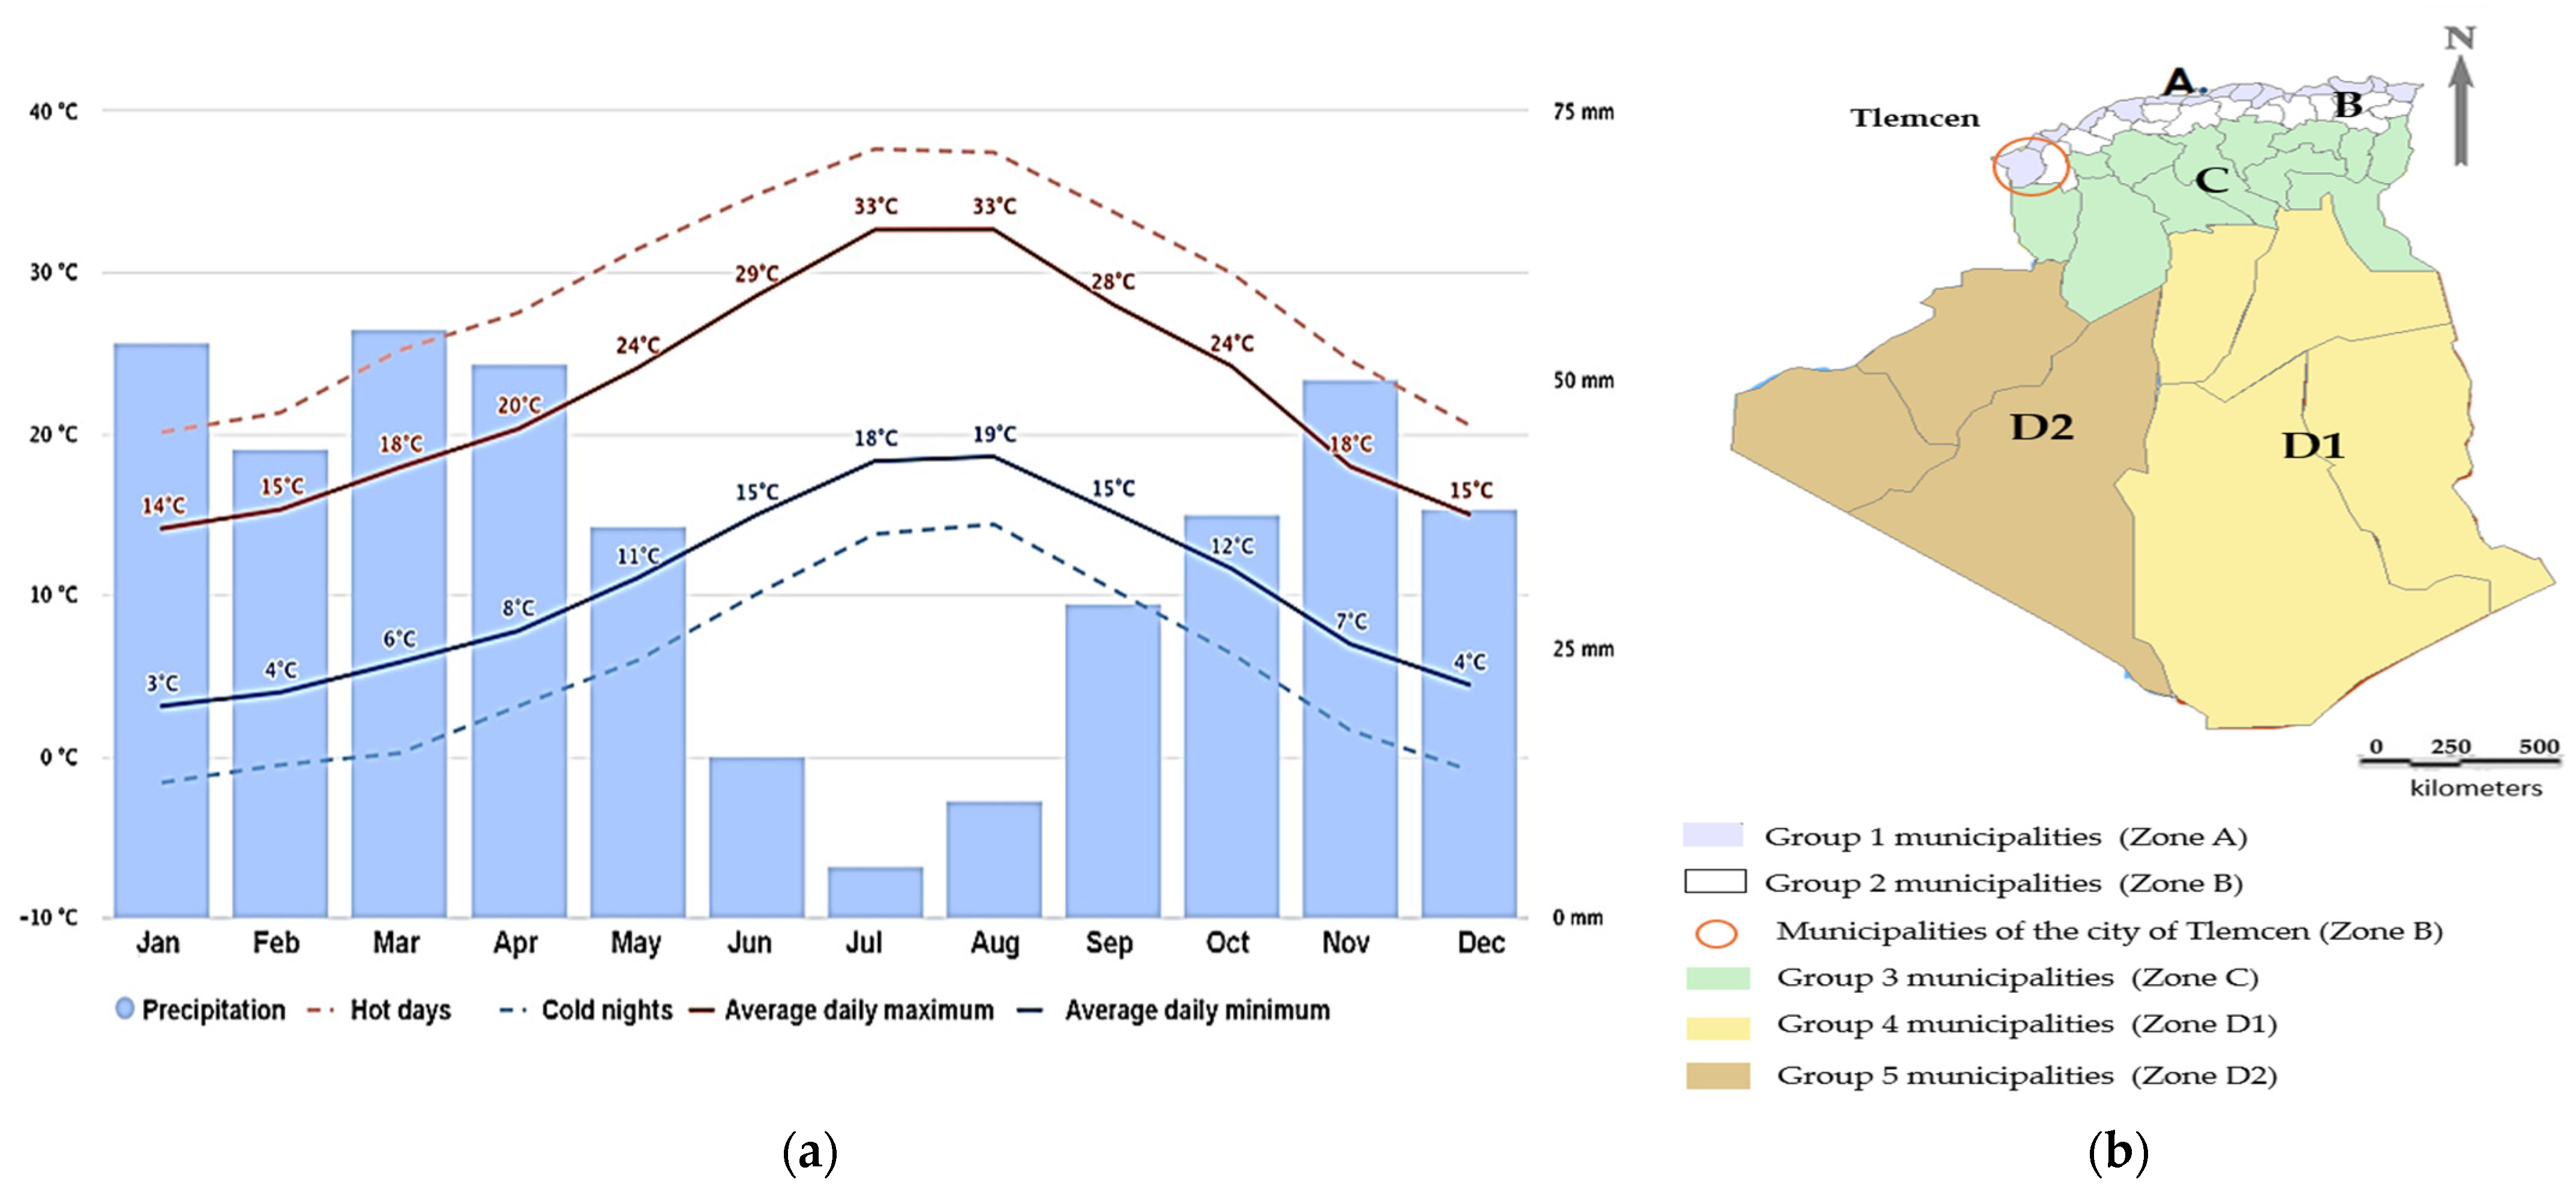
The case study is situated in the town of Tlemcen, within the municipality of Mansourah. This municipality falls under zone B according to the Algerian technical regulations [36,37], a region identified by Ouahab [52] as one of the most energy-intensive areas in the country. Tlemcen, located in northwestern Algeria at 34.56° latitude, 1.19° longitude, and an altitude of 830 m, experiences a Mediterranean climate with two distinct seasons (Figure 4). The cold winter, lasting from October to April, features significant diurnal temperature variations, with an average daily minimum of 3 °C and a humidity level of 74%. In contrast, the hot, dry summer lasts from June to September, with an average daily maximum temperature of 33 °C and a humidity level of 61%. Seasonal variations also influence wind patterns, with prevailing southwest winds in winter and cooler northwest winds in summer.
Between 1970 and 1985, Algeria extensively developed prefabricated housing, particularly in climate zones A and B, using various industrialized construction techniques. The buildings analyzed in this study were constructed using the tool formwork method, specifically the half-shell transverse tunnel technique, for the execution of transverse walls, floor slabs, and roof elements.
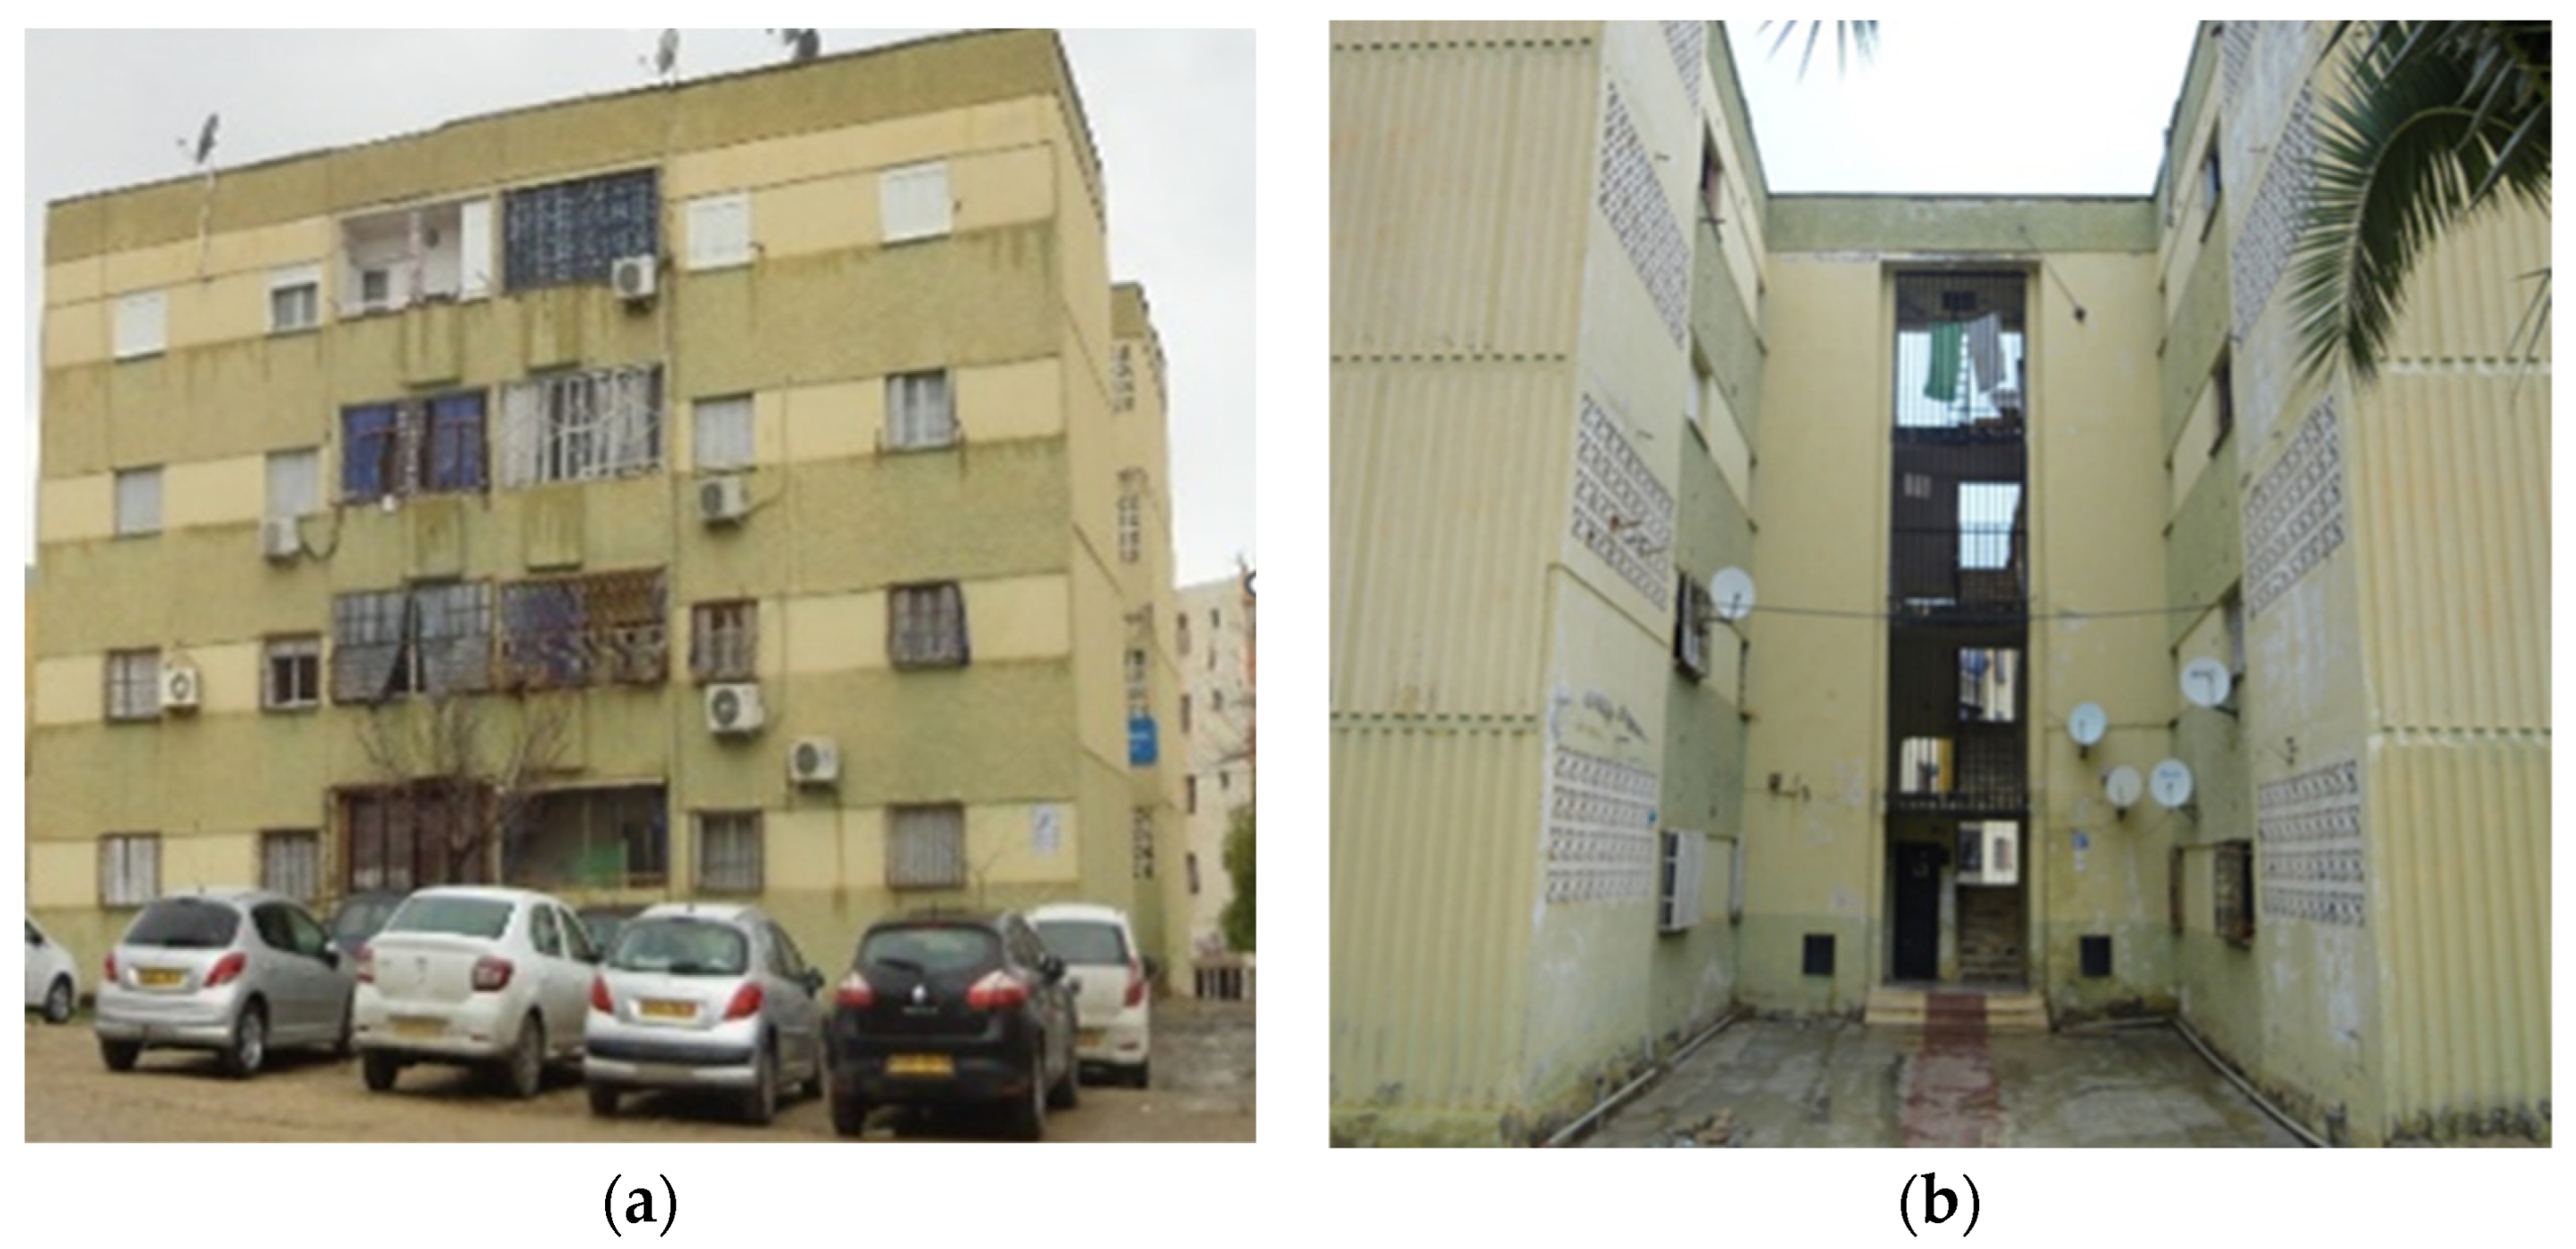
The case study focuses on Cité des Roses, a residential complex located west of Tlemcen. The complex comprises 20 identical buildings, each consisting of a ground floor and three upper stories, totaling 320 dwellings. Each floor contains four apartments accessed via a central stairwell. The buildings are elevated on a 1.50 m crawl space and were constructed without any thermal insulation—one of the defining characteristics of Algeria’s aging housing stock. Additionally, the buildings’ layout, with their parallel configuration and generous spacing, facilitates pronounced thermal interaction between indoor and outdoor environments (Figure 5 and Figure 6).
Cité des Roses exemplifies the broader thermal inefficiencies that typify prefabricated housing built in Algeria during the 1970s and 1980s. Its construction is marked by a lack of insulation, the use of single-glazed wooden windows, and high levels of air infiltration due to poor airtightness at panel joints. These deficiencies are particularly problematic in Tlemcen’s Mediterranean climate, which is characterized by significant seasonal thermal variation. Furthermore, the uniform architectural design, repetitive apartment layouts, and consistent construction materials across the site make this complex an ideal model for testing scalable and replicable retrofit solutions. These features justify the selection of Cité des Roses as a representative case for assessing energy retrofit strategies within the framework of Algeria’s national energy efficiency policy.
Table 1 presents the composition of building elements from the exterior to the interior. The structures feature load-bearing walls cast on-site using specialized formwork. Both the floors and roofs are constructed from reinforced concrete. The north and south exterior load-bearing walls are made of reinforced concrete, while the east and west walls consist of masonry with an air gap. The windows are single-glazed with wooden frames. Table 1 details the building envelope components, referenced according to technical documents [36,37,53].

3.1. Energy Balance

This study focused on a ground-floor, three-room apartment to assess its compliance with thermal regulations implemented through the RETA application [35], as described by Imessad et al. [54]. Winter heat loss was estimated at 380 W/°C, exceeding the reference value of 345 W/°C, indicating non-compliance with DTR C3-2 [36]. Additionally, the apartment does not meet the requirements of DTR C3-4 [37] due to excessive heat gain through both opaque and glazed walls, with the main issue stemming from opaque walls and floors. To analyze energy consumption, a survey was conducted among 80 ground-floor, three-room apartments (67.48 m2 each), yielding responses from 66 units.
After calculating the average annual energy consumption for this type of apartment over four years, the results indicate a cumulative average gas and electricity consumption of 214.43 kWh/m2 per year. The survey, based on responses from 66 apartments, provided insights into indoor thermal comfort (Figure 7). During summer, most residents reported discomfort, while in winter, opinions were nearly evenly split between those who found the apartment comfortable and those who experienced discomfort.
The analysis also reveals that occupants used heating from October to March and cooling from June to September. Table 2 presents the most commonly used electrical equipment and lighting sources, with specific characteristics referenced from the literature [55]. These parameters were incorporated into EnergyPlus 9.2 for simulation. The apartment was assumed to be occupied by a family of four, with occupancy patterns and appliance usage derived from the survey responses.

3.2. Validation of the Simulation Model

On-site measurements were conducted in the target apartment, a ground-floor, three-room unit. Measuring devices were installed in the parents’ bedroom (Figure 6a), which faces southwest and connects to the exterior through two walls of different compositions. Residents identified this room as the least comfortable. Heating and air conditioning were excluded from the measurements. The indoor air temperature sensor was positioned at the center of the room at a height of 0.80 m. To compare recorded indoor temperatures with simulated values, a Meteoblue weather data file was integrated for the measurement period.
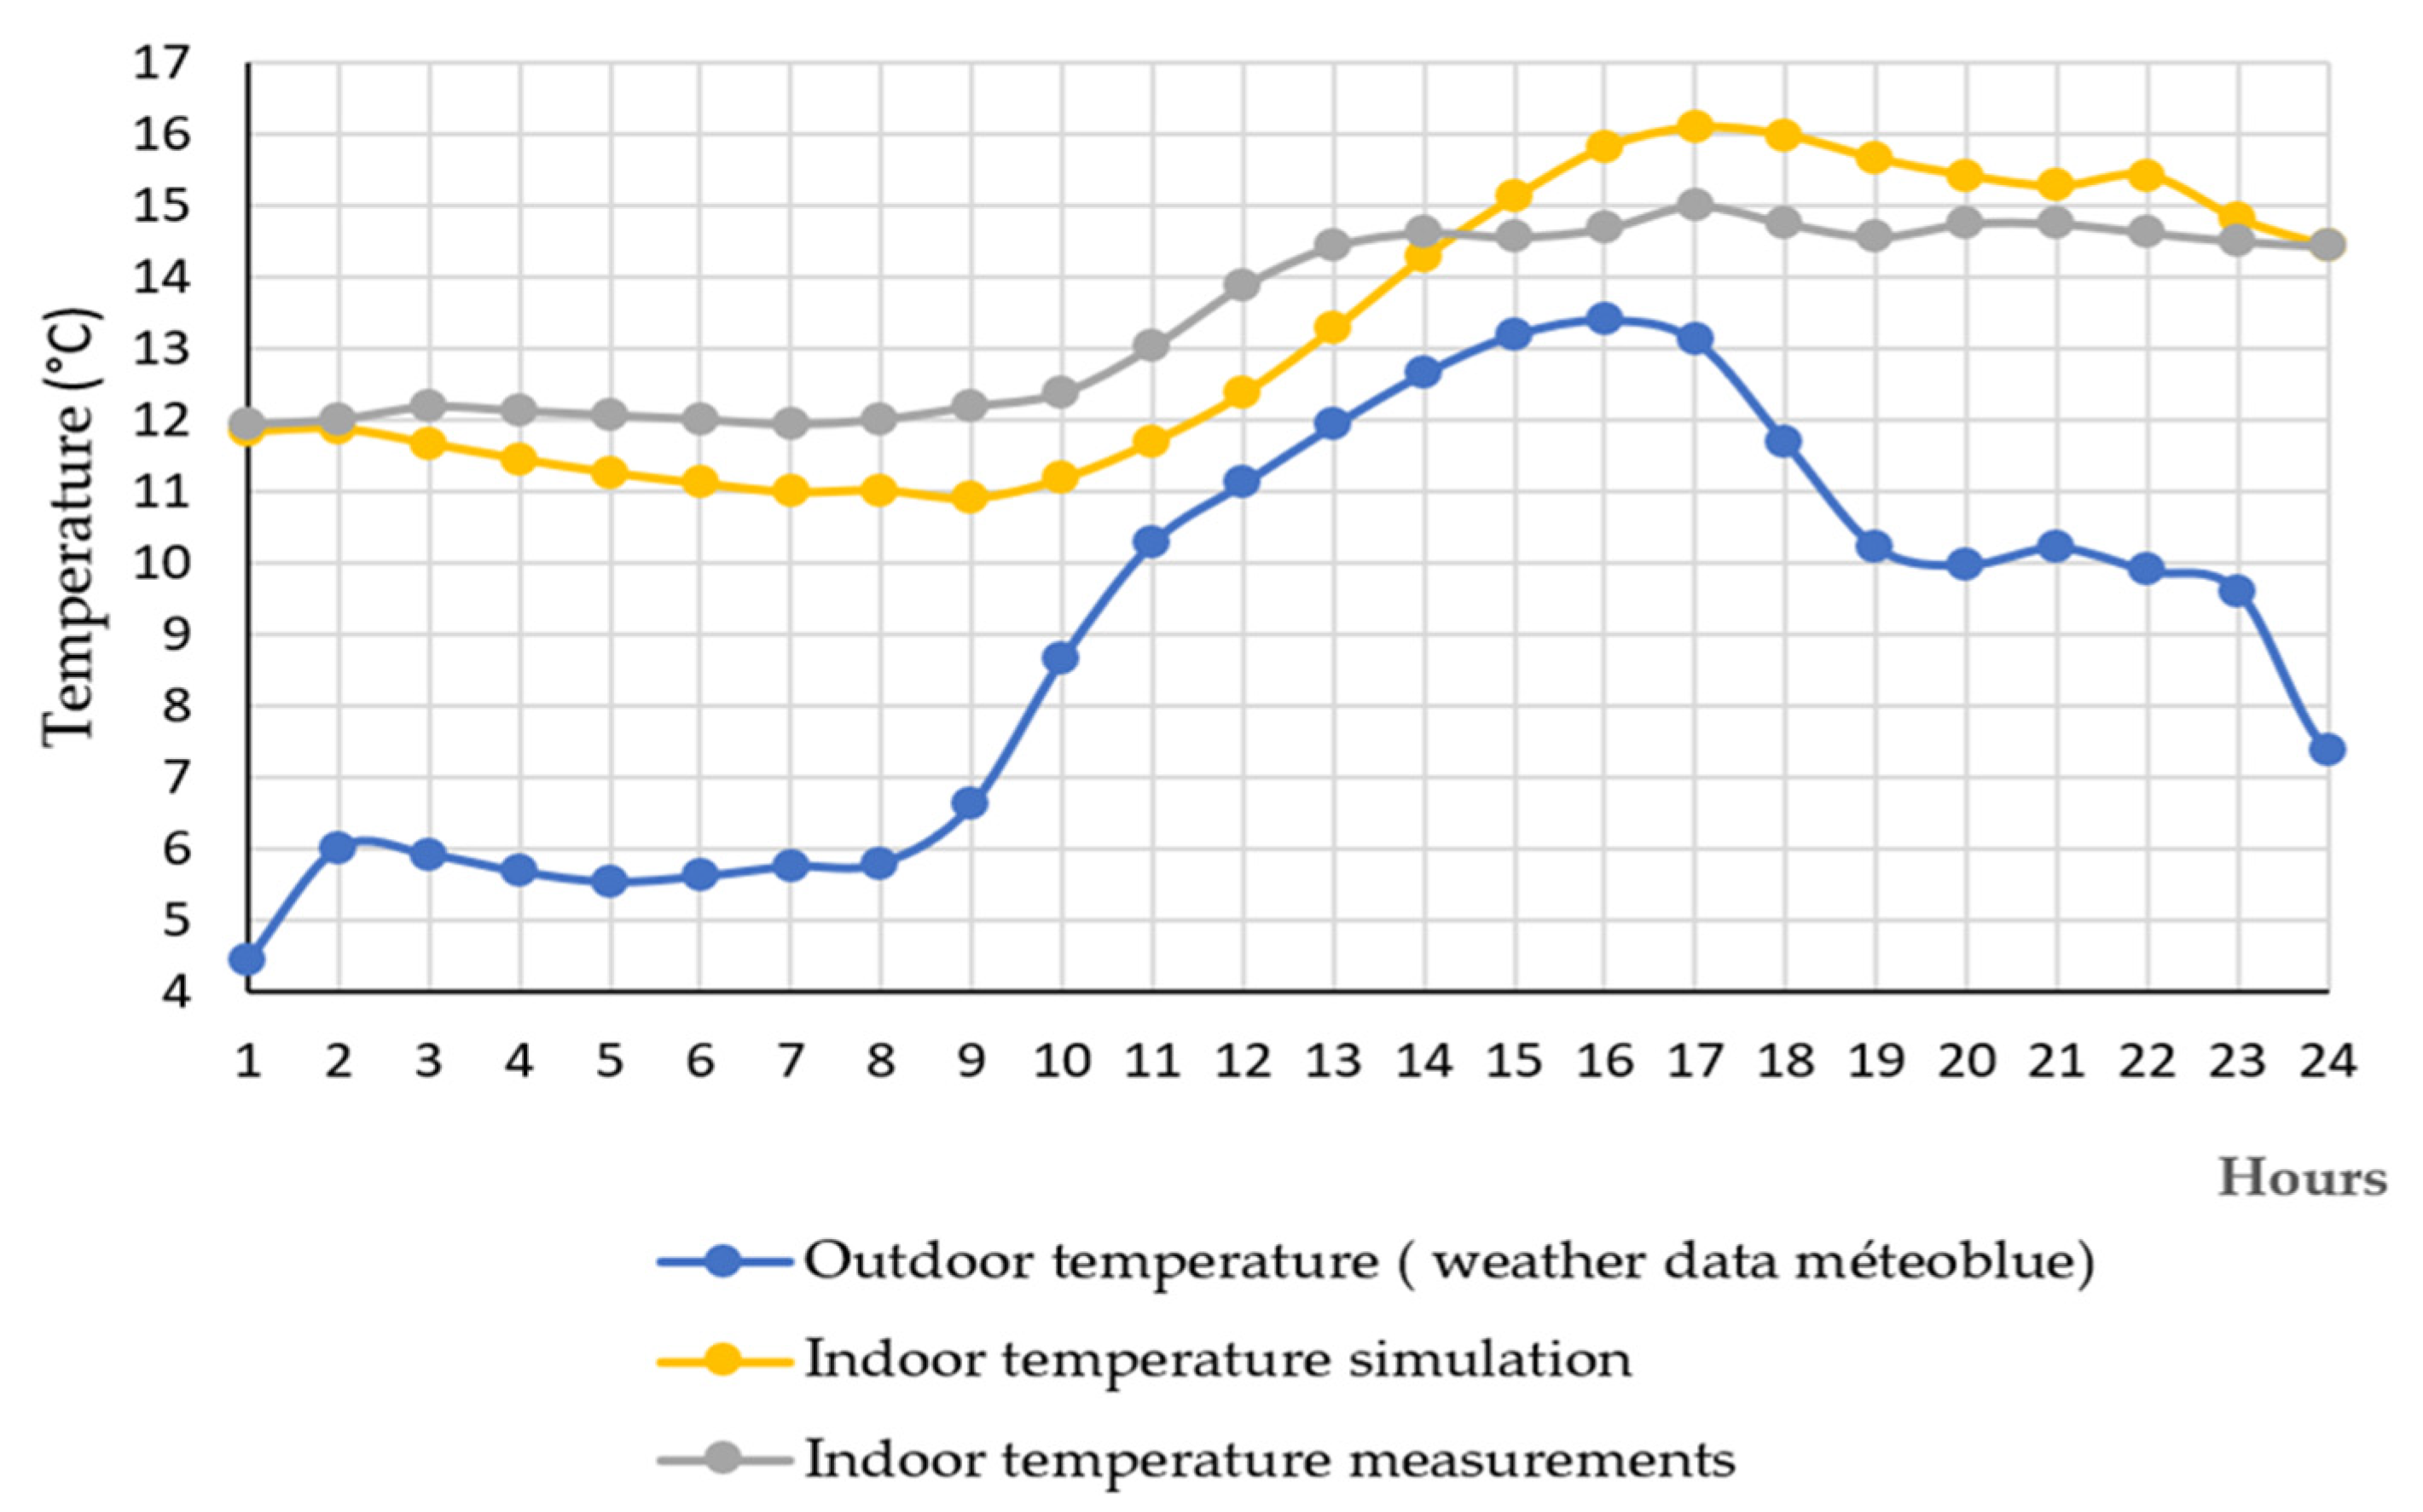
Figure 8 illustrates the outdoor temperature variation on 13 January 2018, a winter day characterized by an exponential rise in temperatures. The lowest temperature, 4.44 °C, was recorded at 1 a.m., while the maximum of 13.40 °C occurred at 4 p.m. Indoor temperatures, both measured and simulated, reached their lowest point of approximately 12 °C at 1 a.m. As outdoor temperatures increased, indoor temperatures followed a similar trend, peaking at 5 p.m. with a one-hour time lag before declining in the evening. The measured and simulated temperatures exhibited a comparable pattern, with the simulated values slightly lower at the start of the day. However, calculations indicate a low relative mean deviation over 24 h.
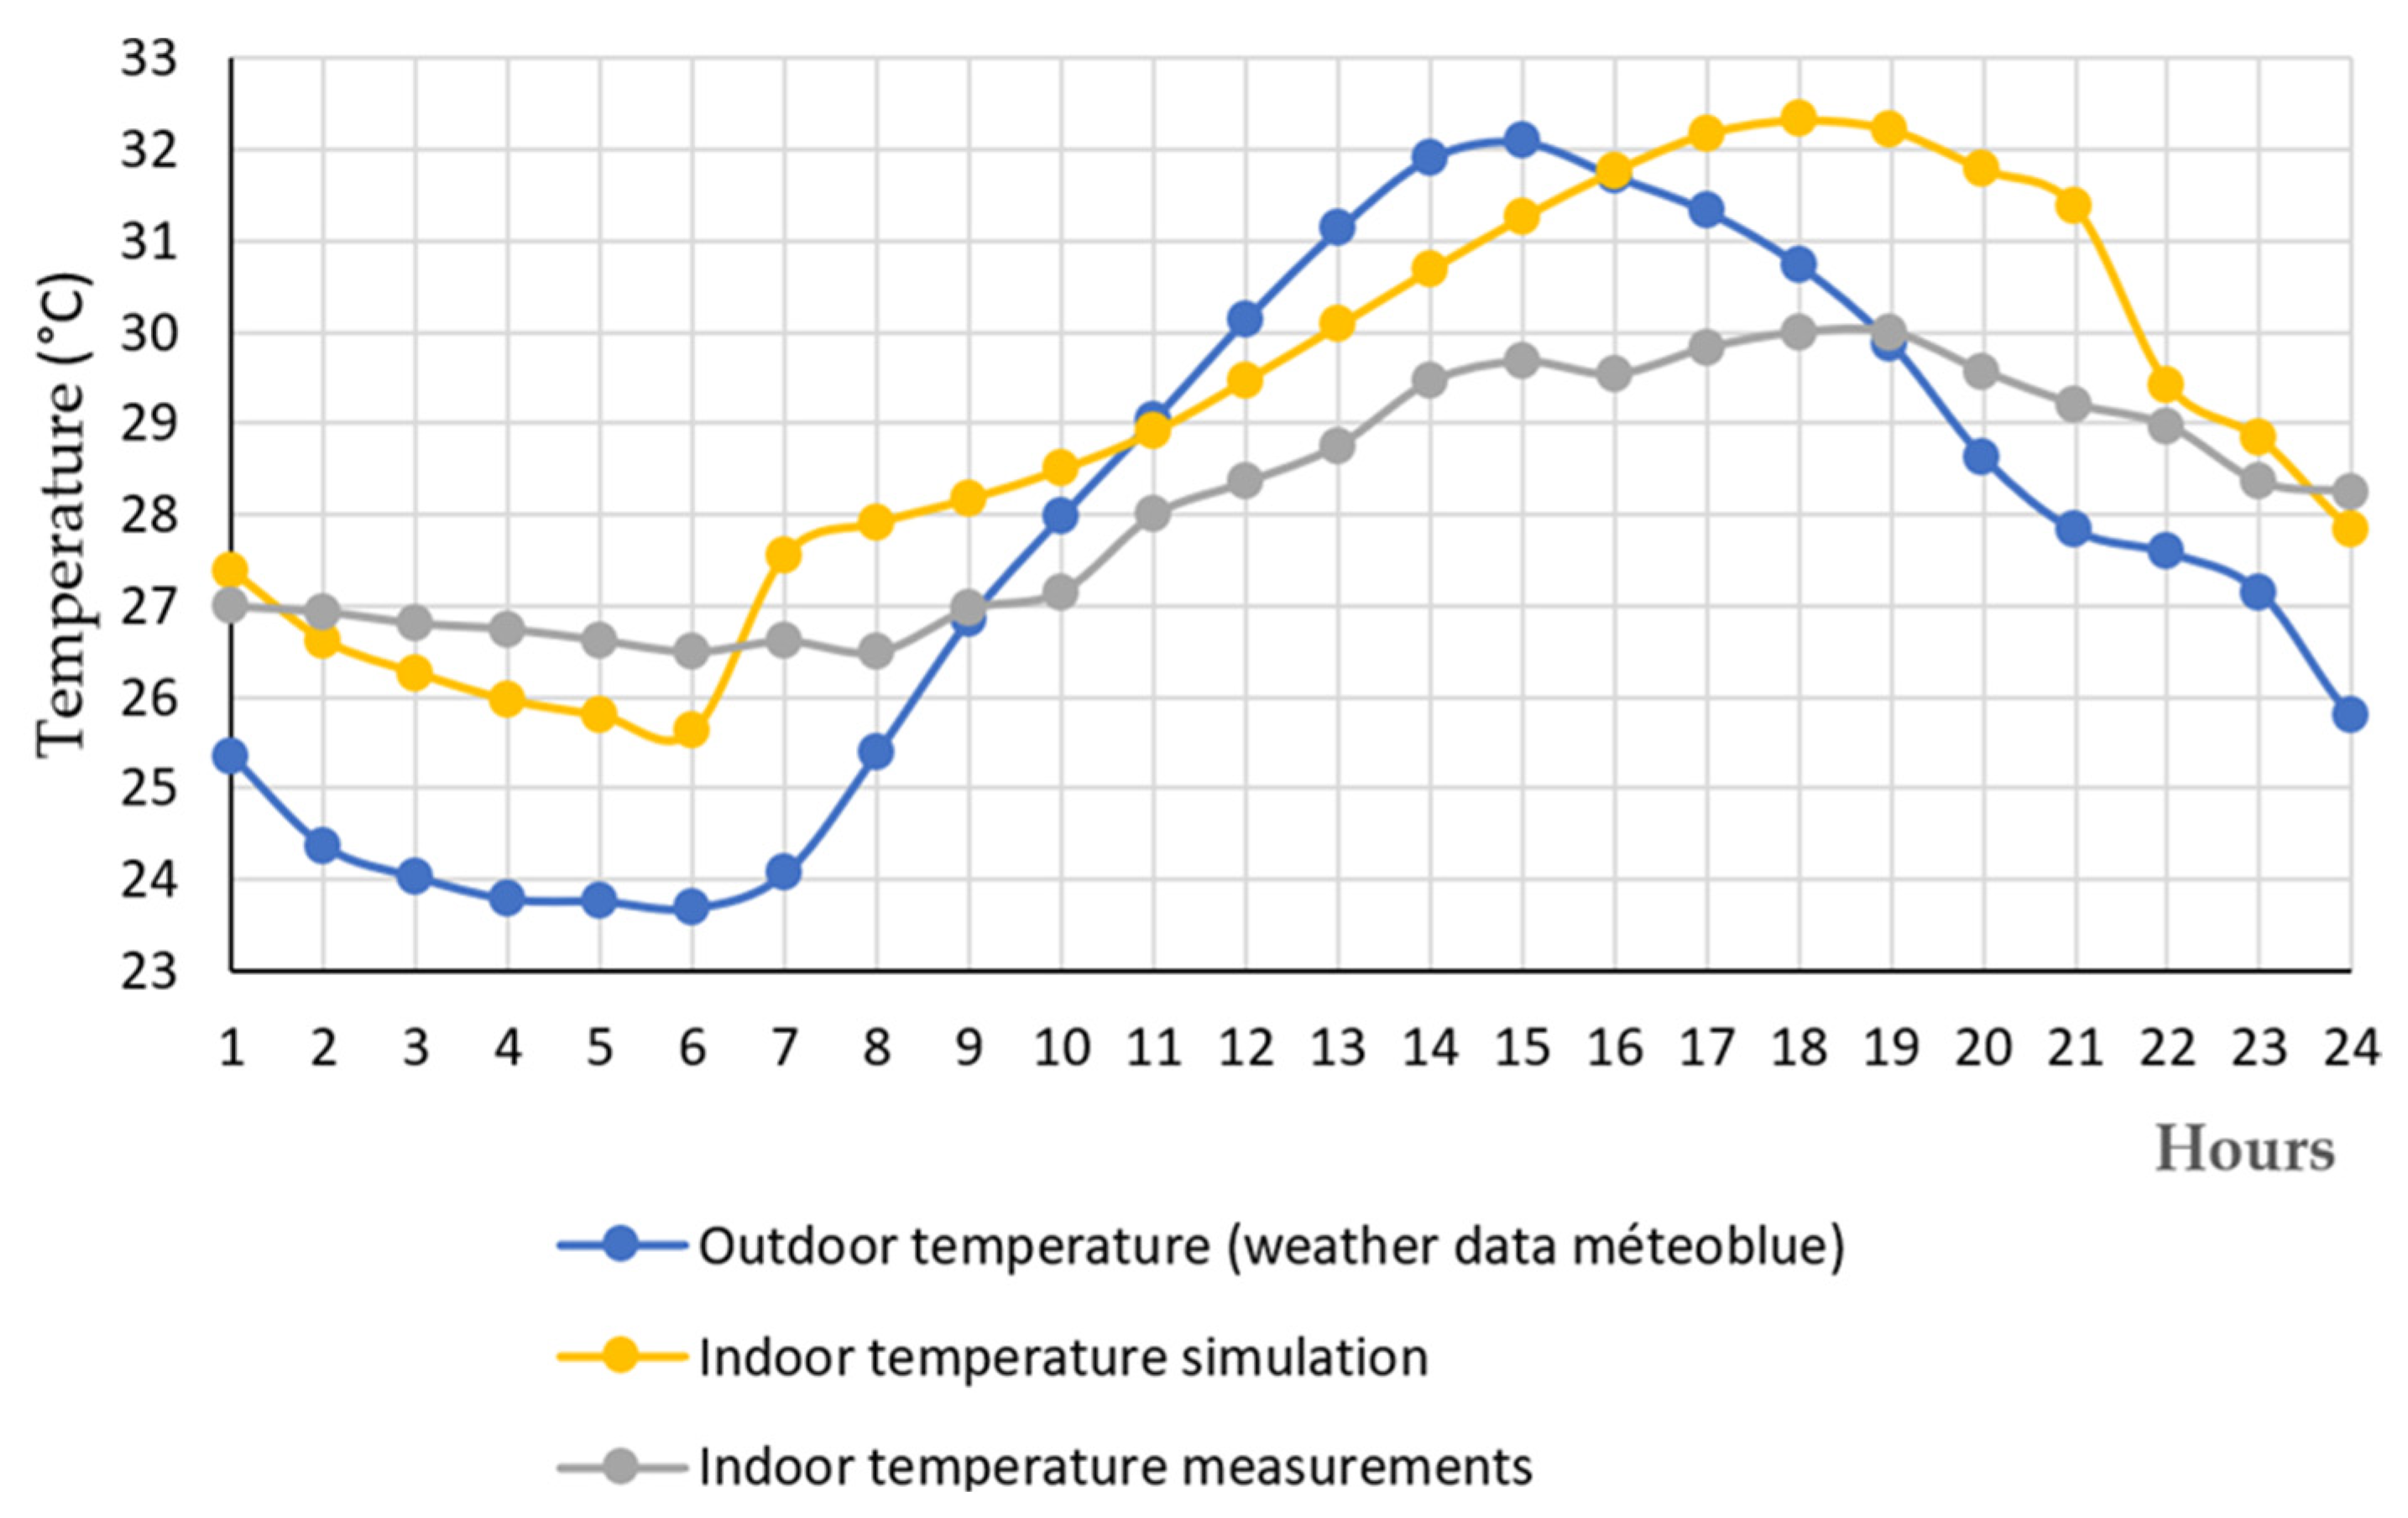
Figure 9 presents the outdoor temperature variation on 23 July 2019. The minimum temperature of 23.68 °C was recorded at 6 a.m., rising to a peak of 32.08 °C around 3 p.m. before decreasing in the evening. The simulation and measurement temperature curves followed a similar trend, with indoor temperatures reaching their peak around 6 p.m., showing a three-hour delay compared to outdoor conditions. Although the recorded experimental temperatures were slightly lower than the simulated values, the average relative deviation remained within an acceptable range.
Table 3 presents the relative deviation calculations, with an average deviation of 5% on 13 January 2018, and 4% on 23 July 2019. In engineering applications, deviations below 10% are considered acceptable. Such discrepancies likely result from internal disturbances and the limitations of measuring equipment. Consequently, the simulation model can be considered validated.
Prefabricated buildings are known for their rapid construction; however, they often suffer from poor airtightness due to inadequate panel connections and material degradation [56,57]. Additionally, poorly fitted windows and doors contribute to high infiltration rates in these structures, as noted by Halik et al. [58].
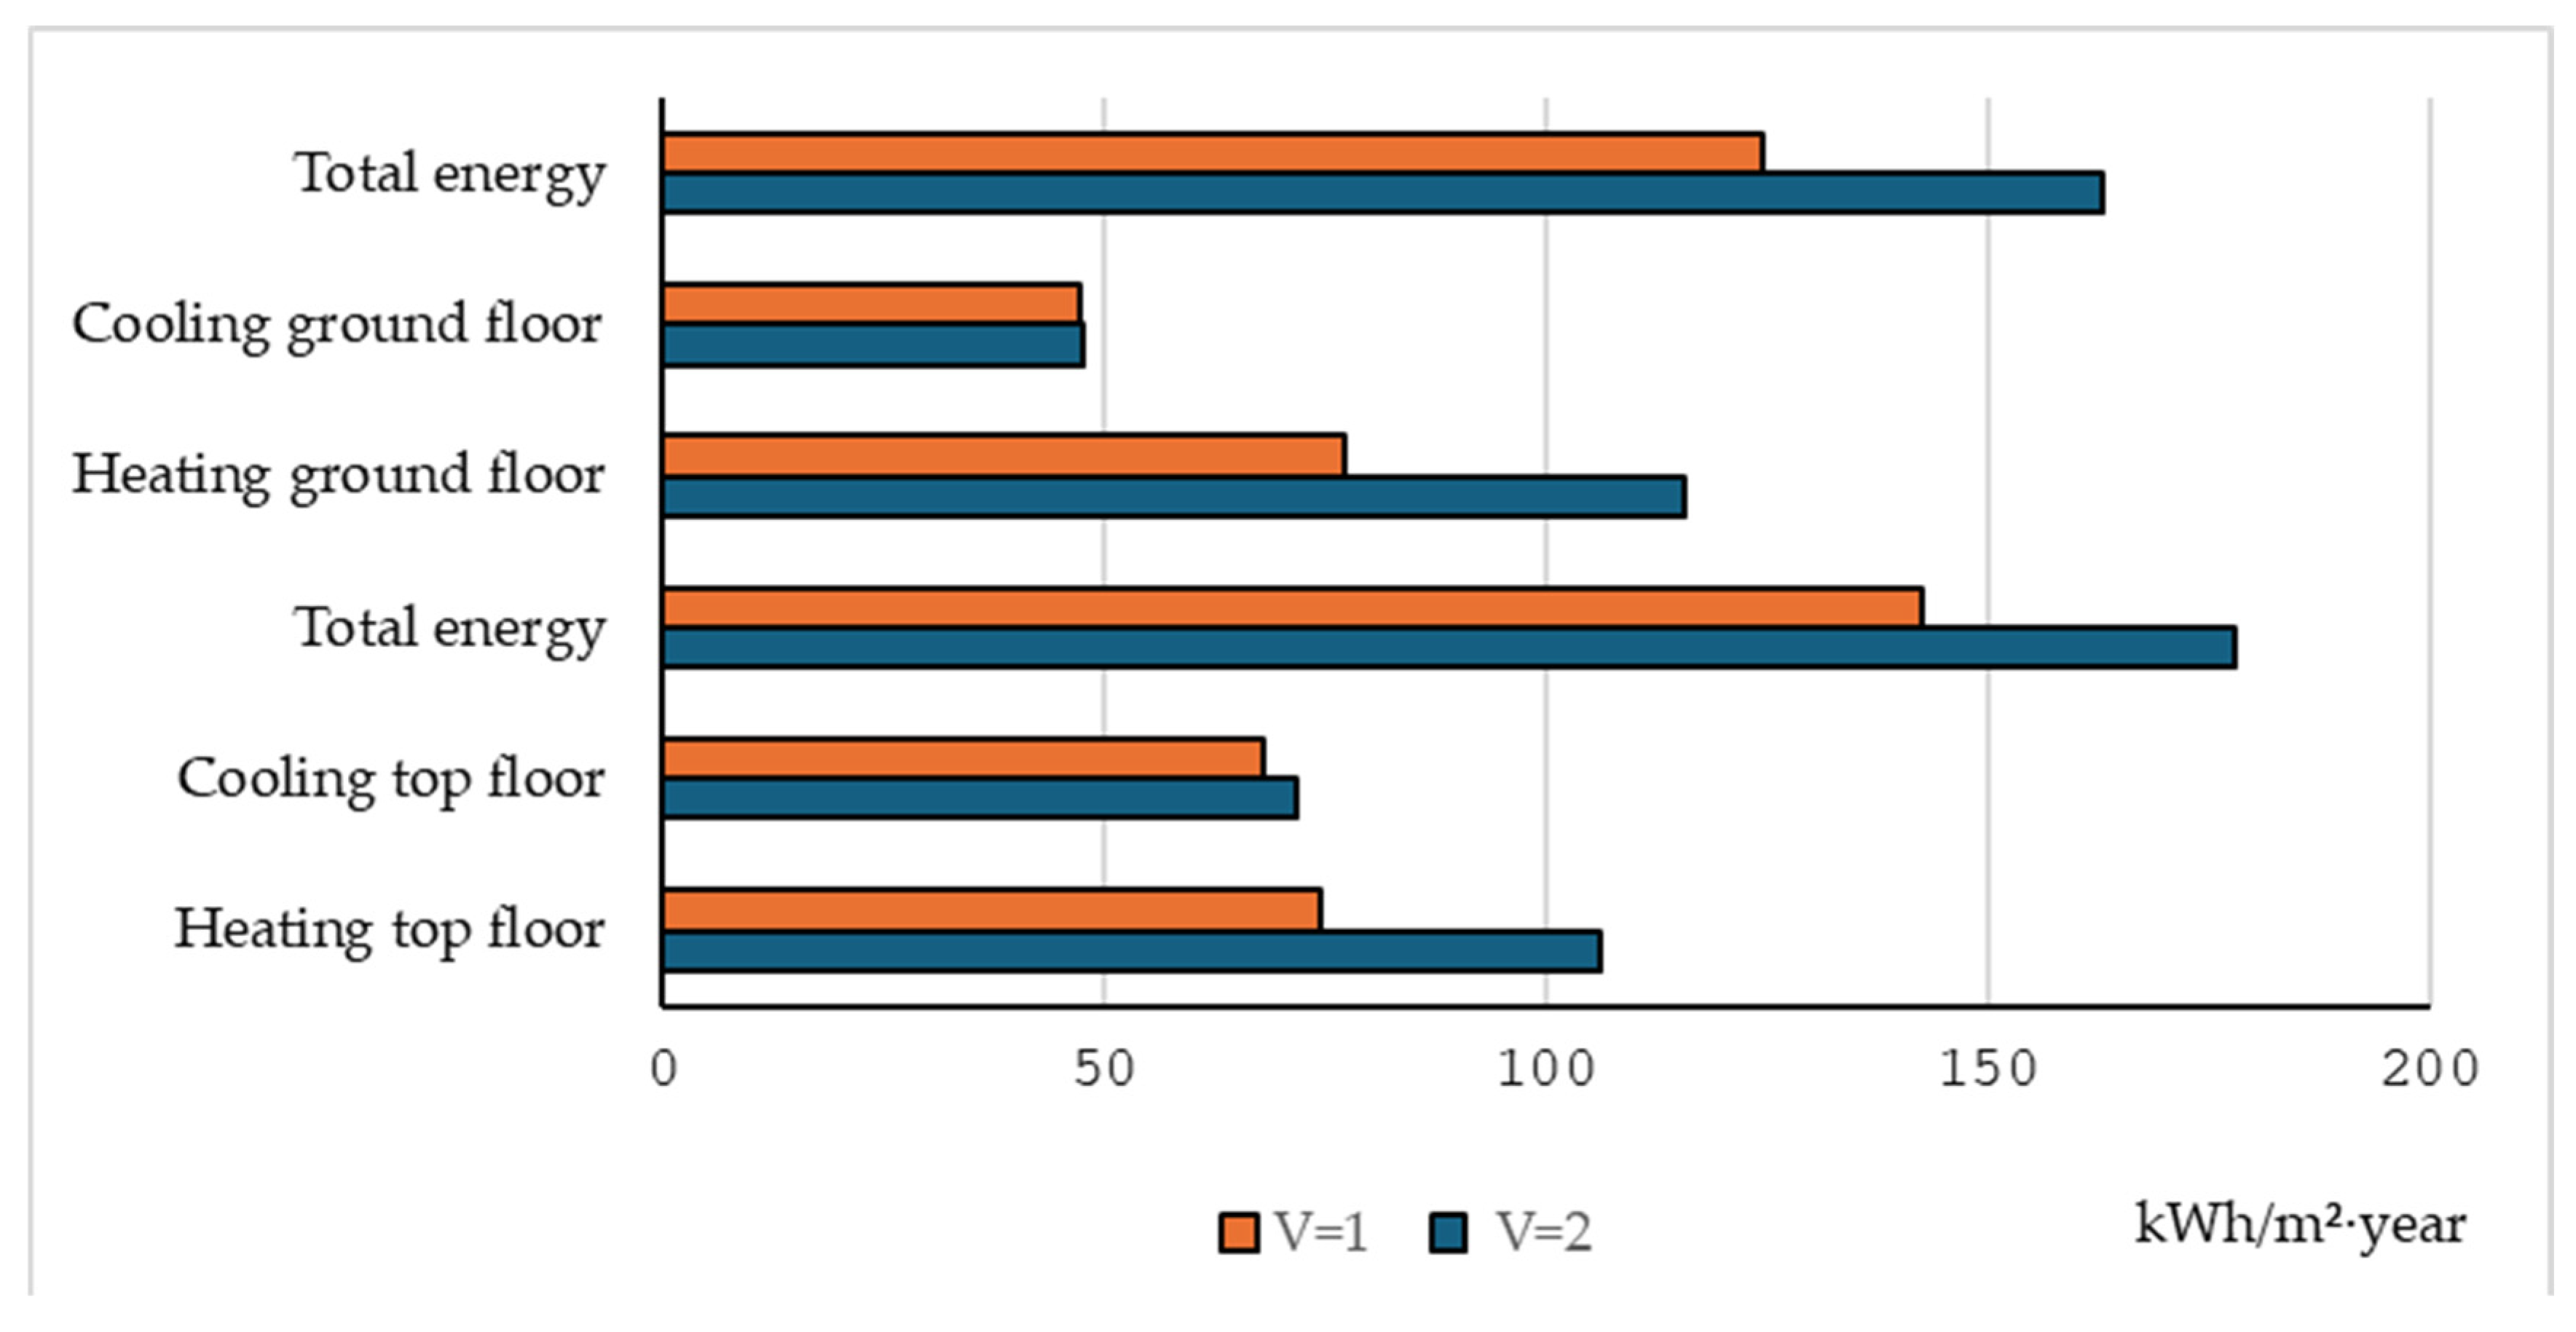
Figure 10 illustrates the impact of different air infiltration rates per hour on energy consumption, as determined through simulation. Under uncontrolled air renewal conditions (V = 2), the top-floor dwelling exhibits the highest energy demand, estimated at 178 kWh/m2 per year. For a ground-floor dwelling, the estimated annual energy consumption is 162.89 kWh/m2, with 115.51 kWh/m2 allocated to heating and 47.38 kWh/m2 to cooling. When lighting, electrical appliances, and gas equipment consumption are included, the total energy demand reaches 212.48 kWh/m2 per year. This value closely aligns with the previously calculated average consumption based on utility bills, which was approximately 214.43 kWh/m2 per year.
It should be noted that in the winter, high levels of air infiltration significantly increase consumption. The primary energy consumption for this type of dwelling is estimated at 324.2 kWhpe/(m2·year) for the ground floor and 372.93 kWhpe/(m2·year) for the top floor. These buildings are classified as F under the European Energy Label and G under the Climate Label [59].

4. Results and Discussion

4.1. Energy Consumption After Retrofit

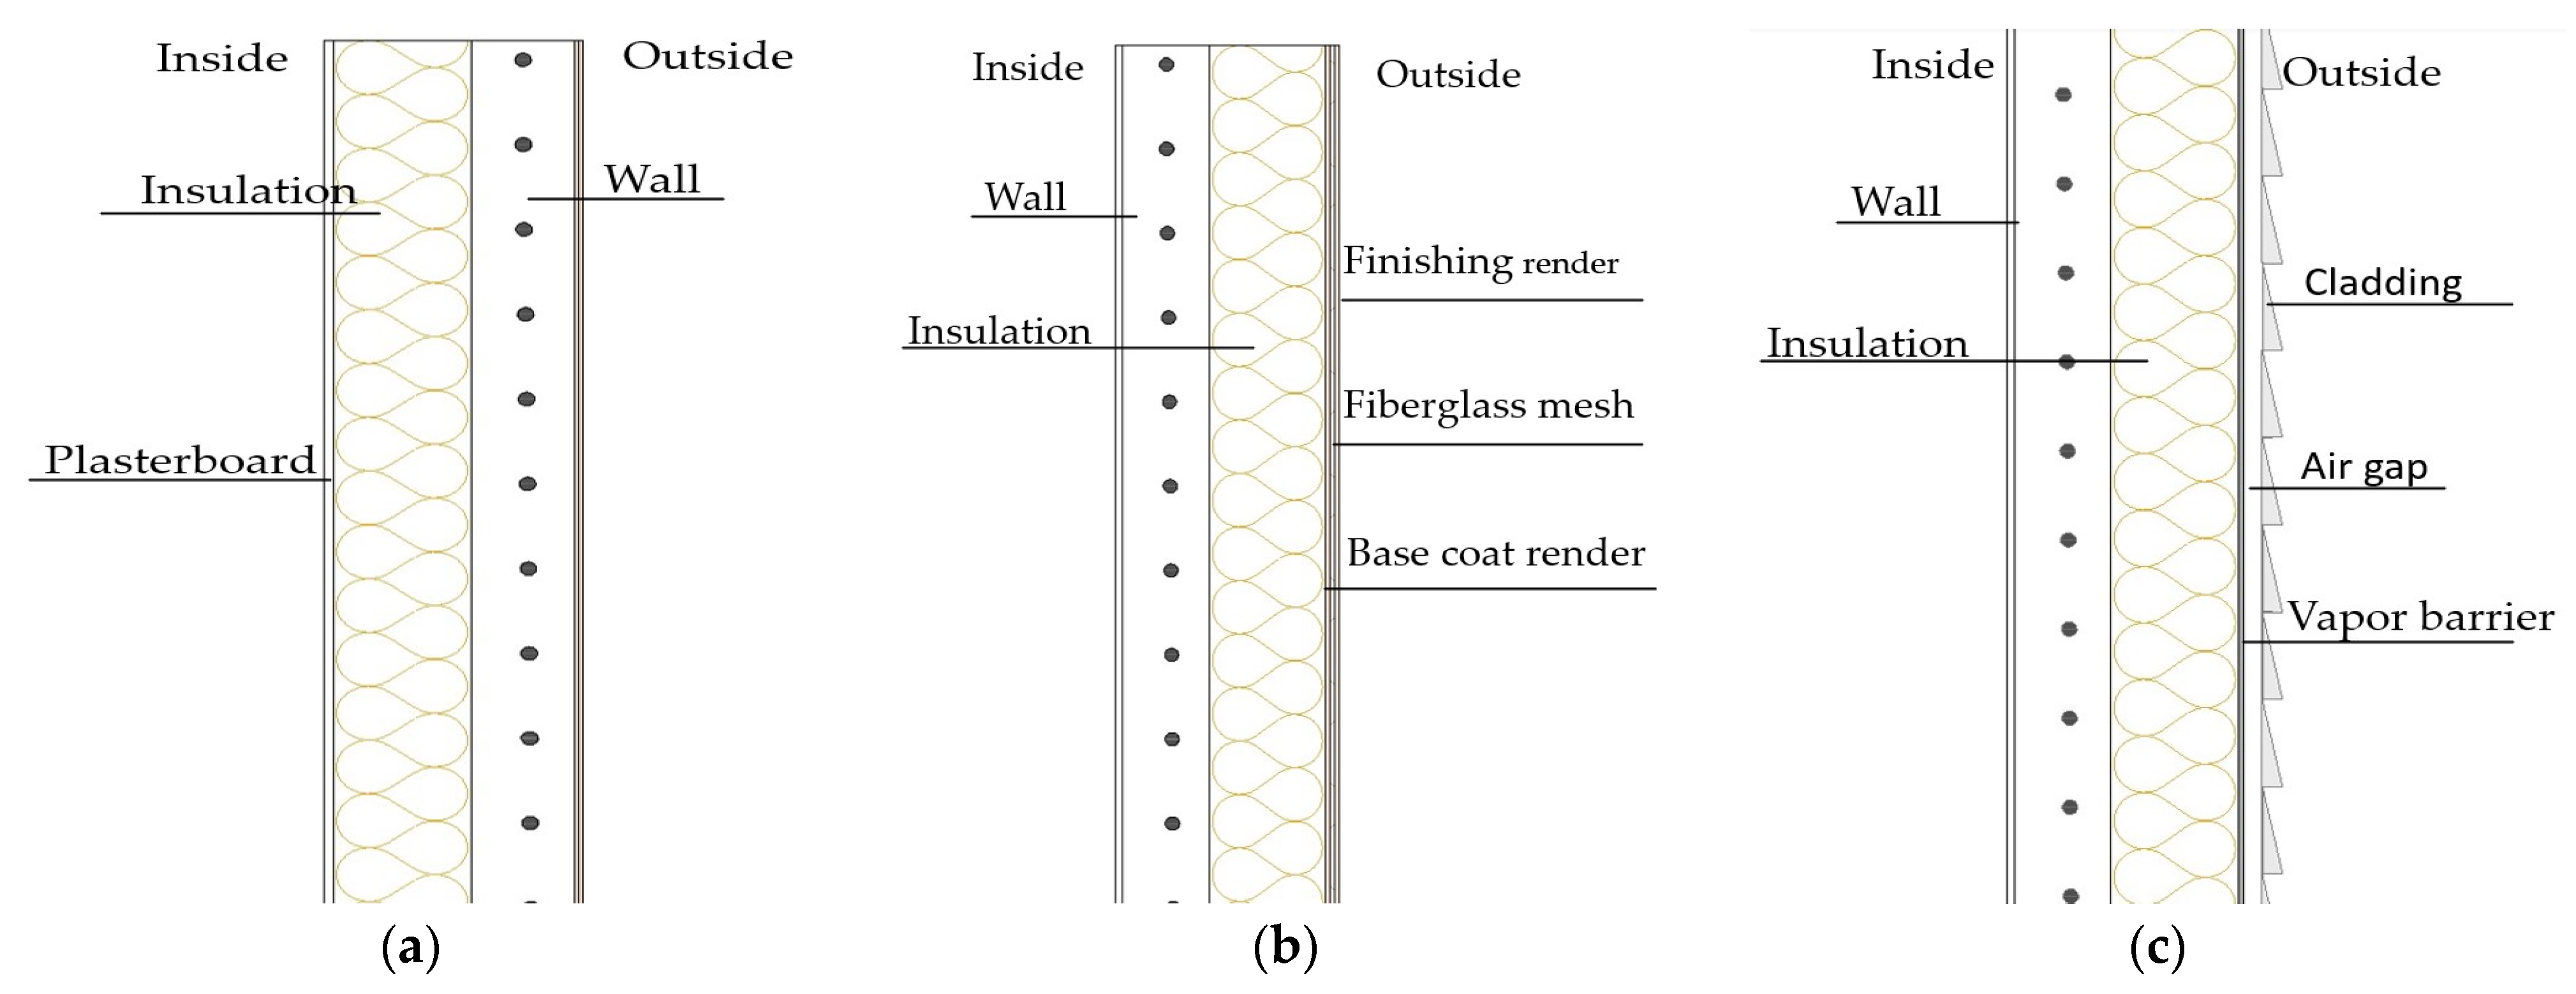
Retrofit strategies can be implemented through both interior and exterior interventions. The selection and placement of insulation are determined by the decision maker, considering the building’s architectural, economic, and climatic contexts. Exterior retrofitting offers various installation and finishing options, allowing flexibility in the facade’s appearance. Since the studied buildings are not classified as protected heritage, this study explores two exterior insulation options—cladding and rendering—alongside interior insulation (Figure 11).
Various insulation materials were selected for the proposed retrofit strategies (Table 4, Table 5 and Table 6) to facilitate a comparative analysis. The chosen solutions include both durable and less environmentally friendly materials, all of which effectively reduce energy consumption and CO2 emissions. Common intervention strategies include roof insulation, low floor insulation, and window replacement to assess the impact of insulation placement, whether interior or exterior. The proposed window replacement involves PVC (polyvinyl chloride) frames with 4 mm double glazing and a 6 mm air gap. Additionally, both types of exterior facade insulation require the restoration of the original facade.
In addition to the specific retrofit configurations applied to internal and external walls, several construction layers are common across all the proposed strategies. These include standardized treatments for the ground and upper floors as well as for the roof components. Table 7 presents the thermal and physical properties of these shared materials, ensuring consistency in the comparative analysis of the retrofit scenarios.
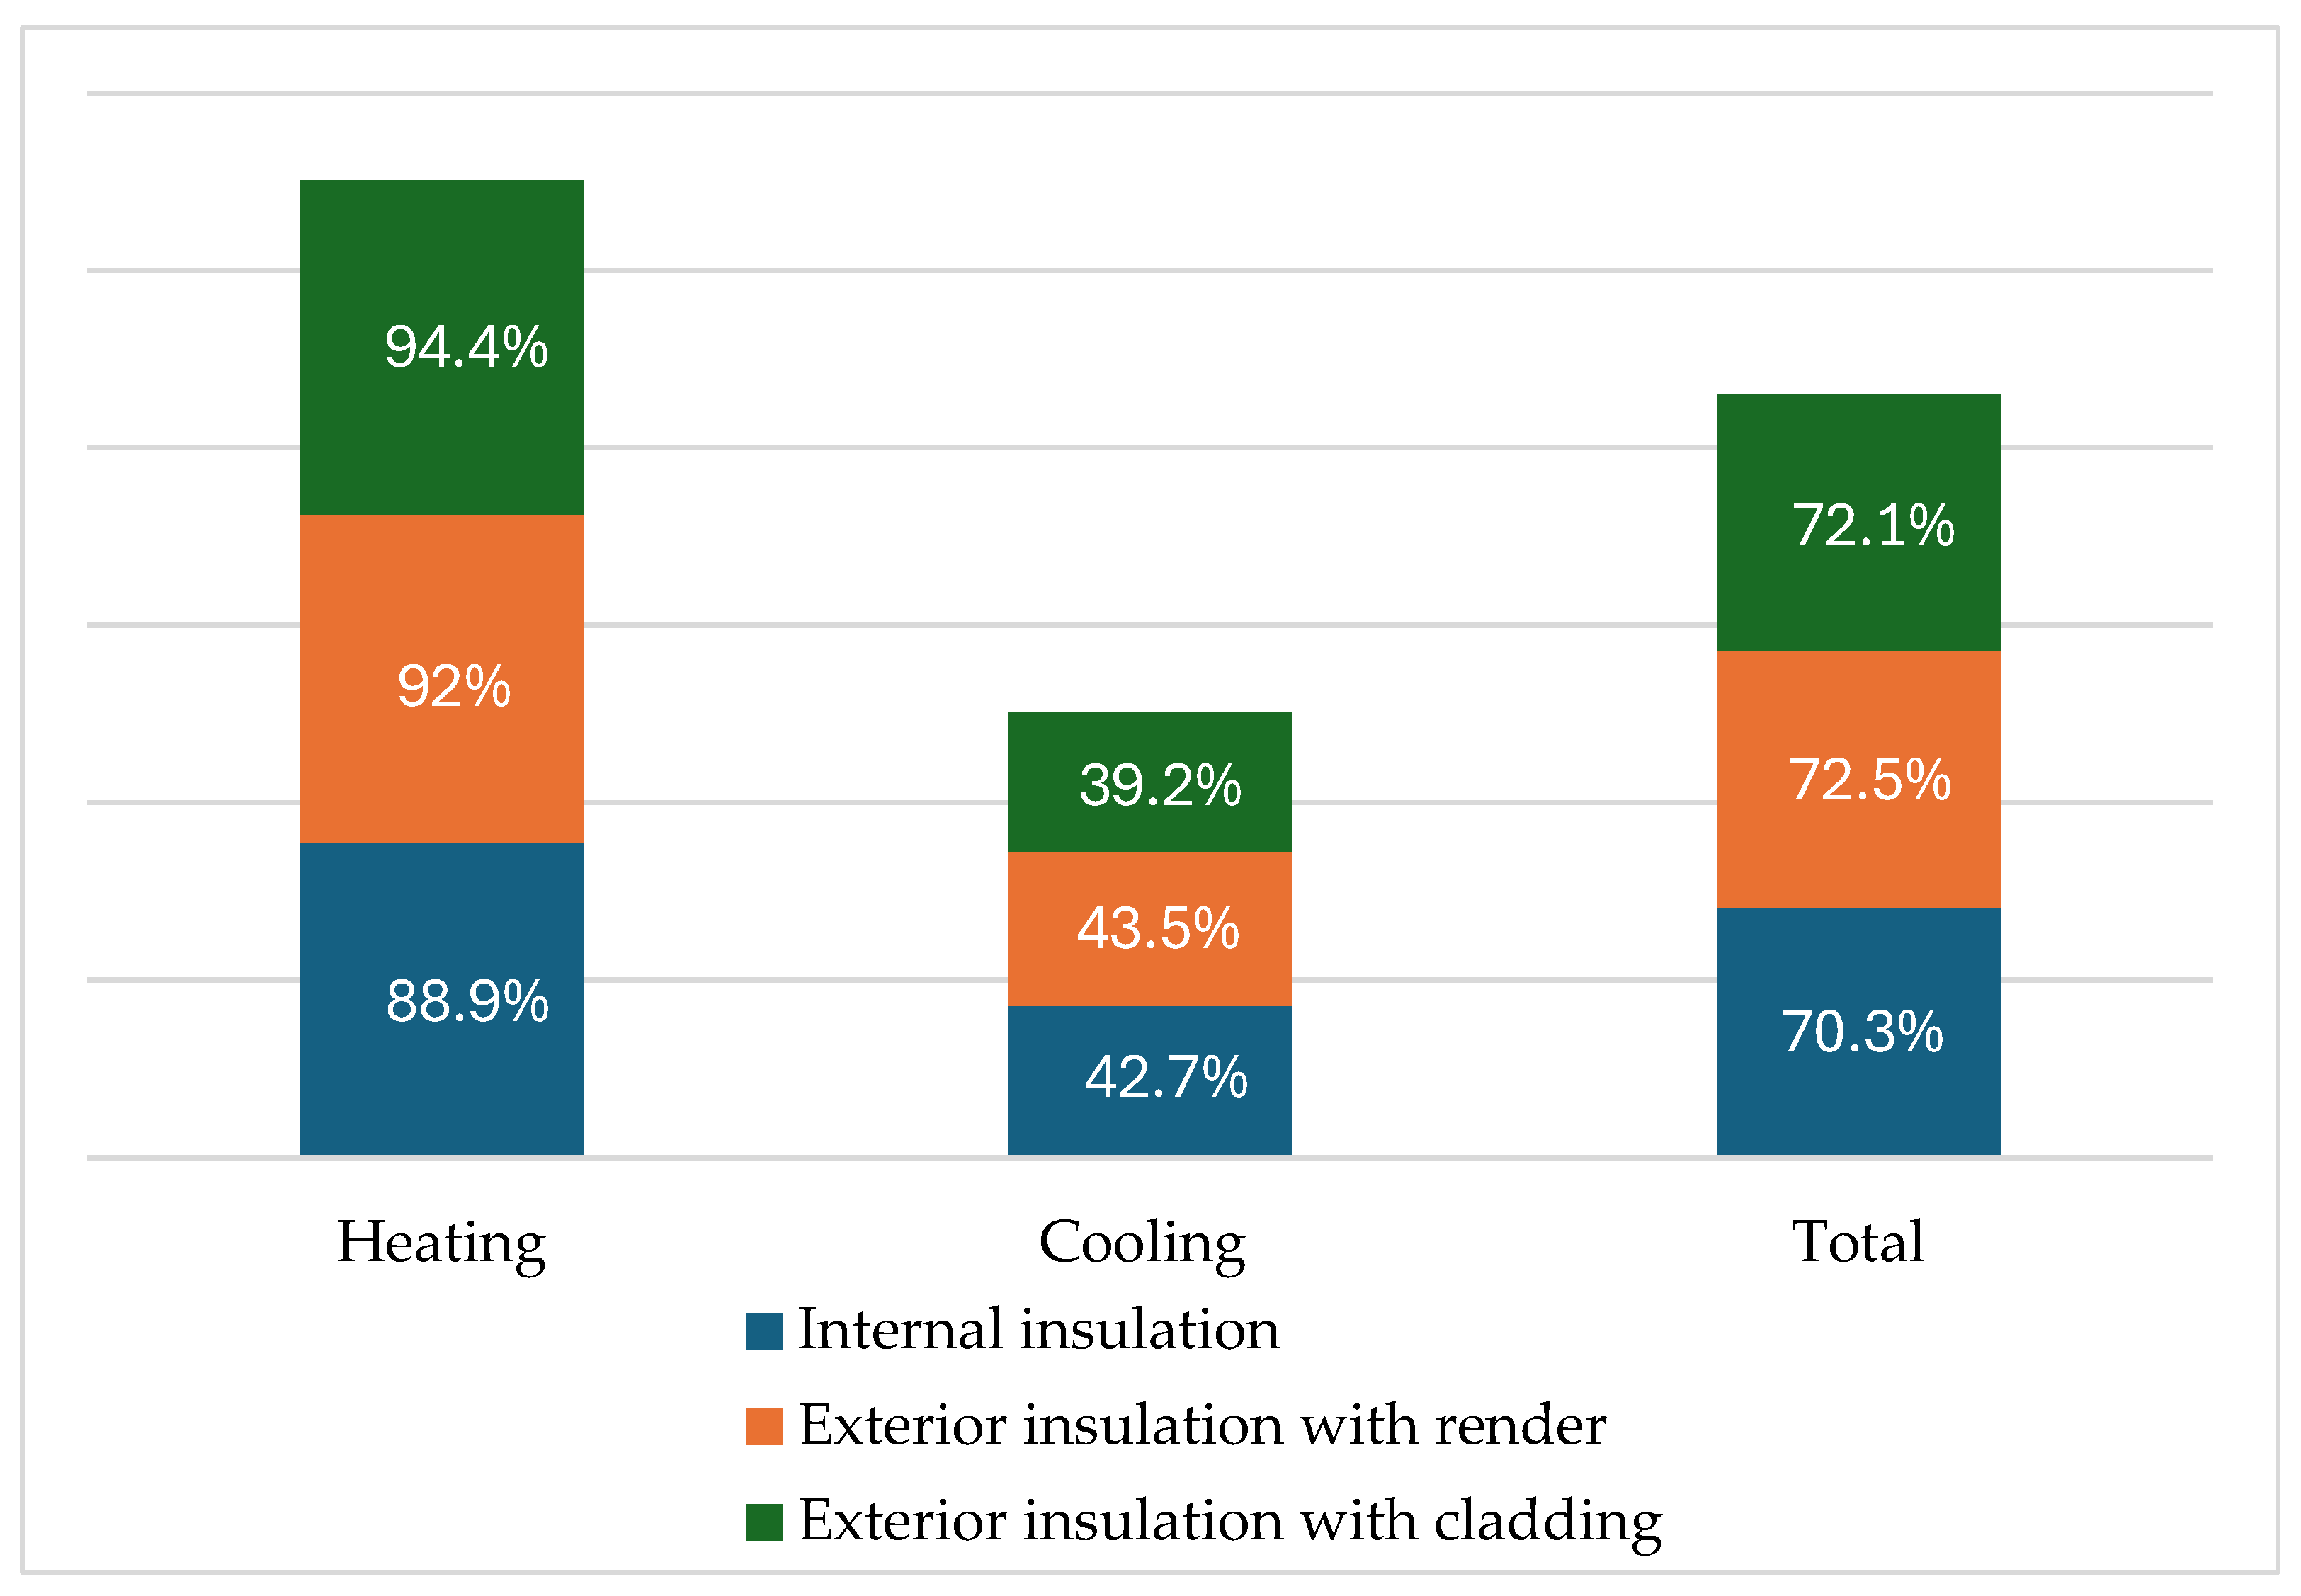
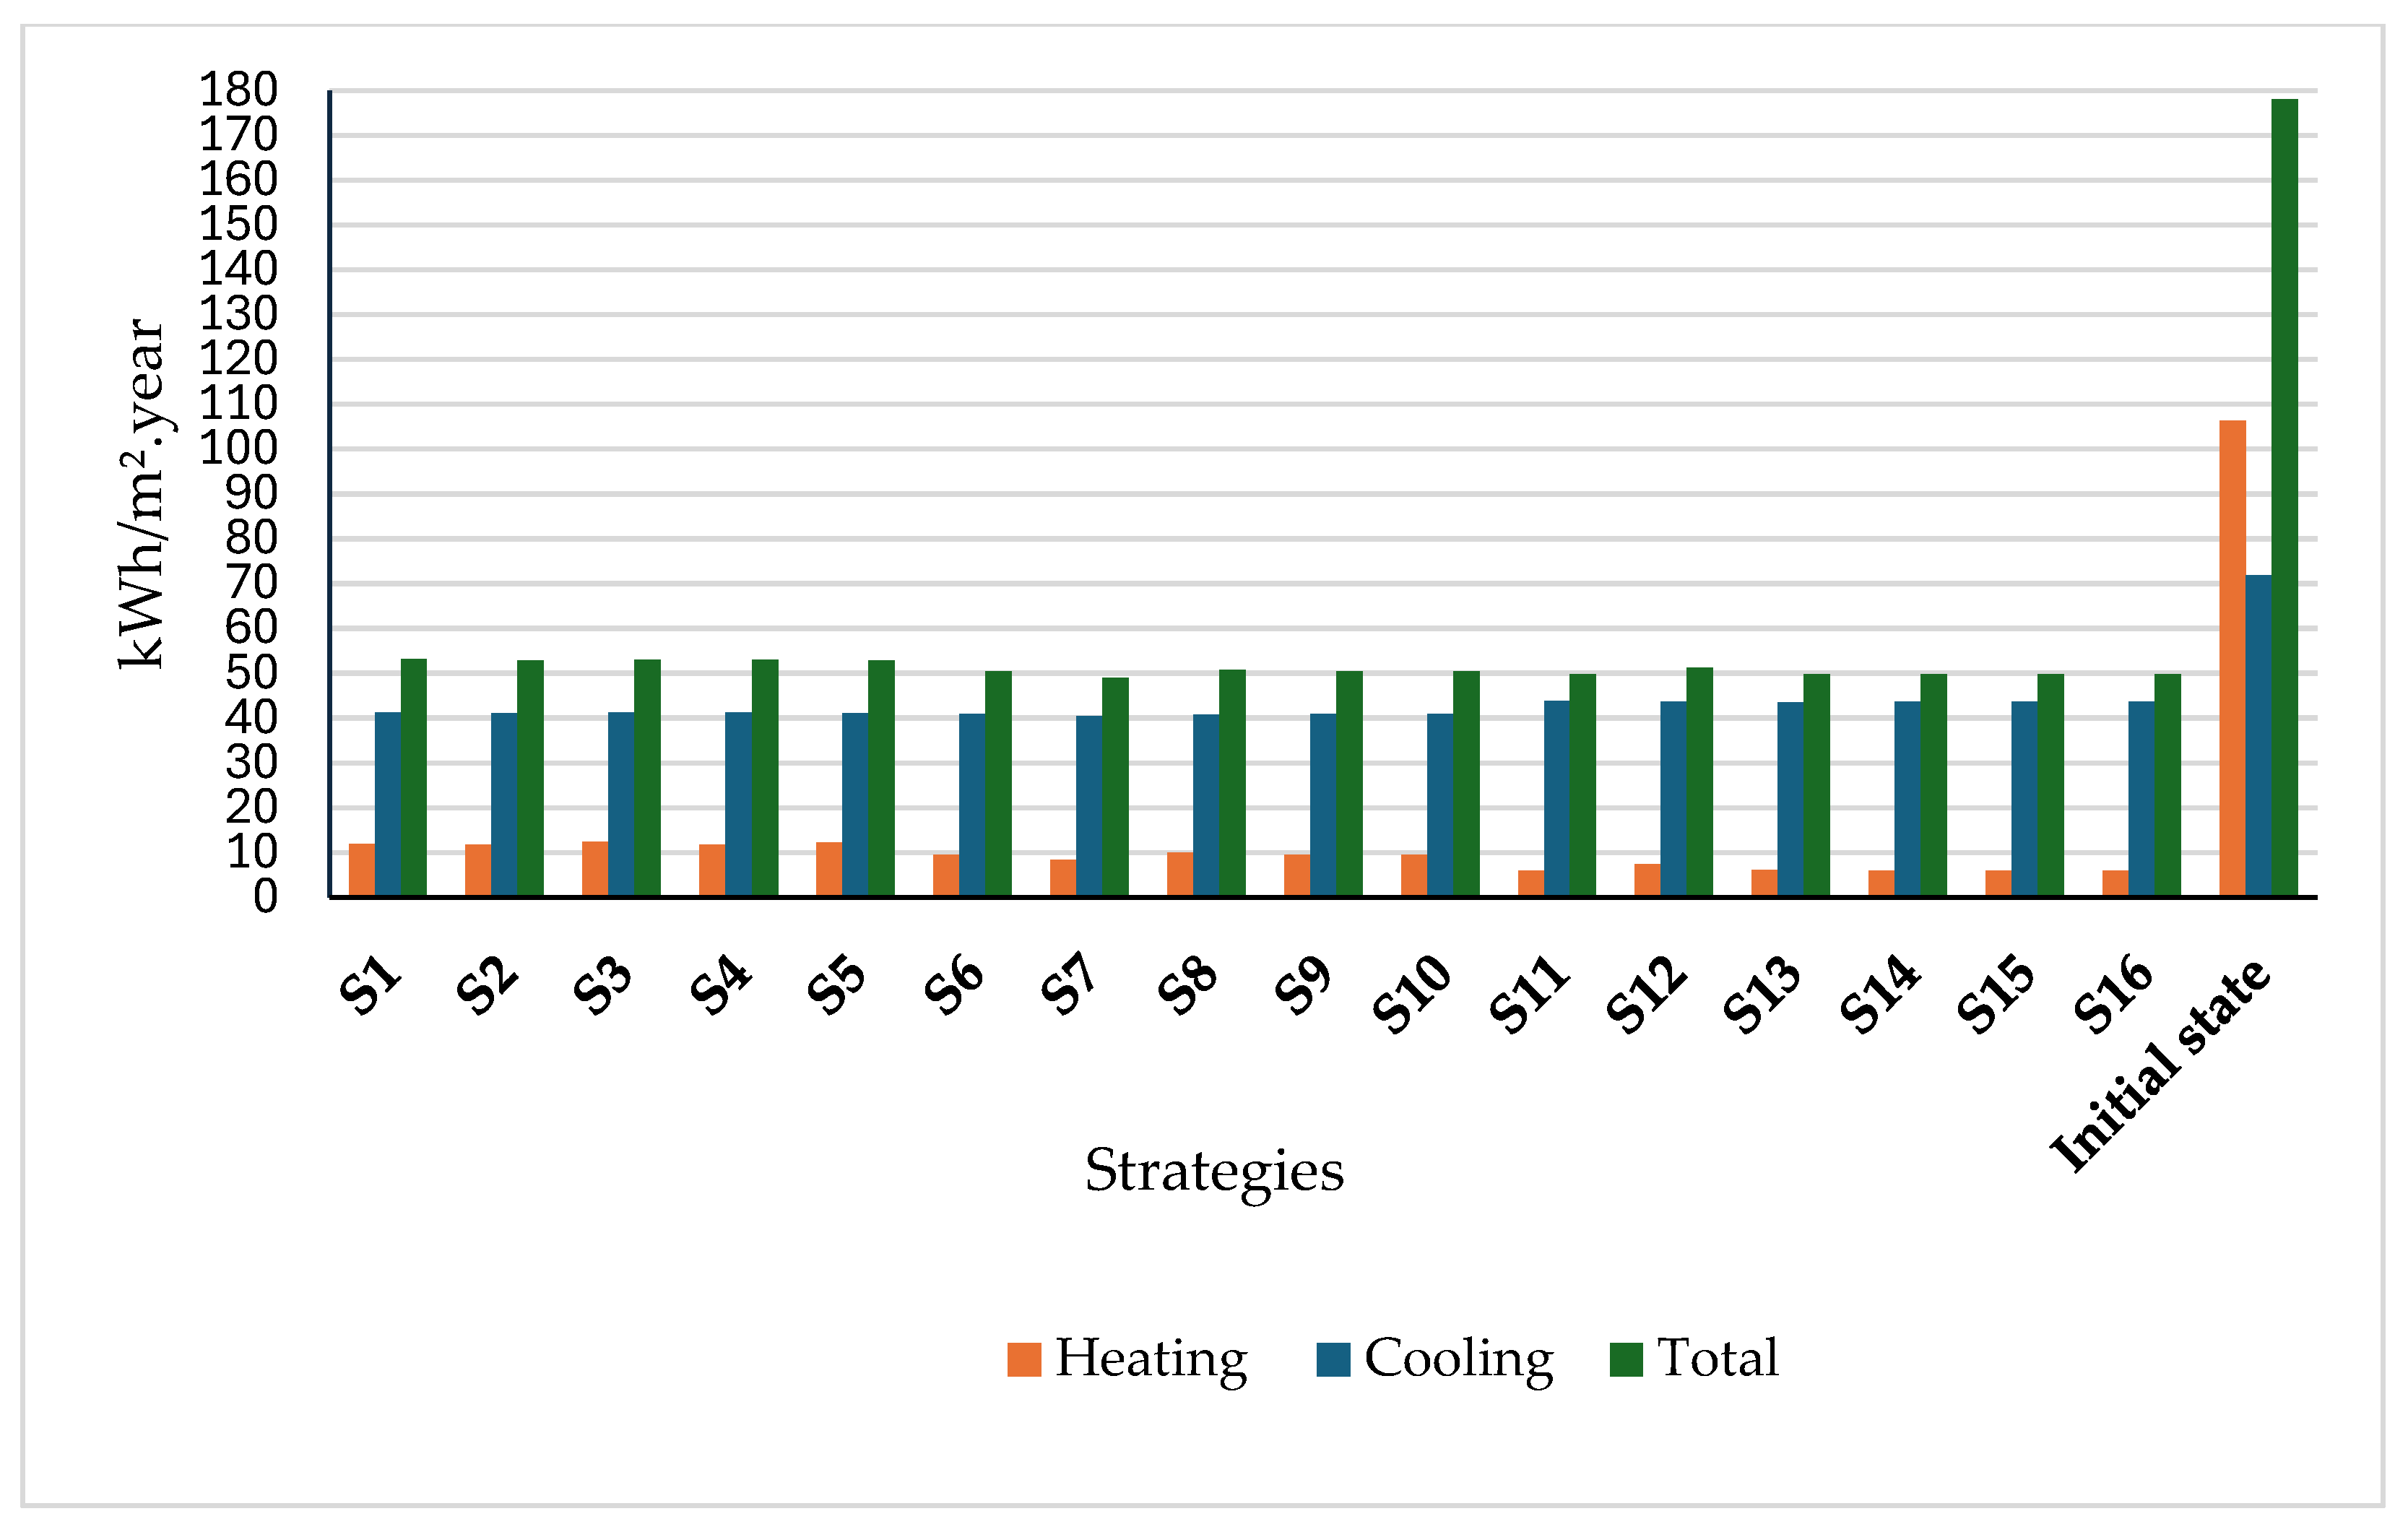
The simulation of various retrofit strategies demonstrated a significant reduction in initial energy consumption. Figure 12 and Figure 13 illustrate the improvements for the top-floor apartment, which initially consumed 178 kWh/(m2·year), including 106.26 kWh/(m2·year) for heating and 71.74 kWh/(m2·year) for cooling. Figure 12 presents three proposed strategies that achieve a total energy consumption reduction of 70.3% to 72.5%.
The heating demand saw the most significant reduction, ranging from 88.9% to 94.4%, while air-conditioning consumption decreased by 39.2% from 42.7%. After retrofitting, the first-floor apartment’s energy consumption is estimated at 200.77 kWhpe/(m2·year), placing it in class D on the energy label. Among the retrofit strategies, cladding insulation proved to be the most effective in reducing heating demand, whereas rendered external insulation was the best for lowering air-conditioning consumption, second only to internal insulation.
Figure 13 illustrates that combining heating and cooling savings can result in a reduction of up to 129 kWh/(m2·year), with the most notable impact observed in heating requirements. The total energy consumption across different strategies shows no significant variations, with the largest difference estimated at 4.74 kWh/(m2·year). Heating demand varies slightly between the strategies, with a maximum difference of 6.4 kWh/(m2·year), while cooling differences remain minor at 3.27 kWh/(m2·year). These small variations indicate that optimal insulation (achieving a 70% to 72.5% energy reduction) effectively regulates energy gains and losses, ultimately limiting the differences between strategies.
The thermal properties of the materials remained similar, and the simulation parameters were kept constant. Among the three insulation methods, exterior insulation strategies proved to be the most effective. In winter, cladding strategies perform well by limiting thermal bridges, utilizing air space as a buffer between the interior and exterior, and preserving the thermal inertia of the walls. However, as shown by the histogram, their performance declines in summer. The exposure of the air space to solar gain, along with the materials used for cladding, can reduce overall efficiency.
Rendered exterior insulation strategies offer a more balanced performance, as they minimize thermal bridges through insulation continuity and homogeneity while maintaining the walls’ thermal inertia. In contrast, interior insulation strategies are generally less effective, particularly in winter, due to the presence of thermal bridges and limited thermal inertia, making them more susceptible to climatic fluctuations.

4.2. Variation in Indoor Temperature After Retrofit

To identify additional differences between strategies, the thermal behavior of the building envelope in relation to indoor temperatures was analyzed. A comparison of indoor temperature variations over time before and after the energy retrofit was conducted for two extreme seasons (21 January and 6 August). The simulation results illustrate temperature fluctuations in the southwest-facing parents’ bedroom on the top floor.
The simulated strategies provide insight into how insulation positioning influences interior temperatures. Polyurethane insulation can be applied internally (S4), externally under plaster (S9), or externally under fiber cement cladding (S14). This comparison is based on identical insulation technical characteristics, including thickness, thermal conductivity, and specific heat while maintaining internal heat gains and excluding heating.
On the winter day shown in Figure 14, the highest and most comfortable indoor temperature, ranging from 19 °C to 20 °C, was achieved with exterior insulation under cladding (S14). A maximum temperature difference of approximately 9 °C was observed between the pre-retrofit state and insulation under cladding (S14), while the difference between insulation under cladding (S14) and interior insulation (S4) was nearly 3 °C. The temperature variation between insulation from the inside (S4) and exterior insulation under plaster (S9) reached 1.21 °C.
Additionally, in all three insulated scenarios, interior temperatures remained stable due to the reduction in both external and internal disturbances. As illustrated in Figure 14, a sharp indoor temperature peak of 2.87 °C occurred around 7–8 a.m. in the initial state, triggered by internal heat gain (such as the use of a hairdryer), leading to a sudden rise in room temperature.
This disturbance persisted for some time before stabilizing around 9 a.m. In insulated cases, peak temperatures were reduced as heat gradually dissipated, with less heat lost through the envelope due to the wall’s thermal inertia. Rehman [60] confirmed the impact of insulation on interior temperature fluctuations caused by both climatic conditions and internal heat gains. In uninsulated buildings, temperature disturbances resulting from envelope heat loss and internal gains contribute to occupant discomfort and increase energy demand, as heating and air-conditioning systems operate at full capacity to maintain comfort.
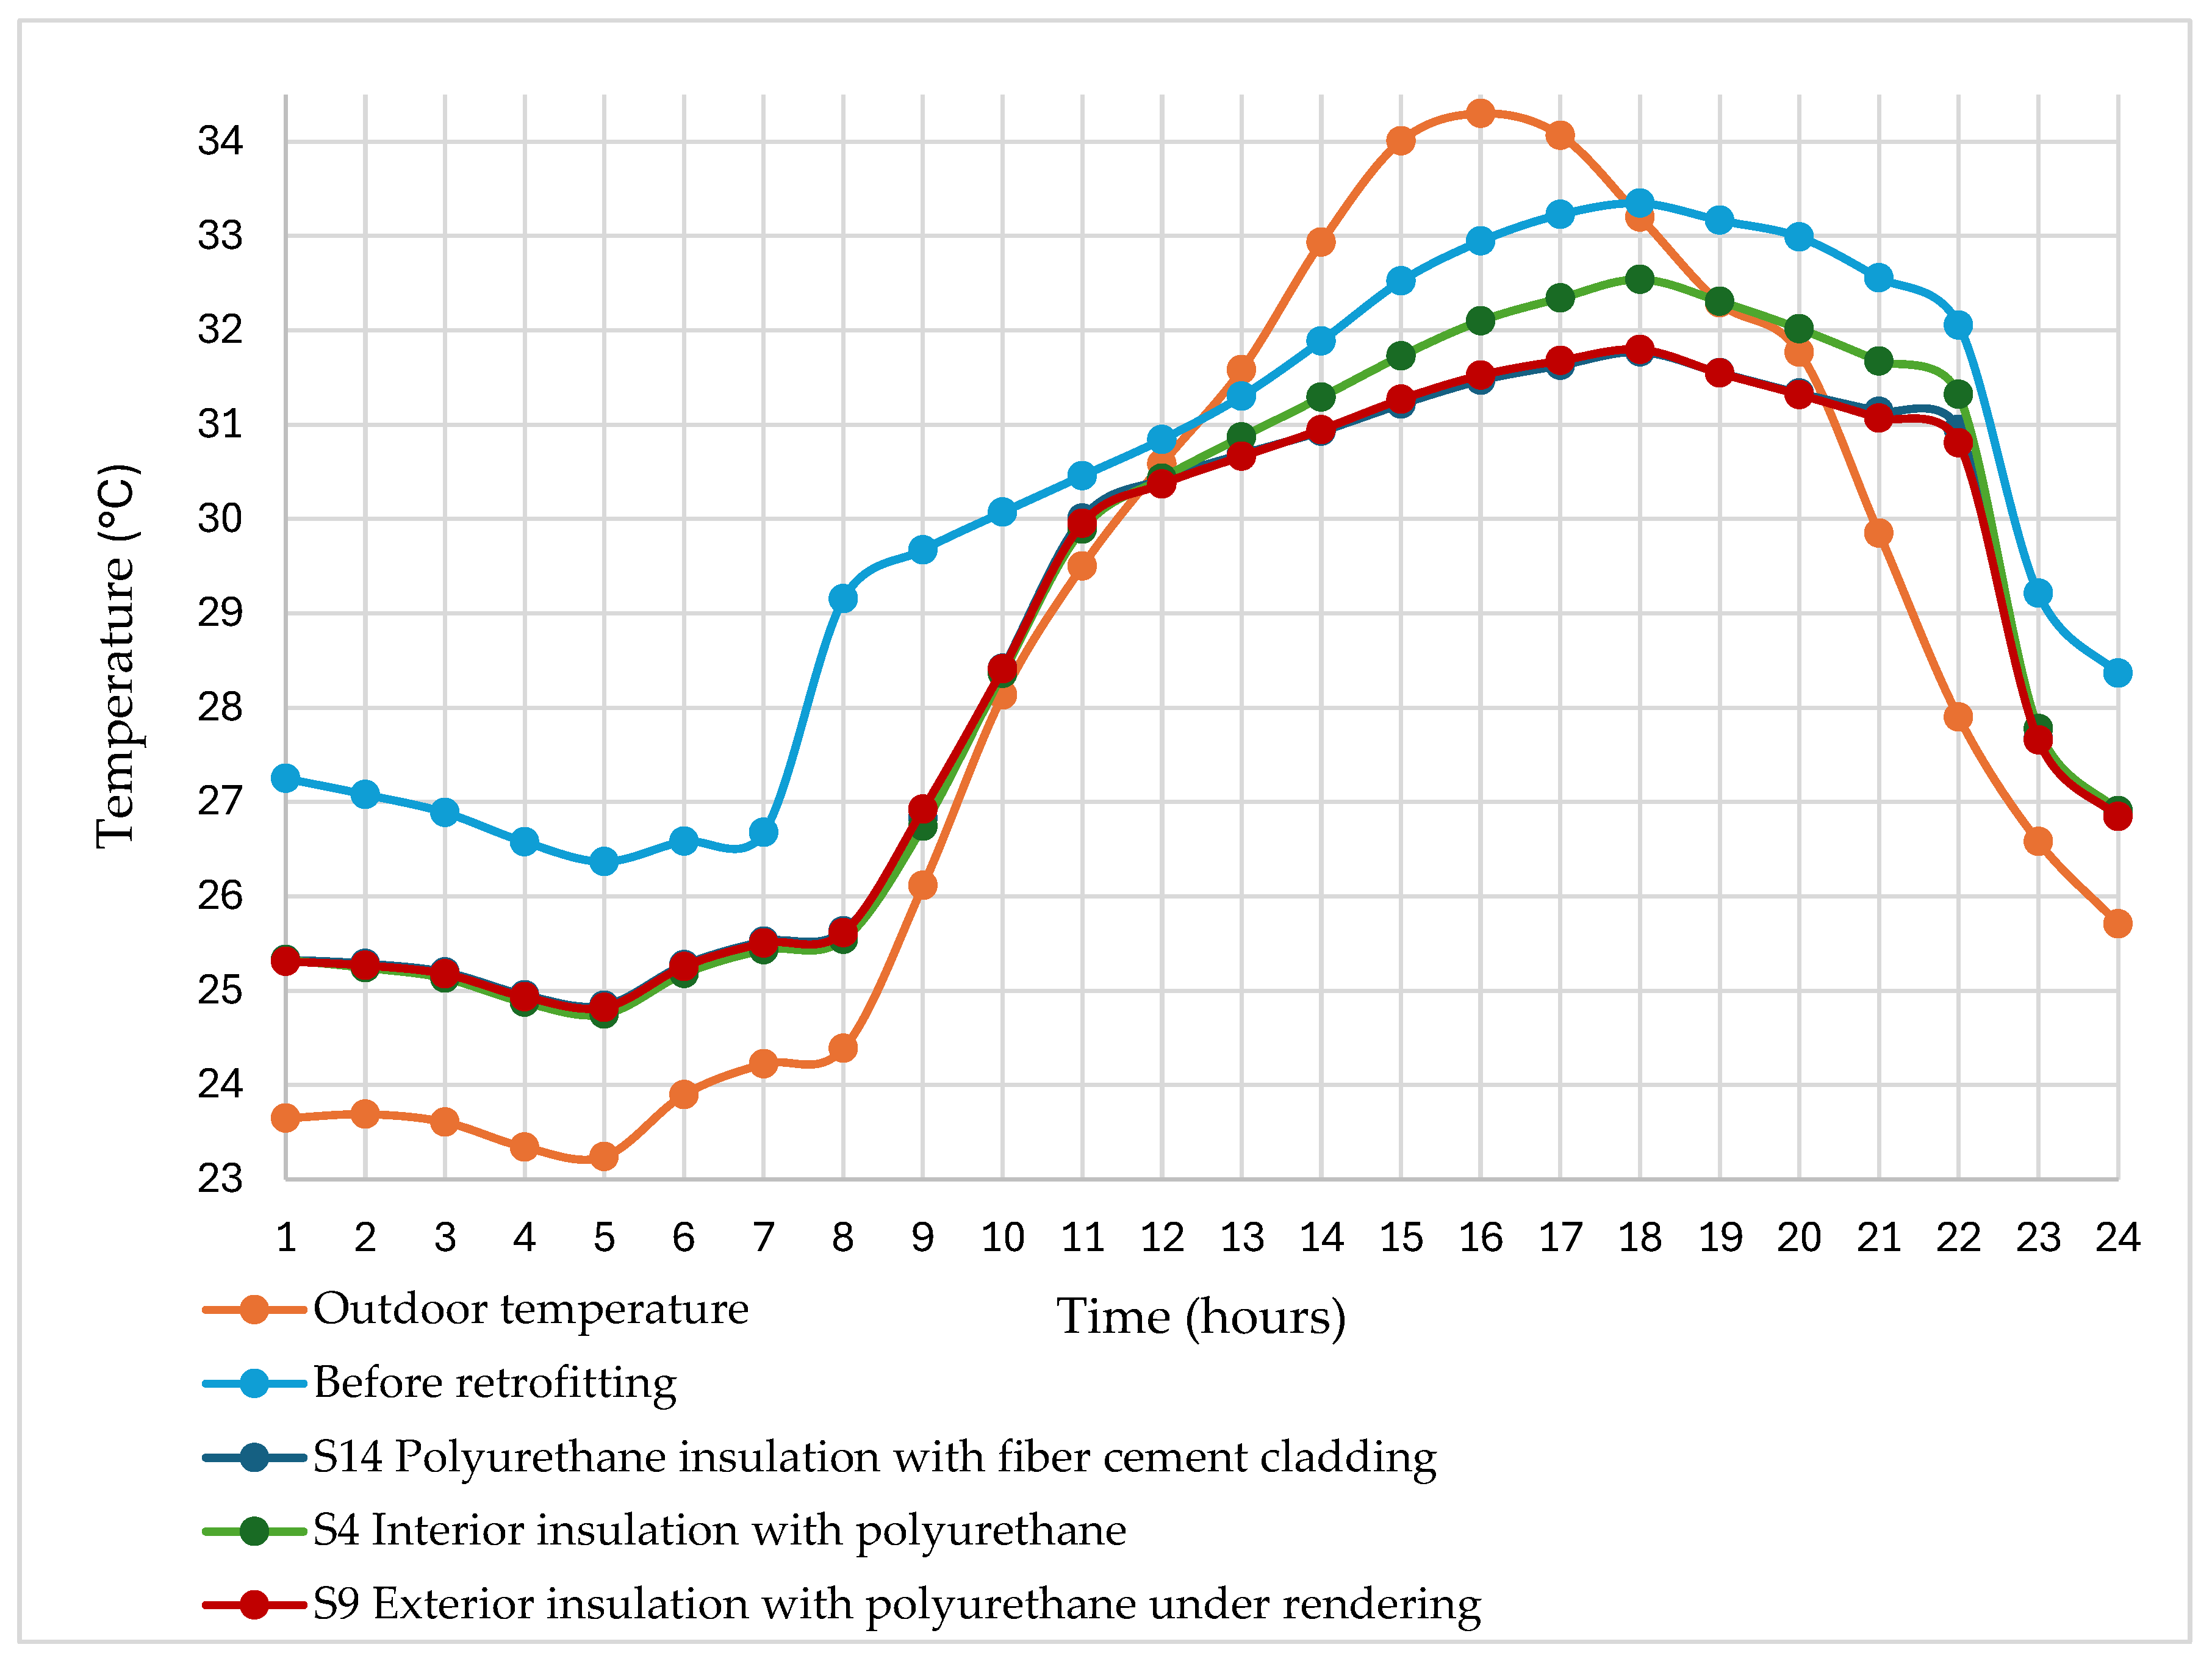
Figure 15 illustrates the differences between outdoor and indoor temperatures on August 6th, a day characterized by high temperatures reaching a maximum of 34.30 °C before decreasing in the evening. The simulation conditions included night ventilation without air conditioning. Indoor temperatures followed the same pattern as outdoor temperatures, with higher values in the pre-retrofit state, highlighting sensitivity to external climatic variations.
Indoors, the highest temperature occurred around 6 pm, with a two-hour lag compared to the outdoor peak. After retrofitting, all insulation strategies effectively reduced indoor temperatures, though differences were minor compared to the winter scenario. The S9 and S14 insulation strategies, when superposed, yielded identical results and proved the most effective, with a maximum difference of 3.61 °C at 8 h from the pre-retrofit state. The S4 strategy showed similar performance, with a maximum temperature difference of nearly 1 °C at 18 h. Due to controlled ventilation, post-retrofit temperatures remained consistent in the morning and evening across all three strategies.
The difference between strategies was less significant in the summer, although all solutions effectively limited solar gain. In contrast, the effectiveness of insulation and the variation in indoor temperatures were more pronounced during the winter. According to Bendouma [61], the air gap in under-slab insulation acts as a barrier that reduces heat loss in winter while facilitating the evacuation of accumulated heat from the cladding in summer. However, in high-temperature climates, this air gap may also introduce warm air, reducing its overall effectiveness. The presented results highlight the relevance of using a selection aid method to further analyze other comparative parameters.

4.3. Applying the ELECTRE III Method

As outlined in the Section 2, the potential actions defined by Figueira et al. [48] as A = {a1, a2, …, aₘ} are referred to as strategies in our case and denoted as S = {S1, S2, …, Sₘ}. The selection of criteria is tailored to align with the decision maker’s needs, which, in this study, is assumed to be the state. Accordingly, the priorities (criteria) have been determined. For interior and exterior insulation strategies (S1 to S10), the same selection criteria apply, whereas for exterior insulation under cladding (S10 to S16), different criteria are introduced due to the distinct analytical requirements of this study. The SRF method is employed to compute normalized weights for z = 6.5 and z = 8.67. The normalized weights are illustrated in the appendix Table A1 and Table A2. Table 8, Table 9 and Table 10 present the performance evaluation of different insulation strategies based on a set of eight criteria, labeled from C1 to C8 for clarity and consistency. These criteria include:
  • C1—CO2 emissions (Kg CO2/m2);
  • C2—Sustainability and recycling potential;
  • C3—Energy consumption (Wh/year);
  • C3′—Maintenance;
  • C4—Economic cost (DZD);
  • C5—Fire resistance scoring;
  • C6—Acoustic comfort scoring;
  • C7—Health hazard scoring;
  • C8—Installation convenience scoring.
The table also outlines the normalized weights, indifference, preference, and veto thresholds for each criterion, which are essential parameters for the multi-criteria decision-making process applied in this study.
Sustainability and recycling, fire resistance scoring, acoustic comfort scoring, and health hazard scoring are evaluated on a scale from 1 to 8, where 1 represents the lowest rating (poor) and 8 signifies the highest rating (excellent).

4.3.1. Interior Insulation

The most important criteria are considered to be energy consumption and economic cost, followed by fire resistance in third place. Acoustic comfort ranks next, while health hazard, durability, recycling, and CO2 emissions are regarded as equally significant.
To clarify how the ELECTRE III thresholds influence the outranking decisions, a specific comparison based on the results in Table 8 is presented. Strategy S1 (rock wool) and Strategy S3 (expanded polystyrene) exhibit respective energy consumptions of 2,526,154.00 Wh/year and 2,548,504.00 Wh/year. The absolute difference (22,350 Wh/year) exceeds both the preference threshold (10,789.67 Wh) and the veto threshold (20,230.64 Wh). In this case, energy consumption is a criterion to be minimized. Thus, Strategy S1, which consumes less energy, is not only preferred over S3, but this preference is considered strong, as the difference exceeds the veto threshold. Consequently, S3 is disqualified in comparison to S1, as its performance is deemed unacceptable beyond the rejection threshold.
The concept of partial preorders is also evident in the case of Strategy S2 (cork panels) versus Strategy S5 (cellular glass). While S2 performs better in environmental terms (C1 = −27 kg CO2/m2; C2 = 8), S5 offers advantages in energy consumption (C3 = 2,511,489.00 Wh/year) and fire resistance (C5 = 8). Due to these trade-offs and performance differences that may fall within threshold margins, the ELECTRE III method may classify these strategies as incomparable. This reflects real-world decision-making complexity, where no single alternative dominates across all criteria.
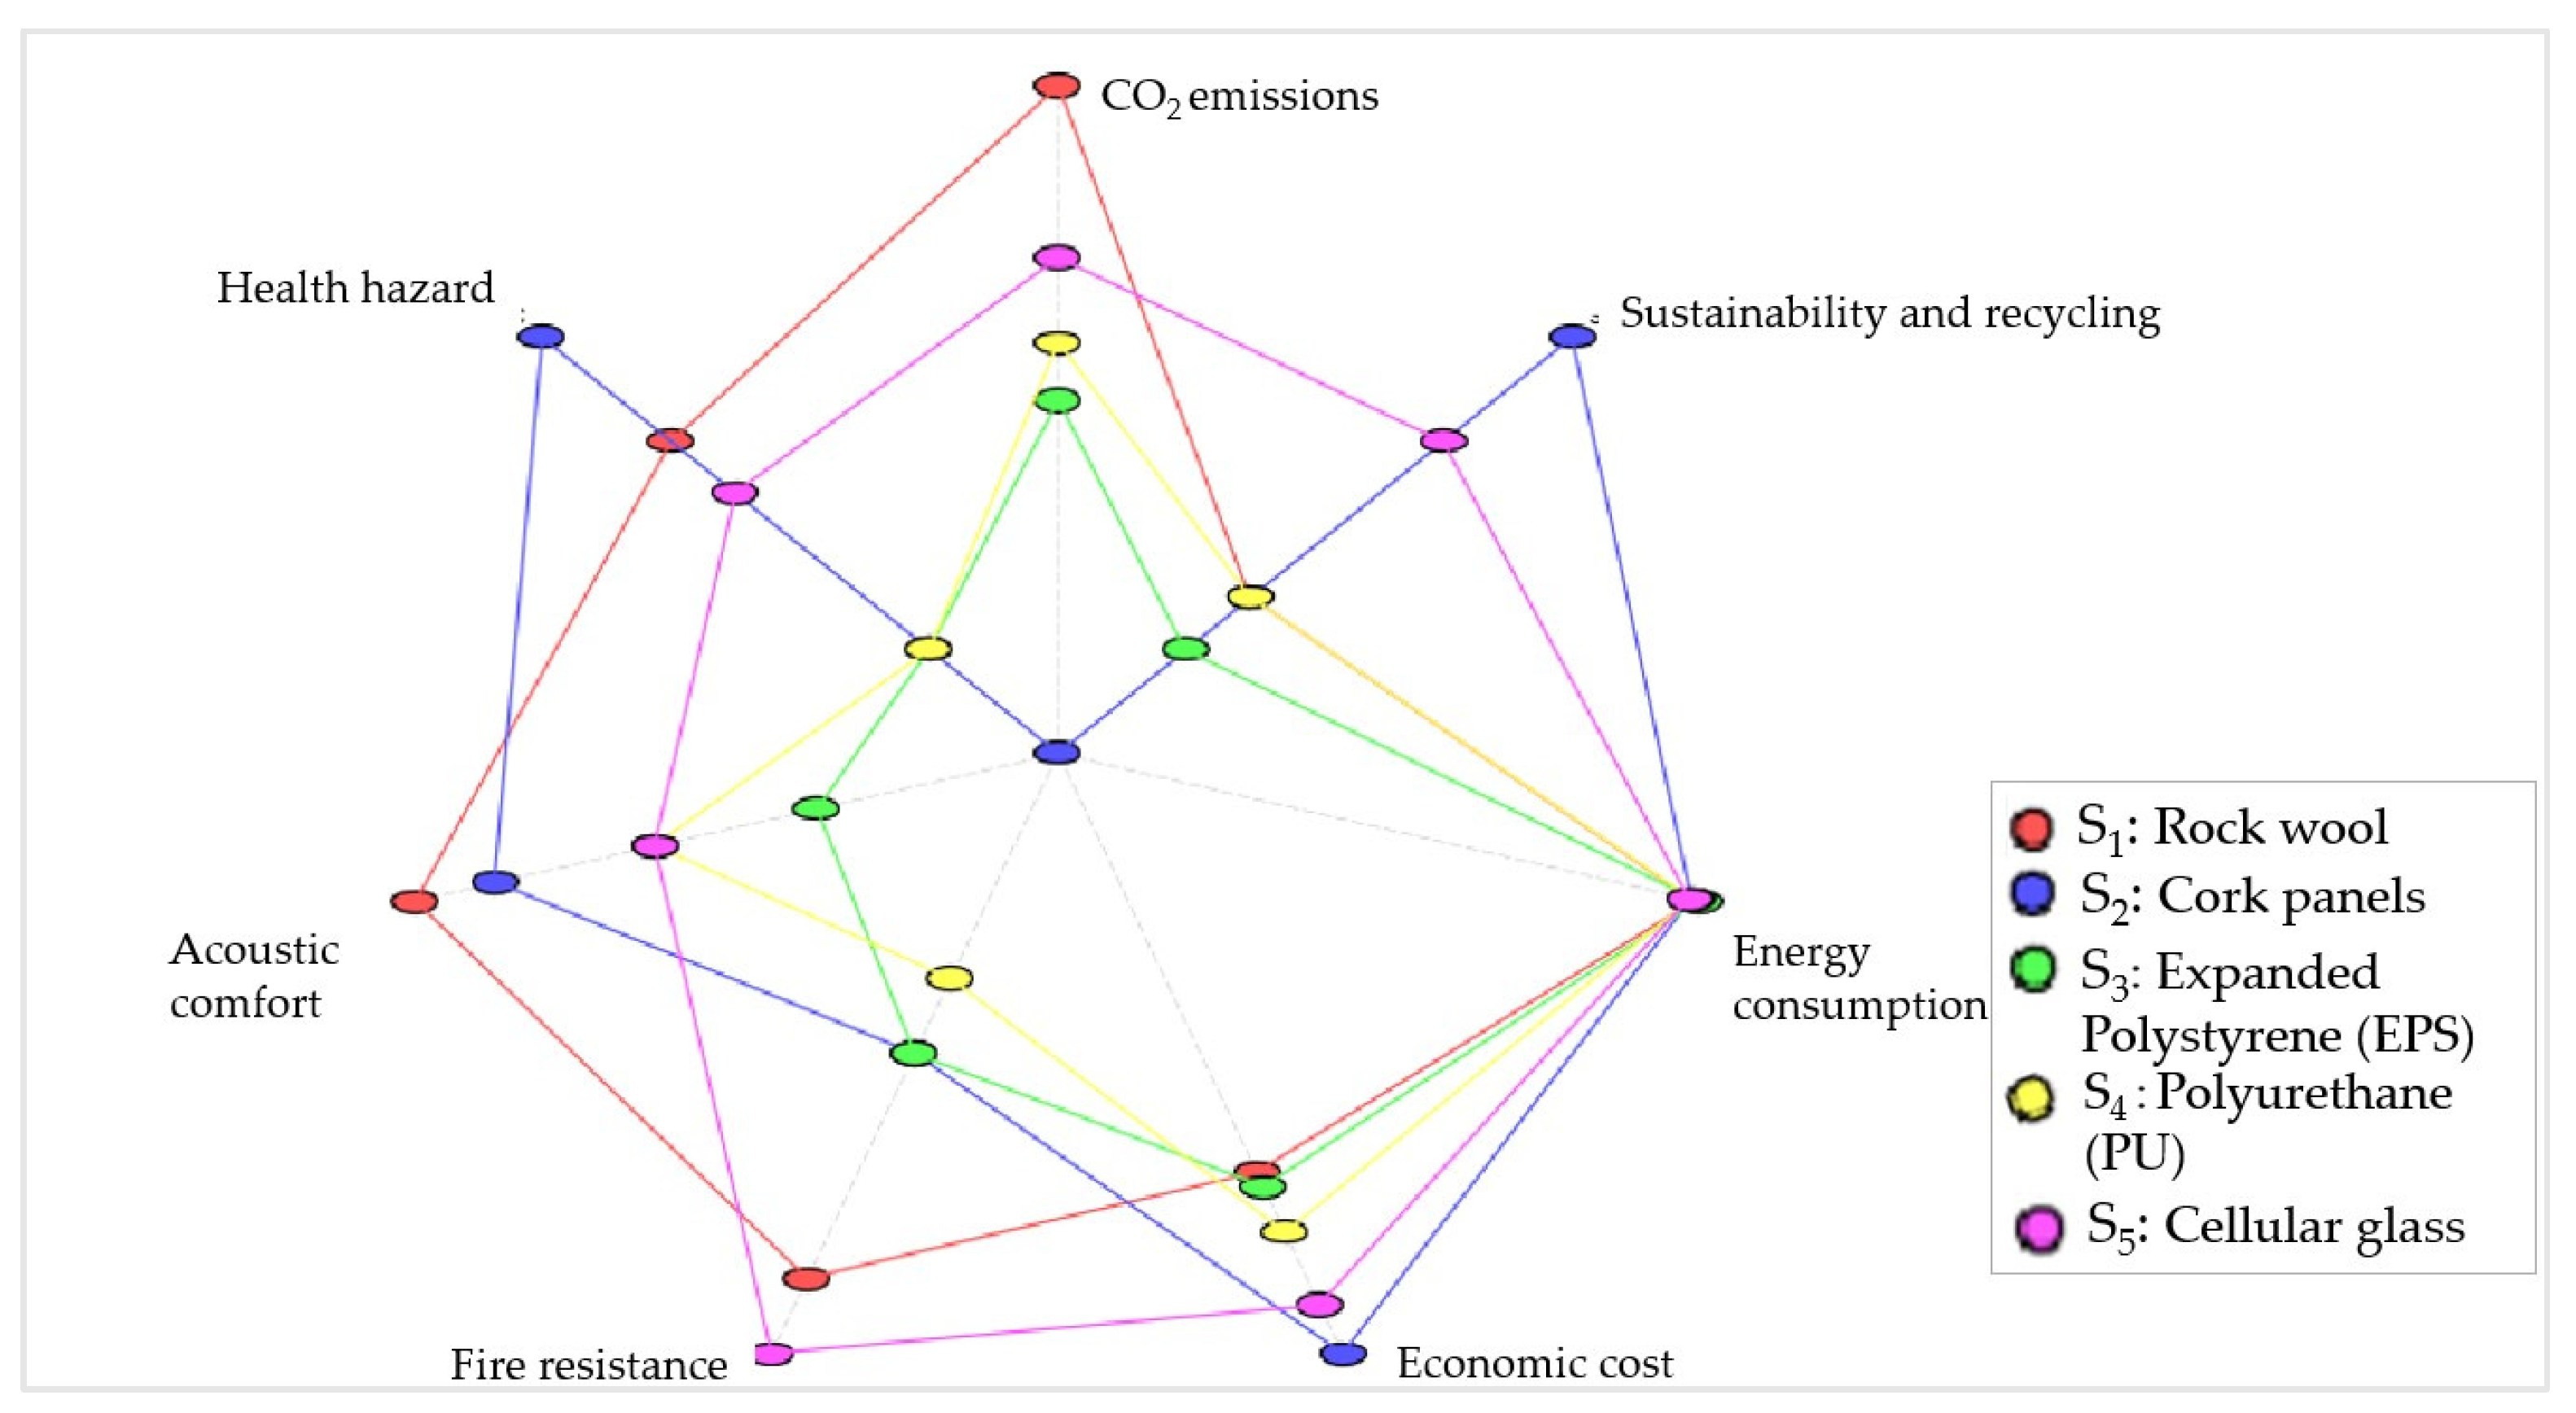
The radar diagram (Figure 16) illustrates the performance of various strategies across different criteria. The results indicate minimal differences in energy consumption, highlighting the complexity of the decision-making process. Among the strategies, S5, which utilizes cellular glass insulation, has the lowest energy consumption. S1, incorporating rock wool insulation, is the most effective in terms of acoustic comfort and economic cost but has a negative carbon footprint during production. Compared to S1, S2 (cork insulation) is the most environmentally friendly, excelling in CO2 emissions, durability, and recycling. Regarding the risk of inhaling toxic gases during a fire, S2 offers the best performance. Strategies S3 and S4 produce lower emissions than those using cellular glass (S5) and rock wool (S1). In terms of fire resistance, S5 ranks the highest.

4.3.2. Exterior Insulation with Rendering

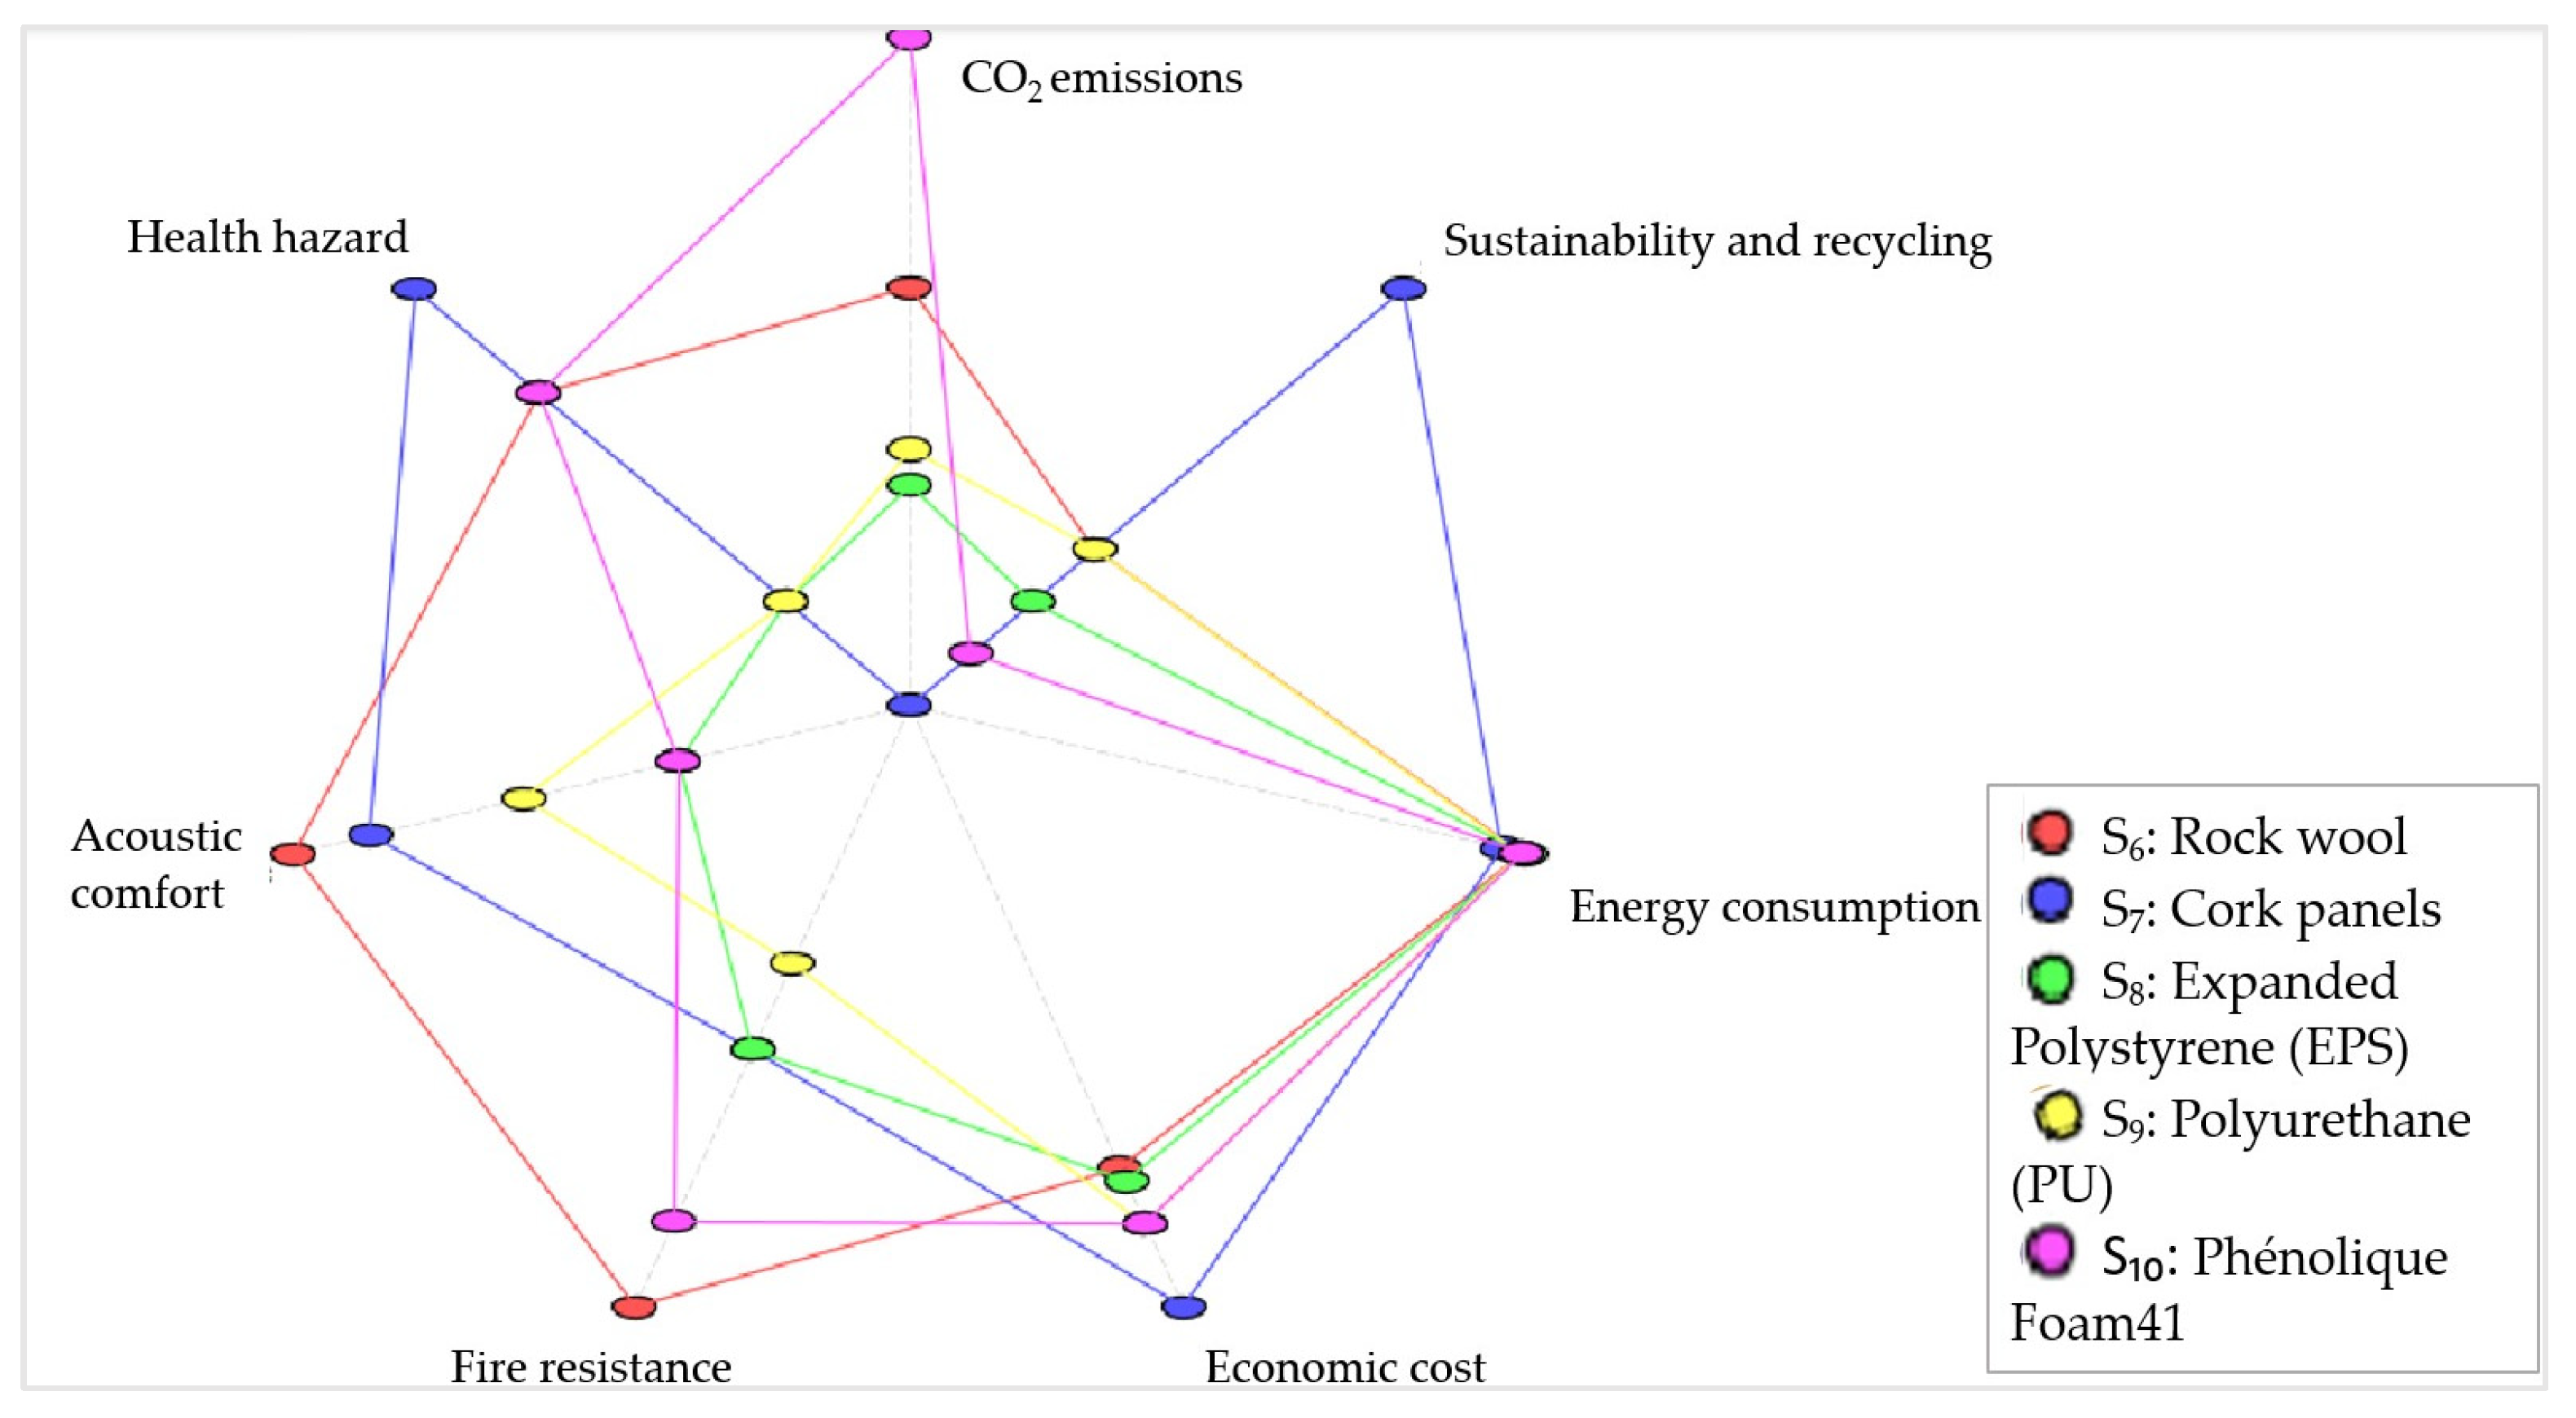
According to Figure 17, S10, which includes resolving foam, is highly polluting but performs well in recycling and sound insulation. S7 is the least energy-intensive, with a positive environmental impact, but it has the highest economic cost when compared to the others. S6 (rock wool) provides the best acoustic comfort and fire resistance. S8 and S9 remain more balanced than S10 in terms of environmental criteria (CO2 emissions and recycling).

4.3.3. Exterior Insulation with Cladding

Insulation strategies with cladding require the consideration of more subjective criteria, such as the exterior cladding’s resistance to ultraviolet rays, weathering, and mold. Cleaning time, treatment with special products, and reinforcement of the cladding depend on the materials used in its construction. The ease of installation of both insulation and cladding is also taken into account. To ensure a fair comparison, various insulating materials were combined with different claddings of natural, organic, or synthetic origin. As a result, the strategies offer a diverse range of sustainable options. The weights of the criteria are ranked by importance using the revised Simos method (z = 8.67).
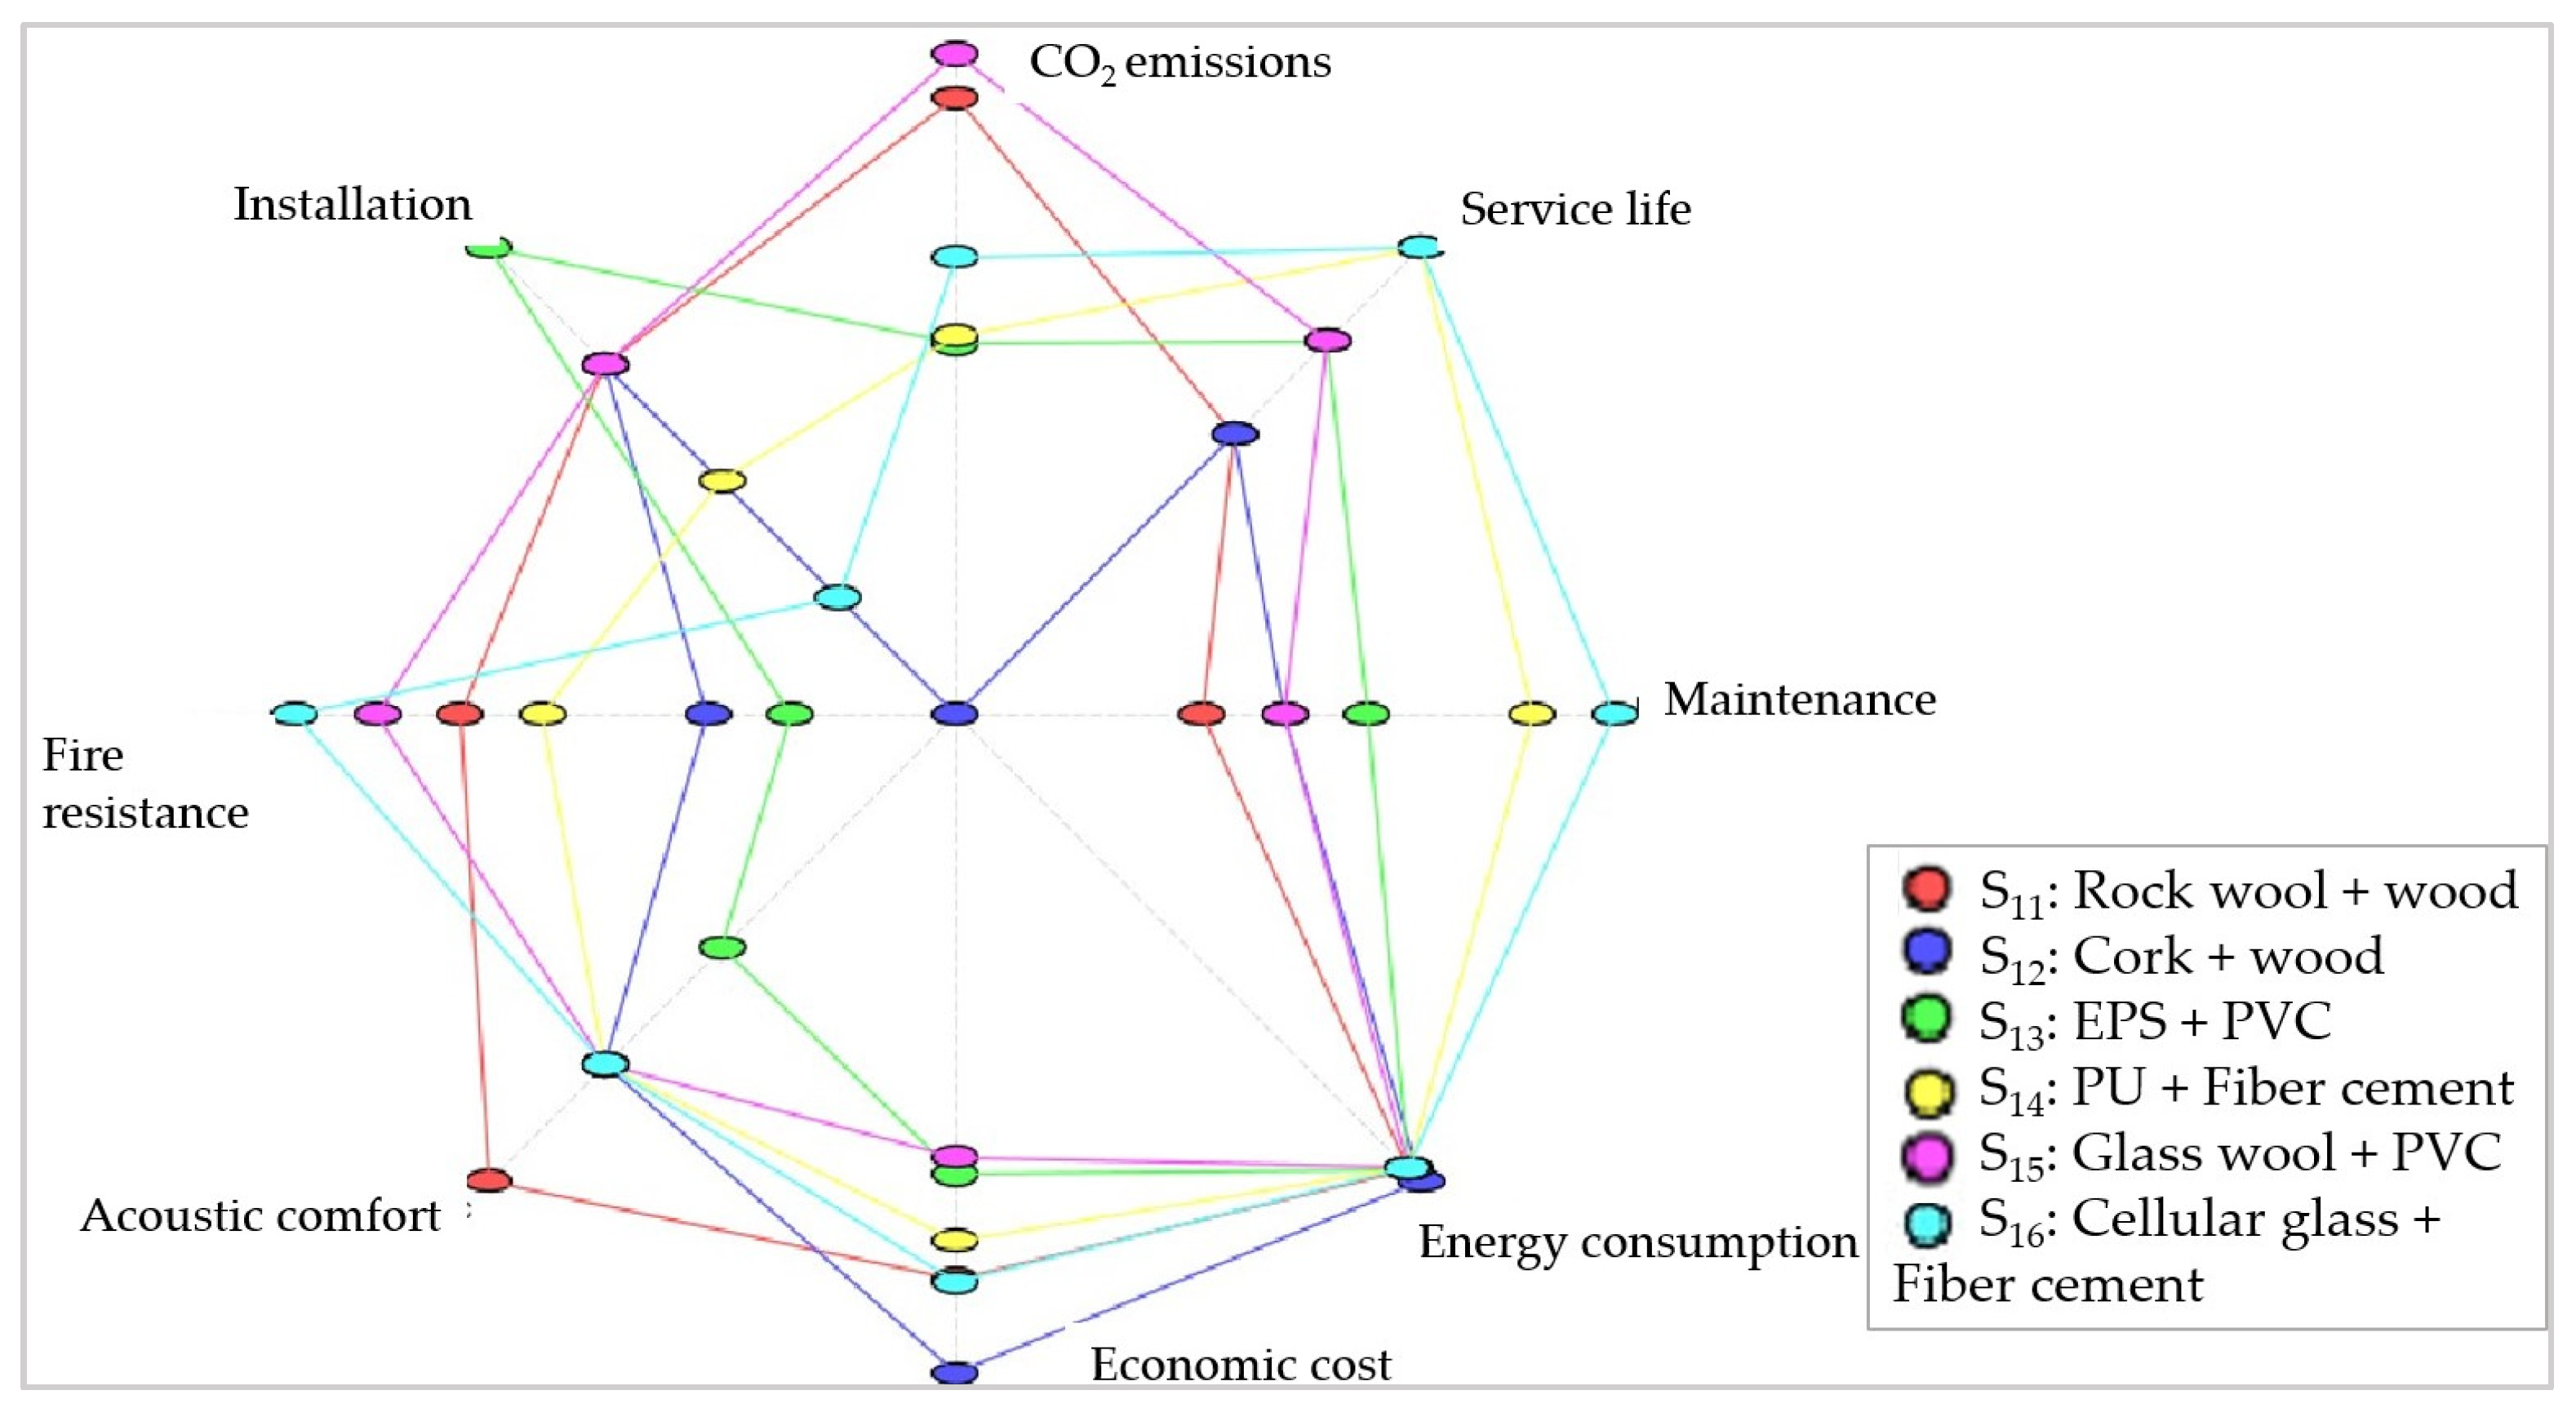
Figure 18 shows that the most polluting strategies are S11 and S15, followed by S16. S13 is the most user-friendly installation strategy, while S16 and S15 offer the best fire resistance. Economically, S15 is the least expensive, whereas S12 is the costliest and requires the most maintenance due to its wood cladding, though it is also the most durable. The energy performance of the strategies is comparable, but S15 is the most cost-effective. Strategies S14 and S16, featuring fiber cement cladding, have the longest service lives and do not require routine maintenance. The ranking results are detailed in the following subsection.
To ensure consistency in evaluating the criteria, the direct mode was chosen for the thresholds. A dynamic adaptation allows for a strict analysis based on tolerance that increases with the criterion’s value. Thresholds p, q, and v vary depending on performance or relative gaps between strategies. The discrimination index threshold function s(λ) is used for the sensitivity analysis, as outlined in the Section 2 (Equation (23)).

4.4. Results and Sensitivity Study of the ELECTRE III Method

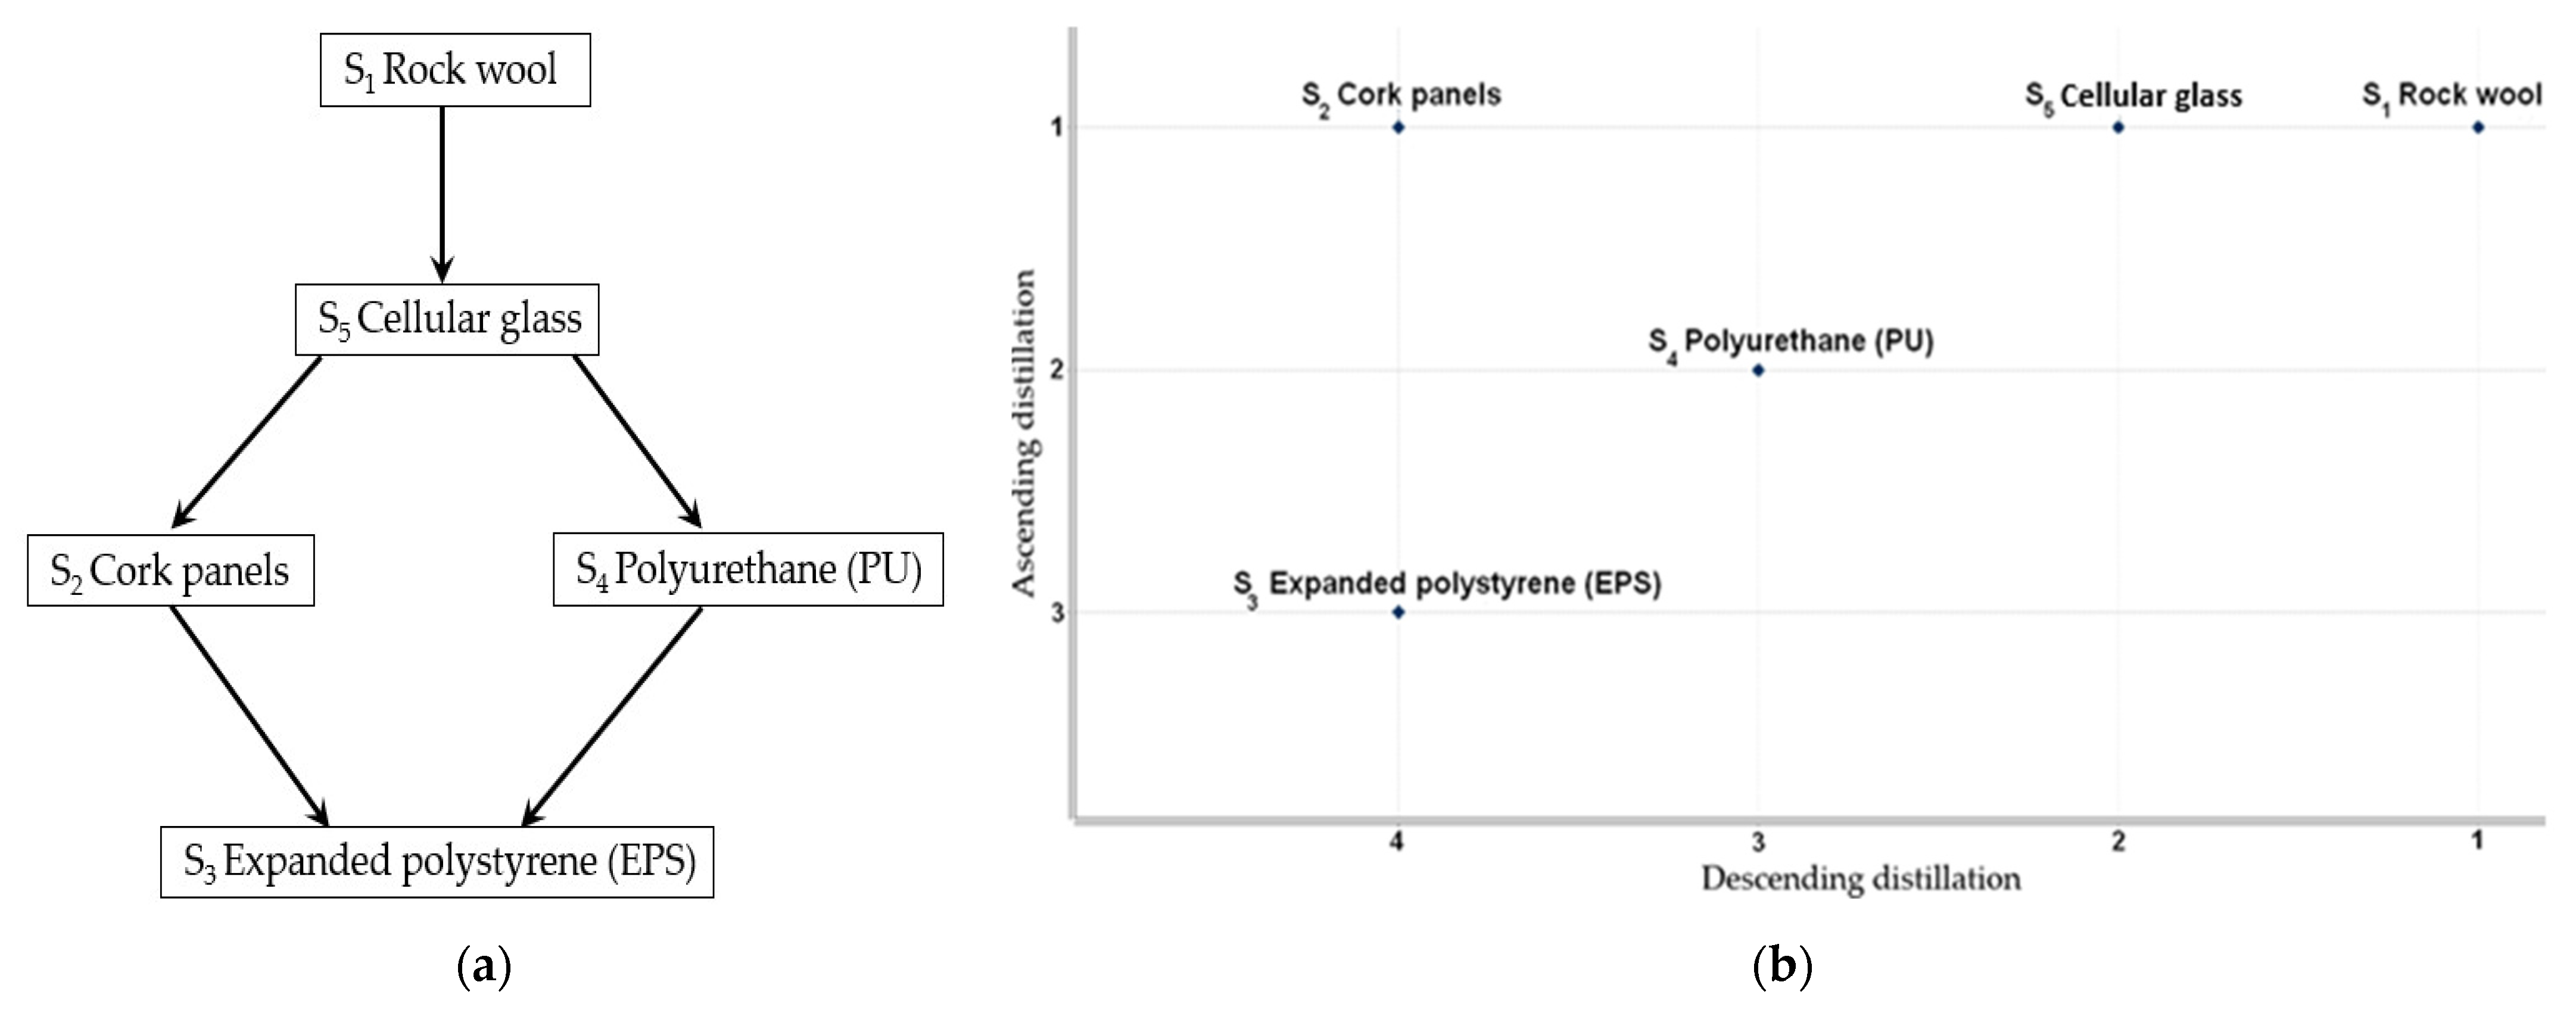
Figure 19a shows that for interior retrofit strategies with α = 0.3, S1 is the optimal solution, followed by S5 in second place. In third place, the decision maker can choose between S2 and S4, as their performances are similar. The upward and downward distillation graphs (Figure 19b) reveal a conflict between S2 and S4, with no clear dominance between them. In the upward distillation, S2 ranks first while S4 is third, whereas in the downward distillation, S4 takes third place and S2 falls to fourth.
Several variation scenarios were tested, including reducing indifference thresholds from 30% to 10% of the standard deviation, increasing the preference threshold to 85% with the veto, and adjusting the weights of the criteria while maintaining their relative importance. Despite these modifications, the ranking remains unchanged. Additionally, increasing α from 0.3 to 0.8 does not alter the ranking, confirming the stability and robustness of the results.
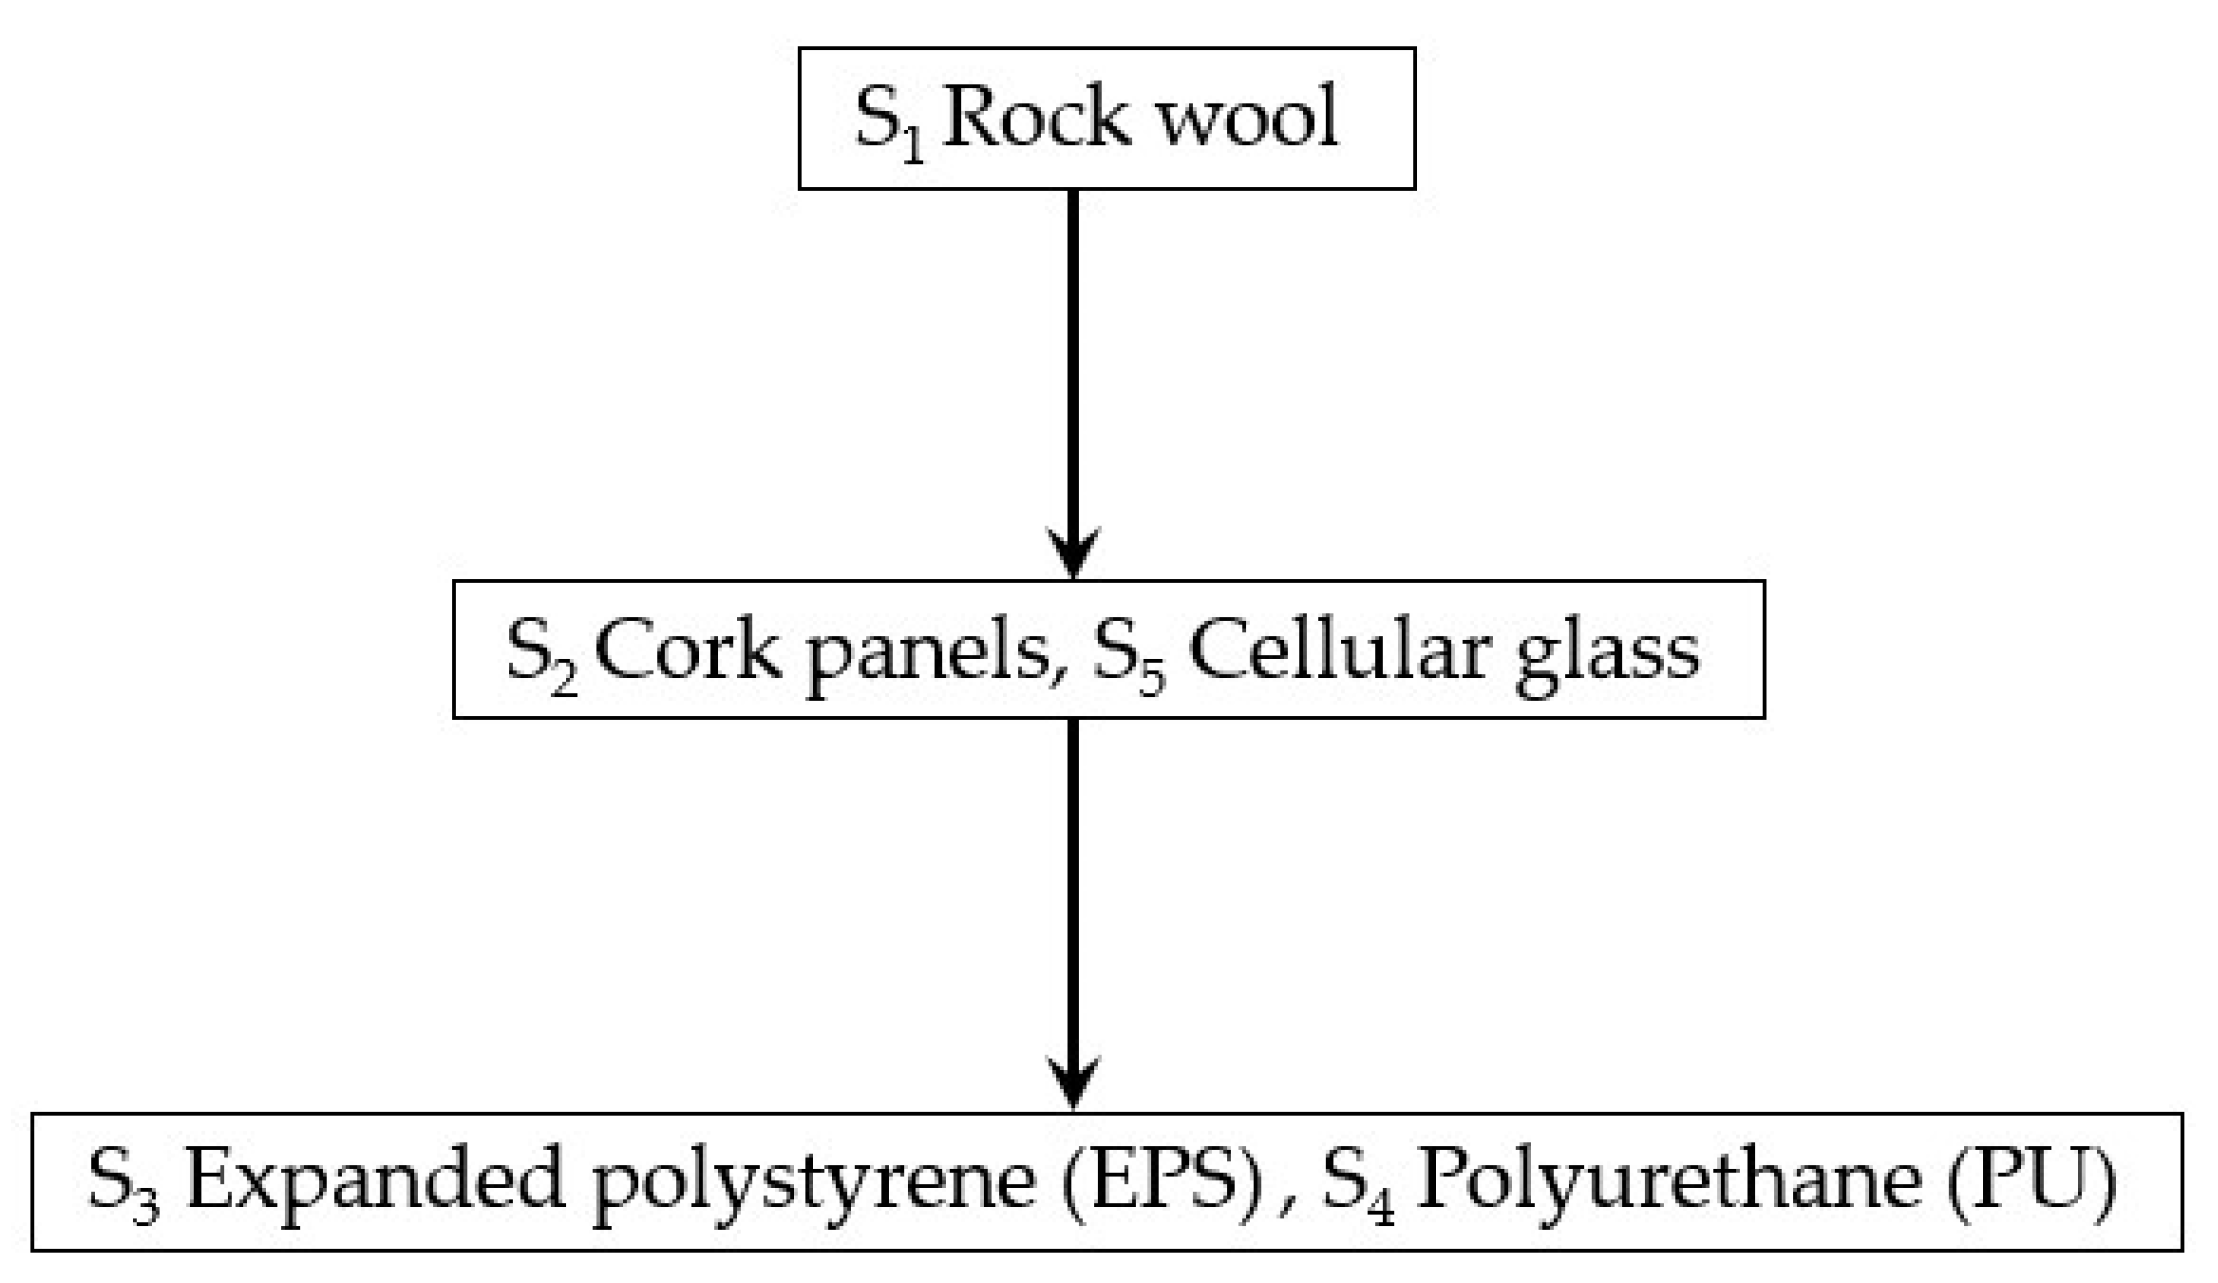
Figure 20 illustrates the ranking variations when α = 0.9. Rock wool (S1) outperforms the selected criteria, eliminating incomparability. In the second and third positions, the strategies are nearly indistinguishable. The ranking becomes less clear due to the high values assigned to the discrimination threshold of the credibility index.
Figure 21a presents the ranking of exterior insulation strategies applied under plaster, with rock wool (S6) emerging as the dominant option. Its performance reflects a balance across multiple criteria, making it a competitive choice. As shown in the distillation graph (Figure 21b), S7 ranks second. Despite its high cost, cork insulation (S7) may be a preferable option for the decision-maker due to its superior environmental and energy performance compared to other strategies. S8 takes third place, outperforming S9 and S10, whose rankings remain unchanged. This is primarily because the two most critical criteria—energy efficiency and economic cost—exhibit minimal differences between them.
Figure 21b indicates that rock wool insulation (S6) remains the dominant strategy in this group. As α increases, the ranking remains stable. When α reaches higher values (α ≥ 0.75), outranking becomes more restricted, causing some strategies to be considered indifferent. This effect is evident in Figure 22 with α = 0.9, where strategies with strong credibility, such as S6, maintain their ranking. However, as the ranking criteria become more stringent, S7 and S8 are now classified as indifferent.
As with internal insulation, changing the threshold parameters q from 10% to 30% and p from 30% to 50% yields the same results. The rankings remain stable, with rock wool continuing to dominate.
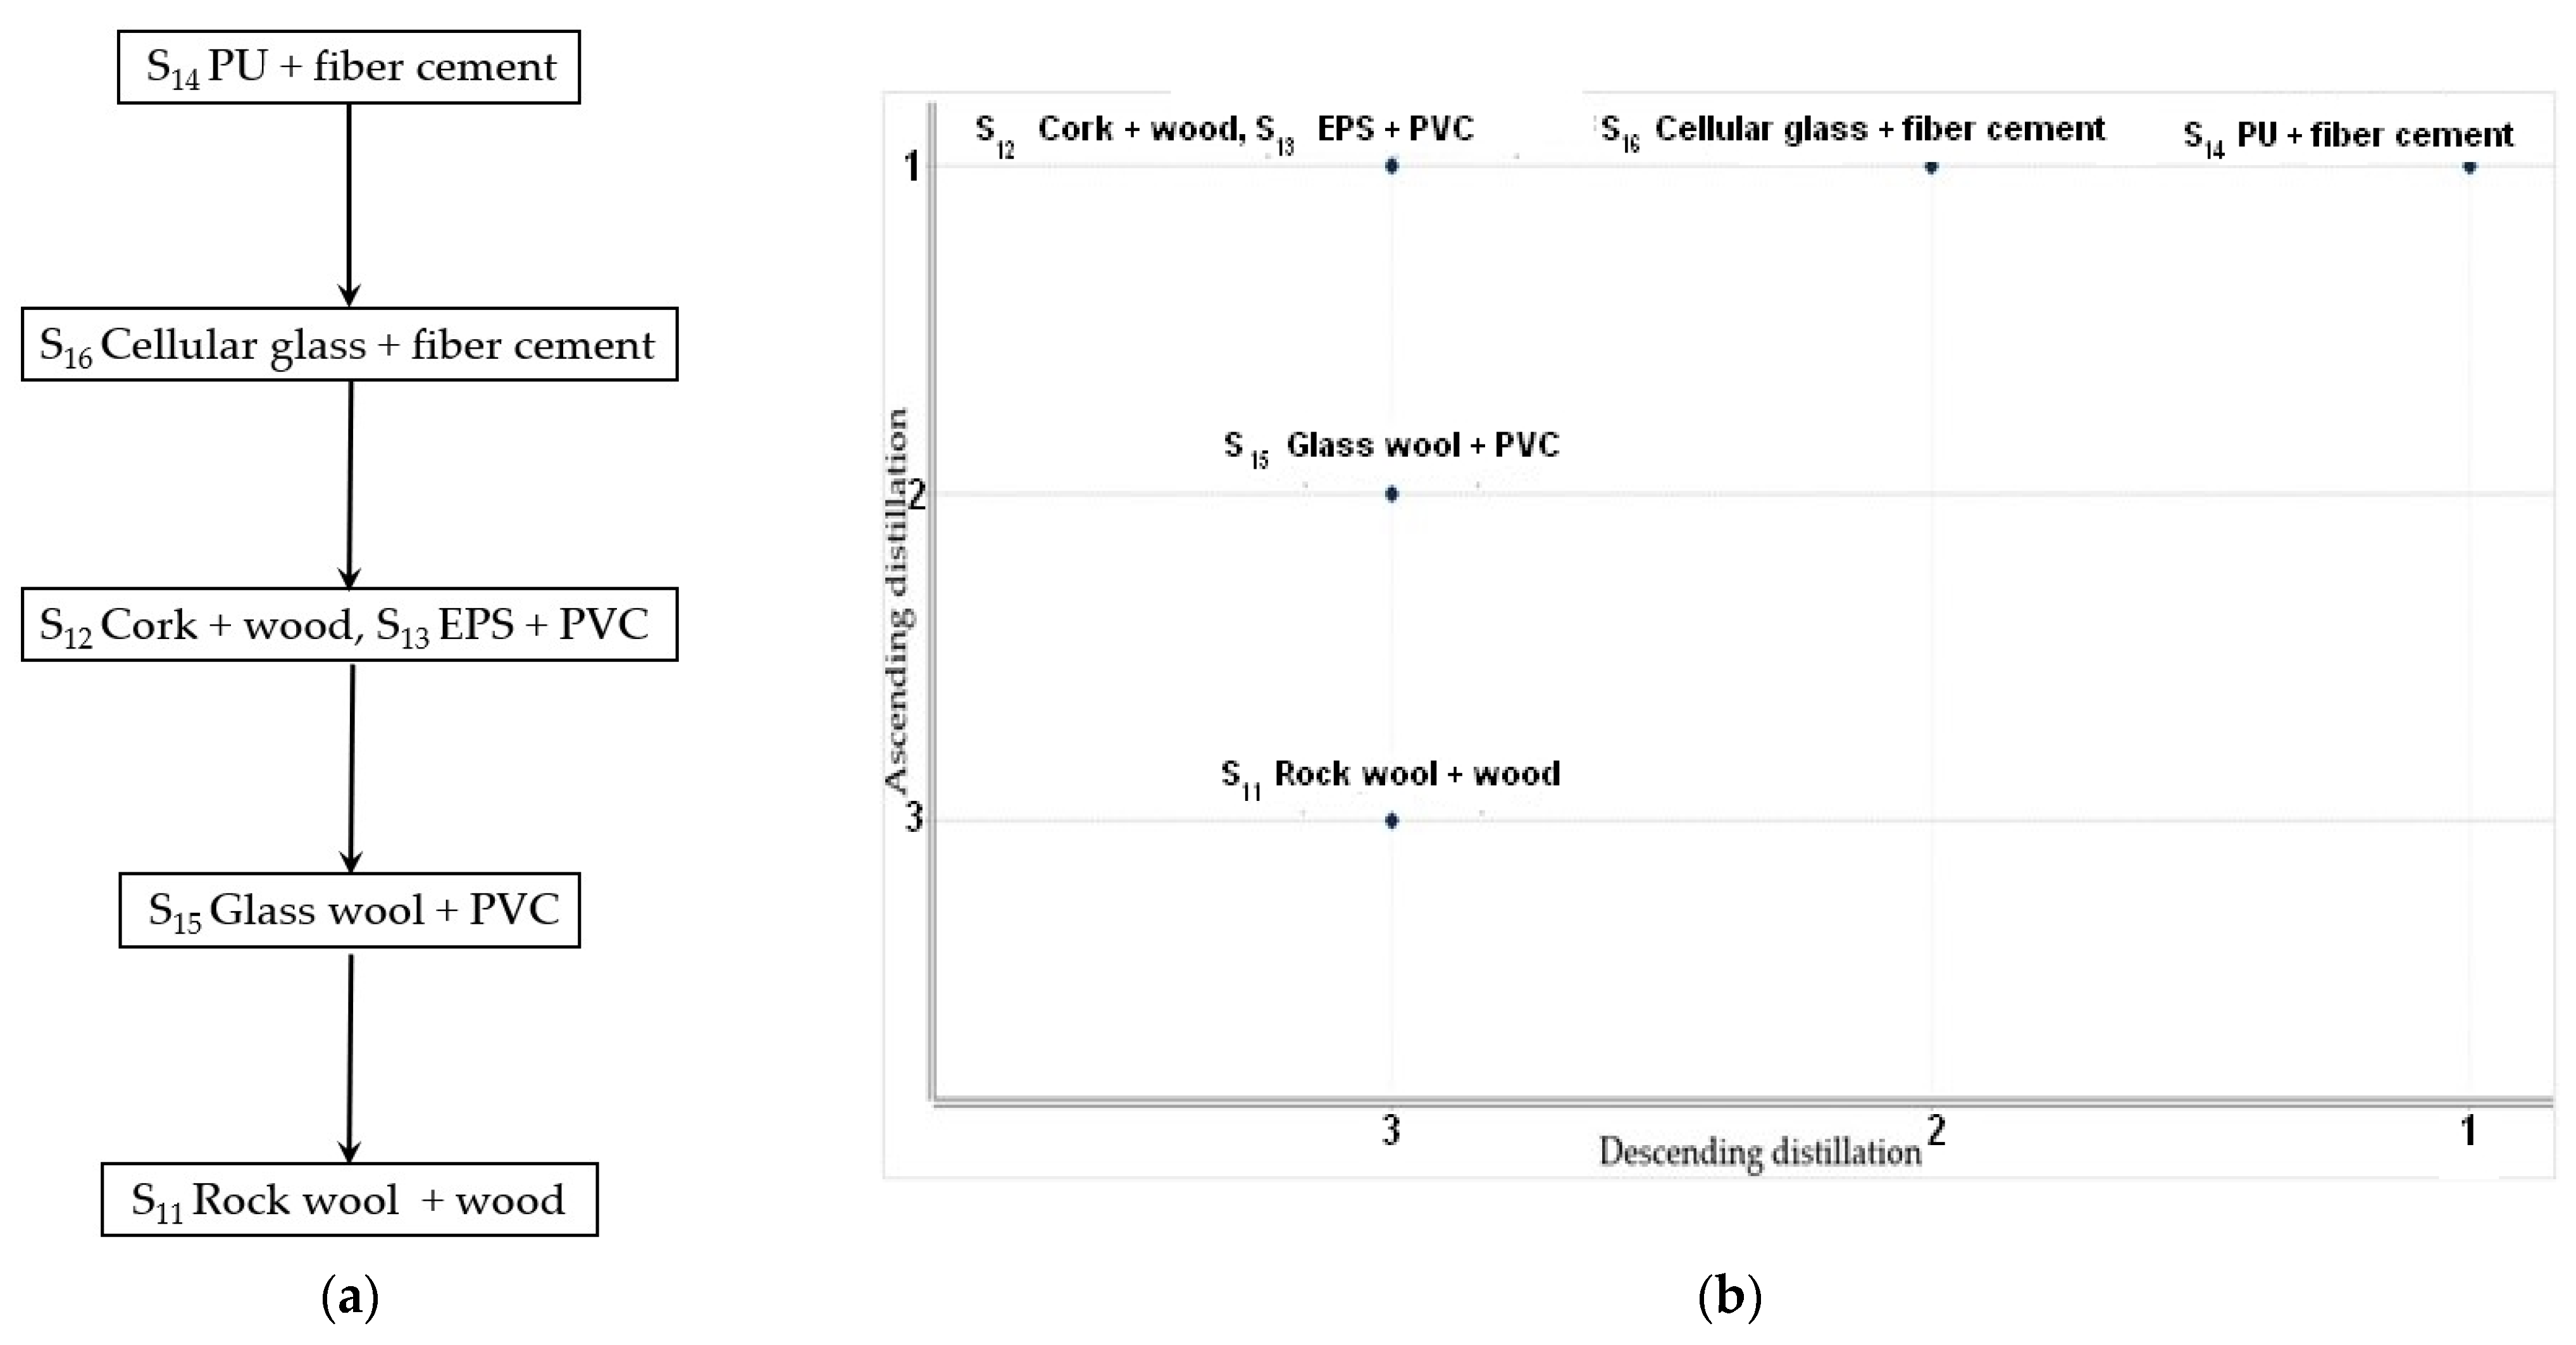
Figure 23 and Figure 24 show different rankings for exterior insulation strategies under cladding. The variation in the parameter α affects the final ranking. Setting α = 0.3 reduces tolerance for performance differences between strategies. The model is overly sensitive and takes into account only minor differences. Figure 23a shows that the two best-performing strategies, S14 and S16, are indifferent. This is due to their similar, and sometimes identical, performance characteristics, such as cladding service life and annual energy consumption.
S12 and S15 are incomparable, as shown in Figure 23b, with S12 ranking first and S15 second in the downward breakdown. S13 is ranked third, and S11 is ranked last, dominated by the other strategies, particularly in the maintenance criterion because rock wool combined with wood cladding is more prone to moisture and settlement problems and requires more frequent maintenance.
Raising the threshold to α = 0.6 results in a clearer and more hierarchical ranking, effectively grouping strategies with similar performance, as shown in Figure 24a. S14 remains the top-ranked solution, outperforming S16 in second place, as confirmed by the top-down distillation in Figure 24. This ranking also reinforces S11’s position in last place across both distillations.
In contrast, intermediate strategies shift positions under this less strict threshold. S12 and S13 are now considered indifferent and outperform S15. Further increasing the α parameter to 0.8, as observed in other interior and undercoated scenarios, leads to more clustering of strategies and increased indifference. The variation in α facilitated a sensitivity analysis of the models. However, the literature [50] recommends setting α at 0.3 and β at −0.15.

4.5. Broader Implications for Retrofit Decision Making and Sustainability

The results of this study highlight the complexity inherent in selecting retrofit strategies, particularly in contexts where energy savings, material sustainability, and social factors intersect. The adoption of ELECTRE III as a decision-support tool demonstrates its strength in navigating these conflicting priorities, offering a structured way to handle both technical performance and qualitative aspects such as health, comfort, and ease of installation. This addresses a gap often observed in energy retrofit research, where decisions are typically driven by cost or energy performance alone, overlooking the social and environmental dimensions essential to sustainable development.
These findings resonate with the work of Wu et al. [62], who emphasized the importance of integrating human-centered design, energy optimization, and interdisciplinary approaches in indoor environment strategies. Although their study focused on educational buildings, the methodological parallels are clear: both studies advocate for moving beyond purely energy-focused evaluations to embrace holistic, user-informed frameworks that account for comfort, adaptability, and broader sustainability goals. The convergence of these viewpoints reinforces the growing consensus that future retrofit frameworks must incorporate both objective performance and subjective user experience to be truly effective.
In practice, the identification of optimal strategies—such as rock wool or polyurethane with fiber cement—underscores the need for retrofit guidelines in Algeria to evolve beyond prescriptive technical specifications. Incorporating multi-criteria decision making into policy design could ensure that future retrofitting projects not only meet energy efficiency goals but also contribute to occupant well-being and long-term material sustainability. This aligns with the broader reflections given by Wu et al. [62], which advocate for more adaptable, dynamic, and human-aware building evaluation systems that can respond effectively to diverse climatic and operational conditions.
On a broader scale, this study supports global energy transition priorities by demonstrating that deep energy retrofits can substantially reduce carbon emissions while improving indoor environmental quality. The flexible, criteria-driven methodology proposed here is well-suited for replication in regions with similar architectural and climatic profiles, including much of the Mediterranean and North African context. By combining quantitative simulations, stakeholder-centered evaluation, and regulatory compliance, the approach contributes to Algeria’s sustainability ambitions while offering valuable insights into the future of building retrofits as envisioned by international frameworks such as the UN Sustainable Development Goals (SDGs).

5. Conclusions and Perspectives

This study proposed and validated a sustainable multi-criteria optimization framework for the energy retrofit of collective housing buildings constructed in Algeria between the 1970s and 1980s. Through a combination of on-site surveys, dynamic energy simulations using EnergyPlus, and multi-criteria decision making with the ELECTRE III method, 16 retrofit strategies were evaluated across environmental, economic, and social criteria.
The initial assessment confirmed the poor thermal performance of the studied buildings, with top-floor apartments consuming an average of 178 kWh/(m2·year)—classifying them in energy label class G. After applying the proposed retrofit strategies, simulations demonstrated that total energy consumption could be reduced by up to 72.5%, with heating demand reduced by 94.4% and cooling demand by 43.5%, depending on the choice of insulation material and its placement.
This study compared three types of insulation configurations—internal insulation, external insulation with rendering, and external insulation with cladding. The results show that exterior insulation under cladding (particularly polyurethane combined with fiber cement) offers the highest winter energy savings and the most stable indoor temperatures. For summer cooling demand, rendered exterior insulation proved slightly more efficient.
The multi-criteria analysis identified rock wool as the optimal solution for both internal and rendered exterior insulation, while polyurethane with fiber cement ranked highest among cladding-based strategies, offering a balanced compromise between thermal performance, cost, fire safety, health impact, and sustainability.
Beyond technical outcomes, this study emphasizes the potential for informed, criteria-based retrofit decisions to contribute to Algeria’s national energy transition goals and its commitments under the Sustainable Development Goals (SDG 7 and SDG 11). The framework is designed to be adaptable to other regions and building types, providing a valuable tool for decision makers seeking to enhance the energy efficiency, sustainability, and resilience of existing housing stock.
Future work will explore the impact of hygrothermal conditions on insulation performance and expand the evaluation to include heating system upgrades, renewable energy integration, and solar protection measures, to develop even more comprehensive retrofit strategies.

Author Contributions

Conceptualization, N.C. and A.M.M.; methodology, N.C. and M.K.; software, N.C.; validation, Z.R.H., N.A. and M.H.-N.; formal analysis, Z.R.H. and N.H.; investigation, N.C. and A.M.M.; resources, M.K., N.H. and N.A.; writing—original draft preparation, N.C. and Z.R.H.; writing—review and editing, N.H., N.A. and M.H.-N.; visualization, M.K. and N.H.; supervision, A.M.M. and M.K. All authors have read and agreed to the published version of the manuscript.

Funding

This research received no external funding.

Institutional Review Board Statement

Not applicable.

Informed Consent Statement

Not applicable.

Data Availability Statement

The data presented in this study are available on request from the corresponding author.

Acknowledgments

The authors sincerely thank Meteoblue for providing free access to meteorological data, which was essential for comparing measurements and simulations.

Conflicts of Interest

The authors declare no conflicts of interest.

Nomenclature

ASet of alternatives to choose from
FFamily of criteria that evaluate each of A’s alternatives
g j ( a i ) Performance   of   alternative   a i according to criterion j
w j The weight associated with criterion j, expressing its relative importance in the set F
zCoefficient for normalizing criterion weights
p j ( g j ( a i ) ) Strict   alternative   preference   threshold   a i
q j ( g j a i ) Low preference threshold for criterion j
v j ( g j ( a i ) ) Veto threshold for criterion j
c j ( a 1 , a 2 ) Partial   concordance   index   according   to   criterion   j   for   assertion   a   1   outperforms a 2
C a 1 , a 2 Overall   concordance   index   for   the   claim   a 1   outperforms   a 2 on all criteria
d j a 1 , a 2 Partial   discordance   index   according   to   j   for   the   statement   a 1   outperforms   a 2
DcSet of j such that its partial discordance is greater than the global concordance
σ s a 1 , a 2 Credibility   index   for   the   a   1   and   a 2 action pair comparison
a 1   S   a 2 The   a 1   action   outperforms   a 2
s(λ)Credibility index discrimination threshold
Z1Partial pre-order obtained by downward breakdown
Z2Partial pre-order obtained by upward breakdown
ZThe intersection of Z1 and Z2 to obtain the final ranking
λThermal conductivity, W·m−1·K−1
CpSpecific heat, J·kg−1·K−1
ρ Material density, Kg/m3
kWhpeKilowatt-hour Primary Energy
DZDAlgerian Dinar

Appendix A

Table A1 and Table A2 explain how to apply the SRF method and calculate normalized criterion weights.
Table A1. Determination of normalized criteria weights with z = 6.5 and T = 13.
PositionCriteriaNon-Normalized WeightsNormalized Weights
1CO214.82
1Sustainability14.82
1Health hazard14.82
(2) * ///
3 Acoustic comfort2.1010.12
(4), (4)///
5Fire resistance3.7518.07
(6), (6)///
7Economic cost5.4026.02
(8)///
9Energy consumption6.5031.33
* Positions in brackets () indicate blank cards. Criteria are ranked from least to most important.
Table A2. Determination of normalized criteria weights with z = 8.67 and T = 13.
PositionCriteriaNon-Normalized WeightsNormalized Weights
1CO213
1Installation13
(2) *///
3Acoustic comfort2.537.59
(4)///
5Maintenance4.0712.21
5Service life4.0712.21
6Fire resistance4.8414.53
(7)(7)//
(8)(8)//
9Economic cost7.1421.43
(10)(10)//
11Energy consumption8.6726.03
* Positions in brackets () indicate blank cards. Criteria are ranked from least to most important.

References

  1. Cantin, R.; Mourtada, A.; Guarracino, G.; Adra, N.; Nasser, M.; Maamari, F. Scenarios of application of energy certification procedure for residential buildings in Lebanon. Energy Policy 2007, 35, 3167–3178. [Google Scholar] [CrossRef]
  2. Pérez-Lombard, L.; Ortiz, J.; Pout, C. A Review on Buildings Energy Consumption Information. Energy Build. 2008, 40, 394–398. [Google Scholar] [CrossRef]
  3. République Algérienne Démocratique et Populaire. Ministère de L’énergie et des Mines, T. Bilan Energétique National 2022. Available online: https://www.energy.gov.dz/?article=bilan-energetique-national-du-secteur (accessed on 29 January 2025).
  4. Ouahab, A. Les Gisements d’économie d’énergie et Des Émissions de CO2 à l’horizon 2050 Dans Le Secteur Résidentiel Algérien. J. Renew. Energ. 2015, 18, 667–682. [Google Scholar] [CrossRef]
  5. Seddiki, M.; Anouche, K.; Bennadji, A.; Boateng, P. A Multi-Criteria Group Decision-Making Method for the Thermal Renovation of Masonry Buildings: The Case of Algeria. Energy Build. 2016, 129, 471–483. [Google Scholar] [CrossRef]
  6. Ding, Z.; Li, J.; Wang, Z.; Xiong, Z. Multi-Objective Optimization of Building Envelope Retrofits Considering Future Climate Scenarios: An Integrated Approach Using Machine Learning and Climate Models. Sustainability 2024, 16, 8217. [Google Scholar] [CrossRef]
  7. Biega, K.; Krarti, M. Evaluation of Exterior Insulated Panels for Residential Deep Energy Retrofits. Energies 2024, 17, 3988. [Google Scholar] [CrossRef]
  8. Fezzioui, N.; Belkacem, D.; Mebirika, B.; Larbi, S. Influence of Dynamic Characteristics of the Building Envelope on Thermal Comfort in Southern Algeria (in French). Rev. Energ. Renouvelables 2008, 11, 25–34. [Google Scholar]
  9. Bentoumi, L.; Bouacida, T.; Bessaïh, R.; Bouttout, A. Impact of Thermal Insulation on Energy Consumption in Buildings. J. Therm. Eng. 2024, 10, 924–935. [Google Scholar] [CrossRef]
  10. Ahn, B.-L.; Kim, J.-H.; Jang, C.-Y.; Leigh, S.-B.; Jeong, H. Window Retrofit Strategy for Energy Saving in Existing Residences with Different Thermal Characteristics and Window Sizes. Build. Serv. Eng. Res. Technol. 2015, 37, 18–32. [Google Scholar] [CrossRef]
  11. Shu, L.; Mo, Y.; Zhao, D. Energy retrofits for smart and connected communities: Scopes and technologies. Renew. Sustain. Energy Rev. 2024, 199, 114510. [Google Scholar] [CrossRef]
  12. Desvallées, L. Low-carbon retrofits in social housing: Energy efficiency, multidimensional energy poverty, and domestic comfort strategies in southern Europe. Energy Res. Soc. Sci. 2022, 85, 102413. [Google Scholar] [CrossRef]
  13. Djafri, R.; Osman, M.M.; Rabe, N.S.; Shuid, S. Algerian Housing Policies. Asian J. Environ. Behav. Stud. 2019, 4, 1–14. [Google Scholar] [CrossRef]
  14. Benmicia, N. The Energy Efficiency Diagnosis of Residential Buildings in Algeria. E3S Web Conf. 2023, 436, 01009. [Google Scholar] [CrossRef]
  15. Taylor, N.W.; Searcy, J.K.; Jones, P.H. Multifamily Energy-Efficiency Retrofit Programs: A Florida Case Study. Energy Effic. 2016, 9, 385–400. [Google Scholar] [CrossRef]
  16. Hens, H. Energy Efficient Retrofit of an End of the Row House: Confronting Predictions with Long-Term Measurements. Energy Build. 2010, 42, 1939–1947. [Google Scholar] [CrossRef]
  17. Zhang, L.; Liu, Z.; Hou, C.; Hou, J.; Wei, D.; Hou, Y. Optimization Analysis of Thermal Insulation Layer Attributes of Building Envelope Exterior Wall Based on DeST and Life Cycle Economic Evaluation. Case Stud. Therm. Eng. 2019, 14, 100410. [Google Scholar] [CrossRef]
  18. Zhang, L.Y.; Jin, L.W.; Wang, Z.N.; Zhang, J.Y.; Liu, X.; Zhang, L.H. Effects of Wall Configuration on Building Energy Performance Subject to Different Climatic Zones of China. Appl. Energy 2017, 185, 1565–1573. [Google Scholar] [CrossRef]
  19. Ozel, M. Effect of Insulation Location on Dynamic Heat-Transfer Characteristics of Building External Walls and Optimization of Insulation Thickness. Energy Build. 2014, 72, 288–295. [Google Scholar] [CrossRef]
  20. Al-Sanea, S.A.; Zedan, M.F. Effect of Insulation Location on Initial Transient Thermal Response of Building Walls. J. Therm. Envel. Build. Sci. 2001, 24, 275–300. [Google Scholar] [CrossRef]
  21. Ali, A.; Issa, A.; Elshaer, A. A Comprehensive Review and Recent Trends in Thermal Insulation Materials for Energy Conservation in Buildings. Sustainability 2024, 16, 8782. [Google Scholar] [CrossRef]
  22. Napoli, G.; Bottero, M.; Ciulla, G.; Dell’Anna, F.; Figueira, J.R.; Greco, S. Supporting Public Decision Process in Buildings Energy Retrofitting Operations: The Application of a Multiple Criteria Decision Aiding Model to a Case Study in Southern Italy. Sustain. Cities Soc. 2020, 60, 102214. [Google Scholar] [CrossRef]
  23. Wątróbski, J.; Jankowski, J.; Ziemba, P.; Karczmarczyk, A.; Zioło, M. Generalised Framework for Multi-Criteria Method Selection. Omega 2019, 86, 107–124. [Google Scholar] [CrossRef]
  24. Dell’Anna, F.; Bottero, M.; Becchio, C.; Corgnati, S.P.; Mondini, G. Designing a Decision Support System to Evaluate the Environmental and Extra-Economic Performances of a Nearly Zero-Energy Building. Smart Sustain. Built Environ. 2020, 9, 413–442. [Google Scholar] [CrossRef]
  25. Daniel, S.; Ghiaus, C. Multi-Criteria Decision Analysis for Energy Retrofit of Residential Buildings: Methodology and Feedback from Real Application. Energies 2023, 16, 902. [Google Scholar] [CrossRef]
  26. Taherdoost, H.; Madanchian, M. A Comprehensive Overview of the ELECTRE Method in Multi-Criteria Decision-Making. J. Manag. Sci. Eng. Res. 2023, 6, 5–16. [Google Scholar] [CrossRef]
  27. Salminen, P.; Hokkanen, J.; Lahdelma, R. Comparing Multicriteria Methods in the Context of Environmental Problems. Eur. J. Oper. Res. 1998, 104, 485–496. [Google Scholar] [CrossRef]
  28. Kokaraki, N.; Hopfe, C.J.; Robinson, E.; Nikolaidou, E. Testing the Reliability of Deterministic Multi-Criteria Decision-Making Methods Using Building Performance Simulation. Renew. Sustain. Energy Rev. 2019, 112, 991–1007. [Google Scholar] [CrossRef]
  29. Caillet, R. Analyse Multicritère: Étude de Comparaison Des Méthodes Existantes En Vue d’une Application En Analyse de Cycle de Vie. 1 August 2003. Available online: https://cirano.qc.ca/files/publications/2003s-53.pdf (accessed on 10 January 2025).
  30. Behzadian, M.; Kazemzadeh, R.B.; Albadvi, A.; Aghdasi, M. PROMETHEE: A Comprehensive Literature Review on Methodologies and Applications. Eur. J. Oper. Res. 2010, 200, 198–215. [Google Scholar] [CrossRef]
  31. Rey, E. Office Building Retrofitting Strategies: Multicriteria Approach of an Architectural and Technical Issue. Energy Build. 2004, 36, 367–372. [Google Scholar] [CrossRef]
  32. Roulet, C.-A.; Flourentzou, F.; Labben, H.H.; Santamouris, M.; Koronaki, I.; Dascalaki, E.; Richalet, V. ORME: A Multicriteria Rating Methodology for Buildings. Build. Environ. 2002, 37, 579–586. [Google Scholar] [CrossRef]
  33. Catalina, T.; Virgone, J.; Blanco, E. Multi-Source Energy Systems Analysis Using a Multi-Criteria Decision Aid Methodology. Renew. Energy 2011, 36, 2245–2252. [Google Scholar] [CrossRef]
  34. Almeida, M.; Bragança, L.; Silva, P.; Silva, S.; Mateus, R.; Barbosa, J.; Araújo, C. Selection of Rehabilitation Construction Solutions Using ELECTRE III Method. In Proceedings of the Reabilitação Energética de Edifícios, Guimaraes, Portugal, 28 September 2012. [Google Scholar]
  35. Centre de Developpement des Energies Renouvelables Réglementation Thermique Algérienne RETA. Available online: https://reta.cder.dz/ (accessed on 22 December 2024).
  36. Ministere de L’habitat Document Technique Réglementaire (DTR C3-2). Réglmentation Thermique Des Batiments D’habitation. Règles de Calcul Des Déperditions Calorifiques; Centre National d’Etudes et de Recherches Intégrées du Bâtiment: Souidania, Algeria, 1998.
  37. Ministere de L’habitat Document Technique Réglementaire (DTR C3-4). Climatisation. Règles de Calcul Des Apports Calorifiques Des Batiments; Centre National d’Etudes et de Recherches Intégrées du Bâtiment: Souidania, Algeria, 1998.
  38. Meteoblue. Available online: https://www.meteoblue.com/fr/meteo/aujourd%27hui/suisse_suisse_2658434 (accessed on 20 December 2024).
  39. EnergyPlus. Available online: https://energyplus.net/ (accessed on 29 January 2025).
  40. Université Laval, C. Logiciel d’aide Multicritère à la Décision MCDA-ULaval|Université Laval. Available online: https://mcda.fsa.ulaval.ca/fr/ (accessed on 29 January 2025).
  41. Kumar, D.; Alam, M.; Zou, P.X.W.; Sanjayan, J.G.; Memon, R.A. Comparative Analysis of Building Insulation Material Properties and Performance. Renew. Sustain. Energy Rev. 2020, 131, 110038. [Google Scholar] [CrossRef]
  42. Rathan, N.S.; Raut, A.; Rahul, B.G. Comparative Analysis of Various Insulation Materials for Building Envelope Components. IOP Conf. Ser. Earth Environ. Sci. 2021, 822, 012014. [Google Scholar] [CrossRef]
  43. Iqbal, A.; Mubin, S.; Gavrishyk, E.; Masood, R.; Roy, K.; Moradibistouni, M. A Comparative Performance Analysis of Different Insulation Materials Installed in a Residential Building of a Cold Region in Pakistan. J. Compos. Sci. 2022, 6, 165. [Google Scholar] [CrossRef]
  44. Lu, X.; Memari, A. Comparative Analysis of Energy Performance for Residential Wall Systems with Conventional and Innovative Insulation Materials: A Case Study. Open J. Civ. Eng. 2019, 9, 240–254. [Google Scholar] [CrossRef]
  45. ASTM C1639-19; Standard Specification for Fabrication of Cellular Glass Pipe and Tubing Insulation. ASTM International: West Conshohocken, PA, USA, 2019.
  46. ASTM C1696-20; Standard Guide for Industrial Thermal Insulation Systems. ASTM International: West Conshohocken, PA, USA, 2020.
  47. Rockwool. Product Application Guide; ROCKWOOL Limited: Mumbai, India. Available online: https://www.rockwool.com/group/products-and-applications/ (accessed on 5 February 2025).
  48. Figueira, J.R.; Greco, S.; Roy, B.; Słowiński, R. An Overview of ELECTRE Methods and Their Recent Extensions. J. Multi-Criteria Decis. Anal. 2013, 20, 61–85. [Google Scholar] [CrossRef]
  49. Figueira, J.; Roy, B. Determining the Weights of Criteria in the ELECTRE Type Methods with a Revised Simos’ Procedure. Eur. J. Oper. Res. 2002, 139, 317–326. [Google Scholar] [CrossRef]
  50. Roy, B.; Bouyssou, D. Aide Multicritère à La Décision: Méthodes et Cas; Economica: Paris, France, 1993. [Google Scholar]
  51. Stephan, E. Méthode d’aide à La Décision Multicritère Des Stratégies de Réhabilitation Des Bâtiments Anciens En Pierre Calcaire: Application Au Patrimoine En Tuffeau. Ph.D. Thesis, Université de Lyon, Lyon, France, 17 December 2014. [Google Scholar]
  52. Ouahab, A. Modélisation Des Consommations d’énergie et Des Émissions de CO2 à Long Terme Appliquée Au Secteur Résidentiel Algérien. Doctoral Theses, École Doctorale Sciences de L’homme et de la Société, Tours, France, 2015. [Google Scholar]
  53. Pompeo, C.; Gueret, C. Conductivité Thermique Des Matériaux-Fascicule 2/5; Centre Scientifique et Technique du Batiment CSTB: Paris, France, 2000. [Google Scholar]
  54. Imessad, K.; Kharchi, R.; Bouchaib, S.; Chenak, A.; Hakem, S.; Hamidat, A.; Larbi-youcef, S.; Sami, S.; Sahnoune, F. Mise En Application de La Nouvelle Réglementation Thermique Algérienne Du Bâtiment. J. Renew. Energ. 2017, 20, 591–597. [Google Scholar] [CrossRef]
  55. Belgherras, S.; Bekkouche, S.M.A.; Benouaz, T.; Benamrane, N. Prospective Analysis of the Energy Efficiency in a Farm Studio under Saharan Weather Conditions. Energy Build. 2017, 145, 342–353. [Google Scholar] [CrossRef]
  56. Lu, Z.; Wang, Y.; Li, J.; Fan, Q. Experimental Study on Seismic Performance of L-shaped Partly Precast Reinforced Concrete Shear Wall with Cast-in-situ Boundary Elements. Struct. Des. Tall Spec. Build. 2019, 28, e1602. [Google Scholar] [CrossRef]
  57. Vitorino, H.; Batalha, N.; Sousa, R.; Fernandes, P.; Varum, H.; Rodrigues, H. Assessment of Seismic Behavior of an RC Precast Building. In Proceedings of the International Conference on Automation Innovation in Construction (CIAC-2019), Leiria, Portugal, 7–8 November 2019. [Google Scholar] [CrossRef]
  58. Hallik, J.; Kalamees, T.; Pikas, E. (PDF) Airtightness of Estonian Dwellings—Median and Base-Values for Heat Loss Estimation. In Proceedings of the 13th Nordic Symposium on Building Physics, Aalborg, Denmark, 12 June 2023. [Google Scholar] [CrossRef]
  59. Understanding the Energy Label. Available online: https://energy-efficient-products.ec.europa.eu/ecodesign-and-energy-label/understanding-energy-label_en (accessed on 22 March 2025).
  60. Rehman, H.U. Experimental Performance Evaluation of Solid Concrete and Dry Insulation Materials for Passive Buildings in Hot and Humid Climatic Conditions. Appl. Energy 2017, 185 Pt 2, 1585–1594. [Google Scholar] [CrossRef]
  61. Bendouma, M. Systèmes D’isolation Thermique Par L’extérieur: Études Expérimentales et Numériques des Transferts de Chaleur et D’humidité. Ph.D. Thesis, Université de Bretagne Sud, Lorient, France, 2018. [Google Scholar]
  62. Wu, S.; Zhou, P.; Xiong, Y.; Ma, C.; Wu, D.; Lu, W. Strategies for Driving the Future of Educational Building Design in Terms of Indoor Thermal Environments: A Comprehensive Review of Methods and Optimization. Buildings 2025, 15, 816. [Google Scholar] [CrossRef]
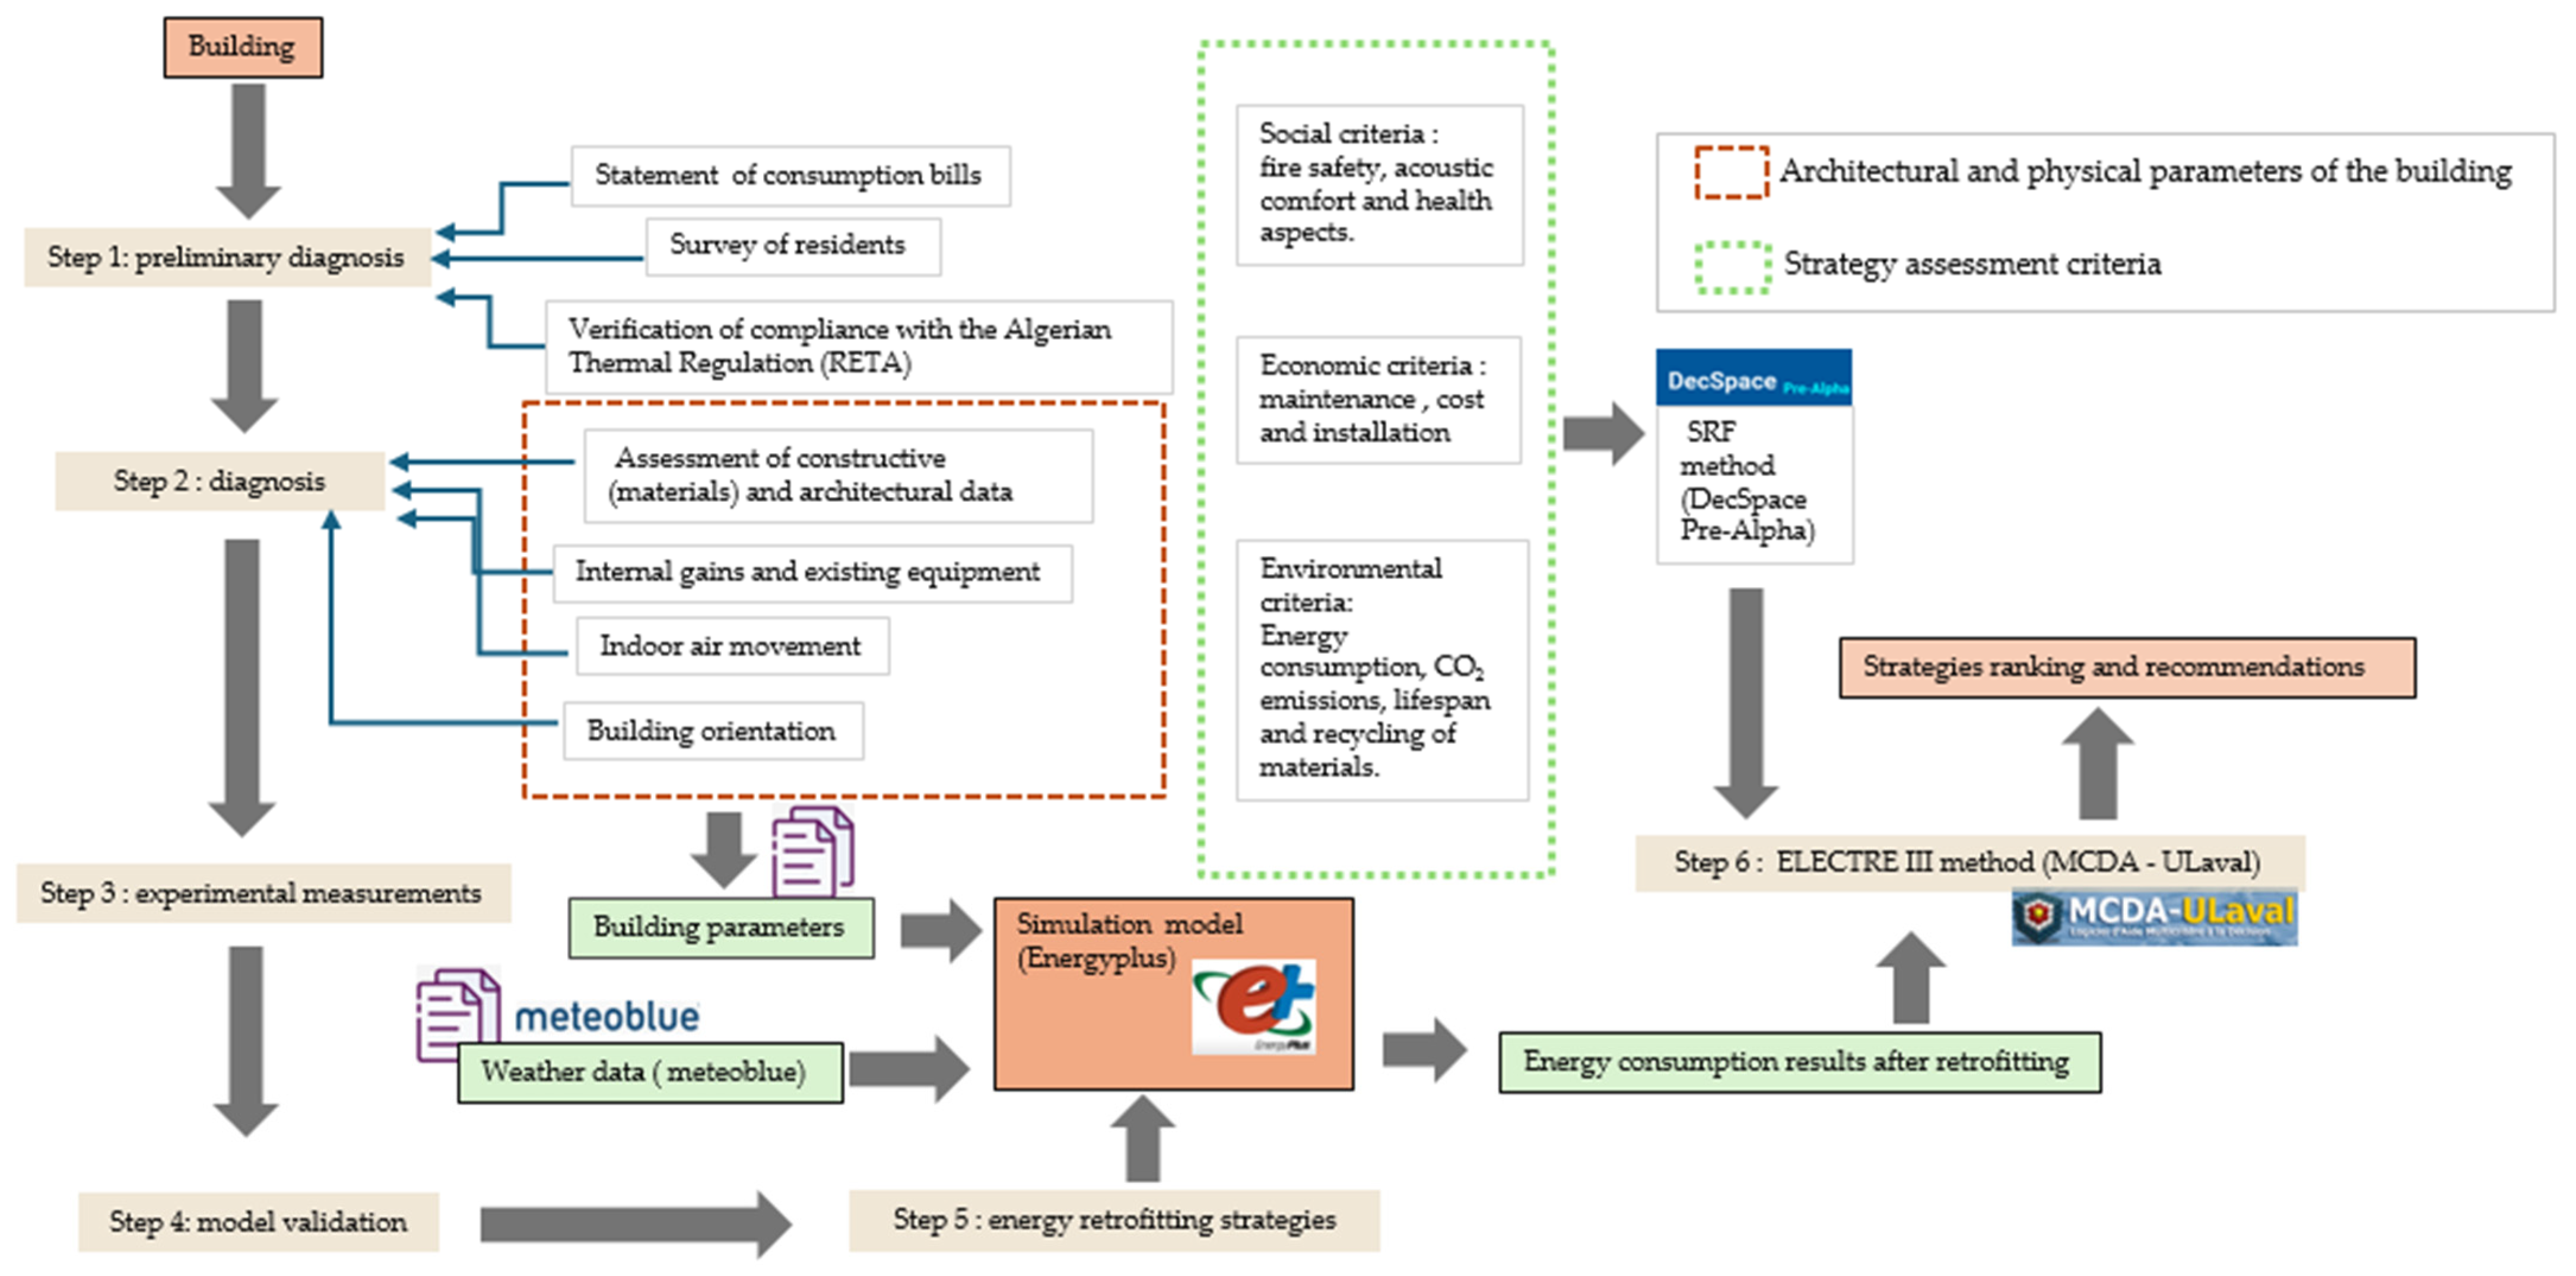
Figure 1. Methodology Framework.
Sustainability 17 04273 g001
Figure 2. Measuring instruments used.
Sustainability 17 04273 g002
Figure 3. Representation of the SRF and ELECTRE III methods.
Sustainability 17 04273 g003
Figure 4. (a) Graph of average climatic data for Tlemcen from Meteoblue; (b) Algerian climatic zones from regulatory technical documents.
Sustainability 17 04273 g004
Figure 5. (a) Photo of the building’s west facade; (b) photo of the building’s main entrance.
Sustainability 17 04273 g005
Figure 6. (a) Apartment’s floor plan; (b) Building’s floor plan.
Sustainability 17 04273 g006
Figure 7. Comfort and discomfort rates based on occupant survey.
Sustainability 17 04273 g007
Figure 8. Comparison between measurements and simulations for indoor temperature (13 January 2018).
Sustainability 17 04273 g008
Figure 9. Comparison between measurements and simulations for indoor temperature (23 July 2019).
Sustainability 17 04273 g009
Figure 10. Energy consumption before retrofitting on the ground floor and top floor with different infiltration rates.
Sustainability 17 04273 g010
Figure 11. Representation of the three types of insulation used: (a) internal insulation; (b) external wall insulation with render; and (c) external wall insulation with cladding.
Sustainability 17 04273 g011
Figure 12. Reduction in final energy consumption of top-floor apartment for three types of insulation.
Sustainability 17 04273 g012
Figure 13. Annual energy consumption results for different retrofit strategies.
Sustainability 17 04273 g013
Figure 14. Indoor temperature variation before and after retrofit with different insulation positions (winter, 21 January).
Sustainability 17 04273 g014
Figure 15. Indoor temperature variation before and after retrofit with different insulation positions (summer, 6 August).
Sustainability 17 04273 g015
Figure 16. Radar diagram of strategies from the inside.
Sustainability 17 04273 g016
Figure 17. Radar diagram of rendered exterior strategies.
Sustainability 17 04273 g017
Figure 18. Radar diagram of exterior cladding strategies.
Sustainability 17 04273 g018
Figure 19. (a) Final ranking for α = 0.3; (b) Ascending and descending distillation for internal insulation.
Sustainability 17 04273 g019
Figure 20. Final ranking for α = 0.9 for internal insulation.
Sustainability 17 04273 g020
Figure 21. (a) Final ranking for α = 0.3; (b) ascending and descending distillation for insulation with render.
Sustainability 17 04273 g021
Figure 22. Final ranking for α = 0.9 for insulation with render.
Sustainability 17 04273 g022
Figure 23. (a) Final ranking for α = 0.3; (b) ascending and descending distillation for insulation with cladding.
Sustainability 17 04273 g023
Figure 24. (a) Final ranking for α = 0.6; (b) ascending and descending distillation for insulation with cladding.
Sustainability 17 04273 g024
Table 1. Building’s materials.
ElementsOutside to Inside LayersCompositionThickness (m) Thermal Conductivity λ (W·m−1·K−1) Density ρ (Kg/m3)Specific Heat Capacity Cp (J·Kg−1·K−1)
North exterior wall (load-bearing) 1Cement mortar0.021.1518001080
2Concrete0.152.525001000
3Plaster0.020.5713001000
Exterior wall
(East/West)
1Cement mortar0.021.1518001080
2Hollow brick0.10.48900936
3Air gap0.050.0251.231008
4Hollow brick0.050.48900936
5Plaster0.020.5713001000
Interior wall
(load-bearing)
1Plaster0.020.5713001000
2Concrete0.152.525001000
3Plaster0.020.5713001000
Interior wall1Cement mortar0.021.1518001080
2Hollow brick0.100.48900936
3Cement mortar0.021.1518001080
Ground and upper floors1Concrete0.102.525001000
2Concrete screed0.051.1518001080
3Tiles0.032.12200336
Roof1Water-tightness0.020.04670200
2Concrete screed0.071.1518001080
3Concrete0.12.525001000
4Cement mortar0.021.1518001080
Table 2. Equipment layout and power.
SpacesEquipmentDesign Level
(W)
Lighting Level
(W)
Living roomTelevision14040
Iron925
Vacuum cleaner720
Laptop60
BedroomsHairdryer45030
Laptops60
KitchenRefrigerator17520
Stove with oven1500
Robots150
BathroomWashing machine50020
Table 3. Relative deviations between measurements and simulation.
HoursDay of 13 JanuaryDay of 23 July
Measures
(°C)
Simulation
(°C)
Relative DeviationMeasures
(°C)
Simulation
(°C)
Relative Deviation
111.9211.830.00726.9927.380.014
211.9911.870.00926.9226.620.011
312.1711.660.04126.8026.260.020
412.1111.440.05426.7425.960.028
512.0511.250.06526.6125.790.030
611.9911.100.07326.4925.620.032
711.9210.980.07826.6127.550.035
811.9911.000.08126.4927.900.053
912.1710.890.10426.9628.170.044
1012.3611.170.09627.1528.490.049
1113.0111.680.10127.9928.900.032
1213.8612.350.10828.3529.470.039
1314.4213.260.08028.7530.070.045
1414.6114.260.02329.4530.680.041
1514.5515.100.03829.6731.260.053
1614.6715.800.07729.5331.770.075
1714.9916.080.07529.8232.170.078
1814.7415.970.08329.9932.320.077
1914.5515.640.07529.9932.210.074
2014.7415.400.04529.5631.780.075
2114.7415.250.03529.2031.360.073
2214.6115.410.05428.9729.420.015
2314.4914.800.02128.3528.830.016
2414.4214.420.00028.2527.830.014
114.3614.160.01328.1527.330.028
Table 4. Retrofit strategies for internal insulation.
Type of InsulationStrategyCompositionThickness (m)Thermal Conductivity λ (W·m−1·K−1)Density
ρ (Kg/m3)
Specific Heat Capacity Cp (J·Kg−1·K−1)
Internal insulation S1Rock wool0.20.04126612
S2Cork panels0.20.0401201670
S3Expanded polystyrene (EPS)0.150.038301404
S4Polyurethane (PU)0.150.029251300
S5Cellular glass0.230.0451201100
S1, S2, S3, S4, S5Plasterboard0.0130.359001460
Table 5. Retrofit strategies for external wall insulation with render.
Type of InsulationStrategyCompositionThickness (m)Thermal Conductivity λ (W·m−1·K−1)Density
ρ (Kg/m3)
Specific Heat Capacity Cp (J·Kg−1·K−1)
External wall insulation with renderS6Rock wool0.20.04126612
S7Cork panels0.20.0401201670
S8Expanded polystyrene (EPS)0.150.038301404
S9Polyurethane (PU)0.150.029251300
S10Phenolic foam0.110.022301300
RenderS7Organic base coat0.0070.8718001080
Organic finishing render0.0060.8718001080
S6, S8, S9, S10Mineral base coat 0.0070.5714001080
Mineral finishing render0.0060.7617001080
Table 6. Retrofit strategies for external wall insulation with cladding.
Type of InsulationStrategyCompositionThickness (m)Thermal Conductivity λ (W·m−1·K−1)Density
ρ (Kg/m3)
Specific Heat Capacity Cp (J·Kg−1·K−1)
External wall insulation with claddingS11Rock wool0.20.04126612
S12Cork panels0.20.0401201670
S13Expanded polystyrene (EPS)0.150.038301404
S14Polyurethane (PU)0.150.029251300
S15Glass wool0.150.0440800
S16Cellular glass0.230.0451201100
CladdingS11, S12Scots pine wood0.0220.154502160
S13, S15Polyvinyl chloride0.0150.1713801046
S14, S16Fiber cement0.0120.5818001500
Table 7. Materials used across all retrofit strategies.
Type of InsulationStrategyCompositionThickness (m)Thermal Conductivity λ (W·m−1·K−1)Density
ρ (Kg/m3)
Specific Heat Capacity Cp (J·Kg−1·K−1)
Ground floor and upper floor Polystyrene (EPS)0.150.038301404
For allConcrete0.102.525001000
strategiesConcrete screed0.051.1518001080
Tiles0.032.12200336
Roof Water-tightness0.020.04670200
Airium®0.10.051801001
For allConcrete0.12.525001000
strategiesRock wool0.20.04126612
Plasterboard0.0130.359001460
Table 8. Performances of the strategies and thresholds for internal insulation.
StrategiesCriteria
C1C2C3C4C5C6C7
Rock wool (S1)4332,526,154.00617,134.00786
Cork panels (S2)−2782,512,601.00883,748.00478
Expanded polystyrene (EPS) (S3)1022,548,504.00638,794.00432
Polyurethane (PU) (S4)1632,519,706.00703,781.00352
Cellular glass (S5)2562,511,489.00812,089.00855
Normalized weight z = 6.54.824.8231.3326.02018.0710.124.82
Indifference threshold6.920.674046.1230,628.100.580.520.7
Preference threshold18.451.7910,789.6781,674.941.551.391.87
Veto threshold34.63.3620,230.64153,140.532.92.623.5
ObjectiveMINMAXMINMINMAXMAXMAX
Table 9. Performances of the strategies and thresholds for insulation with render.
StrategiesCriteria
C1C2C3C4C5C6C7
Rock wool (S6)4332,397,499.00717,736.00786
Cork panels (S7)−2782,323,415.00934,377.00478
Expanded polystyrene (EPS) (S8)1022,412,908.00739,423.00432
Polyurethane (PU) (S9)1632,395,679.00804,410.00352
Phenolic foam (S10)8512,397,955.00804,277.00636
Normalized weight z = 6.54.824.8231.3326.0218.0710.124.82
Indifference threshold3.720.243164.957553.400.140.200.24
Preference threshold11.170.729494.8522,660.220.440.610.72
Veto threshold33. 512.1728,484.5667,980.661.321.832.16
ObjectiveMINMAXMINMINMAXMAXMAX
Table 10. Performances of the strategies and thresholds for insulation with cladding.
Strategies Criteria
C1C2C3C3′C4C5C6C8
Rock wool + wood (S11)63302,364,784.0031,452,781.00686
Cork panels + wood (S12)−7302,429,512.0041,698,986.00366
Expanded polystyrene (EPS) + PVC (S13)35402,365,168.0051,184,716.00248
Polyurethane (PU) + fiber cement (S14)36502,361,545.0071,356,139.00564
Glass wool + PVC (S15)68402,360,687.0041,139,540.00766
Cellular glass + fiber cement (S16)45502,361,207.0081,464,424.00862
Normalized weight z = 8.67312.2126.0312.2121.4314.537.593
Indifference threshold3.252.649173.750.6568,846.060.780.420.69
Preference threshold10.858.8030,579.172.16229,486.882.591.412.30
Veto threshold27.7117.6161,158.354.33458,973.755.182.834.62
ObjectiveMINMAXMINMAXMINMAXMAXMAX
Disclaimer/Publisher’s Note: The statements, opinions and data contained in all publications are solely those of the individual author(s) and contributor(s) and not of MDPI and/or the editor(s). MDPI and/or the editor(s) disclaim responsibility for any injury to people or property resulting from any ideas, methods, instructions or products referred to in the content.