1. Introduction
Sustainable supply chain management (SSCM) has become an important research direction in the field of supply chains in recent years. A sustainable supply chain refers to the integration of the concept of sustainable development into the traditional supply chain. It aims to integrate the economic, environmental, and social dimensions to ensure the robust operation and development of the supply chain in the long term [
1]. Compared with traditional supply chain management, sustainable supply chain management has achieved a shift from a closed to an open system, placing greater emphasis on reducing negative impacts on the external environment and strengthening ecological and environmental protection. Shekarian et al. conducted a comprehensive systematic review of industrial practices and found that when implementing sustainable supply chain management, companies need to focus on technological innovation and stakeholder engagement [
2]. Although research on sustainable supply chain management started relatively late, it has developed rapidly in recent years with a continuous emergence of research findings. However, there are still some issues in the current research on sustainable supply chain management. In terms of theory, the relevant concepts are not yet clearly defined, and some studies only focus on a single aspect, lacking an overall and macro perspective. Some scholars confine sustainable supply chain management to the corporate product production process or only focus on the logistics link of the product [
3]. Few studies have paid attention to the impact of decision-making biases of key members in the supply chain on sustainable supply chains.
Overconfidence is a common cognitive bias in human decision-making. Many psychologists and economists have conducted experiments related to overconfidence, and a large body of empirical research has confirmed that individuals who are not fully rational tend to exhibit overconfidence [
4,
5,
6]. Overconfidence is one of the significant psychological factors influencing economic behavior and is a key focus of this study in examining the factors causing decision biases among retailers. However, current research on overconfidence behavior is mostly concentrated in the field of behavioral finance, primarily considering the impact of managerial or decision-maker overconfidence on corporate management and financial decisions. In the supply chain field, managers are also prone to overconfidence bias. Retailers, as the entities closest to market consumers in the supply chain, can directly observe changes in consumer demand. When retailers exhibit overconfidence, they may incorrectly estimate market demand and send orders to upstream suppliers based on inaccurate demand forecasts, resulting in order quantity deviations. The demand forecast biases caused by overconfidence are transmitted and amplified step by step upstream, ultimately leading to manufacturers and wholesalers in the upstream supply chain making incorrect production and ordering decisions due to the amplified demand fluctuations, resulting in inventory accumulation.
The bullwhip effect is the phenomenon where demand fluctuations are amplified as they move up the supply chain [
7]. A sustainable supply chain is an integrated system composed of upstream and downstream enterprises. The bullwhip effect on product orders is primarily analyzed from the perspective of upstream enterprises, whereas the bullwhip effect on inventory levels directly measures the magnitude of inventory fluctuations in downstream enterprises due to demand changes. For the entire sustainable supply chain, the bullwhip effect leads to overproduction and excess inventory, increasing the consumption of raw materials, energy use, and waste emissions. In recent years, with the rise of sustainable supply chain management (SSCM), scholars have begun to focus on the negative impact of the bullwhip effect on environmental, economic, and social sustainability and explore mitigation strategies. As a result, the bullwhip effect has attracted widespread attention from both the business community and academia, leading to in-depth research and discussion on its causes and mitigation methods.
Analyzing the impact of retailers’ overconfidence on the bullwhip effect is of great significance in promoting the practice of sustainable supply chain concepts. In terms of environmental sustainability, reducing demand distortion caused by overconfidence can mitigate the bullwhip effect in sustainable supply chains. This, in turn, reduces inventory overstocking and overproduction and decreases transportation frequency and volume, and so on. As a result, it can lower energy consumption and waste emissions, improve the environmental performance of the supply chain, and help companies achieve their sustainable development goals. From the perspective of economic sustainability, overconfidence may trigger a crisis of trust among supply chain members and increase coordination costs, thereby inhibiting long-term cooperation. By mitigating the bullwhip effect, the overall efficiency and economic resilience of the supply chain can be enhanced. From the perspective of social sustainability, stable supply chain operations help safeguard labor rights (such as reducing the misuse of temporary workers due to order fluctuations) and ensure fair allocation of community resources. It also helps to increase the transparency and traceability of the supply chain, strengthen the supervision and management of companies at various stages of the supply chain, and encourage businesses to better fulfill their social responsibilities.
In the existing research on sustainable supply chains, some scholars have considered the impact of the overconfidence of supply chain participants on decision-making and their own profits, but no research has analyzed its impact on the bullwhip effect. For example, Ji et al. [
8] constructed game-theoretic models considering the overconfidence of suppliers and retailers, respectively. They considered the overconfidence of suppliers in overestimating the impact of their emission reduction efforts on product demand and the overconfidence of retailers in underestimating the variability of random demand. They analyzed the impact on joint decisions regarding carbon emission reduction and inventory replenishment, as well as the impact on their own profits. Yu and Sun [
9] constructed a supply chain model including manufacturers and retailers and used a Stackelberg game model to explore the role of carbon trading pricing and overconfidence in the decision-making and profits of supply chain members. They found that overconfidence is always detrimental to manufacturers, especially when carbon trading prices rise. In the research on sustainable supply chains, the study of the impact of retailers’ overconfidence on the bullwhip effect is not yet in-depth and sufficient. Therefore, this study starts from this perspective and focuses on the impact of retailers’ overconfidence on the bullwhip effect in sustainable supply chains.
This paper approaches the issue from the perspective of retailers’ decision-making, characterizing retailer overconfidence from two aspects: overprecision and overestimation. It examines the influence of this decision-making bias on retailers’ market demand forecasts and its subsequent impact on the bullwhip effect of sustainable supply chain, thereby enriching the application of overconfidence theory and complementing research on the bullwhip effect and sustainable supply chain. This paper measures both the bullwhip effect on product orders and inventory simultaneously and further analyzed the influencing factors. The findings of this study offer valuable insights for retailers to avoid the adverse effects of overconfidence in the ordering process and to make more accurate demand and inventory predictions. Additionally, from a broader sustainable supply chain perspective, the study comprehensively analyzes the impact of retailer overconfidence on both types of bullwhip effects from the upstream and downstream perspectives, making the conclusions more widely applicable and providing a reference for supply chain managers in both research and practice.
2. Literature Review
The traditional economic theory system is based on the assumption of “economic man”, which holds that individual behavior is driven by self-interest and can make fully rational decisions. However, decision-making behavior in reality often deviates from this assumption. Psychological research has revealed that there are widespread cognitive biases in the decision-making process of individuals. In recent years, scholars have begun to explore the impact mechanism of incomplete rational cognitive biases on economic behavior from the perspective of behavioral economics. The concept of “overconfidence” originates from research findings in the field of cognitive psychology. Numerous cognitive psychology studies have pointed out that humans generally have a tendency to be overconfident, especially in overestimating the accuracy of their own knowledge. Wolosin et al. [
10] found that people tend to overestimate their abilities and contributions to their work, often attributing their success to their skills and capabilities. Mahajon [
11] argued that overconfidence refers to the behavior of individuals who overestimate the probability of certain events during decision-making. After these events occur, individuals believe their previous estimates were correct, thus reinforcing this psychological factor. Moore et al. [
12] reviewed over 350 articles on overconfidence and confirmed its influence on decision-making. Their research found that decision-makers may exhibit overconfident irrational behavior across various fields and environments, and they identified three main manifestations of overconfidence behavior: overestimation, overplacement, and overprecision. Overestimation typically refers to the overestimation of one’s own abilities to handle tasks, believing that one’s skills are superior to others in managing situations. Overplacement refers to the belief that one’s position or platform is higher than others, i.e., above the average level. Overprecision involves making more accurate predictions based on one’s perceived understanding of the actual situation.
Traditional perspectives often attribute the widespread inefficiencies in supply chains (such as the bullwhip effect) to information asymmetry, but traditional theoretical frameworks have limitations in explaining the bullwhip effect. Against this backdrop, scholars have begun to focus on the impact of decision-makers’ irrational behavior on supply chain fluctuations. Lu et al. [
13] explored the impact of information errors in inter-channel information sharing on decision-making and supply chain operational efficiency in omnichannel operations. Pournader et al. [
14] explored the impact of risk preferences on decision biases and the bullwhip effect in multi-stage supply chains from a risk preference perspective. Pillai and Min [
15] introduced the concept of knowledge calibration into supply chain management, emphasizing the role of matching confidence with the accuracy of knowledge in decision-making. If confidence and accuracy do not match (such as overestimating or underestimating the value of knowledge), it may lead to supply chain inefficiencies (such as the bullwhip effect).
Among supply chain entities, downstream retailers may exhibit overconfidence due to incomplete information or insufficient self-awareness, which can lead to decision errors and trigger the bullwhip effect. However, existing research mainly explores the impact of retailers’ overconfidence on supply chains from the perspective of supply chain coordination and decision-making. Studies on the impact of retailers’ overconfidence on the bullwhip effect in supply chains are still relatively rare. Wang et al. [
16] discussed the efficiency of supply chain contracts in coordinating the supply chain with overprecision-type retailers. Ren and Croson [
17] assumed that retailers over-precisely interpret demand information and analyzed their ordering decisions from the supply chain decision-making perspective while correcting overconfidence through pricing strategies, repurchase contracts, and other methods to stimulate optimal decision-making behavior. Xu et al. [
18] investigated the optimization of pricing and overconfidence issues in a duopoly supply chain, analyzing the impact of retailer overconfidence on supply chain performance, with the results highlighting that overconfidence does not necessarily harm supply chain performance.
With the expansion and deepening of supply chain research, scholars have gradually introduced the concept of overconfidence into the study of supply chains to analyze the bullwhip effect. Ancarani et al. [
19] found through the beer game research that overconfidence can lead to biases in supply chain ordering decisions, triggering the bullwhip effect. In experimental settings, even experts familiar with supply chain management may have their decisions affected by overconfidence. Shee and Kaswi [
20] discovered through surveys of local and multinational supermarket managers in India that these managers are overly confident in their decisions, which leads to increased order variability and the bullwhip effect. Yang et al. [
21] demonstrated that behavioral and psychological factors play a critical role in generating the bullwhip effect. Their research on overconfidence shows that it is an important behavioral factor affecting supply chain decisions and may lead to the bullwhip effect.
However, in the research literature on sustainable supply chain management, there is limited research on the bullwhip effect in sustainable supply chains. The existing research literature mainly focuses on the green collaboration across the entire supply chain, including green procurement, low-carbon logistics, and supplier social responsibility management [
22]. Metwally et al. [
23] empirically demonstrated based on the Egyptian manufacturing industry that digital technology indirectly improves the environmental performance of sustainable supply chains by enhancing supply chain resilience and robustness. Li et al. [
24] focused on the joint impact of lead time uncertainty (LTU) and carbon cost on the bullwhip effect in sustainable supply chains. Shaban et al. [
25] explored how to reduce the bullwhip effect while maintaining service levels under demand-related scenarios to enhance supply chain sustainability. Some studies have also focused on the impact of irrational behaviors, such as overconfidence, on supply chain performance and stability, indirectly affecting the bullwhip effect.
Although existing studies have focused on the impact of overconfidence of supply chain members on the decision-making and profits of sustainable supply chains [
8,
9], the role of overconfidence in the bullwhip effect in sustainable supply chains has not yet been fully explored. Moreover, the bullwhip effect has only been studied as a reference factor for measuring the efficiency of sustainable supply chain systems, and no systematic research has been found on the impact of retailers’ overconfidence on the bullwhip effect on product orders and inventory. Therefore, this paper analyzes the impact of retailers’ overconfidence on the bullwhip effect on product orders and inventory in sustainable supply chains from the perspective of retailers’ overconfidence. It not only supplements the research on the bullwhip effect from the behavioral operations aspect but also further extends the application research of overconfidence theory in the field of sustainable supply chains.
3. Model Establishment
3.1. Demand Model
For the demand process, the ARMA model has been widely applied, especially the special form of the ARMA model, the AR(1) model. Lee et al. [
18] were the first to systematically analyze the bullwhip effect in the supply chain and its countermeasures using the AR(1) demand model. The AR(1) model is widely used in time-series analysis, and it is suitable for market environments where demand is stable, has strong short-term correlation, and is subject to minimal random disturbances. This paper constructs a single-stage supply chain system with a single retailer based on the widely used first-order autoregressive AR(1) model. Within this single-stage model, a demand function is established to examine how the retailer’s overconfidence influences the bullwhip effect on product orders and inventory in the supply chain.
First, assume that consumer demand
Dt follows the AR(1) demand model proposed by Lee et al. [
26]:
where
ensures the stationarity of the model;
is an i.i.d. (independent and identically distributed) random variable that captures demand shocks across different periods and follows a normal distribution,
;
represents the market demand of consumers in period
t. The parameter
denotes the market demand level of the product, with
μ > 0. The expected value and variance of
are given by
and
.
Due to the presence of overconfidence, a retailer exhibiting overprecision bias perceives the future demand error
as an i.i.d. random variable following
, where
is a coefficient representing the retailer’s overprecision level, and
. Meanwhile, due to the retailer’s overestimation bias, the predicted demand over the lead time
L, denoted as
, is perceived as
, where
is a coefficient representing the retailer’s overestimation level, and
. The variables and their corresponding definitions are presented in
Table 1.
3.2. Ordering Process
Considering a single-stage supply chain scenario with only one retailer, the retailer’s ordering process operates under a fixed base-stock policy, where the retailer reviews its inventory and ordering status based on the target inventory level. To simplify the model, we assume that the retailer replenishes inventory by ordering from an external supplier with an ample supply. The replenishment lead time is a constant L. If the system has sufficient inventory, customer demand is met immediately; otherwise, unmet demand is fully backlogged. The specific sequence of events in the ordering process is as follows:
We adopt the following schedule during the replenishment period. At the beginning of period t, the retailer receives the product in the previous period. Then, based on the market demand in period t − 1, the retailer forecasts the market demand over the lead time L. Using this demand forecast, the retailer calculates the target inventory level for period t. Then, the retailer places an order of quantity at the beginning of period t. After the lead time L, the retailer receives the replenishment at the beginning of period t + L. Throughout the ordering process, due to the retailer’s overconfidence, biases in demand forecasting arise in the form of overestimation and overprecision. These biases affect the ordering quantity , which may further influence the bullwhip effect on product orders and inventory in the entire ordering process.
3.3. Order-Up-To Inventory Policy
In the existing research, a substantial body of literature has employed the classical order-up-to inventory policy. Chen et al. [
27,
28] investigated the bullwhip effect using the order-up-to inventory policy. This strategy estimates the target inventory of the supply chain based on the forecasted demand over the lead time and determines the order quantity for each period accordingly. Particularly, when demand follows a normal distribution, prior studies have demonstrated that the order-up-to policy is optimal [
29,
30]. Therefore, this study also adopts the order-up-to inventory policy, assuming that the retailer follows this strategy. The retailer estimates the supply chain’s target inventory
based on the forecasted demand
over the lead time and places an order
accordingly.
To simplify the calculations, following the assumption of target inventory proposed by Aviv [
31,
32,
33], the target inventory
can be assumed as follows:
where
represents the retailer’s forecast of consumer demand over the lead time L, and
denotes the fixed safety stock level set at the end of the lead time
L. The use of a fixed safety stock
is justified by the fact that the level of demand uncertainty over the lead time remains constant across time periods [
34].
The retailer conducts periodic inventory reviews. To maintain the inventory level at
, the retailer needs to place an order quantity
at the beginning of period
t. The order quantity
can be expressed as the difference between the retailer’s target inventory level in period t and the actual inventory level at the end of period
t − 1, i.e., that
This expression has been widely used in the field of statistics to represent ordering policies [
27,
28,
35,
36] and has been proven to be equivalent to other forms of ordering policies [
37]. Therefore, this study also adopts this expression to characterize the ordering policy. In this context, it is assumed that the retailer’s order quantity
can take negative values, meaning that excess inventory can be returned to the manufacturer at no cost [
27,
28,
29,
35]. The assumption that order quantity can be negative has been demonstrated to have minimal impact on the final results of bullwhip effect calculations [
38].
Substituting Equation (2) into Equation (3), the order quantity
can be expressed as follows:
3.4. MMSE Forecasting Techniques
To calculate the retailer’s order quantity and inventory level at the beginning of period t, the retailer needs to apply forecasting techniques to estimate the lead-time demand
. Traditional literature commonly employs forecasting techniques such as Moving Average (MA), Exponential Smoothing (ES), and Minimum Mean Square Error (MMSE) methods. The MMSE method minimizes the mean squared error of the forecast and is generally considered the optimal forecasting technique [
31]. Therefore, this study adopts the MMSE forecasting technique to estimate the market demand forecast in period t.
Before conducting demand forecasting, the retailer needs to understand the actual consumer demand over the lead time L. This can be achieved by expressing
as a function of
through a recursive formulation,
The actual demand over the lead time L is given by
where
I = 0, 1, 2,…,
.
When retailers have overconfidence, incorporating the coefficients that describe overconfidence into the model may influence the retailer’s forecast of future demand. The demand forecast over the lead time L, denoted as
, can be expressed as follows:
represents the conditional expectation function expressed in terms of the observed demand . In practice, an overconfident retailer forecasts future demand based on current and past information. However, due to the presence of the overestimation coefficient and the overprecision coefficient , the forecasting results may be biased.
4. The Influence of Retailers’ Overconfidence on the Bullwhip Effect on Product Orders
4.1. The Bullwhip Effect on Product Orders Caused by Retailers’ Overconfidence
Using (4), the order quantity placed by the overconfident retailer at the beginning of period
t is given by
According to expression (7), the demand forecast over the next
L periods from period
t−1 is given by
Substituting (7) and (9) into (8), we obtain
In this paper, the bullwhip effect on product orders is defined as the ratio of the variance of orders to the variance of demand [
31]. Therefore, the bullwhip effect on product orders for an overconfident retailer can be expressed as
If , the bullwhip effect in order quantity exists, meaning that order fluctuations are amplified.
Theorem 1. In a sustainable supply chain with an overconfident retailer, the bullwhip effect on product orders is given by 4.2. Influencing Factors of the Bullwhip Effect on Product Orders Caused by Retailers’ Overconfidence
To further identify the factors influencing the bullwhip effect on product orders, this section analyzes each factor individually to determine whether the retailer’s overconfidence coefficient affects the bullwhip effect on product orders and, if so, how it exerts such an impact.
From Theorem 1, it can be observed that the bullwhip effect on product orders of an overconfident retailer is independent of the market demand scale and the overprecision coefficient , but it is significantly influenced by the overestimation coefficient and the demand autocorrelation coefficient .
Proposition 1. The relationship between the bullwhip effect on product orders of overconfident retailers and various parameters is as follows: The bullwhip effect on product orders significantly increases as the retailer’s overestimation coefficient and the lead time L increases. This indicates that the retailer’s overestimation behavior exacerbates the bullwhip effect on product orders, and reducing the degree of overestimation can mitigate the bullwhip effect. It also indicates that an increase in lead time L directly exacerbates the bullwhip effect. This occurs because a longer lead time increases the uncertainty in demand forecasting and accumulates forecasting errors, thereby amplifying demand fluctuations. As , , and the derivative approaches zero, indicating that the growth rate of the bullwhip effect slows down and converges to a maximum value. Therefore, to mitigate the bullwhip effect, retailers should consider shortening the lead time to reduce demand forecasting uncertainty and error accumulation.
Proposition 2. The impact of the demand autocorrelation coefficient ρ on the bullwhip effect is not monotonic; instead, it first increases and then decreases, reaching a maximum at a critical point .
If supply chain managers aim to minimize the bullwhip effect on product orders, they should avoid approaching the critical value . By optimizing demand autocorrelation, the bullwhip effect on product orders can be effectively mitigated.
A comprehensive analysis of the effects of on the bullwhip effect on product orders reveals the following:
The retailer’s overestimation level and lead time L are positively correlated with .
The impact of the demand autocorrelation coefficient on the bullwhip effect on product orders is not monotonic. Instead, it first intensifies and then weakens, reaching a maximum at a critical point .
When is smaller than the critical value , increasing exacerbates the bullwhip effect; when exceeds the critical value, increasing alleviates the bullwhip effect.
Therefore, supply chain managers can effectively mitigate the bullwhip effect on product orders by reducing the retailer’s overestimation level, shortening the order lead time, and optimizing demand autocorrelation.
5. The Influence of Retailers’ Overconfidence on the Bullwhip Effect on Inventory
5.1. Inventory Level Analysis
At the beginning of period t, the retailer observes the market demand from the previous period and places an order to the upstream based on the existing inventory and target inventory. After a lead time of L, at the beginning of period t + L, the retailer receives the ordered product, resulting in the net inventory level for period t.
Lemma 1. The net inventory of an overconfident retailer can be expressed as the forecasting error of lead-time demand made in period t − L:
Lemma 2. The variance of the net inventory for an overconfident retailer is given by 5.2. The Bullwhip Effect on Inventory Caused by Retailers’ Overconfidence
To further explore the impact of overconfidence on the bullwhip effect on inventory, this paper defines the bullwhip effect on inventory as the ratio of inventory variance to demand variance [
39]. We use
, which represents the bullwhip effect on inventory, indicating the degree of distortion in sales information within the supply chain. If
, the bullwhip effect on inventory exists, meaning that fluctuations in sales are amplified. The expression for the bullwhip effect on inventory of an overconfident retailer can be derived as
Theorem 2. In a sustainable supply chain with an overconfident retailer, the bullwhip effect on inventory is given by 5.3. Influencing Factors of the Bullwhip Effect on Inventory Caused by Retailers’ Overconfidence
To further identify the factors influencing the bullwhip effect on inventory, this section analyzes each factor individually to determine whether the retailer’s overconfidence coefficients affect the bullwhip effect on inventory, and if so, how they exert such an impact.
From Theorem 2, it can be observed that the bullwhip effect on inventory of an overconfident retailer is independent of the market demand scale but is influenced by the overprecision coefficient , the overestimation coefficient , and the demand autocorrelation coefficient .
Proposition 3. The relationship between the bullwhip effect on inventory of overconfident retailers and various parameters is as follows: This Proposition shows that the overestimation coefficient is positively correlated with the bullwhip effect on inventory, meaning that as increases, also increases. The overprecision coefficient has a negative effect on the bullwhip effect on inventory, meaning that as increases (i.e., as the retailer’s overprecision level strengthens), the bullwhip effect on inventory decreases. The bullwhip effect on inventory significantly increases as the retailer’s lead time L increases. This occurs because a longer lead time exacerbates demand forecasting uncertainty and accumulates forecasting errors, amplifying demand fluctuations. As , the bullwhip effect on inventory stabilizes at a maximum value. In general, an increase in the demand autocorrelation coefficient exacerbates the bullwhip effect on inventory.
This result indicates that the retailer’s overestimation level significantly exacerbates the bullwhip effect on inventory. By controlling the degree of retailer overestimation, the bullwhip effect on inventory can be effectively mitigated. The influence of overprecision differs from that of overestimation. Therefore, appropriately increasing the retailer’s overprecision level can help mitigate the bullwhip effect on inventory. Meanwhile, retailers should consider shortening the lead time to mitigate demand forecasting uncertainty and reduce errors. By controlling and improving demand autocorrelation, the bullwhip effect on inventory can be mitigated.
A comprehensive analysis of the effects of α, β, L, and ρ on the bullwhip effect on inventory reveals that the retailer’s overestimation degree β, the lead time L, and the demand autocorrelation coefficient ρ have a positive impact on the bullwhip effect on inventory in the sustainable supply chain. In contrast, the overprecision coefficient α negatively affects the bullwhip effect on inventory. Therefore, supply chain managers can effectively alleviate the bullwhip effect on inventory by reducing retailers’ overestimation degree, shortening order lead times, appropriately increasing the degree of overprecision, and optimizing demand autocorrelation.
6. Simulation Analysis
In the previous sections, the impact of retailers’ overconfidence on the bullwhip effect on product orders and inventory was analyzed using an analytical approach. However, these analyses were derived through reasoning and differentiation, leading to Propositions 1–3. To further verify the results and determine the critical threshold, this paper conducted numerical simulations using the scientific computing software Wolfram Mathematica 13.3. To examine the effects of overconfidence coefficients (), demand autocorrelation coefficient (ρ), and lead time (L) on the bullwhip effect on product orders and inventory under lead times of L = 1, 2, 4.
6.1. Simulation Analysis of the Bullwhip Effect on Product Orders
From Propositions 1 and 2, it can be derived that
all influence the bullwhip effect on product orders. Specifically, the retailer’s overestimation degree
and lead time
L have a positive impact on the bullwhip effect on product orders (
). The impact of the demand autocorrelation coefficient
on the bullwhip effect on product orders follows a trend of initially increasing and then decreasing, with a critical point
at which the bullwhip effect on product orders reaches its maximum (
). For the numerical analysis of the bullwhip effect on product orders,
derived from Theorem 1 is examined under three different lead time scenarios: L = 1, L = 2, and L = 4. The analysis considers different parameter combinations of the overestimation coefficient
and the demand autocorrelation coefficient
. To unify the format of the output results, the calculation results are rounded to two decimal places. The detailed numerical results are presented in
Table 2.
The numerical simulation analysis clearly demonstrates that, under the same conditions, retailers’ overconfidence (overestimation) exacerbates the bullwhip effect on product orders: as the demand autocorrelation coefficient
increases, the bullwhip effect on product orders becomes more pronounced. An increase in lead time
L also amplifies the bullwhip effect on product orders. Additionally, as
increases, the bullwhip effect on product orders follows a pattern of first intensifying and then diminishing. Therefore, the numerical simulation analysis fully validates the conclusions of Propositions 1 and 2. Beyond these validations, further insights can be drawn by analyzing
Table 2 and examining
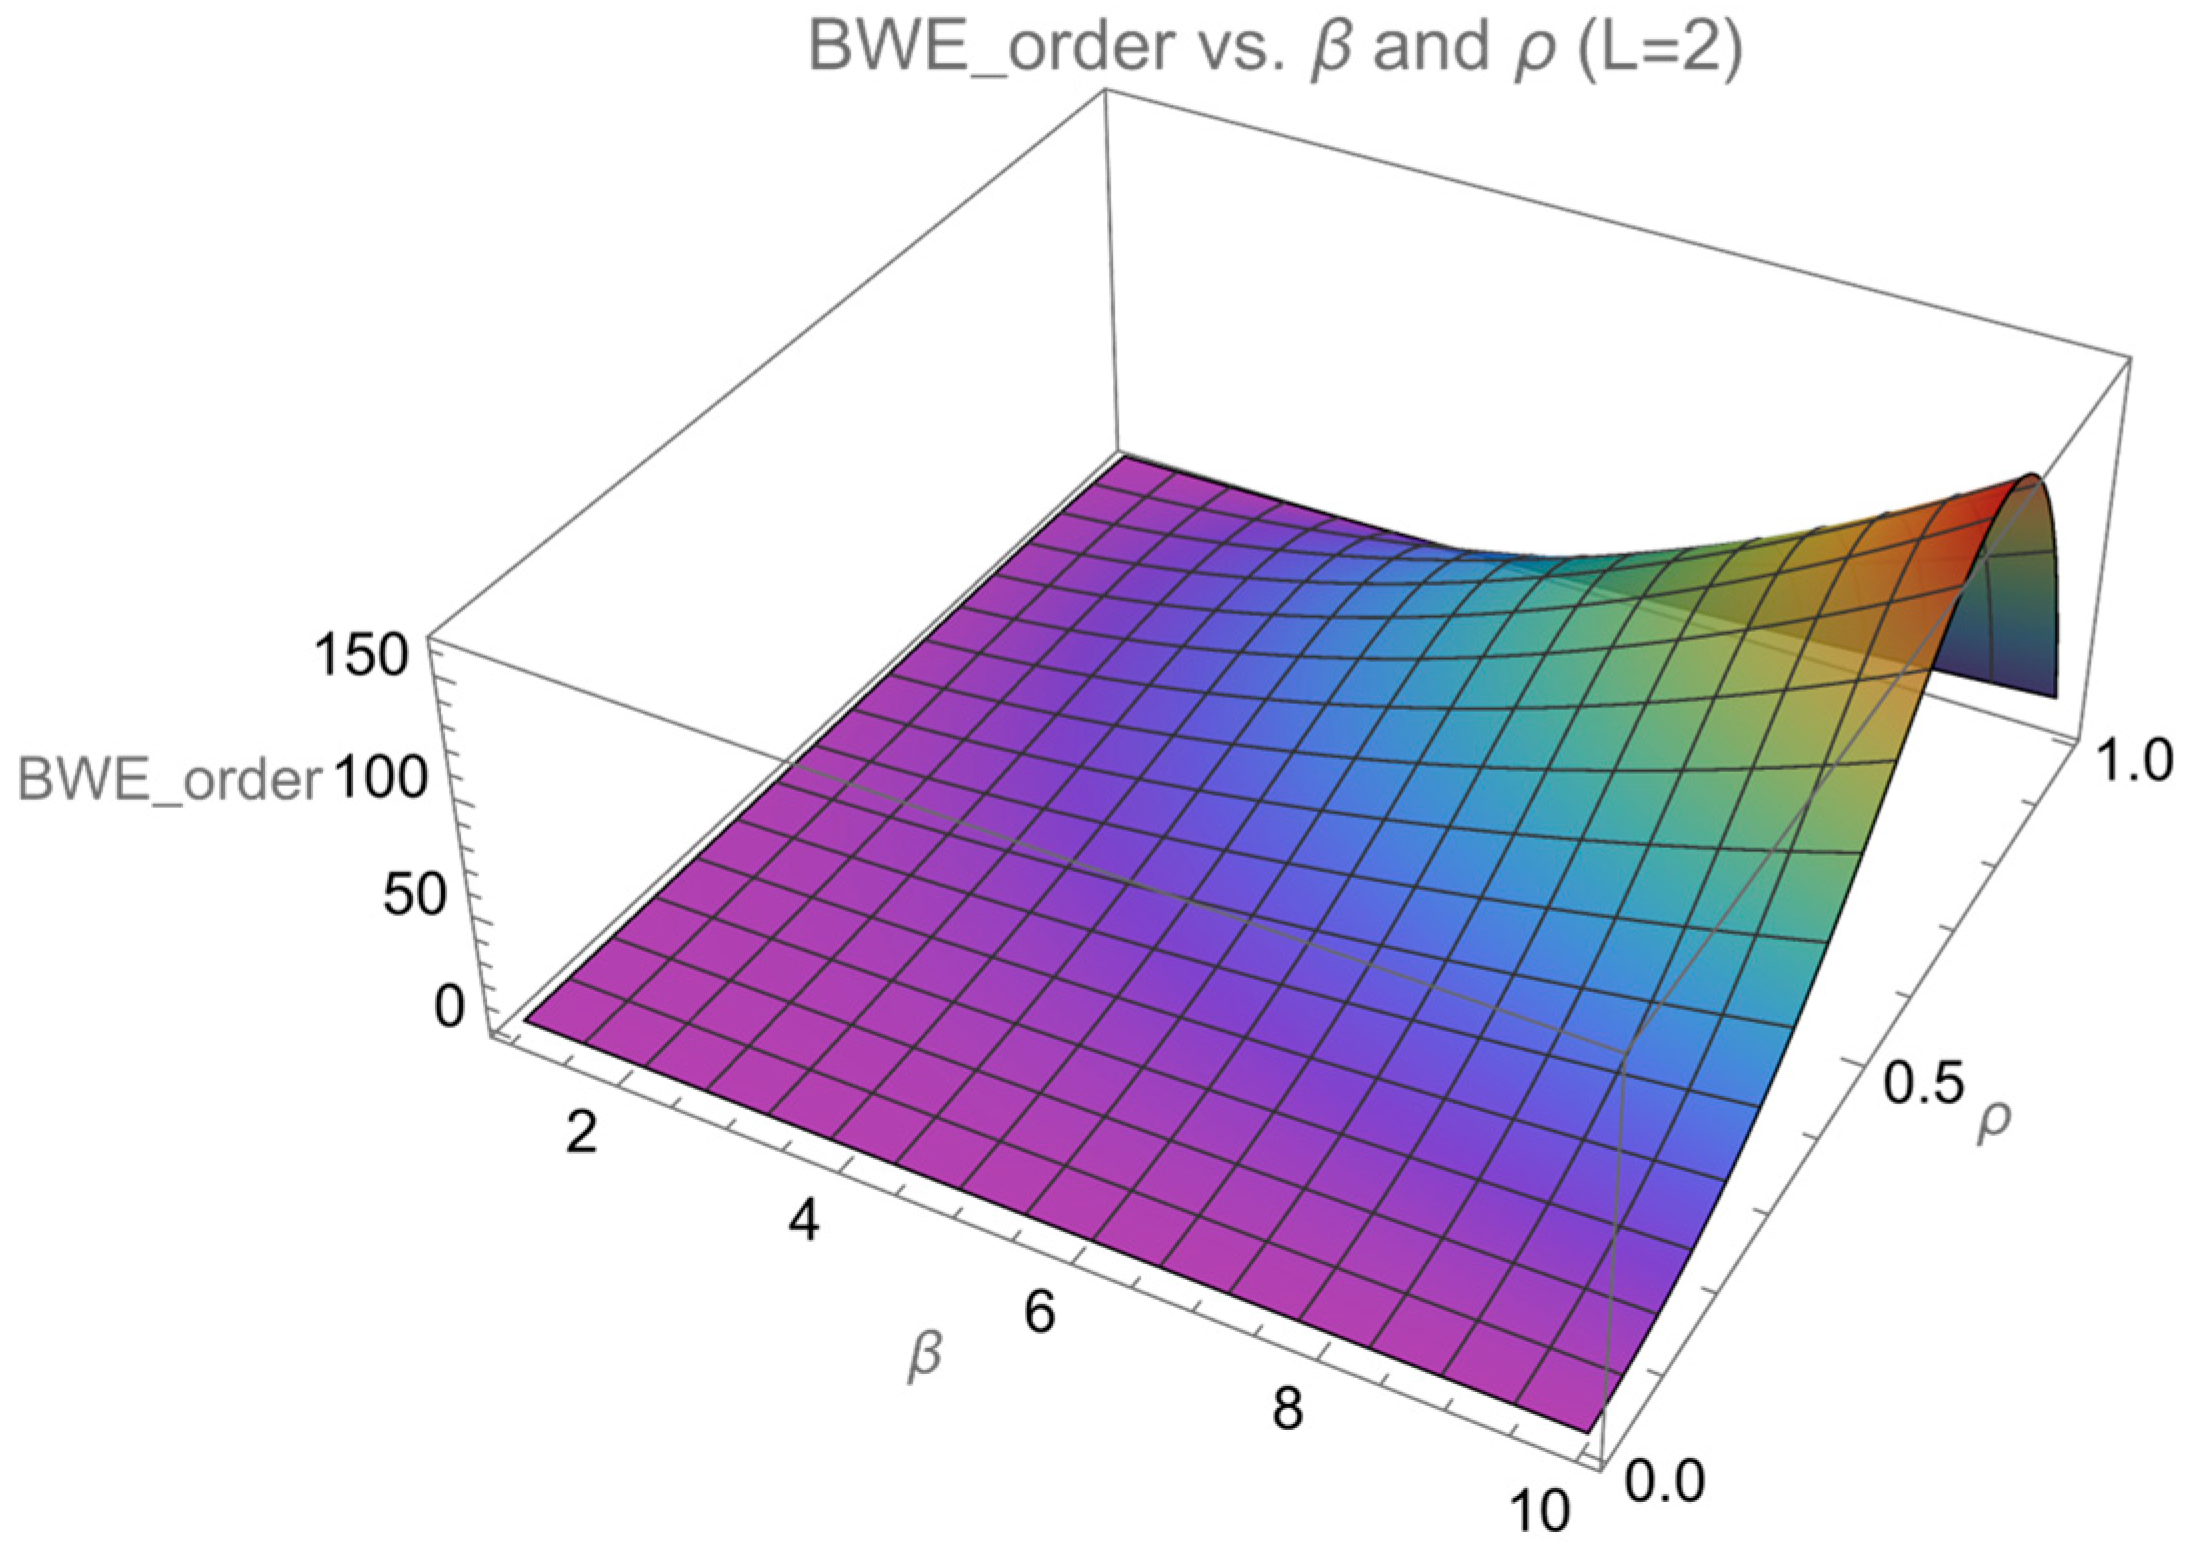
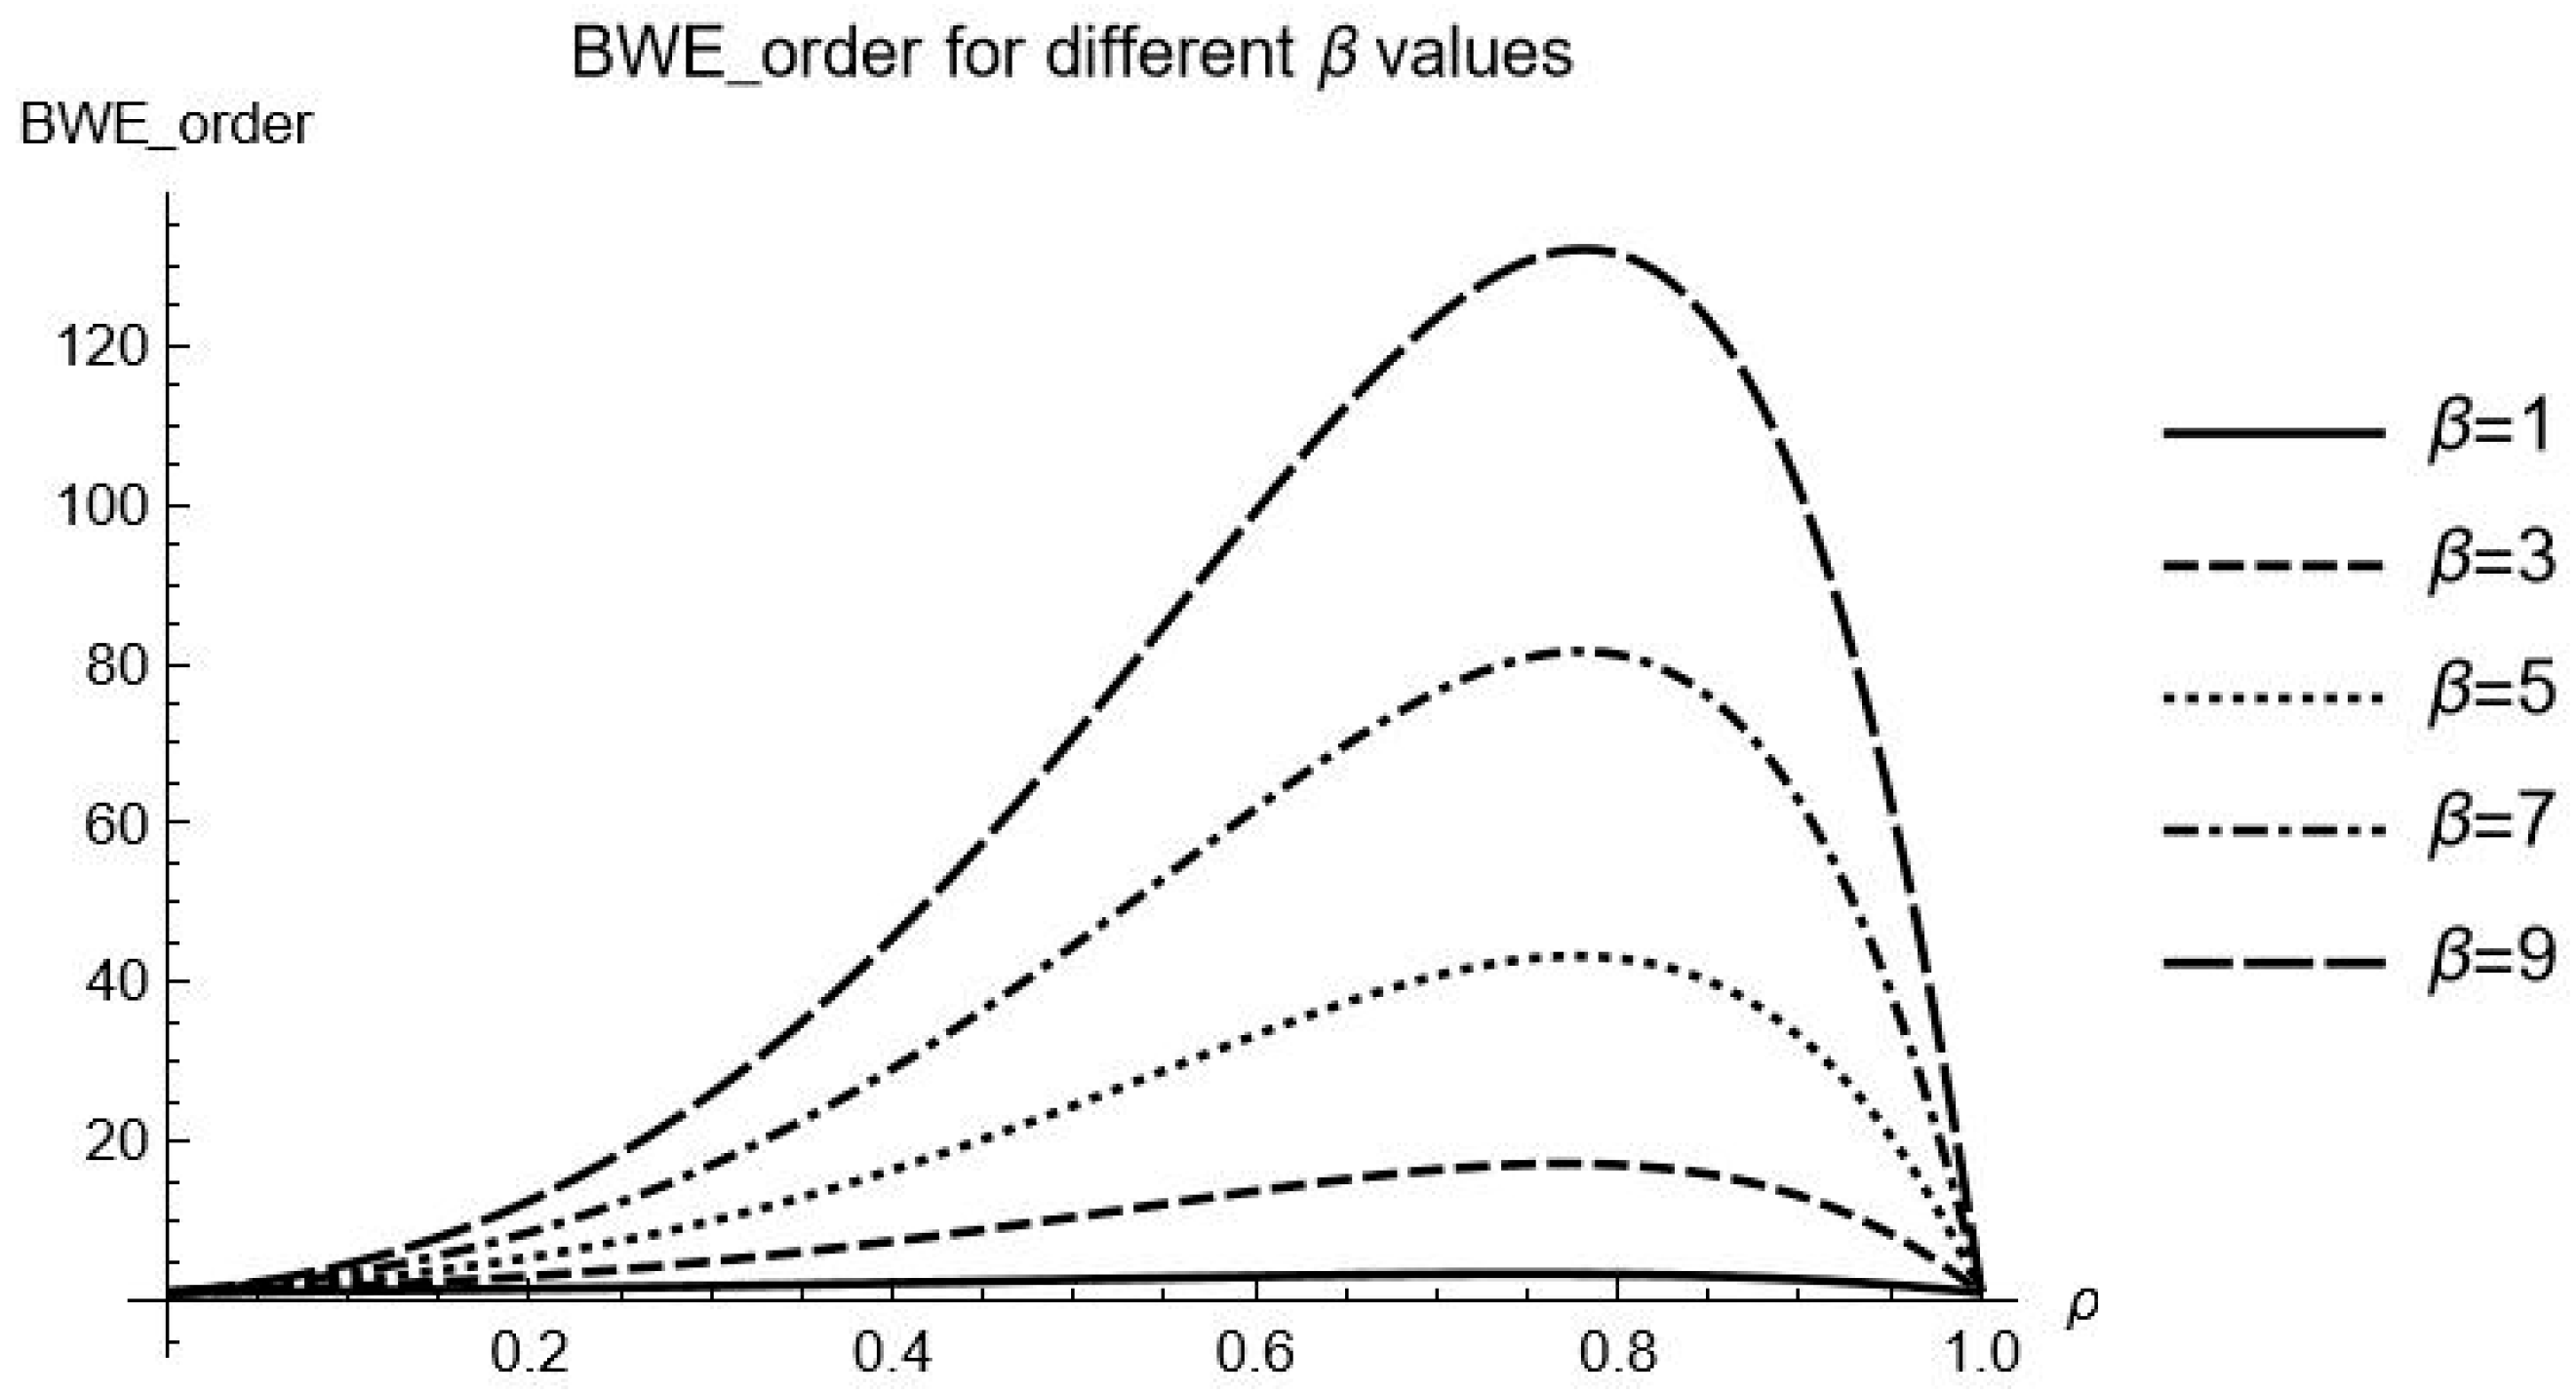
Figure 1 and
Figure 2, as discussed below:
- (1)
The increase in the overestimation coefficient leads to an overall rise in the bullwhip effect on product orders (), but the growth rate of its impact on the bullwhip effect is not uniform. For certain fixed values of , as increases, grows rapidly in the early stage but slows down in the later stage. For example, when L = 2 and = 0.4, as increases from 1 to 5, rises from 2.2161 to 16.4253, representing a 7.41-fold increase. However, when further increases from 5 to 9, only rises from 16.4253 to 45.5865, reflecting a lower 2.78-fold increase. This clearly indicates that when the overestimation level is relatively low, its amplifying effect on the bullwhip effect on product orders is more pronounced, whereas when the overestimation level is high, the amplifying effect weakens.
- (2)
When the lead time
L is fixed, the maximum value of the bullwhip effect on product orders (
) increases significantly with
, and the rate of increase also gradually accelerates.
Figure 2 illustrates that when
L = 2, the increase in
becomes more pronounced as
rises from 1 to 9, with the curvature of the function increasing and the peak position of the curve rising higher. Moreover,
Table 2 also reveals that as lead time L increases, the amplifying effect of
on
becomes more significant. Specifically, when L = 1, 2, and 4, the growth multiples of
from
= 1 to
= 9 are 29.96-fold, 39.17-fold, and 50.42-fold, respectively. This indicates that the impact increases substantially, meaning that the longer the lead time, the stronger the amplifying effect of
on the bullwhip effect on product orders. In actual sustainable supply chains, a longer lead time amplifies the impact of retailers’ overconfidence on the bullwhip effect, leading to greater deviations in order quantities due to excessive demand estimation
- (3)
When the lead time
L is fixed (e.g.,
L = 2),
Figure 1 shows that
reaches maximum when
is close to 0.8–0.9, particularly at high
values. As
approaches 1, the function diverges. The extremum point
ρ’ of
ρ gradually shifts towards 1 as
β increases; and with the increase in lead time
L, the value of the extremum point
ρ’ increases overall, indicating that the extremum point
ρ’ also gradually shifts towards 1 as
L increases. This also indicates that both the lead time
L and an overestimated coefficient
β can shift the extremum point of the bullwhip effect on product orders caused by
ρ.
- (4)
The impact of on the bullwhip effect varies depending on the lead time L. The larger L is, the greater the variation in caused by changes in . For example, when = 3, with L = 1, increases from 1.79 to a maximum of 10.81 as changes from 0.1 to 0.9. However, when L = 4, rises from 1.80 to a maximum of 30.82 over the same range, indicating a significantly larger variation at L = 4. This indicates that as the lead time increases, the effect of raising the demand autocorrelation coefficient on intensifying the becomes increasingly significant.
Figure 1.
Analysis of the impact of different parameter β and ρ combinations on the for L = 2.
Figure 1.
Analysis of the impact of different parameter β and ρ combinations on the for L = 2.
Figure 2.
Relationship between the and ρ for different β Values (L = 2).
Figure 2.
Relationship between the and ρ for different β Values (L = 2).
A comprehensive analysis of the effects of on the suggests that for retailers to effectively control the bullwhip effect on product orders, they must not only reduce overestimation levels but also focus on shortening order lead times. This can be achieved by selecting more efficient suppliers to ensure faster response times and higher production efficiency or by improving logistics and transportation. The adoption of smarter logistics systems to optimize transport routes and the use of faster shipping methods can reduce transportation time, thereby shortening the lead time. Supply chain managers can effectively mitigate the bullwhip effect on product orders by reducing retailers’ overestimation levels, shortening order lead times, and optimizing demand autocorrelation.
6.2. Simulation Analysis of the Bullwhip Effect on Inventory
From Propositions 3, it can be derived that four parameters
all influence the bullwhip effect on inventory. Specifically, the retailer’s overestimation degree
, lead time
L, and demand autocorrelation coefficient
have a positive impact on the bullwhip effect on inventory, while the overprecision coefficient
α has a negative effect. For the numerical analysis of the bullwhip effect on inventory, numerical simulation is conducted based on the
expression derived in Theorem 2 under two lead time scenarios:
L = 2 and
L = 4. The analysis considers different parameter combinations, where the overestimation coefficient takes values of
= 3 and
= 5, the overprecision coefficient
, and the demand autocorrelation coefficient
. To unify the format of the output results, the calculation results are rounded to two decimal places. The detailed numerical results are presented in
Table 3.
The numerical simulation analysis clearly demonstrates that, under the same conditions, retailers’ overestimation exacerbates the
. Both an increase in lead time
L and a higher demand autocorrelation coefficient
also amplify the
. However, an increase in the overprecision coefficient
has a mitigating effect on the
. Therefore, the numerical simulation analysis fully validates the conclusions of Propositions 3. Beyond these validations, further insights can be drawn by analyzing
Table 3 and examining
Figure 3 and
Figure 4, as discussed below:
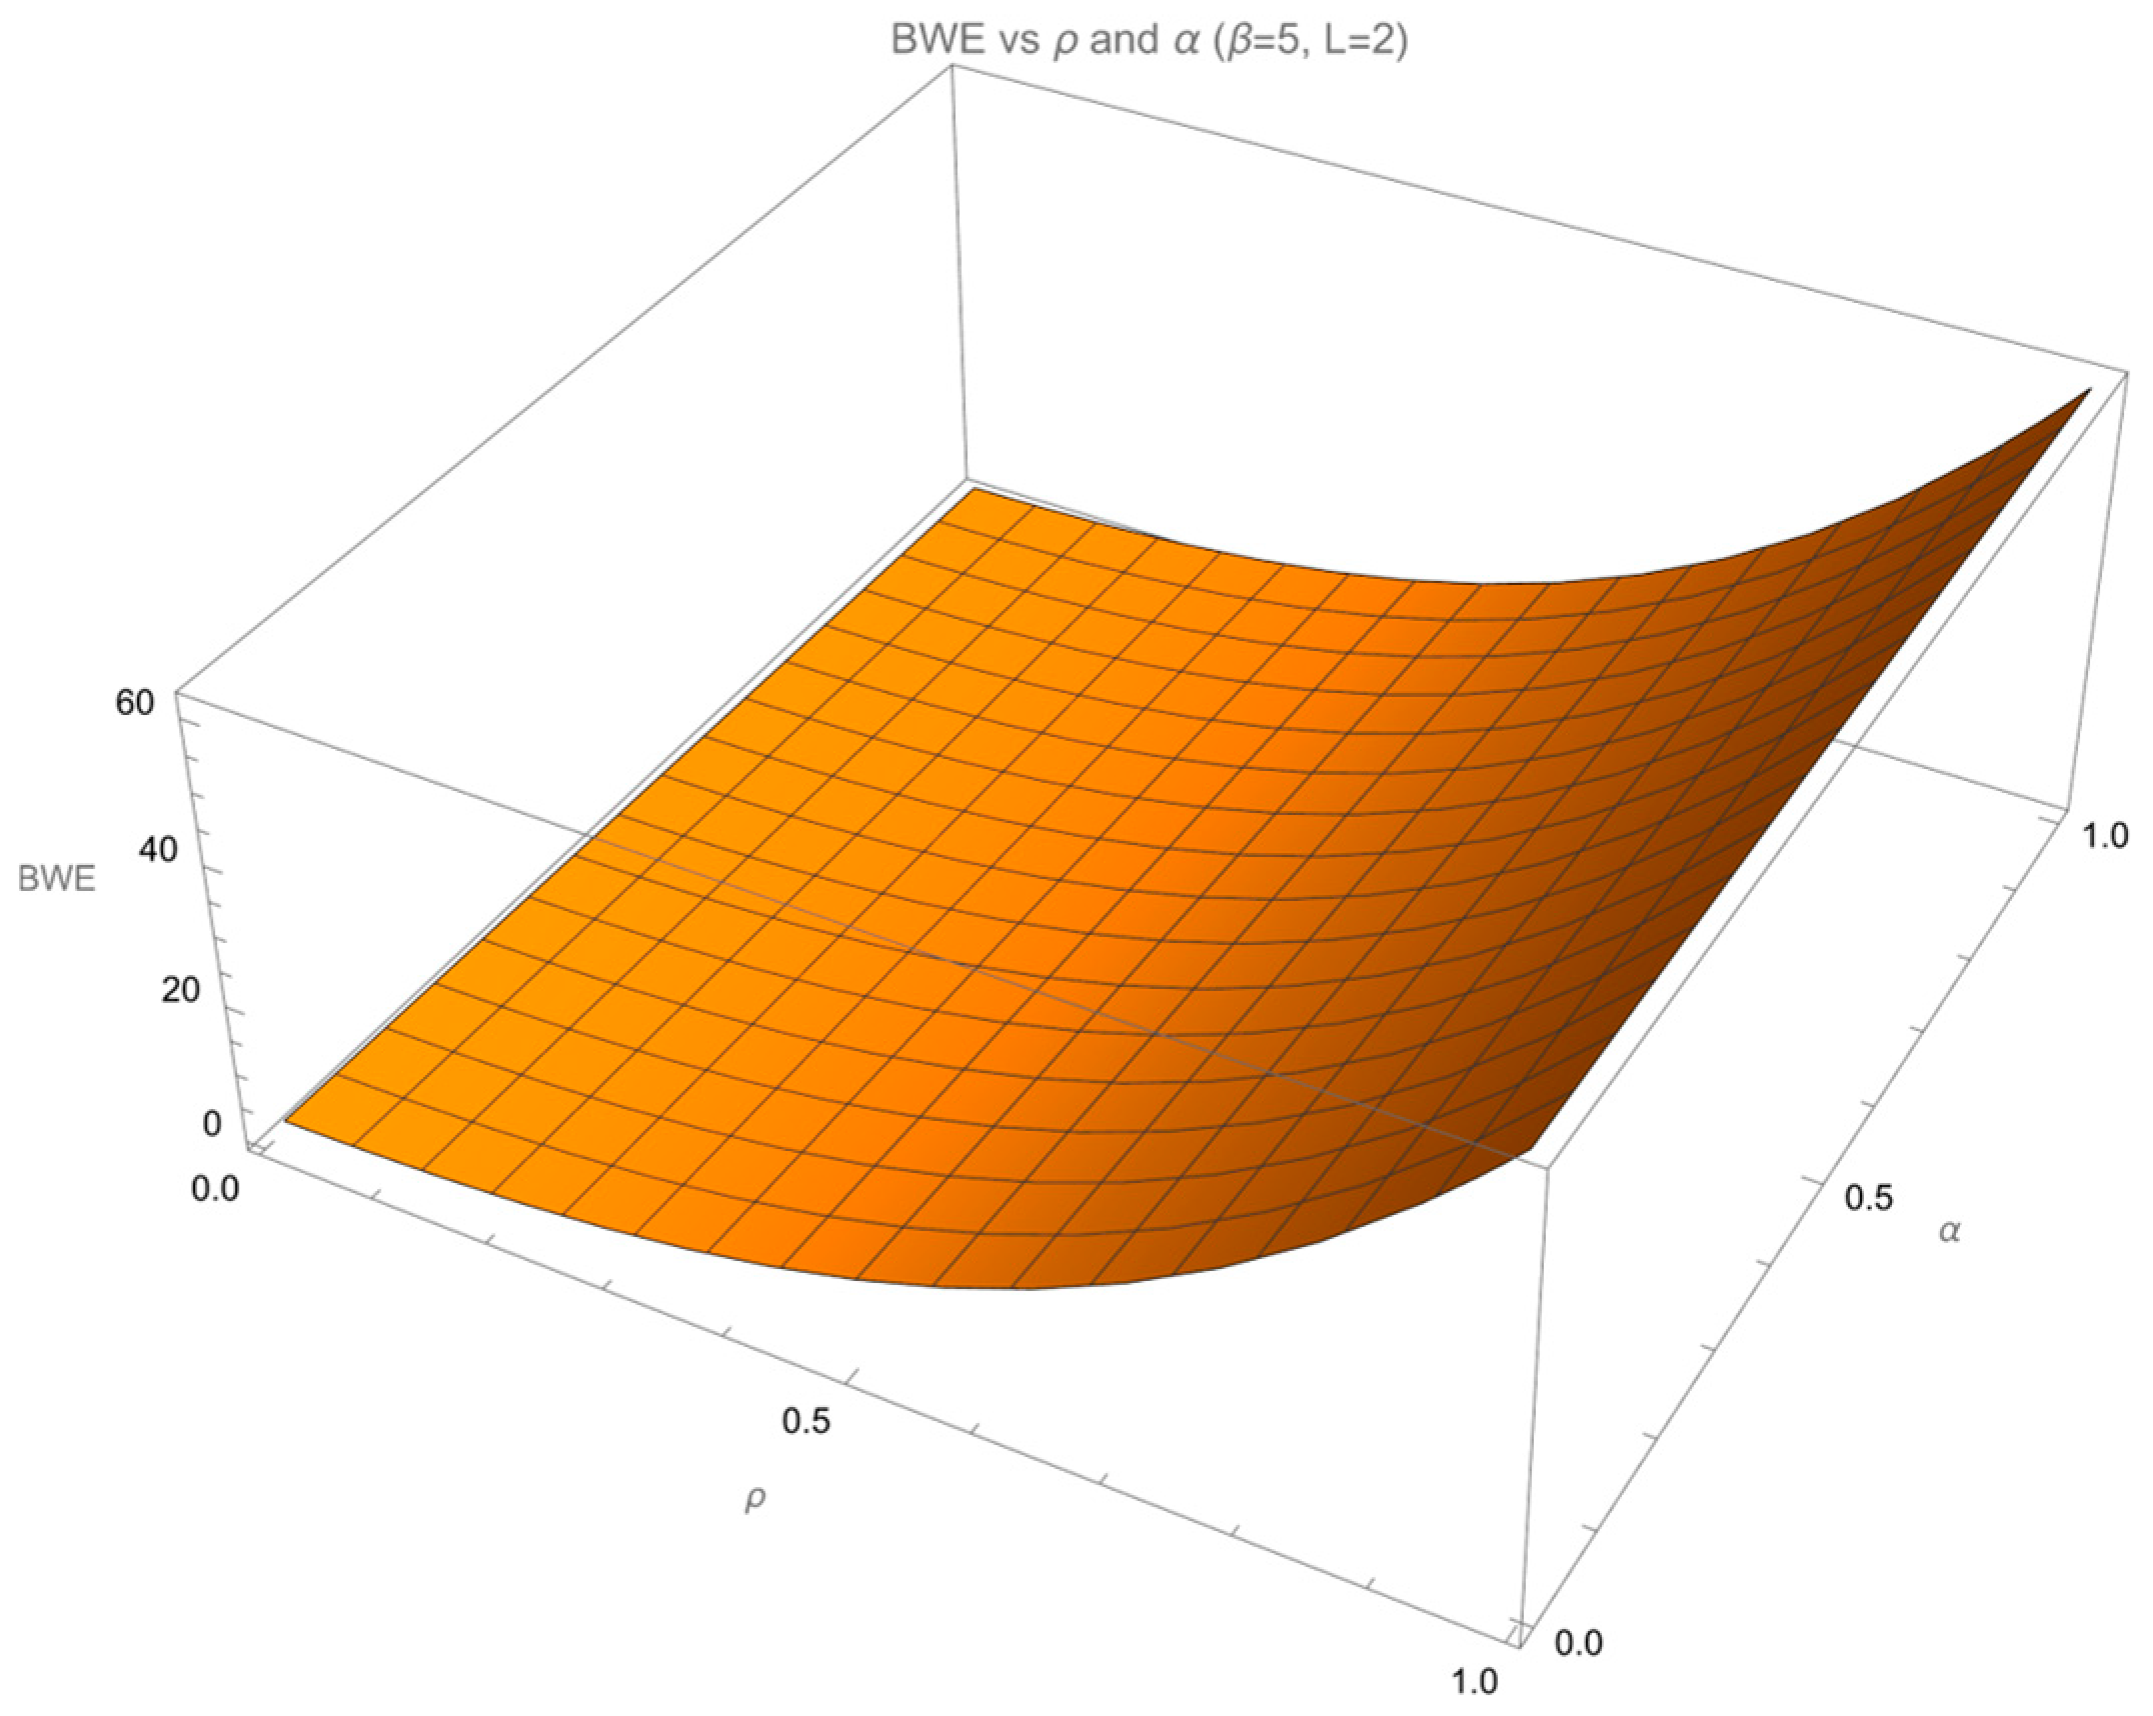
- (1)
Under different combinations of
L and
, for a fixed
value,
generally exhibits a decreasing trend as
increases, though the overall reduction is relatively small.
Figure 3 also shows that when lead time
L and
are fixed, the
curves remain very close across different
values, indicating that the suppressing effect of the overprecision coefficient
on the
is generally weak. When lead time
L and
are fixed (e.g.,
L = 2 and
= 0.5), as
increases (
= 3, 5, 7), when
increases from 0.2 to 0.8, the reduction rate of
is 34.82%, 13.36%, and 6.59%, respectively, with the reduction rate gradually decreasing. This indicates that there is a mutual constraint relationship between the overprecision coefficient
and the overestimation coefficient
: as
increases, the suppressing effect of
on the
weakens. When
and
are fixed (e.g.,
= 5 and
= 0.5), as
L increases (
L = 2 and 4), when
increases from 0.2 to 0.8, the reduction in
is 13.36% and 21.16%, respectively, showing a gradual increase in the reduction rate. This suggests that the suppressing effect of the overprecision coefficient
on the
strengthens as the lead time
L increases.
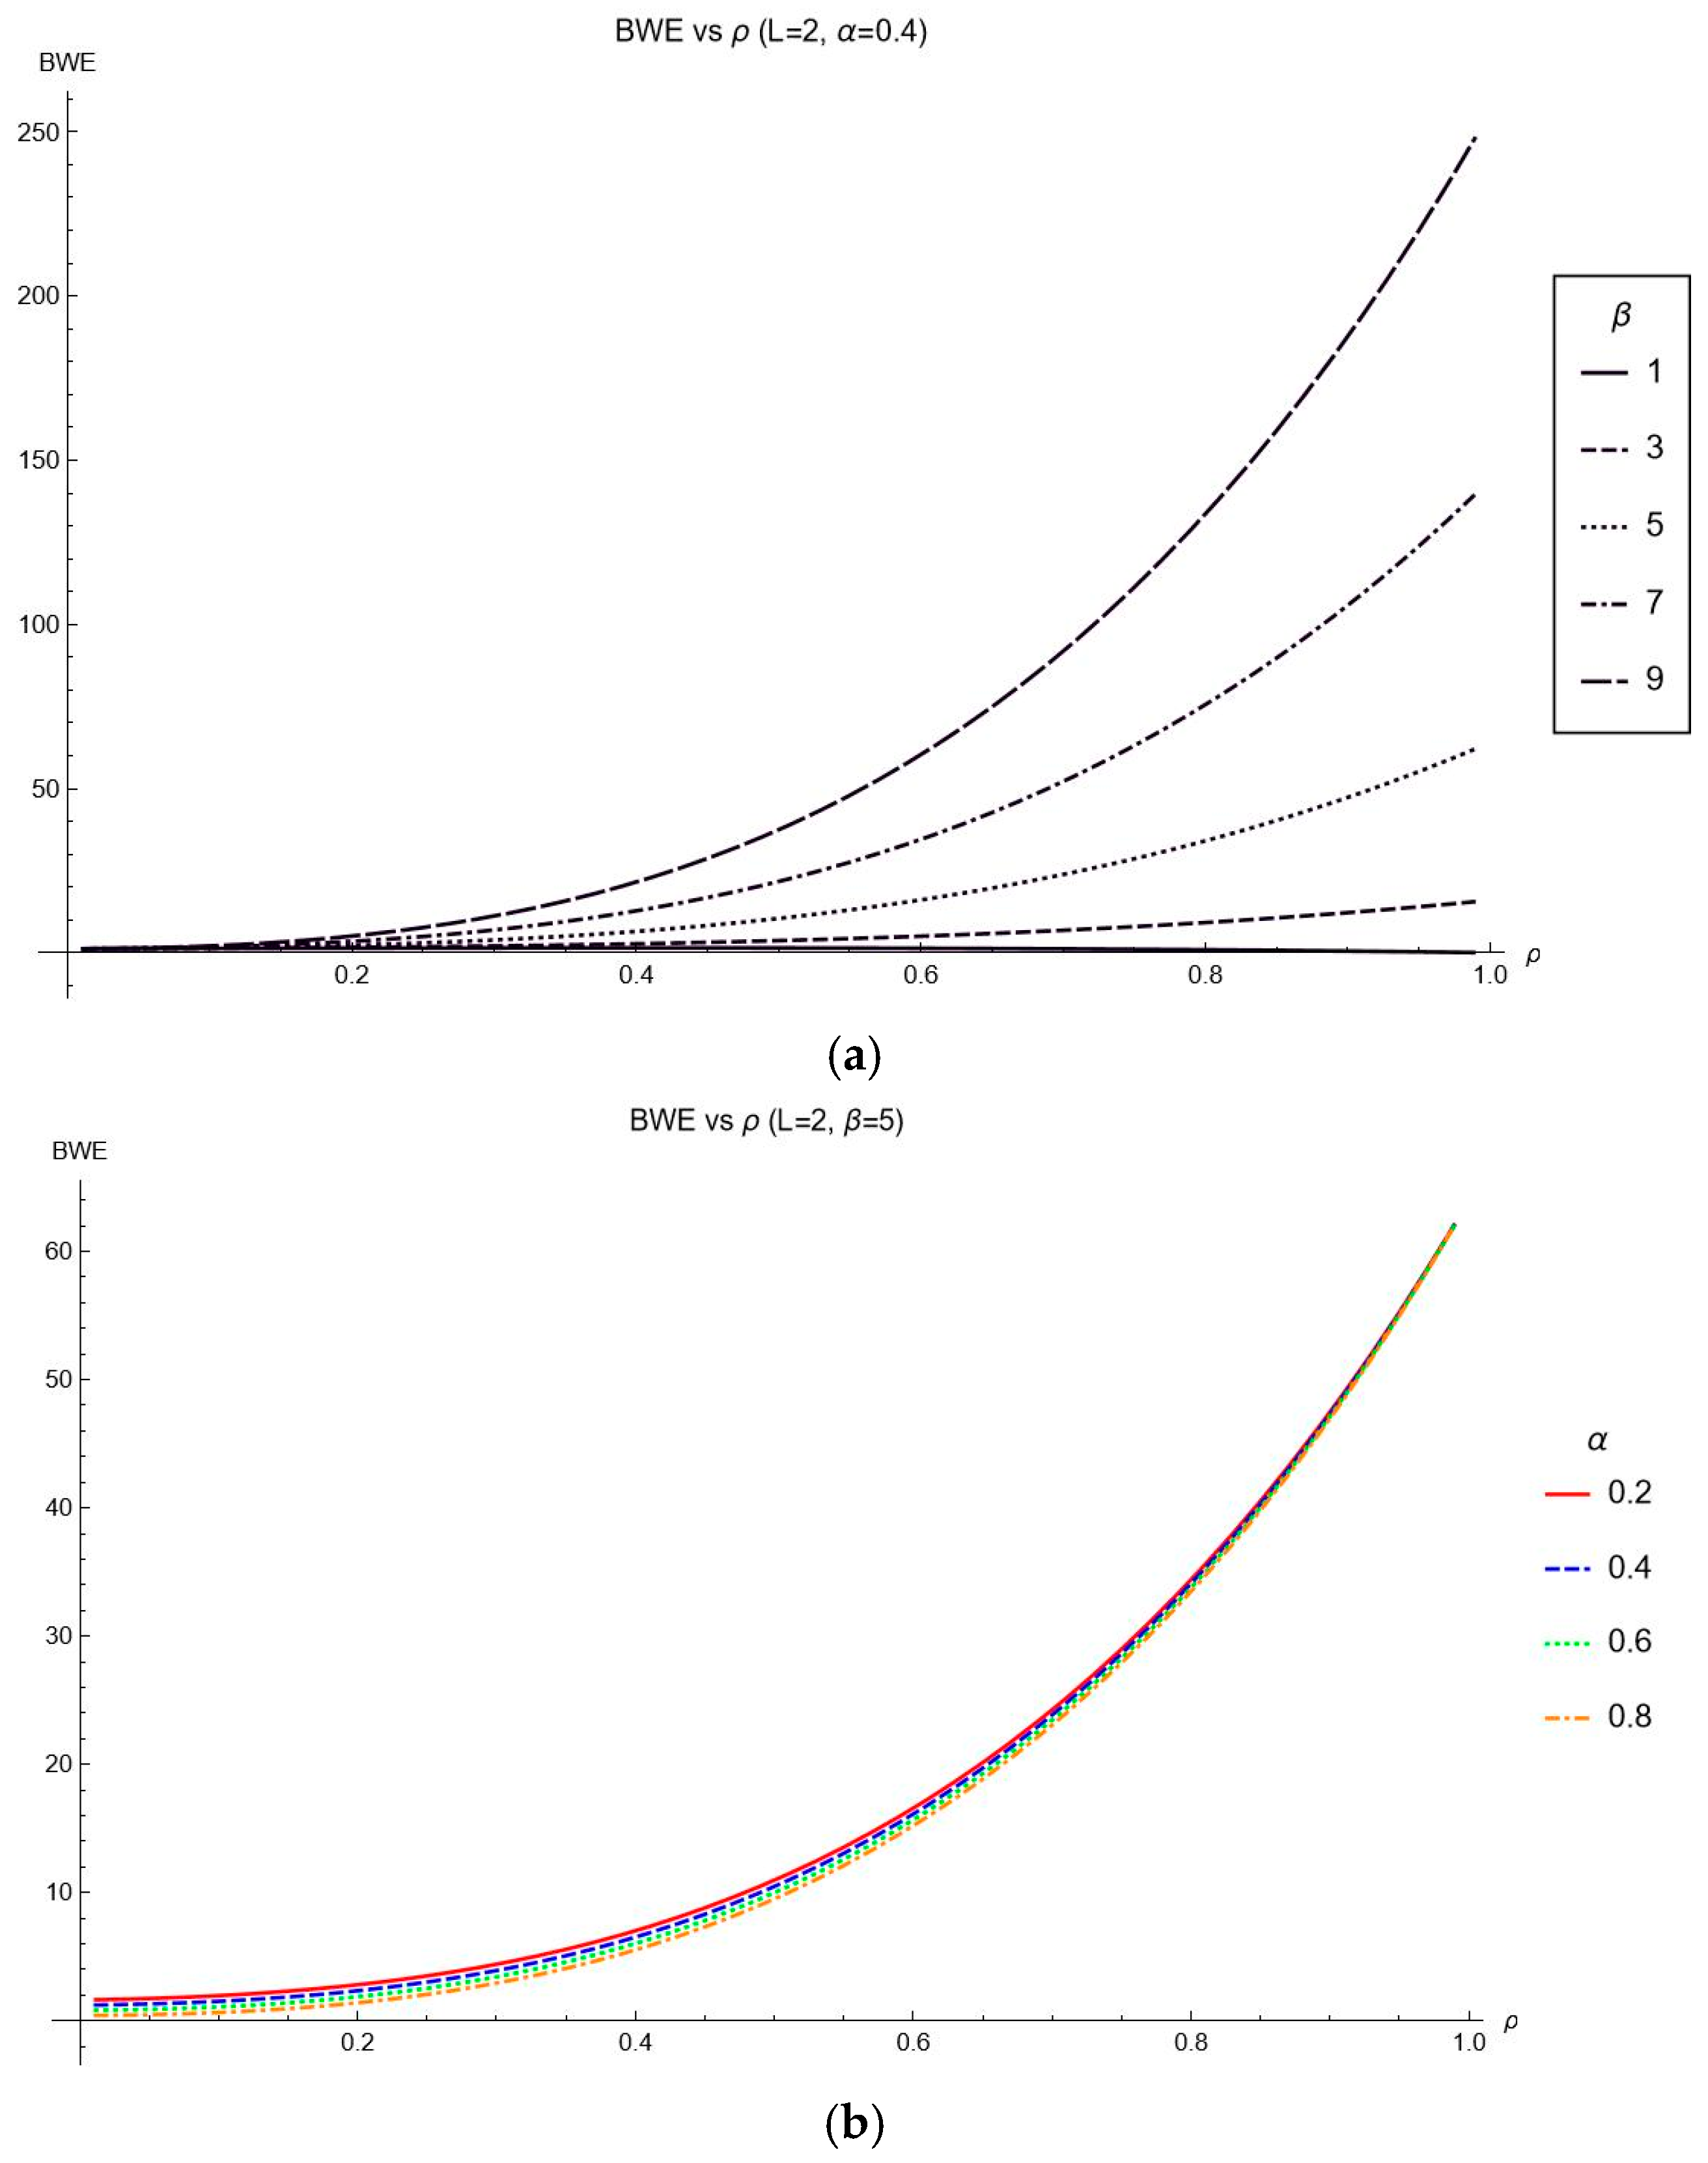
- (2)
As the overestimation coefficient
increases, the variation in
is significant, indicating that
has a substantial impact on the bullwhip effect. Across different combinations of
L,
, and
, an increase in
consistently leads to a significant rise in
.
Figure 4 shows that when
L and
are fixed, the
curve rises sharply with increasing
. Moreover, as
increases, the steepness of the curve also intensifies, indicating that a higher demand autocorrelation coefficient
amplifies the impact of the overestimation coefficient
on the bullwhip effect on inventory.
- (3)
When L, , and are fixed, an increase in the demand autocorrelation coefficient leads to a gradual increase in reaching its maximum value as approaches 1. Under different values of the overprecision coefficient and the overestimation coefficient , consistently follows an upward-sloping curve as increases.
- (4)
Under different combinations of , and , an increase in lead time L leads to a rapid and significant increase in , indicating that extending lead time has a considerable amplifying effect on the bullwhip effect. To mitigate the bullwhip effect on inventory, measures such as adopting advanced logistics and distribution technologies, streamlining order processing procedures, or selecting more efficient suppliers can be implemented to shorten order lead times.
Figure 3.
Relationship between the for L = 2, .
Figure 3.
Relationship between the for L = 2, .
Figure 4.
(a). Relationship between the and for different values (L = 2, = 0.4). (b). Relationship between the and for different values (L = 2, ).
Figure 4.
(a). Relationship between the and for different values (L = 2, = 0.4). (b). Relationship between the and for different values (L = 2, ).
Overall, have a positive impact on the bullwhip effect on inventory, with all three factors exhibiting significant variation. Additionally, as their values increase, the rate of change in the bullwhip effect on inventory accelerates. In contrast, the overprecision coefficient has a negative effect on the bullwhip effect on inventory; however, its overall impact is relatively small. Although provides some suppression of the bullwhip effect on inventory, this effect diminishes as the overestimation coefficient increases.
In practical sustainable supply chain management and related scenarios, effectively controlling the bullwhip effect requires a strong focus on variations in the retailer overestimation coefficient , order lead time , and demand autocorrelation coefficient . Furthermore, careful regulation of these parameters is essential, considering their interactive effects and overall impact on the sustainable supply chain system.
6.3. Discussion
Based on the simulation analysis, Propositions 1–3 in this study have been comprehensively validated. The results indicate that the retailer overestimation coefficient exhibits a significant positive correlation with both the bullwhip effect on product orders and inventory, meaning that as increases, the bullwhip effect intensifies. Lead time L also has a positive impact on the bullwhip effect on product orders and inventory; an extended lead time increases demand forecasting uncertainty and cumulative errors, thereby amplifying demand fluctuations and exacerbating the bullwhip effect.
The demand autocorrelation coefficient influences the bullwhip effect on product orders in a pattern of initial amplification followed by attenuation, with a critical point . Under different lead time conditions, the impact of on the aligns with the theoretical model propositions. In contrast, for the bullwhip effect on inventory, an increase in demand autocorrelation generally exacerbates the effect.
The overprecision coefficient is unrelated to the bullwhip effect on product orders but negatively correlated with the bullwhip effect on inventory, albeit with a relatively small reduction. Moreover, as the overestimation level increases, the suppressing effect of on the weakens. This suggests that enhancing retailers’ overprecision level can moderately alleviate the bullwhip effect on inventory, but its mitigation effect diminishes when overestimation levels are high.
These findings provide clear decision-making insights for supply chain managers. By controlling retailers’ overestimation levels, shortening lead times, optimizing demand autocorrelation, and improving increasing the level of overprecision, the bullwhip effect in the sustainable supply chain can be effectively mitigated, reducing inventory costs and enhancing overall sustainable supply chain efficiency and stability.
7. Conclusions
Traditional bullwhip effect research has mostly focused on structural factors such as information asymmetry and order batching. However, the overconfidence of retailers, as a psychological bias, reveals the impact of decision-makers’ irrational behavior on supply chain fluctuations. This perspective integrates behavioral operations management theory with sustainable supply chains, filling the gap of psychological factors in sustainability analysis. This study constructs a single-stage supply chain model to characterize retailers’ overestimation and overprecision level. Through model derivation, it reveals the mechanism by which retailers’ overconfidence influences both the bullwhip effect on product orders and inventory. The study further validates the theoretical propositions through numerical simulation analysis and visually illustrates the impact of different parameters on the bullwhip effect on product orders and inventory using graphical representations. A total of three propositions are verified through numerical simulations, providing a theoretical foundation for the quantitative analysis of overconfidence. The key findings of this study are as follows:
- (1)
The retailers’ overestimation coefficient and lead time L are significantly positively correlated with both the bullwhip effect on product orders and inventory. An increase in retailers’ overestimation levels and an extension of lead time both intensify the bullwhip effect on product orders and inventory. Overconfident retailers should aim to minimize overestimation in demand forecasting by strengthening market research and improving forecasting accuracy. Additionally, order lead time should be minimized through improvements in logistics technology, supply chain process optimization, and the selection of high-quality suppliers. These measures help reduce the problem of information distortion amplification caused by excessively long lead time, effectively suppressing the bullwhip effect on product orders and inventory in sustainable supply chain.
- (2)
The impact of the demand autocorrelation coefficient on the bullwhip effect on product orders exhibits a non-monotonic trend, initially intensifying before weakening, with a critical point where the bullwhip effect on product orders reaches its maximum. In contrast, the bullwhip effect on inventory continuously intensifies as increases. Optimizing demand autocorrelation and adopting more reasonable demand forecasting methods can effectively alleviate both the bullwhip effect on product orders and inventory, thereby improving the sustainable supply chain stability and reliability.
- (3)
The overprecision level does not affect the bullwhip effect on product orders but has a suppressing effect on the bullwhip effect on inventory. However, this suppressing effect diminishes as the overestimation level increases. When overestimation levels are low, a moderate increase in overprecision can help mitigate the bullwhip effect on inventory.
The conclusions of this study on the impact of lead time and demand autocorrelation coefficient on the bullwhip effect are basically consistent with those of other researchers [
24,
25]. Meanwhile, this study characterizes the overconfidence of retailers from two aspects: overestimation and overprecision. The analysis of the impact of overestimation coefficient and overprecision coefficient on the bullwhip effect fills the gap in existing research. The conclusion that overestimation exacerbates the bullwhip effect is consistent with intuitive judgment. However, contrary to intuitive judgment, overprecision has a certain mitigating effect on the bullwhip effect, although this mitigating effect is relatively weak. The study not only deepens the theory of the causes of the bullwhip effect but also provides behavioral science-based solutions for sustainable supply chain management. It extends the application field of overconfidence theory, deepens the research on the bullwhip effect in the sustainable supply chain field, and also provides a reference for other scholars’ future academic research. In supply chain practice, for industries with low demand volatility (such as everyday consumer goods and basic industrial products), the conclusions of the model in this paper can be applied to optimize order decisions. For industries with high demand volatility, parameters may need to be recalibrated based on industry data, but the analytical logic of overconfidence behavioral bias in this study still has reference value. In practical sustainable supply chain operations, supply chain managers can take corresponding measures based on these findings to mitigate the bullwhip effect. By reducing retailers’ overestimation levels through enhanced market research and improved forecasting accuracy, the bullwhip effect on product orders and inventory can be alleviated. Shortening order lead times, optimizing supply chain processes, and strengthening collaboration with suppliers can help reduce demand forecasting uncertainty and cumulative errors, thereby mitigating the bullwhip effect. Furthermore, optimizing demand autocorrelation through more accurate forecasting methods can enhance supply chain stability and reliability. These measures can effectively mitigate the bullwhip effect on product orders and inventory, lowering inventory costs, reducing overproduction and resource consumption, and enhancing overall sustainable supply chain efficiency. It also reveals that psychological factors can be both a potential driver of supply chain inefficiency and a new means to achieve sustainable goals through behavioral interventions.
Therefore, the following policy recommendations are proposed based on this study: Firstly, it is suggested that governments or industry associations incorporate behavioral factors into the sustainability assessment system of supply chains, for example, requiring the disclosure of cognitive risk management measures in the decision-making process in ESG (environmental, social, and governance) reports. In addition, it is recommended to provide a new dimension for sustainable supply chain certification (such as B Corp) and encourage enterprises to achieve green transformation by reducing decision-making biases.
Despite its contributions, this study has certain limitations. Firstly, in terms of model design, a single-stage simplified model is used, without considering the complex interactions in multi-echelon supply chains. Secondly, the portrayal of overconfidence has been focused on overestimation and overprecision, without characterizing the cognitive bias of overplacement. Additionally, although the study generates extensive simulation data, discrepancies remain between simulated data and real-world supply chains, where uncertainties such as macroeconomic fluctuations, regulatory changes, and unexpected events can have significant impacts—factors that are difficult to fully capture in simulations. Moreover, for analytical simplicity, the model assumes certain idealized supply chain relationships, such as demand following a specific normal distribution, while neglecting potential nonlinear demand relationships and diverse consumer behaviors present in real markets. Future research can extend the model to scenarios involving multiple supply chain entities and further investigate the impact of overconfidence among different sustainable supply chain participants, such as manufacturers and suppliers, on the bullwhip effect.
Author Contributions
Conceptualization, S.L. and L.Z.; Methodology, S.L., L.Z., and D.S.; Software, S.L.; Validation, S.L., L.Z., and D.S.; Formal Analysis, S.L. and L.Z.; Investigation, S.L., L.Z., and D.S.; Resources, S.L., L.Z., and D.S.; Data Curation, S.L., L.Z., and D.S.; Writing—Original Draft, S.L.; Writing—Review and Editing, S.L., L.Z., and D.S.; Visualization, S.L.; Supervision, L.Z.; Project administration, S.L., L.Z., and D.S. All authors have read and agreed to the published version of the manuscript.
Funding
This research received no external funding.
Institutional Review Board Statement
Not applicable.
Informed Consent Statement
Not applicable.
Data Availability Statement
The original contributions presented in this study are included in the article. Further inquiries can be directed to the corresponding author.
Conflicts of Interest
The authors declare no conflicts of interest.
Appendix A
Appendix A.1. Proof of the Actual Demand over the Lead Time L
Proof. This completes the proof. □
Appendix A.2. Proof of Theorem 1
Proof. Let K =
, then the expression simplifies to
Under stationary demand conditions, the variance of demand remains constant over different periods, thus = , .
Substituting these into the variance equation obtains
Since
, substituting this into the bullwhip effect formula obtains
Substituting
into the equation obtains
Proof completed. □
Appendix A.3. Proof of Proposition 1
Proof. Since
, it follows that
, and
is always positive. Therefore, all terms in the derivative expression are positive, implying that
Thus, the bullwhip effect on product orders
increases as
increases.
Since
, and for
, we have
,
it follows that
Thus, the bullwhip effect on product orders increases with lead time L.
Proof completed. □
Appendix A.4. Proof of Proposition 2
Proof. Taking the derivative of
with respect to
, we obtain
From this expression, the following can be observed:
When is relatively small, the positive terms and dominate, making the derivative positive. This indicates that the bullwhip effect increases as increases.
When ρ is relatively large, the negative terms and dominate the numerator, making the derivative negative. This suggests that the bullwhip effect decreases as ρ increases.
As , the numerator approaches , while the denominator approaches 1, resulting in a positive derivative. This implies that and increases slightly with .
As , both the numerator and denominator approach zero, and the sign of the derivative is determined by higher-order terms. Numerical calculations indicate that when approaches 1, the derivative may become negative, leading to a decrease in the bullwhip effect with increasing .
Thus, there exists a critical point where , at which the bullwhip effect reaches its maximum. Therefore, the influence of the demand autocorrelation coefficient on the bullwhip effect on product orders is not monotonic. When , the bullwhip effect increases with ; when , the bullwhip effect decreases with .
Proof completed. □
Appendix A.5. Proof of Lemma 1
Proof. From the above equation, the expression for
can be derived as
Meanwhile, Vassian [
40] and Ma [
38] provided an expression for the optimal order quantity
that minimizes net inventory fluctuations:
Similarly, the order quantity
for an overconfident retailer can be expressed as
where
represents the overconfident retailer’s forecast of lead-time demand, and
denotes the total order quantity already placed by the overconfident retailer but not yet received. Thus, we obtain
The above equation can be simplified as
Proof completed. □
Appendix A.6. Proof of Lemma 2
Proof. Proof completed. □
Appendix A.7. Proof of Theorem 2
Proof. From Lemma 2 and the fact that
we obtain,
Proof completed. □
Appendix A.8. Proof of Lemma 2
Proof. To examine the impact of the overestimation coefficient
on the bullwhip effect on inventory, taking the derivative of
with respect to
gives
Since , and , it follows that all terms in the derivative expression are positive. Therefore, .
To examine the impact of the overprecision coefficient
on the bullwhip effect on inventory, taking the derivative of
with respect to
gives
Since , the sign of the numerator determines the sign of the derivative. When L is relatively large and the numerator is negative. Therefore, .
Taking the derivative of
with respect to
L, we obtain
Since , for large values of L, the higher-order terms containing and approach zero. The dominant term is the constant term , which ensures that .
Taking the derivative with respect to
, we obtain
Since , the sign of the derivative is determined by the numerator. Examining the numerator, we observe that when and most terms involving are positive for . Therefore, .
The above indicates that as increases (i.e., as demand autocorrelation strengthens), the combined effect of a shrinking denominator and an increasing numerator causes to rise rapidly. This indicates that an increase in ρ amplifies the demand autocorrelation, significantly intensifying the bullwhip effect on inventory, particularly when ρ approaches 1. The primary reason for this phenomenon is that historical demand increasingly influences current forecasts, resulting in amplified order fluctuations.
Proof completed. □
References
- Elkington, J. Cannibals with Forks: The Triple Bottom Line of 21st Century Business. Environ. Qual. Manag. 1998, 8, 37–51. [Google Scholar] [CrossRef]
- Shekarian, E.; Ijadi, A.; Zare, J.; Majava, J. Sustainable supply chain management: A comprehensive systematic review of industrial practices. Sustainability 2022, 14, 7892. [Google Scholar] [CrossRef]
- Seuring, S.; Müller, M. From a literature review to a conceptual framework for sustainable supply chain management. J. Clean. Prod. 2008, 16, 1699–1710. [Google Scholar] [CrossRef]
- Fischhoff, B.; Slovic, P.; Lichtenstein, S. Knowing with certainty: The appropriateness of extreme confidence. J. Exp. Psychol. Hum. Percept. Perform. 1977, 3, 552–564. [Google Scholar] [CrossRef]
- Russo, J.E.; Schoemaker, P.J.H. Managing overconfidence. Sloan Manag. Rev. 1992, 33, 7–17. [Google Scholar]
- Weinstein, N.D. Unrealistic optimism about future life events. J. Personal. Soc. Psychol. 1980, 39, 806–820. [Google Scholar] [CrossRef]
- Lee, H.L.; Padmanabhan, V.; Whang, S. Information distortion in a supply chain: The bullwhip effect. Manag. Sci. 1997, 43, 546–558. [Google Scholar] [CrossRef]
- Ji, S.; Zhao, D.; Peng, X. Joint Decisions on Emission Reduction and Inventory Replenishment with Overconfidence and Low-Carbon Preference. Sustainability 2018, 10, 1119. [Google Scholar] [CrossRef]
- Yu, J.; Sun, L. Supply Chain Emission Reduction Decisions, Considering Overconfidence under Conditions of Carbon Trading Price Volatility. Sustainability 2022, 14, 15432. [Google Scholar] [CrossRef]
- Wolosin, R.J.; Sherman, S.J.; Till, A. Effects of cooperation and competition on responsibility attribution after success and failure. J. Exp. Soc. Psychol. 1973, 9, 220–235. [Google Scholar] [CrossRef]
- Mahajan, J. The overconfidence effect in marketing management predictions. J. Mark. Res. 1992, 29, 329–342. [Google Scholar] [CrossRef]
- Moore, D.A.; Healy, P.J. The trouble with overconfidence. Psychol. Rev. 2008, 115, 502–517. [Google Scholar] [CrossRef] [PubMed]
- Lu, J.; Nageswaran, L.; Xu, J.; Kwak, J.K.; Gavirneni, S. Horizontal Information Sharing in Omnichannel Operations: Impact of Information Errors. 2024. Available online: https://papers.ssrn.com/sol3/papers.cfm?abstract_id=3931934 (accessed on 4 May 2025).
- Pournader, M.; Narayanan, A.; Keblis, M.F.; Ivanov, D. Decision Bias and Bullwhip Effect in Multiechelon Supply Chains: Risk Preference Models. IEEE Trans. Eng. Manag. 2024, 71, 9229–9243. [Google Scholar] [CrossRef]
- Pillai, K.G.; Min, S. A Firm’s Capability to Calibrate Supply Chain Knowledge—Antecedents and Consequences. Ind. Mark. Manag. 2010, 39, 1365–1375. [Google Scholar] [CrossRef]
- Wang, Z.; Zhang, Z.; Li, C.; Xu, L.; You, C. Optimal ordering and disposing policies in the presence of an overconfident retailer: A Stackelberg game. Math. Probl. Eng. 2015, 2015, 385289. [Google Scholar] [CrossRef]
- Ren, Y.; Croson, R. Overconfidence in newsvendor orders: An experimental study. Manag. Sci. 2013, 59, 2502–2517. [Google Scholar] [CrossRef]
- Xu, L.; Shi, X.; Du, P.; Govindan, K.; Zhang, Z. Optimization on pricing and overconfidence problem in a duopolistic supply chain. Comput. Oper. Res. 2019, 101, 162–172. [Google Scholar] [CrossRef]
- Ancarani, A.; Di Mauro, C.; D’Urso, D. Measuring overconfidence in inventory management decisions. J. Purch. Supply Manag. 2016, 22, 171–180. [Google Scholar] [CrossRef]
- Shee, H.; Kaswi, S. Behavioral causes of the bullwhip effect: Multinational vs. local supermarket retailers. Oper. Supply Chain. Manag. -Int. J. 2016, 9, 1–14. [Google Scholar] [CrossRef]
- Yang, Y.; Lin, J.; Liu, G.; Zhou, L. The behavioural causes of bullwhip effect in supply chains: A systematic literature review. Int. J. Prod. Econ. 2021, 231, 108120. [Google Scholar] [CrossRef]
- Theeraworawit, M.; Suriyankietkaew, S.; Hallinger, P. Sustainable Supply Chain Management in a Circular Economy: A Bibliometric Review. Sustainability 2022, 14, 9304. [Google Scholar] [CrossRef]
- Metwally, A.B.M.; Ali, H.A.A.; Aly, S.A.S.; Ali, M.A.S. The Interplay between Digital Technologies, Supply Chain Resilience, Robustness and Sustainable Environmental Performance: Does Supply Chain Complexity Matter? Sustainability 2024, 16, 6175. [Google Scholar] [CrossRef]
- Li, Z.; Fei, W.; Zhou, E.; Gajpal, Y.; Chen, X. The Impact of Lead Time Uncertainty on Supply Chain Performance Considering Carbon Cost. Sustainability 2019, 11, 6457. [Google Scholar] [CrossRef]
- Shaban, A.; Shalaby, M.A.; Di Gravio, G.; Patriarca, R. Analysis of Variance Amplification and Service Level in a Supply Chain with Correlated Demand. Sustainability 2020, 12, 6470. [Google Scholar] [CrossRef]
- Lee, H.L.; Padmanabhan, V.; Whang, S. The bullwhip effect in supply chains. Sloan Manag. Rev. 1997, 38, 93–102. [Google Scholar] [CrossRef]
- Chen, F.; Drezner, Z.; Ryan, J.K.; Simchi-Levi, D. Quantifying the bullwhip effect in a simple supply chain: The impact of forecasting, lead times, and information. Manag. Sci. 2000, 46, 436–443. [Google Scholar] [CrossRef]
- Chen, F.; Ryan, J.K.; Simchi-Levi, D. The impact of exponential smoothing forecasts on the bullwhip effect. Nav. Res. Logist. 2000, 47, 269–286. [Google Scholar] [CrossRef]
- Ryan, J.K. Analysis of Inventory Models with Limited Demand Information. Ph.D. Thesis, Northwestern University, Evanston, IL, USA, 1997. [Google Scholar]
- Gaalman, G.; Disney, S.M. State space investigation of the bullwhip problem with ARMA(1,1) demand processes. Int. J. Prod. Econ. 2006, 104, 327–339. [Google Scholar] [CrossRef]
- Aviv, Y. The effect of collaborative forecasting on supply chain performance. Manag. Sci. 2001, 47, 1326–1343. [Google Scholar] [CrossRef]
- Aviv, Y. Gaining benefits from joint forecasting and replenishment processes: The case of auto-correlated demand. Manuf. Serv. Oper. Manag. 2002, 4, 55–74. [Google Scholar] [CrossRef]
- Aviv, Y. On the benefits of collaborative forecasting partnerships between retailers and manufacturers. Manag. Sci. 2007, 53, 1326–1343. [Google Scholar] [CrossRef]
- Aviv, Y. A time-series framework for supply-chain inventory management. Oper. Res. 2003, 51, 210–227. [Google Scholar] [CrossRef]
- Lee, H.L.; So, K.C.; Tang, C.S. The value of information sharing in a two-level supply chain. Manag. Sci. 2000, 46, 626–643. [Google Scholar] [CrossRef]
- Dejonckheere, J.; Disney, S.M.; Lambrecht, M.R.; Towill, D. The impact of information enrichment on the bullwhip effect in supply chains: A control engineering perspective. Eur. J. Oper. Res. 2004, 153, 727–750. [Google Scholar] [CrossRef]
- Hosoda, T.; Disney, S.M. On variance amplification in a three-echelon supply chain with minimum mean square error forecasting. Omega 2006, 34, 344–358. [Google Scholar] [CrossRef]
- Ma, Y.; Wang, N.; Che, A.; Huang, Y.; Xu, J. The bullwhip effect under different information-sharing settings: A perspective on price-sensitive demand that incorporates price dynamics. Int. J. Prod. Res. 2013, 51, 3085–3116. [Google Scholar] [CrossRef]
- Chen, L.; Luo, W.; Shang, K. Measuring the bullwhip effect: Discrepancy and alignment between information and material flows. Manuf. Serv. Oper. Manag. 2017, 19, 36–51. [Google Scholar] [CrossRef]
- Vassian, H.J. Application of discrete variable servo theory to inventory control. Oper. Res. 1955, 3, 272–282. [Google Scholar] [CrossRef]
| Disclaimer/Publisher’s Note: The statements, opinions and data contained in all publications are solely those of the individual author(s) and contributor(s) and not of MDPI and/or the editor(s). MDPI and/or the editor(s) disclaim responsibility for any injury to people or property resulting from any ideas, methods, instructions or products referred to in the content. |
© 2025 by the authors. Licensee MDPI, Basel, Switzerland. This article is an open access article distributed under the terms and conditions of the Creative Commons Attribution (CC BY) license (https://creativecommons.org/licenses/by/4.0/).


