Article

The Role of Tourism Development in Promoting Income Equality: A Case Study of GCC Countries

1
Department of Economics, College of Business Administration, King Saud University, P.O. Box 71115, Riyadh 11587, Saudi Arabia
2
Department of Economics, College of Business Administration, Princess Nourah bint Abdulrahman University, P.O. Box 84428, Riyadh 11671, Saudi Arabia
Sustainability 2025, 17(10), 4272; https://doi.org/10.3390/su17104272
Submission received: 20 February 2025 / Revised: 19 April 2025 / Accepted: 2 May 2025 / Published: 8 May 2025

Abstract

:
In recent years, the importance of developing the tourism sector and diversifying income sources has grown in the Gulf Cooperation Council (GCC) countries. This paper estimates the impact of tourism industry development on income equality in the GCC region from the first quarter of 2014 to the fourth quarter of 2023. Furthermore, this paper evaluates the existence of the Kuznets curve and its implications for income distribution. To achieve these objectives, this study employs panel cointegration tests and the cross-sectionally augmented autoregressive distributed lag (CS-ARDL) model. The dataset combines quarterly data from the World Bank and national statistical agencies, including indicators such as tourism revenue, international arrivals, government effectiveness, and education expenditure (used as a proxy for income equality). The results indicate that tourism revenue (TOU) has a significant and positive long-run effect on income equality (0.14%). In the short run, the squared term of tourism revenue (TOU2) becomes significant and positive (0.01%), but the findings do not support the Kuznets curve hypothesis. Furthermore, the number of international travelers (TRAV) has a negative and significant effect in the long run, while government effectiveness (GE) is negative and significant in both the long and short run. A key limitation of the study lies in the use of education expenditure as a proxy for income equality, due to the unavailability of consistent inequality metrics across the GCC countries.

1. Introduction

The relationship between the tourism industry and income inequality is complex and can vary depending on factors such as the type of tourism, the level of economic development in a region, and how wealth is distributed among the population [1]. Tourism can help mitigate income inequality by creating jobs and reducing poverty, particularly when lower-income groups engage in tourism-related activities, thereby increasing their earning potential [2,3,4]. According to the World Travel and Tourism Council [5], the tourism industry contributed to global employment by creating 27 million new jobs by the end of 2023, accounting for 9.1% of global economic growth and promoting inclusive development. However, tourism can also have negative impacts, such as the displacement of local communities, unequal distribution of benefits, and the prevalence of seasonal, low-wage employment [6].
Tourism can drive urban renewal and rural development, helping to reduce regional disparities by allowing communities to grow economically in their places of origin. It also serves as an effective tool for developing countries to engage with the global economy. Tourism contributes to a country’s GDP, employment, and foreign currency earnings [7] and can stimulate growth in related sectors such as transportation, lodging, and food production. Additionally, tourism can lessen a country’s reliance on a single industry by generating revenue from external sources. The extent of the tourism sector’s contribution to economic growth is determined by factors such as investment in infrastructure and human capital, the quality of tourism products and services, and the efficacy of sectoral policies and regulations [8,9]. Furthermore, tourism can provide direct support to the poor through financial benefits, employment opportunities, and community development initiatives [10,11]. Currently, tourism is seen as a strategy for economic development, contributing to income growth, utilizing human capital, and enhancing the standard of living in local communities [12]. When well-planned and effectively managed, the tourism industry can stimulate economic growth and boost government tax revenues in host countries. Reflecting this potential, the tourism sector experienced a remarkable growth rate of 22% from 2021 to 2022 [13]. According to the United Nations 2030 Agenda, involving local populations and all key stakeholders in tourism development can make tourism an effective tool for community development and reducing inequalities.
The Gulf Cooperation Council (GCC) countries—which include Bahrain, Kuwait, Oman, Qatar, Saudi Arabia, and the United Arab Emirates—have long been recognized for their abundance of natural resources [14]. In recent years, however, these countries have acknowledged the need to diversify their economies and reduce dependence on oil [15]. As a result, tourism development projects have become important for economic growth in some GCC countries, as tourism generates revenue, creates jobs, and promotes cultural exchange [16]. Several factors contribute to the growing importance of the tourism industry in the GCC region, including economic diversification, investment in infrastructure, hospitality, entertainment, and employment [17]. Additionally, tourism fosters global understanding, builds cultural bridges, and promotes infrastructure development and environmental conservation [18]. Despite these positive contributions, the negative impacts of tourism cannot be overlooked. Unregulated visitor numbers can place significant pressure on natural ecosystems, leading to problems such as soil erosion, pollution, habitat loss, and rising living costs [19,20]. Furthermore, increased greenhouse gas emissions from tourist transport contribute to climate change, which can have far-reaching consequences for both wildlife and human communities. Socially, while tourism can promote intercultural exchange, it may also lead to the erosion of cultural identity within local communities [21]. These challenges highlight the need for responsible tourism management to ensure sustainable development.
While environmental and sociocultural concerns highlight the unsustainable dimensions of tourism growth, another critical issue tied to tourism development is its effect on income inequality.
The issue of equality has become a central topic in both international and domestic discourse, as governments and organizations seek solutions to growing economic and social disparities. According to Raza and Shah [22], increasing income inequality is one of the causes of economic crises. Beyond concerns related to fairness and social justice, there are significant economic and political motivations for addressing inequality in all its dimensions, given its far-reaching effects on societal development [23]. From an economic perspective, high levels of income inequality slow economic growth [24]. Economic equality is crucial in societies, but its relevance and influence depend on ideological, cultural, and religious contexts [8,25,26,27]. Rising inequality has notable consequences for both economic growth and macroeconomic stability [24], including its capacity to concentrate political and decision-making power among a few individuals, bring about misallocation of human resources, cause political and economic instability, reduce investment, and increase the likelihood of economic and financial crises.
The COVID-19 pandemic had a larger effect on income distribution than the other pandemics [28,29]. As a result, it drew attention to rising income inequality, which has become a significant concern. Long-term and heightened levels of inequality, particularly those related to unequal opportunities, can have significant societal costs. For example, persistent income inequality can substantially impact individuals’ educational and vocational decisions [30]. Moreover, when income inequality is driven by rent-seeking behavior rather than merit or productivity, it undermines incentives for innovation and economic growth. Under such circumstances, individuals may prioritize obtaining preferential treatment and protection, leading to the misallocation of resources, corruption, and favoritism. These dynamics can have detrimental effects on both the economy and society. Notably, a loss of public trust in institutions may occur, gradually eroding social cohesion and diminishing optimism about the future [31].
The GCC, formed in 1981, consists of six member states: Saudi Arabia, Kuwait, the United Arab Emirates, Qatar, Oman, and Bahrain. The governance structure of these states is predominantly monarchical, either in the form of absolute monarchies or constitutional monarchies, where the ruling families hold substantial power. Each state executes its government unique to its historical and cultural context; however, they share common elements, such as a strong central authority and limited political pluralism. This system often encompasses a Supreme Council, consisting of the monarchs of each state, which convenes for collective decision-making and cooperation on regional issues. The GCC also features a Ministerial Council and a Secretariat General to facilitate ongoing collaboration and policy execution [32].
Over the past decade, GCC countries have increasingly relied on tourism to diversify their oil-dependent economies. Governments have launched ambitious national strategies to develop tourism infrastructure, attract international visitors, and position tourism as a key pillar of sustainable growth. While these initiatives have stimulated sectoral expansion, the distributive effects of tourism—particularly on income inequality—remain underexplored. In particular, GCC countries have prioritized tourism development in response to rising unemployment rates among their national populations, viewing tourism as a potential solution to this pressing issue [18]. Importantly, in nondemocratic systems, such as those found in the GCC, where decision-making is highly centralized, the role of the state in shaping tourism outcomes and managing inequality is especially pronounced. Political structures may influence whether tourism revenues are redistributed equitably or concentrated in elite-dominated sectors. This study addresses this gap by empirically examining the relationship between tourism development and income distribution in the GCC, using education expenditure as a proxy for income equality.
The present study evaluates the issue of income inequality by examining the impact of tourism on income equality in GCC countries, applying the Kuznets curve framework to quarterly data from 2014Q1 to 2023Q4, based on data availability. The Kuznets curve theory posits that as an economy grows, income inequality initially increases and then decreases after reaching a certain level of economic growth. This inverted U-shaped relationship implies that inequality may rise in the early stages of economic development but will eventually decline as the economy matures and wealth distribution becomes more equitable. By applying this theory to GCC countries, the present study aims to analyze how tourism has influenced income equality in these nations over the specified period.
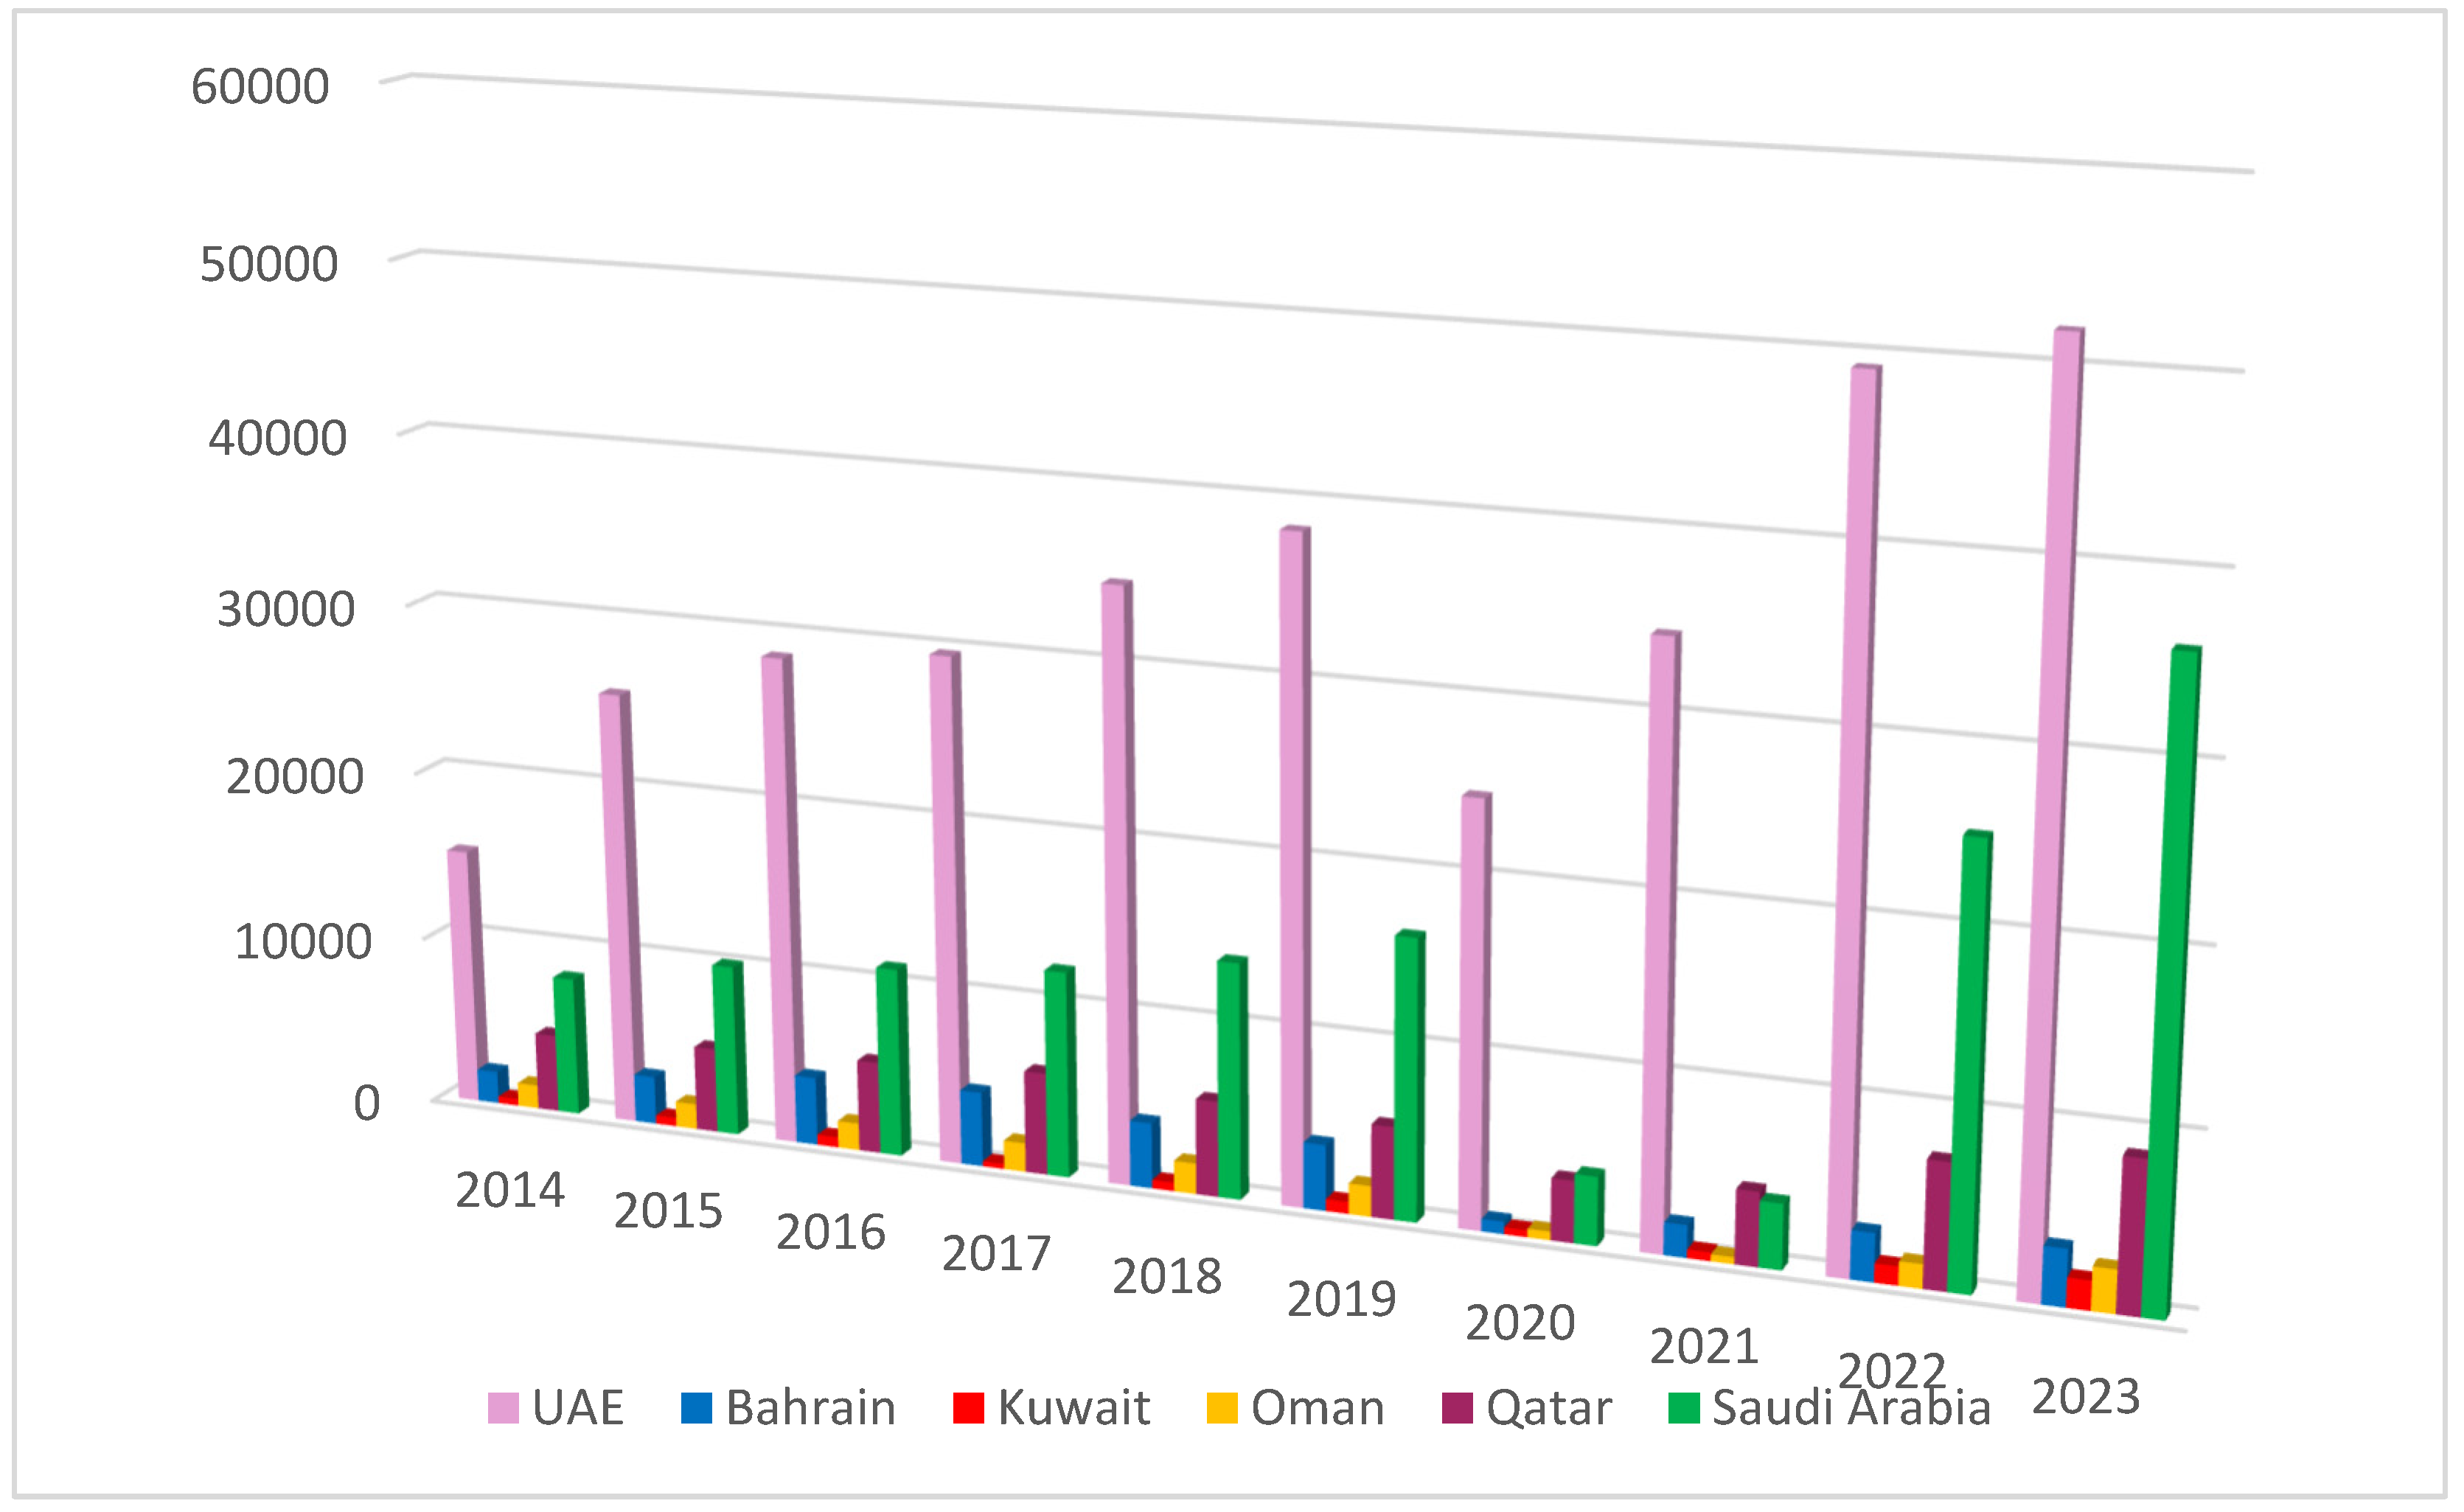
Figure 1 compares the tourism revenues of the six GCC countries from 2014 to 2023 The United Arab Emirates leads the region in tourism revenue, followed by Saudi Arabia and Qatar. The United Arab Emirates recorded its highest tourism revenue in 2019, reaching USD 38 billion, while Saudi Arabia followed with USD 19 billion in the same year. A notable decline in tourism revenues occurred in 2020, likely due to the global pandemic’s impact on the tourism sector.
An important variable that reflects income equality is education expenditure per capita. 
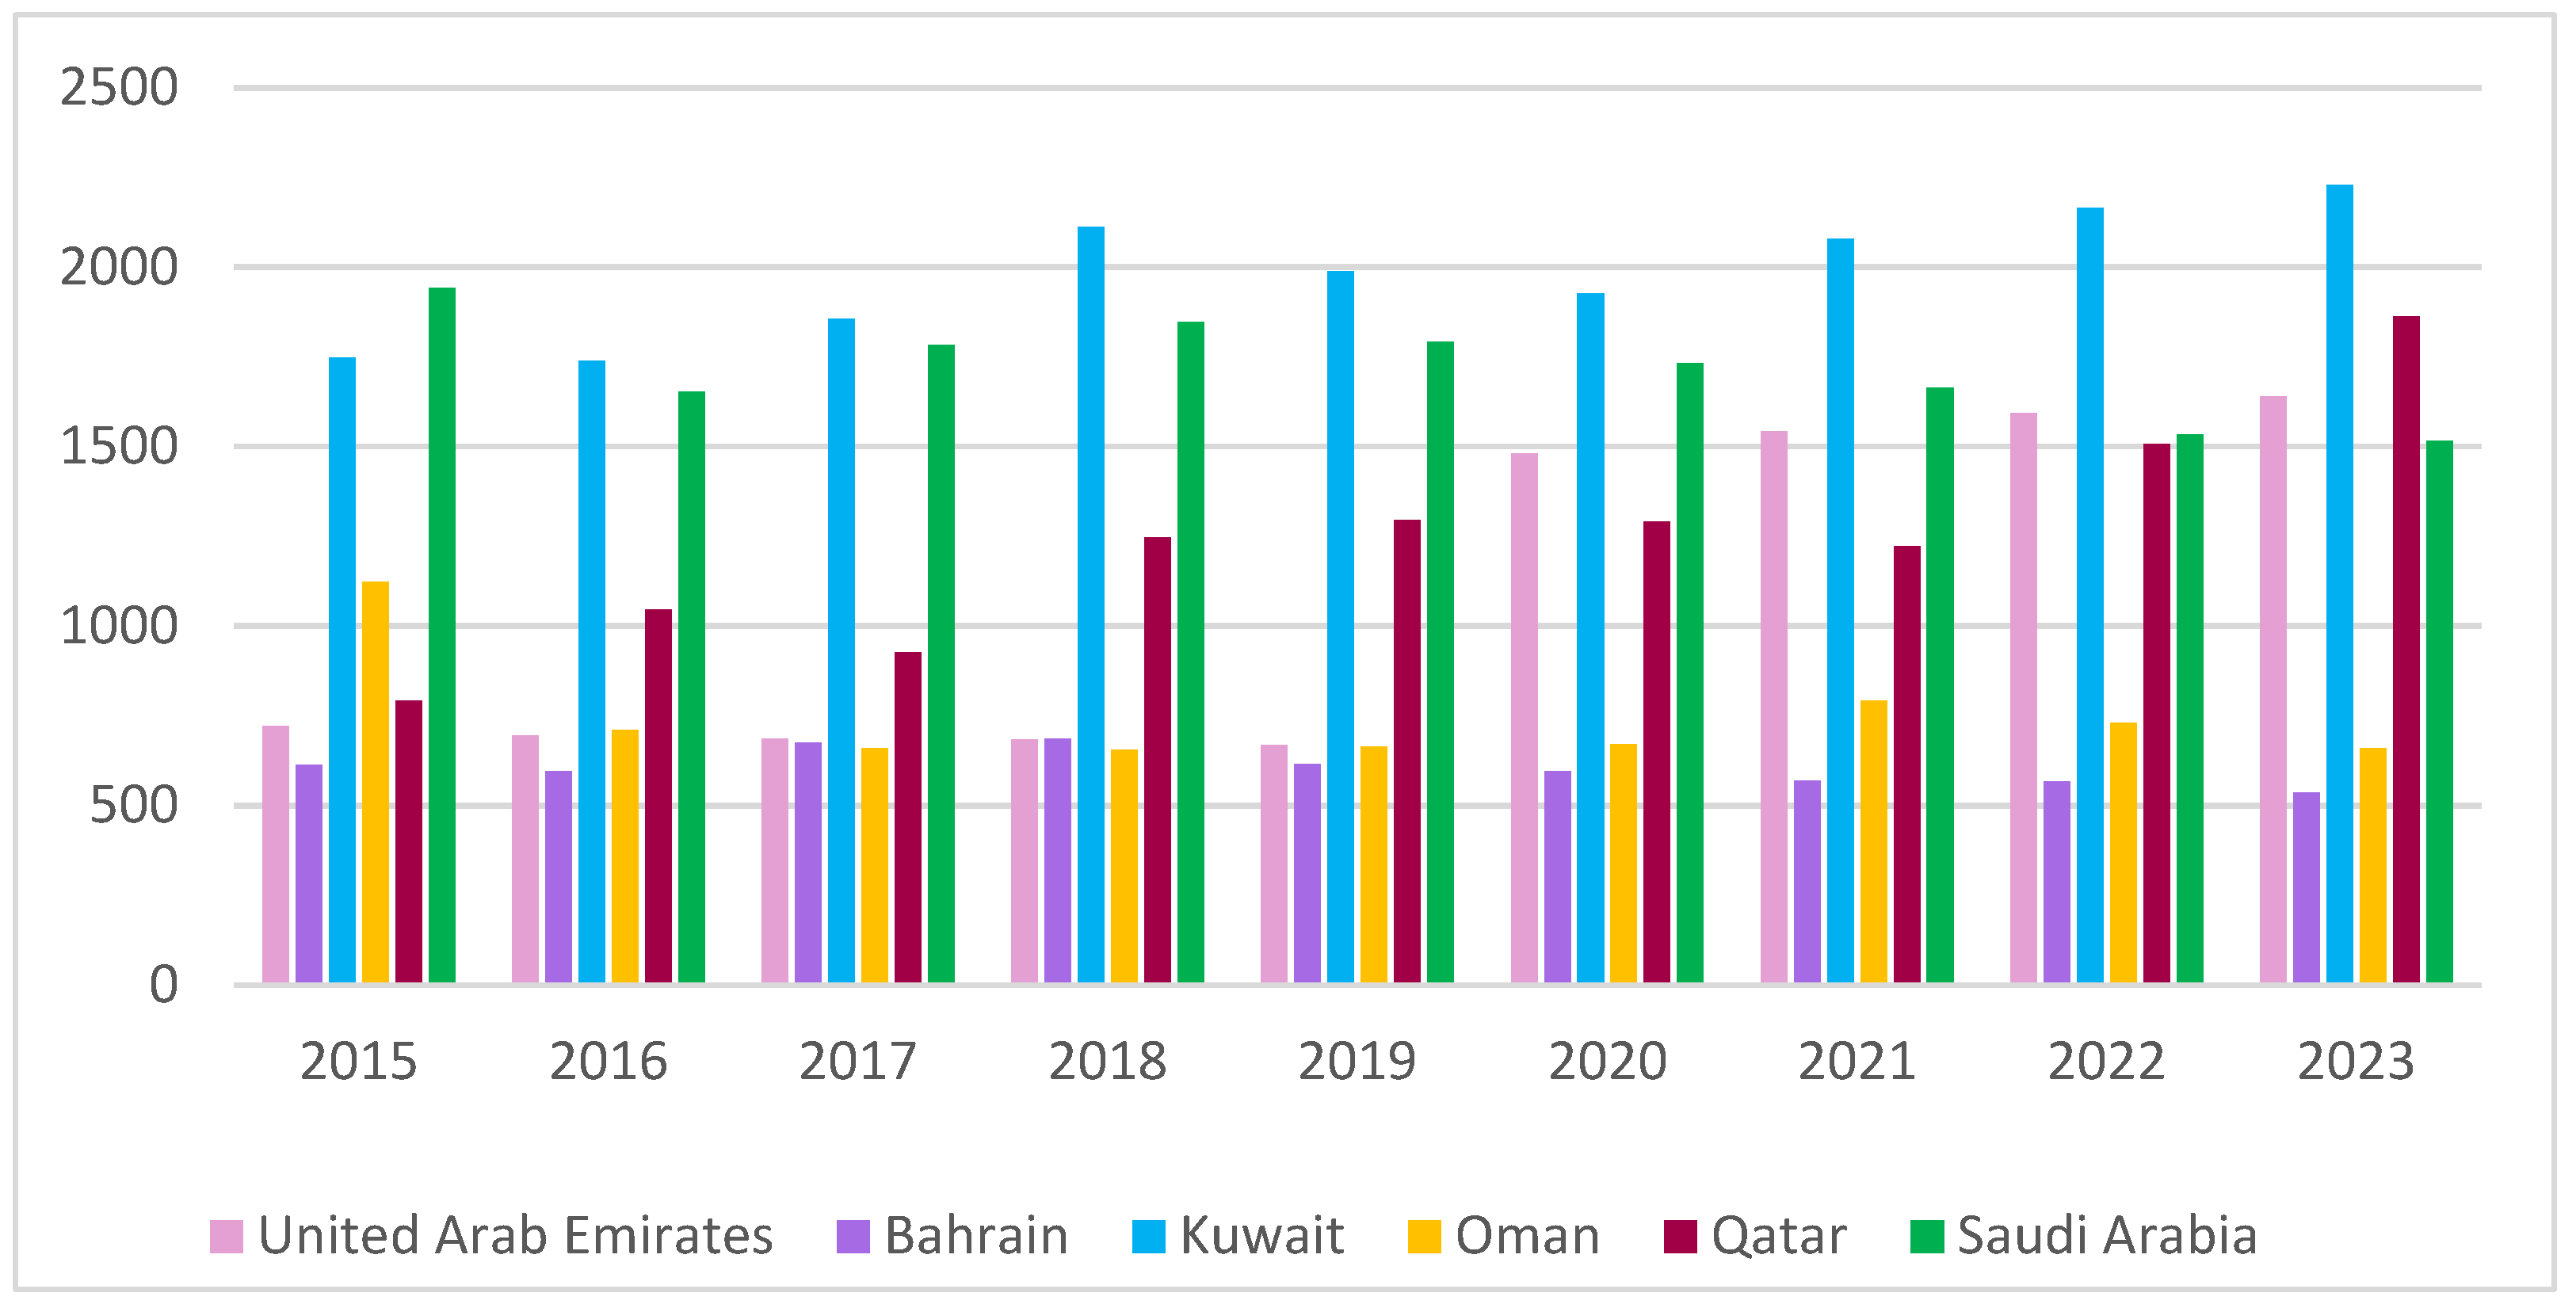
Figure 2 presents the differences in education spending among the studied GCC countries. Saudi Arabia had the highest education spending per capita in 2015, at around USD 1700 per capita. On average, spending on education among the studied GCC countries is approximately USD 1200 per capita.
From 2015 to 2023, Kuwait consistently recorded the highest levels of education expenditure per capita, surpassing USD 2000 in 2023. For Kuwait, the dataset includes both education and training expenditure, as both categories reflect investments in education. This adjustment has improved the measurement of per capita education expenditure compared to the previous data version. Saudi Arabia, while leading in 2015, experienced relatively stable spending levels with a slight upward trend, reaching around USD 1800 in 2023. In contrast, Oman and Bahrain maintained the lowest levels of education expenditure throughout the period, remaining below USD 800 per capita. Qatar showed a steady and significant increase in education spending, particularly after 2019, rising to nearly USD 1800 by 2023, indicating enhanced investment in human capital. The United Arab Emirates also saw a gradual increase, overtaking Saudi Arabia in some years, particularly from 2020 onward. Bahrain’s expenditure remained relatively flat across the entire period, suggesting limited change in fiscal prioritization for education.
These differences highlight the variation in policy emphasis and fiscal capacity across the GCC, with countries like Kuwait and Qatar demonstrating stronger commitments to public education investment. Such disparities may have implications for long-term income equality outcomes and labor market preparedness in the region.
Moreover, the students enrolled in public education accounted for 18.6% of the total GCC population in 2022/2023, underlining the growing importance of education in the region [1].
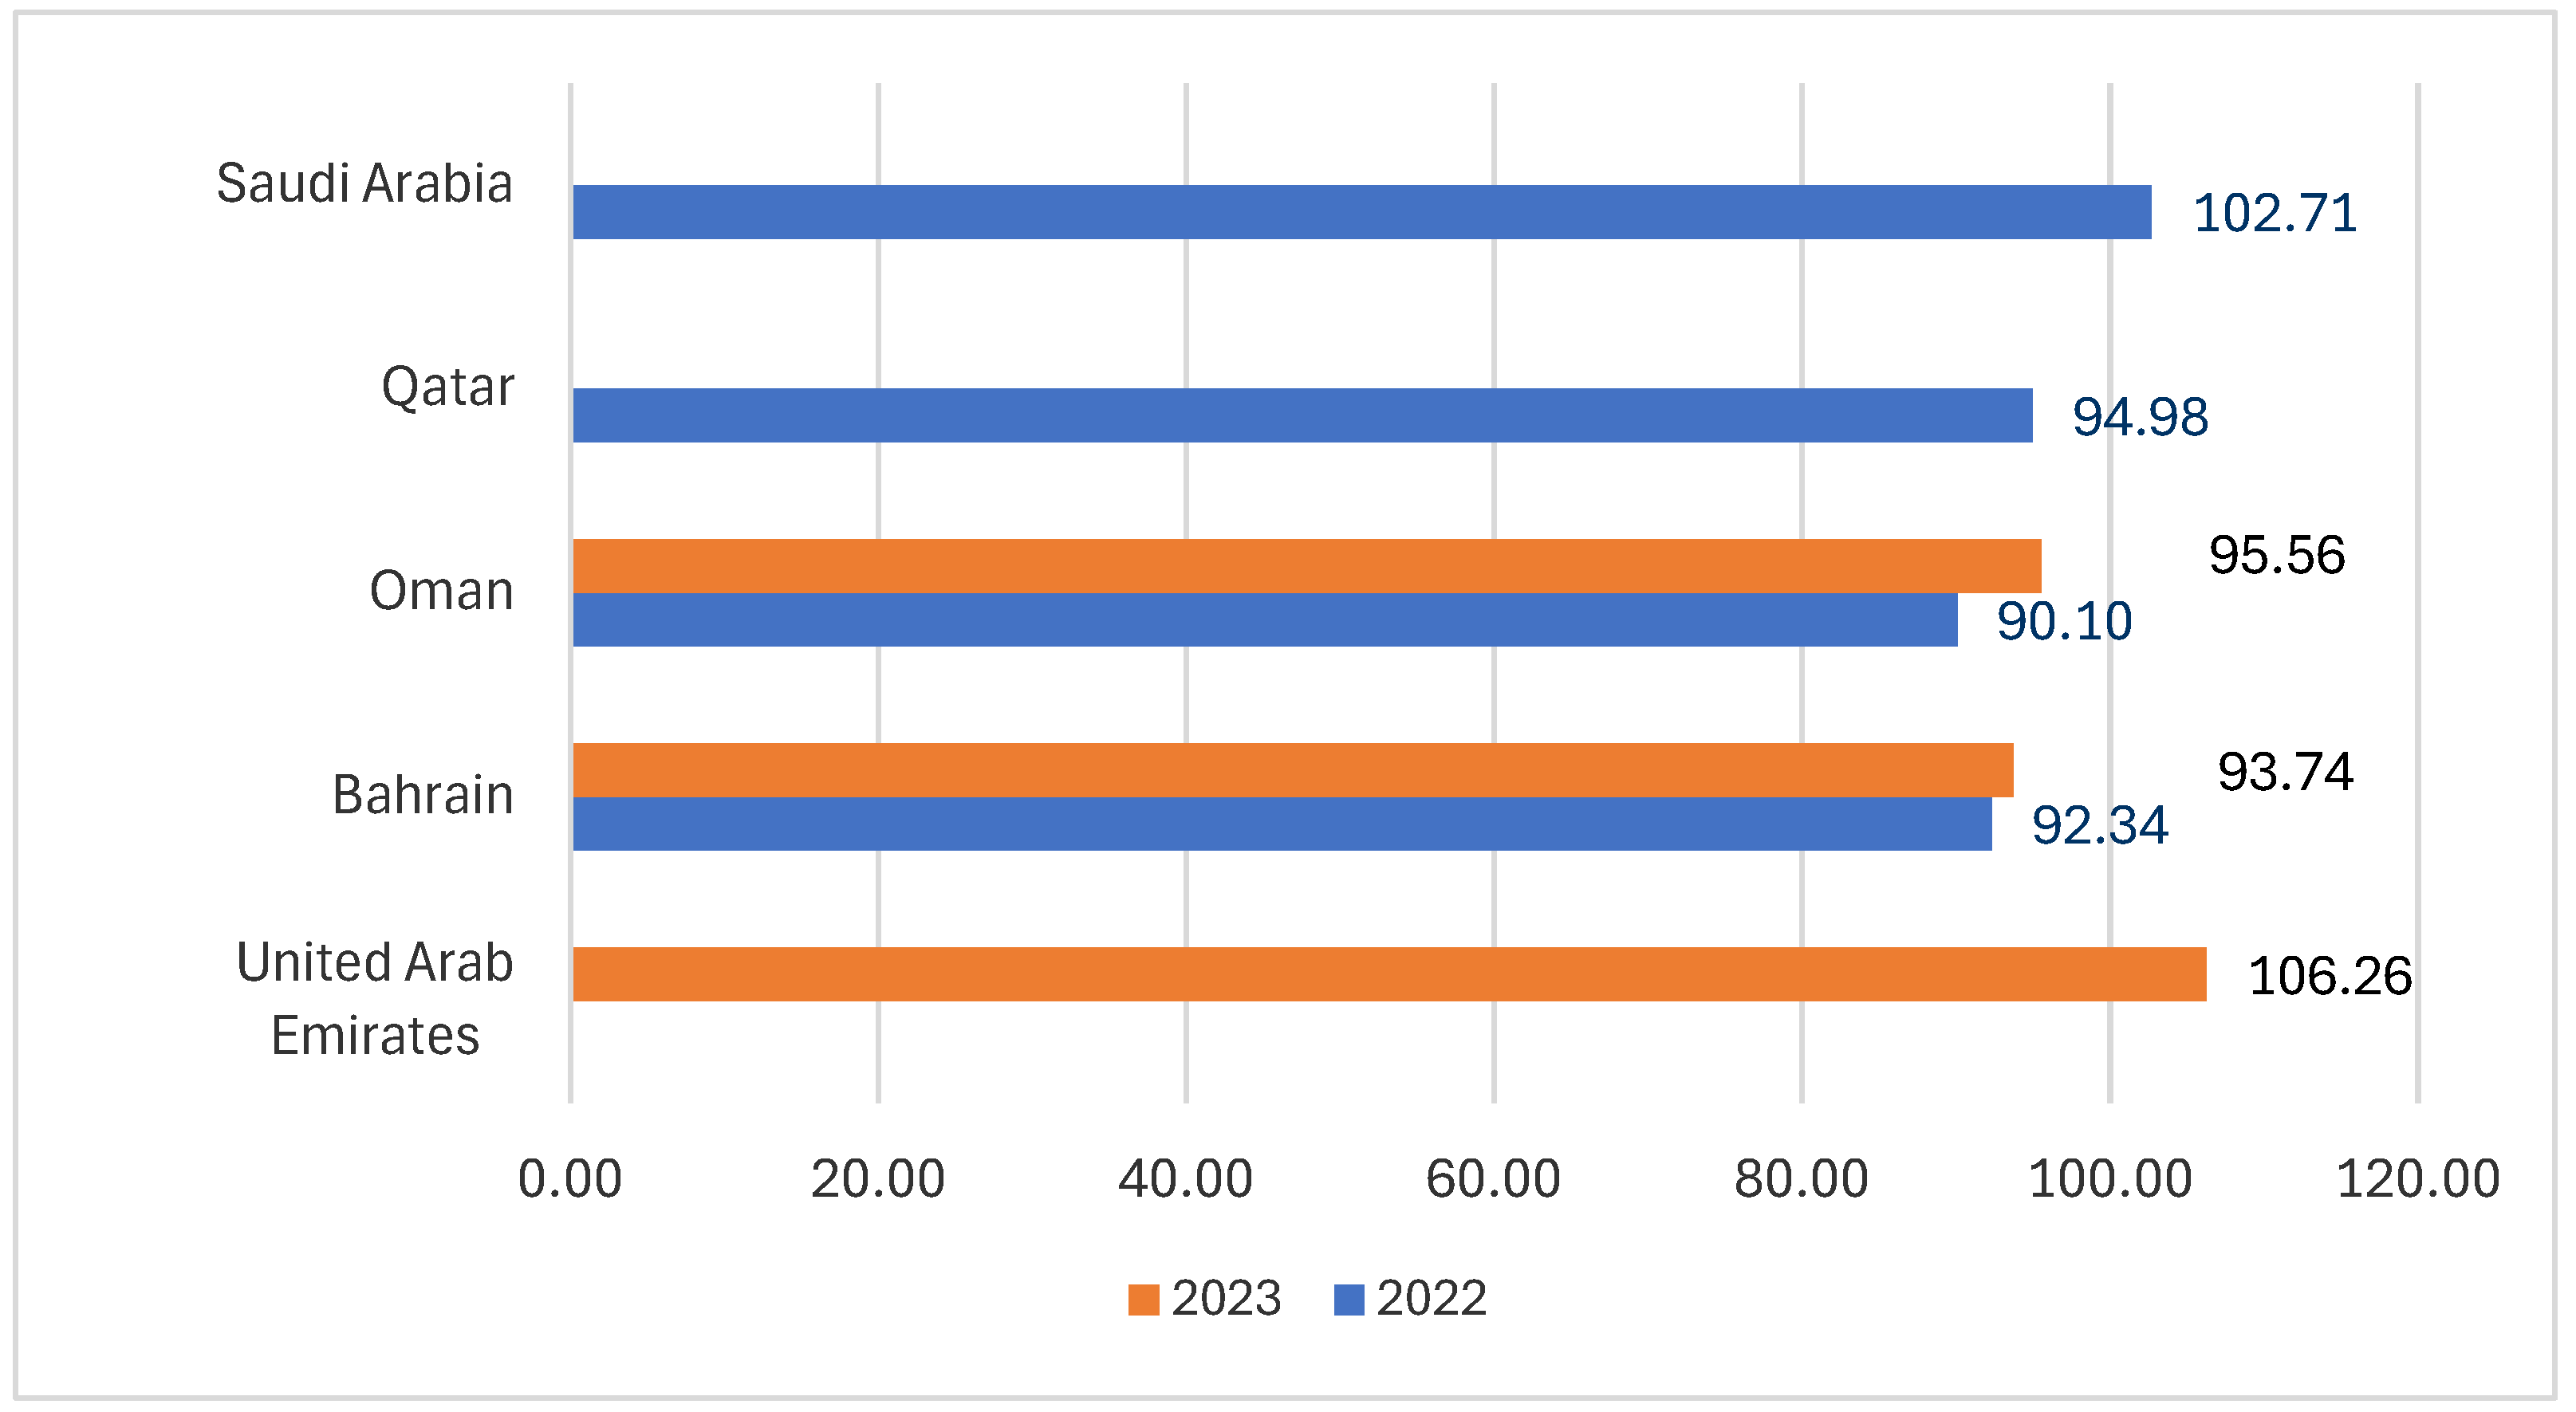
Figure 3 presents the gross enrollment rates in primary education across selected GCC countries, using the most recent available data for each country—2022 or 2023.
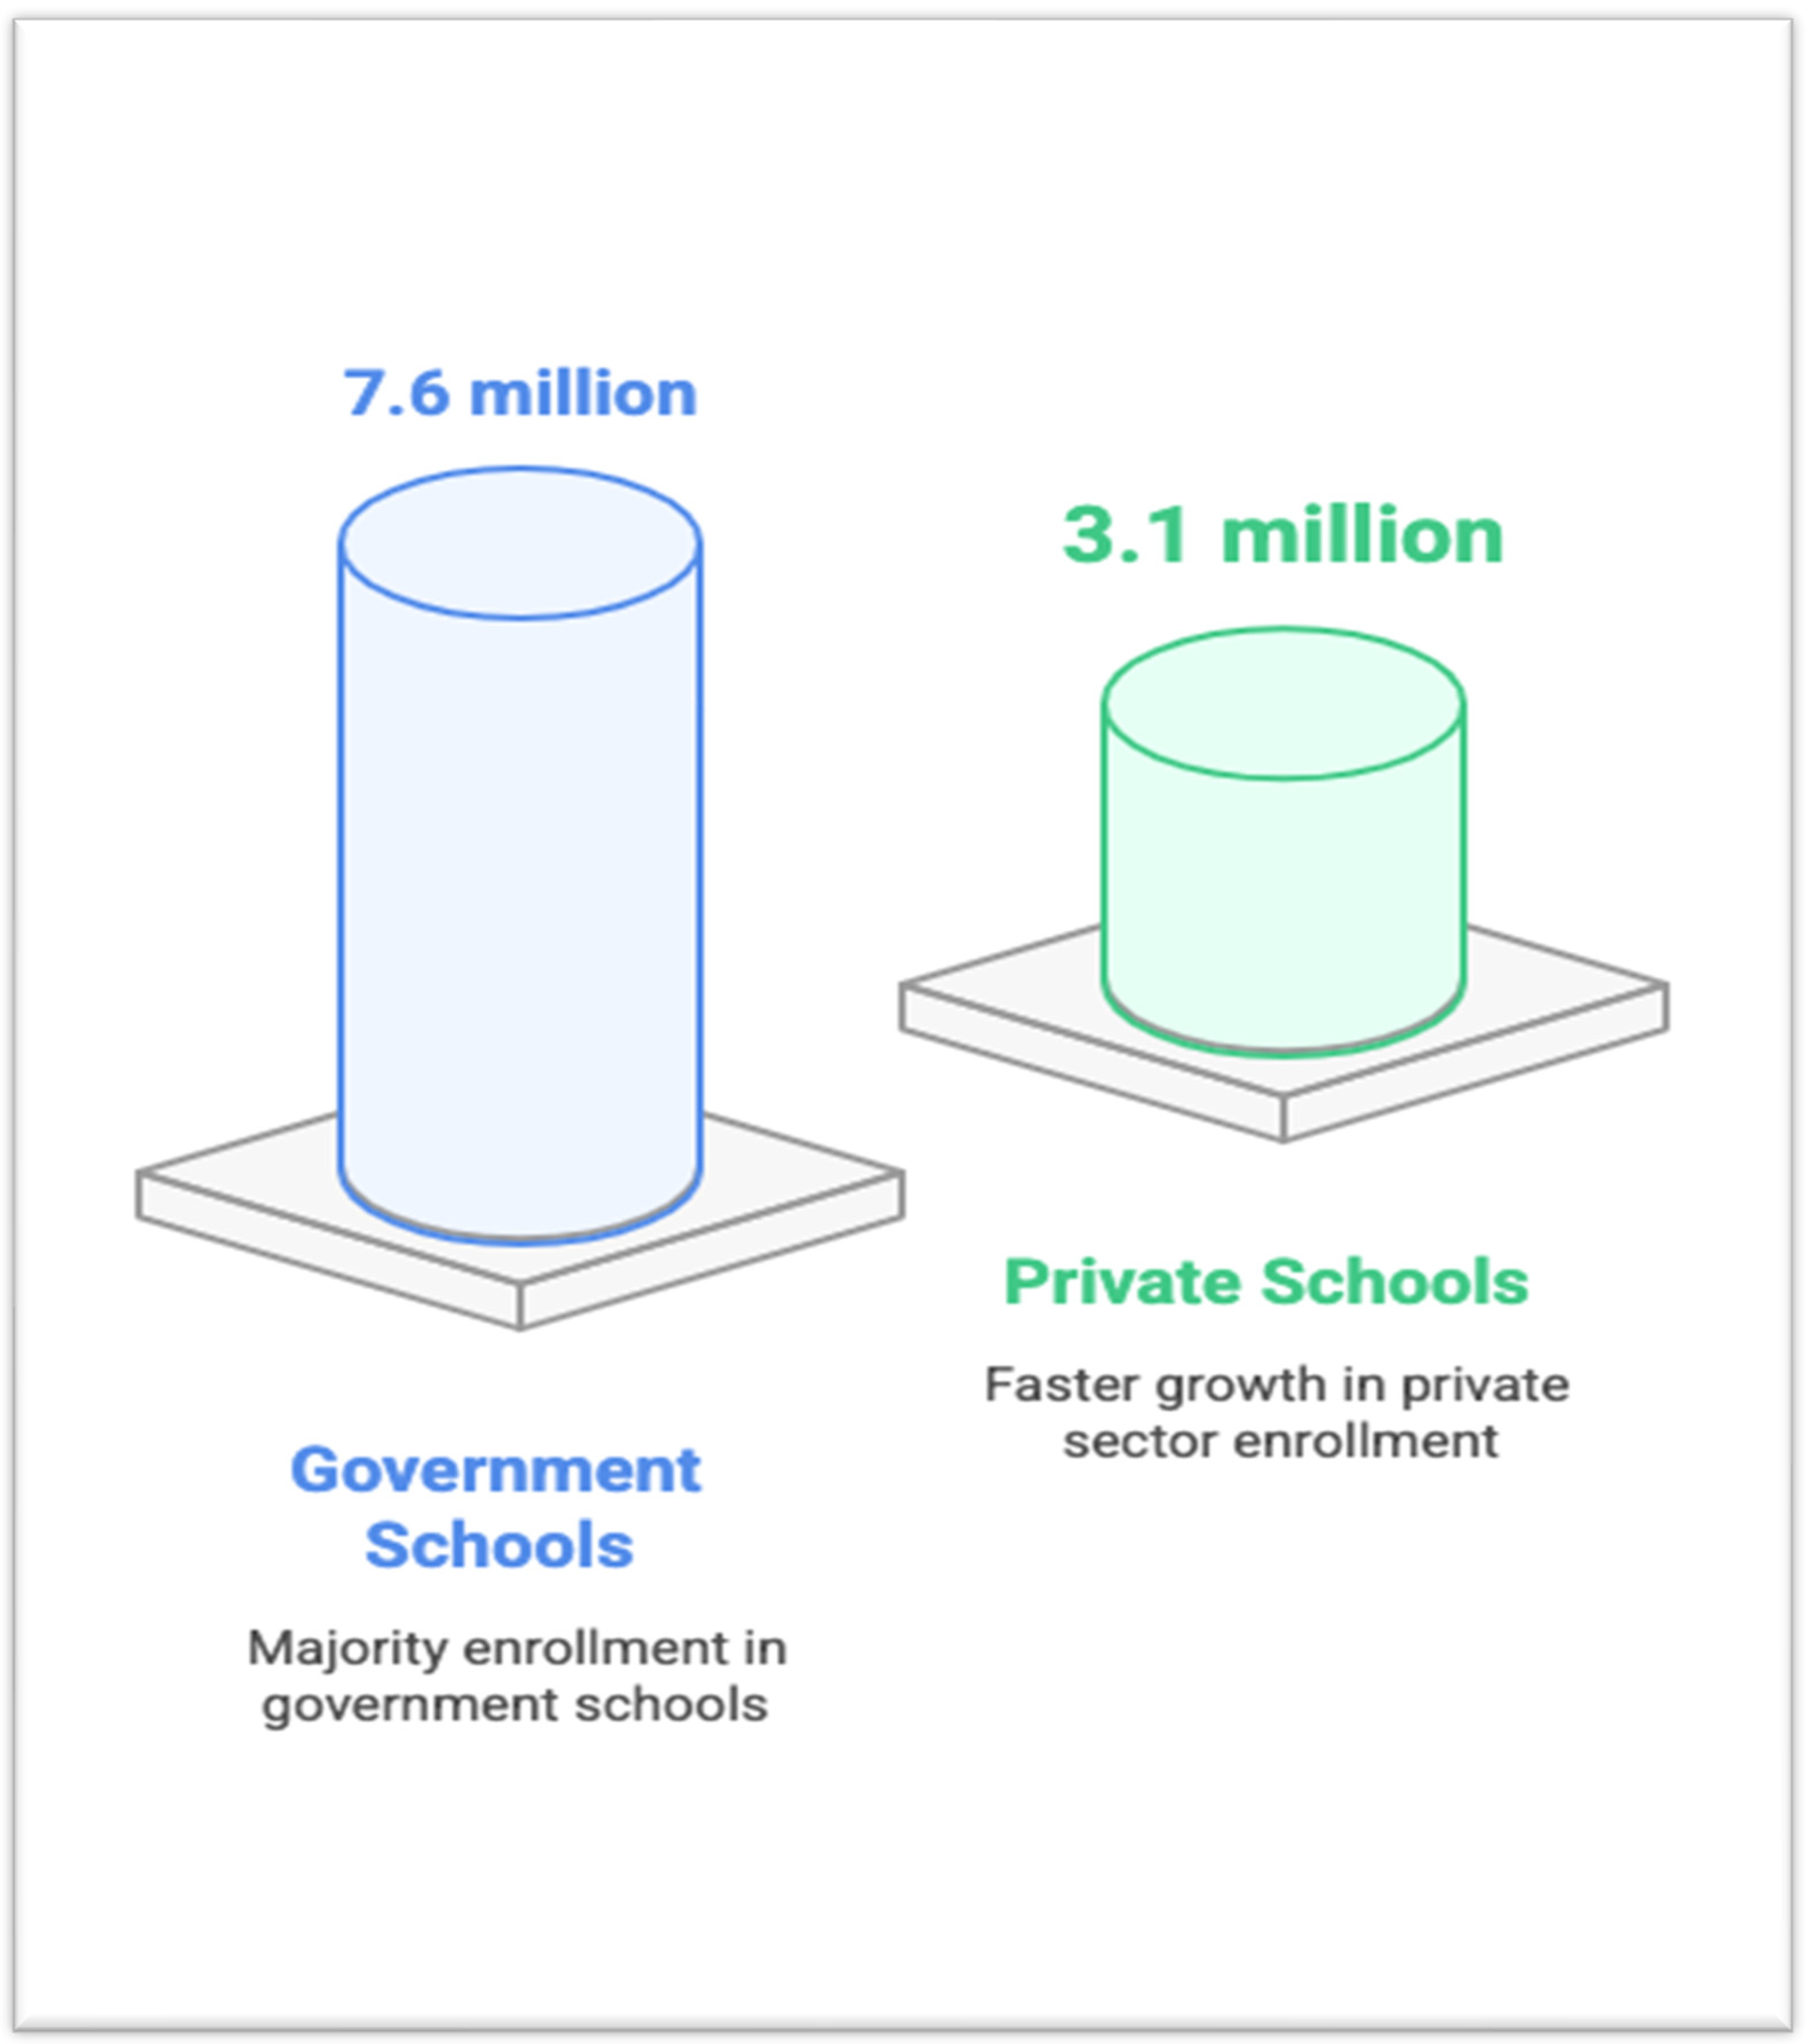
The United Arab Emirates recorded the highest rate at 106.26% in 2023, exceeding 100%. Saudi Arabia followed with 102.71% in 2022, indicating similarly strong educational coverage. Oman and Bahrain showed moderate improvements, with Oman rising from 90.10% in 2022 to 95.56% in 2023, while Bahrain increased slightly from 92.34% to 93.74%. Qatar, which only reported data for 2022, had a rate of 94.98%. Despite the variation in reporting years, the data reflects generally high levels of access to primary education across the region, though performance differs between countries. In terms of student distribution between public and private education institutions, the total number of students in public education across the GCC reached 10.7 million in the 2022/2023 academic year, up from 9.8 million in 2017/2018. Figure 4 shows an average annual growth rate of 0.7% for public education over this period. In contrast, the number of students in private education reached approximately 3.1 million, with an average annual growth rate of 5% during the same period [1].
These data suggest that student enrollment is growing quicker in the private sector than in the public sector. The majority of students in the GCC will remain enrolled in government institutions, accounting for 70.9% of all students in 2022–2023.
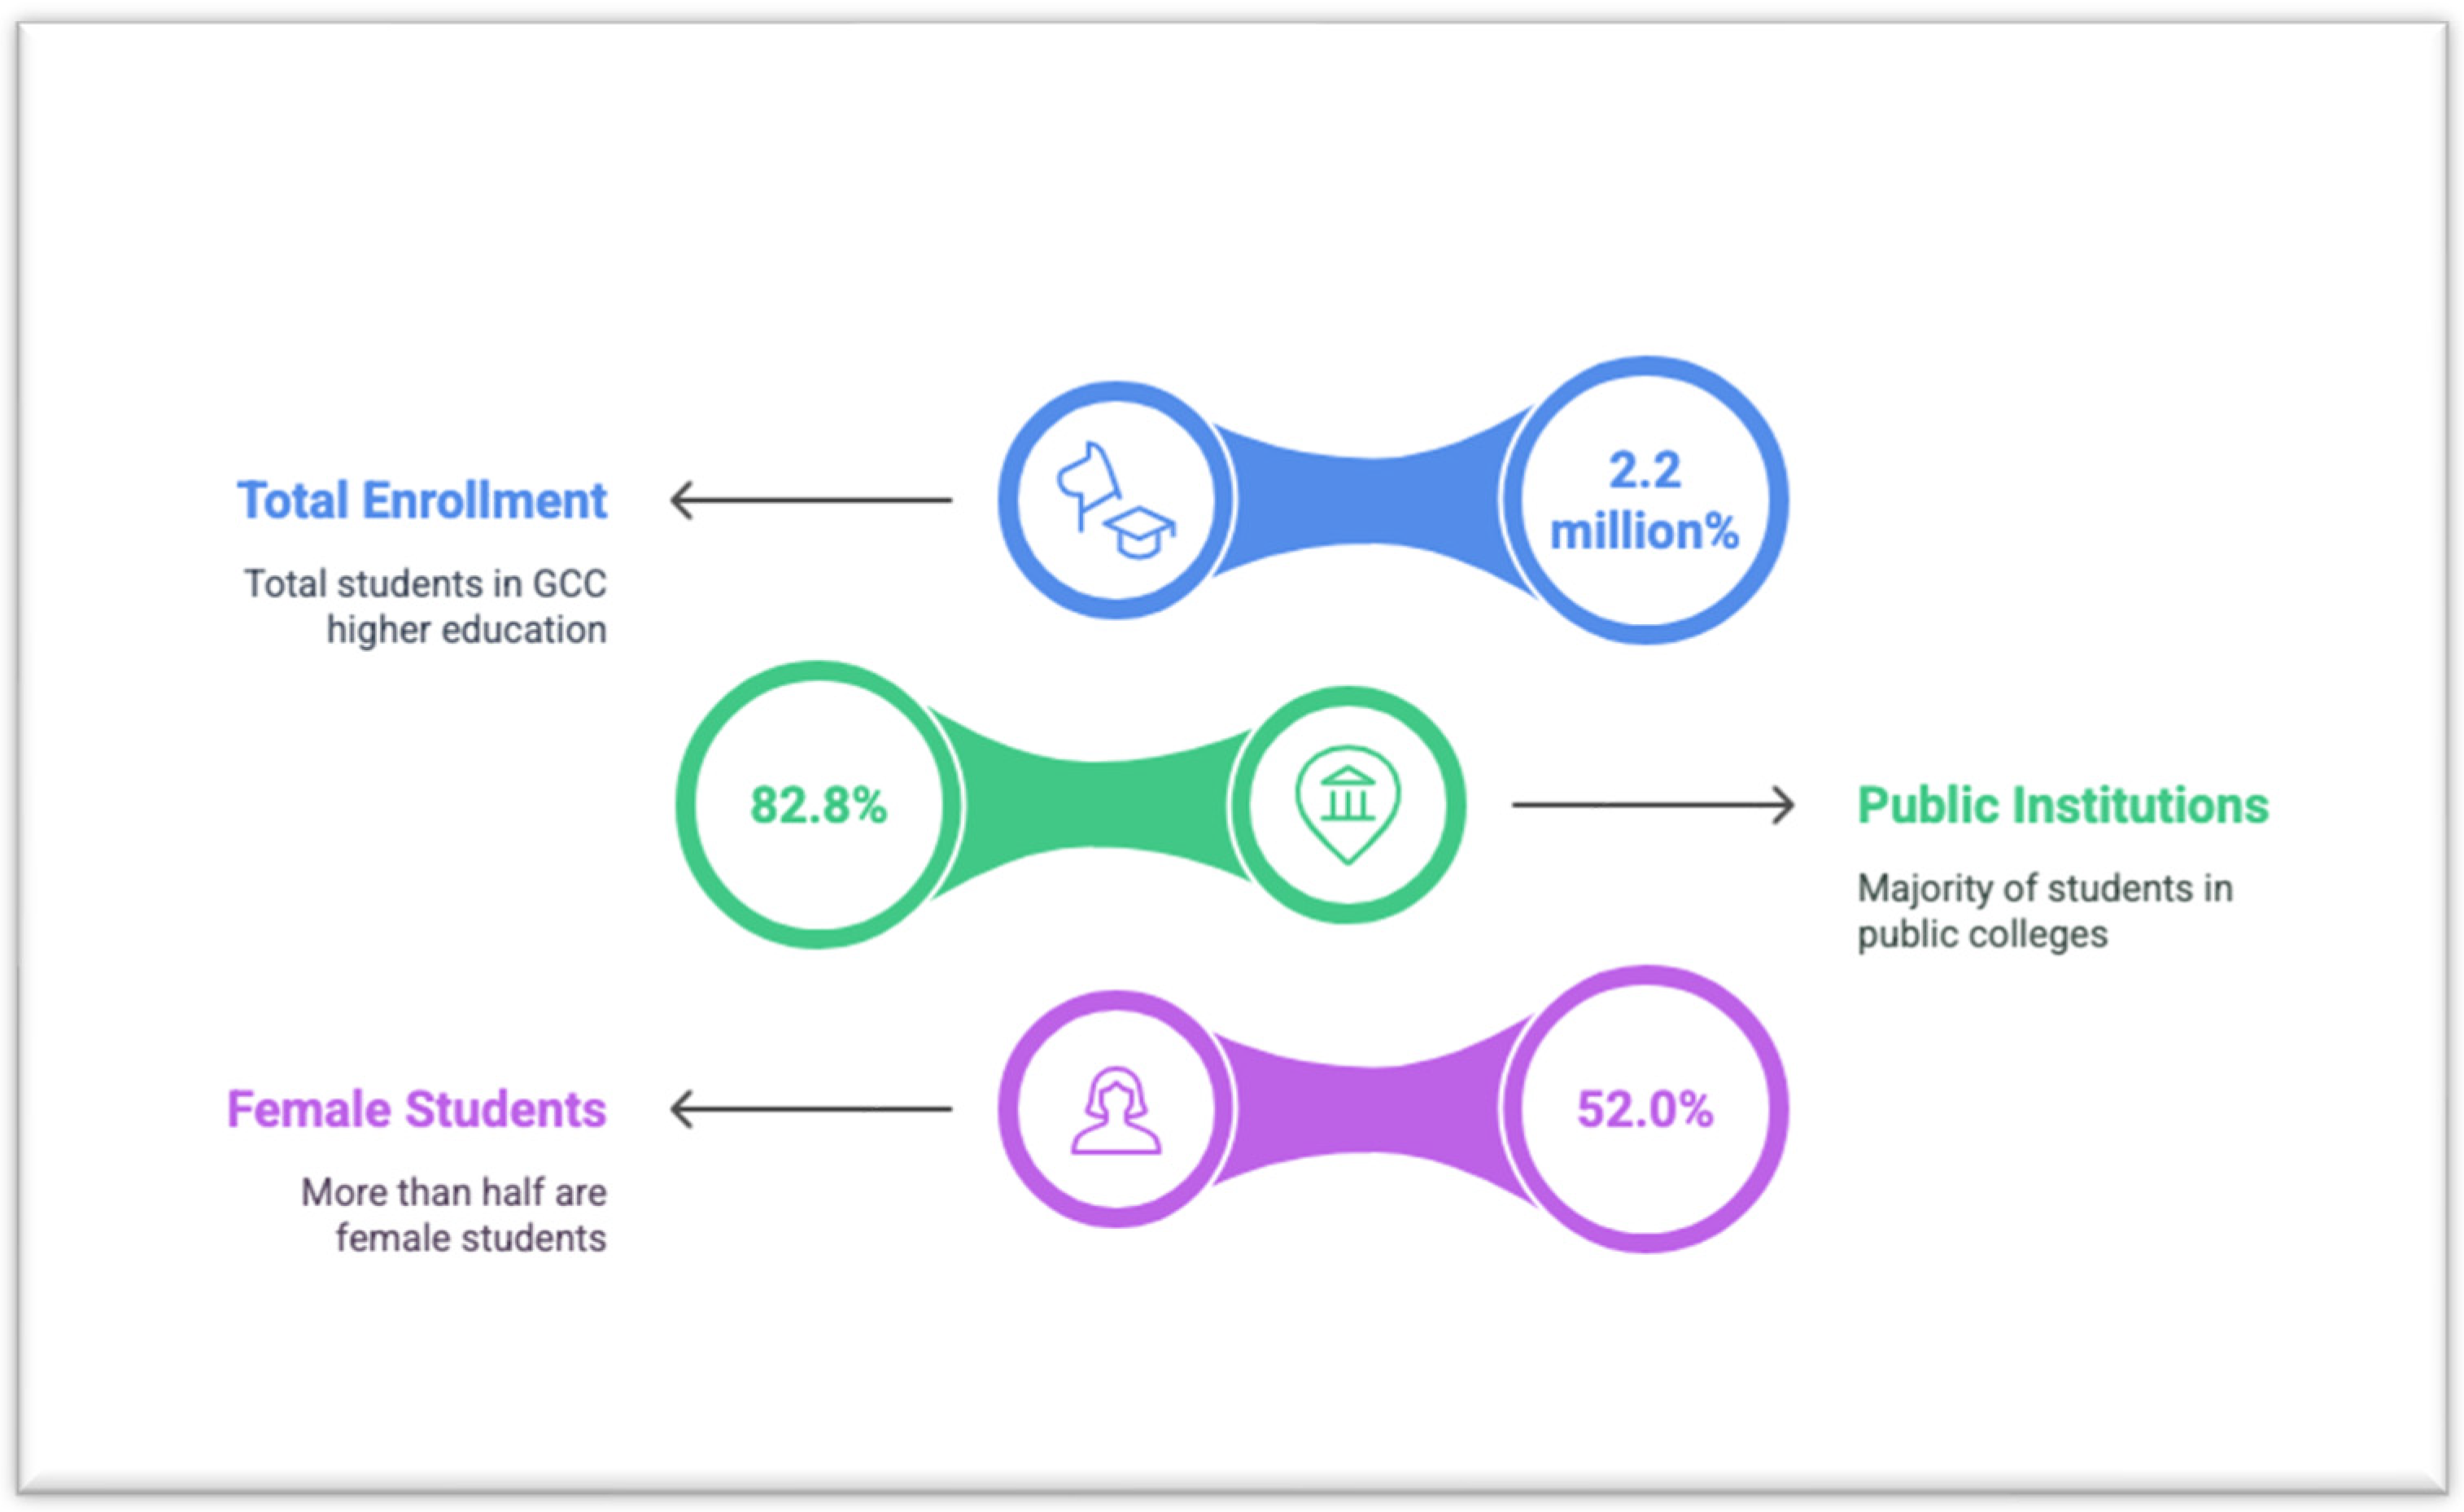
Beyond primary and secondary education, the GCC region has also witnessed steady growth in higher education enrollment. As shown in Figure 5, higher education institutions in the GCC enrolled 2.2 million students in the academic year 2022/2023, rising from 2.0 million students in 2017/2018, reflecting an average annual growth rate of 2.4% over this period. Public institutions enrolled the majority of students and accounted for 82.8% of total enrollment in 2022/2023, while the rest attended private institutions or pursued their studies abroad. Additionally, female students comprised 52.0% of the total enrollment in higher education across the GCC in the same year.
This study will test the existence of the Kuznets hypothesis, as no prior research has specifically tested this hypothesis in the context of the studied GCC countries. This paper uniquely addresses the role of tourism in mitigating income inequality, suggesting that in the early stages of tourism development, the tourism industry may increase income inequality in GCC countries. However, after a certain level of development, increased tourism revenue could reduce income inequality among these countries’ communities. Due to the lack of direct income inequality measurements in GCC nations, education expenditure is employed as a proxy in this study.
Education spending is widely acknowledged as a critical factor in achieving social and economic justice, as increased investment in education improves access to opportunities, reduces income gaps, and promotes long-term economic mobility. In the absence of standard income inequality metrics such as the Gini coefficient or income distribution data, education spending provides a trustworthy alternative, evidence of the government’s attempts to create inclusive growth and equal opportunity. This strategy is consistent with the current literature linking higher education expenditure to increased income equality, making it a viable alternative to direct inequality measures in the GCC context. This paper is structured as follows: First, a review of the relevant literature is presented. Next, the data and methodology used in the analysis are described. The subsequent section discusses the empirical results, and, finally, the paper concludes with a summary of the key findings and implications

2. Literature Review

In this literature review, we explore various dimensions of the relationship between tourism and income inequality, drawing on a diverse range of empirical studies and theoretical perspectives. As tourism has expanded, there has been increasing concern that the benefits of this growth may not be equally distributed among the population, potentially exacerbating income disparities. This review is structured into five main subsections: (1) theoretical perspectives on tourism and inequality, including the Kuznets Curve and human capital theory; (2) empirical evidence on tourism’s impact on income distribution; (3) the role of government policies in shaping equality outcomes; and (4) the context of GCC countries, 5) using education expenditure as proxy for income equality.

2.1. Theoretical Perspectives on Tourism and Inequality

2.1.1. Kuznets Curve

The application of the Kuznets hypothesis to evaluate the impact of tourism revenue on income inequality among countries demonstrates the importance of tourism income in reducing this inequality. However, after a certain point, expanding the tourism sector and increasing the revenue from investment in tourism are posited to have a negative impact on income equality. The existence of the Kuznets curve is confirmed by studies investigating the impact of tourism on income inequality in developing economies [34,35] Similarly, the persistent correlation between tourism revenue and income inequality, as measured by the Gini coefficient, has been investigated among a panel of 41 nations from 1995 to 2016 [36]. These studies find that developed nations exhibit behavior consistent with the Kuznets curve, while developing nations display an inverted Kuznets curve. The relationship between tourism and income inequality follows an inverted U-shaped Kuznets curve, while capital investment in tourism exhibits a negative correlation with income inequality [37]. Furthermore, tourism development is suggested to exhibit feedback causal relationship in both directions.
H1. 
Tourism development affects income equality in two distinct stages of development.

2.1.2. Alternative Theoretical Perspectives on Tourism and Inequality Human Capital Theory

Human capital is frequently cited in the literature as a key mechanism for reducing income disparities among individuals. Educational attainment, as a core component of human capital, significantly influences labor market outcomes and earnings. Governments often view increased public investment in education as a strategic tool to reduce both educational and income inequality. While the importance of education in promoting income equality is widely acknowledged by policymakers and the public alike, theoretical and empirical findings on this relationship remain mixed. Some studies confirm a strong link between higher educational attainment and more equitable income distribution, while others highlight contextual factors that moderate this effect [38]. Moreover, human capital theory posits that investment in people through education, training, and skill development enhances their productivity and earnings potential, thereby contributing to broader economic development and social mobility. This theory is particularly relevant to the tourism sector, which is labor-intensive and service oriented. As tourism expands, it creates demand for a diverse set of competencies, including language proficiency, cultural sensitivity, hospitality services, digital literacy, and managerial expertise. The tourism and hospitality industries rely heavily on human capital and are significantly shaped by the availability and quality of skilled labor [39]. This growing complexity pushes both public and private sectors to invest in education and vocational training to meet the evolving needs of the tourism workforce. Jithendran and Baum [40] emphasize that human resource development (HRD) is central to sustainable tourism, arguing that long-term success in the industry depends on building a professional and locally integrated workforce [40]. This requires structured efforts in capacity building, including formal education, apprenticeships, and continuous upskilling. The World Travel and Tourism Council [41] also highlights that tourism plays a major role in employment generation and has become a catalyst for skill development in many emerging economies, where tourism is often one of the largest employers. Similarly, the UN World Tourism Organization [42] stresses that to achieve inclusive and sustainable tourism growth, governments must align human capital policies with sector-specific demands, particularly in countries where the tourism industry is central to diversification and development strategies.
These perspectives indicate that tourism does not merely consume labor but actively stimulates the development of human capital, especially in countries that prioritize the sector as part of their economic agenda. By fostering skill development and encouraging public investment in education, tourism can serve as a tool for reducing inequality, expanding employment opportunities, and enhancing labor mobility. Thus, integrating human capital theory into the tourism–inequality debate provides a more comprehensive framework for understanding how tourism development can contribute to long-term social and economic outcomes. The growth and diversification of niche tourism markets, such as ecotourism and medical tourism, create additional demand for specialized skills relevant to those sectors [43]. Ultimately, a robust and competitive tourism industry fosters a demand for a well-trained workforce capable of delivering quality services and contributing to a positive visitor experience. In the GCC, where nationalization of the labor force is a key policy priority, the tourism sector plays a critical role in creating employment opportunities for nationals and reducing dependency on expatriate labor [18]. Jithendran and Baum [40] argue that long-term sustainability in tourism requires targeted human resources. Human capital theory illustrates the critical role of investing in education and skill development to enhance productivity in the tourism sector. Meeting the labor demands of this service-oriented industry contributes to broader economic development and social mobility. Language proficiency, cultural sensitivity, and digital literacy are essential competencies that will shape the industry’s future.

2.2. The Empirical Studies of the Relationship Between Tourism and Income Inequality

The literature that emphasizes tourism development’s contribution to income inequality highlights the impact of tourism growth on poverty, the poverty gap, and income inequality for the period from 1995 to 2012, using a panel of 13 tourism-intensive economies [7]. While there is little evidence to suggest that tourism growth reduces headcount poverty, the poverty gap indicator shows that the amount of money required to help the poor escape poverty is significantly reduced when this growth occurs. However, findings based on the Gini coefficient indicate that tourism growth has not led to any measurable improvements in income inequality [7]. The Gini coefficient measures income inequality within a population, where values close to zero indicate greater equality, while values near one represent higher income inequality [43].
On the other hand, some scholars have illustrated the significant impact of tourism on reducing income inequality by examining the top countries in terms of income equality from 2001 to 2016. Findings suggest that tourism is one of the major drivers of income equality, and policymakers should support the tourism industry to reduce income disparity and enhance income distribution [3]. Additionally, both domestic and international tourism mitigate income inequality, contributing to more inclusive economic growth [35]. Meanwhile, national tourism necessitates institutional changes; comparing developed and developing countries, they find that the influence of tourism on income inequality is negative and significant in developing economies but not significant in developed economies [2]. Furthermore, a dynamic panel data analysis and a panel vector autoregressive error correction model have been employed to investigate the correlation between tourism development and income inequality, showing that tourism can contribute to a reduction in income inequality, particularly in developing economies that are heavily reliant on tourism [36]. This effect is more pronounced in developing economies than in developed economies.
The impact of tourism on poverty reduction and income distribution equality in the Dominican Republic appears to be negligible [44]. A review of 12 econometric studies establishes that tourism has a substantial impact on income inequality, with the effects moderated by economic growth and trade openness [6]. Finally, the effect of tourism on income inequality remains unclear [38].
A related discussion emerges in the context of the informal economy, an increasingly significant component of global tourism that introduces new equity challenges. Although it promotes access and participation, studies reveal sharp disparities in revenue distribution within platforms like Airbnb, where just 10% of hosts earn nearly 50% of the total income [45]. Gender and racial inequalities are also evident, with Black and female hosts consistently earning less than their White and male counterparts.
This growing concentration of income undermines the initial promise of the sharing economy as a pathway to inclusive development. Temporary regulatory responses have yet to resolve these structural disparities [46].
The relationship between education and income equality remains complex and differs across countries and social groups. Some studies find that higher levels of educational attainment and a more even distribution of education reduce income inequality [47], while others observe a positive link between education and inequality in both high- and low-income countries, but a negative link in middle-income countries [48]. Dynamic panel estimates show a strong positive association between educational inequality and income inequality, particularly in developing countries and older age cohorts [49]. However, younger generations who achieve higher levels of education tend to experience lower levels of economic inequality. Policy simulations suggest that expanding access to education continues to reduce inequality, although this effect may weaken as countries advance economically. Targeting disparities in educational quality could further strengthen this impact [49].
H2. 
Tourism development mitigates income equality.

2.3. Education Expenditure and Income Inequality Proxy

The relationship between education spending and income inequality has been examined across various countries, with most studies supporting the role of education in reducing inequality. For example, Seefeldt [50] presents evidence from the United States, indicating that increased investment in education can help narrow income disparities. Similarly, a panel data analysis covering a wide range of countries from 1960 to 1990 offers strong empirical support for the connection between education and income distribution. The findings suggest that higher educational attainment and a more equitable distribution of education significantly contribute to a more equal income distribution, while also supporting the Kuznets inverted-U curve, which describes the nonlinear relationship between income levels and inequality [47]. Although the relationship between education and income inequality is complex, several studies indicate that public education expenditures can reduce income disparities and support long-term economic development. Numerous studies have reported a negative correlation between public education spending and wealth inequality, implying that higher public investment in education is associated with more equitable income outcomes [47,51]. However, a contrasting view presents a U-shaped relationship between inequality and education spending, suggesting that the effect may vary depending on the stage of development [52]. Importantly, while private education spending has a limited impact on reducing inequality, public education expenditure has been found to improve skill levels across different socioeconomic groups [51].
The effectiveness of education spending in reducing inequality varies across studies. Some find the effect to be relatively inelastic [53], while others highlight its potential to reduce disparities significantly [54]. All things considered, the literature generally supports a negative association between education spending and the Gini coefficient. For instance, one European study finds that a 1% increase in education spending reduces the Gini coefficient by 0.22%, indicating that investment in education contributes to a more equitable income distribution [35]. Similarly, in the United States, rising public education expenditure is negatively correlated with Gini scores, suggesting that such investment improves access to opportunities and reduces inequality over time [55]. Additionally, if more people get access to education, the gap between the rich and poor becomes smaller. Meanwhile, government spending on education helps make access to education more equal [38].
However, some factors make inequality worse. These include high per capita income, more trade with other countries, and fast technological change—because these often benefit people who are already more educated or wealthier. In the case of East Asia, this study suggests that fast economic growth and globalization have increased income inequality, even though access to education has improved. Due to the unavailability of the Gini coefficient and the lack of reliable and consistent income distribution data in GCC countries, the direct use of the Gini coefficient is not feasible. In this context, government education expenditures may serve as a practical proxy for income equality. Although it does not directly measure income distribution, it reflects the country’s redistributive priorities and long-term investment in human capital. Increased public education spending is often linked to broader access to school and skill acquisition, particularly among lower-income groups, thereby potentially reducing future inequality [56]. Educational attainment strongly influences wages, and disparities in education are a known driver of income inequality [57]. In the GCC, where labor markets are segmented between the public and private sectors and heavily reliant on expatriate labor, expanding access to quality education for nationals is a strategic policy tool to enhance productivity and promote income mobility. Therefore, although education expenditure is not a perfect substitute for direct inequality measures, it remains a useful and theoretically grounded indicator of inequality trends, especially in data-constrained environments such as the GCC.
H3. 
Investing in human capital through increased government spending on education reduces income inequality.

2.4. Government Policies and Equality

Government policies aimed at economic development often carry significant implications for social equity. In tourism-dependent economies, where income distribution and access to opportunities remain uneven, understanding how public policy shapes equality is essential. Sang Yoon Lee and Ananth Seshadri [58] examine how economic policies affect equality of opportunity (EOP) and find that, while education subsidies may reduce some forms of inequality, they have limited impact on EOP when intergenerational investment in human capital is undervalued. This highlights the importance of redistributive strategies that extend beyond short-term interventions and address deeper structural barriers. Another critical dimension of equitable policy design is the influence of social justice movements. Research by Nugraha and Lubis [59] demonstrates how these movements play a vital role in promoting community empowerment and shaping inclusive policy frameworks. In Indonesia, for instance, civic activism has contributed to reforms aimed at improving conditions for marginalized groups, reflecting the power of grassroots engagement in driving responsive governance.
Beyond influencing policy content, social justice movements contribute to broader debates on governance, accountability, and citizenship. By mobilizing communities to assert their rights, they promote more inclusive and participatory policymaking processes that reflect a diversity of social and economic realities. Additionally, in terms of their impact, whether direct or indirect, governance efficiency plays a critical role in promoting equality. Efficient public governance is closely linked to macroeconomic stability, which can indirectly influence income distribution and social equity. At the same time, effective governance relies on societal support, yet such cooperation is difficult to achieve under conditions of ineffective governance. This dynamic points to a cyclical relationship between governance efficiency and social equality, where each reinforces or undermines the other [52].
H4. 
Government policies influence income distribution.

2.5. GCC Countries

The tourism sector has emerged as a crucial element for economic diversification in GCC countries, transitioning from traditional reliance on oil and gas to sustainable growth. This sector’s development is supported by government initiatives, infrastructure investment, and cultural promotion. GCC nations, namely Saudi Arabia, United Arab Emirates, Qatar, Kuwait, Oman, and Bahrain, have implemented comprehensive national tourism strategies aimed at attracting international visitors and enhancing local tourism. These strategies include specific targets for hotel capacity, number of visitors, and workforce development by 2030 or 2040 for Oman [60]. The United Arab Emirates and Saudi Arabia lead in terms of tourism contributions, but others are keen on increasing their market share. Investment in modern infrastructure, such as airports, hotels, and leisure facilities, supports tourism growth. Such developments have aided recovery post-COVID-19, with countries making ambitious growth plans despite challenges like extreme weather [60]. Research indicates that while tourism expenditures positively influence sector growth, the causal relationship between tourism and overall economic growth varies by country. However, in some cases, such as Kuwait and Saudi Arabia, economic growth is primarily driving tourism expansion, suggesting that these economies are investing in tourism as a growth strategy rather than purely relying on tourism to boost their economies.
Over the last ten years, all GCC nations have made significant efforts to support investments in the tourism sector, including the expansion of hotel infrastructure—a trend that began in the late 1980s [18]. The GCC countries are relatively new to the global tourism sector, notably in leisure, business, sports, and adventure tourism. As a result, they are progressively becoming popular global travel destinations. However, the sector’s growth is hindered by increasing dependence on foreign labor and other socioeconomic barriers [18]. Despite these challenges, GCC countries are actively pursuing tourism as a viable alternative to oil-based economies, with governments playing a crucial role in shaping tourism policies and destination management [51,56].
Ministries, development commissions, and sovereign wealth funds are in charge of planning, promotion, and investment. These governments invest in large-scale projects and infrastructure development as part of broader economic diversification efforts. Meanwhile, the private sector focuses on providing services, such as hotels, transportation, and events. For example, in Saudi Arabia, the Ministry of Tourism and the Public Investment Fund are spearheading efforts to integrate tourism as a central pillar of the country’s post-oil economy under the Vision 2030 framework. Across the area, governments regard tourism as a critical sector, linking it to national branding, job generation, and competitiveness. Religious tourism, particularly Hajj and Umrah, continues to be a significant source of revenue in Saudi Arabia, attracting millions of travelers each year. These pilgrimages have a significant impact on the urban development and local economics of Mecca and Medina, demonstrating the close relationship between tourism, religion, and national planning.
In 2015, GCC countries committed to the UN Sustainable Development Goal 4, which gives inclusive, high-quality education top priority on their national agendas. In response, they enhanced regulatory frameworks and institutional structures to strengthen their education systems. National committees were established to align development plans and strategies with SDG targets, while dedicated funding was allocated to support implementation. Additionally, monitoring mechanisms and public awareness initiatives were introduced to promote research, innovation, and community engagement in advancing educational outcomes [18]. Building on these national development priorities, Gulf countries such as Saudi Arabia, Qatar, the UAE, and Bahrain have also strategically used international events—including the FIFA World Cup, Expo 2020, Formula 1 races, and major conferences—to advance tourism development and economic diversification. In Saudi Arabia, these efforts are closely tied to Vision 2030 and supported by Giga projects such as NEOM, Qiddiya, and the Red Sea Project, which aim to transform the Kingdom into a global tourism hub. These initiatives have promoted infrastructure expansion, enhanced global visibility, and contributed to increasing the non-oil share of GDP by fostering leisure, sports, and business tourism [41,60,61,62,63,64,65].
The relationship between tourism and inequality in the GCC remains unexplored in the current research. Mansfeld and Winckler [18] demonstrate that tourism enhances the demand for foreign labor and reinforces divisions within the labor market. Domestic workers are occupied in high-wage positions, and foreign laborers are employed in lower-paid roles. Zmami and Ben-Salha [66] conclude that Saudi Arabia and Kuwait have a positive impact on job creation in tourism, whereas Oman and the United Arab Emirates exhibit weaker or negative effects.

3. Materials and Methods

To evaluate the link between tourism development and income equality in GCC countries from 2014Q1 to 2020Q4 using panel data, the present study uses education expenditure as a proxy for income equality, following the methods of other scholars [67,68]. Additionally, other factors such as foreign direct investment (FDI), trade openness, and income are considered to potentially account for this relationship [35,37,69]. To evaluate the existence of the Kuznets curve, the square of the tourism revenue variable is used to estimate the impact of tourism revenue on income equality [70].
E D U i t = β 1 + β 2 i T O U i t + β 3 i T O U i t 2 + β 4 i F D I i t + β 5 i T R A V i t + β 6 i G I i t + ϵ i t
In the given model, t denotes time, and i represents the studied countries, which include the United Arab Emirates, Bahrain, Oman, Kuwait, Qatar, and Saudi Arabia. This model illustrates the relationship between tourism and income inequality according to the Kuznets curve theory. This theory posits that in the early stages of tourism development, income inequality increases due to a lack of skilled individuals and the fact that most workers are not sufficiently educated. As these workers improve their skills, they enter the market and secure jobs, leading to a decline in income inequality during the second stage of development. This progression represents the inverse U-shaped relationship predicted by the Kuznets curve theory. The present study uses expenditure on education as a proxy for income equality because public education spending can help lower income inequality by offering equal learning opportunities, thereby distributing human capital and income more fairly and increasing income equality [38,50,52]. Table 1 outlines the variables of the present study.
The dependent variable is education expenditure, which serves as a proxy for income equality [52,71]. An increase in education expenditure indicates a decline in income inequality, and vice versa. The independent variables include tourism revenue (TOU), the squared term of tourism revenue ( T O U 2 ) in current US dollars, the number of international tourist arrivals (TRAV), government effectiveness (GI), and FDI.
This study uses data from multiple official sources. Tourism revenue and the governance index were obtained from the World Bank’s World Development Indicators. Education expenditure was sourced from the ministries of finance in the respective GCC countries. FDI data were collected from the United Nations Conference on Trade and Development (UNCTAD). The number of international tourist arrivals was obtained from the United Nations World Tourism Organization (UNWTO). All variables were transformed into natural logarithms, except for the governance index. It remains in its original scale because it is a bonded, composite score that does not follow a ratio scale, making logarithmic transformation inappropriate.
In empirical economic and financial research, panel data techniques provide a powerful framework for examining dynamic relationships across both cross-sectional and time series dimensions. This study utilizes a cross-sectionally augmented autoregressive distributed lag (CS-ARDL) model to investigate the underlying relationships within the dataset. This approach helps account for unobserved heterogeneity, dynamic adjustments, and long-run equilibrium relationships, ensuring a thorough and reliable econometric analysis.
A panel ARDL model is used to capture both short-run dynamics and long-run relationships within the panel structure, making it especially relevant for macroeconomic and financial studies, where variables may be nonstationary but cointegrated over time [72]. Lastly, the CS-ARDL model is applied to address cross-sectional dependence (CSD), which is a crucial factor when working with panel data involving globally or regionally interconnected entities [73].
By incorporating these methodologies, this study ensures robust empirical analysis while effectively addressing heterogeneity, endogeneity, and dynamic panel effects. The following subsections provide a detailed discussion of the econometric framework, estimation strategy, and model specification.

3.1. Cross-Sectional Dependence (CSD) Test

This study analyzes CSD due to the interconnectedness of nations through various economic, social, and cultural networks, which may generate spillover effects. Both the Pesaran scaled LM test and the Pesaran [74]. CSD test were employed to determine CSD. The equation for testing CSD is defined as follows:
C S D = 2 T N N 1 i = 1 N 1 j = i + 1 N ρ ^ i j

3.2. Slope Homogeneity (SH) Test

A slope homogeneity (SH) test has been introduced and further developed [73]. This test is employed in the present study to determine whether the cross-sections exhibit heterogeneous or homogeneous slopes. The SH test is a tool used in panel data analysis to assess whether the relationship between independent and dependent variables (i.e., regression slopes) remains homogeneous or heterogeneous across cross-sectional units, such as countries, firms, or industries. It examines whether the slope coefficients are identical for all cross-sectional units by testing the following hypotheses. Null Hypothesis (H0): The slopes are homogeneous, indicating consistency across all units. Alternative Hypothesis (H1): The slopes are heterogeneous, suggesting variation between units. The test is carried out as follows.
~ S H = N 1 2 ( 2 k ) 1 2 1 N S ~ k
~ A S H = N 1 2 2 k T k 1 T + 1 1 2 1 N S ~ 2 k
where ~ S H and ~ A S H represent statistical measures [72] used to test for SH. These delta statistics assess whether the assumption of homogeneous slopes holds in panel data regression. If the test results are significant (p < 0.05), this suggests that slope heterogeneity is present, meaning the regression coefficients vary across cross-sections.

3.3. Second-Generation Unit Root Test

After confirming the presence of cross-sectional dependency in our model, comprehending the stationarity properties of the studied series is essential for empirical analysis. For this purpose, we employ the second-generation unit root test—specifically, the Cross-sectionally Augmented Im, Pesaran, and Shin (CIPS) test. This strategy is effective, particularly in cases of diverse slopes and CSD. The formula for this assessment is as follows:
Y i , t = γ i + γ i Y i , t 1 + γ i X ¯ t 1 + 1 = 0 P γ i 1 Y ¯ t 1 + 1 = 1 P γ i 1 Y i , t 1 + ε i t
where Y ¯ t 1 and Y i , t 1 illustrate the average first and lagged differences, respectively.
Additionally, the CIPS is determined by averaging each Cross-Sectionally Augmented Dickey–Fuller test (CADF), as demonstrated by the following equation:
C I P S = 1 N ^ i = 1 n C A D F i
The present study utilizes the CIPS unit root test [72], predicated on the premise of CSD and informed by the results of the CSD test [72]. This unit root test is utilized to examine the order of integration of the variables.

3.4. Cross-Sectionally Augmented Autoregressive Distributed Lag (CS-ARDL)

The CS-ARDL test [75] is employed in this study to estimate both long-run and short-run relationships. Compared to alternative methods—such as mean group (MG), pooled mean group (PMG), augmented mean group (AMG), and common correlated effects mean group (CCMG) estimators—this approach offers greater reliability and efficiency. It effectively addresses challenges related to homogeneous slope coefficients, CSD, nonstationary, unobserved common factors, and endogeneity. This is crucial, as failing to account for unobserved common factors can lead to biased estimation results. The following equation represents the CS-ARDL model:
Y i t = i = 1 p y π i t Y i , t + i = 0 p z θ i 1 ι Z i , t 1 + i = 0 p T i 1 ι Z i , t 1 + e i t
where X ¯ t 1 = ( Y ¯ t 1 , Z ¯ t 1 ι ) ι , with Y ¯ t and Z ¯ t representing the average cross-sections. Additionally, X ¯ t 1 denotes the averages of both the dependent variable and the regressors.
ϑ ^ C S - A R D L , i = i = 0 P Z θ ^ i I ι 1 I = 1 P y π i I ^
ϑ ^ m e a n   g r o u p M G = 1 N i 1 N ϑ ^ i

4. Results

The present analysis begins with an overview of descriptive statistics, as presented in Table 2 across 218 observations. Statistics provide insights into the central tendency and dispersion of each variable, revealing that while some variables exhibit greater stability, others display more substantial variability across the dataset. The variable EDU (log of education expenditure) has a mean of 22.47 and a median of 22.27. FDI shows a mean close to zero, while TRAV has a mean of 1.05 and ranges from –3.51 to 3.57, indicating a wide distribution of tourist arrival values. TOU and its squared term TOU2 display considerable spread, with values ranging from 5.86 to 10.86 and –2.99 to 0.24, respectively.
The GI (governance index) varies from 0.78 to 2.83, with a mean of 1.54. These descriptive statistics highlight noticeable variations in tourism-related and institutional variables across observations.
Given this variation across variables, it was essential to assess potential cross-sectional dependence (CSD) before proceeding with the estimation. Accordingly, a CSD test was conducted on the variables of interest, the results of which are summarized in Table 3.
The findings indicate that all the examined variables exhibit CSD, as the test results lead to the rejection of the null hypothesis at a significant level of 1%. The significance of CSD stems from the interconnected nature of economies in a globalized world, particularly among GCC nations, where fluctuations in one country’s fundamental variables can influence other countries due to spillover effects. Additionally, Table 4 confirms the presence of heterogeneous slope coefficients, highlighting differences in economic structures. Given the presence of CSD and heterogeneous slopes, the next step involves conducting a second-generation unit root test to examine the stationarity of the variables.
Table 5 presents the results of the stationarity analysis, indicating that EDU, TOU, GDP, and TRADE are stationary at level I(0), while TOU2 and FDI become stationary at the first difference I(1) at a significance level of 5%.
A fundamental condition for the application of the panel CD-ARDL model is the presence of cross-sectional dependence and the integration of variables at either level I(0) or first-order I(1), which indicates that the variables are nonstationary at levels but become stationary after first-order differencing. This indicates that these factors may collectively possess a long-term equilibrium connection. The outcomes of the CD and CIPS assessments are recorded in Table 6. The CD results indicate a robust rejection of the null hypothesis of cross-sectional independence at the 1% significance level for all variables. These results indicate that all examined variables exhibit CSD. The presence of CSD within the data series renders standard unit root tests useless, as these tests depend on the assumption of cross-sectional independence. To address this issue, the present study utilizes a newly constructed CIPS unit root test that operates under the premise of CSD within the data series. The CIPS unit root test findings on level data suggest that the null hypothesis should be rejected at the 1% significance level, confirming that the studied series are free from unit roots. These results confirm that the variables of the present study exhibit a combination of I (0) and I(1) integration orders, suggesting cointegration among them. The variable EDU (log of education expenditure) has a mean of 22.47 and a median of 22.27. FDI shows a mean close to zero, while TRAV has a mean of 1.05 and ranges from –3.51 to 3.57, indicating a wide distribution of tourist arrival values. TOU and its squared term TOU2 display considerable spread, with values ranging from 5.86 to 10.86 and –2.99 to 0.24, respectively.
The coefficient is highly significant at the 5% level, emphasizing the importance of past investments in education in improving income equality. Moreover, the results show that tourism revenue has a negative but not significant impact on income equality in the short run, while its lagged value (∆TOU(−1)) shows a positive and significant impact at the 5% level. This suggests that the effects of tourism revenue on income equality require a short lag to appear, highlighting a delayed response in distributive outcomes. The squared term of tourism (∆ T O U 2 ) is significant at the 10% level, indicating potential nonlinear effects, although its lagged value is statistically insignificant.
The effects of the other variables remain limited in the short run. Neither FDI nor its lag has a significant impact on income equality. The governance index GI records a negative association at the 10% level, implying that weaker institutional quality may undermine distributive outcomes. Tourist arrivals (TRV) exert no meaningful influence in either the current or lagged periods.
In the long run, tourism revenue (TOU) shows a significant and positive effect at the 1% level. Sustained growth in the tourism sector contributes to greater equality over time. The squared term T O U 2 is negative and insignificant, providing no evidence of a Kuznets-type inverted U-shape. The governance index shows a significant and negative effect on income equality in the long run. This suggests that even as institutional quality improves, the benefits of economic policies may not reach all segments of society equally. In the GCC context, stronger governance often supports large-scale tourism investments and state-led development, but without inclusive redistribution mechanisms, these gains tend to be concentrated among privileged groups. As a result, governance improvements may coincide with widening income gaps unless accompanied by targeted social and labor policies.
Linking the short- and long-run results, the model shows that income equality improves mainly through past tourism revenue and public spending on education. The strong effect of lagged education expenditure in the short run supports human capital theory, which sees education as a key driver of equal opportunity and higher earning potential. By investing in education, governments can raise the skill levels of the population and reduce income gaps over time. In the long run, tourism revenue continues to support equality, but the squared term is not significant, so the Kuznets curve does not apply in this case. Tourist arrivals show a small negative effect over time. FDI has no significant effect. These results highlight the need for long-term policies that expand access to quality education and ensure that tourism growth supports broader social goals.
To better understand the direction of influence between key variables, the Dumitrescu–Hurlin panel causality test, Table 7, provides additional insights that complement the CS-ARDL findings. The Dumitrescu–Hurlin panel causality results reveal several significant directional relationships. A feedback (bidirectional) relationship emerges between education (EDU) and governance (GI), suggesting a mutual influence between government effectiveness and educational expenditure. Additionally, the analysis identifies a one-way causality from education to tourist arrivals (TRAV), indicating that improvements in education may enhance tourism capacity or service quality. FDI also Granger-causes education, implying that external capital inflows influence public spending patterns. Meanwhile, the squared term of tourism receipts (TOU2) shows evidence of causing education. No causal effects are detected between total tourism receipts (TOU) and education, nor from education to FDI, underscoring the selective nature of these interactions. These findings reinforce the asymmetric and context-dependent links between tourism, investment, governance, and education within the GCC.
Dumitrescu and Hurlin build their panel causality test based on the usual Granger causality structure to determine if lagged values of one variable predict changes in another across panel units. However, it does not account for long-run equilibrium relationships, which are better captured through approaches such as the CS-ARDL framework [72].
As a robustness check, the generalized linear model (GLM) was estimated. The results, presented in Table 8, broadly support the findings from the CS-ARDL model. The coefficient for tourism receipts (TOU) is positive and highly significant, indicating that growth in tourism revenues tends to increase education expenditure. This outcome aligns with the view that tourism strengthens income equality by expanding human capital. The squared tourism term (TOU2) does not reach statistical significance, which suggests no nonlinear relationship in this specification. The governance index GI shows a negative and statistically significant effect, possibly indicating structural weaknesses in public resource use. Tourist arrivals (TRV) also show a negative and significant effect, implying that an increase in the number of visitors does not automatically translate into better educational investment. FDI does not show a significant association with education expenditure. These results confirm the consistency of the main findings and reinforce the role of tourism revenue as a key driver of public education spending across GCC countries.

5. Discussion

The importance of tourism as a source of income for reducing income inequality can be inferred from the results of the CS-ARDL panel model. These estimation results provide valuable insights into the short- and long-term relationships between the studied variables, which include income equality (proxied by education expenditure), tourism revenue, foreign direct investment, the number of international tourist arrivals, and effectiveness of governance. While some variables exhibit significant influence, others appear to have limited or no measurable impact.
The results provide clear evidence that tourism revenue improves income equality, as shown by its significant and positive association with education expenditures. This pattern supports earlier findings by Blake [76], who reported that tourism receipts increase public sector resources and promote equity through targeted government investment. In the GCC countries, where governments channel tourism revenue into education and infrastructure, this relationship aligns with human capital theory. By expanding revenue bases, tourism enables governments to fund education, which helps reduce inequality over time [11].
In contrast, international tourist arrivals show a significant and negative relationship with education expenditure. This result diverges from studies that assume that more arrivals automatically generate broader social benefits. The explanation lies in the structural features of GCC tourism. Large-scale tourism in the region often relies on expatriate labor, short-term contracts, and low-wage employment. These dynamics limit wage growth among nationals and reduce the potential for inclusive development. Instead of fostering human capital formation, high volumes of arrivals may concentrate income among private operators without increasing public education budgets or reducing inequality.
The government effectiveness index exerts a negative and statistically significant effect on education expenditures. This result results to weaknesses in institutional mechanisms that should redistribute resources. Although tourism increases revenue, weak institutions may misallocate funds or prioritize nonsocial sectors. Studies by Barro [58] and Kaufmann et al. [77] support this view, showing that better governance improves the efficiency of public spending, especially in education.
FDI does not influence education expenditures in a meaningful way. This aligns with conclusions from Tsounta and Osueke [78], who show that foreign investment often targets capital-intensive sectors with limited social spillovers unless governments implement deliberate redistribution policies.
These findings highlight the importance of treating tourism revenue and tourist arrivals as distinct variables. Revenue reflects financial capacity, while arrivals reflect volume and market structure. Without institutional reform and strategic planning, the tourism sector may grow without reducing inequality. GCC policymakers should recognize this distinction and focus on capturing tourism value through regulation, education investment, and labor market reform.
The governments of GCC countries have introduced various social aid programs to mitigate income inequality among citizens. For instance, the United Arab Emirates provides social welfare assistance to vulnerable groups, including widows, divorced women, individuals with disabilities, the elderly, orphans, and low-income families. Emirati nationals meeting the eligibility criteria can apply for financial support through the Ministry of Community Development’s online portal [79]. Similarly, Saudi Arabia’s Ministry of Human Resources and Social Development oversees a comprehensive welfare system, offering support services for orphans, juvenile rehabilitation, elderly care, and financial assistance programs for job seekers. These initiatives aim to improve citizens’ well-being and ensure a stable standard of living at different life stages [80]. In Oman, the Social Protection Fund administers multiple benefits, including financial support for the elderly, children, and individuals with disabilities, widows, and orphans, as well as income assistance for low-income families. These programs provide a basic level of financial security to vulnerable segments of society [81]. These examples reflect GCC countries’ commitment to enhancing social welfare and addressing economic disparities among their citizens.
The results of the present long-run analysis reinforce the nonlinear relationship between tourism revenue and income equality, as evidenced by the significance of the squared tourism variable. Similar patterns have been reported, providing evidence of nonlinear dynamics in the tourism–income relationship [82]. These findings confirm that tourism development can enhance economic progress and income equality over time when appropriate policies are implemented to mitigate the initial challenges of tourism growth. Additionally, GDP per capita emerged as the most significant long-term determinant in the CS-ARDL model. The strong, positive, and highly significant relationship between GDP and income equality aligns with findings that emphasize the critical role of economic growth in raising living standards and reducing inequality [83,84]. These results highlight the importance of sustainable economic growth in improving long-term economic outcomes and addressing income disparities.
In contrast, FDI has no significant impacts in either the short or long run. This aligns with conclusions that argue the effects of FDI and trade are often conditional on the presence of supportive policies and strong institutional frameworks [23,85].
Without these complementary factors, the potential benefits of trade and FDI may remain unrealized, as reflected by their insignificance in the model’s results. While, the CS-ARDL framework helps address some dynamic endogeneity through lag structure and cross-sectional dependence, the possibility of reverse causality or omitted variables cannot be fully ruled out. Future studies should consider instrument variable approaches or dynamic panel model to better isolate causal effect.

6. Conclusions and Policy Implications

This study investigates the dynamic relationships between tourism development, governance quality, FDI, and income equality, with income equality proxied by public education expenditure, in the GCC countries over the period from 2014Q1 to 2023Q4. Using the CS-ARDL model and the generalized linear model (GLM), the analysis reveals several key insights.
First, tourism revenue exhibits a significant and positive association with education expenditure, suggesting that increased earnings from tourism can enhance government capacity to invest in human capital. This finding aligns with human capital theory, which posits that investments in education contribute to reducing income inequality over time.
In contrast, the number of international tourist arrivals demonstrates a significant negative relationship with education expenditure. This outcome may reflect the structural characteristics of the tourism sector in the GCC, where mass tourism often relies on expatriate labor and may not translate into broader socioeconomic benefits for the local population. Such dynamics can limit the potential of tourism to contribute to income equality.
The governance index (GI) consistently shows a negative and significant effect on education expenditure, indicating that institutional weaknesses may hinder the effective allocation of resources toward education. This underscores the importance of governance reforms and transparency to ensure that tourism-driven revenues are utilized to promote equitable social outcomes.
FDI does not exhibit a statistically significant impact on education expenditure, suggesting that external capital flows may not directly influence domestic education budgets in the GCC context.
These findings highlight the necessity for policymakers in the GCC to distinguish between different dimensions of tourism—such as revenue versus arrivals—and to implement strategies that ensure tourism development contributes to inclusive growth. Emphasizing sustained investment in tourism revenue management, targeted education spending, and institutional reform can enhance the role of tourism in promoting income equality.
Future research could expand upon this study by incorporating additional variables and exploring the impact of other sectors on income equality in GCC countries.
Based on the findings of this study, policymakers in GCC countries should prioritize policies that promote economic growth, including investments in infrastructure, research and development, and human capital. Governments should also devise strategies to promote tourism while ensuring that it does not exacerbate income inequality. Policymakers can attract FDI by simplifying investment procedures and offering incentives to foreign investors. Finally, policymakers should develop trade policies that promote growth for all and reduce income disparities by protecting vulnerable industries, providing education and skill development opportunities, and facilitating workforce transitions to emerging sectors.
As discussed above, GCC countries such as Saudi Arabia, the United Arab Emirates, and Oman have implemented redistributive welfare programs that complement tourism development efforts and contribute to mitigating income disparities.
This study has some limitations, primarily due to the unavailability of data on income distribution in GCC countries, which necessitated using education expenditure as a proxy. The lack of disaggregated tourism and sector-specific FDI data also limits the depth of the analysis.

Funding

The authors would like to thank the Deanship of Scientific Research at King Saud University for funding and supporting this research through the initiative of DSR Graduate Students Research Support (GSR). The APC was funded by the Deanship of Scientific Research at King Saud University.

Institutional Review Board Statement

Not applicable.

Informed Consent Statement

Not applicable.

Data Availability Statement

The data used in this study are available from the corresponding author upon reasonable request.

Conflicts of Interest

The authors declare no conflict of interest.

References

  1. Wang, Y.; Tziamalis, A. International Tourism and Income Inequality: The Role of Economic and Financial Development. Tour. Econ. 2023, 29, 135481662311771. [Google Scholar] [CrossRef]
  2. Fang, J.; Gozgor, G.; Paramati, W.S.R.; Wu, X. The Impact of Tourism Growth on Income Inequality: Evidence from Developing and Developed Economies. Tour. Econ. 2020, 27, 1669–1691. [Google Scholar] [CrossRef]
  3. Subramaniam, Y.; Masron, N.T.A.; Loganathan, X. Tourism and Income Inequality. J. Bus. Socio-Econ. Dev. 2022, 2, 181–194. [Google Scholar] [CrossRef]
  4. Durán-Román, J.L.; Cárdenas-García, P.J.; Pulido-Fernández, J.I. Tourists’ Willingness to Pay to Improve Sustainability and Experience at Destination. J. Destin. Mark. Manag. 2021, 19, 100540. [Google Scholar] [CrossRef]
  5. World Travel & Tourism Council. Economic Impact Reports. Available online: https://wttc.org/research/economic-impact (accessed on 25 April 2025).
  6. Zhang, J. The Effects of Tourism on Income Inequality: A Meta-Analysis of Econometrics Studies. J. Hosp. Tour. Manag. 2021, 48, 312–332. [Google Scholar] [CrossRef]
  7. Mahadevan, R.; Suardi, S. Panel Evidence on the Impact of Tourism Growth on Poverty, Poverty Gap and Income Inequality. Curr. Issues Tour. 2019, 22, 253–264. [Google Scholar] [CrossRef]
  8. Li, C.; Zuckerman, M.; Diener, E. Culture Moderates the Relation between Income Inequality and Subjective Well-Being. J. Cross-Cult. Psychol. 2019, 50, 1221–1241. [Google Scholar] [CrossRef]
  9. Cortes-Jimenez, I.; Pulina, M. Inbound Tourism and Long-Run Economic Growth. Curr. Issues Tour. 2010, 13, 61–74. [Google Scholar] [CrossRef]
  10. Butcher, J. Tourism and Poverty Reduction: Pathways to Prosperity. J. Policy Res. Tour. Leis. Events 2011, 3, 99–101. [Google Scholar] [CrossRef]
  11. Croes, R.; Rivera, M.A. Tourism’s Potential to Benefit the Poor: A Social Accounting Matrix Model Applied to Ecuador. Tour. Econ. 2017, 23, 29–48. [Google Scholar] [CrossRef]
  12. Cárdenas-García, P.J.; Sánchez-Rivero, M.; Pulido-Fernández, J.I. Does Tourism Growth Influence Economic Development? J. Travel Res. 2013, 54, 206–221. [Google Scholar] [CrossRef]
  13. Travel & Tourism Economic Impact 2023. Available online: https://assets-global.website-files.com/6329bc97af73223b575983ac/647df24b7c4bf560880560f9_EIR2023-APEC.pdf (accessed on 5 March 2025).
  14. Maalel, N.; Mahmood, H. Oil Abundance and Macroeconomic Performance in the GCC Countries. Int. J. Energy Econ. Policy 2018, 8, 182–187. [Google Scholar]
  15. Wong, V.S.; El Massah, S. Recent Evidence on the Oil Price Shocks on Gulf Cooperation Council Stock Markets. Int. J. Econ. Bus. 2018, 25, 297–312. [Google Scholar] [CrossRef]
  16. Hilal, N. Tourism in the Gulf Cooperation Council Countries as a Priority for Economic Prospects and Diversification. J. Tour. Hosp. 2020, 9, 2167–2269. [Google Scholar]
  17. Alhowaish, A. Is Tourism Development a Sustainable Economic Growth Strategy in the Long Run? Evidence from GCC Countries. Sustainability 2016, 8, 605. [Google Scholar] [CrossRef]
  18. Mansfeld, Y.; Winckler, O. The tourism industry as an alternative for the GCC oil-based rentier economies. Tour. Econ. 2007, 13, 333–360. [Google Scholar] [CrossRef]
  19. Tsypko, V. The Effect of Tourism on the Ecological State of the Environment. In Proceedings of the E3S Web Conference International Scientific Conference on Green Energy (GreenEnergy 2024), Kyiv, Ukraine, 22–25 October 2024; Volume 587. [Google Scholar] [CrossRef]
  20. Frenț, C. An Overview on the Negative Impacts of Tourism. Rev. Tur. Stud. Si Cercet. Turism 2016, 22. [Google Scholar]
  21. Paul, B.D. The Impacts of Tourism on Society. Ann. Fac. Econ. 2012, 1, 500–506. [Google Scholar]
  22. Raza, S.A.; Shah, N. Tourism Growth and Income Inequality: Does Kuznets Curve Hypothesis Exist in Top Tourist Arrival Countries. Asia Pac. J. Tour. Res. 2017, 22, 874–884. [Google Scholar] [CrossRef]
  23. Ncube, M.; Anyanwu, J.C.; Hausken, K. Inequality, Economic Growth and Poverty in the Middle East and North Africa (MENA). Afr. Dev. Rev. 2014, 26, 435–453. [Google Scholar] [CrossRef]
  24. Benjamin, D.; Brandt, L.; Giles, J. The Evolution of Income Inequality in Rural China. Econ. Dev. Cult. Chang. 2005, 53, 769–824. [Google Scholar] [CrossRef]
  25. Djerf-Pierre, M. The Difference Engine: Gender Equality, Journalism and the Good Society. Fem. Media Stud. 2011, 11, 43–51. [Google Scholar] [CrossRef]
  26. Hadler, M. Why Do People Accept Different Income Ratios? A Multi-Level Comparison of Thirty Countries. Acta Sociol. 2005, 48, 131–154. [Google Scholar] [CrossRef]
  27. Milanovic, B.; Gradstein, M.; Ying, Y. Democracy and Income Inequality: An Empirical Analysis 2001. Available online: https://ssrn.com/abstract=253368 (accessed on 3 April 2025).
  28. Furceri, D.; Loungani, P.; Ostry, J.D.; Pizzuto, P. Will COVID-19 Have Long-Lasting Effects on Inequality? Evidence from Past Pandemics. J. Econ. Inequal. 2022, 20, 811–839. [Google Scholar] [CrossRef]
  29. Asaria, M.; Costa-Font, J.; Cowell, F. How Does Exposure to COVID-19 Influence Health and Income Inequality Aversion? Soc. Choice Welf. 2023, 61, 625–647. [Google Scholar] [CrossRef]
  30. Dabla-Norris, M.; Kochhar, M.; Suphaphiphat, M.; Ricka, M.; Tsounta, M. Causes and Consequences of Income Inequality: A Global Perspective; International Monetary Fund: Washington, DC, USA, 2015. [Google Scholar]
  31. Stiglitz, J.E. Macroeconomic Fluctuations, Inequality, and Human Development. In Macroeconomics and Human Development; Routledge: Abingdon, UK, 2015; pp. 31–58. [Google Scholar]
  32. Alasfoor, R. The Gulf Cooperation Council: Its Nature and Achievements: A Political Analysis of Regional Integration of the GCC States 1979–2004. Ph.D. Thesis, Department of Political Science, Lund University, Lund, Sweden, 2007. ISBN 978-91-88306-67-8. [Google Scholar]
  33. Arab Bureau of Education for the Gulf States. Education in the GCC Countries Towards Achieving Sustainable Development. 2021. Available online: https://cdn-files.abegs.org/abegs-portal-prod/uploads/cba09808-0e92-4467-ab1d-566212f5d476.pdf (accessed on 3 April 2025).
  34. Zhang, H.; Yang, Y. Is Tourism Growth Able to Shrink Economic Inequalities? A DSGE Analysis. Ann. Tour. Res. Empir. Insights 2023, 4, 100089. [Google Scholar] [CrossRef]
  35. Alam, M.; Samsul, S.R.; Paramati, W. The Impact of Tourism on Income Inequality in Developing Economies: Does Kuznets Curve Hypothesis Exist? Ann. Tour. Res. 2016, 61, 111–137. [Google Scholar] [CrossRef]
  36. Ghosh, S.; Mitra, S.K. Tourism and Inequality: A Relook on the Kuznets Curve. Tour. Manag. 2021, 83, 104255. [Google Scholar] [CrossRef]
  37. Kumail, T.; Sadiq, M.; Ali, W.; Sadiq, F. The Impacts of Tourism Development on Income Inequality: How Does Tourism Capital Investment Contribute to Income Distribution? Tour. Agenda 2023, 78, 630–645. [Google Scholar]
  38. Lee, J.-W.; Lee, H. Human Capital and Income Inequality*. J. Asia Pac. Econ. 2018, 23, 554–583. [Google Scholar] [CrossRef]
  39. Suprabha, K.R.; Prasad, K.; Devji, S. Labour Intensity and Skill Gap in the Hospitality Sector: A Study in South India. Public Enterp. Half-Yrly. J. 2017, 23, 84–110. [Google Scholar] [CrossRef]
  40. Jithendran, K.J.; Baum, T. Human Resources Development and Sustainability? The Case of Indian Tourism. Int. J. Tour. Res. 2000, 2, 403–421. [Google Scholar] [CrossRef]
  41. World Bank. Gini Index (World Bank Estimate). 2022. Available online: https://data.worldbank.org/indicator/SI.POV.GINI (accessed on 13 February 2025).
  42. World Health Organization. G20 Tourism Leaders Commit to Intensify Efforts Towards a Sustainable Recovery 2020. Available online: https://www.unwto.org/news/g20-tourism-leaders-commit-to-intensify-efforts-towards-a-sustainable-recovery (accessed on 10 March 2025).
  43. Hall, C.M. Policy Learning and Policy Failure in Sustainable Tourism Governance: From First- and Second-Order to Third-Order Change? J. Sustain. Tour. 2011, 19, 649–671. [Google Scholar] [CrossRef]
  44. Oviedo-García, M.Á.; González-Rodríguez, M.R.; Vega-Vázquez, M. Does Sun-and-Sea All-Inclusive Tourism Contribute to Poverty Alleviation and/or Income Inequality Reduction? The Case of the Dominican Republic. J. Travel Res. 2019, 58, 995–1013. [Google Scholar] [CrossRef]
  45. Byers, J.; Proserpio, D.; Zervas, G. The Rise of the Sharing Economy: Estimating the Impact of Airbnb on the Hotel Industry. SSRN J. 2016, 54, 687–705. [Google Scholar] [CrossRef]
  46. Cui, Y.; Davis, A.M. Tax-Induced Inequalities in the Sharing Economy. Manag. Sci. 2023, 68, 7202–7220. [Google Scholar] [CrossRef]
  47. Georgiou, M.N. Education Spending and Income Inequality—An Empirical Analysis for Western Europe (1995–2006). SSRN J. 2010. [Google Scholar] [CrossRef]
  48. Olupona, T. The Impact of Education on Income Inequality. SSRN J. 2018. [Google Scholar] [CrossRef]
  49. Coady, D.; Dizioli, A. Income Inequality and Education Revisited: Persistence, Endogeneity, and Heterogeneity. Appl. Econ. 2018, 50, 2747–2761. [Google Scholar] [CrossRef]
  50. Seefeldt, B. The Impact of Education Expenditures on Income Inequality: Evidence from US States. Bachelor’s Thesis, Bryant University, Smithfield, NC, USA, 2018. [Google Scholar]
  51. Huber, E.; Gunderson, J.; Stephens, J.D. Private Education and Inequality in the Knowledge Economy. Policy Soc. 2020, 39, 171–188. [Google Scholar] [CrossRef]
  52. Artige, L.; Cavenaile, L. Public education expenditures, growth and income inequality. J. Econ. Theory 2023, 209, 105622. [Google Scholar] [CrossRef]
  53. Pulido-Fernández, J.I.; Cárdenas-García, P.J. Analyzing the Bidirectional Relationship between Tourism Growth and Economic Development. J. Travel Res. 2021, 60, 583–602. [Google Scholar] [CrossRef]
  54. Glomm, G.; Ravikumar, B. Public versus Private Investment in Human Capital: Endogenous Growth and Income Inequality. J. Political Econ. 1992, 100, 818–834. [Google Scholar] [CrossRef]
  55. Hooper, E.; Peters, S.; Pintus, P. To What Extent Can Long-Term Investments in Infrastructure Reduce Inequality? J. Infrastruct. Policy Dev. 2018, 2, 193. [Google Scholar] [CrossRef]
  56. Barro, R.J.; Lee, J.W. A New Data Set of Educational Attainment in the World, 1950–2010. J. Dev. Econ. 2013, 104, 184–198. [Google Scholar] [CrossRef]
  57. Psacharopoulos, G.; Patrinos, H.A. Returns to Investment in Education: A Decennial Review of the Global Literature. Educ. Econ. 2018, 26, 445–458. [Google Scholar] [CrossRef]
  58. Lee, S.Y.; Seshadri, A. Economic Policy and Equality of Opportunity. Econ. J. 2018, 128, F114–F151. [Google Scholar] [CrossRef]
  59. Melendez, E. Closing the Growth and Equity Policy Divide: Rethinking the Role of the Federal Government When Promoting Economic Development in Distressed Urban Communities. Ph.D. Thesis, University of Massachusetts Boston, Boston, MA, USA, 1996. [Google Scholar]
  60. Nugraha, M.V.A.; Lubis, A.F. Assessing the Influence of Social Justice Movements on Public Policy and Community Empowerment in Indonesia. Easta J. Law Hum. Rights 2024, 3, 1–9. [Google Scholar] [CrossRef]
  61. Qatar Tourism. Post-World Cup Tourism Strategy 2023. Available online: https://www.qatartourism.com/en/news-and-media/sector-statistics/tourism-reports. (accessed on 4 February 2025).
  62. Public Investment Fund (PIF). Vision 2030 and Economic Transformation. Available online: https://www.vision2030.gov.sa/en/explore/programs/public-investment-fund-program (accessed on 4 February 2025).
  63. Expo 2020 Dubai. Connecting Minds, Creating the Future. Available online: https://www.expo2020dubai.com/ (accessed on 4 February 2025).
  64. Saudi Motorsport Company. Saudi Motorsport Strategy and Events 2023. Available online: https://downloads.ctfassets.net/5deddylq7ay4/6LHOUZbog485myGH6dS55g/3948f917481315f9fed3e424ac9e9bb3/SMC_Magazine_Second_Edition_new-V10_Eng-digital.pdf (accessed on 4 February 2025).
  65. Government of Saudi Arabia. Saudi Vision 2030. Available online: https://www.vision2030.gov.sa/en (accessed on 4 February 2025).
  66. Brannagan, P.M.; Giulianotti, R. Soft Power and Soft Disempowerment: Qatar, Global Sport and Football’s 2022 World Cup. Leis. Stud. 2015, 34, 703–719. [Google Scholar] [CrossRef]
  67. Zmami, M.; Ben-Salha, O. The Impact of Tourism on Sustainable Development in GCC Countries. J. Tour. Manag. Res. 2024, 11, 153–166. [Google Scholar] [CrossRef]
  68. Abdullah, A.; Doucouliagos, H.; Manning, E. Does Education Reduce Income Inequality? A Meta-Regression Analysis. J. Econ. Surv. 2015, 29, 301–316. [Google Scholar] [CrossRef]
  69. Gregorio, J.D.; Lee, J. Education and Income Inequality: New Evidence From Cross-Country Data. Rev. Income Wealth 2002, 48, 395–416. [Google Scholar] [CrossRef]
  70. Uzar, U.; Eyuboglu, K. Can Tourism Be a Key Sector in Reducing Income Inequality? An Empirical Investigation for Turkey. Asia Pac. J. Tour. Res 2019, 24, 822–838. [Google Scholar] [CrossRef]
  71. Pesaran, M.H.; Yamagata, T. Testing Slope Homogeneity in Large Panels—ScienceDirect. Available online: https://www.sciencedirect.com/science/article/abs/pii/S0304407607001224 (accessed on 6 February 2025).
  72. Kuznets, S. The Distribution of National Income. Econ. J. 1955, 36, 69. [Google Scholar]
  73. Pesaran, M.H.; Schuermann, T.; Weiner, S.M. Modeling Regional Interdependencies Using a Global Error-Correcting Macroeconometric Model. J. Bus. Econ. Stat. 2004, 22, 129–162. [Google Scholar] [CrossRef]
  74. Dumitrescu, E.-I.; Hurlin, C. Testing for Granger Non-Causality in Heterogeneous Panels. Econ. Model. 2012, 29, 1450–1460. [Google Scholar] [CrossRef]
  75. Pesaran, M.H. A Simple Panel Unit Root Test in the Presence of Cross-section Dependence. J. Appl. Econom. 2007, 22, 265–312, Wiley Online Library. Available online: https://onlinelibrary.wiley.com/doi/full/10.1002/jae.951?casa_token=qkM1kfm3YMQAAAAA%3AirVmvndm6gISzAlUpuZr38ulO-sWOZGy0qdFWlUcghZ5oYjFvCmhlx8fD8W7gwQz-5-GZ2oIJg2ERv4P (accessed on 5 February 2025). [CrossRef]
  76. Blake, A. Tourism and Income Distribution in East Africa. J. Tour. Res. 2008, 10, 511–524. [Google Scholar] [CrossRef]
  77. Kaufmann, D.; Kraay, A.; Mastruzzi, M. The Worldwide Governance Indicators: Methodology and Analytical Issues. Hague J. Rule Law 2011, 3, 220–246. [Google Scholar] [CrossRef]
  78. Tsounta, E.; Osueke, A. What Is Behind Latin America’s Declining Income Inequality? IMF Work. Pap. 2014, 14. [Google Scholar] [CrossRef]
  79. Social Welfare Programmes. The Official Portal of the UAE Government. Available online: https://u.ae/en/information-and-services/social-affairs/social-welfare/social-welfare-programmes (accessed on 18 February 2025).
  80. Social Protection in the Kingdom of Saudi Arabia. Available online: https://my.gov.sa/en/content/social-protection?highlight=social+protection#section-1 (accessed on 18 February 2025).
  81. Oman Social Protection Fund. Home. Available online: https://www.spf.gov.om/en/home-2/ (accessed on 3 April 2025).
  82. Lee, C.-C.; Chang, C.-P. Tourism Development and Economic Growth: A Closer Look at Panels. Tour. Manag. 2008, 29, 180–192. [Google Scholar] [CrossRef]
  83. Howitt, P.; Aghion, P. Capital Accumulation and Innovation as Complementary Factors in Long-Run Growth. J. Econ. Growth 1998, 3, 111–130. [Google Scholar] [CrossRef]
  84. Vandemoortele, J.; Delamonica, E. Growth Is Good for the Poor? Not Necessarily. Rev. Political Econ. 2023, 35, 1157–1161. [Google Scholar] [CrossRef]
  85. Rodrik, D. Why Do More Open Economies Have Bigger Governments? J. Political Econ. 1998, 106, 997–1032. [Google Scholar] [CrossRef]
Figure 1. Tourism expenditure in GCC countries (USD millions). Source: authors’ compilation based on data from the World Bank, World Development Indicators (2015–2020), and the UN World Tourism Organization, International Tourism Statistics (2021–2023) [33].
Sustainability 17 04272 g001
Figure 2. Education expenditure per capita. Source: data from ministries of finance, converted into US dollars by the researcher.
Sustainability 17 04272 g002
Figure 3. School enrollment rate in primary school (% gross). Source: World Bank, 2025.
Sustainability 17 04272 g003
Figure 4. Student enrollment in GCC schools (2022/2023). Source: Gulf Cooperation Council Statistical Center, 2024 [33].
Sustainability 17 04272 g004
Figure 5. Higher education enrollment in the GCC (2022/2023). Source: Gulf Cooperation Council Statistical Center, 2024 [33].
Sustainability 17 04272 g005
Table 1. Data sources.
SymbolVariableSource
EDUGovernment education expenditure in US dollars is divided by the population to calculate education expenditure per capita.Ministries of Finance and education
GIGovernment Effectiveness captures perceptions of the quality of public services, the quality of the civil service and the degree of its independence from political pressures, the quality of policy formulation and implementation, and the credibility of the government’s commitment to such policies. Estimates give the country’s score on the aggregate indicator in units of a standard normal distribution, i.e., ranging from approximately −2.5 to 2.5.World Bank
TOUInternational tourism receipts show the expenses paid by international visitors traveling to a particular destination. This includes payments made to national carriers for transportation, goods, and services and encompasses same-day visitors. These data are denominated in US dollars.World Bank
FDIThe cumulative amount of direct cross-border investment over time.United Nations Conference on Trade and Development (UNCTAD)
TRAVInternational tourists arrivalUN Tourism
Table 2. Descriptive statistics of the study.
EDUTOUTOU2FDITRAVGI
Mean22.4738.4020−0.3630.0001.0541.543
Median22.2718.320−0.1923−0.00011.1311.390
Maximum24.78110.8570.23900.0583.5692.833
Minimum20.5385.8579−2.995−0.0582−3.5060.775
Observations218218218218218218
Table 3. Cross-sectional dependence (CSD) test.
EDUTOUTOU2FDITRAVGI
Breusch–Pagan LM207.655 ***
(0.000)
230.282 ***
(0.000)
427.382 ***
(0.000)
33.876 ***
(0.000)
270.446 ***
(0.000)
280.53 ***
(0.000)
Pesaran scaled LM35.173 ***
(0.000)
39.305 ***
(0.000)
75.290 ***
(0.000)
3.446 ***
(0.000)
46.638 ***
(0.000)
48.47 ***
(0.000)
Bias-corrected scaled LM35.173 ***
(0.000)
39.228 ***
(0.000)
75.213 ***
(0.000)
3.365 ***
(0.000)
46.561 ***
(0.000)
48.47 ***
(0.000)
Pesaran CD35.096 **
(0.034)
13.609 ***
(0.000)
20.491 ***
(0.000)
−0.585
(0.558)
15.103 ***
(0.000)
0.051 ***
(0.341)
Note: ***,** represents significance at the 1% and 5% level, respectively where the p-value is lower than the critical value.
Table 4. Homogenous slope coefficients (SH).
Test Valuep-Value
Delta tilde9.0140.000 ***
Delta tilde adjusted9.9850.00 ***
Note: *** represents significance at the 1% level.
Table 5. Second generation (CIPS unit root test).
VariablesLevelFirst DifferenceCritical Value
EDU3.007 *** −2.33
TOU−3.349 *** −2.33
TOU2−3.985 *** −2.33
GI−2.238 * 2.21
FDI−5.462 *** −2.33
TRAV−0.356−2.927 ***−2.33
Note: * and *** indicate significance at the 10% and 1% levels, respectively. The critical values for the CIPS test, as proposed by Pesaran [72], are −2.21, −2.33, and −2.57 at these respective significance levels.
Table 6. CS-ARDL test results.
Panel A: Short-Run Results
RegressorsCoefficientStdErr.t-Satp-Value
ECM(−1)−0.120618 **0.052741−2.2869950.0238
EDU(−1)0.413291 ***0.1439012.8720430.0048
TOU−0.0229250.040916−0.5602930.5763
TOU(−1)0.07139 **0.0298342.3928570.0182
T O U 2 0.011071 *0.0061811.7910770.0756
TOU2(−1)−0.0058640.004366−1.3429560.1816
FDI0.3949430.3364171.1739710.2426
FDI(−1)0.3014790.3516850.8572420.3929
GI−0.65377 *0.371822−1.7582880.0811
GI(−1)0.3550630.3161821.1229710.2635
TRV−0.1027490.080914−1.2698480.2064
TRV(−1)−0.0358370.030719−1.1666030.2455
Panel B: Long-Run Results
RegressorsCoefficientStdErr.Z-Satp-Value
TOU0.146502 ***0.0497632.9439880.0038
TOU2−0.0168880.019365−0.8720920.3848
FDI−0.3348050.70232−0.4767120.6344
GI−0.17746 ***0.049404−3.5920150.0005
TRAV−0.077711 *0.04518−1.7200350.0878
Note: ***, **, and * represent significance at the 1%, 5%, and 10% levels, respectively.
Table 7. Dumitrescu–Hurlin panel causality results.
Directions of CausalityW-SatZbar-SatprobDecision
TOU EDU1.751−0.4060.684No causality
EDU TOU 1.847-.3030.761
E D U T O U 2 3.0440.9850.324One-way causality
T O U 2 E D U 0.4323−1.8290.0673
FDI EDU7.3545.5720.000One-way causality
EDU FDI1.105−1.1050.269
EDU TRAV4.2202.2300.026One-way causality
TRAV E D U 3.3961.3490.177
E D U G I 3.8631.8700.061Feedback causality
G I E D U 4.7372.8130.004
Table 8. Generalized linear model (GLM) robustness check.
VariableCoefficientStd. Errorz-Statisticp-Value
C14.74 ***0.9116.140.00
TOU1.38 ***0.149.600.00
TOU20.040.130.290.77
FDI−0.787.35−0.110.92
GI−2.26 ***0.23−9.840.00
TRAV−0.33 ***0.09−3.660.00
Note: *** represent significance at the 1% levels.
Disclaimer/Publisher’s Note: The statements, opinions and data contained in all publications are solely those of the individual author(s) and contributor(s) and not of MDPI and/or the editor(s). MDPI and/or the editor(s) disclaim responsibility for any injury to people or property resulting from any ideas, methods, instructions or products referred to in the content.

