Article

How Does the Pilot Information Consumption Policy Affect Urban Carbon Productivity? Quasi-Experimental Evidence from 275 Chinese Cities

1
Economic Research Institute of The Belt and Road Initiative, Lanzhou University of Finance and Economics, Lanzhou 730020, China
2
School of Statistics and Data Science, Lanzhou University of Finance and Economics, Lanzhou 730020, China
*
Author to whom correspondence should be addressed.
Sustainability 2025, 17(10), 4266; https://doi.org/10.3390/su17104266
Submission received: 30 March 2025 / Revised: 3 May 2025 / Accepted: 5 May 2025 / Published: 8 May 2025

Abstract

:
Digital consumption, driven by the widespread application of information technology, has led to more efficient resource allocation and industrial structure optimization. This promotes green transformation and has a positive impact on carbon productivity. This research examined 275 cities across China, employing a difference-in-differences approach alongside the national information consumption pilot policy to carry out a quasi-natural experiment. The study found that the information consumption pilot policy enhances carbon productivity at the 1% significance level. After controlling for other variables, the regions affected by the information consumption policy saw an increase in carbon productivity that was 0.233 higher than in the regions that were not affected. This growth reflects the positive impact of the information consumption pilot policy or measures on carbon productivity. Meanwhile, the increase in technological resources and the transformation of the industrial framework encouraged by the policy indirectly promote the development of carbon productivity. The information consumption pilot policy promotes technological innovation and increases resource density, leading to more efficient technology application and resource allocation. It also drives industrial structure optimization, particularly accelerating the development of low-carbon industries, thereby effectively enhancing carbon productivity. This study provides theoretical and empirical references for the promotion of carbon productivity through digital consumption.

1. Introduction

1.1. Introduction

1.1.1. Definition of Research

As global climate change intensifies, how to achieve the development of a low-carbon economy has become a key issue of widespread concern for both governments and the academic community. There is a dual role of digital technology as a driver of systemic change: on the one hand, it optimizes energy efficiency and restructures the circular economy model through technologies such as Internet of Things, artificial intelligence, and big data analysis; on the other hand, the digital divide and data ethics issues highlight the urgent need for a governance framework. China is actively taking measures to promote the transition. In 2024, the State Council of China issued the 2024–2025 Energy Conservation and Carbon Reduction Action Plan, which re-emphasizes the priority of conservation, improves the regulation of total energy consumption and intensity, and aims to achieve energy conservation and carbon reduction in key areas and industries by 2025. The plan sets a target to reduce carbon dioxide emissions by approximately 130 million tons. At the critical stage of building a modern economic system, carbon productivity is an important indicator of the link between carbon emissions and productivity and has become a key measure for assessing sustainable economic growth. With the advent of the new era of socialism with Chinese characteristics, information consumption, as a new engine driving economic growth, is also influencing carbon emissions. The Consumer-Side Carbon Emissions Report (2024) points out that while information consumption drives economic development, it also significantly increases carbon emissions. In the process of promoting digital economic transformation, improving carbon productivity is not only key to achieving the carbon peak and neutrality goals but also has profound practical significance for advancing high-quality development. Improving carbon productivity is not only a key pathway for addressing climate change and promoting green development but also a necessary condition for achieving sustainable development.
In recent years, China’s information consumption policy, together with the Broadband China strategy, the establishment of national big data comprehensive pilot zones, and policies promoting digital industrialization, has collectively formed the policy guidance system of the digital economy strategy. As a core component of the digital economy strategy, the fundamental positioning of the information consumption policy lies in driving supply-side structural reform through demand-side incentives, thereby serving as a hub for integrating the digital economy with the real economy. Information consumption is a new consumption style generated by the coupling of digital technology and traditional physical consumption [1]. Information consumption refers to consumption activities involving the direct or indirect purchase of information products and information services [2,3]. As a developing country with a large population, China has seen an average annual growth rate of over 15% in information consumption, according to statistics from the Ministry of Industry and Information Technology. This growth rate is 1.6 times that of the growth rate of final consumption during the same period. As an important component of the digital economy, information consumption has broken through the constraints of traditional consumption style. The green technological innovations brought about by digital technology can improve energy utilization efficiency, thereby enhancing carbon productivity [4]. The government has introduced clearer and more specific information consumption pilot policy in recent years, aiming to foster the close integration of information technology with traditional industries. This is intended to drive the transformation of consumption patterns and industrial upgrading, thereby achieving green and low-carbon development.

1.1.2. Research Perspective

Despite the initial success of the information consumption policy in promoting the digital transformation of the economy, systematic empirical studies on the specific effects of information consumption on carbon productivity remain limited. Most existing studies concentrate on its effects on industrial upgrading, economic growth, and related fields, while the potential influence of information consumption on improving carbon productivity has received less attention. Hence, this study aimed to explore the impact of China’s pilot information consumption policy on carbon productivity and its specific effects. After clarifying their specific effects, the paper will analyze the mechanisms at play and investigate the heterogeneity of information consumption policies. By systematically reviewing the background of information consumption policies, integrating relevant theories of carbon productivity, and considering different dimensions of policy implementation, this paper will examine how information consumption can simultaneously promote the green transformation of the economy and enhance carbon productivity.
Specifically, this study began by applying the Super-SBM model to assess urban carbon emission efficiency and subsequently calculated carbon productivity based on the results. Then, by constructing a multi-period difference-in-differences (DID) model, we explored how China’s pilot policy regarding urban information consumption affects carbon productivity. Through this study, this paper aims to clarify whether information consumption exerts a considerable influence on carbon productivity and, if there is an impact, whether it promotes or inhibits carbon productivity and through which mechanisms. By addressing these questions, this paper seeks to identify the relationship between information consumption pilot policies and carbon productivity, providing new perspectives and empirical evidence for further research.

1.1.3. Research Objectives

This paper aims to address three core questions: First, has the information consumption pilot policy significantly improved urban carbon productivity? Second, does the policy effect exhibit regional or other forms of heterogeneity? Third, are green patent innovation and industrial structure upgrading the key transmission pathways? Through the integration of multiple methods and a quasi-experimental design, this paper seeks to provide new evidence for policy evaluation and offer decision-making references for the differentiated advancement of digital green development.

1.2. Research Hypotheses

Information consumption is an important component of the digital economy and has become a key force in driving economic transformation and expanding domestic demand. The information consumption pilot policy is a policy implemented in China. Since 2013, the government has advanced the development of information consumption through a series of policies, gradually achieving a shift from policy trials to nationwide implementation. In July 2013, the State Council first explicitly proposed the promotion of information consumption. This move marked the formal inclusion of information consumption in the national strategy, aiming to promote innovation and explore suitable policy measures through local pilot projects. In 2014, the State Council further issued the Several Opinions on Promoting Information Consumption and Expanding Domestic Demand policy, emphasizing that information consumption not only involves infrastructure development but also requires the optimization of service models and the integration of information technology with traditional consumption sectors. By early 2015, the number of pilot cities had increased to 104, and information consumption had expanded into multiple fields, including e-commerce, smart homes, and mobile payments. At this point, information consumption had become more than just a technological application; it had permeated society and helped drive the growth of the digital economy. In 2017, the State Council released further guidelines to expand and upgrade information consumption. The guidelines proposed that, through technological innovation and the optimization of service models, the potential of domestic demand would be further released, driving the upgrade of information consumption, particularly in terms of quality enhancement and industrial integration. Entering the 14th Five-Year Plan period, digital consumption was incorporated into the national strategy. Despite the rapid development of information consumption driven by policies, challenges such as data privacy protection, smart product security, and regional digital divides remain. In the future, the government will need to continue promoting policy innovation and regulation, strengthen the construction of the digital consumption ecosystem, and ensure healthy development. In summary, the implementation of information consumption policies has propelled the rise of the digital economy.
To further understand how this policy specifically drives improvements in carbon productivity, three specific research hypotheses were proposed. These hypotheses relate to the mechanisms of the information consumption pilot policy from two perspectives: technological progress and industrial structure adjustment.
Firstly, regarding the direct impact of the information consumption pilot policy on carbon productivity, digital information consumption policies can promote the aggregation and optimal allocation of various production factors, ultimately driving economic structural adjustments. The mechanisms through which information consumption affects the real economy and digital economy have attracted widespread attention in academia. However, there is no consensus on how information consumption influences the economy. In terms of the factors influencing digital integration, existing research mainly focuses on theoretical deduction, often from a general perspective of the digital economy, and lacks in-depth analysis and empirical research on the consumption dimension. In related studies, according to Xia et al. [5], economic development enhances carbon emission efficiency, primarily by promoting green technological innovations and optimizing industrial structures, which in turn positively impact carbon emission performance. Cui and Li [6] further suggest that integrating the digital economy promotes sustainable growth in urban areas while also being shaped by regional factors. Building on the findings of previous research, this paper proposes the following hypothesis:
Hypothesis 1 (H1).
The Chinese pilot policy on information consumption can enhance carbon productivity.
Secondly, Hypothesis 1 (H1) posits the direct effect of China’s information consumption pilot policy on carbon productivity, while Hypotheses 2 (H2) and 3 (H3) specify the underlying mechanisms through which this effect operates—namely, technological progress and industrial structure adjustment. This hierarchical structure aligns with the mediation framework [7], where H2 and H3 test how the policy enhances carbon productivity rather than proposing independent causal claims. The information consumption pilot policy also exerts an indirect impact on carbon productivity. Technological progress is a core factor affecting carbon productivity. Compared with traditional resource inputs such as capital, labor, energy, and intermediate goods, technological progress can promote industry production through the factor substitution effect or year-on-year changes. It enhances energy efficiency, optimizes resource allocation, reduces carbon emission intensity, and subsequently improves regional carbon productivity. Li et al. [8] further linked the growth of carbon productivity to the enhancement of urban green competitiveness. Lin and Zhou [9] argued that the Internet has improved energy efficiency and carbon performance by promoting industrial structure optimization effects and technology spillover effects.
Regarding technological progress, the pilot policy on information consumption can drive technological innovation. The core goal of the pilot construction is to guide enterprises to rely on the domestic market, strengthen the foundation for innovation, elevate the level of innovation, and encourage businesses to speed up the innovation and advancement of essential information technologies and products. Therefore, pilot cities will incentivize enterprises to carry out technological innovations through a series of policy support measures.
In terms of industrial structure adjustment, industrial structure optimization is the process through which the government improves the ratio of sectors within industries and among industries through policy measures, promoting rational resource allocation. The focus of the information consumption pilot is to stimulate domestic demand through consumption and cultivate new consumption growth points. Pilot cities will vigorously develop several new information consumption experience centers and create information consumption plazas, demonstration streets, and industrial parks as demonstration bases. These will offer residents various new information services and products that provide sensory experience services, thereby meeting the growing consumer demand and enhancing residents’ willingness to consume. As a key driver of economic growth in China, the digital economy has emerged as a significant force [10]. Existing studies show that consumption upgrades are becoming a powerful driving force for industrial upgrades. New consumption models and demands force enterprises to continuously adjust production scales and product types. The information technology industry has also experienced long-chain development due to these new demands, and this phenomenon has facilitated the transformation and enhancement of the industrial structure [3].
Existing research presents two viewpoints on the role of green innovation and structural upgrading: the technological optimism school and the structural determinism school. The technological optimism school argues that green patents (especially invention patents) reconstruct the production function through disruptive innovation, making them the core engine for improving carbon productivity [11]. On the other hand, the structural determinism school emphasizes that industrial structure directly reduces emission intensity through factor substitution (such as digital services replacing energy-intensive manufacturing). However, the above debate overlooks two key issues: the uniqueness of demand-side policies: traditional research focuses on supply-side tools (such as carbon taxes, R&D subsidies), whereas information consumption policies guide corporate innovation through market signals (such as consumer preferences forcing iterations of green products), which may change the interaction model between technology and structure [12]; and the moderating effect of regional institutional environments: cities in the central and western regions, constrained by weak innovation ecosystems and path dependence, may rely more on structural upgrading than on technological innovation. leading to spatial differentiation in policy effects.
Hypothesis 2 (H2).
The information consumption pilot policy enhances carbon productivity by promoting technological progress.
Hypothesis 3 (H3).
The information consumption pilot policy enhances carbon productivity by adjusting industrial structure.

2. Materials and Methods

2.1. Model Specification

2.1.1. Multi-Period Difference-in-Differences Model

This paper constructs a multi-period difference-in-differences (DID) model based on two lists of national information consumption pilot cities.
C P i t = τ 0 + φ 1 T r e a t i × P o s t i t + π i X i t + η i + ξ t + ε i t
The cities are represented by i , and the years by t . The dependent variable C P i t reflects carbon productivity. T r e a t i indicates whether a city is selected as part of the information consumption pilot cities. At the same time, another variable, P o s t i t , represents the time point when the pilot policy is implemented. If city i was included in the pilot city list in year t , the value is 1; otherwise, it is 0. T r e a t i × P o s t i t is an explanatory variable, denoted as D , the dummy variable for the information consumption pilot policy. Cities with substantial missing data were excluded from the sample. π i X i t represents the control variables and their corresponding regression coefficients. The focus of this study was on φ 1 . If φ 1 > 0, it is indicated that the policy has a contributing effect, thus verifying Hypothesis 1. The variables η i , ξ t represent city fixed effects and year fixed effects, respectively, while ε it is the random error term. In this study, the term ‘pilot policy’ refers to China’s official policy program designating selected cities for phased experimentation, distinct from the methodological term ‘pilot study’ denoting small-scale exploratory research.

2.1.2. Density Estimation

The kernel estimation method was used to intuitively reveal the evolving trends of carbon productivity in Chinese cities. This approach avoids errors caused by unreasonable assumptions about the data distribution. It offers the advantages of high goodness-of-fit and robustness in the estimation results [13]; Stief and Baranowski [14] made it a commonly used method for analyzing dynamic time-series evolution. The kernel density function is as follows:
f x = 1 N h i = 1 N K ( X i x h )
In this formula, f x represents the kernel density estimate, K ( X i x h ) is the kernel density function, and h is the bandwidth. The Gaussian kernel density function was used to analyze the dynamic distribution of the computed carbon productivity in cities. The Gaussian kernel density function is as follows:
K x = 1 2 π e x p ( x 2 2 )

2.1.3. Mediation Effect Model

To identify the pathway mechanism through which the information consumption pilot policy enhances carbon productivity, we referred to the study by Liu et al. [1] and constructed the following model:
M it = α 0 + α 1 D I D + α 2 C o n t r o l i t + u i + v t + ε i t
i represents the city, t represents the year, and M i t means the mediator variable, which includes the technology resource density ( T e c h ) [15], represented by the green patents total [16]. The industrial structure ( R s ) [5] is reflected by the asset condition of industrial enterprises exceeding a specified size [9]. D I D indicates whether a city is a pilot city or not, C o n t r o l i t represents control variables, u i and v t represent mean regional and time fixed effects, and ε i t represents the random error term.

2.1.4. Spatial Heterogeneity Model

Referencing Wu and Guo [17], the following model was established to test the spatial heterogeneity of the information consumption policy effects:
C P i t = β 0 + β 1 D I D i t + s = 50 500 δ s N i t S + λ Z i t + ν i + μ t + ε i t
This equation is based on the difference-in-differences (DID) model, with a new control variable N i t S , where s represents the geographical distance between cities (in kilometers; s ≥ 50), calculated using spherical distance to determine the actual distance between any two cities. Specifically, if in a given year t there is an information consumption pilot city within the range of ( s 50 , s ] kilometers around city i , then N i t s takes the value of 1; otherwise, it is 0. For example, N i t 200 indicates whether in year t an information consumption pilot city existed within 100 km of city i . Therefore, the coefficient δ s of the control variable N i t S essentially reflects the impact of neighboring cities. This paper presents regression results for various distance thresholds, such as s = 50, 100,…, 450, 500.

2.2. Variable Selection

2.2.1. Dependent Variable

This study accounts for urban carbon emissions from four sources: direct energy consumption, electricity, transportation, and heat supply.
The carbon emission calculation formula for direct energy consumption is as follows, with energy types including natural gas, liquefied petroleum gas, and other fossil fuels. The emission factor ( E F ) uses the default values from the IPCC 2006 (e.g., natural gas: 2.53 kg CO2/kg).
C O 2 D i r e c t = ( F u e l i × N C V I × E F i )  
The carbon emission for electricity consumption is as follows. China is divided into six major power grid regions: North China, northeast, East China, Central China, northwest, and southern regions. The emission factor is based on the annual regional power grid baseline emission factors published by the Ministry of Ecology and Environment (e.g., for the East China grid in 2020, the factor is 0.6379 kg CO2/kWh).
C O 2 E l e c t r i c i t y = C i t y l e v e l   e l e c t r i c i t y   c o n s u m p t i o n × R e g i o n a l   g r i d   e m i s s i o n   f a c t o r  
The carbon emission for transportation is as follows, based on data from the China Statistical Yearbook transport sector. The energy consumption per unit of passenger and freight traffic is calculated by energy type (gasoline, diesel, etc.). Emission factors: gasoline (2.98 kg CO2/L), diesel (3.16 kg CO2/L).
C O 2 T r a n s p o r t = ( P a s s e n g e r F r e i g h t   v o l u m e × E n e r g y   i n t e n s i t y   p e r   u n i t × E F f u e l )
The carbon emission for thermal energy consumption is as follows, with thermal efficiency set at 70% (according to GB 15317-2009 [18] Energy Saving Monitoring of Coal-Fired Industrial Boilers). Raw coal parameters: lower heating value 20,908 kJ/kg, standard coal coefficient 0.7143 kgce/kg, emission factor 2.53 kg CO2/kg.
C O 2 H e a t = H e a t   s u p p l y T h e r m a l   e f f i c i e n c y × C o a l   c a l o r i f i c   v a l u e × E F c o a l  
Finally, the total carbon emissions of the city are as follows.
C O 2 T o t a l = C O 2 D i r e c t + C O 2 E l e c t r i c i t y + C O 2 T r a n s p o r t + C O 2 H e a t  
Typically, carbon productivity is defined as the ratio of gross domestic product (GDP) to carbon dioxide emissions over a specified time frame, drawing on the environmental production and directional distance function introduced by FARE [19]. This study incorporated energy consumption as an input indicator and carbon emissions as undesirable output. In line with the analysis above, this study selected labor, capital, and energy as the input variables for carbon emission efficiency, with the expected output being urban GDP and the undesirable output being the city’s carbon emissions. Regarding the method of calculation, considering that the standard SBM (slack-based measure) model often results in multiple cities having an efficiency score of 1, which makes it impossible to compare carbon emission efficiencies, this study adopted the super-efficiency SBM model proposed by Andersen and Petersen [20]. This model, which accounts for undesirable outputs, is used to calculate carbon emission efficiency.
E ff = min 1 m i = 1 m x ¯ i x i k 1 c 1 + c 2 r = 1 c 1 y ¯ r + y r k + + q = 1 c 2 y ¯ q y q k s . t . x ¯ j = 1 , i k n λ j x i j , y ¯ + j = 1 , j k n λ j y r j + , y ¯ j = 1 , j k n λ j y q j , x ¯ x k , y ¯ + y k , λ j 0 i = 1 , 2 , , m ; j = 1 , 2 , , n ; k = 1 , 2 , , m ; r = 1 , 2 , , c 1 ; q = 1 , 2 , , c 2
In the above equation, E f f represents the carbon emission efficiency of the city; x i k denotes the elements in the input matrix; the expected output y r k + and undesirable output y q k are represented by urban GDP and carbon emissions, respectively; λ j is the weight vector, representing the weights of each decision-making unit; n is the number of decision-making units; m is the number of input indicators; and c 1 and c 2 represent the numbers of expected and undesirable output indicators, respectively. The specific calculation is shown in Table 1.

2.2.2. Control Variables

The control variables included the fiscal investment intensity (FIE) [22], represented by the ratio of fixed asset investment to fiscal expenditure; government self-sufficiency capacity (AIS) [23], indicated by the proportion of fiscal revenue to fiscal expenditure; comprehensive utilization rate of industrial solid waste (CISW) [24]; and economic development level (ECO) [25], represented by the logarithm of per capita regional GDP. The fiscal investment intensity measures the ratio of government investment in fixed assets relative to fiscal expenditure. This variable reflects the extent of government financial input into infrastructure construction, social development, and other areas, as well as the efficiency of fiscal resource allocation. The government’s self-sufficiency capacity is commonly used to assess the sustainability of fiscal policies and the economic stability of a country. It reflects the government’s fiscal independence and self-supply ability when performing public functions. High self-sufficiency indicates that the government can rely on its own revenue for fiscal expenditures, reducing external dependence and enhancing the economy’s resilience and policy autonomy. The regional differences in solid waste management policies (e.g., the 14th Five-Year Plan for Circular Economy Development) may affect carbon productivity through technological diffusion channels, so the comprehensive utilization rate of industrial solid waste is included as a control variable. The comprehensive utilization rate of industrial solid waste is used to measure the degree of resource utilization, reduction, and harmlessness of solid waste generated in industrial production processes. This variable allows for the evaluation of a company’s performance in resource utilization and environmental protection. The efficient use of industrial solid waste plays a vital role in attaining sustainable development. A higher utilization rate indicates significant progress in reducing environmental burdens and promoting resource recycling in industrial production.
The economic development level is typically measured in terms of per capita regional GDP, which reflects the economic development status of a region or country. It serves as a basic indicator for evaluating economic vitality, people’s living standards, and industrial structure.

2.2.3. Mediator Variables

This study analyzed the mediating effects from two aspects: green patent innovation [2] and the advancement of industrial structure [9]. Specifically, the green patent innovation (GPI) was represented in terms of the quantity of green patents total. The advancement of industrial structure (IND) was evaluated by comparing the value added of the tertiary industry with that of the secondary industry. This study uses the ratio of the value added of the tertiary industry to the value added of the secondary industry (IND) as a proxy variable for industrial structure upgrading. The theoretical basis and literature support can be traced back to the following research: China’s 14th Five-Year Plan clearly proposes “increasing the proportion of the service industry” as a core path for low-carbon transformation, and the IND indicator is highly aligned with policy objectives. At the same time, Fankhauser and Jotzo [26] verified the positive relationship between industrial structure servicization (the increase in the ratio of the tertiary industry to the secondary industry) and carbon productivity.

2.2.4. Data Sources

This study selects panel data from 275 prefecture-level cities in China from 2006 to 2022, based on the continuity and availability of the data. Cities with a missing data rate exceeding 30% were excluded, ensuring regional representativeness by covering the three major economic belts: Eastern, Central, and Western China. Economic and social variable data are sourced from the China City Statistical Yearbook (2006–2022 volumes), carbon emission data are calculated using the energy consumption data from the China Environmental Statistics Yearbook combined with the IPCC coefficient method, and green patent data come from the “Y02” class patent public records of the National Intellectual Property Administration (CNIPA). To control for outliers, the continuous variables were winsorized at the 1st and 99th percentiles, and variables with less than 5% missing values were supplemented using linear interpolation. The definition and basis of the variables are detailed in Section 2.2 on variable selection.

3. Results

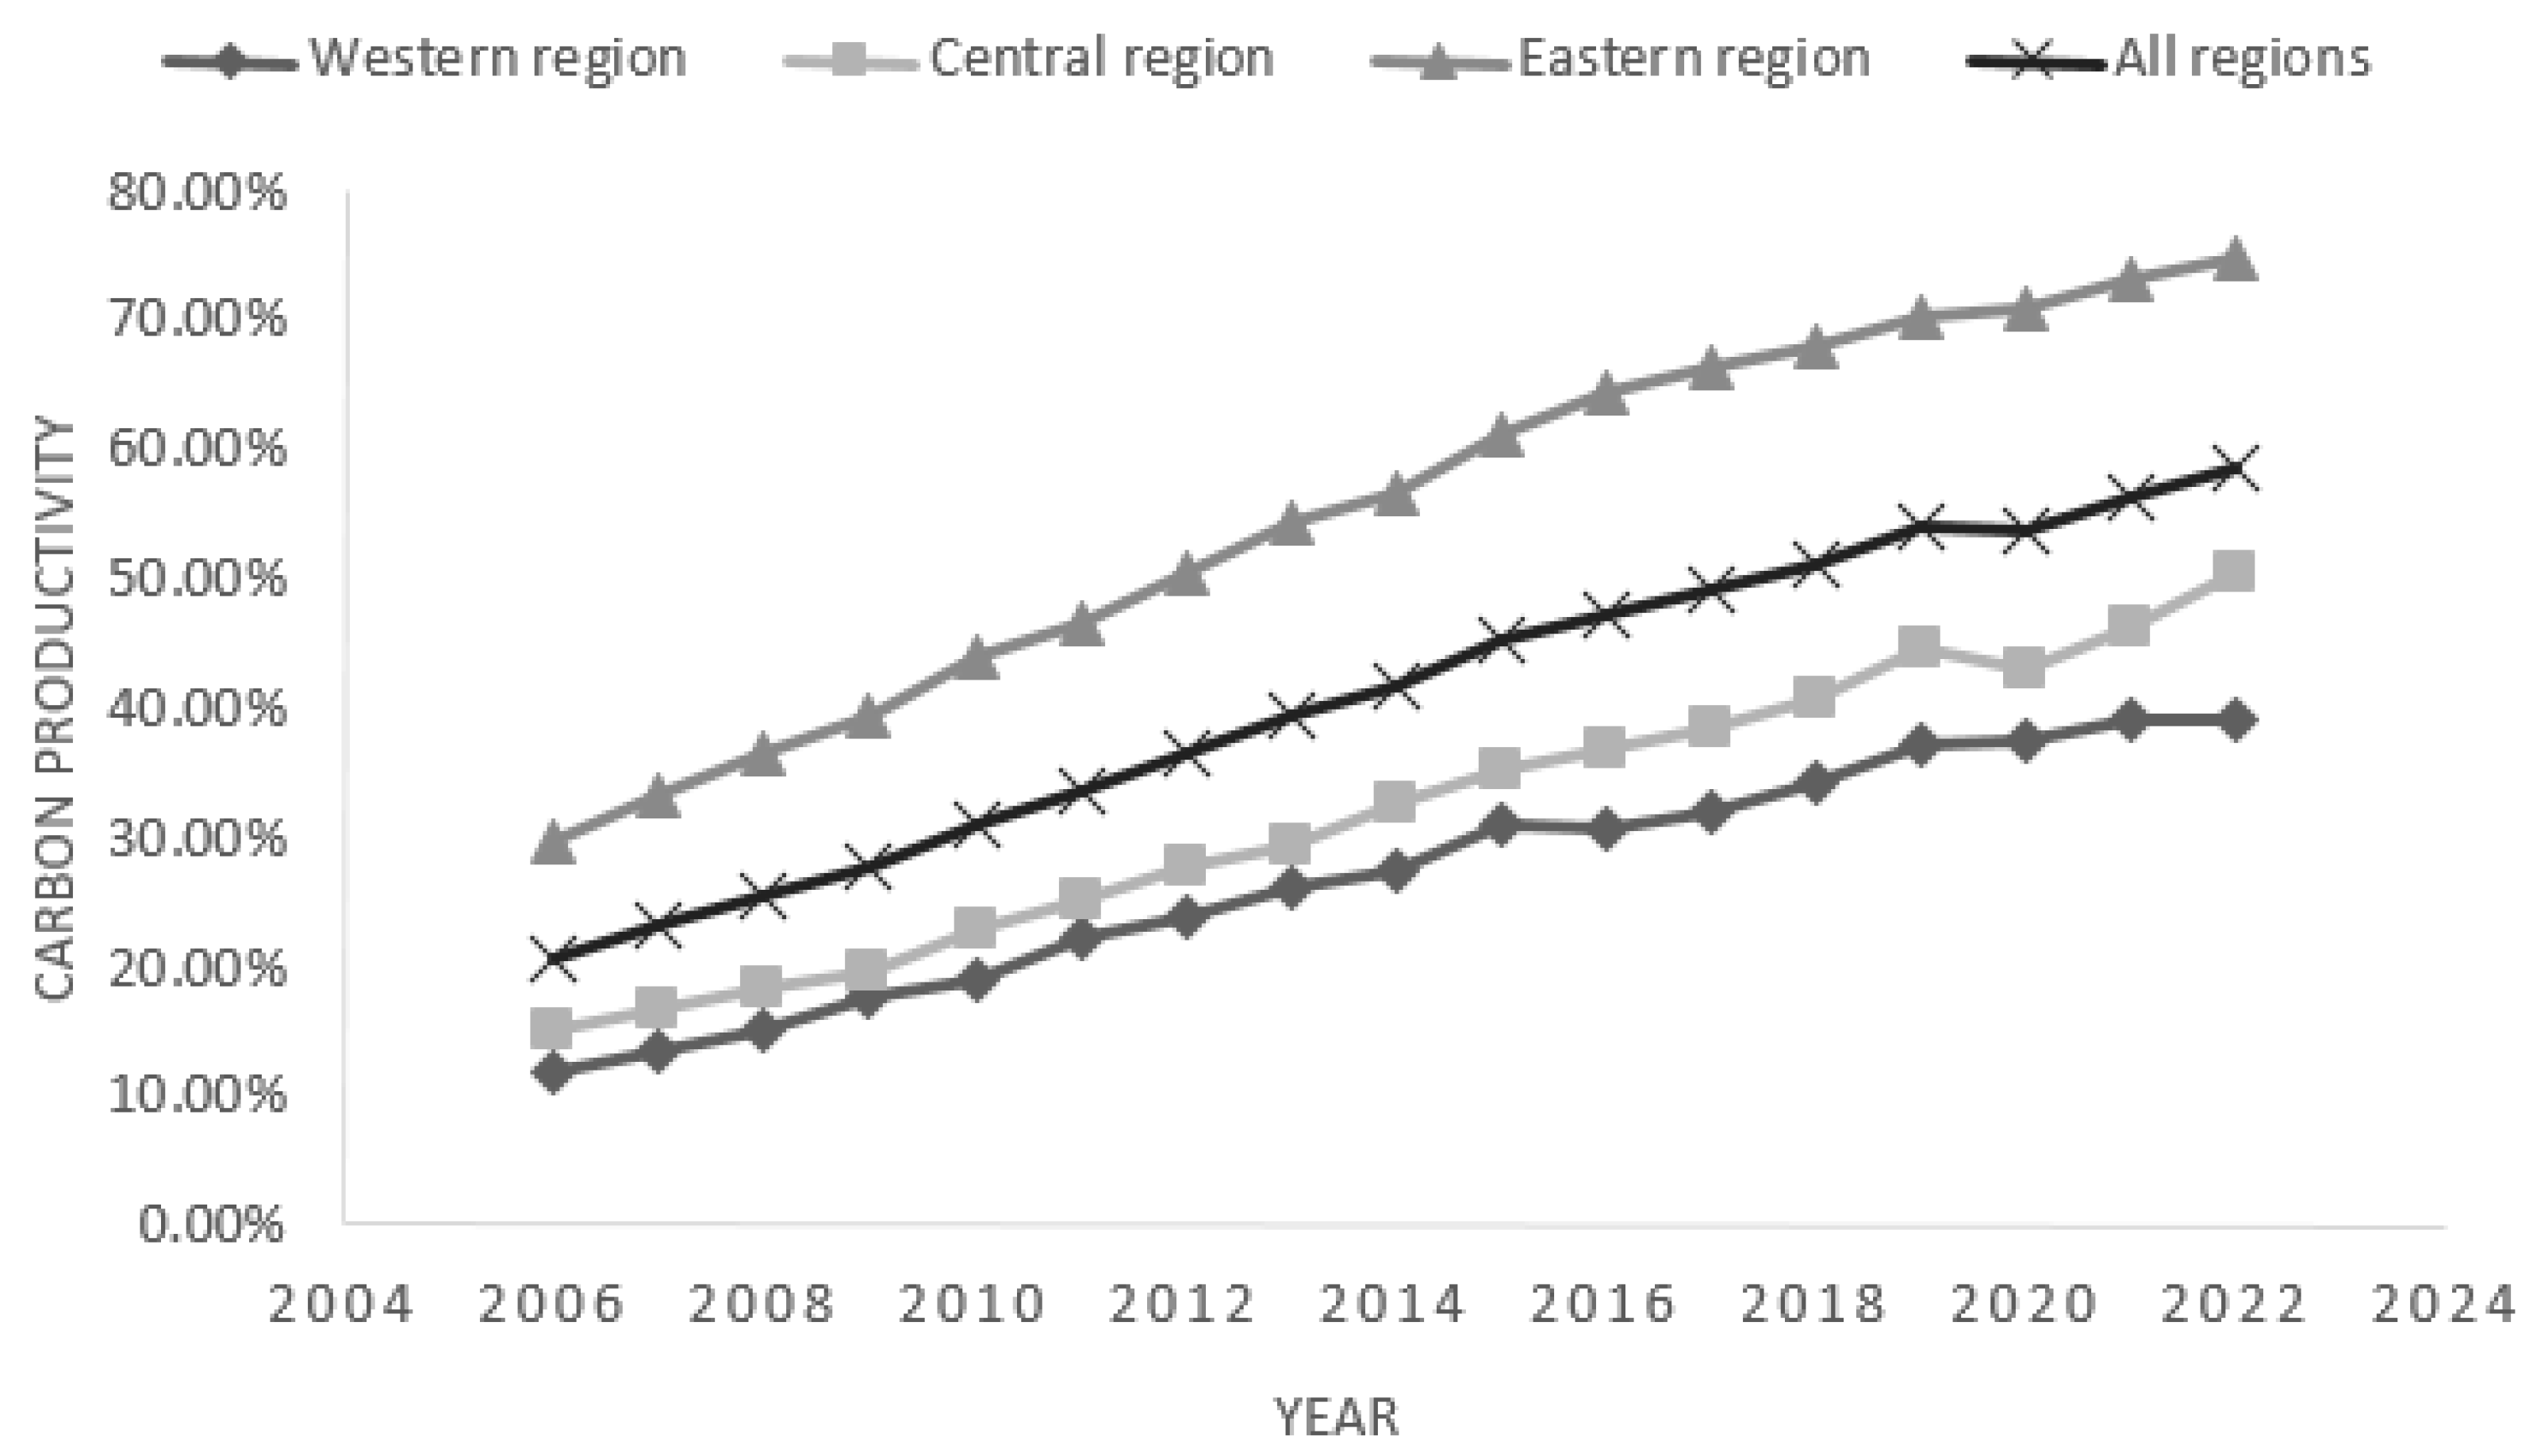
3.1. Carbon Productivity Trends over Time

To assess the changes in carbon productivity across different regions of China from 2006 to 2022, we analyzed the improvement in carbon productivity in various regions. The trend of these changes reflects the effectiveness of each region in promoting the transition to a low-carbon economy. Overall, the national carbon productivity has shown significant growth. The results are shown in Figure 1. Overall, from 2006 to 2022, it exhibited a significant growth trend, reflecting the nation’s achievements in driving economic transformation. Carbon productivity increased from 20.66% in 2006 to 58.40% in 2022, a cumulative increase of about 37.74 percentage points over the span of more than a decade, with an average annual increase of nearly 2.3 percentage points. This highlights China’s efforts and accomplishments in advancing a low-carbon economy.
In summary, although the eastern region has maintained a leading position in carbon productivity, the central region’s growth rate is gradually catching up; although the western region is experiencing significant improvement, it continues to make less progress than the eastern and central regions. With the implementation of green energy policies and the ongoing optimization of industrial structures in various regions, the central and western regions are expected to narrow the gaps with the eastern region in the coming years, promoting more balanced national carbon productivity growth and further assisting China in achieving its carbon peak and carbon neutrality goals.

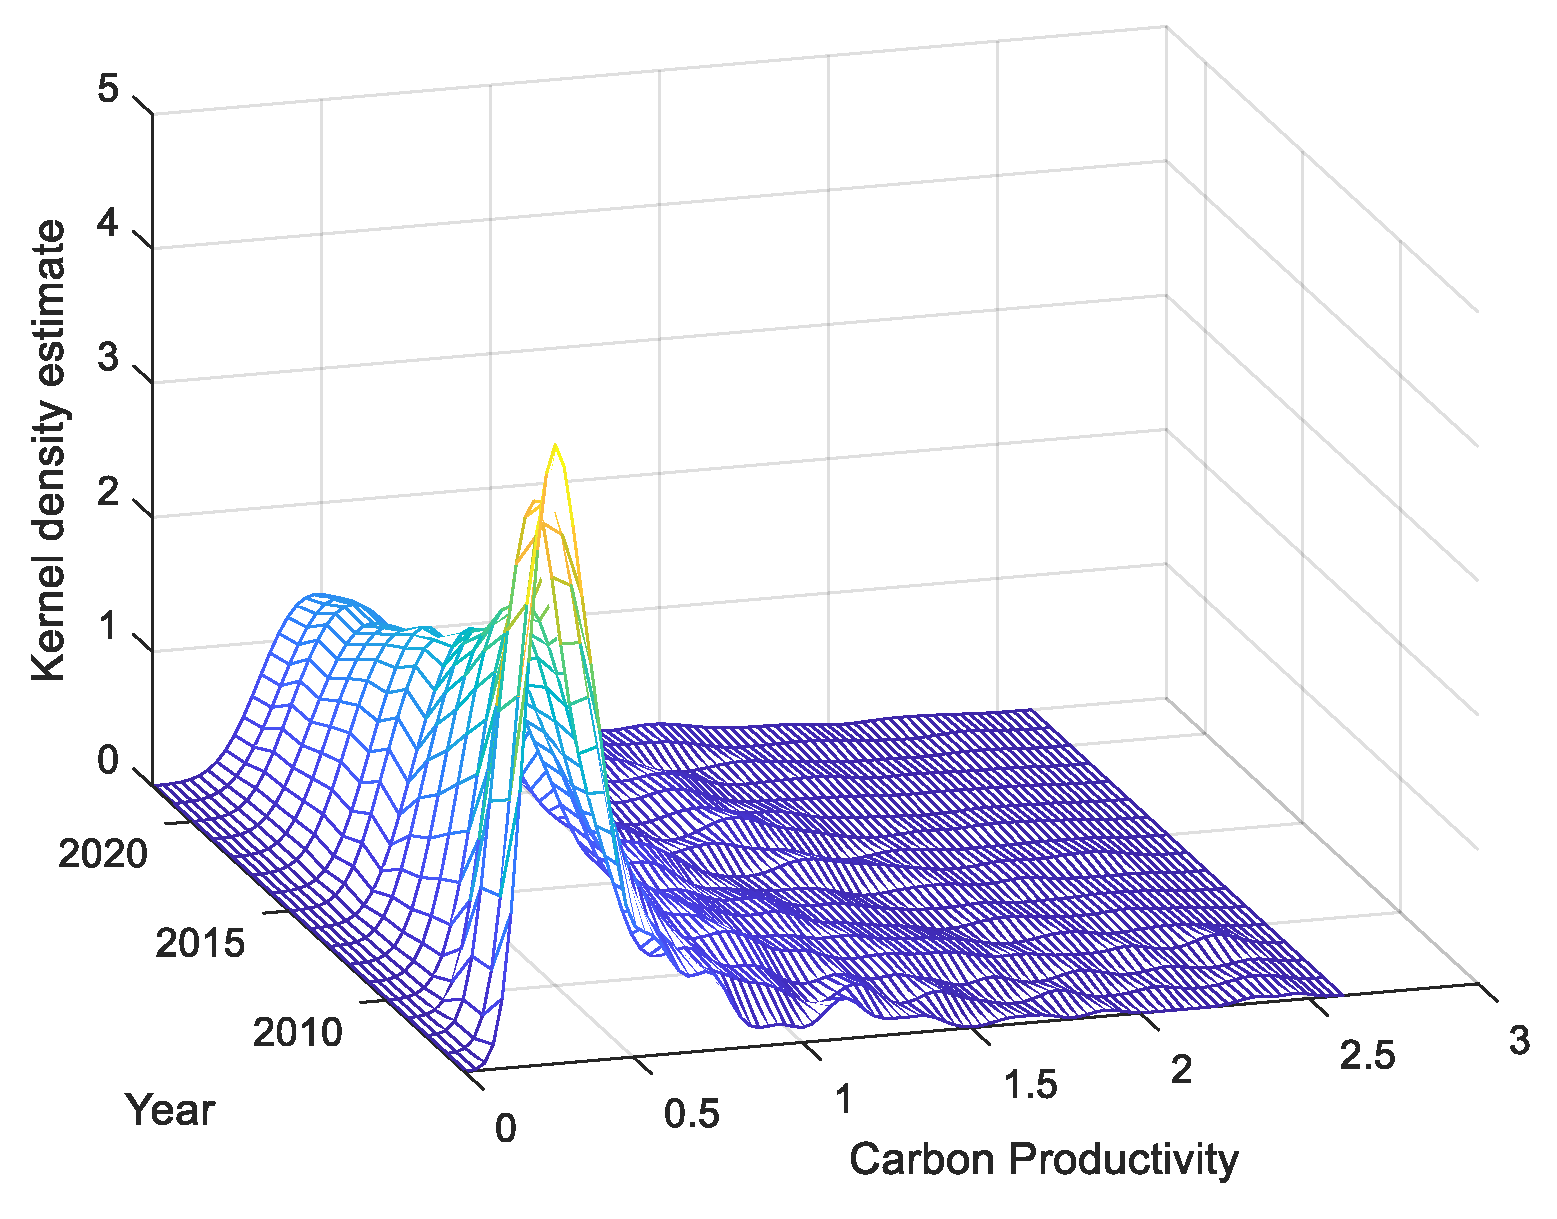
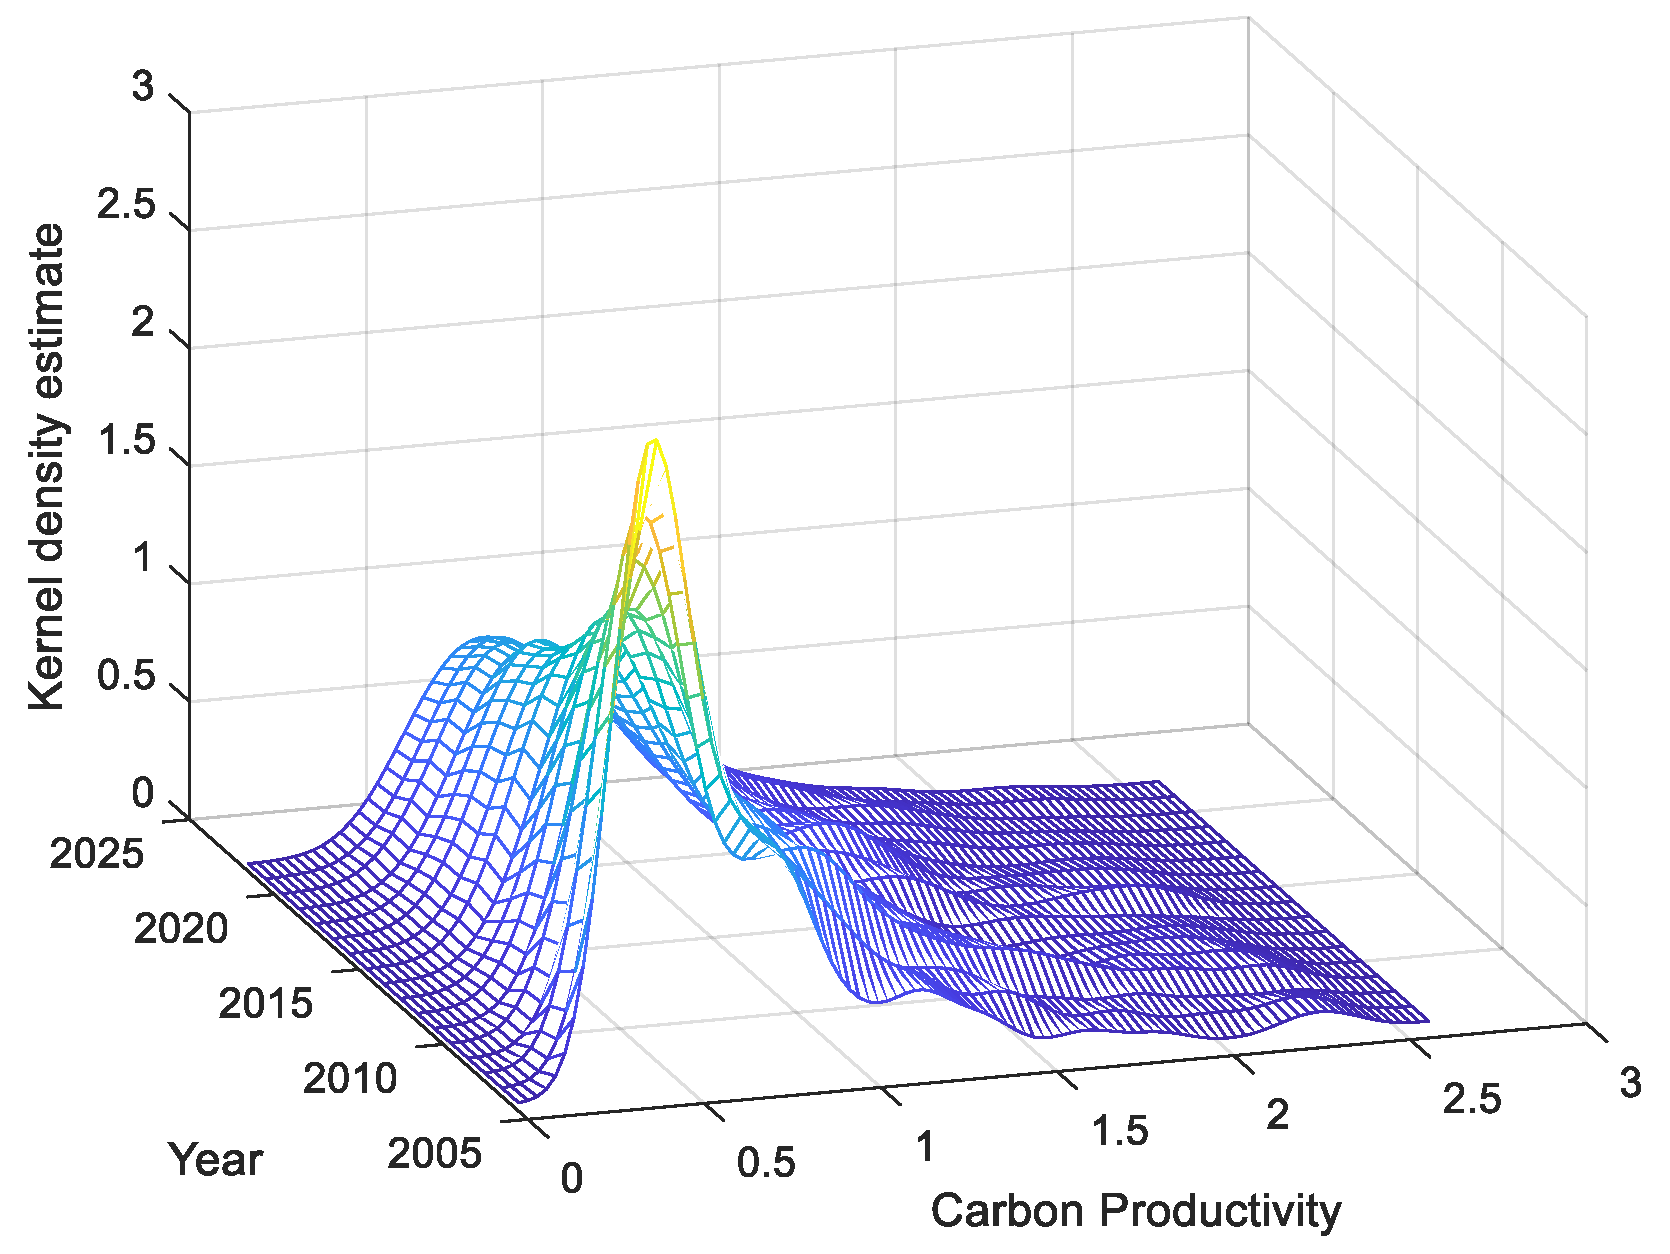
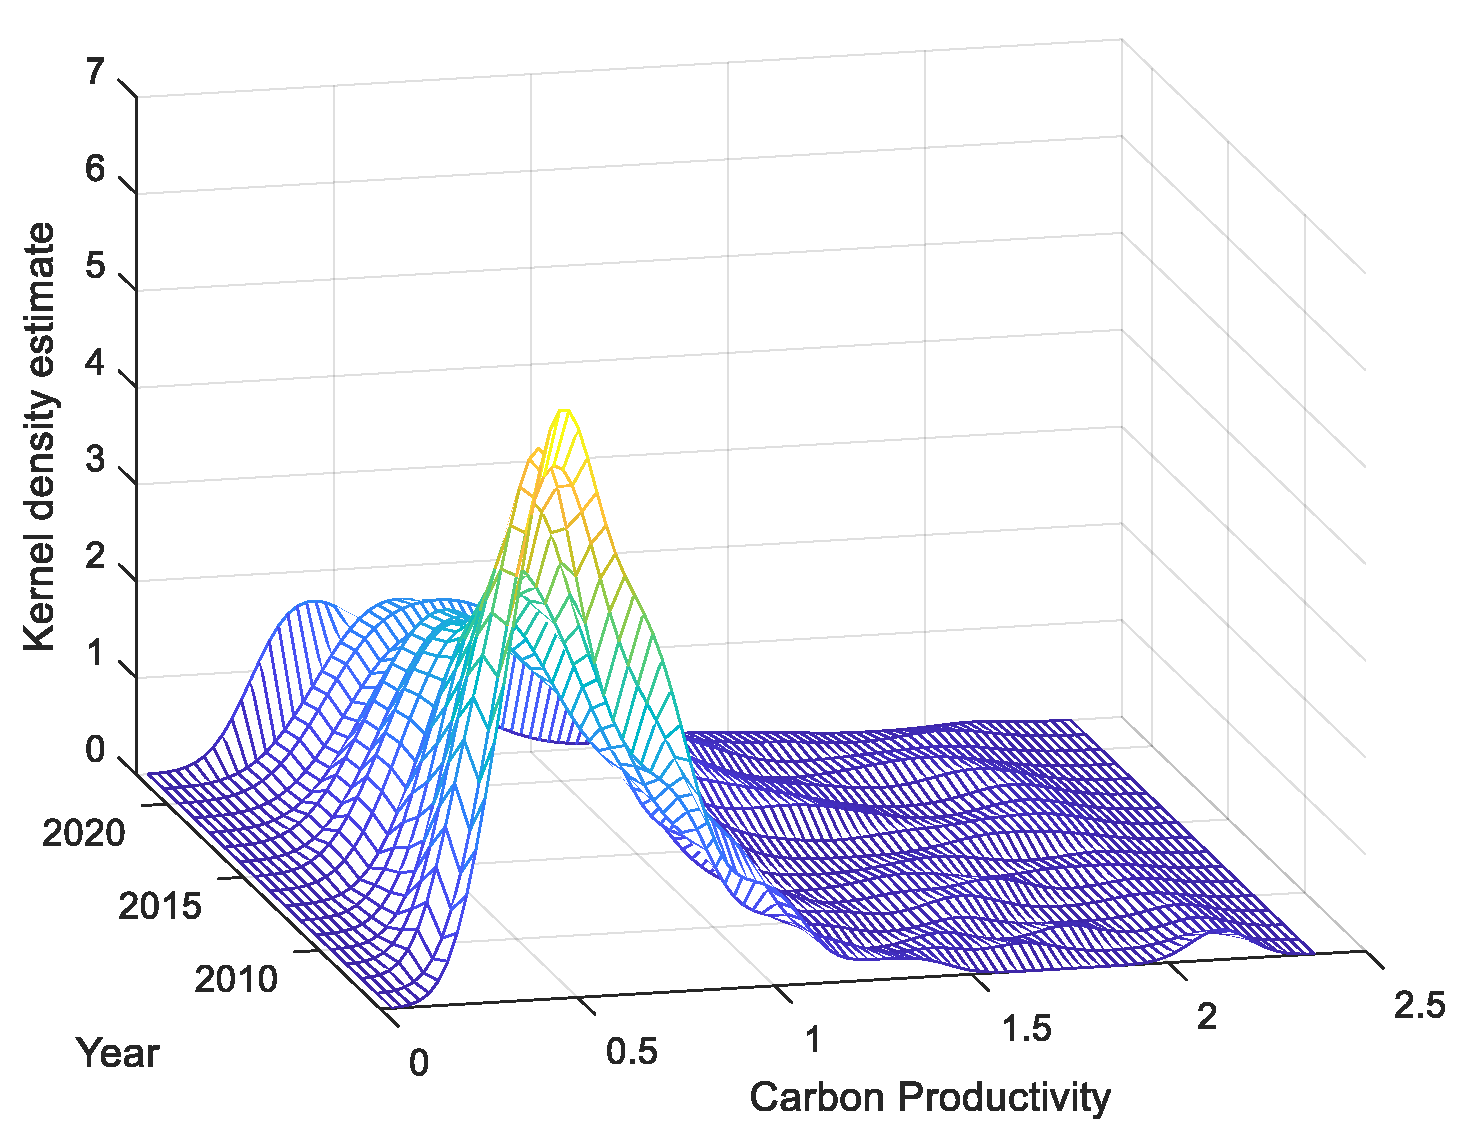
3.2. Carbon Productivity Kernel Density Analysis

This study further used Matlab R2024a to plot the kernel density curves of carbon productivity for the entire country as well as for all areas to assess the dynamic evolution of carbon productivity and regional differences. As shown in Figure 2, Figure 3, Figure 4 and Figure 5, the results reflect a gradual improvement in China’s carbon productivity. In terms of the distribution pattern, the peak heights of the curves exhibit a downward trend, while the width of the main peak increases, shifting from a sharp peak to a broader one. This suggests that the disparity in carbon productivity levels among Chinese cities has widened, possibly indicating a “the strong get stronger” effect. This means that the carbon productivity in the central region was more concentrated during these years, with an overall higher level. In terms of distribution extensiveness, the kernel density curve exhibits a distinct rightward tailing phenomenon. This suggests that the gap between the central and western regions is gradually narrowing, indicating a reduction in the imbalance of economic development and growth between these areas. In contrast, the kernel density curve for the eastern region shows a unimodal distribution, suggesting that there is no apparent polarization in carbon productivity in the eastern region. Furthermore, the carbon productivity levels of the vast majority of the urban samples generally show an upward trend. However, this growth is accompanied by a gradual widening of the gap between cities.

3.3. Benchmark Regression Results

The DID method was used to determine whether the policy could impact the cities’ carbon productivity. As shown in Table 2, it is the result of the benchmark regression. To enhance the robustness of the benchmark regression and explore whether information consumption promoted an improvement in carbon productivity, in column (1), the model does not include control variables, nor does it control for year and city fixed effects. In column (2), without adding control variables, year and city fixed effects are controlled. Column (3) represents the model with control variables and both time and city fixed effects. The regression results indicate that the information consumption pilot policy has a positive effect on urban carbon productivity at the 1% significance level, suggesting that the implementation of the information consumption pilot policy has effectively increased urban carbon productivity, which confirms Hypothesis 1.

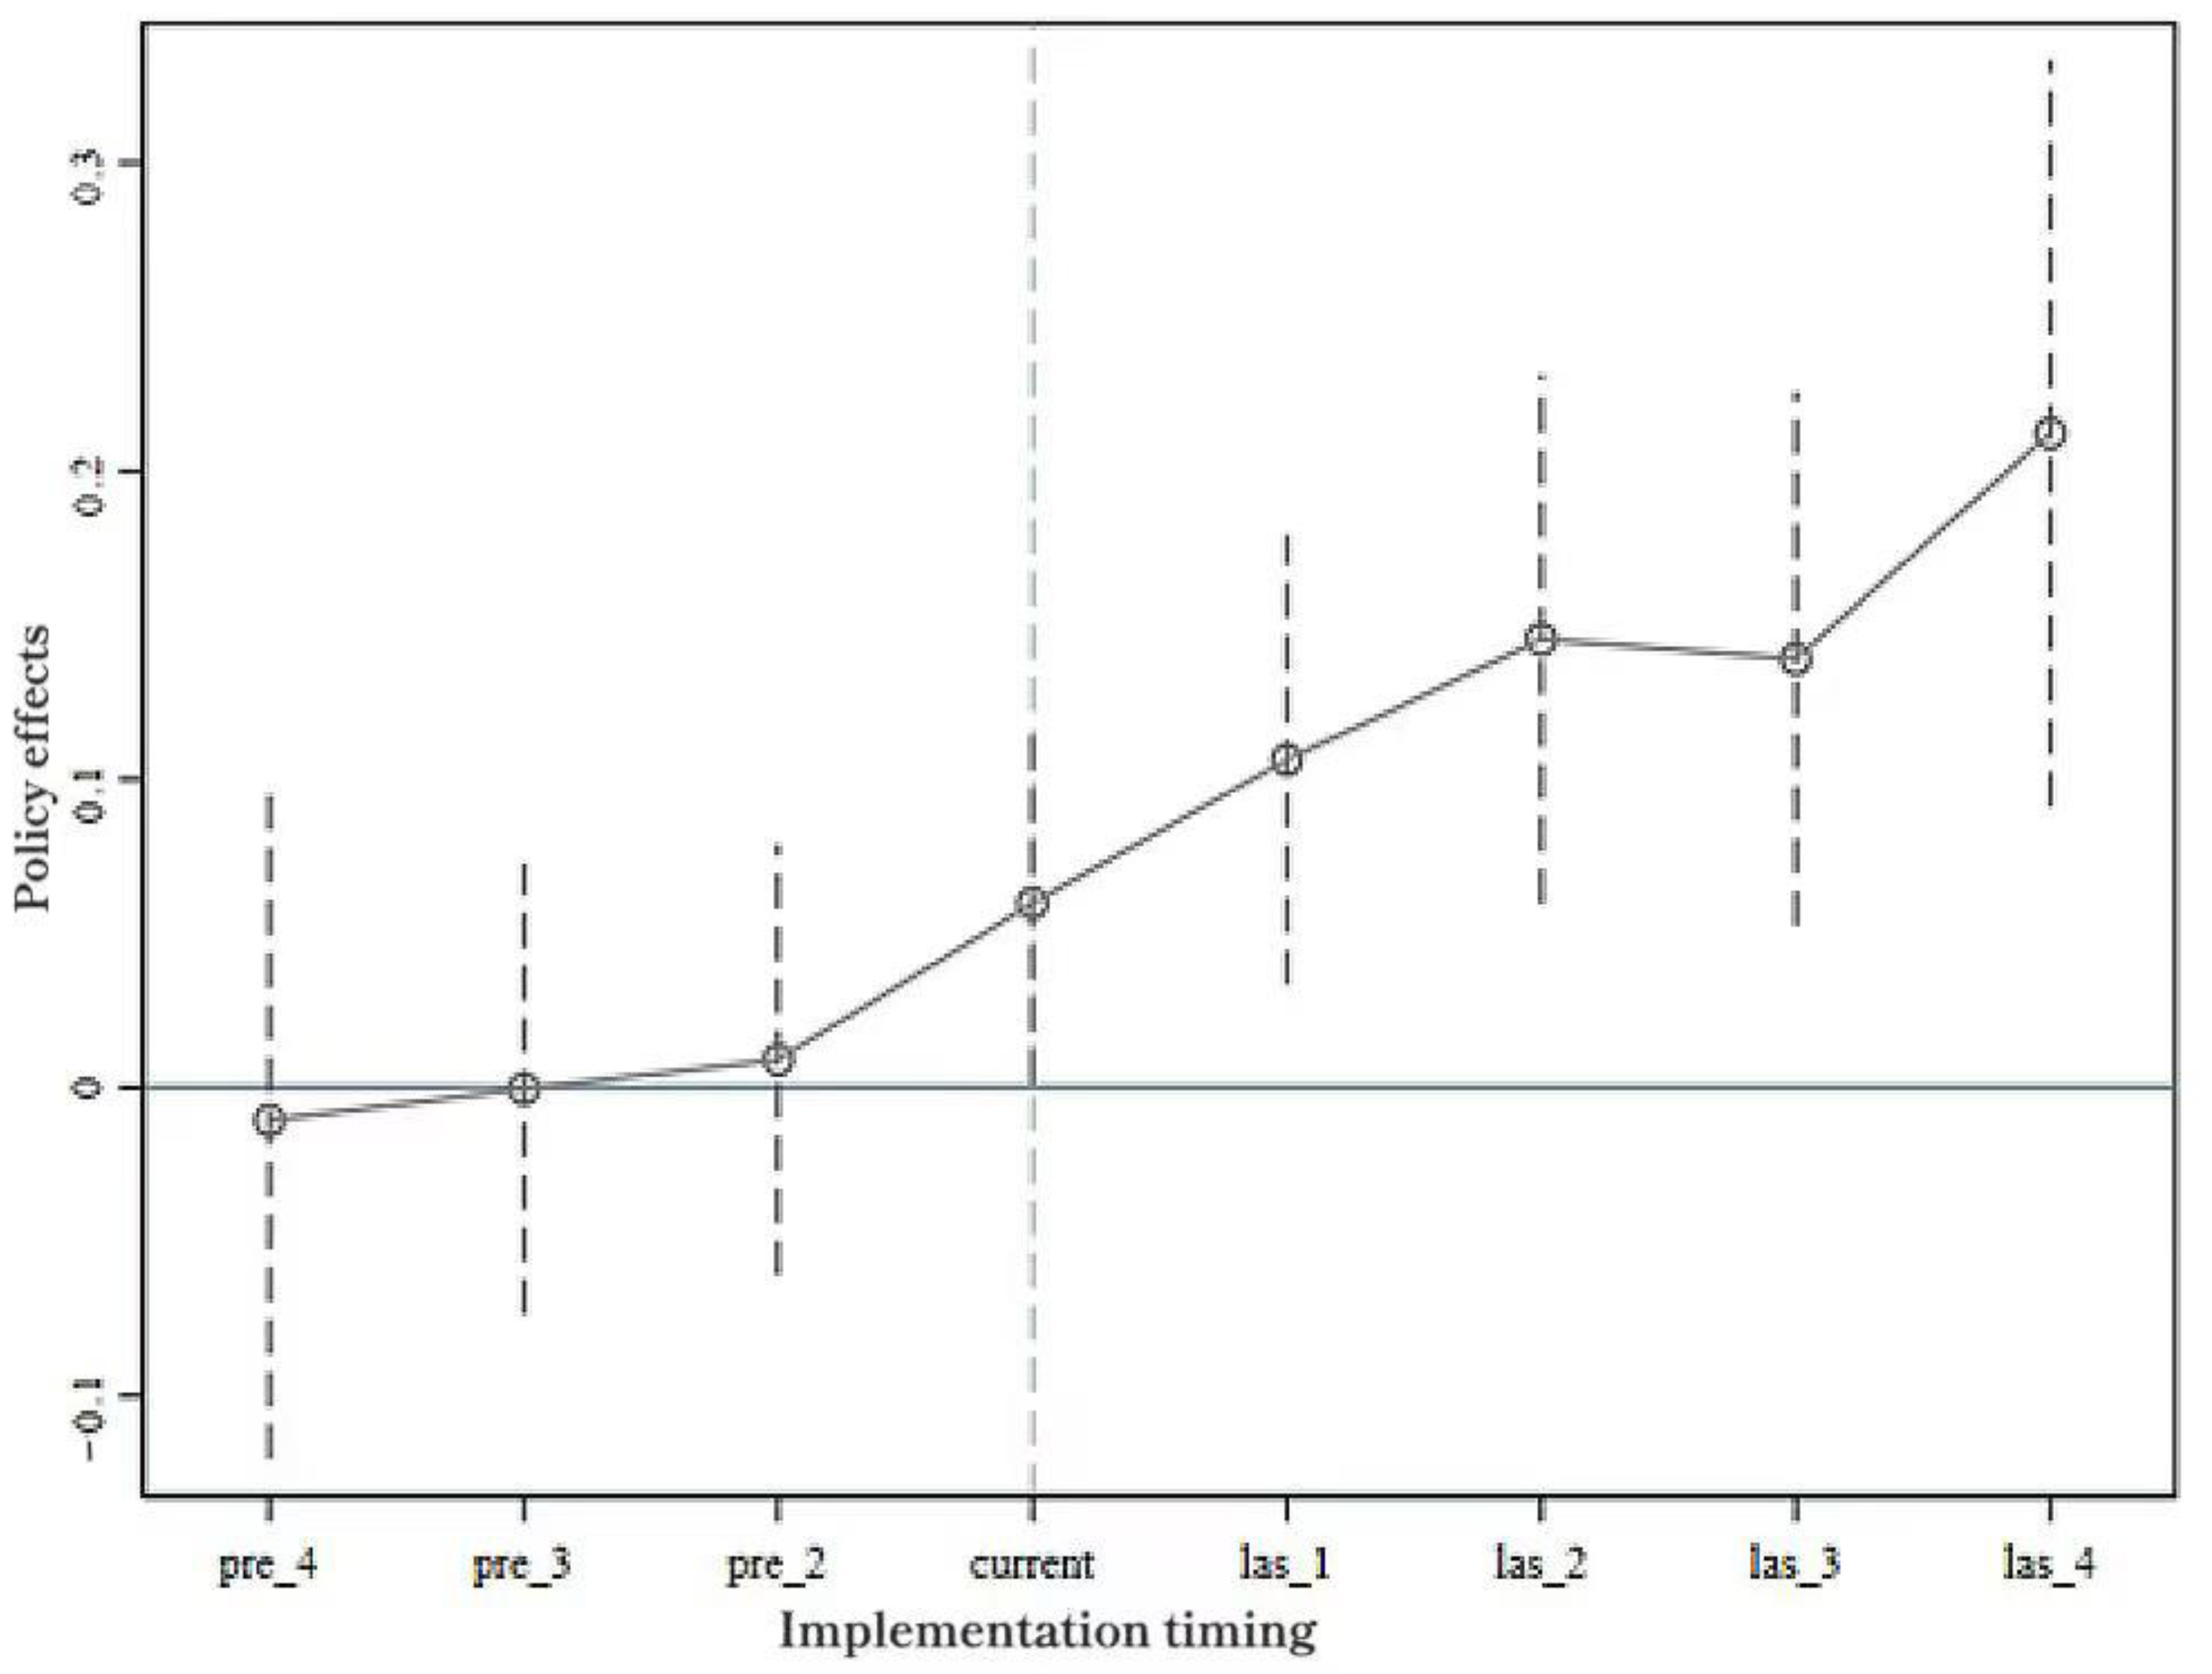
3.4. Identification Condition Test
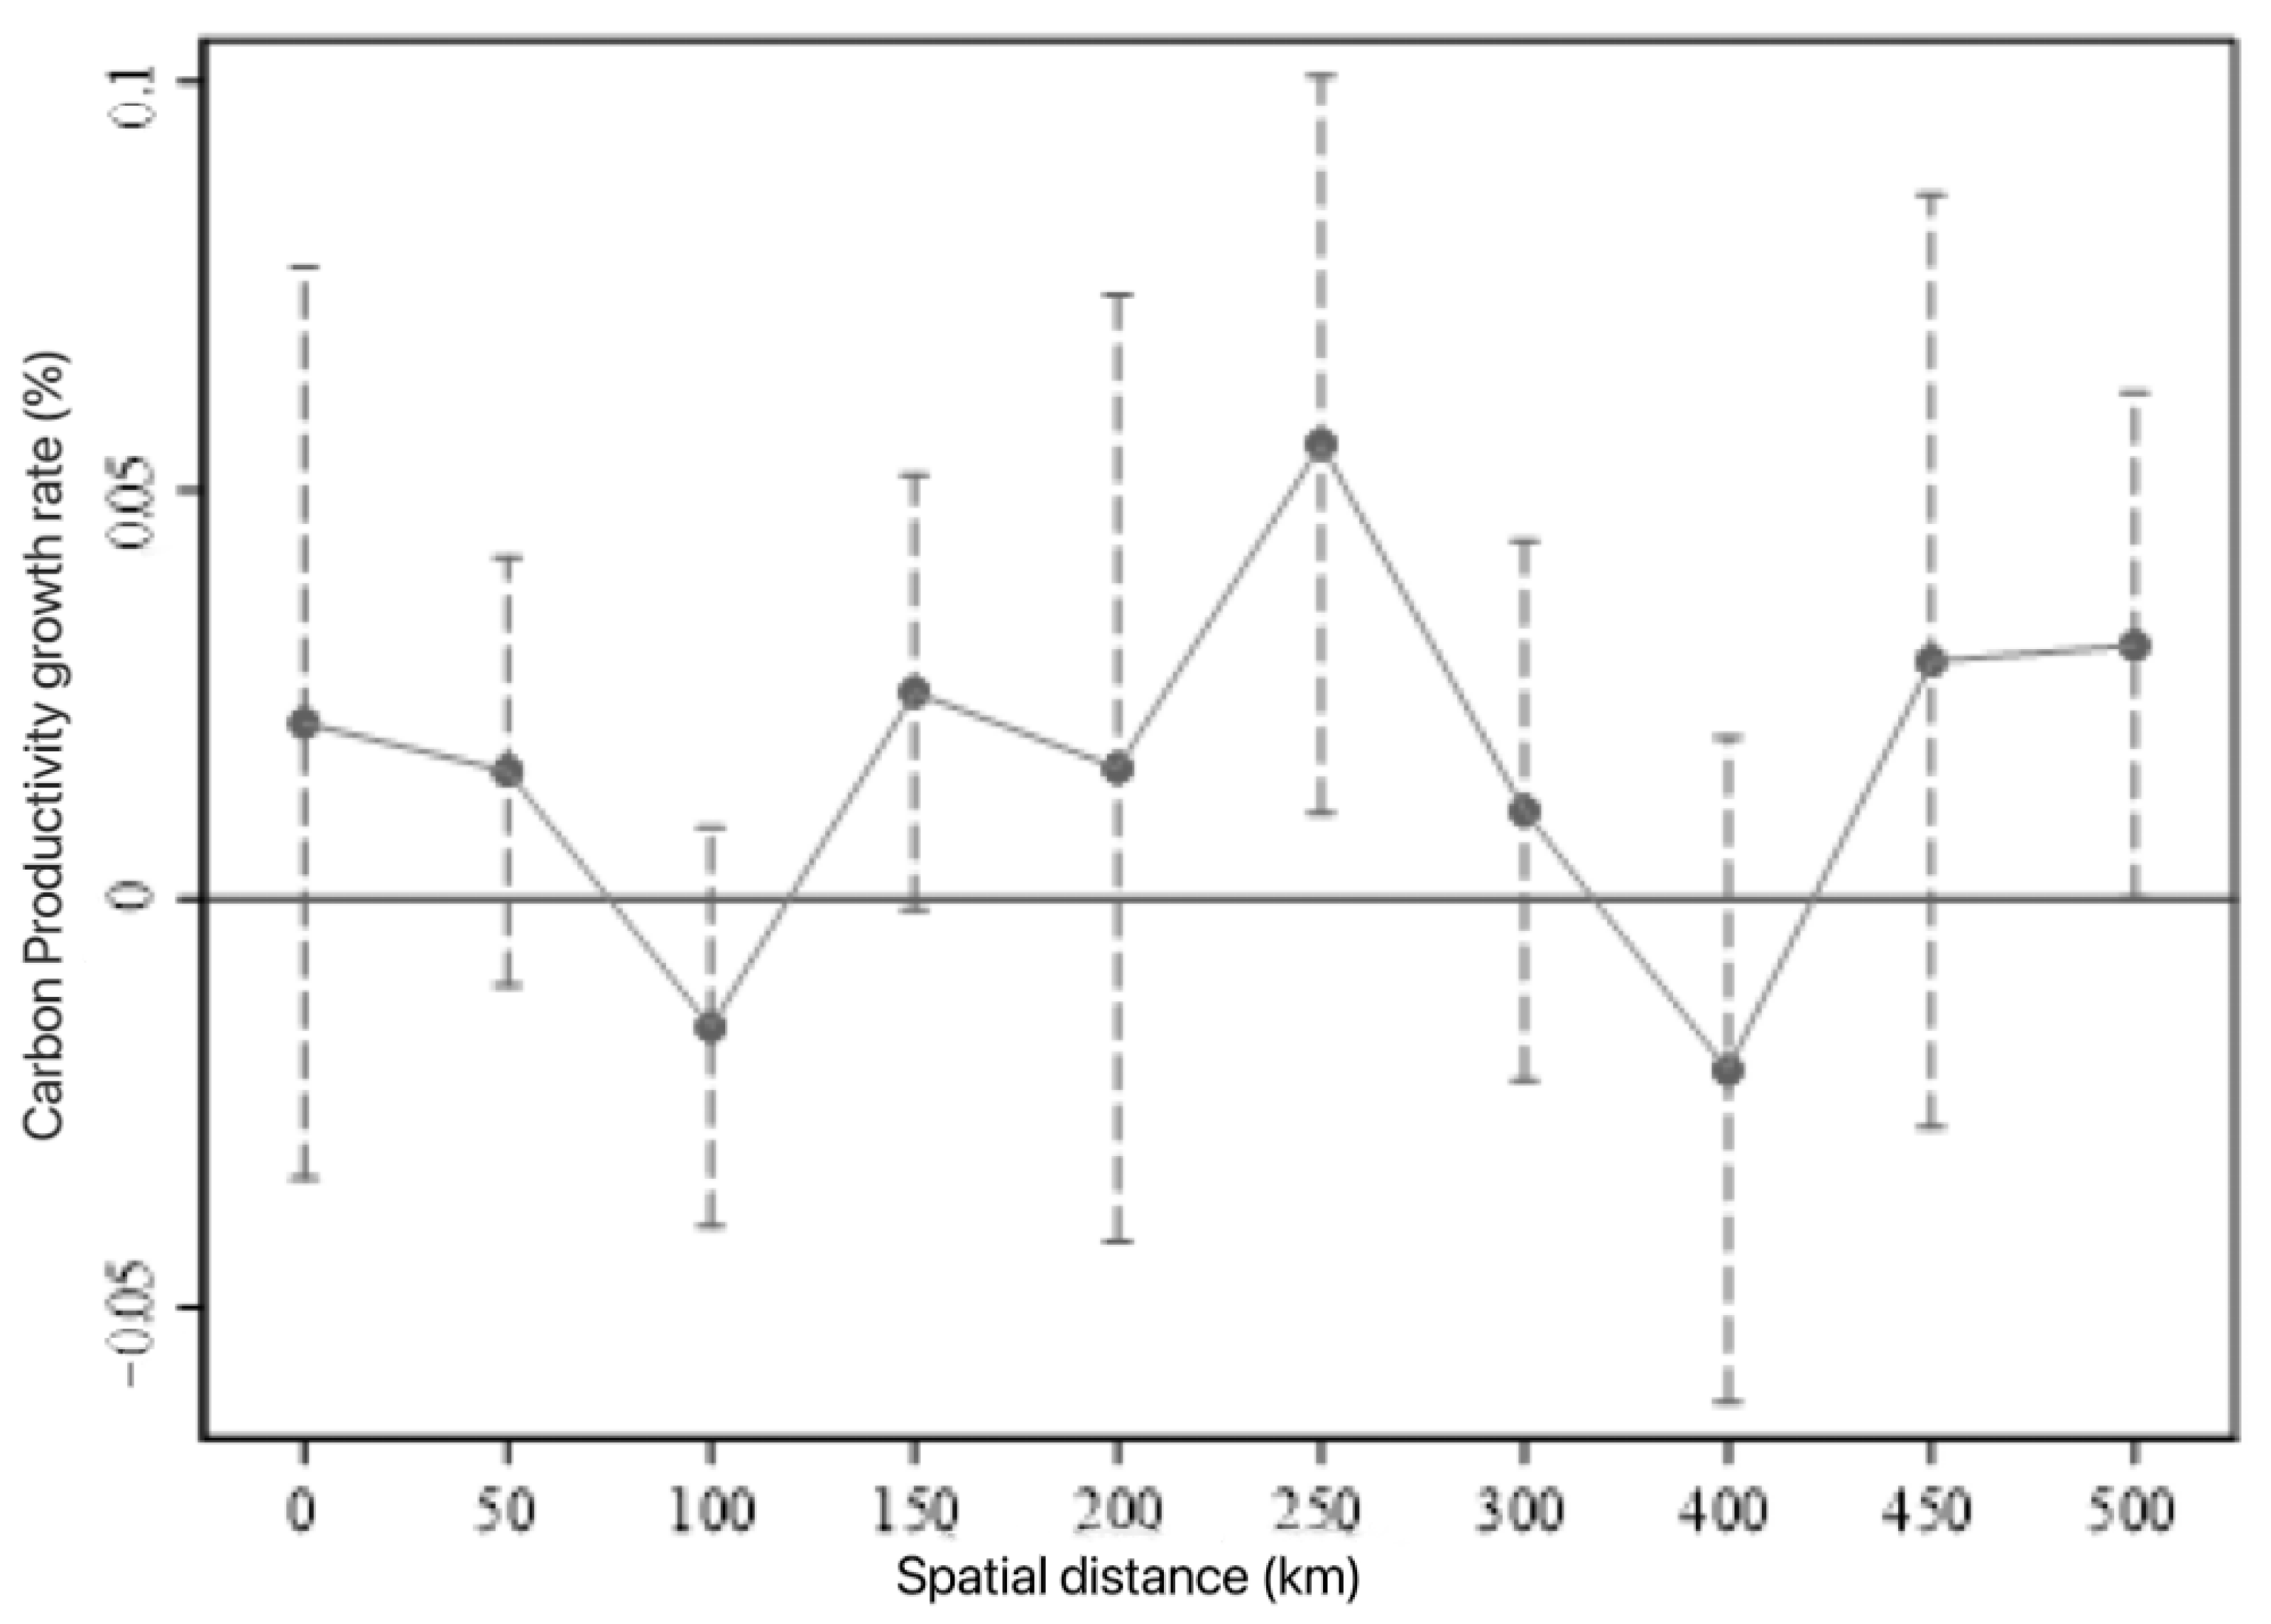
In order to ensure that there were no systematic differences between the two types of cities, first, we performed a parallel trend test. The results are shown in Figure 6. Given that the sample data cover a 17-year period, with a substantial time span before and after the policy’s implementation, the decision was made to trim the tails of the time dummy variables in the model. The interaction terms, the implementation year, and the 4 years after were used to construct the following model: D i t k represents a series of dummy variables for the 4 years before and 4 years after the policy’s implementation, with the following assignment rule: a c t i o n i represents policy implementation in city i . If D i t 4 = 1 , then y e a r a c t i o n i = k and D i t k = 1 ; if y e a r a c t i o n i 5 , then D i t 5 = 1 . β k is the coefficient we focus on, which reflects the impact between policy and CP. If this parameter is not significant, the parallel trend test has been passed.
It is not difficult to observe that, in the four years prior to the policy’s implementation, the corresponding regression coefficients did not reach a significant level in the model. This result indicates that the pilot cities and non-pilot cities exhibited similar trends in carbon productivity changes during the test. This indicates that, prior to the introduction of the policy, there was no notable difference in the trends of carbon productivity changes between the two groups. From a dynamic effects perspective, the regression coefficients for the four years following the policy’s implementation were all statistically significant. Overall, these results strongly support Hypothesis 1.

3.5. Placebo Test

Referring to the research method of Qin [27] to ensure the effectiveness of the policy regarding carbon productivity and exclude the influence of other factors, we used the distribution of the Chinese pilot policy on information consumption in the baseline regression. The results are shown in Figure 7. The pseudo-policy dummy variable was generated through 500 counterfactual samples using the permute command in Stata 17, and regression was performed with the aforementioned DID model. The results show that the average counterfactual regression coefficient for carbon productivity is zero, and the deviation from the baseline regression coefficient indicates that, based on the distribution of p-values, the vast majority of the experimental results are not significant, implying that the improvement in carbon productivity was caused by the policy, and other factors can be ruled out.

3.6. Robustness Tests

This study conducted the following robustness tests: (1) Sample selection bias treatment: When selecting pilot areas for an information consumption policy, government policymaking bodies might prioritize regions with more developed information consumption infrastructure. This creates inherent differences between cities that are pilot areas and those that are not. To address this, this study used four existing control variables as matching variables and performed regression analysis using a logit model. Then, based on propensity scores, cities were matched using the nearest neighbor matching method and radius matching method. After identifying the control group cities that did not adopt the information consumption pilot policy, a regression analysis was conducted using the DID method on the matched samples. The results of this regression are presented in columns (1)–(2) of the Table 3 below. A comparison between the outcomes obtained from the matched samples with those from the baseline regression (before matching) indicates a positive average causal effect of the policy. (2) Excluding the interference of other policies: Although previous research indicates that establishing national information consumption pilot cities helps improve carbon productivity, it must be considered that these cities may also be pilot areas for other policies [28]. Therefore, based on a review of related policies, this study mainly considered the potential interference of the National Smart City Pilot, Broadband China Strategy, and Big Data Comprehensive Pilot Zone policies, as these policies may have an impact. To eliminate the influence of these three policies, this study incorporated the double difference estimates of the pilot policies into the baseline model and re-evaluated their effects on carbon productivity growth. In columns (3)–(5) of the Table 3 below, after considering the interference of these three policies, it can be observed that the conclusions are robust. (3) Governments often enjoy more policy support, higher fiscal autonomy, more concentrated resource allocation, and relatively independent administrative management systems. These factors make municipalities different from ordinary cities in terms of policy conditions, economic development, resource allocation, and governance structures. Their economic and social development characteristics often deviate significantly from those of other cities.
Therefore, the data from these municipalities may have an imbalanced impact on certain research results, especially in regressions that involve economic development differences between cities, which could lead to biased regression coefficient estimates, thus affecting the universality and accuracy of the research conclusions. To address this, this study excluded Beijing, Tianjin, Shanghai, and Chongqing from the analysis to eliminate potential interference with the model results. The results, shown in column (6) of the table above, indicate that even after excluding the samples of municipalities directly under the central government, the information consumption pilot policy still had a significant impact on carbon productivity, confirming that the hypothesis held, and the results remained robust. (4) Shortening the sample period: This study shortened the research period from the original 2006–2022 to 2011–2022 to avoid the interference of atypical economic phenomena such as the global financial crisis before 2011 and the long-term impacts of such events. The results show that excluding the data from the first five years (2006–2010) did not significantly affect the main conclusions. In other words, shortening the sample period still led to robust regression results, demonstrating that the research conclusions have strong reliability and robustness.

3.7. Heterogeneity Analysis

This study further employed a subsample regression method and conducted heterogeneity analysis based on different samples. Specifically, it examined heterogeneity based on city size and resource endowment and tested spatial heterogeneity using Formula (5).
Table 4 shows the heterogeneity analysis by city size. This study was based on the Notice on Adjusting the Standards for Classifying City Sizes issued by the State Council in November 2014. By combining this with the classification of resident population sizes in municipal districts, cities are further divided into large, medium, and small cities. Specifically, a large city is one with a resident population exceeding 1 million, a medium city has a population between 500,000 and 1 million, and a small city has a population of less than 500,000. The regression analysis shows that the policy significantly promoted carbon productivity in both large and medium-sized cities. The influence of the pilot information consumption policy on carbon productivity was most significant in large cities, followed by medium cities, with the policy effect being weaker in small cities. Overall, as the city size increased, the positive effect was gradually strengthened, especially in large and medium cities. The reasons for the differentiated effects across city sizes may include the following: Large cities possess better information infrastructure, a more diversified industrial structure, stronger market demand, and significant scale effects, allowing them to better leverage the information consumption policy in improving carbon productivity. Medium cities, while having some level of information infrastructure and industrial diversity, are constrained by smaller market sizes and weaker policy enforcement, resulting in less significant effects compared to large cities. In small cities, the lower level of information technology, more simplified industrial structure, greater difficulty in policy implementation, and limited market demand lead to more limited policy effects.
The implementation effect of the policy is shaped by factors like technological level and talent aggregation. Many Chinese cities rely on resource-based industries. These resource-based cities often have an industrial structure and economic model centered around resource extraction and raw material processing, which makes them less adaptable to new technologies and emerging industries. They are also prone to path dependence on traditional resource-based development models, resulting in greater resistance during the transformation and upgrading process. However, non-resource-based cities are more diversified and have a stronger innovation-driven force, which enables them to exhibit greater potential in promoting information consumption and green development. Based on this, we hypothesize that the transformation challenges are greater in resource-based cities. On the other hand, non-resource-based cities have better technological access conditions and policy support, making the policy’s effect relatively more significant. Based on the National Sustainable Development Plan for Resource-based Cities (2013–2020) issued by the State Council, this study divided the sample into resource-based cities and non-resource-based cities. Table 5 presents the results of the resource endowment heterogeneity test, which show that, in the sample of non-resource-based cities, the coefficient of the main explanatory variable is highly positive and significant at the 1% level. In the sample of resource-based cities, the result is also significant, with a difference in both coefficient size and significance. This means that the policy plays a more significant role in enhancing carbon productivity in non-resource-based cities.
This study also analyzed spatial heterogeneity [29]. Figure 8 shows the trend of the coefficient of variable N i t S with respect to spatial distance, based on the estimation results from Formula (5) (with a 95% confidence interval). As the distance increases, the effect of these surrounding cities shows a “∽” pattern: it first decreases, then increases, and finally decreases again. Specifically, within 100 km, due to the “agglomeration shadow effect”, the information consumption pilot policy does not significantly promote carbon productivity in nearby regions. As the distance gradually increases, when the agglomeration shadow zone of the pilot city expands to a 200 km range, it significantly enhances carbon productivity in cities between 200 and 250 km away. However, when the distance exceeds 250 km, the effect of the pilot city on the carbon productivity of surrounding cities becomes insignificant. This phenomenon reflects the spatial heterogeneity of the carbon productivity growth effect of information consumption pilot cities. Specifically, the significant promotion of carbon productivity in surrounding cities by information consumption pilot cities is limited to the 200–250 km region. This result is consistent with the expectations of agglomeration economy theory: when surrounding cities are relatively close to the information consumption pilot city, the carbon productivity growth effect is not significant due to the influence of the agglomeration shadow zone. Only when a certain distance is exceeded and the cities escape the agglomeration shadow zone will the promoting effect be observed. As the distance further increases, the promoting effect gradually weakens and eventually becomes insignificant. At the same time, the results of Figure 8 indicate that although the agglomeration shadow zone of information consumption pilot cities covers a 200 km range from the city, its impact remains insignificant. This suggests that the driving effect does not come from the spatial reallocation of existing resources but is instead achieved through significant net growth effects.

3.8. Impact Mechanism Test

The three-step method requires that the mediator variable and the outcome variable are not affected by confounding factors, while the number of green patents and carbon productivity may be influenced by common latent variables (such as urban innovation culture). The two-step method reduces bias through a simplified regression. To avoid endogeneity, this study adopts the two-step method proposed by Jiang Ting [7] as a replacement for the traditional Baron and Kenny (1986) three-step method.
Building on the analysis above, this study specifically examined how the policy influences carbon productivity through the enhancement of green patent innovation and industrial structure adjustment. To avoid the endogeneity issues associated with the traditional three-step method, this study employed the Jiang–Ting two-step method [7] for analysis, with the results shown in Table 6. The initial step involves regressing the policy’s virtual variable against carbon productivity, which aligns with the results obtained from the previous regression. The virtual variable of the information consumption pilot policy has a significant positive impact on carbon productivity. In the second step, the dependent variable is replaced by the intermediary variable for direct regression. The regression coefficients for the impact of the information consumption pilot policy on green patent innovation and industrial structure are positive. Through significance testing, the intermediary effect was validated. As for the role of the intermediary variable in the Jiang–Ting two-step method, many existing studies have explained this from a theoretical perspective [5,10,15]. Therefore, the policy effectively leads to the growth of carbon productivity by enhancing the density of technological resources and optimizing the industrial structure. Hypothesis 2–3 is confirmed.

4. Discussion

Why did this paper choose carbon productivity? Compared with other low-carbon transition indicators, carbon productivity (GDP/CO2) stands out as a more advantageous synergy-enhancing indicator for low-carbon transformation. This indicator reflects both economic growth and absolute emission reduction through the dynamic relationship between the numerator (GDP) and denominator (CO2), avoiding the “false decoupling” risk of carbon intensity caused by economic fluctuations (such as the passive reduction of carbon intensity during an economic recession). Therefore, this paper selects carbon productivity as the dependent variable.
Information consumption refers to economic activities that focus on information products and information services as the objects of consumption [30]. Information consumption has a profound impact on production and consumption models. To date, limited research has been conducted on the connection between information consumption policy and carbon productivity. The literature relevant to this paper primarily focuses on the economic benefits of information consumption and the factors influencing carbon productivity.
Firstly, let us consider the economic benefits of information consumption. Qin et al. [27], using transaction cost theory, found that digital development advanced the deepening and expansion of international trade, promoted the expansion of consumption scales, and became a new driver of economic growth. In recent years, information consumption has shown a rapid growth trend worldwide, gradually transforming traditional production and consumption models. Meanwhile, it has profoundly impacted technological innovation, industrial transformation, and other areas. The rapid popularization of information consumption has driven technological innovation and optimized industrial structures, facilitating the development of emerging industries. These emerging technologies create new avenues for consumption and foster the development of innovative business models, thereby enhancing the overall vitality of the economy [15]. Through continuous innovation in digital technologies, businesses are able to reduce costs while improving production efficiency, thus injecting sustained momentum into economic growth.
Currently, studies exploring the link between information consumption policies and carbon productivity remain limited, and no consensus has been reached on the relationship between the digital economy and energy conservation or emission reduction. Dabla-Norris et al. [31] argue that providing clearer information on climate policies helps to increase public recognition and participation, thus promoting improvements in climate issues. According to Liu [2], the pilot information consumption policy in China has had a substantial impact in lowering both overall carbon emissions and carbon intensity. The research by Jia [32] shows that information intervention policies can effectively enhance residents’ low-carbon capabilities and consumption intentions, particularly through the Internet, television, personalized leaflets, and face-to-face communication. Lin [9] suggests that the Internet improves energy efficiency and carbon performance by promoting industrial structure optimization and technological spillover effects. Zhang et al. [3] found that the introduction of information consumption demonstration cities has significantly impacted green development. Cao et al. [33] verified that digital finance, through the effect of green technological innovation, has promoted improvements in energy and environmental performance across 30 provinces in China, with the environmental benefits being particularly significant in regions with underdeveloped credit and capital markets.
In addition, studies on the factors affecting carbon productivity primarily concentrate on the decomposition analysis of these determinants. Carbon productivity is typically defined as the relationship between GDP and carbon dioxide emissions during a given time frame [27]. Many scholars have explored its influencing factors from various perspectives, such as technological progress (McKinsey Global Institute, 2008) [34], environmental regulation [35], and industrial structure [36]. The McKinsey Global Institute [34] indicates that technological advancement plays a crucial role in enhancing carbon productivity. Achieving a tenfold increase in carbon productivity requires technological advances similar to those seen during the industrial revolution, but it must be completed within a much shorter time frame. Through technological innovation and policy support, it is possible to reduce carbon emissions while maintaining economic growth. Sedjo et al. [37] argue that carbon emissions are a responsibility that must be borne and have established a related “emission credit system” to help businesses or countries fulfill this responsibility and improve carbon productivity. Zhou et al. [35] discovered through the introduction of the Malmquist CO2 Emission Performance Index (MCPI) that stringent environmental regulations encourage businesses to adopt cleaner production technologies and management practices, thereby reducing carbon emissions. Li et al. [36] found through their research that non-resource-based cities, due to their diversified industrial structure and stronger innovation capabilities, experience a more significant improvement in carbon productivity through green finance.
Current research focuses on technological innovation, industrial transformation, and carbon productivity. However, studies on how information consumption can affect carbon productivity and its underlying mechanisms remain relatively scarce. How to effectively improve carbon productivity is a key issue for achieving the “carbon peak and carbon neutrality” goals and promoting high-quality development. Therefore, this paper will explore the theoretical mechanisms through which information consumption affects carbon productivity. The study used city panel data from 2006 to 2022 and applied a multi-period DID method to analyze the specific impact of information consumption pilot policies on carbon productivity. The aim is to provide theoretical and empirical support for promoting low-carbon transformation in cities.
The main innovations of this study compared with existing research are as follows: (1) Research scope: This paper focuses on information consumption pilot policies and explores their relationship with carbon productivity, aiming to provide policy references and insights for improving carbon productivity through the consumption side. (2) Research perspective: Based on the new dual circulation development pattern both domestically and internationally, this study concentrated on the consumption field, using panel data from China’s prefecture-level cities. By combining national information consumption pilot programs with a quasi-experimental design and the use of a multi-period DID model, this study effectively addressed the endogeneity issues in the new consumption pilot policies and carbon productivity measurement.
Although current research has extensively discussed the development and impact of green patents, there are still some key issues that need further exploration in practical applications. In particular, the risks associated with relying on green patents and the imbalance in industrial upgrading across different regions globally, including how these factors influence the promotion and implementation of green innovation, remain urgent challenges that need to be addressed.
While the strategy of relying on green patents to drive improvements in carbon productivity has been effective, it also harbors the dual risks of technological path dependence and regional imbalance. Currently, the green innovation system is dominated by short-term improvement-oriented technologies (such as energy-efficient equipment optimization), which may squeeze research and development investments in disruptive technologies like hydrogen energy and carbon capture, while the regional innovation gap continues to widen—Eastern regions have a significantly higher proportion of invention patents and total patent applications than the western regions, exacerbating the “core-periphery” divide. To address this, it is necessary to balance incremental and breakthrough innovation at the policy level: Germany’s experience can be referenced, with its Carbon Management Strategy, National Hydrogen Strategy, and Research Subsidy Law, which focus on federal-level strategies, tax incentives, and professional evaluations while setting goals for basic research funding ratios at the national or regional level. China could legislate to require local governments to allocate at least 30% of their R&D budget to basic research in disruptive technologies such as hydrogen energy and carbon capture and establish independent evaluation mechanisms to ensure compliance. At the same time, the government could lead the establishment of a regional green technology sharing platform, similar to the EU–Africa Pharmaceutical Patent Pool model, and amend the Patent Law Implementation Rules to clarify that when specific low-carbon technologies are not sufficiently implemented due to regional imbalances, compulsory licensing provisions may be triggered, requiring companies in the core Eastern regions to share technologies with the West.
The process of industrial upgrading presents a significant “East-Strong, West-Weakened” divide, the root cause of which lies in the dual constraints of factor endowments and institutional environments: eastern regions have significantly better digital infrastructure coverage and marketization levels than the western regions, while the latter is constrained by administrative intervention and high-carbon path dependence, making it difficult to effectively reduce the share of secondary and tertiary industries. To overcome this dilemma, an adaptive policy framework needs to be built. The eastern regions can leverage its digital consumption advantage to promote the deep integration of “manufacturing + digital services,” unleashing the emission reduction potential of the service industry. The western regions should focus on low-carbon alternatives for high-carbon industries (such as smart mining) and reduce transformation resistance through technological integration. Furthermore, a horizontal carbon compensation and fiscal transfer payment mechanism should be established, referencing the EU’s Just Transition Fund, to offset the ecological contributions and transformation costs in the west. At the same time, the national East Data, West Computing project should be promoted to allocate computing power and data resources across regions, breaking down digital exclusion barriers with shared elements, enabling inclusive industrial upgrading.

5. Conclusions

5.1. Conclusions

This study systematically evaluated the impact of China’s information consumption pilot policies on carbon productivity. The empirical results validate all three hypotheses:
H1 is validated: the pilot policy significantly enhances carbon productivity at the 1% significance level.
H2 and H3 are supported: technological progress (mediated by green patent growth, β = 0.448) and industrial structure adjustment (increase in the tertiary-to-secondary industry ratio, β = 0.168) serve as core mechanisms.
These findings highlight the leverage of demand-side policies, indicating that information consumption policies, unlike traditional supply-side interventions, drive carbon productivity through the dual channels of innovation and structural transformation, with the following key findings:
Policy effectiveness: The information consumption pilot significantly enhances carbon productivity through technological upgrading and industrial structure optimization, demonstrating robust policy effects.
Spatial heterogeneity: The policy outcomes exhibit a “local agglomeration–regional differentiation” pattern. Eastern regions benefit most due to infrastructure and innovation ecosystem advantages, highlighting the urgent need to strengthen regional coordinated development.
Structural sensitivity: City size and economic type significantly moderate policy effects. Non-resource-based cities and large cities achieve easier low-carbon transitions, while targeted support is required for small–medium cities and resource-dependent cities.
For policymakers, balancing “efficiency prioritization” with “equity orientation” by integrating spatial justice into climate governance frameworks is crucial to synergize the “dual carbon” goals with high-quality development.
For future research directions, building on these findings, future studies could extend this work by exploring the interaction between demand-side policies (e.g., digital consumption incentives) and supply-side tools (e.g., carbon pricing) to identify synergistic pathways for carbon neutrality. Additionally, comparative analyses of similar policies in other emerging economies could deepen our understanding of contextual factors shaping policy effectiveness.

5.2. Recommendations

(1) The research confirms that the information consumption pilot policy significantly promotes carbon productivity improvement: The pilot policy is beneficial for enhancing green patent innovation and upgrading industrial structure. In particular, except for the other two regions in the eastern area, it is essential to design tailored policies that align with local economic conditions in order to foster green economic transformation and meet the “dual carbon” objectives.
(2) Optimize supporting policies for technological innovation and industrial structure adjustment: The mechanisms of the information consumption pilot policy can improve energy efficiency and optimize the industrial structure through technological progress. To further promote an improvement in carbon productivity, the government should increase support for technological innovation, particularly encouraging enterprises to invest in research and development in green technologies, smart manufacturing, and other fields. The government should promote the green elevation of the industrial structure and optimize resource allocation, which will enhance carbon productivity while promoting high-quality economic development. Priority should be given to the development of digital infrastructure (such as 5G, cloud computing, and data centers), energy efficiency optimization technologies (smart energy management, industrial internet), renewable energy integration systems (wind, solar, and energy storage integration), green building technologies (low-carbon building materials, nearly zero-energy design), and industrial carbon capture technologies. These technologies achieve systemic emissions reduction by improving energy efficiency, promoting clean energy substitution, and optimizing resource utilization.
(3) Strengthen regional coordination and cooperation to narrow regional development gaps: It is necessary to develop new consumption models based on local conditions. This study shows that to achieve a positive overall effect from the information consumption pilot, cities should implement new consumption policies tailored to their resource endowments, city sizes, and industrial development stages. In the future, policies should focus more on coordinated development between regions, assisting the central and western regions in reducing the disparity with the eastern regions through technological innovation and industrial structure adjustments. It is recommended that the differentiated design of regional policies be enhanced, providing more opportunities for technology transfer and financial support.
(4) Focus on the green transformation and industrial diversification of resource-based cities: Resource-based cities face considerable transformation pressures due to their reliance on traditional industries. In response to this issue, the government should introduce special policies to promote the diversification of industries in resource-based cities, cultivate innovative enterprises, accelerate the application of green technologies, and improve carbon productivity. Additionally, resource-based cities should be guided to gradually phase out high-carbon emission industries and develop low-carbon, environmentally friendly industries to achieve industrial green transformation. This can be achieved through policy incentives (such as tax breaks and special financial support), advancing the East Data, West Computing project to optimize the regional data center layout, establishing collaborative digital technology R&D alliances and strengthening government-led advanced green digital infrastructure (such as smart computing power centers) to overcome funding, technology, and talent bottlenecks.
(5) Strengthen differentiated support policies for different city sizes, improve regulation, and enhance policy effectiveness: This study found that the effects of the information consumption pilot policy varied across cities of different sizes. Therefore, the government should develop differentiated policies based on the economic development statuses and informatization levels of different cities. For large cities, the focus should be on strengthening information infrastructure and supporting technological innovation. For medium and small cities, attention should be given to infrastructure development, talent attraction, and industrial transformation. Policies should aim to create a favorable information consumption market environment, improve overall information consumption levels, and further enhance carbon productivity.

Author Contributions

Conceptualization: J.Q. and G.D.; methodology: J.Q.; software: J.Q.; validation: J.Q.; formal analysis: J.Q.; investigation: J.Q.; data curation: J.Q.; writing—original draft: J.Q.; writing—review and editing: G.D.; visualization: J.Q.; supervision: G.D.; project administration: G.D.; funding acquisition: G.D. All authors have read and agreed to the published version of the manuscript.

Funding

This work was supported by the Natural Science Foundation of China under grants (72363021 and 12101279); the Longyuan Youth Talent Project (2022); the Double First-class Scientific Research Key Project of Gansu Provincial Department of Education (GSSYLXM-06); the Major Science and Technology Special Project Plan of Gansu Province (24ZDWA007); the Lanzhou University of Finance and Economics Research Project (Lzufe2024C-009); and the Soft Science Special Project of Gansu Basic Research Plan (25JRZA094 and 22JR4ZA065).

Institutional Review Board Statement

Not applicable.

Informed Consent Statement

Not applicable.

Data Availability Statement

The data are provided within the manuscript.

Conflicts of Interest

The authors declare no conflicts of interest.

References

  1. Liu, X.; Luo, Y.; Guo, S.; Yang, X.; Chen, S. Information consumption city and carbon emission efficiency: Evidence from China’s quasi-natural experiment. Environ. Res. 2024, 255, 119182. [Google Scholar] [CrossRef]
  2. Liu, L.; Chen, M.; Wang, H.; Liu, B. How does the Chinese pilot policy on information consumption affect carbon emissions? Sustain. Prod. Consum. 2023, 41, 88–106. [Google Scholar] [CrossRef]
  3. Zhang, K.; Zhu, P.-H.; Qian, X.-Y. National information consumption demonstration city construction and urban green development: A quasi-experiment from Chinese cities. Energy Econ. 2024, 130, 107313. [Google Scholar] [CrossRef]
  4. Huang, X.-X.; Hu, Z.-P.; Liu, C.-S.; Yu, D.-J.; Yu, L.-F. The relationships between regulatory and customer pressure, green organizational responses, and green innovation performance. J. Clean. Prod. 2016, 112, 3423–3433. [Google Scholar] [CrossRef]
  5. Xia, W.; Ruan, Z.; Ma, S.; Zhao, J.; Yan, J. Can the digital economy enhance carbon emission efficiency? Evidence from 269 cities in China. Int. Rev. Econ. Financ. 2025, 97, 103815. [Google Scholar] [CrossRef]
  6. Cui, X.; Li, P. Digital economy, environmental expenditure, and green total factor productivity. Finance Res. Lett. 2024, 73, 106624. [Google Scholar] [CrossRef]
  7. Jiang, T. Mediation and Moderation Effects in Empirical Research on Causal Inference. China Ind. Econ. 2022, 5, 100–120. [Google Scholar] [CrossRef]
  8. Li, X.; Xu, Y.; Tan, H.; Lei, Y. Low-carbon city pilot policies and urban carbon productivity improvement: An empirical analysis from the perspective of green competitiveness. Environ. Sustain. Indic. 2024, 24, 100531. [Google Scholar] [CrossRef]
  9. Lin, B.; Zhou, Y. Does the Internet development affect energy and carbon emission performance? Sustain. Prod. Consum. 2021, 28, 1–10. [Google Scholar] [CrossRef]
  10. La Ferrara, E.; Chong, A.; Duryea, S. Soap operas and fertility: Evidence from Brazil. Am. Econ. J. Appl. Econ. 2012, 4, 1–31. [Google Scholar] [CrossRef]
  11. Cohen, L.; Gurun, U.G.; Nguyen, Q.H. The ESG-Innovation Disconnect: Evidence from Green Patenting (NBER Working Paper No. 27990); National Bureau of Economic Research: Cambridge, MA, USA, 2020; Available online: https://www.nber.org/papers/w27990 (accessed on 29 March 2025).
  12. Wang, J.; Yu, S.; Li, M.; Cheng, Y.; Wang, C. Study of the impact of industrial restructuring on the spatial and temporal evolution of carbon emission intensity in Chinese provinces—Analysis of Mediating Effects Based on Technological Innovation. Int. J. Environ. Res. Public Health 2022, 14, 13401. [Google Scholar] [CrossRef] [PubMed]
  13. Coufal, D. Convergence rates of kernel density estimates in particle filtering. Stat. Probab. Lett. 2019, 153, 164–170. [Google Scholar] [CrossRef]
  14. Stief, A.; Baranowski, J. Fault diagnosis using interpolated kernel density estimate. Measurement 2021, 176, 109230. [Google Scholar] [CrossRef]
  15. Du, K.; Li, J. Towards a green world: How do green technology innovations affect total-factor carbon productivity. Energy Policy 2019, 131, 240–250. [Google Scholar] [CrossRef]
  16. Chen, Y.; Tian, W.; Ma, W.; Gu, J.; Ma, Z. Spatiotemporal Differentiation and Influencing Factors of Coordination Degree be-tween Population Urbanization and Land Urbanization Based on ESDA-GWR: A Case Study of the Central Plains Urban Agglomeration. Agric. Resour. Reg. China 2020, 41, 88–99. [Google Scholar]
  17. Wu, J.X.; Guo, Z.Y. Analysis of China’s Carbon Emission Convergence Based on Continuous Dynamic Distribution Method. Stat. Res. 2016, 33, 54–60. [Google Scholar] [CrossRef]
  18. GB/T 15317-2009; Energy Conservation Monitoring of Coal-Fired Industrial Boilers. China Standard Press: Beijing, China, 2009.
  19. Färe, R.; Grosskopf, S.; Pasurka, C.A. Environmental production functions and environmental directional distance functions. Energy 2007, 32, 1055–1066. [Google Scholar] [CrossRef]
  20. Andersen, P.; Petersen, N.C. A Procedure for ranking efficient units in data envelopment analysis. Manag. Sci. 1993, 39, 1261–1264. [Google Scholar] [CrossRef]
  21. Zhang, J.; Wu, G.; Zhang, J. Estimation of Interprovincial Physical Capital Stock in China: 1952–2000. Econ. Res. J. 2004, 10, 35–44. [Google Scholar]
  22. Zhao, J.; Yan, J. The impact of public fiscal expenditure on industrial transformation and upgrading: An inverted U-shape evidence from China. Heliyon 2024, 10, e38456. [Google Scholar] [CrossRef] [PubMed]
  23. Sharma, V.; Adil, M.H.; Fatima, S. Revisiting fiscal deficit sustainability and revenue-expenditure nexus in India. Dev. Sustain. Econ. Finance 2024, 2–4, 100020. [Google Scholar] [CrossRef]
  24. Guan, X.-G.; Ren, F.-R.; Fan, G.; Zhang, Q.-Q.; Wu, T.-F. Dynamic evaluation and sensitivity analysis of China’s industrial solid waste management efficiency based on ecological environment cycle perspective. Front. Environ. Sci. 2024, 12, 1462975. [Google Scholar] [CrossRef]
  25. Zhao, J.; Chen, W.; Liu, Z.; Liu, W.; Li, K.; Zhang, B.; Zhang, Y.; Yu, L.; Sakai, T. Urban expansion, economic development, and carbon emissions: Trends, patterns, and decoupling in mainland China’s provincial capitals (1985–2020). Ecol. Indic. 2024, 169, 112777. [Google Scholar] [CrossRef]
  26. Fankhauser, S.; Jotzo, F. Economic growth and development with low-carbon energy. WIREs Clim. Change 2017, 9, e495. [Google Scholar] [CrossRef]
  27. Qin, S.; Deng, H.; Hu, S. Digital development and China–BRICS trade: Role of institutional distance. Financ. Res. Lett. 2024, 73, 106636. [Google Scholar] [CrossRef]
  28. Deng, G.; Wu, Y.; Qian, J. Research on the impact of dual pilot projects for low-carbon and innovative cities on carbon emission efficiency. Front. Environ. Sci. 2024, 12, 1432400. [Google Scholar] [CrossRef]
  29. Wang, X.; Bu, L. International Export Trade and Enterprise Innovation: A Quasi-Natural Experiment Based on the Opening of the China-Europe Railway Express. China Ind. Econ. 2019, 10, 80–98. [Google Scholar]
  30. Liao, B.; Yang, Z.; Tian, C. Can information consumption promote the synergistic effect of urban pollution reduction and carbon emission reduction? Consum. Econ. 2025, 41, 45–58. [Google Scholar]
  31. Dabla-Norris, E.; Khalid, S.; Magistretti, G.; Sollaci, A. Does information change public support for climate mitigation policies? Clim. Policy 2024, 24, 1474–1487. [Google Scholar] [CrossRef]
  32. Wei, J.; Chen, H.; Long, R.; Zhang, L.; Feng, Q. Maturity of residents’ low-carbon consumption and information intervention policy. J. Clean. Prod. 2020, 277, 124080. [Google Scholar] [CrossRef]
  33. Cao, S.; Nie, L.; Sun, H.; Sun, W.; Taghizadeh-Hesary, F. Digital finance, green technological innovation and energy-environmental performance: Evidence from China’s regional economies. J. Clean. Prod. 2021, 327, 129458. [Google Scholar] [CrossRef]
  34. McKinsey Global Institute. The Carbon Productivity Challenge: Curbing Climate Change and Sustaining Economic Growth; McKinsey & Company: London, UK, 2008; Available online: https://www.mckinsey.com/mgi/overview (accessed on 29 March 2025).
  35. Zhou, P.; Ang, B.; Han, J. Total factor carbon emission performance: A Malmquist index analysis. Energy Econ. 2010, 32, 194–201. [Google Scholar] [CrossRef]
  36. Li, J.; Qu, S.; Peng, Z.; Ji, Y.; Boamah, V. The impact of green finance on carbon productivity: The mediating effects of the quantity and quality of green innovation. J. Environ. Manag. 2024, 370, 122952. [Google Scholar] [CrossRef] [PubMed]
  37. Sedjo, R.A.; Marland, G. Inter-trading permanent emissions credits and rented temporary carbon emissions offsets: Some issues and alternatives. Clim. Policy 2003, 3, 435–444. [Google Scholar] [CrossRef]
Figure 1. Development of carbon productivity in China from 2006 to 2022.
Sustainability 17 04266 g001
Figure 2. Kernel density plot for all regions.
Sustainability 17 04266 g002
Figure 3. Kernel density plot for the eastern region.
Sustainability 17 04266 g003
Figure 4. Kernel density plot for the central region.
Sustainability 17 04266 g004
Figure 5. Kernel density plot for the western region.
Sustainability 17 04266 g005
Figure 6. Parallel trend test.
Sustainability 17 04266 g006
Figure 7. Placebo test.
Sustainability 17 04266 g007
Figure 8. Spatial effect analysis.
Sustainability 17 04266 g008
Table 1. Input–Output variables.
IndicatorSecondary IndicatorTertiary Indicator
InputLaborNumber of employees in each prefecture-level city, in tens of thousands.
CapitalUsing the perpetual inventory method, the capital stock is represented as follows: K i , t = K i , t 1 1 δ i , t + I i , t , where K i , t denotes the material capital stock (RMB ten thousand) of city i in year t , and δ i , t represents the economic depreciation rate. In this study, the depreciation rate was set at 9.6%, based on the findings of Zhang et al. [21]. I i , t represents the total fixed asset formation (i.e., capital flow, in RMB ten thousand) of city i in year t , adjusted to constant 2006 prices.
EnergyDirect energy consumption (e.g., natural gas and liquefied petroleum gas) and indirect energy (e.g., electricity) are converted to standard coal using conversion factors, as outlined in the General Principles of Comprehensive Energy Consumption Calculation— 1.33   kg   tec / m 3 , 1.7143   kg   tec / kg , and 0.1229   kg   tec / kW h , respectively—to resolve the unit inconsistency.
Expected OutputUrban GDPGDP is calculated using 2006 price levels as the base year to eliminate the influence of price changes in subsequent years.
Undesirable OutputUrban Carbon EmissionsThe urban carbon emission accounting in this study covers four main emission sources: direct energy consumption, electricity, transportation, and thermal energy, as detailed in Section 2.2.1 above.
Table 2. Benchmark regression.
(1)(2)(3)
DID0.832 ***0.304 ***0.233 ***
(6.421)(4.223)(3.685)
FIE −0.022 ***
(−3.169)
CISW −0.000
(−0.760)
ECO 0.000 ***
(7.405)
AIS −0.047
(−1.326)
Constant0.496 ***−0.219 ***−0.212 ***
(13.856)(−8.979)(−4.311)
Control VariablesNoNoYes
Year Fixed EffectsNoYesYes
City Fixed EffectsNoYesYes
Observation467546754675
R20.1220.8580.876
Note: t statistics in parentheses. *** p < 0.01.
Table 3. Robustness tests.
VariablesPSM-DIDExcluding the Impact of Other Policies
Nearest Neighbor MatchingRadius MatchingSmart City ConstructionBroadband China StrategyBig Data Comprehensive Pilot ZoneExcluding the Influence of Municipalities Directly Under the Central GovernmentShortening the Sample Period
DID0.233 ***0.304 ***0.199 ***0.194 ***0.224 ***0.196 ***0.192 ***
(10.12)(12.32)(3.253)(2.853)(3.660)(3.183)(3.750)
DID1 0.192 ***
(4.416)
DID2 0.117 **
(1.980)
DID3 0.180 ***
(2.833)
Constant Term0.150 ***0.5833 ***−0.148 ***−0.217 ***−0.211 ***−0.201 ***−0.235 ***
(4.12)(94.53)(−3.066)(−4.466)(−4.412)(−4.198)(−4.283)
Control VariablesYESYESYESYESYESYESYES
Year Fixed EffectsYESYESYESYESYESYESYES
City Fixed EffectsYESYESYESYESYESYESYES
Observation4675467346754675465846073300
R20.8840.8930.8790.8770.8780.8530.921
Note: t statistics in parentheses. ** p < 0.05, and *** p < 0.01.
Table 4. Heterogeneity analysis by city size.
VariablesLarge CitiesMedium CitiesSmall Cities
DID0.377 ***0.135 **0.134
(2.962)(2.104)(1.403)
Constant0.013−0.120−0.158
(0.104)(−1.365)(−1.442)
Control variablesYESYESYES
City fixed effectYESYESYES
Year fixed effectYESYESYES
Observation20061683986
R20.8940.7930.866
Note: t statistics in parentheses. ** p < 0.05, and *** p < 0.01.
Table 5. Resource endowment heterogeneity analysis.
VariablesNon-Resource-Based CitiesResource-Based Cities
DID0.264 ***0.140 *
(2.795)(1.786)
Constant−0.468 ***−0.099 **
(−5.134)(−2.247)
Control variablesYESYES
City fixed effectYESYES
Year fixed effectYESYES
Observation28561819
R20.8760.788
Note: t statistics in parentheses. * p < 0.1, ** p < 0.05, and *** p < 0.01.
Table 6. Impact mechanism test.
VariablesIndustrial StructureGreen Patent Innovation Index
DID0.168 ***0.448 ***
(0.0311)(4.77)
Constant0.331 ***1.684 ***
(0.0599)(11.39)
Control variablesYESYES
City fixed effectYESYES
Year fixed effectYESYES
Observation46754675
R20.3340.625
Note: t statistics in parentheses. *** p < 0.01.
Disclaimer/Publisher’s Note: The statements, opinions and data contained in all publications are solely those of the individual author(s) and contributor(s) and not of MDPI and/or the editor(s). MDPI and/or the editor(s) disclaim responsibility for any injury to people or property resulting from any ideas, methods, instructions or products referred to in the content.

