Article

Trends of Industrial Waste Generation in Manufacturing Enterprises in the Context of Waste Prevention—Shift-Share Analysis for European Union Countries

by
Agata Mesjasz-Lech
Faculty of Management, Czestochowa University of Technology, 42-201 Częstochowa, Poland
Sustainability 2025, 17(1), 34; https://doi.org/10.3390/su17010034
Submission received: 22 November 2024 / Revised: 10 December 2024 / Accepted: 23 December 2024 / Published: 25 December 2024
(This article belongs to the Special Issue Waste Management for Sustainability: Emerging Issues and Technologies)

Abstract

:
The problem of waste in the European Union is still present—from 2010 to 2022, the amount of hazardous waste generated increased by an average of 2.25% per year, while non-hazardous waste decreased by an average of 0.06% per year. The increase in the amount of hazardous waste and the very slight decrease in non-hazardous waste over the 13-year period testify to the ever-present problem of waste generation. To effectively address this issue, it is necessary to understand the trends that characterize the amount of waste generated. This study focuses on the amount of waste generated in manufacturing companies. Panel data from 27 European Union countries from 2010–2022 were analyzed to examine what factors contribute to the generation of hazardous and non-hazardous waste. For this purpose, a shift-share analysis was used. The research showed that, in comparison to 2010, the total amount of EU waste generated by manufacturing companies in 2022 was 3,632,096 tons lower for hazardous waste and 15,149,754 tons lower for non-hazardous waste. A shift-share analysis of hazardous waste suggests that companies in the manufacturing sectors should show an upward trend in the amount of waste generated in all the European Union countries. In fact, however, there has been a decline in the amount of this waste overall across the EU (though only in 15 countries), driven by both structural (industrial mix) and geographic (regional shift) factors. The dominance of the geographic component was particularly pronounced in countries with a decrease in hazardous waste (negative total effect). The situation was different for non-hazardous waste. Negative values of the national shift component for all the countries suggest a decline in non-hazardous waste at companies in the manufacturing sector. In reality, the decline occurred in only 16 countries, and in most, due to the regional shift component. The analysis shows that policies on hazardous and non-hazardous waste management in European Union countries vary. Positive changes in hazardous waste have taken place in 12 EU countries that differ in terms of levels of economic and social development, suggesting the need for further analysis of the reasons for these trends. In the case of non-hazardous waste, the largest number of countries have made positive changes related to their competitive potential, indicating that the decline in non-hazardous waste is mainly due to their macroeconomic situation. Thus, there is considerable regional heterogeneity in the spatial distribution of the waste change component. The research provides valuable insights for companies and institutions responsible for shaping waste management policies, helping them to recognize the regional advantages and disadvantages of waste reduction and strengthen regional cooperation in this regard.

1. Introduction

Comprehensive solutions that would effectively reduce the amount of waste generated are still lacking. Waste reduction is a necessary policy for sustainable management, and thus, especially in industrialized countries, it is becoming a priority component of national waste management strategies [1]. The large volume of waste generated by European Union countries presents not only a significant challenge to address but also an opportunity to alleviate problems associated with resource and energy shortages. It can also contribute to diversifying sources of resources and energy, as well as improving supply security by reducing dependence on imports [2]. Achieving this goal, however, will only be possible if used products cease to be regarded as worthless waste and are instead viewed as a source of valuable resources that can be recovered. Efforts to reduce the environmental impact of production and consumption by reusing waste materials within the economy form the basis of the circular economy, which has become a central aspect of the European integration framework.
Research on the circular economy indicates that it is no longer sufficient to simply deliver a product to the end user. It is also necessary to define who is responsible for the product after it has been used. However, it must be remembered that achieving a closed-loop material cycle in the economy cannot be accomplished solely through recycling [3]. The design stage should already consider the possibility of disassembly, processing, and reuse of components [4]. Additionally, it is crucial to inform consumers about the environmental impact of a product at every stage of its life cycle. Thus, maintaining the desired level of consumption is only possible by changing the approach to how products are sourced, manufactured, delivered, refurbished, and renewed [5]. This enables effective management not of waste, but of resources.
Sustainable resource use forms the basis of efforts toward a resource-efficient Europe, supported by the European Union’s circular economy initiatives. In this context, the material efficiency of products can be increased through appropriate legal and administrative regulations aimed at ensuring durability, functionality, reuse, recovery, and recycling. Prioritizing these regulations helps eliminate or at least minimize material losses and reduce the amount of waste entering the environment [6]. The circular economy is no longer an option but a necessity for maintaining economic prosperity and ecological balance [7].
However, the circular economy primarily focuses on recycling and recovery processes [8,9,10]. Less emphasis is placed on methods that prevent waste generation at the source.
Increasingly, waste prevention is being adopted as a primary goal of waste management [11,12,13]. Preventing waste is the top priority in the European waste hierarchy [14], ranking above reduction, reuse, recycling, recovery, and disposal. Prevention of waste generation is becoming important at both the planning and implementation levels of waste and resource management strategies [15]. It addresses not only the volume of waste, but also the threat it poses to all elements of the environment, refers to measures that are opposed to not using and reusing, and thus focuses on developing awareness, material efficiency, and sustainable consumption [16]. Waste prevention is also seen as changing the way waste is handled, making it into something resourceful that can be reused or repaired, resulting in seeing the value of used things [17].
By adopting the goal of waste prevention to reduce the quantity and/or hazardous characteristics of waste [18], waste prevention is seen as on par with reducing its negative environmental impact. Thus, the most desirable goals include: “prevent or reduce the amount of waste” as equivalent actions [19] and classified as “higher order behaviours” [20]. It is crucial to note, however, that waste prevention is distinct from waste management. On the contrary, waste prevention avoids the need to dispose of waste and saves the resources needed for production [21].
Unfortunately, despite the fact that waste prevention is the most desirable action in the waste hierarchy [22,23], attention is focused on reducing their negative environmental impact through recycling or recovery processes [24,25,26]. In this context, waste prevention mainly targets packaging waste [27,28,29,30,31], food waste [32,33,34,35,36,37], and construction waste [38,39,40]. This is influenced by the physical and chemical properties of waste, which facilitate the implementation of processes that restore its value. A lot of research is also directed at the possibility of manufacturing green products from waste [41].
Unfortunately, it is noted that the implementation of waste prevention programs in the context of waste reduction in general is still a rare practice [42]. To prevent pollution at the source, it is necessary to analyze the socioeconomic factors leading to changes in the waste generation process [43]. Studies have shown that the socioeconomic determinants of changes in hazardous waste generation are consumption, exports, the production technology used, and changes in the intensity of the hazardous waste stream in production [44]. Johansson and Corvellec [45] point out that most waste management policies overlook the issue of overconsumption, which contributes to waste generation. Moreover, these policies prioritize traditional waste management objectives instead of focusing on preventing waste at its source. The issue of consumption is examined mostly in the context of recycling [46]. Additionally, it is precisely the measures that lead to waste prevention at the source that constitute the most preferred waste management alternative [47].
A variety of legal and administrative measures can be identified that directly influence company activities, promoting the circular use of secondary products and stricter waste management practices [48]. However, it seems that it is not only the way waste is handled that should be regulated with legal and administrative measures, but also, and perhaps most importantly, the legal and administrative framework for waste prevention should be defined. This framework should prioritize major waste streams, including industrial and commercial waste, with waste prevention measures implemented across all levels. Instead of relying on informational campaigns, the focus should be on taxes, bans, incentives, and consequences for the entities involved [45]. Therefore, the focus should be on developing a methodology to support the establishment of effective policies by quantifying the characteristics of industrial waste generation, including hazardous waste, taking into account analyses of the relationship between economic activity and waste generation [49]. For this reason, the goal of the research is to evaluate the amount of waste generated by enterprises, especially industrial enterprises. The analysis focused on companies in the manufacturing sector due to the fact that they have a slight downward trend in terms of the amount of waste generated between 2010 and 2022—the average annual decrease for hazardous waste was 1.39%, and for non-hazardous waste was 0.58%. In addition, the studies to date tend to focus on methods of managing specific groups of waste, paying less attention to analyses of trends in the amount of waste generated, particularly from the manufacturing sector. Waste prevention has received significant attention in the literature, but mainly in the context of recycling or recovery. However, considering that prevention holds a higher priority in the waste management hierarchy, its consideration in relation to the dynamics of waste generation is largely overlooked in decision-making. This is particularly true of holistic approaches, encompassing groups of countries, which allow for comparative analyses. Moreover, previous studies using shift-share analysis have focused on municipal waste [50,51]. This provided the impetus for conducting the research discussed in this article. The primary research gap involves delivering insights into the necessity of modifying waste management practices to decrease the production of hazardous and non-hazardous waste in enterprises in the manufacturing sector. Therefore, this study aims to fill this research gap by providing an analysis of regional, structural, and global effects on the amount of waste generated by manufacturing companies.
The following research questions were posed:
  • Q1. What are the trends in the amount of waste generated by manufacturing companies operating in each European Union country compared to the amount of waste generated in all sectors?
  • Q2. What factors influence the trends in the amount of waste generated by companies, including manufacturing companies, in each country of the European Union?
  • Q3. Can countries be classified by the conditions they create for the development of manufacturing companies in waste management in the context of waste reduction?

2. Data and Methods

The study was conducted using shift-share analysis. The research method used enables the analysis of an area’s development level for a specific characteristic in comparison to a reference area, considering the development of its respective sub-areas and the changes taking place within them. This method employs a decomposition approach, enabling the evaluation of how individual components influence the overall assessment of a sub-area’s position relative to the entire area. It also facilitates identifying the sources of change within sub-areas. Shift-share analysis was selected as it is a growth decomposition method that enables the examination of the growth rate of a phenomenon within an aggregated territorial unit by breaking it down into three components: the trend component, the structural component, and the local component [51]. Therefore, applying shift-share analysis enables the assessment of economic changes across three dimensions: (1) evaluating the potential of individual countries in relation to the entire European Union; (2) examining the dynamics of changes in waste generation within the manufacturing sector in each country; (3) analyzing the competitiveness of countries based on the amount of hazardous and non-hazardous waste produced. Although shift-share analysis does not explain the observed changes but only describes them, it allows for the distinction of regional industries, and, in the case of this study, countries that require further attention. Shift-share analysis is a versatile method that can be applied in various structural and geographical contexts.
The following elements were presented within the shift-share analysis:
  • National share (NS), which determines changes in the amount of waste generated in the studied area, assuming that it is developing at a rate similar to the reference area;
  • Industrial mix (IM), the sectoral effect that characterizes the part of change that results from the overall development trend in the amount of waste generated, with a positive value indicating a less favorable structure in the studied area than in the reference area in the context of the research conducted;
  • Regional shift (RS), the geographic effect describing changes in the amount of waste generated due to competitive positioning, and thus indicating differences between the growth rate in the studied area in comparison with the reference area.
Applied Formulas (1)–(3) (adopted from [52]):
N S = G X i j t 1
I M = ( G i G ) X i j t 1
R S = ( g i G i ) X i j t 1
  • g i = ( X i j t X i j t 1 )/ X i j t 1 —the annual growth rate of X in the i-th sector of the j-th country;
  • g = ( X j t X j t 1 )/ X j t 1 —the annual growth rate of X in all the sectors of the j-th country;
  • G i = ( X i t X i t 1 )/ X i t 1 —the annual growth rate of X in the i-th sector of all the countries;
  • G = ( X t X t 1 ) / X t 1 —the annual growth rate of X in all the sectors of all the countries;
  • X i j t —the amount of waste from the i-th sector of the j-th country generated in the j-th country in year t;
  • X i j t 1 —the amount of waste from the i-th sector of the j-th country generated in the j-th country in year t – 1;
  • t − 1—the first year in the analyzed period (the year 2010);
  • t—the last year in the analyzed period (the year 2022).
This division into three effects is consistent with the classic shift-share model [53,54]. The sum of the NS, IM, and RS components is the so-called total effect (TE) shift, which reflects the actual change in the scope of a given variable in year t compared to year t − 1. The structural effect is determined by the weighted average of the differences between the average growth rates in sectors and the EU growth rate. It enables an examination of whether the average growth rate in the analyzed sector is identical across all studied countries. The competitive effect, on the other hand, is defined as the weighted average of deviations between the regional growth rate in specific sectors and the average EU growth rate. This represents the average effect of internal changes occurring within a given country.
The shift-share analysis has been expanded to include a spatial component:
  • Regional industry mix (RIE) defines the portion of the change that is explained by the sectoral structure of j-th country. It allows for the assessment of whether the analyzed country has a comparative advantage or disadvantage in the i-th sector.
  • Regional sectoral effect (RSE) compares regional growth to national growth, taking all sectors into account. In other words, this effect assesses whether the sectoral structure of the studied region is relatively strong or weak compared to the country. In the context of the current research, a positive RSE value indicates that the EU Member State should reconsider its strategy for improving its performance in the specific area.
  • Residual contextual competitive effect (RCCE) evaluates the gap between the growth rates of the overall national economy and the sector within a specific region. It allows for an assessment of whether the value of a variable for a specific sector within a region is growing faster or slower than for the entire economy. However, the contribution of this effect is purely informational, as it is not possible to determine what drives the positive or negative impact of this effect—whether it is due to geographical or sectoral factors.
This enables a comparison not only of changes within a specific area but also with other areas. This means that changes in the amount of hazardous waste can be compared with changes in the amount of non-hazardous waste or vice versa. For this purpose, Formulas (4)–(6) were applied (adopted from [52]):
R I E = ( g i g ) X i j t 1
R S E = ( g G ) X i j t 1
R C C E = ( G g i ) X i j t 1
Data for 2010 and 2022 were analyzed. The data come from the Eurostat database [55]. Statistics on waste generation for individual European Union countries were taken into account, divided into hazardous and non-hazardous waste. Data on waste collected in the Eurostat database are comparable because they meet the requirements of The Regulation (EC) 2150/2002 on waste statistics. This regulation obliges EU Member States to report statistical data on waste generation and treatment in accordance with the EWC-Stat waste statistical nomenclature, i.e., in accordance with a specific division, in an appropriate form, and within the established periods from the end of the relevant reference year. This guarantees the comparability of results. The selection of years for analysis was dictated by the availability and completeness of data. Data on the amount of waste generated are available in two-year periods. The latest data come from 2022, hence this year was adopted as the year under study. The year 2010 was adopted as the basis for comparisons in terms of the amount of waste generated. The 13-year analysis period allows for observing the dynamics in the level of the analyzed variable. The enterprises were divided by EU countries (27 countries). The analysis was conducted from the point of view of manufacturing companies. The study was carried out for two groups of waste generated in enterprises: hazardous and non-hazardous waste. Hazardous waste is a major category of industrial waste, especially since its movement and disposal are regulated by the Basel Convention on the Control of Transboundary Movements of Hazardous Wastes and their Disposal, approved by the European Union with Decision 93/98/EEC [56].
The components of the shift-share analysis were also used for building a matrix of development conditions for waste management enterprises. The structural effect (IM) and geographic effect (RS) refer to changes in the scope of the analyzed variable in the studied area in comparison with the reference area. They indicate sectoral and local factors of growth or decline in the value of the analyzed variable, while the potential of the studied area (NS) refers to the expected growth or decline of the analyzed variable, assuming that the studied area develops at the same level as the reference area. Because sectoral and geographic effects form what is known as pure regional growth [57], they were used for classifying entities by development conditions for waste management in the context of waste reduction. The structural effect is calculated as the weighted average of the differences between the average growth rates of sectors and the EU growth rate. It enables an examination of whether the average growth rate in the analyzed sector is identical across all studied countries. The competitive (geographic) effect, on the other hand, is defined as the weighted average of deviations between the regional growth rate in specific sectors and the average EU growth rate. This represents the average effect of internal changes occurring within a given country. The matrix of conditions for the development of enterprises in the scope of waste management is shown in Figure 1.
In the case of waste management in the context of the waste hierarchy, the most desirable situation is a negative value for both the structural effect and the geographic effect because negative values for both mean a slowdown in the growth of waste due to structural and geographic factors. The least desirable situation is a positive value of both measures, as it means that the amount of waste is increasing in the areas of each activity. The other two situations indicate some potential for favorable shaping of the waste stream resulting from either competitive factors (i.e., competitive potential) or structural factors (i.e., structural potential) shaping the potential of a given region. On this basis, it was concluded that:
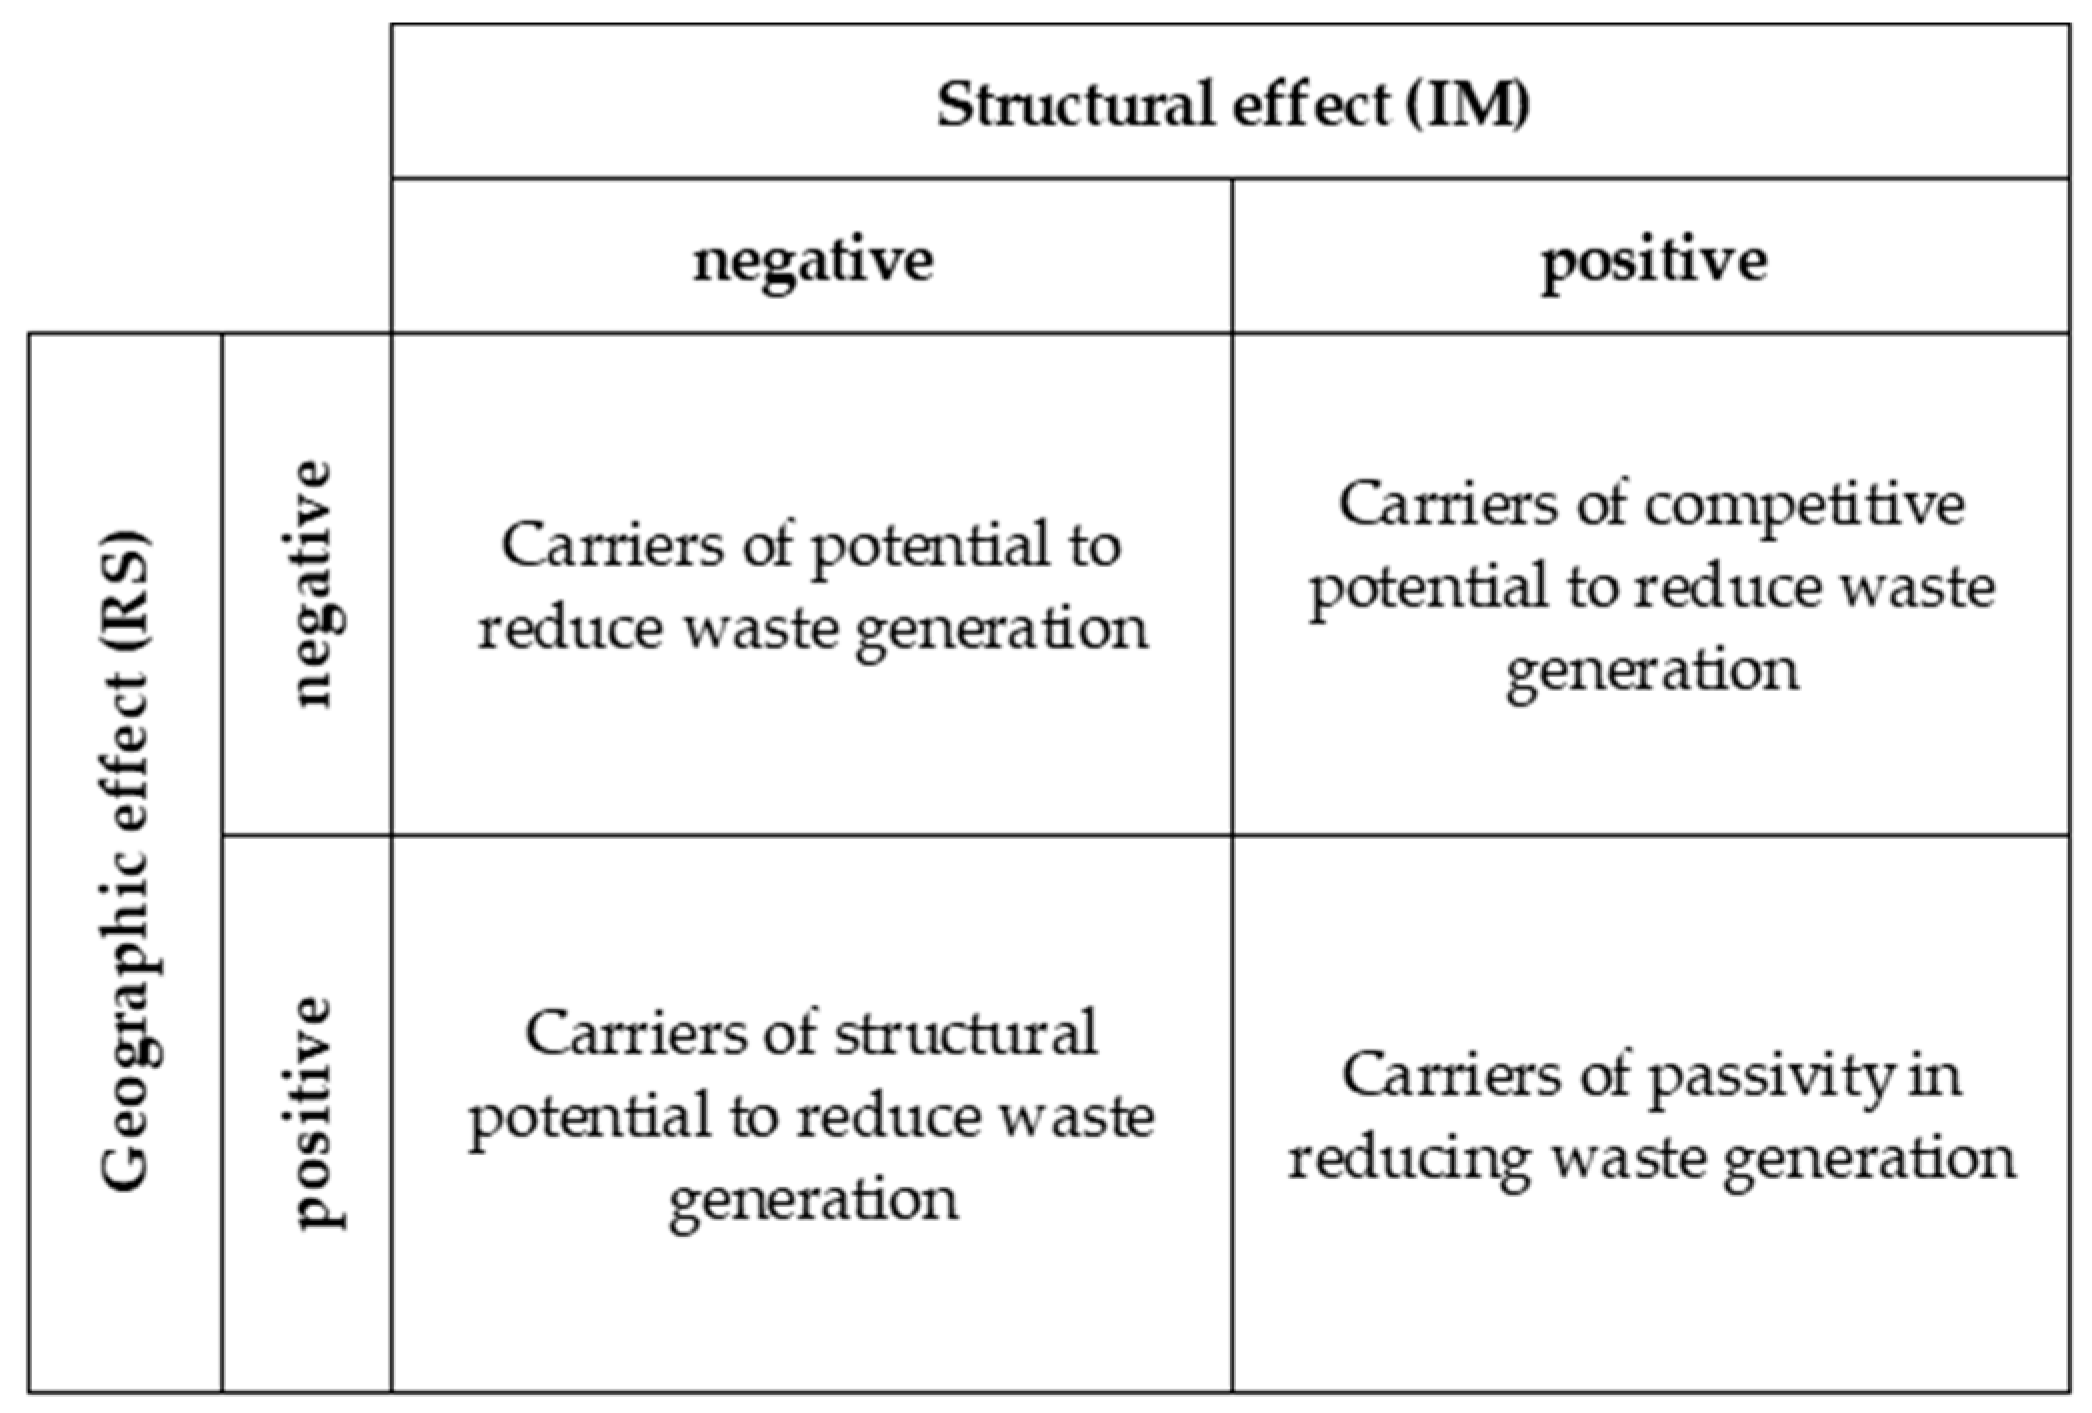
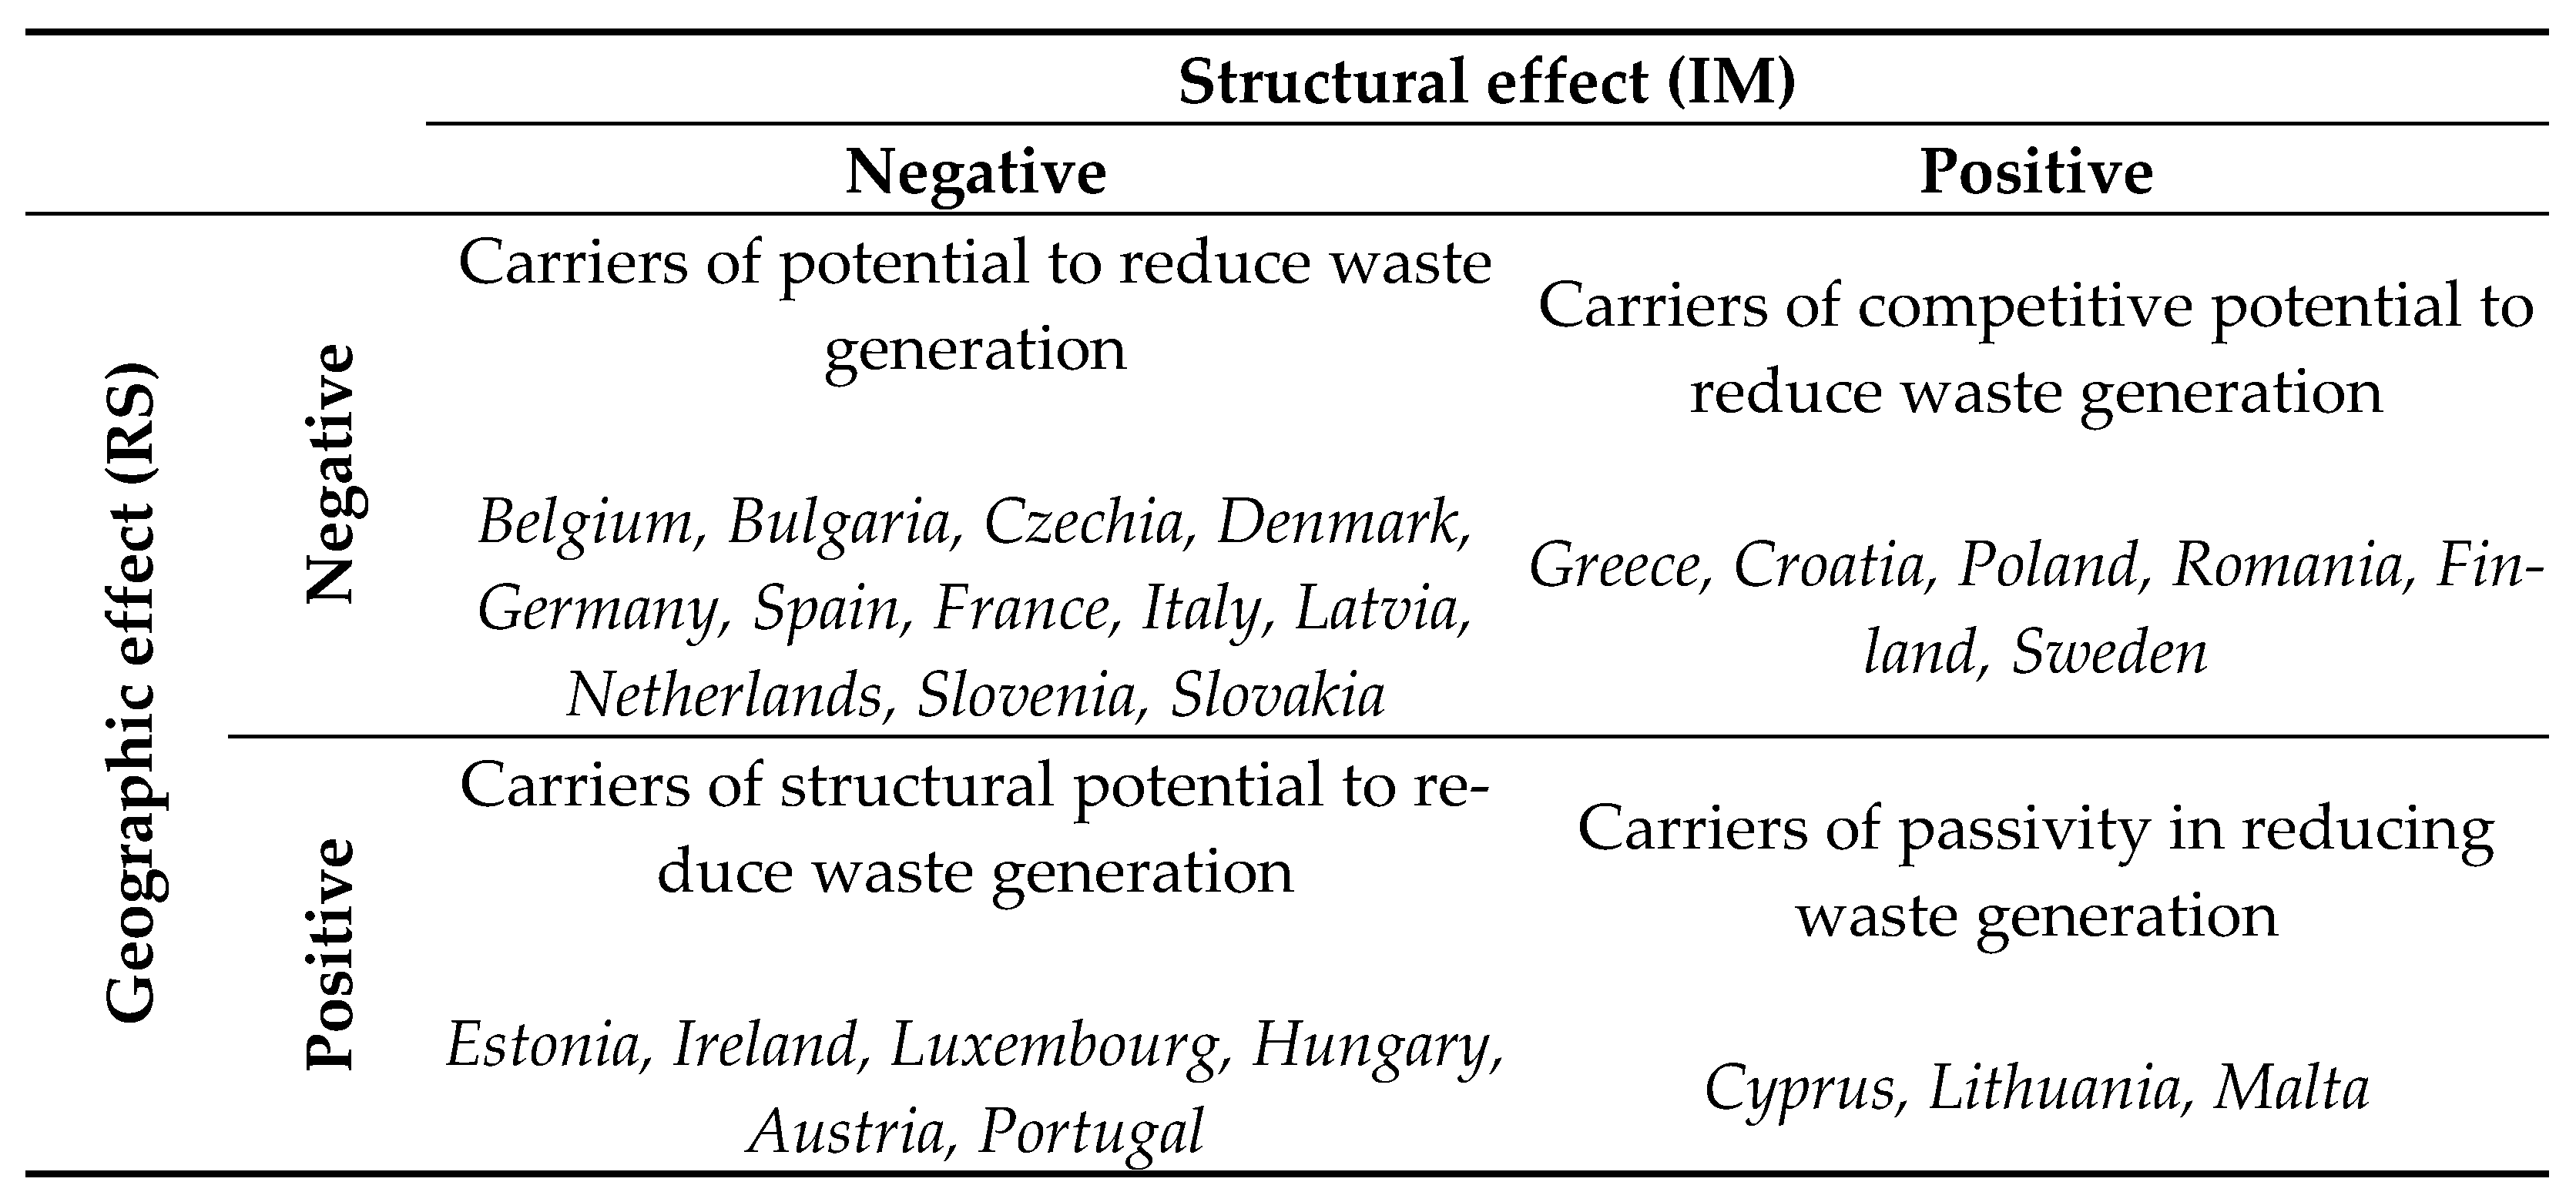
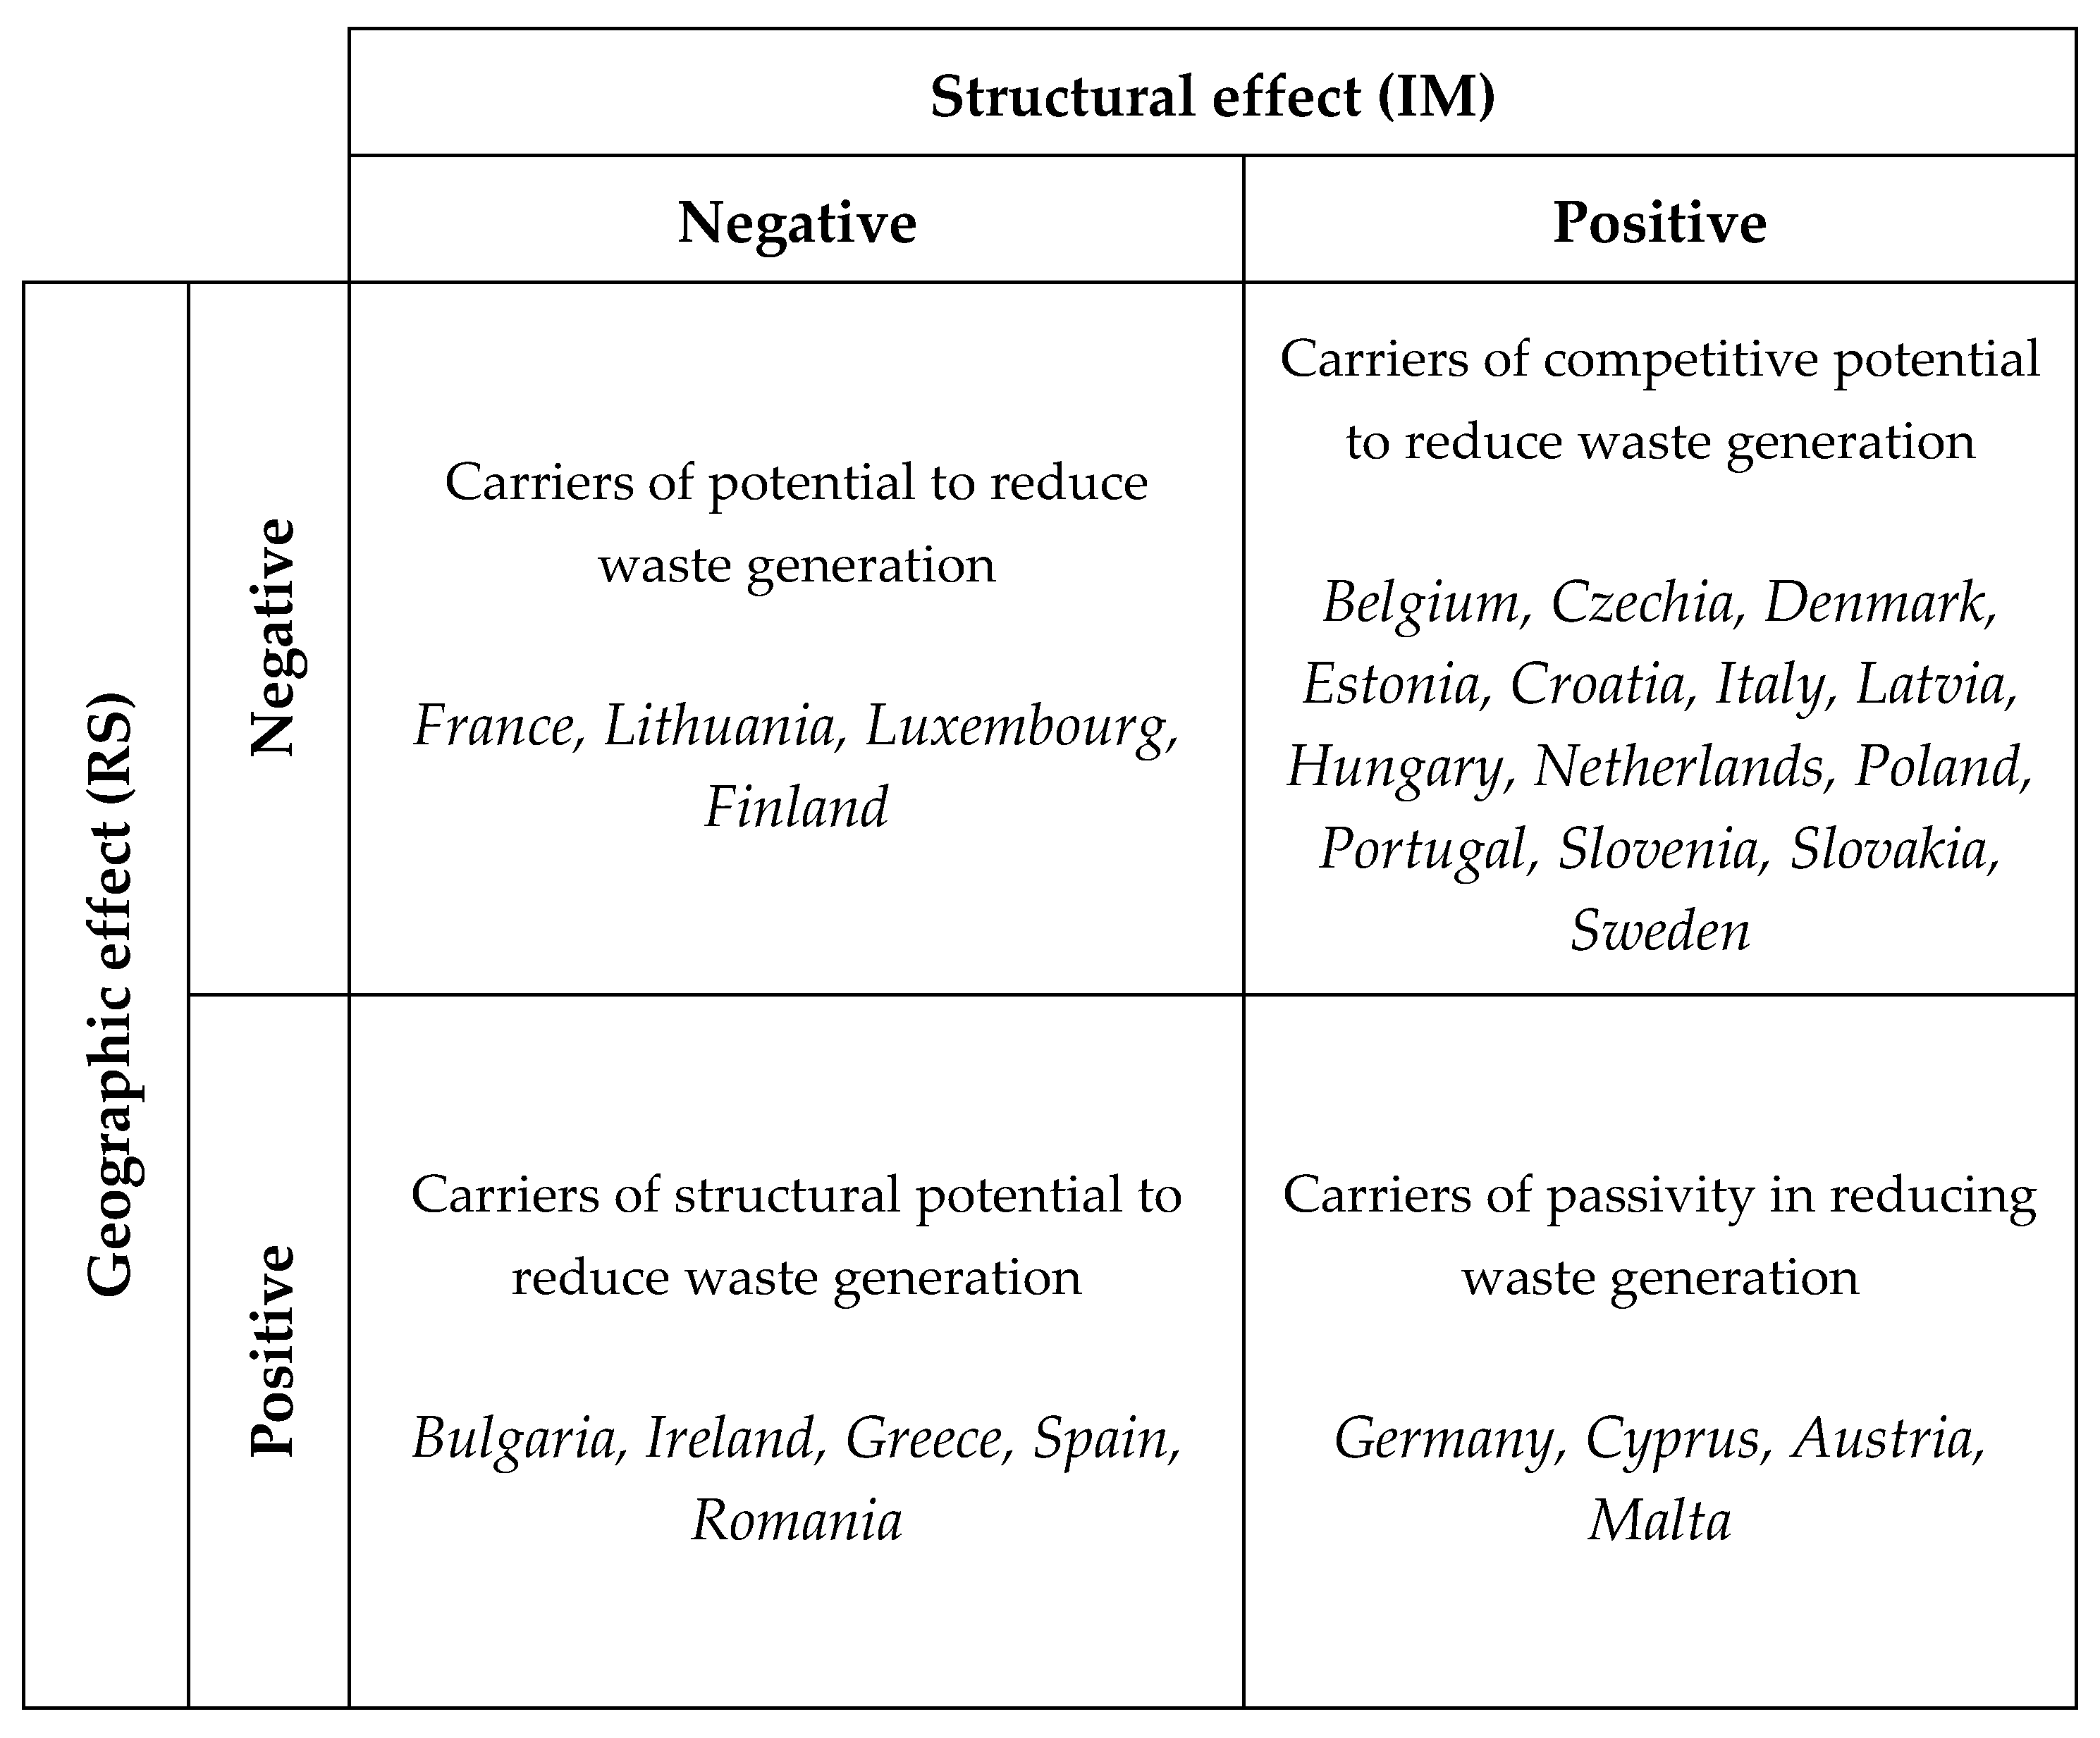
  • The carriers of the potential to reduce waste generation are the economies of the countries with declining trends in the amount of waste generated by manufacturing companies.
  • The carriers of the competitive potential to reduce waste generation are the economies of the countries with a faster decline in the amount of waste generated by companies in the manufacturing sector compared with other sectors. This potential can be influenced by such macroeconomic factors as, for example, the number of companies or the ability to finance pro-environmental investments in a country.
  • The carriers of the structural potential for reducing waste generation are the economies of the countries where positive changes in the amount of waste generated in comparison with the EU average are observed, i.e., a decrease in the amount of waste generated by manufacturing companies in comparison with the average amount of waste generated in the European Union. Simultaneously, these changes are due to sectoral variations, so, for example, as a result of specific national solutions for reducing waste in companies, national plans for pro-environmental attitudes of companies, production technologies used, and ways of allocating financial resources to pro-environmental solutions.
  • The carriers of passivity in reducing waste generation are the economies of the countries with an increase in the amount of waste generated by industrial companies, caused by both competitive and structural factors.

3. Results

The values of the respective components of the shift-share analysis for hazardous and non-hazardous waste are shown in Table 1 and Table 2, respectively.
The results of the shift-share analysis show a declining trend in the amount of hazardous waste generated by companies in the manufacturing sector observed for the European Union overall. Overall, at the European Union level, the amount of hazardous waste generated in 2022 was lower by 3,632,096 tons than in 2010. The respective components of the analysis address different aspects of change. The first one, the national share, indicates changes resulting from the general economic situation in the European Union, and therefore reflects the expected change (increase or decrease) in the amount of hazardous waste generated in companies in the manufacturing sector, assuming that the change in this regard in the respective countries is similar to the changes observed in the amount of hazardous waste generated in the European Union in all sectors. A positive NS value for all countries means that manufacturing companies should show an upward trend in hazardous waste generation in all EU countries. Therefore, it can be argued that the negative changes in the amount of hazardous waste generated in manufacturing companies should be due to the overall condition of the EU economy. If such convergence were to occur, then the amount of hazardous waste generated by manufacturing companies operating in the European Union should increase by 7,182,606 tons. In fact, there has been a decline, which, as indicated by the NS component, was not due to a reduction in hazardous waste in companies in all sectors of each European Union country.
Assuming a similar rate of change in the amount of hazardous waste generated in manufacturing companies and the amount of hazardous waste generated in all sectors in the European Union, there should be an increase in the amount of hazardous waste generated in the manufacturing sector in each country. Such a situation occurred in 12 of the 27 European Union countries analyzed (positive TE). Assuming that NS refers to the general conditions determining the amount of hazardous waste generated, they were unfavorable to manufacturing companies and negatively affected the amount of hazardous waste generated.
The structural component of the total shift (IM) represents the amount of change in the amount of hazardous waste generated by companies in the manufacturing sector compared to the reference area, which is the amount of hazardous waste generated in companies in all sectors in the European Union. These changes are due to differences between the dynamics of changes in the amount of hazardous waste of companies operating in a given country and the dynamics of changes in the amount of hazardous waste generated in the European Union. In eight countries of the European Union, a positive value of the IM component is observed, indicating an unfavorable trend in the amount of hazardous waste generated in manufacturing enterprises compared to the amount of hazardous waste generated by enterprises of all sectors. Indeed, positive values of the IM component show that in the countries in question, the amount of hazardous waste generated by companies in the manufacturing sector has increased above the average amount of hazardous waste generated by other sectors across the European Union.
The third component (RS) indicates the increase or decrease in the analyzed variable caused by the competitive position of the respective EU countries; thus, it is interpreted as a reflection of the strength or weakness of the regional economy. These changes are due to the differences between the dynamics of changes in the amount of hazardous waste of enterprises in the manufacturing sector and the dynamics of changes in the amount of hazardous waste generated in enterprises of all sectors in the respective countries. Based on the positive RS value, it can be inferred that EU countries are less competitive in terms of the amount of hazardous waste generated by companies in the manufacturing sector in comparison with the amount of hazardous waste generated by companies in all sectors. This situation was observed in nine countries. The negative value of the RS component occurred mainly in the countries characterized by a negative real change, which means higher regional competitiveness in terms of the analyzed variable of manufacturing enterprises relative to enterprises in all sectors. The clear dominance of the RS component over the other components of the total shift is therefore evident, especially in the countries with an ultimate decline in hazardous waste (negative TE).
The regional sectoral effect (RSE) is negative for all the countries. This means that the reduction in the amount of hazardous waste generated at the level of individual EU countries was lower than the decrease in the amount of such waste produced across the entire economy. The negative value of the RCCE effect for 12 EU countries means that the reduction of hazardous waste generated by manufacturing sector enterprises in these countries is faster than the overall reduction of such waste in the entire European Union.
Positive trends can be observed for the amount of non-hazardous waste generated by manufacturing companies operating in the European Union. The negative values of the NS component for all countries indicate an expected decrease in the amount of non-hazardous waste generated in manufacturing enterprises, a consequence of the decrease in the amount of such waste generated in enterprises in all sectors. These trends show the favorable impact of the conditions determining the amount of waste in manufacturing enterprises. The following countries, among others, have demonstrated the relatively greatest capabilities in this regard: Germany, Italy, and Poland—in these countries it was potentially possible to reduce the amount of waste generated in manufacturing companies by 337,359, 247,392, and 213,942 tons, respectively (representing 19%, 14%, and 12% of the EU-wide amount of non-hazardous waste). However, the largest actual decreases in non-hazardous waste were observed in Italy, Belgium, and Finland, with reductions of 7,798,576, 5,632,838, and 4,516,163 tons of waste generated in manufacturing companies.
The IM component, in turn, indicates positive trends in the amount of non-hazardous waste generated in the manufacturing sector in comparison with all sectors in such countries as Greece, Finland, Spain, Romania, Bulgaria, France, Ireland, Lithuania, and Luxembourg. Unfortunately, other countries are seeing an increase in the amount of non-hazardous waste generated by manufacturing companies above the average amount of hazardous waste generated by other sectors in the European Union.
The difference between the amount of non-hazardous waste in the manufacturing sector in comparison with all sectors indicated in the RS competitiveness level should be assessed as quite high. Most countries showed lower dynamics in the amount of waste generated in the manufacturing sector in comparison with all sectors. Austria and Germany’s low competitiveness on the analyzed variable may come as a surprise—these countries have great potential for reducing waste generation but still show a negative trend in terms of changes in waste volumes, as well as poor competitiveness in this area.
Countries such as Bulgaria, Czechia, Germany, Estonia, Ireland, Cyprus, Hungary, Malta, Austria, Portugal, and Slovakia are seeing an increase in the amount of non-hazardous waste generated in the manufacturing sector (positive TE value) despite positive expected trends in this area (negative NS value). The positive value of the TE component was most influenced in most of these countries by the IM component, i.e., the sectoral structure. Only in the case of Bulgaria and Ireland was the increase in non-hazardous waste generated in manufacturing companies influenced by the geographic effect manifested by a greater increase in the amount of waste generated compared to the entire European Union.
The regional sectoral effect (RSE) is positive for all the countries. This means that no country has achieved a reduction in the amount of non-hazardous waste generated at the EU level across all sectors (not only manufacturing). There is still a need to modify hazardous waste management strategies to reduce their volume. This is further supported by the value of the RCCE effect, as in fewer than half of EU countries, the reduction in non-hazardous waste generated by enterprises of the manufacturing sector is slower than the overall reduction in non-hazardous waste generated by all enterprises in the European Union.
When comparing EU countries in terms of structural and regional changes in the amount of hazardous waste generated, it can be observed that countries such as Belgium, Bulgaria, Czechia, Denmark, Germany, Greece, Spain, France, Croatia, Italy, Latvia, Netherlands, Poland, Romania, Slovenia, Slovakia, Finland, and Sweden exhibit competitive advantages in the manufacturing sector at the EU level, as the decline in hazardous waste generation in this sector is more dynamic than at the EU level. However, at the national level, these changes are not as positive. Therefore, waste management policies in these countries should focus on improving the competitiveness of the manufacturing sector domestically to strengthen their national economies.
On the other hand, countries such as Estonia, Ireland, Cyprus, Lithuania, Luxembourg, Hungary, Malta, Austria, and Portugal show a competitive advantage in the manufacturing sector at the national level, and trends in hazardous waste generation are more positive domestically than at the EU level. Nevertheless, these countries do not exhibit sectoral competitive advantages at the EU level. Thus, it is advised that these countries direct their national waste management policies towards sustaining and boosting the competitiveness of the manufacturing sector in order to improve their competitive standing within the EU while safeguarding their national strengths.
In the case of non-hazardous waste, countries such as Bulgaria, Germany, Ireland, Greece, Spain, Cyprus, Malta, Austria, and Romania show a competitive advantage in the manufacturing sector within their national economies, as the amount of non-hazardous waste generated by enterprises in this sector is decreasing faster than in the overall economy. However, the reduction in non-hazardous waste in these countries is slower than in the entire European Union. Consequently, waste management policies in these countries should focus on strengthening the competitiveness of the manufacturing sector through targeted investments aimed at reflecting national sectoral advantages at the EU level.
Most countries, including Belgium, Czechia, Denmark, Estonia, France, Croatia, Italy, Latvia, Lithuania, Luxembourg, Hungary, Netherlands, Poland, Portugal, Slovenia, Slovakia, Finland, and Sweden, demonstrate competitive advantages in the manufacturing sector only at the EU level. However, at the national level, the manufacturing sector shows a less favorable situation regarding the reduction of non-hazardous waste, as the decrease in waste is slower than for the entire European Union. Waste management policies in these countries should prioritize enhancing the competitiveness of the manufacturing sector by capitalizing on national strengths in waste reduction. This approach will help preserve the country’s competitive edge within the EU while reinforcing the national economic framework in terms of waste prevention.
Taking into account the values of structural and geographic effects, the countries were identified that are taking measures conducive or not conducive to reducing waste in the context of preventing waste generation (Figure 2 and Figure 3).
From the data shown in Figure 2 and Figure 3, it is clear that countries have different policies on hazardous and non-hazardous waste for manufacturing companies. France is the only country to observe positive trends for hazardous and non-hazardous waste—it was the only country to observe positive trends for both waste groups, i.e., a decrease in the amount of waste generated due to both sectoral and competitive changes. Positive trends in structural or competitive changes occurred in as many as twelve European Union countries for hazardous waste. These are countries with different levels of economic and social development. Positive trends in the formation of the waste stream due to competitive and structural factors may therefore result from various reasons that require deeper analysis. In the case of non-hazardous waste, most countries create positive changes caused by competitive potential. It demonstrates that, for this group of waste, the most important factors shaping downward trends in the volume of waste are primarily due to the macroeconomic situation of the country. Surprisingly, Germany and Austria ranked among the countries characterized by passivity in terms of the amount of non-hazardous waste generated. It can be assumed that this is due to the high economic development of these countries. A high level of economic development contributes to increased waste generation. For this reason, highly developed countries strive to reduce waste by promoting reuse, recycling, and processing initiatives. Furthermore, in terms of the amount of non-hazardous waste generated, these countries demonstrate a competitive advantage in the manufacturing sector within their national economies. However, the amount of non-hazardous waste produced by manufacturing sector enterprises in these countries is decreasing more slowly than in the entire European Union.
The analyses carried out indicate a wide variation in the trends in the amount of waste generated in the context of structural and competitive factors shaping these trends. The Nordic countries Denmark, Sweden, and Finland are among the countries with positive trends in waste generation. This situation should not come as a surprise, as studies show that countries such as Denmark and Sweden are leaders in driving a green and eco-innovative economy [58]. Although countries such as Bulgaria and Slovakia found themselves in the group of countries that are carriers of structural and/or competitive potential to reduce the amount of hazardous and non-hazardous waste generated, at the same time, they are countries that store waste, including municipal waste, to a large extent [59]. This situation can therefore mobilize towards taking steps to reduce the amount of waste.
In terms of reducing the amount of waste generated, the situation is worse for non-hazardous waste. EU countries have implemented the EU requirements for waste handling methods in different ways and have responded with different strategies. In terms of implementing the waste hierarchy goals, the following group of leaders can be observed: Slovenia, the Netherlands, Belgium, and Germany [2]. However, these countries are focused on re-use, recycling, recovery, and disposal, rather than prevention. Even more so because Tauš et al. [60] showed that increasing the share of energy recovery from waste has an impact on increasing the rate of waste sorting and subsequent recycling. Attention is also being paid to treating waste not as a problem, but as a resource [61,62], which is related to reconceptualization of waste as a valuable resource [63]. In turn, Germany is considered to be the country in the European Union that is most advanced in implementing circular economy development activities in the context of circularity, trade flows, and recycling [64]. This is confirmed by the dynamics of change in the industrial mix and regional shift for Germany—the structural factor resulted in a 7.09% increase in waste and the geographic factor resulted in a 9.43% increase in non-hazardous waste. This may explain the country’s passivity in reducing non-hazardous waste. This is because it is difficult to prevent waste if the narrative in developed countries is oriented toward seeing waste as raw materials. Perhaps this mindset is the result of research showing that waste prevention strategies do not necessarily prevent negative environmental impacts [65]. In addition, the intensification of production factors, such as capital and employment, contributes to an increase in waste generation, both in the short and long term [66].
The research by Gentil et al. [67] showed that waste prevention has only minor direct consequences for the environmental impact of waste management systems. Waste management focused on energy and material recovery generates significant environmental savings that are not significantly reduced by waste prevention. Unfortunately, it should be noted that stricter environmental regulations are leading, for example, to increased e-waste exports [68]. The research by Neves et al. [68] indicates that the countries with high emissions from increased economic growth may be less environmentally responsible and export more e-waste. Thus, it can be deduced that developed countries will be less committed to reducing waste because they can simply export it to other countries. This is also indicated by the results of a study by Marques and Teixeira [69], according to which, decisively positive changes in the establishment of a circular economy in the context of municipal waste management can be seen in Latvia, Lithuania, and Slovakia, while negative changes were noted in Finland, Luxembourg, and Romania. However, Finland, Luxembourg, and Lithuania were among the countries with the potential to reduce non-hazardous waste, while the others—Latvia, Slovakia, and Romania—are in the group characterized by competitive or structural potential. Thus, there is no rule by which economically developed countries are considered to be setting positive trends in waste management/prevention. Waste management is becoming increasingly difficult due to the specificity and complex matrix of wastes that are generated not only by processing raw materials but also by recycling or recovery [70].
Moreover, research indicates a significant variation in the effectiveness of the progress made by European Union countries in transitioning to a circular economy through waste management. Despite the considerable efforts of EU institutions, the response of various countries to the regulations and requirements introduced is inconsistent [71], which may be the reason why countries vary so much in terms of waste reduction potential. It should also be taken into account that the Waste Framework Directive assumes an increase in preparing for re-use and recycling targets by 2035, indicating an increase in the importance of these two methods of handling waste [72], while there are no targets set for waste prevention. This issue should be taken into account, as the study by Tang et al. [73] revealed that in 76.67% of the regions analyzed in China, prevention efficiency surpasses treatment efficiency, while in only 23.33% of the regions is treatment efficiency higher than prevention efficiency.

4. Conclusions

The analyses made it possible to identify trends in the amount of waste generated by manufacturing companies operating in each EU country compared to the amount of waste generated in all sectors. The conducted analyses thus allowed for answering the first research question: What are the trends in the amount of waste generated by manufacturing companies operating in each European Union country compared to the amount of waste generated in all sectors? The results of the shift-share analysis show a declining trend in the amount of hazardous and non-hazardous waste generated by companies in the manufacturing sector. In total, across the European Union, the volume of waste generated in 2022 was reduced compared to 2010 by 3,632,096 tons for hazardous waste and 15,149,754 tons for non-hazardous waste. The positive NS value for all countries for hazardous waste indicates that manufacturing companies are expected to show an upward trend in volumes in all EU countries. In fact, for this group of wastes, there was a decrease that resulted from both the structural (IM) and geographic (RS) components for the European Union overall, with a clear dominance of the RS component over the other components of the total shift in the countries that ultimately experienced a decrease in the amount of hazardous waste (negative TE).
A different situation is observed for non-hazardous waste. Negative values of the NS component for all the countries indicate an expected decrease in the amount of non-hazardous waste generated in manufacturing enterprises. The IM component has had a positive impact on trends in the amount of non-hazardous waste generated in the manufacturing sectors in countries such as Greece, Finland, Spain, Romania, Bulgaria, France, Ireland, Lithuania, and Luxembourg. Most countries showed lower dynamics in the amount of non-hazardous waste generated in the manufacturing sector in comparison with all the sectors (negative RS component).
It was also identified which factors influence trends in the amount of waste generated by enterprises in the manufacturing sector in individual European Union countries (research question Q2). Countries such as Bulgaria, Czechia, Germany, Estonia, Ireland, Cyprus, Hungary, Malta, Austria, Portugal, and Slovakia are seeing an increase in the amount of non-hazardous waste generated in the manufacturing sector (positive TE value) despite the positive expected trends in this area (negative NS value). The positive value of the TE component was most influenced in most of these countries by the IM component and, therefore, the structure of the companies.
An answer was also obtained for research question Q3, as EU countries were divided into four groups based on the conditions they create for the development of manufacturing companies in waste management in the context of waste reduction. Countries shape their policies for managing hazardous and non-hazardous waste for manufacturing enterprises differently. Positive trends regarding structural or competitive changes were observed in 12 EU countries for hazardous waste and only in 4 countries for non-hazardous waste.
The limitation of the research is the adoption of the year 2022 as the period ending the analyses. Due to dynamic changes in the scope of state policies aimed at waste management, it is necessary to continuously monitor trends in the amount of hazardous and non-hazardous waste, which will be the direction of future research. For this purpose, the research can also be extended to include dynamic shift-share analysis.
The article is also limited to examining only the dynamics of changes in the amount of waste generated. The impact of economic and social factors on the level of waste generated is omitted. For this reason, in the future, the impact of these factors on the size of the waste stream can be examined using an adapted Kuznets curve or an econometric model for qualitative data illustrating social factors. Undoubtedly, the impact of national and EU waste management policies should also be examined, particularly how they might explain the dynamics of changes in the amounts of waste generated.
The direction of future research should be to analyze the positive evidence for changes in the amount of waste generated for countries at different levels of economic and social development. It would provide an answer to the question of whether the positive trends in the quantitative characteristics of waste streams are due to consciously shaped pro-environmental policies, or rather to enforced restrictions related to industrial production. Furthermore, trends in the amount of waste generated should also be compared with trends in the amount of waste subjected to reuse, recycling, and recovery.
The results of the analysis are valuable for those responsible for shaping waste management in the manufacturing sector and should strengthen environmental management practices and monitoring by shaping consumption patterns and using technological advances to implement clean production methods. At the national level, they provide information regarding the effectiveness of waste management policies in reducing hazardous and non-hazardous waste in sectors compared to the overall economy. This enables the identification of methods to prevent waste generation in specific economic sectors. At the European Union level, the analyses allow for the identification of countries that may exhibit concerning trends in waste management compared to other countries and the EU as a whole. Such information encourages the revision of EU waste management legislation to find solutions that benefit the economies of each member state.
The conducted research serves as a model for analyzing trends in the effects of pro-environmental actions within a different structural and geographical context, particularly for economies less developed than the European Union or regions within individual countries striving to align their efforts more closely with waste management objectives.
Finally, this research contributes to the global discourse on trends in the generation of hazardous and non-hazardous waste. It highlights that, despite ongoing discussions about waste reduction, waste generation remains a significant issue both at the national and EU levels. Furthermore, the study supports the goal of waste prevention at its source by emphasizing the importance of sectoral and geographical conditions in shaping the volume of waste generated.

Funding

This research received no external funding.

Institutional Review Board Statement

Not applicable.

Informed Consent Statement

Not applicable.

Data Availability Statement

The raw data supporting the conclusions of this article will be made available by the authors on request.

Conflicts of Interest

The author declares no conflict of interest.

Abbreviations

EUEuropean Union
NSNational share
IMIndustrial mix (structural effect)
RSRegional shift (geographic effect)
TETotal effect
RIERegional industry mix effect
RSERegional sectoral effect
RCCEResidual contextual competitive effect

References

  1. Maldonado, L. The economics of urban solid waste reduction in educational institutions in Mexico: A 3-year experience. Resour. Conserv. Recycl. 2006, 48, 41–55. [Google Scholar] [CrossRef]
  2. Tomić, T.; Schneider, D.R. Municipal solid waste system analysis through energy consumption and return approach. J. Environ. Manag. 2017, 203, 973–987. [Google Scholar] [CrossRef]
  3. Haas, W.; Krausmann, F.; Wiedenhofer, D.; Heinz, M. How Circular is the Global Economy?: An Assessment of Material Flows, Waste Production, and Recycling in the European Union and the World in 2005. J. Ind. Ecol. 2015, 19, 765–777. [Google Scholar] [CrossRef]
  4. Burchart-Korol, D. Sustainable management of natural resources based on circular economy. Sci. Pap. Silesian Univ. Technol. Organ. Manag. 2016, 87, 51–61. [Google Scholar]
  5. Hazen, B.T.; Mollenkopf, D.A.; Wang, Y. Remanufacturing for the Circular Economy: An Examination of Consumer Switching Behavior. Bus. Strategy Environ. 2017, 26, 451–464. [Google Scholar] [CrossRef]
  6. Tecchio, P.; McAlister, C.; Mathieux, F.; Ardente, F. In search of standards to support circularity in product policies: A systematic approach. J. Clean. Prod. 2017, 168, 1533–1546. [Google Scholar] [CrossRef] [PubMed]
  7. Jawahir, I.S.; Bradley, R. Technological Elements of Circular Economy and the Principles of 6R-Based Closed-loop Material Flow in Sustainable Manufacturing. Procedia CIRP 2016, 40, 103–108. [Google Scholar] [CrossRef]
  8. Maeder, M.; Fröhling, M. Conceptualizing circular economy policy instruments: The case of recycled content standards. Sustain. Prod. Consum. 2024, 52, 333–346. [Google Scholar] [CrossRef]
  9. Wang, Y.; Liu, Y.; Pei, H. Designing a new robust solid waste recycling network under uncertainty: A case study about circular economy transition. Socio-Econ. Plan. Sci. 2024, 96, 102066. [Google Scholar] [CrossRef]
  10. Pratap, B.; Mohan, T.V.K.; Amit, R.K.; Venugopal, S. Evaluating circular economy strategies for raw material recovery from end-of-life lithium-ion batteries: A system dynamics model. Sustain. Prod. Consum. 2024, 50, 191–204. [Google Scholar] [CrossRef]
  11. D’Inverno, G.; Carosi, L.; and Romano, G. Meeting the challenges of the waste hierarchy: A performance evaluation of EU countries. Ecol. Indic. 2024, 160, 111641. [Google Scholar] [CrossRef]
  12. Zhang, C.; Hu, M.; Di Maio, F.; Sprecher, B.; Yang, X.; Tukker, A. An overview of the waste hierarchy framework for analyzing the circularity in construction and demolition waste management in Europe. Sci. Total Environ. 2022, 803, 149892. [Google Scholar] [CrossRef] [PubMed]
  13. Pires, A.; Martinho, G. Waste hierarchy index for circular economy in waste management. Waste Manag. 2019, 95, 298–305. [Google Scholar] [CrossRef]
  14. Bartl, A. End-of-Life Textiles. In Waste, 2nd ed.; Letcher, T.M., Vallero, D.A., Eds.; Academic Press: Cambridge, MA, USA, 2019; pp. 323–336. [Google Scholar] [CrossRef]
  15. Zorpas, A.A.; Lasaridi, K. Measuring waste prevention. Waste Manag. 2013, 33, 1047–1056. [Google Scholar] [CrossRef]
  16. Corvellec, H. A performative definition of waste prevention. Waste Manag. 2016, 52, 3–13. [Google Scholar] [CrossRef] [PubMed]
  17. Bortoleto, A.P. Waste Prevention Policy and Behaviour. In New Approaches to Reducing Waste Generation and Its Environmental Impacts; Routledge: New York, NY, USA, 2015. [Google Scholar]
  18. Wiprächtiger, M.; Haupt, M.; Rapp, M.; Hellweg, S. Waste not, want not—Ambiguities around waste and waste prevention. Resour. Conserv. Recycl. 2021, 173, 105742. [Google Scholar] [CrossRef]
  19. Nilsen, H.R. The hierarchy of resource use for a sustainable circular economy. Int. J. Soc. Econ. 2020, 47, 27–40. [Google Scholar] [CrossRef]
  20. Sharp, A.; Stocchi, L.; Levitzke, V.; Kreinhold, M. Developing Measures for the Waste Management Hierarchy: A South Australian Case Study. In Unmaking Waste in Production and Consumption: Towards the Circular Economy; Crocker, R., Saint, C., Chen, G., Tong, Y., Eds.; Emerald Publishing Limited: Leeds, UK, 2018; pp. 159–175. [Google Scholar] [CrossRef]
  21. Dolnicar, S. Eat up! Prevention of plate waste in tourism and hospitality: A perspective paper. Tour. Rev. 2021, 76, 43–46. [Google Scholar] [CrossRef]
  22. Hou, C.; Sarigöllü, E. Waste prevention by consumers’ product redistribution: Perceived value, waste minimization attitude and redistribution behavior. Waste Manag. 2021, 132, 12–22. [Google Scholar] [CrossRef]
  23. Magrini, C.; Degli Esposti, A.; De Marco, E.; Bonoli, A. A framework for sustainability assessment and prioritisation of urban waste prevention measures. Sci. Total Environ. 2021, 776, 145773. [Google Scholar] [CrossRef]
  24. Lin, C.; Ahmad, S.F.; Ayassrah, A.Y.B.A.; Irshad, M.; Telba, A.A.; Awwad, E.M.; Majid, M.I. Green production and green technology for sustainability: The mediating role of waste reduction and energy use. Heliyon 2023, 9, e22496. [Google Scholar] [CrossRef]
  25. Ndiribe, C.C. The nature fit concept of waste reduction: Prospects for engineering a clean future. J. Environ. Sustain. 2023, 14, 100127. [Google Scholar] [CrossRef]
  26. Suryawan, I.W.K.; Lee, C.-H. Community preferences in carbon reduction: Unveiling the importance of adaptive capacity for solid waste management. Ecol. Indic. 2023, 157, 111226. [Google Scholar] [CrossRef]
  27. Sumrin, S.; Gupta, S.; Asaad, Y.; Wang, Y.; Bhattacharya, S.; Foroudi, P. Eco-innovation for environment and waste prevention. J. Bus. Res. 2021, 122, 627–639. [Google Scholar] [CrossRef]
  28. Tua, C.; Nessi, S.; Rigamonti, L.; Dolci, G.; Grosso, M. Packaging waste prevention in the distribution of fruit and vegetables: An assessment based on the life cycle perspective. Waste Manag. Res. 2017, 35, 400–415. [Google Scholar] [CrossRef]
  29. Tencati, A.; Pogutz, S.; Moda, B.; Brambilla, M.; Cacia, C. Prevention policies addressing packaging and packaging waste: Some emerging trends. Waste Manag. 2016, 56, 35–45. [Google Scholar] [CrossRef] [PubMed]
  30. Nessi, S.; Rigamonti, L.; Grosso, M. Packaging waste prevention activities: A life cycle assessment of the effects on a regional waste management system. Waste Manag. Res. 2015, 33, 833–849. [Google Scholar] [CrossRef]
  31. Lucia-Monica, S. Study on packaging waste prevention in Romania. Ann. Fac. Econ. 2013, 1, 1404–1413. [Google Scholar]
  32. Domingo-Morcillo, E.; Escrig-Olmedo, E.; Rivera-Lirio, J.M.; Muñoz-Torres, M.J. Analyzing the suitability of LCIA methods to foster the most beneficial food loss and waste prevention action in terms of environmental sustainability. Environ. Impact Assess. Rev. 2024, 107, 107575. [Google Scholar] [CrossRef]
  33. Amador-Cervera, M.; Angarita-Zapata, J.S.; de la Calle Vicente, A.; Alonso-Vicario, A. The FOODRUS index: Assessing suitability for effective food loss and waste prevention management under an integral perspective. Waste Manag. 2024, 179, 32–43. [Google Scholar] [CrossRef] [PubMed]
  34. Casonato, C.; García-Herrero, L.; Caldeira, C.; Sala, S. What a waste! Evidence of consumer food waste prevention and its effectiveness. Sustain. Prod. Consump. 2023, 41, 305–319. [Google Scholar] [CrossRef]
  35. Albizzati, P.F.; Rocchi, P.; Cai, M.; Tonini, D.; Astrup, T.F. Rebound effects of food waste prevention: Environmental impacts. Waste Manag. 2022, 153, 138–146. [Google Scholar] [CrossRef] [PubMed]
  36. Le Borgne, G.; Sirieix, L.; Valette-Florence, P.; Costa, S. Adopting waste-prevention routines: The role of consumer concern for food waste. Appetite 2021, 163, 105188. [Google Scholar] [CrossRef]
  37. Moraes, N.V.; Lermen, F.H.; Echeveste, M.E.S. A systematic literature review on food waste/loss prevention and minimization methods. J. Environ. Manag. 2021, 286, 112268. [Google Scholar] [CrossRef]
  38. Pilipenets, O.; Hui, F.K.P.; Gunawardena, T.; Mendis, P.; Aye, L. New circularity indicator for decision making in the stockpile management of construction and demolition waste: Perspectives of Australian practitioners. J. Environ. Manag. 2024, 363, 121345. [Google Scholar] [CrossRef] [PubMed]
  39. Hassan, M.H.; Mohamed, A.Y.; Ibrahim, A.M.; Roble, Z.A.; Balasbaneh, A.T. A Review of Strategies to Prevent On-Site Construction Waste. J. Adv. Environ. Solut. Resour. Recovery 2022, 2, 19–26. [Google Scholar]
  40. Mbadugha, L.C.; Ozumba, A.O.U.; Shakantu, W.M.W. The need to improve current waste management practices in the area of construction waste reduction. In IOP Conference Series: Earth and Environmental Science, Proceedings of the ASOCSA 14th Built Environment Conference, Durban, South Africa, 21–22 September 2020; IOP science: Bristol, UK, 2021; Volume 654. [Google Scholar]
  41. Ren, C.; Wang, W.; Yao, Y.; Wu, S.; Qamar; Yao, X. Complementary use of industrial solid wastes to produce green materials and their role in CO2 reduction. J. Clean. Prod. 2020, 252, 119840. [Google Scholar] [CrossRef]
  42. Ribeiro-Rodrigues, E.; Bortoleto, A.B.; Fracalanza, B.C. Exploring the influence of contextual and sociodemographic factors on waste prevention behaviour—The case of Campinas, Brazil. Waste Manag. 2021, 135, 208–219. [Google Scholar] [CrossRef] [PubMed]
  43. Zhang, X.; Zhou, M.; Li, J.; Wei, L.; Dong, Y.; Hou, H.; Chen, C.; Wang, Z. Analysis of driving factors on China’s industrial solid waste generation: Insights from critical supply chains. Sci. Total Environ. 2021, 775, 145185. [Google Scholar] [CrossRef] [PubMed]
  44. Lee, D.; Kim, J.; Sonnemann, G.; Park, H.-S. Identifying the socioeconomic determinants of industrial hazardous waste generation: South Korea as a case study. Sci. Total Environ. 2023, 901, 166525. [Google Scholar] [CrossRef] [PubMed]
  45. Johansson, N.; Corvellec, H. Waste policies gone soft: An analysis of European and Swedish waste prevention plans. Waste Manag. 2018, 77, 322–332. [Google Scholar] [CrossRef]
  46. Scrioşteanu, A.; Criveanu, M.M. Reverse Logistics of Packaging Waste under the Conditions of a Sustainable Circular Economy at the Level of the European Union States. Sustainability 2023, 15, 14727. [Google Scholar] [CrossRef]
  47. Ali, H.; Ahmad, A.R.; Ali, N.; Ahmad, S.; Toriman, M. Waste prevention and life cycle assessment in municipal solid waste management towards sustainable environment. J. Adv. Res. Nat. Appl. Sci. 2012, 6, 85–93. [Google Scholar]
  48. Topliceanu, L.; Puiu, P.G.; Drob, C.; Topliceanu, V.V. Analysis Regarding the Implementation of the Circular Economy in Romania. Sustainability 2023, 15, 333. [Google Scholar] [CrossRef]
  49. Lee, D.; Kim, J.; Park, H.-S. Characterization of industrial hazardous waste generation in South Korea using input-output approach. Resour. Conserv. Recycl. 2022, 183, 106365. [Google Scholar] [CrossRef]
  50. Agovino, M.; Cerciello, M.; Garofalo, A.; Musella, G. Environmental legislation and achieving circular economy in Italy’s waste sector: A shift-and-share macro-area analysis. Util. Policy 2024, 90, 101811. [Google Scholar] [CrossRef]
  51. Agovino, M.; Cerciello, M.; Musella, G.; Garofalo, A. European waste management regulations and the transition towards circular economy. A shift-and-share analysis. J. Environ. Manag. 2024, 354, 120423. [Google Scholar] [CrossRef]
  52. Montanía, C.V.; Márquez, M.A.; Fernández-Núñez, T.; Hewings, G.J.D. Toward a more comprehensive shift-share analysis: An illustration using regional data. Growth Chang. 2024, 55, e12693. [Google Scholar] [CrossRef]
  53. Knudsen, D.C. Shift Share Analysis: Further examination of models for the description of economic change. Socio-Econ. Plan. Sci. 2000, 34, 177–198. [Google Scholar] [CrossRef]
  54. Zaccomer, G. Shift-Share Analysis with Spatial Structure: An Application to Italian Industrial Districts. Transit. Stud. Rev. 2006, 13, 213–227. [Google Scholar] [CrossRef]
  55. Eurostat Database. Available online: https://ec.europa.eu/eurostat/web/waste/database (accessed on 4 October 2024).
  56. Document 21993A0216: Basel Convention on the Control of Transboundary Movements of Hazardous Wastes and Their Disposal. Available online: https://eur-lex.europa.eu/legal-content/EN/TXT/HTML/?uri=CELEX:21993A0216 (accessed on 2 October 2024).
  57. Trzpiot, G.; Szołtysek, J.; Ojrzyńska, A.; Twaróg, S. Wykorzystanie shift share analysis w opisie zmian struktury honorowych dawców krwi w Polsce (Use Shift Share Analysis of Changes in the Description of the Structure of Blood Donors in Poland). Stud. Ekon. 2013, 162, 85–98. [Google Scholar]
  58. Mazur-Wierzbicka, E. Measurement of Progress in the Environmental Area: Poland against the Countries of the European Union. Int. J. Environ. Res. Public Health 2023, 20, 563. [Google Scholar] [CrossRef] [PubMed]
  59. Tsimnadis, K.; Kyriakopoulos, G.L. Investigating the Role of Municipal Waste Treatment within the European Union through a Novel Created Common Sustainability Point System. Recycling 2024, 9, 42. [Google Scholar] [CrossRef]
  60. Tauš, P.; Šimková, Z.; Cehlár, M.; Krajňáková, I.; Drozda, J. Fulfillment of EU Goals in the Field of Waste Management through Energy Recovery from Waste. Energies 2023, 16, 1913. [Google Scholar] [CrossRef]
  61. Corvellec, H.; Hultman, J. From “less landfilling” to “wasting less”: Societal narratives, socio-materiality, and organizations. J. Organ. Chang. Manag. 2012, 25, 297–314. [Google Scholar] [CrossRef]
  62. Singh, A.; Sushil. Integrated approach for finding the causal effect of waste management over sustainability in the organization. Benchmarking Int. J. 2021, 28, 3040–3073. [Google Scholar] [CrossRef]
  63. Steenmans, K.; Malcolm, R. Transitioning towards circular systems: Property rights in waste. J. Prop. Plan. Environ. Law. 2020, 12, 219–234. [Google Scholar] [CrossRef]
  64. Ūsas, J.; Balezentis, T.; Streimikiene, D. Development and integrated assessment of the circular economy in the European Union: The outranking approach. J. Enterp. Inf. Manag. 2021; ahead of print. [Google Scholar] [CrossRef]
  65. de Lara, B.L.E.; Penteado, C.S.G. Environmental assessment of construction waste prevention: A case study in a social housing project in Southeast Brazil. Clean. Waste Syst. 2024, 8, 100145. [Google Scholar] [CrossRef]
  66. Hondroyiannis, G.; Sardianou, E.; Nikou, V.; Evangelinos, K.; Nikolaou, I. Waste generation and macroeconomic drivers: A panel study for European countries and regions. Manag. Environ. Qual. 2024, 35, 1118–1136. [Google Scholar] [CrossRef]
  67. Gentil, E.C.; Gallo, D.; Christensen, T.H. Environmental evaluation of municipal waste prevention. Waste Manag. 2011, 31, 2371–2379. [Google Scholar] [CrossRef]
  68. Neves, S.A.; Marques, A.C.; de Sá Lopes, L.B. Is environmental regulation keeping e-waste under control? Evidence from e-waste exports in the European Union. Ecol. Econ. 2024, 216, 108031. [Google Scholar] [CrossRef]
  69. Marques, A.C.; Teixeira, N.M. Assessment of municipal waste in a circular economy: Do European Union countries share identical performance? Clean. Waste Syst. 2022, 3, 100034. [Google Scholar] [CrossRef]
  70. Kim, L.; Cuciureanu, A.; Pascu, L.F.; Tache, O.C.; Catrina, G.A.A. Comprehensive Methodology for Assessing the Hazardousness of Waste Categorized in the European Union Legislation as “Mirror Entries”—Case Studies. Environments 2023, 10, 183. [Google Scholar] [CrossRef]
  71. Halkos, G.E.; Aslanidis, P.-S.C. Reviewing the integrated institutional waste-related framework for circular economy in the European Union. Waste Manag. Bull. 2024, 2, 28–35. [Google Scholar] [CrossRef]
  72. López-Portillo, M.P.; Martínez-Jiménez, G.; Ropero-Moriones, E.; Saavedra-Serrano, M.C. Waste treatments in the European Union: A comparative analysis across its member states. Heliyon 2021, 7, e08645. [Google Scholar] [CrossRef] [PubMed]
  73. Tang, J.; Wang, Q.; Li, Z.; Gu, J.; Xu, J. Coupling coordination degree of industrial solid waste prevention and treatment efficiencies and its driving factors in China. Ecol. Indic. 2024, 158, 111395. [Google Scholar] [CrossRef]
Figure 1. The matrix of conditions for the development of enterprises in the scope of waste management in the context of waste reduction. Source: own elaboration.
Sustainability 17 00034 g001
Figure 2. Matrix of conditions for the development of enterprises in the scope of hazardous waste management in the context of waste reduction. Source: own elaboration.
Sustainability 17 00034 g002
Figure 3. Matrix of conditions for the development of enterprises in the scope of non-hazardous waste management in the context of waste reduction. Source: own elaboration.
Sustainability 17 00034 g003
Table 1. Components of the shift-share analysis for the amount of hazardous waste generated in manufacturing enterprises in European Union countries in the period 2010–2022.
CountryThe Level of ComponentsReal ChangeSpatial Components
NSIMRSTERIERSERCCE
Belgium438,690−1,211,510−56,582−829,40256,582−438,691829,402
Bulgaria180,804−142,946−233,601−195,743233,601−180,804195,743
Czechia168,366−92,837−130,806−55,277130,806−168,36655,277
Denmark31,282−24,936−25,071−18,72525,071−31,28218,725
Germany1,514,650−812,112−114,0551−438,0131,140,551−1,514,650438,013
Estonia750,447−2,793,705905,480−1,137,777−905,480−750,4481,137,777
Ireland103,377−334,366294,68563,695−294,685−103,378−63,695
Greece32,905131,697−85,77078,83185,770−32,903−78,831
Spain417,789−199,139−362,656−144,006362,656−417,788144,006
France915,551−1,138,153−739,302−961,904739,302−915,551961,904
Croatia18,39318,557−53,154−16,20553,154−18,39216,205
Italy1,113,454−437,665−623,01752,772623,017−1,113,454−52,772
Cyprus421118010062607−1006−420−2607
Latvia3366−1801−7469−59047469−33665904
Lithuania3657902913,50926,194−13,509−3655−26,194
Luxembourg19,744−3733616122,172−6161−19,744−22,172
Hungary73,332−64,13550,18559,381−50,185−73,332−59,381
Malta59851816162732−1616−597−2732
Netherlands255,664−274,371−132,564−151,270132,564−255,664151,270
Austria107,364−104,680142,406145,091−142,406−107,364−145,091
Poland211,588138,647−228,769121,466228,769−211,588−121,466
Portugal59,652−20,00072,613112,265−72,613−59,652−112,265
Romania93,97433,976−181,917−53,967181,917−93,97453,967
Slovenia21,932−2716−21,871−265521,871−21,9322655
Slovakia66,910−31,465−20,18115,26420,181−66,910−15,264
Finland436,93114,752,887−15,490,711−300,89315,490,711−436,920300,893
Sweden141,765845,989−1,010,580−22,8251,010,580−141,76322,825
Total7,182,6060−10,814,702−3,632,096---
Source: own elaboration.
Table 2. Components of the shift-share analysis for the amount of generated non-hazardous waste in manufacturing companies in European Union countries in the period 2010–2022.
CountryThe Level of ComponentsReal ChangeSpatial Components
NSIMRSTERIERSERCCE
Belgium−98,7901,313,370−6,847,418−5,632,8386,847,41898,7905,632,838
Bulgaria−20,806−1,248,1463,495,2962,226,344−3,495,29620,805−2,226,344
Czechia−27,9832,761,713−1,963,228770,5031,963,22827,983−770,503
Denmark−11,109473,867−900,585−437,827900,58511,110437,827
Germany−337,3593,122,4624,151,6916,936,794−4,151,691337,359−6,936,794
Estonia−96751,440,891−117,8451,313,371117,8459676−1,313,371
Ireland−22,382−566,8762,076,7961,487,538−2,076,79622,382−1,487,538
Greece−37,033−2,928,7612,263,350−702,444−2,263,35037,03270,2444
Spain−115,806−2,605,987601,176−2,120,617−601,176115,8062,120,617
France−142,473−695,905−1,321,837−2,160,2151,321,837142,473216,0215
Croatia−4400499,774−571,668−76,294571,668440176,294
Italy−247,3929,237,725−16,788,910−7,798,57616,788,910247,3927,798,576
Cyprus−99848,311269,035316,348−269,035998−316,348
Latvia−2788469,633−529,300−62,455529,300278962,455
Lithuania−20,198−73,795−1,491,326−1,585,3181,491,32620,1981,585,318
Luxembourg−6152−46,166−246,228−298,546246,2286152298,546
Hungary−22,1771,883,230−688,1341,172,919688,13422,177−1,172,919
Malta−557560427911,784−427956−11,784
Netherlands−101,586380,414−1,016,985−738,1571,016,985101,586738,157
Austria−19,9791,707,477946,8812,634,379−946,88119,980−2,634,379
Poland−213,9722,111,647−4,858,428−2,960,7534,858,428213,9722,960,753
Portugal−19,5202,032,438−1,794,642218,2751,794,64219,521−21,8275
Romania−56,620−1,486,383492,533−1,050,470−492,53356,6201,050,470
Slovenia−11,0521,540,081−1,568,074−39,0451,568,07411,05339,045
Slovakia−18,7731,046,642−107,204920,666107,20418,773−920,666
Finland−105,606−2,678,710−1,731,847−4,516,1631,731,847105,6064,516,163
Sweden−56,3872,788,507−5,711,077−2,978,9575,711,07756,3872,978,957
Total−1,731,0690.0−33,953,698−15,149,754---
Source: own elaboration.
Disclaimer/Publisher’s Note: The statements, opinions and data contained in all publications are solely those of the individual author(s) and contributor(s) and not of MDPI and/or the editor(s). MDPI and/or the editor(s) disclaim responsibility for any injury to people or property resulting from any ideas, methods, instructions or products referred to in the content.

