1. Introduction
As society develops and living standards improve, environmental issues and the concept of sustainable development have attracted increasing attention. At the same time, societies and governments are vigorously promoting sustainable development. For instance, globally, numerous governments employ carbon taxes to mitigate greenhouse gas emissions. In 2018, Coca-Cola introduced the World Without Waste initiative to develop more recyclable packaging and decrease packaging waste. McDonald not only replaced plastic straws with paper straws but also replaced 85% of its packaging with renewable materials, which reduces the consumption of 72,000 kg of plastic per year. Apple’s policy to recycle old machines not only recycles the e-waste from its products but also puts the rest of the available materials into the circular economy (
https://www.apple.com.cn/environment/ [accessed on 10 October 2024]). Therefore, driven by green consumption and social responsibility, an increasing number of enterprises are making sustainable investments in the supply chain through different green methods to reduce resource consumption and improve the product green level in order to create new market opportunities [
1,
2]. Among the many environmental policies aimed at improving environmental sustainability, one of the most useful instruments for reducing carbon pollution emissions is an environmental tax [
3].
Even though companies have made several attempts to improve the environmental performance of their products through green investments, some green consumers are still skeptical [
4]. This is a result of information asymmetry and low transparency in the supply chain. Blockchain technology is key to addressing this challenge [
5,
6]. Blockchain, as a new type of decentralized protocol, relies on multiple independent nodes working together to maintain a distributed database system that can securely store all types of data under bitcoin transactions, with shared and highly secure data, information that cannot be forged or tampered with, and automatic execution of smart contracts [
7]. Because of these characteristics, the use of blockchain can effectively increase the level of trust between parties to a transaction and avoid the risks of business-to-business transactions [
8]. Jingdong Logistics is the first one to introduce a supply chain operational model leveraging blockchain technology to facilitate logistics signature returns (
https://www.jdl.com/news/315/content00199 [accessed on 15 October 2024]). At the same time, blockchain offers a new solution for achieving transparency, traceability, and quality assurance of product information [
9]. De Beers has launched Tracr, a blockchain diamond traceability platform that tracks all diamonds on their journey from the mine to the consumer. Tracr starts recording diamonds at their source and provides a tamper-proof guarantee of provenance, allowing buyers to provide an immutable record of a diamond’s provenance while simultaneously giving jewelry retailers and consumers greater confidence in the authenticity of their diamond’s origin (
https://www.xbiao.com/fashion/debeers/4949.html [accessed on 17 December 2024]). This is also common in sustainable supply chains. Blockchain’s traceability and tamper-proofing can effectively improve supply chain transparency and address the crisis of confidence among green consumers. Because of this, blockchain adoption can greatly encourage consumers’ green behavior and improve consumers’ green awareness [
10,
11].
This is likewise mirrored in the existing research. For example, Xu et al. [
12] emphasized the potential for blockchain adoption to enhance consumer comprehension of green information authenticity, thereby potentially boosting consumer interest in purchasing environmentally friendly products. Cai et al. [
13] investigated the optimal preferences of manufacturers when making green investments in production with blockchain technology. Moreover, blockchain adoption could also bring tax benefits to the manufacturer. Choi and Luo [
14] suggested that the government should act as a sponsor on the one hand and consider exemptions from environmental taxes on the other hand. The results suggest that if the government implements environmental tax reduction and exemption policies, then, blockchain adoption could improve social welfare and supply chain profitability. Li et al. [
15] pointed out that the government should support and strengthen green manufacturing and environmental protection by implementing mandatory policies and regulations, as well as encouraging and formulating preferential policies such as tax incentives. Therefore, in this paper, to encourage blockchain adoption, we also take into account the implementation of the government’s environmental tax reduction and exemption policies. The above studies have identified the role of environmental regulation and blockchain technology on green production and green investment in a rational context, without considering the impact of decision-makers’ behavioral characteristics on green investment, such as overconfidence [
16], fairness concerns [
17,
18], and risk aversion [
19]. Therefore, it is difficult for this type of model to address the existence of behavioral characteristics of supply chain decision-makers and the impact of irrational members’ decisions due to the adoption of blockchain technology.
Numerous behavioral studies in the field of psychology have shown that overconfidence is an important factor in decision bias [
20]. Overconfident behavior, i.e., the excessive willingness to bet on one’s performance, may be driven by optimistic beliefs or ambiguous attitudes [
16]. From a behavioral point of view, decision-makers tend to behave with limited rationality, and overconfidence, as a typical feature of irrational behavior, is prevalent in practice. Overconfident firms may overestimate the market demand for their products and their mastery of information, which can lead to biased decision-making and even irrational behavior [
21]. This phenomenon is ubiquitous in upstream manufacturing. In particular, their outstanding success in such businesses can lead them to behave irrationally, either by triggering price wars in their markets or by entering new markets. Gree was engaged in a fierce price war with Midea in 2014. Gree announced a comprehensive price cut on its air conditioning products, with a maximum reduction of 40%. Midea quickly followed suit and implemented price cuts on its air conditioning products. This price war eventually resulted in both companies losing market share and brand image (
https://www.dawen360.com/article/815094.html [accessed on 17 December 2024]). The founders of Northvolt, Europe’s largest power battery factory, wanted to establish a sustainable battery production site in Sweden using renewable energy. They overestimated the demand and market competitiveness of green batteries and neglected technological innovation and production efficiency, which ultimately led to a break in the financial chain and the company’s bankruptcy (
https://news.qq.com/rain/a/20241209A02ZWT00?suid=&media_id= [accessed on 8 November 2024]). Northvolt’s failure also aptly illustrates the important impact of overconfidence on corporate green decisions.
The overconfidence of different decision-makers can have different impacts on supply chain efficiency [
22,
23]. Du et al. [
24] show that managers with overconfidence are more likely to carry out innovative projects during their tenure. Meng et al. [
25] and Zhou et al. [
26] proposed considering the confidence degree of decision-makers’ opinions in the large-group decision-making method. This is not only able to use the degree of confidence as a factor to adjust the opinions of non-consensus experts to narrow the differences of opinion [
27,
28] but also enables the decision-makers to express their opinions more flexibly and confidently. Tu et al. [
29] investigated the interaction between managerial overconfidence and blockchain in fresh supply chains. Nevertheless, scant emphasis has been placed on the ramifications of integrating blockchain in sustainable supply chains, let alone taking into account how overconfidence affects decisions to use blockchain.
This paper attempts to investigate the impact of blockchain technology on green product investment decisions for a manufacturer with overconfidence. We mainly answer the following research questions:
- (1)
How does blockchain adoption affect optimal decision-making, profits, and social welfare across the supply chain?
- (2)
What is the incentive for the adoption of blockchain technology by manufacturer?
- (3)
How does the manufacturer’s overconfidence interact with blockchain technology, and how will it affect the sustainable supply chain’s performance?
To address the above questions, we construct a two-level supply chain consisting of an overconfident manufacturer and a rational retailer and use Stackelberg game theory to explore the impact of overconfidence and blockchain technology adoption on green investment decisions in sustainable supply chains. First, we apply backward induction to obtain equilibrium solutions under different models. Next, we apply derivative analysis and other methods to compare and analyze manufacturer’s motivation for blockchain adoption and further explore how the interaction between blockchain and overconfidence affects the equilibrium decisions of sustainable supply chain members. Finally, we apply numerical analysis to investigate the impact of key parameters in the model, such as the level of overconfidence and the coefficient of green investment costs, on members’ profits, consumer surplus, and social welfare.
Our study highlights several important findings. First, we discover the existence of a maximum tolerable blockchain operating cost for the manufacturer. The manufacturer is incentivized to adopt blockchain technology only in scenarios where the actual blockchain operational cost is below this threshold. With blockchain, as the level of overconfidence increases, the manufacturer can potentially achieve greater profitability compared to the scenario without blockchain. Second, we also find that the adoption of blockchain is only beneficial to the retailer when the manufacturer’s overconfidence is at a low level. Alternatively, the retailer can only make significant gains when the operating costs of blockchain are below a certain threshold. Finally, we find that blockchain adoption can increase consumer surplus and social welfare when the level of overconfidence increases.
The main contributions of this paper lie in three areas. First, this paper considers the contribution of blockchain technology to studying green investment decisions in sustainable supply chains. We explore the impact of blockchain technology on green investment in terms of the strategic choice of manufacturer to adopt blockchain technology. Second, we incorporate a possible cognitive bias of supply chain members, namely manufacturer overconfidence, into our model to examine the impact of the interaction between manufacturer overconfidence behavior and blockchain technology on green investment decisions. Finally, we show how changes in the level of overconfidence affect the adoption of blockchain technology and how their interaction affects supply chain decisions and social welfare.
The rest of this study is structured as follows. In
Section 2, three primary areas related to the paper are reviewed.
Section 3 discusses the model setup.
Section 4 and
Section 5 analyze the equilibrium results in two scenarios without blockchain and with blockchain, respectively. In
Section 6, we summarize the results of this comparison. The numerical analysis is detailed in
Section 7, while
Section 8 presents key findings, management insights, and future directions.
2. Literature Review
This paper has three literature streams: investment in sustainable supply chains, blockchain in supply chain management, and overconfidence in supply chain management. Next, we present some papers relevant to our paper and highlight the main differences between our paper and each stream.
2.1. Investment in Sustainable Supply Chains
Numerous nations and areas have recently implemented pertinent regulations to manage business carbon emissions [
30]. Furthermore, as consumers’ environmental consciousness continues to grow, a rising number of individuals are inclined to purchase green and low-carbon products despite their higher price points [
31]. Therefore, investment in sustainable supply chains not only protects the environment but also promotes market demand.
Existing studies have shown that green investment can bring numerous benefits to supply chain sustainability and performance. Chen et al. [
32] examined two types of green investment decisions in sustainable supply chains under equity concerns, where a manufacturer or retailer decides to invest in green product development. Similarly, Feng and Jin [
33] analyzed two innovation strategies: the implementation of innovation by the manufacturer or the e-retailer. However, investment in sustainable supply chains under different scenarios is not always beneficial to all participants in the supply chain. For example, Yu et al. [
34] found that the manufacturer’s investment in green technology does not always prevent the retailer’s encroachment on the store brand, which also depends on the competition effect and technology spillover effect of the two brands. Similar to our study, Xu and Duan [
35] also explored the impact of blockchain on green investment under a government subsidy mechanism, along with the optimal pricing method for green products. Unlike their study, we also consider the possible behavioral cognitive bias of supply chain members, i.e., the impact of overconfidence on green investment in the supply chain.
Current research on green investment in sustainable supply chains has rarely examined the impact of supply chain members’ cognitive biases. Cognitive bias is an important factor influencing the decisions of supply chain members [
21]. Therefore, in our study on green investment in sustainable supply chains, we also include the factor of overconfidence to analyze its impact on supply chain members’ green decision-making.
2.2. Blockchain in Supply Chain Management
The inherent features of blockchain technology, including its immutability, transparency, verifiability, and decentralization, have the potential to establish a robust and dependable transactional infrastructure for the supply chain [
36]. Additionally, it can trace the origin of products and combat fraudulent counterfeit products and behaviors [
37,
38,
39]. The existing blockchain-related research is predominantly concentrated on the technology and its implementation in supply chains. With its continuous improvement, blockchain has gradually expanded to other fields, such as shipping [
40,
41], medical [
42], agriculture [
43], food [
44], and so on. Among these applications, the development of a logistics supply chain has the best prospects. Zhang et al. [
45] studied the impact of blockchain-based digital transformation of the manufacturer, retailer, and third-party logistics service provider (3PL) in the cold chain supply chain to design ordering solutions for cold chain logistics.
In our study, we used blockchain in sustainable supply chains. Scholars are more interested in two areas of this topic. One of them is its role in combating counterfeiting, increasing supply chain transparency, and boosting consumer confidence [
46], and the other one is the impact of blockchain in reducing carbon emissions and improving the greening of products. In the first area, Cui et al. [
47] noted that investing in blockchain technology can improve supply chain transparency. Given this transparency, companies can design smart contracts that automate transactions based on disclosed information. Zhu et al. [
48] proposed that the traceability of blockchain technology can address counterfeiting and low-quality products, thereby improving consumer trust in brands. The adoption of blockchain also indirectly affects consumers’ purchasing decisions and, to some extent, motivates them to be more environmentally conscious. This is the first focus of our study. Therefore, we started our study from the perspective that blockchain can improve consumers’ green sensitivity.
In the second field, Wang et al. [
49] explored consumer preferences for remanufactured products under different blockchain adoption strategies. The results showed that by choosing an appropriate blockchain adoption strategy, the remanufacturing rate can be increased to improve the sustainability level of the supply chain. Xu et al. [
12] found that the adoption of blockchain technology by new energy vehicle manufacturer is more conducive to carbon reduction under the carbon tax policy. However, few scholars have considered the cognitive bias of decision-makers. Indeed, overconfidence can affect decision-making, not only in decisions about price and production but also in decisions about the adoption of new technologies. Since blockchain technology is currently one of the most effective tools for improving transparency in sustainable supply chains [
13], it is difficult to ignore the issue of motivation in the adoption of blockchain when studying the role of green investment and overconfidence. Therefore, our objective is to bridge the existing research gap by investigating how blockchain technology impacts the decisions of an overconfident manufacturer to invest in green products.
2.3. Overconfidence in Supply Chain Management
Overconfidence, a highly persistent, intense, and widespread cognitive bias, has garnered extensive research attention across numerous disciplines [
50]. In the field of psychology, overconfidence is often used to describe people who are often optimistic about their future and thus overconfident in their abilities without specific reason. Moore and Healy [
51] summarized overconfidence into three forms, namely, overestimation, overplacement, and overprecision, by reviewing the existing research results that proved the prevalence of overconfidence.
Major aspects of the findings on overconfidence that are closely related to our study include subject variability in overconfidence and the impact of overconfidence on business decisions and performance. The first aspect of this study shows that overconfidence can have different effects on different parties in the supply chain. Song et al. [
52] studied the optimal decisions and strategy preferences of a risk-averse supplier and an overconfident manufacturer. They found that under a push strategy, the manufacturer’s overconfidence can lead to better profits and higher order volumes. After examining how retailer overconfidence affects the manufacturer’s payment behavior, Lu et al. [
53] found that retailers in the resale model have more incentives to improve supply chain transparency. Liu et al. [
54] studied the impact of overconfident e-retailer on capital-constrained supply chains. However, there is an abundance of research on e-commerce platforms, i.e., retailer overconfidence, while there is a paucity of research on manufacturer overconfidence.
The results regarding the second area show that overconfidence produces different results in different situations, which also implies that overconfidence is not necessarily detrimental to the supply chain [
55]. For example, Li [
21] investigated the effect of overconfidence on the distribution channel, and the results show that overconfidence benefits, rather than harms, channel members and the entire supply channel, that is, overconfidence can mitigate the impact of double marginalization. Chen et al. [
56] indicated that overconfidence can hurt newspaper sellers’ profits, but it can also consistently increase the profits of well-calibrated newspaper sellers. Wang et al. [
57] highlighted that the overconfidence exhibited by the logistics service integrator regarding the influence of green innovation endeavors on-demand expansion positively affects both optimal decision-making and utility. Yan et al. [
58] found that the profit of the two-sided platform entrant is not monotone; rather, it increased first and then decreased with an increase in overconfidence, that is, an overestimation of consumers’ utility. However, the idea that overconfidence can affect supply chain decision-making is now widely accepted [
59], but the impact of overconfidence on green decision-making in sustainable supply chains is overlooked. Although Yu and Sun [
60] introduced overconfidence into the carbon emission reduction model and explored the impact of manufacturer’s overconfidence on carbon emission reduction decisions, they neglected the problems of low transparency and the crisis of consumer trust in green production.
Therefore, we introduce the cognitive bias of overconfidence into sustainable supply chains to explore the impact of manufacturer’s overconfidence on green supply chain decisions. At the same time, we consider the problem of information asymmetry and opacity in the green production process and introduce blockchain technology into the model. We further investigate the performance of blockchain technology in the sustainable supply chain with overconfident behavior.
2.4. Summary of the Literature Review
Section 2.1,
Section 2.2 and
Section 2.3 introduce and summarize green investment in sustainable supply chains, overconfidence in supply chain management, and blockchain technology in supply chain management, respectively. By analyzing the existing studies, we identify two shortcomings. First, overconfident behavior has been more widely studied in logistics supply chains. However, few studies have focused on how the phenomenon of overconfidence affects sustainable supply chains and sustainable supply chain investment decisions. Second, existing studies either examine blockchain and sustainable supply chain investment or overconfidence and sustainable supply chains. Few studies have explored all three in an integrated manner. Consequently, there is little research on how changes in the level of overconfidence affect the adoption of blockchain technology and how their interaction affects decision-making and efficiency in supply chains.
As shown in
Table 1, the above literature is summarized and categorized according to blockchain technology, overconfidence, green investment, and sustainable supply chains. The contribution of this paper is most significant in the following two aspects. First, we incorporate overconfidence into the study of green investment strategies in sustainable supply chains to analyze how the phenomenon of overconfidence affects the investment decisions of sustainable supply chain members. Second, we consider the input of blockchain technology in sustainable supply chains and further explore how blockchain technology affects the investment decisions of an overconfident manufacturer. In light of the above unique characteristics, the present work differs from previous studies.
3. Model
Previous studies have shown that the decision-makers’ overconfidence may have an impact on the final decision [
24,
53]. Moreover, overconfidence is common among decision-makers [
22]. In reality, upstream manufacturers are usually in a dominant position, and the retailer, as a follower, is usually responsible for performing operations and is less likely to show overconfidence [
61]. On the one hand, the dominant upstream manufacturer usually has control over product design and production and has in-depth knowledge of the raw materials, technology, and production processes [
8]. This dominance can lead to overconfidence in decision-making, with the manufacturer believing that their products and technologies can meet market demand and even set market trends. Downstream retailers are more concerned with consumer behavior, using sales data and customer feedback to adjust their inventory and marketing strategies. This closer-to-market role allows retailers to make more rational decisions based on actual sales and market changes [
62].
On the other hand, manufacturer that shows signs of overconfidence tend to be industry leaders with excellent performance and high brand prestige, which can contribute to overconfidence [
52]; for example, Tesla, Gree, and Microsoft have all engaged in “price wars” as a result (
https://baike.baidu.com/tashuo/browse/content?id=f5a54d4979cd36bdb9ec5424 [accessed on 18 December 2024],
https://mbd.baidu.com/newspage/data/dtlandingsuper?nid=dt_5566469318225464201 [accessed on 18 December 2024]). Early mobile phone giants like Nokia often overestimate market demand and sentiment (
https://tech.sina.com.cn/it/t/2002-01-25/100996.shtml [accessed on 22 November 2024]). Therefore, we analyze a supply chain comprising an upstream manufacturer characterized by overconfidence (referred to as “he”) and a downstream retailer who exhibits rational behavior (referred to as “she”). Therefore, in order to investigate the impact of this typical irrational behavior characteristic on decision-makers’ blockchain adoption decisions, we use the parameter
to measure the overconfidence level [
51]. Among them, the greater the value of
, the more the manufacturer mistakenly overestimates the importance of the green level to market demand. Since there is no fully rational decision-maker in reality,
.
as a measure of overconfidence is also found in the current market. Microsoft launched its Surface tablet computer in 2013 to compete with Apple’s iPad and Google’s Android tablets. In fact, Microsoft has maintained a degree of rationality while waging a price war. Microsoft has priced the Surface at the same level as the iPad but has added unique features and computing power. Finally, Microsoft has also received a good response from the market and gained more market share (
https://cio.zhiding.cn/cio/2013/0103/2138530.shtml [accessed on 18 December 2024]). By contrast, the decline of the mobile phone giant Nokia in the early years was precisely a case of overconfidence with a very high risk of failure. Nokia did not give a strong response to the new changes brought by Apple but also ignored the impact of the iPhone, where consumers generated higher demand. The system is increasingly old and gradually declining, thus generating less demand from consumers (
https://tech.sina.com.cn/roll/2020-08-17/doc-iivhvpwy1475783.shtml [accessed on 22 November 2024]). Realistic examples, such as the Microsoft “price war”, show that overconfidence on the part of a company or decision-maker is not always detrimental to itself, depending, to some extent, on the degree of overconfidence. At the same time, to improve supply chain transparency and consumer environmental awareness [
10], we examine two scenarios, i.e., with and without blockchain, when considering the adoption of blockchain technology in the context of manufacturer overconfidence.
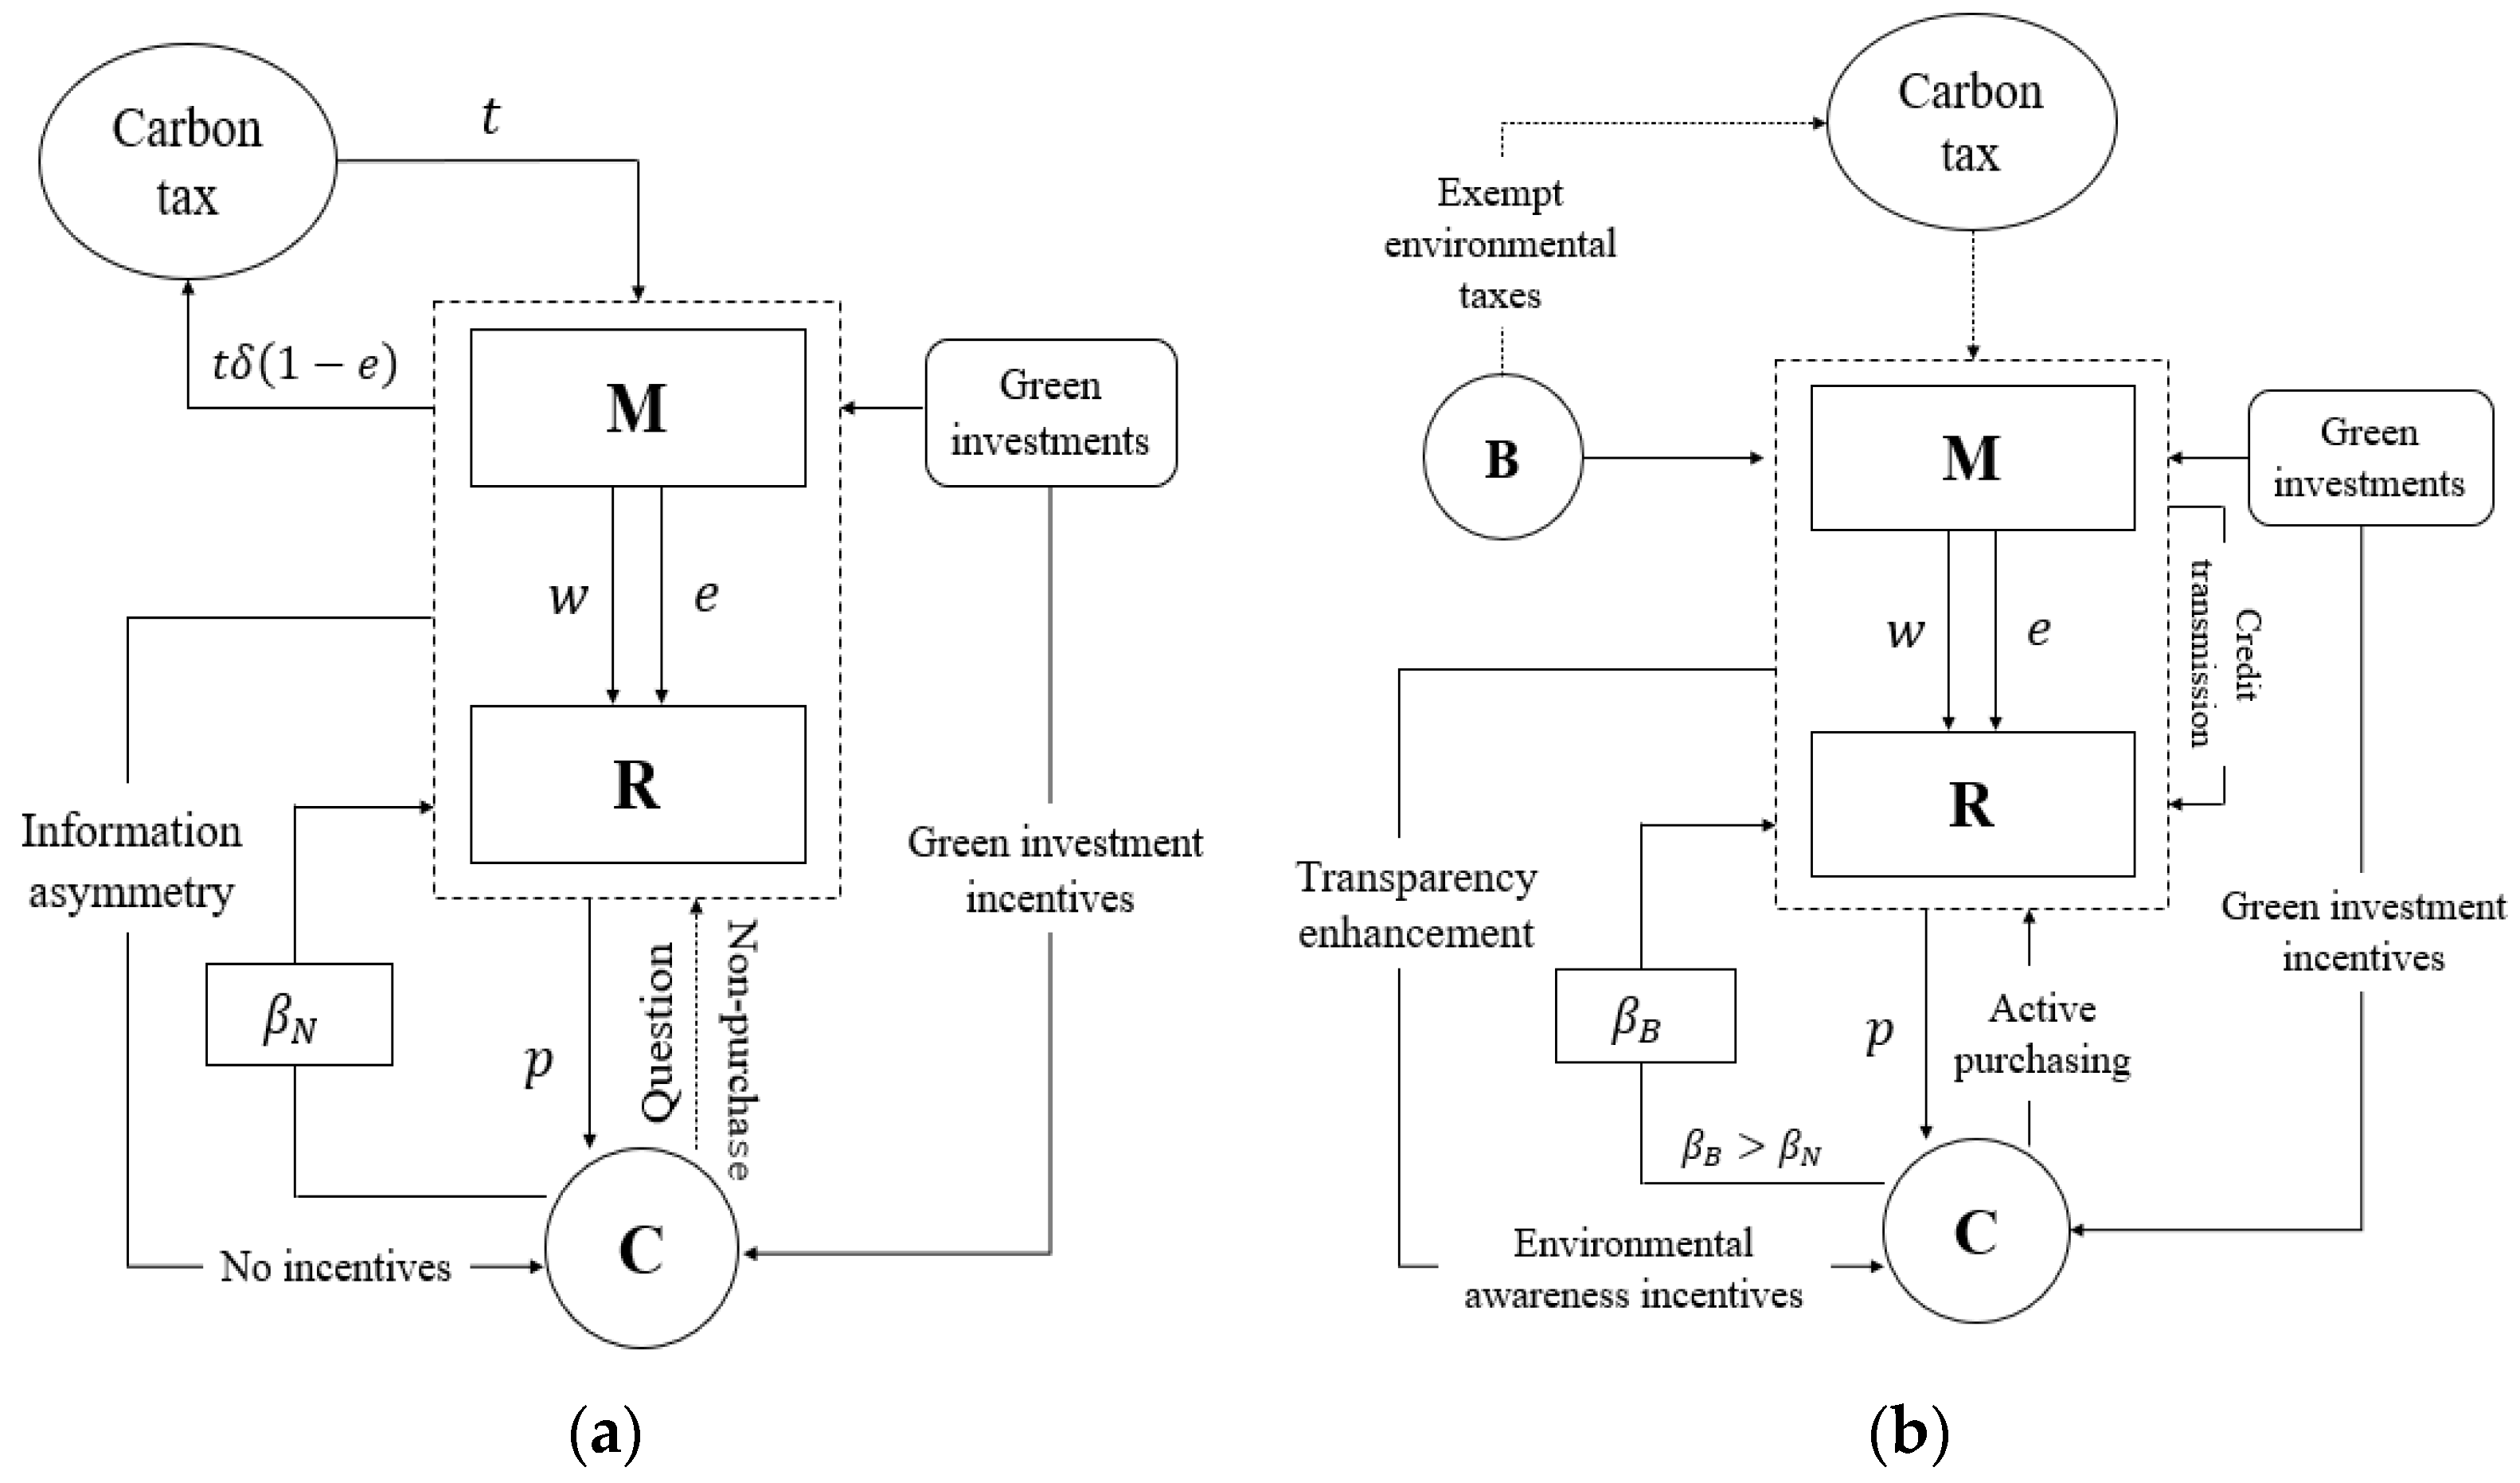
(1) Without blockchain (Scenario N): In this scenario, the manufacturer does not adopt blockchain, that is, there is no digital transformation of the supply chain. The production cost is made up of two main elements: a fixed cost linked to labor and material consumption and a tax levied in proportion to the quantity of emissions produced [
63]. The former part is usually fixed, which we assume to be zero. Then, we focus our attention on the costs associated with emissions. Let
be the emissions generated per unit of green product. It is understood that by investing in green technologies, he can mitigate carbon emissions during production, thereby enhancing the environmental credentials of his products. Therefore, the production of emissions per unit is denoted as
, where
is the green level. Following Hou et al. [
64], the investment cost is assumed to be
, where
is a positive scaling parameter reflecting the investment efficiency. Without blockchain, the manufacturer would have to pay a carbon tax
to the government, where
is the carbon tax rate corresponding to a unit of carbon emissions [
65]. Many developed countries have already implemented carbon tax policies, with Canada imposing an environmental tax in 2019 and announcing a carbon tax of
$80 per ton as of 2024 (
https://iigf.cufe.edu.cn/info/1019/1702.htm [accessed on 20 December 2024]). Simultaneously, it is essential to guarantee that the manufacturer possesses adequate motivation to produce a green product, necessitating that the tax rate remains reasonably low; so, we assume that
.
(2) With blockchain (Scenario B): The manufacturer integrates blockchain for the digital transformation of the sustainable supply chain. Following Xu et al. [
12], blockchain adoption can improve the consumers’ sensitivity to green products, i.e.,
, where
(
) represents the consumers’ green sensitivity coefficient. It reflects the degree of sensitivity and importance that consumers attach to green product attributes in their purchasing decisions. When consumers have high green sensitivity coefficients, they are more likely to choose products with environmentally friendly attributes, even though these products may be slightly more expensive [
66]. We postulate that the government will exempt manufacturer from environmental taxes to encourage them to adopt blockchain and digitize their supply chains [
14]. We presume that the carbon tax rate is set to 0 when blockchain technology is implemented. However, the cost of adopting blockchain is very high [
67]. Therefore, in this scenario, we need to fully consider the operational costs of blockchain and change the production costs of the green product from the carbon emission tax to the blockchain cost per unit
. To avoid the manufacturer having no incentive to adopt blockchain, we assume
. It is worth noting that the use of blockchain also generates emissions, represented as
. This is mainly due to its energy consumption during its operation (especially the large computational demand under the proof-of-work consensus mechanism), as well as the e-waste and energy consumption generated by the production, renewal, and disposal of hardware devices, which, together, lead to additional carbon emissions. To simplify the model, we refer to Feng et al. [
68,
69] and set the additional emission
generated by the adoption of blockchain technology to 0, which is envisaged in future extensions.
Both parties maximize their profits by adjusting decision variables; so, it is assumed that
. We add the subscript
to the notation to represent the equilibrium outcomes, where
(
) is used to indicate the scenario without blockchain and the scenario with blockchain. Meanwhile, the superscript
(
) represents the manufacturer, the retailer, and the entire supply chain, respectively.
Table 2 summarizes the major notations.
A comparative diagram of the supply chain structure before and after blockchain adoption is shown in
Figure 1.
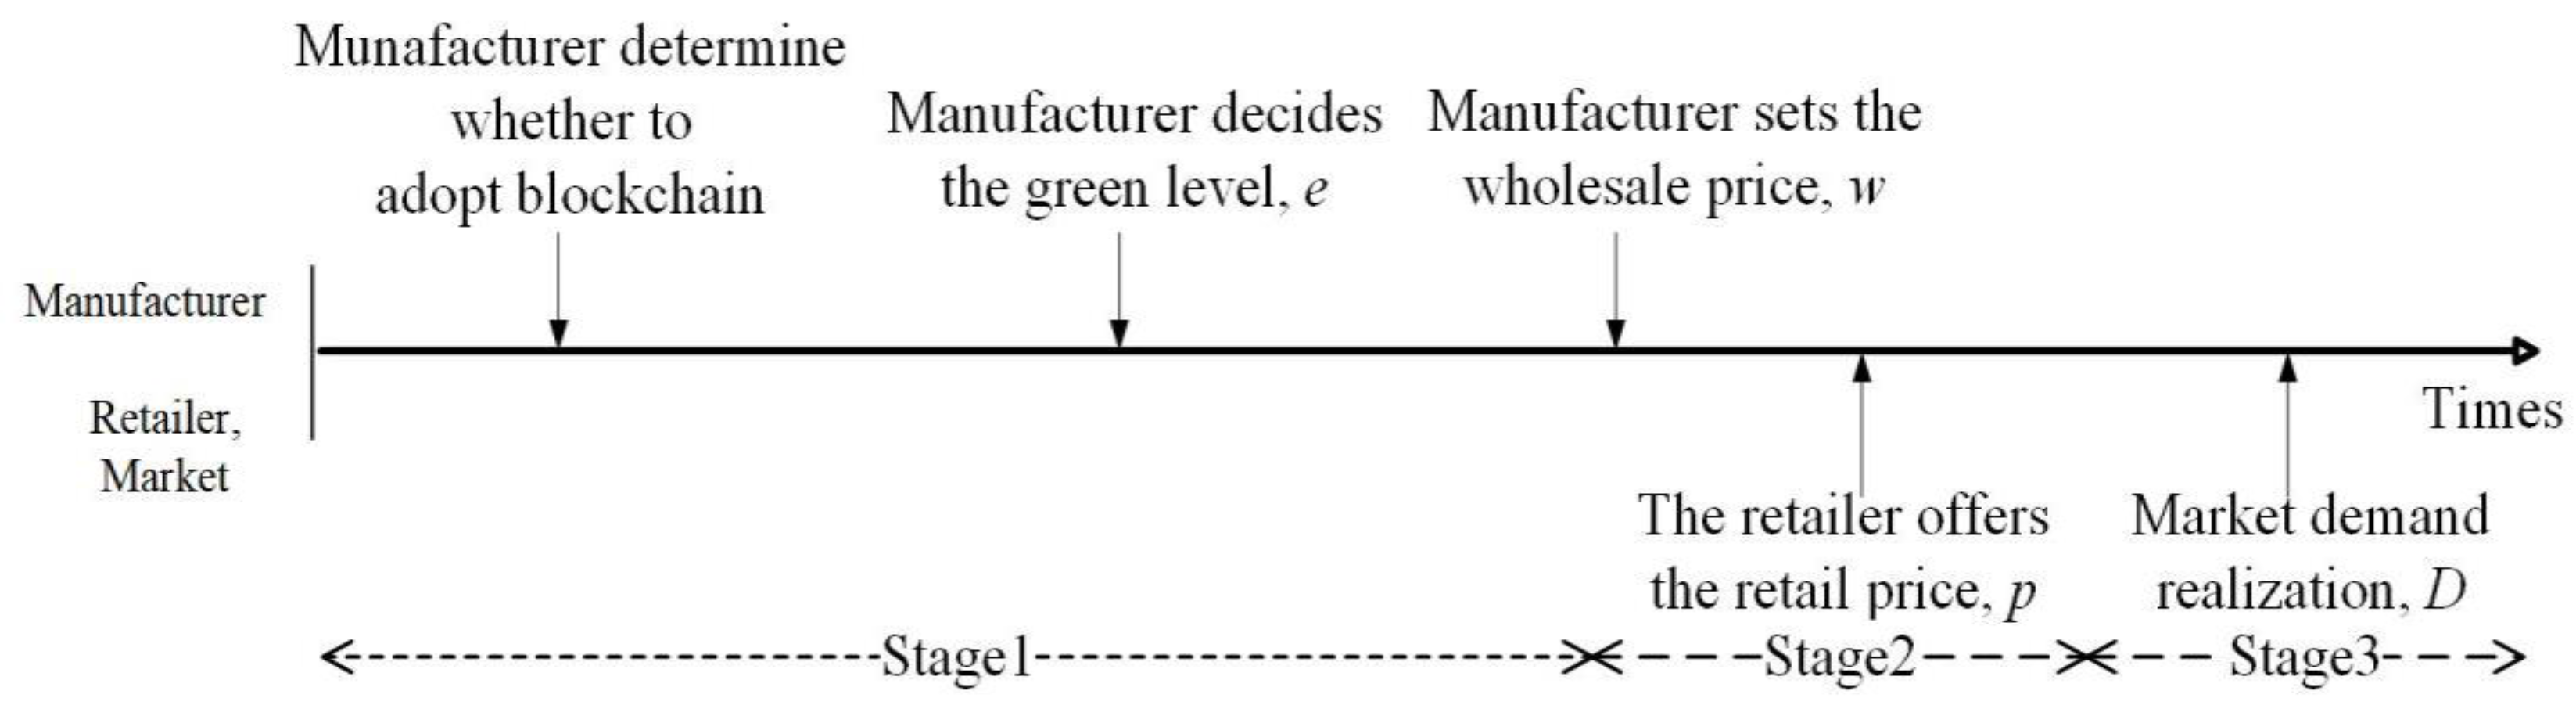
We divide the decision-making sequence of the event into three stages. In Stage 1, the manufacturer makes a decision regarding the adoption of blockchain technology and then determines
and
. In Stage 2, the retailer sets
p for the product to target the consumer market. In Stage 3, market demand is influenced by consumers who demonstrate a preference for environmentally friendly products. The entire sequence of events is visually depicted in
Figure 2.
4. Without Blockchain
In this section, we propose a benchmark model in which the manufacturer does not adopt blockchain, and we use the subscript “
N” to represent this scenario. The manufacturer mistakenly overestimates the importance of the green level to demand functions, which constitutes a specific manifestation of overconfidence. In addition, his overconfidence does not spill over to the retailer [
24]. Therefore, the observed market demand of the retailer is also the demand function truly reflected by the market, that is,
. Referring to the existing methods of overconfidence for the decision-maker [
70,
71], the market demand for the overconfident manufacturer is
. The specific calculation formulas are as follows:
In this context, represents the green product’s retail price, set solely by the retailer. a represents the initial market size, is the coefficient for the price, is the coefficient for the green level without blockchain, and is the overconfidence level, where . When λ = 1, the manufacturer is completely overconfident.
The primary objective of supply chain parties is to maximize their respective profits through optimal pricing strategies. Their profit formulations are outlined as follows:
To ensure that the Hessian matrix is negative definite, we assume that . We employ backward induction to derive the equilibrium results, as outlined in Lemma 1.
Lemma 1. Without blockchain, we obtain the following:where . To ensure that is positive, we assume that . Based on the above results, we obtain the following proposition.
Proposition 1. Without blockchain, the effects of the overconfidence level () and coefficient of green investment cost () on decision variables are as follows:
- (1)
, , .
- (2)
, , .
Proposition 1(1) indicates that overconfidence on the part of the manufacturer results in a mistaken belief in a more pronounced association between the product’s green attributes and market demand than what actually exists. Consequently, this misperception encourages the manufacturer to enhance the product green level, resulting in increased production costs and subsequent wholesale price hikes. Inevitably, the retailer responds by raising the retail price accordingly.
Proposition 1(2) shows that as the green investment cost coefficient increases, the cost borne by the manufacturer gradually increases, which forces the manufacturer to reduce the product green level to avoid excessive expenditure. At this time, the number of consumers who are sensitive to the product green level will decrease; so, the manufacturer can only retain consumers by reducing the wholesale price, which leads to a low retail price.
In reality, green manufacturing companies should balance green investment with cost control to avoid blind investment due to overconfidence. He should ensure that the green level of his products is improved while maintaining a reasonable market price to retain consumer goodwill. To maintain consumer loyalty in the face of rising green investment costs, rather than fighting a one-upmanship battle, upstream and downstream companies need to harmonize their pricing strategies and moderately reduce wholesale and retail prices.
By inserting the findings from Lemma 1 into Equations (3)–(5), we can derive the optimal profit values for each of the participants in the supply chain and for all the participants in a non-blockchain environment.
Lemma 2. Without blockchain, we obtain the following:where . Proposition 2. Without blockchain, we obtain the following:
- (1)
The profit of the manufacturer increases as the level of overconfidence increases, that is,
- (2)
For the profit of the retailer, we obtain the following:
- (i)
If the coefficient of investment cost is low (); then,
- (ii)
If the coefficient of investment cost is high (); then,
Proposition 2(1) points out that the manufacturer’s overconfidence can be advantageous to his own profits. According to Proposition 1(1), it is evident that the green level progressively escalates with the manufacturer’s degree of overconfidence, leading to an augmentation in market demand for green products. Simultaneously, the level of overconfidence correlates with an upward trend in wholesale prices. Consequently, the manufacturer’s profit has the potential to increase commensurately with his level of overconfidence.
Proposition 2(2) illustrates that to solve the problem of the manufacturer’s overconfidence, the retailer will suffer financial losses under certain circumstances. When the green investment cost coefficient is at a low level (), the retailer can profit from it. This is due to overconfidence increasing the green level of the product, which increases the market demand, and at the same time, the retail price increases, thus increasing profits gained by the retailer. However, if the investment cost coefficient is kept at a high level (), the manufacturer needs to set a high wholesale price to offset the negative impact of the high investment, thus creating a high wholesale price. Even if the green level of the product is increased, the retail price at this time is far higher than the expected price that green preference consumers can accept, which ultimately leads to a decline in market demand and a decrease in the retailer’s profit.
Next, we examine consumer surplus (CS) and social welfare (SW) in a non-blockchain setting. CS is shaped by the price and demand for green products. CS and SW can be expressed in the following way:
Since the retailer is rational, her demand is the real market demand. Therefore, is obtained by substituting each of the optimal decision values in Lemma 1 into Equation (2). Then, the obtained demand result is substituted into Equations (6) and (7) to obtain CS and SW.
Lemma 3. Without blockchain, we obtain the following:where . 5. With Blockchain
This section discusses the scenario in which the manufacturer adopts blockchain, and we represent this scenario with the subscript “
B”. As described in
Section 3, the adoption of blockchain can not only increase the transparency of supply chain operations but also incentivize carbon reduction decisions and reduce taxes to affect the performance of sustainable supply chains. Therefore, blockchain adoption can improve the consumers’ green sensitivity coefficient, that is,
. We reformulate the actualized demand within a blockchain framework as follows:
Following Choi and Luo [
11,
14], we assume a zero-emission tax rate in the profit function upon blockchain implementation. However, blockchain adoption requires high fixed costs and variable operational costs. Fixed costs are fees for building and implementing a platform based on blockchain technology, and operational costs depend on the volume of blockchain activity and transaction dimensions. Assume that
is the fixed cost and
is the unit operating cost of the blockchain. Since this paper focuses on the production of green products, we assume
F = 0 and discuss the impact of the blockchain operational cost related to production on the supply chain. To prevent a scenario where the manufacturer lacks the motivation to implement blockchain, we assume that
. Therefore, we revise the profit functions based on the benchmark model as follows:
To ensure that the Hessian matrix is negative definite, we assume that .
Lemma 4. With blockchain, we obtain the following: Proposition 3. With blockchain, the effects of the overconfidence level () and coefficient of green investment cost () on decision variables are as follows:
- (1)
, , .
- (2)
, , .
Proposition 3(1) suggests that with blockchain, due to the exemption of carbon emission tax for the manufacturer and the improvement in consumers’ green sensitivity, the overconfident manufacturer will choose to increase market demand by significantly improving the product green level. To reduce the cost burden of adopting blockchain, the manufacturer will also increase the wholesale price. In this case, the retailer will increase the retail price along with the manufacturer to maximize her profit.
Proposition 3(2) and Proposition 1(2) are similar in that the green level, the wholesale price, and the retail price of the product still decrease with an increase in the green investment cost coefficient. This is because the high blockchain operational cost, coupled with the increasing green investment cost, will lead the manufacturer to appropriately reduce the product green level to avoid excessive spending. However, at the same time, blockchain adoption improves the consumers’ green sensitivity coefficient (that is, ); then, the consumers’ market demand for the product will be significantly reduced. The manufacturer retains consumers by lowering the wholesale price, and the retailer lowers the retail price as a result.
This conclusion prompts companies to pay more attention to the trade-off between consumers’ green demand and their own green investments and technology adoption. Even with the introduction of blockchain technology, which consumers prefer, consumer demand does not necessarily increase. The rationality of green investment becomes important at this point. If the level of green investment is too high and less efficient, it may lead to a lower level of product greenness, thus affecting market competitiveness and consumer acceptance of the product.
By substituting the results of Lemma 4 into Equations (10)–(12), we obtain the optimal profits of the manufacturer, the retailer, and the entire supply chain under the optimal decision in this scenario.
Lemma 5. With blockchain, we obtain the following: Proposition 4. With blockchain, we obtain the following:
- (1)
The profit of the manufacturer increases as the level of overconfidence increases, that is, .
- (2)
For the profit of the retailer, we obtain the following:
- (i)
If , ; then, ;
- (ii)
If , . Then, when , . When , ;
- (iii)
If , . Then, when , . When , . Here, , , and are specified in Appendix A.
Proposition 4(1) indicates that there are benefits for the overconfident manufacturer in adopting blockchain. This is because blockchain adoption will increase the consumers’ green sensitivity coefficient; so, the green level increases with overconfidence, coupled with an increase in the wholesale price. Therefore, the manufacturer can make more profit. However, when , blockchain adoption will result in negative profit for manufacturer. This is primarily attributed to the substantial costs associated with raising the green level and adopting blockchain, which may be overly burdensome for the manufacturer. Therefore, in reality, green manufacturer should not blindly follow the trend of blockchain adoption. First, he should see if he has overestimated the market demand and consider the rationality of his decision. Second, he should see if the cost of his blockchain adoption exceeds the upper limit of what he can accept and tolerate.
Proposition 4(2) shows that the retailer’s profit change is influenced by both the overconfidence level and the coefficient of green investment cost. Interestingly, when , the retailer’s profit is not affected by the cost factor of green investment. Regardless of whether the overconfidence is at a low level () or a high level (), the retailer can obtain a high profit only when the coefficient of green investment cost is low ( or ). This occurs because, as indicated by Proposition 3(1), both the green level and the retail price increase with the overconfidence level. Subsequently, with the adoption of blockchain, market demand experiences a substantial rise, leading to higher profits for the retailer. Conversely, when the coefficient of green investment cost is high ( or ), the manufacturer’s overconfident behavior is detrimental to the retailer. From Proposition 3(1), it can be seen that when the manufacturer constantly overestimates the impact of the product green level on product demand, he will choose to increase the cost input to improve the product green level. Therefore, the retail price exceeds consumers’ price expectations for the green product, which will reduce market demand and ultimately result in losses for the retailer.
Next, we calculate CS and SW to further test the benefits of blockchain adoption to society. From Lemma 4, we find that market demand is .
Then, market demand is substituted into Equations (13) and (14) to obtain CS and SW with blockchain adoption.
Lemma 6. With blockchain, we obtain the following: 6. Comparison and Analysis
Based on the equilibrium results in
Section 4 and
Section 5, we compare the performance in terms of the green level, profit, CS, and SW without blockchain and with blockchain, as follows.
Proposition 5. If
, then,
when
.
We use to denote the blockchain-driven increment in consumers’ green sensitivity coefficient (hereafter referred to as increment in sensitivity). As shown previously, blockchain adoption increases the consumers’ green sensitivity coefficient, that is, . Since the manufacturer excessively overestimates the impact of the green level of his product on the market demand, when the increment in sensitivity is significant (), that is, the consumer’s sensitivity to the product green level is greatly improved, the manufacturer will increase the product green level to obtain more demand and profit. There is also a maximum blockchain operational cost that the manufacturer can accept (). When the actual blockchain operational cost exceeds the threshold, the manufacturer will reduce costs by reducing the product green level, thereby reducing the negative impact of blockchain adoption.
Proposition 6. For the manufacturer,
is obtained: (i) with an overconfident manufacturer, the manufacturer is likely to use blockchain only if
; and (ii)
increases with
and
.
Proposition 6 mainly explores the motivations and influencing factors of the manufacturer choosing to adopt blockchain. Part (i) of Proposition 6 shows that there is a threshold of the blockchain operational cost that the manufacturer can accept (), and when the actual blockchain operational cost is lower than this threshold, the manufacturer will be incentivized to adopt blockchain technology because this behavior can increase his profit. Conversely, it is not conducive to blockchain adoption by the manufacturer. This conclusion is also in line with the actual situation.
Interestingly, Proposition 6(ii) demonstrates that the likelihood of the manufacturer embracing blockchain increases when either the carbon tax rate () is elevated or there is a notable increment in the blockchain-driven green sensitivity coefficient among consumers (). Adopting blockchain can not only avoid carbon taxes but also enhance consumer sensitivity to the green level. Companies should first monitor the volatility of the carbon tax market and, second, pay attention to changes in consumers’ green sensitivity in the market. Adopting blockchain will only be more beneficial for them if both the carbon tax and consumers’ green sensitivity increase. In practice, the government also encourages manufacturers to adopt blockchain by continuously increasing the carbon tax rate or by promoting green products to enhance consumers’ green sensitivity.
Proposition 7. For the retailer,
is obtained: when
, if the manufacturer is motivated to use blockchain technology, then the retailer can always make more profit from it. Otherwise, the retailer can make more profit from it only if
, that is,
.
Proposition 7 shows that if the manufacturer has a moderate level of overconfidence (), the threshold for blockchain operational cost that the retailer is willing to bear exceeds that of the manufacturer’s tolerable limit, i.e., , then the retailer will always make profits if the manufacturer has an incentive to adopt blockchain, i.e., . Lower levels of overconfidence among the manufacturer mean that he can more objectively and rationally assess his capability and the market environment when formulating pricing strategies, adopting blockchain technology, and dealing with retailer, thus reducing uncertainty in decision-making. Blockchain’s immutability and real-time information sharing enhance the accuracy and traceability of information, which can reduce the retailer’s risks and costs, and at the same time, they can increase the appeal to green consumers, from which the retailer can make more profits. Therefore, it is reasonable and beneficial for retailer to be more receptive to blockchain adoption than manufacturer. Combined with Proposition 6, our findings reveal that, when the manufacturer exhibits a moderate level of overconfidence, the retailer can leverage increased advertising efforts to amplify the blockchain-induced enhancement in the consumers’ green sensitivity coefficient. Consequently, this raises the manufacturer’s tolerable limit for blockchain operational costs. This strategy not only serves as a catalyst for the manufacturer to embrace blockchain but also positions the retailer to reap substantial profits from its adoption. Otherwise, the retailer can only achieve a higher profit if the blockchain operational cost is lower than the maximum blockchain operational cost.
7. Impact of Blockchain Adoption
For a more intuitive comparison, we use numerical simulations to discuss how the adoption of blockchain technology influences supply chain investment decisions with overconfidence. According to Lu et al. [
53] and Wang et al. [
57], the basic parameters of the numerical simulation are set as
,
,
,
, and
.
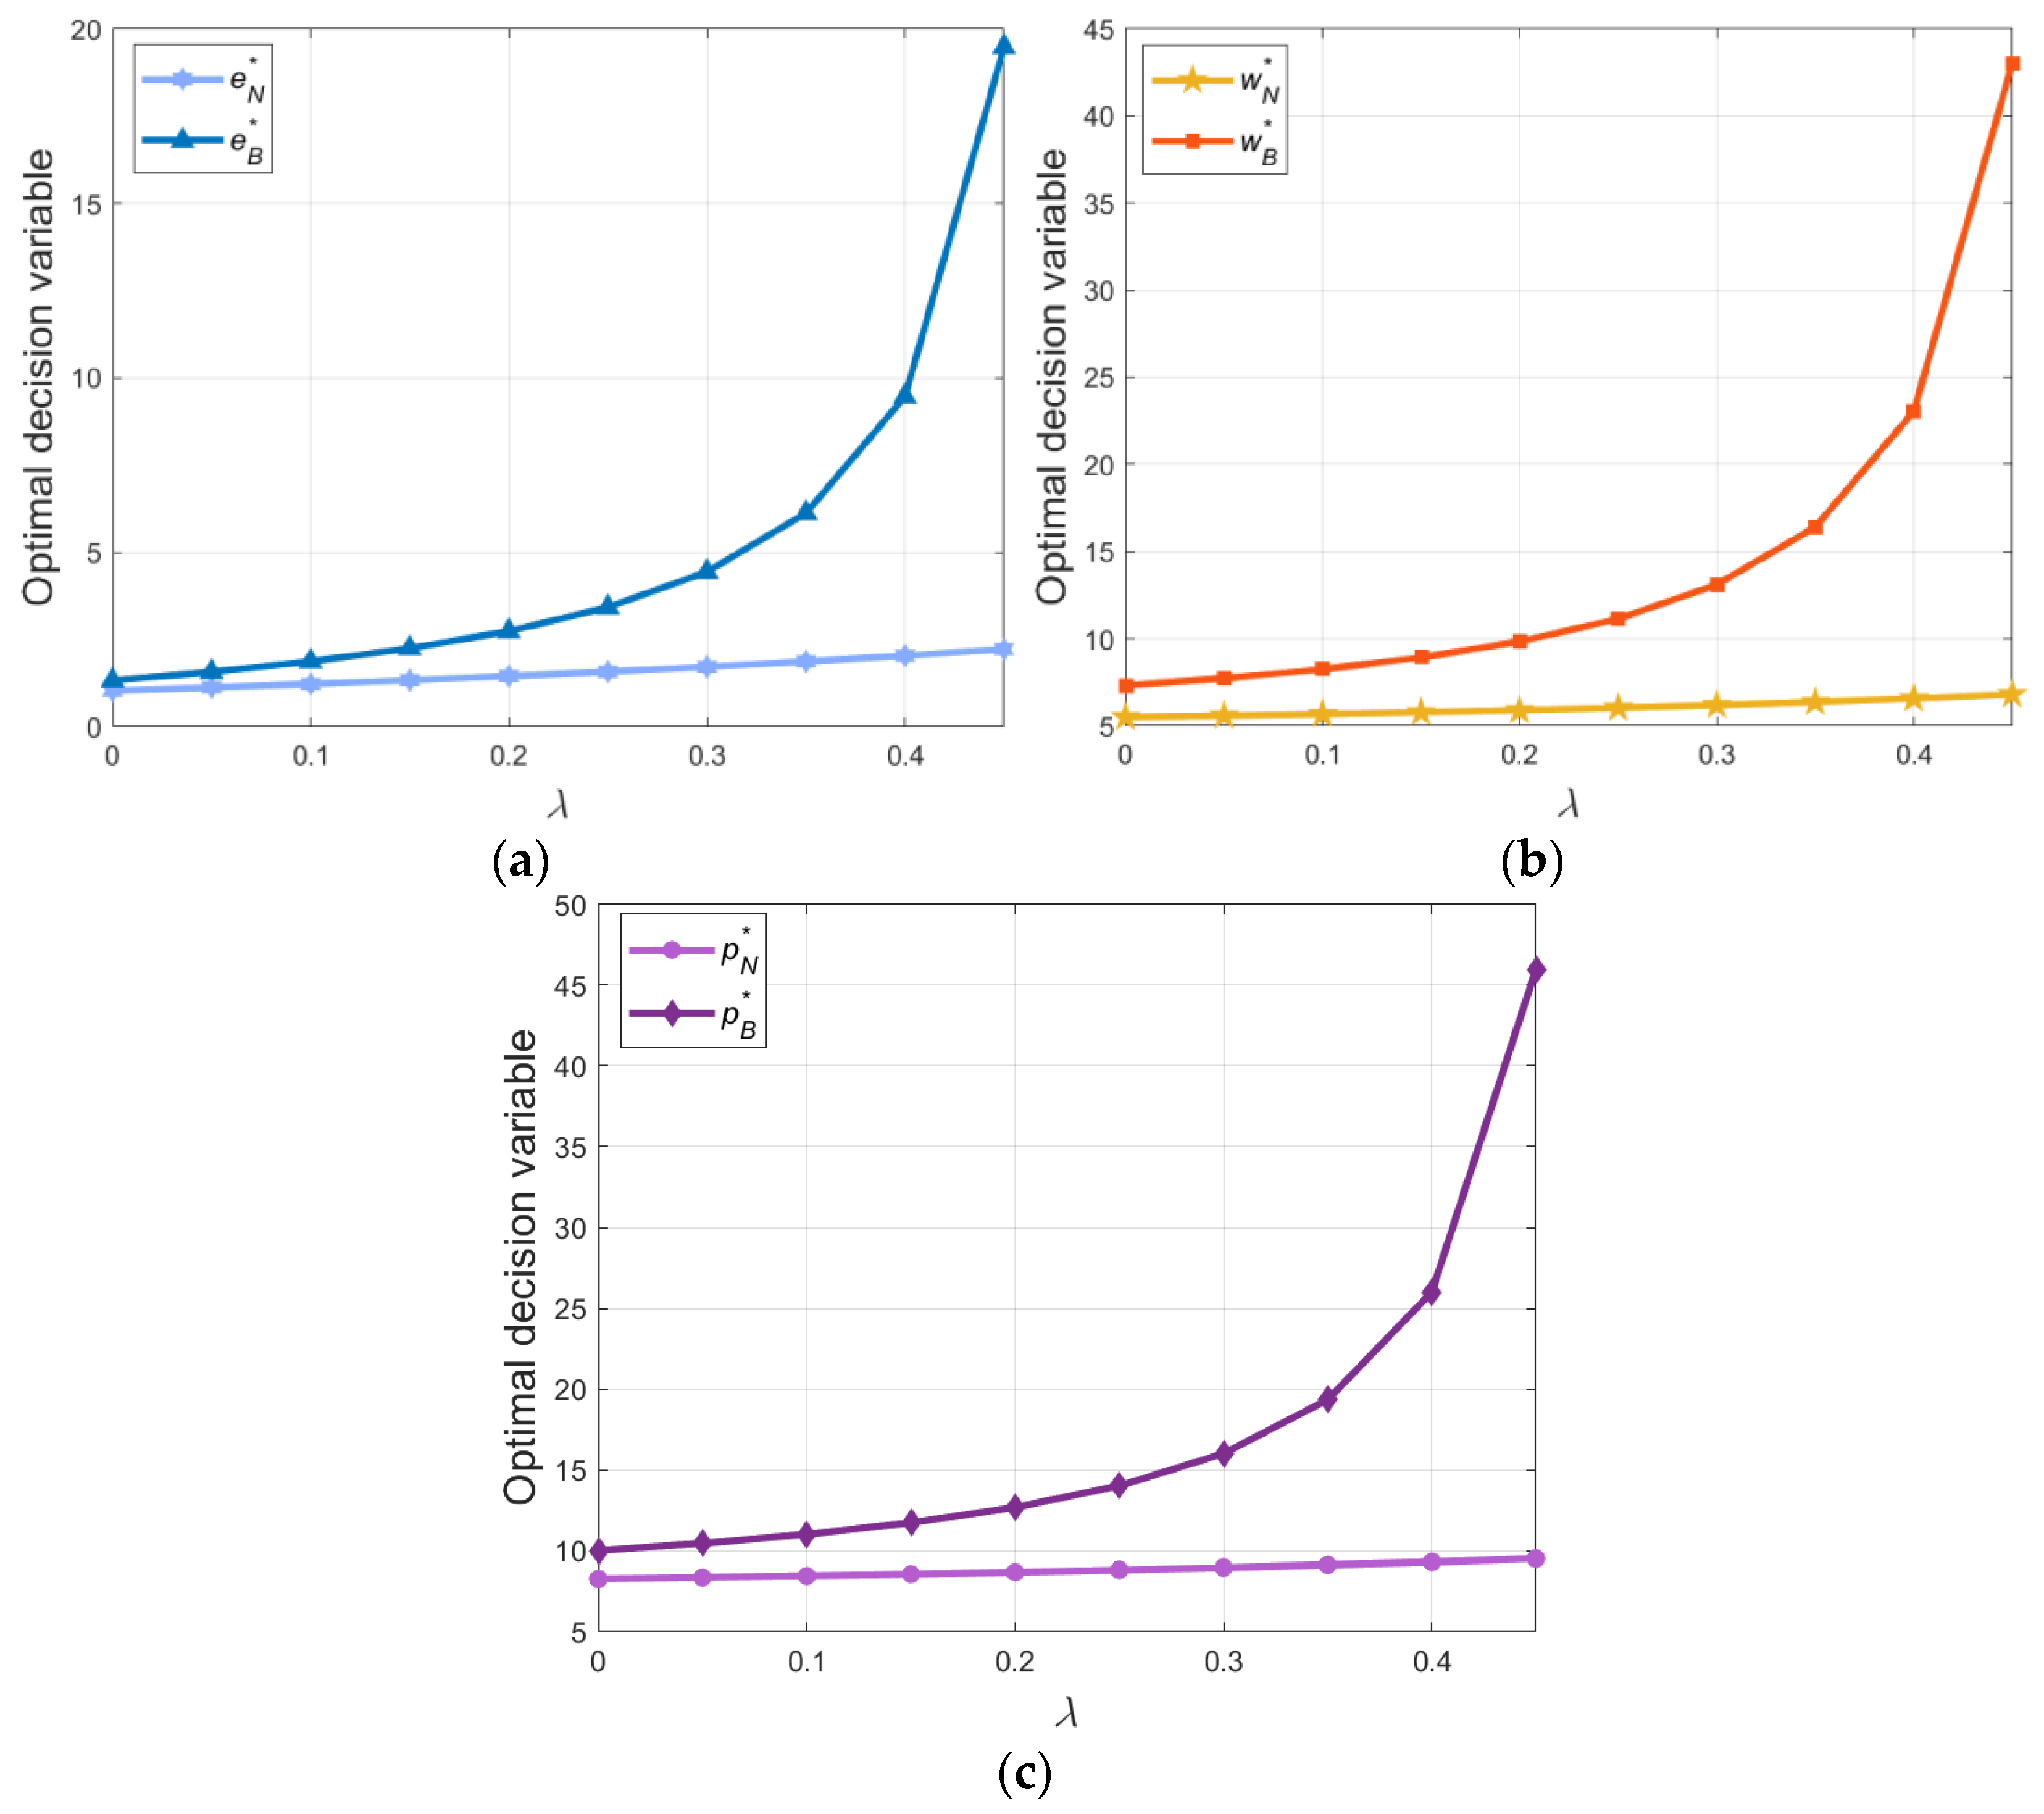
7.1. Impact of Blockchain Adoption on the Optimal Decision Variables
In this section, we discuss the influence of adopting blockchain on the decision variables. Since the introduction of blockchain increases consumer sensitivity to green products (
), we assume
. The overconfidence level is constrained to a certain extent:
. To satisfy the negative definite requirement of the Hessian matrix for both models simultaneously, we assume
. For the convenience of the calculation, we set
. The analysis is carried out within the above range, and numerical results are shown in
Figure 3.
From
Figure 3, we can observe that the adoption of blockchain technology stimulates adjustments to the decision variables, i.e., the product green level, the wholesale price, and the retail price, whereas without adopting blockchain, the overconfident behavior of the manufacturer has a minor impact on these decision variables. As the level of overconfidence increases appropriately, the impact on the three decision variables continues to grow. Then, comparing the decision variables without and with blockchain technology, we can see that the values of the decision variables with blockchain are higher than those without blockchain. Therefore, encouraging the manufacturer to adopt blockchain technology can effectively enhance the green level of products, which is possible due to the increasing number of consumers who are more sensitive towards green products. As a result, adopting blockchain can assist enterprises in generating new market opportunities, enhancing their competitiveness, and advancing the sustainable supply chain’s development objectives.
In order to compare the impact of the green investment cost coefficient on the decision variables with and without blockchain, the numerical simulation values remain the same as above. To ensure that each decision variable is positive, we set
. The result is shown in
Figure 4.
We can see from the trend in
Figure 4 that when the green investment cost coefficient increases within a low range, blockchain adoption makes the wholesale price and retail price more sensitive. This implies that when the manufacturer adopts blockchain technology, it can not only improve the green level of the product but also significantly increase the wholesale price and the retail price by appropriately reducing the cost of green investment, thus benefiting both members of the supply chain. However, with the increasing green investment cost coefficient, its ability to adjust the three decision variables gradually becomes constant.
From the changing trend shown in
Figure 4, we observe that blockchain adoption can increase the three decision variables. This can be attributed to two main reasons. First, the adoption of blockchain will increase operational costs; so, in order to mitigate the negative impact of operational costs, the wholesale price and the retail price need to be higher than without blockchain adoption. Second, the adoption of blockchain allows the government to exempt enterprises from environmental taxes and enhances the sensitivity of consumers to the green level of products (that is,
). As a result, the consumer demand for green products will increase, and the manufacturer will choose to set a higher product green level to obtain a higher profit.
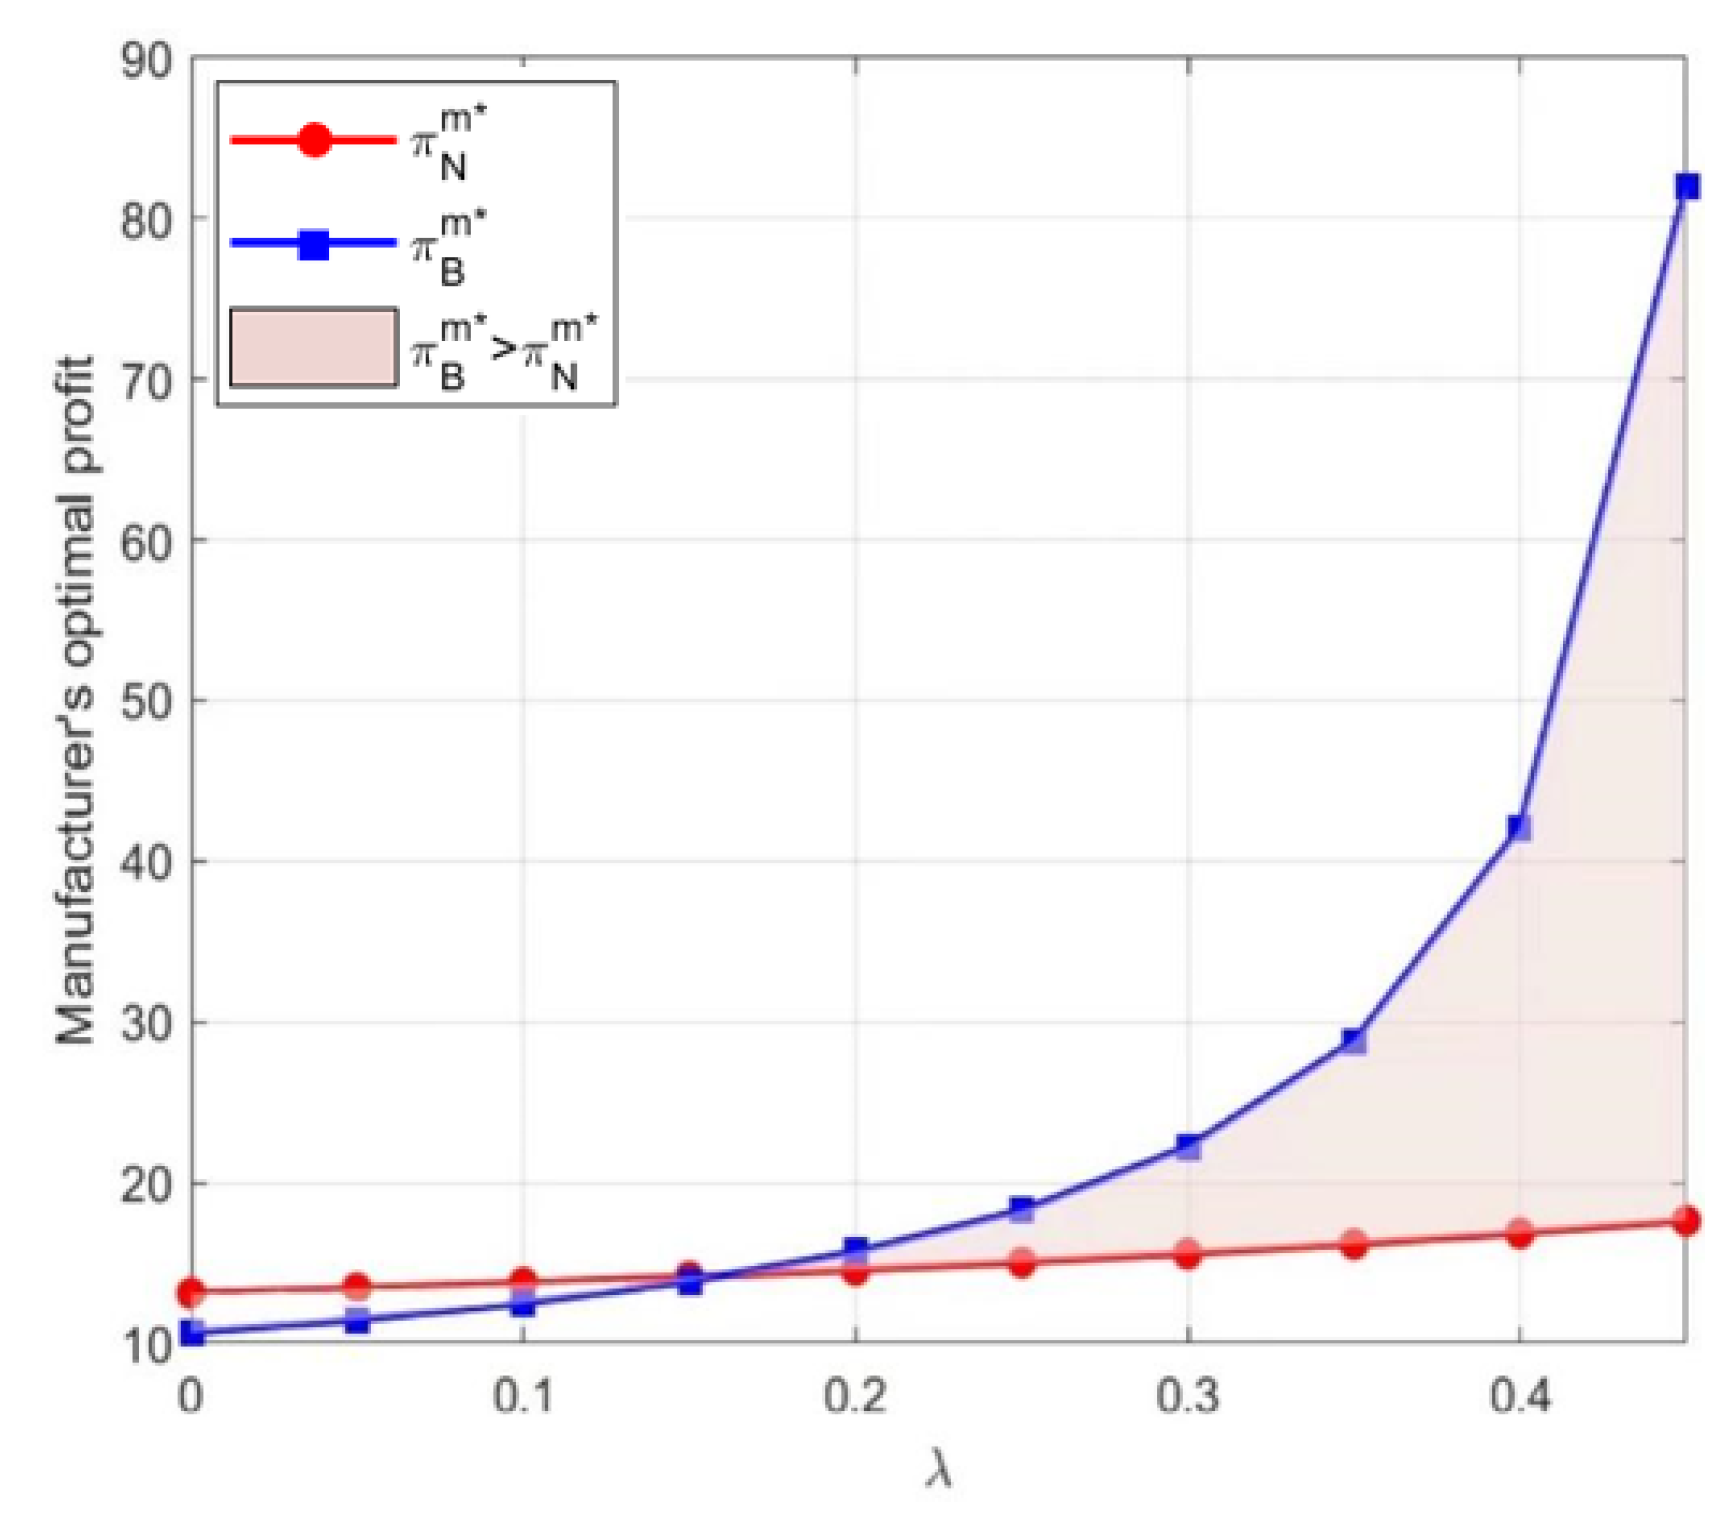
7.2. Impact of Blockchain Adoption on Sustainable Supply Chain Member’s Payoffs
To make sure that the profit of the manufacturer is greater than 0,
. Once more, we assume
, and the result is shown in
Figure 5.
By looking at the results of the numerical simulation shown in
Figure 5, we know that with blockchain, the manufacturer’s profit will grow faster as the level of overconfidence increases. This demonstrates how the choice to use blockchain technology can significantly help the manufacturer to make the decision to improve profit when he exhibits a certain overconfidence level. Moreover, we can see that as the level of overconfidence continues to increase and a certain threshold is exceeded, blockchain adoption can enable the manufacturer to achieve a high profit. The higher the level of overconfidence, the greater the difference in profit resulting from blockchain adoption. Combined with Proposition 3, we may conclude that the reason is that an overconfident manufacturer will invest in the product green level in an effort to boost sales and, thus, enhance its profit in a supply chain that deals with environmentally conscious consumers.
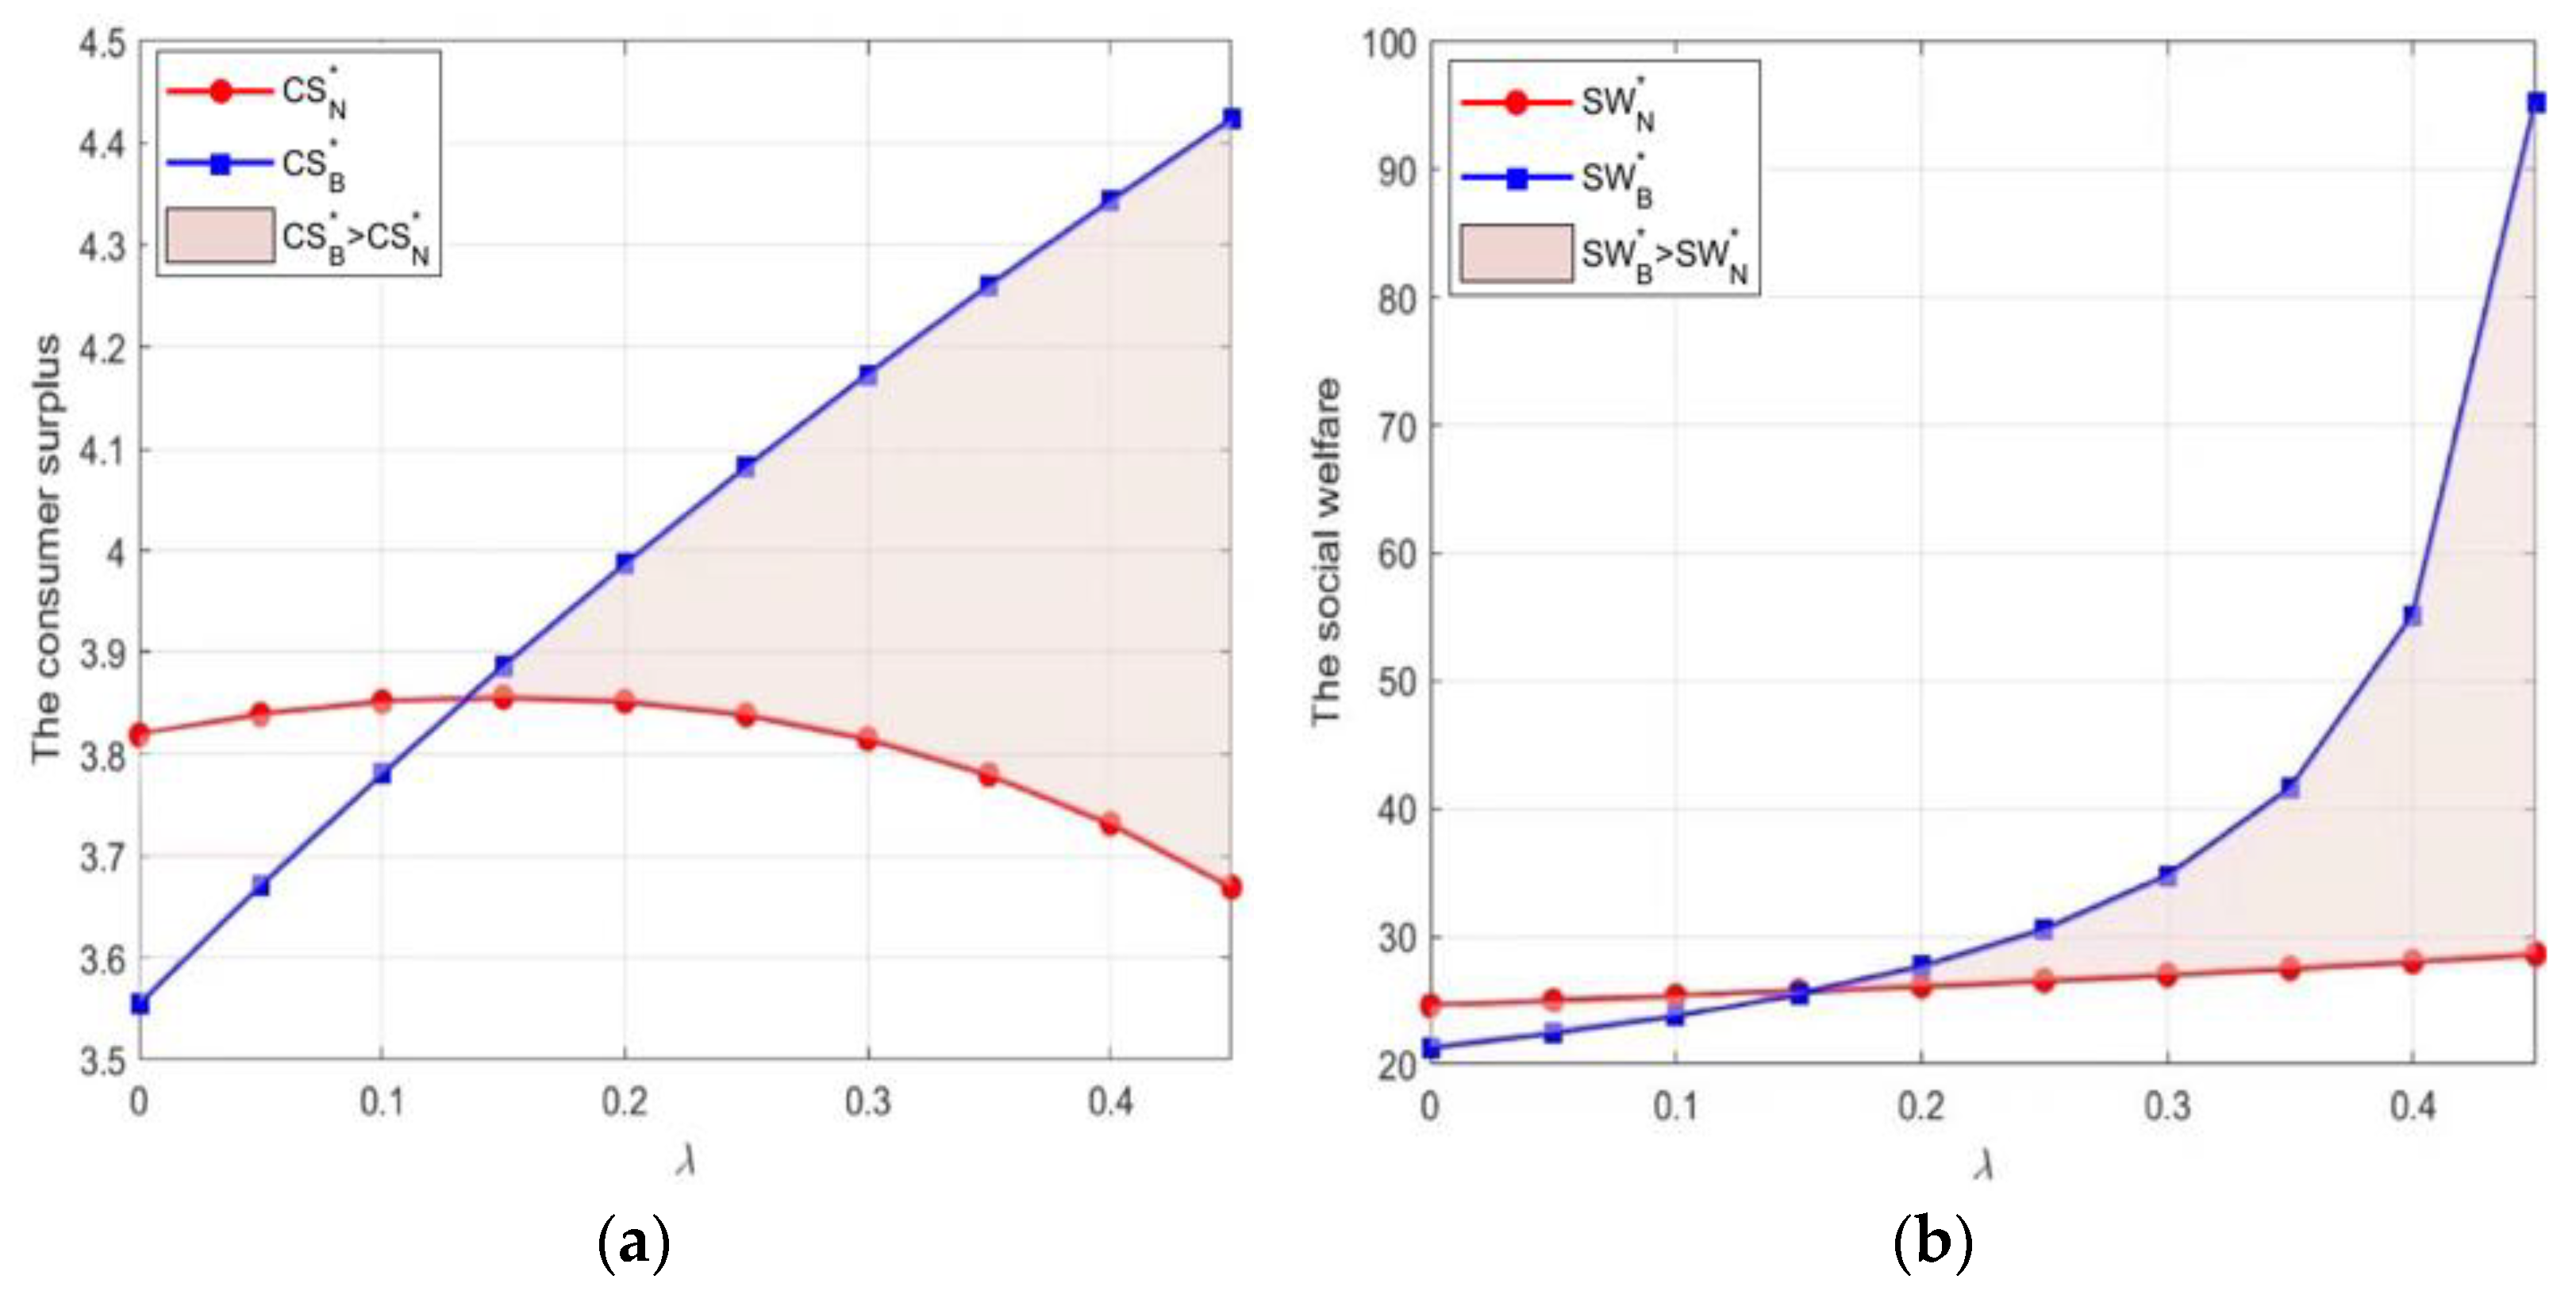
7.3. Impact of Blockchain Adoption on Consumer Surplus and Social Welfare
In this section, our aim is to investigate the advantages to the general public stemming from optimal decision-making and overconfident behavior when blockchain technology is employed. In order to ensure that the value of social welfare is positive, we set
and
. The results are shown in
Figure 6.
The results show that when the manufacturer is a rational decision-maker (), even without introducing blockchain technology, his optimal decision regarding the sustainable supply chain will bring slightly larger CS and SW than when the technology is adopted. However, when the manufacturer is not rational, that is, he demonstrates a certain degree of overconfidence, as the degree of overconfidence increases, the CS and SW brought by the introduction of blockchain technology will gradually exceed the value of the scenario when blockchain technology is not adopted, and the difference between the two will continue to increase with an increase in the manufacturer’s overconfidence level.
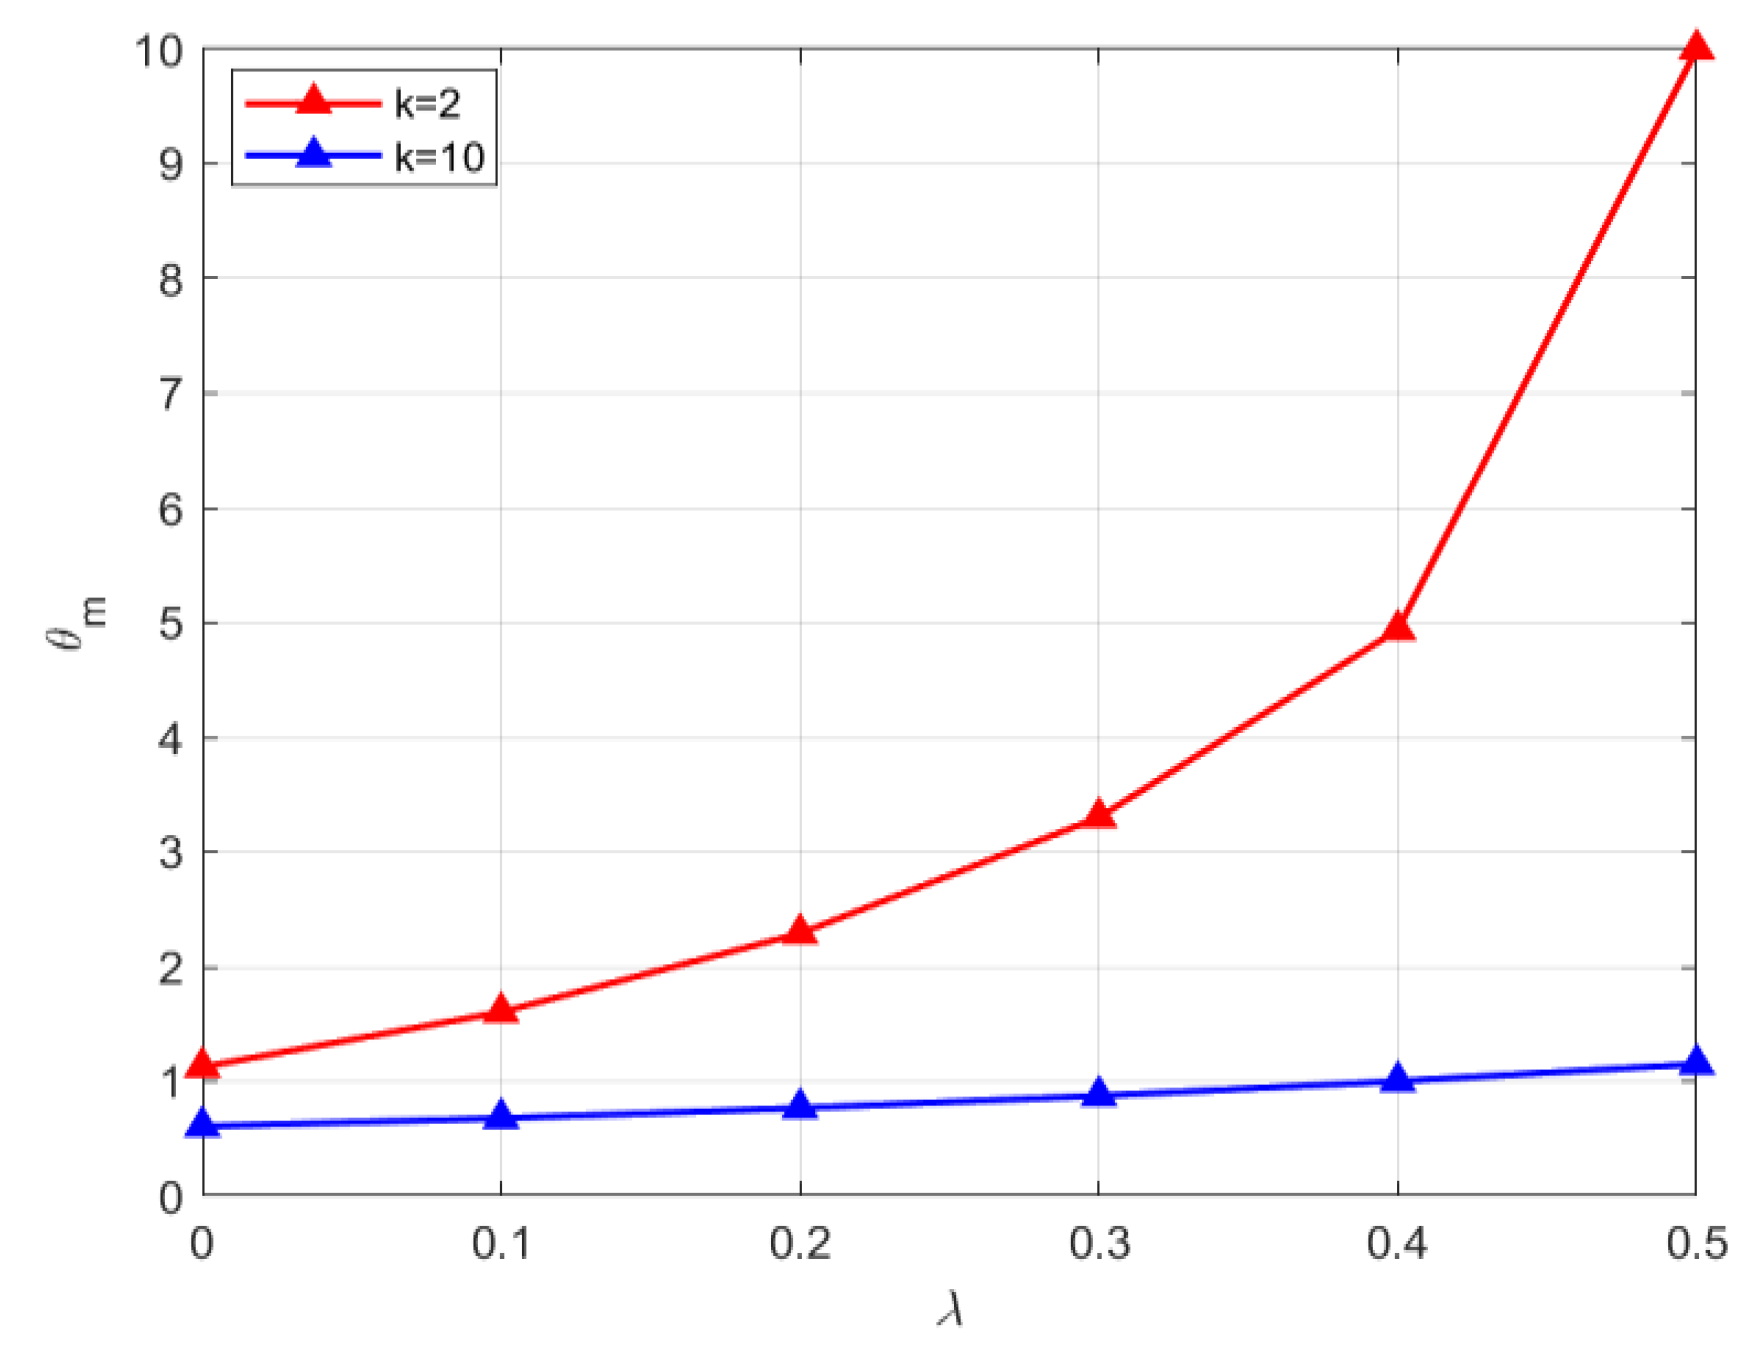
7.4. Interactive Impact of Overconfidence and Blockchain Technology
Proposition 6 posits that the motivation for the manufacturer to embrace blockchain hinges on the threshold of blockchain operational cost. There exists a threshold (
) for the maximum blockchain operational cost, and when the actual blockchain operational cost falls below this threshold, the manufacturer will be motivated to adopt blockchain. To examine how overconfident behavior influences the manufacturer’s inclination towards adopting blockchain, we carry out the constraint
and divide the green investment cost coefficient into a scenario with a high value (e.g.,
) and one with a low value (e.g.,
) for comparison. The specific values are
,
,
,
,
, and
; the results are shown in
Figure 7.
From the simulation results shown in
Figure 7, it is evident that irrespective of the magnitude of the coefficient of green investment cost, the peak blockchain operational cost escalates concurrently with the manufacturer’s increasing level of overconfidence. That is, an appropriate overconfidence behavior can encourage the manufacturer to decide to adopt blockchain technology. As the coefficient of green investment cost decreases, it becomes increasingly advantageous for the manufacturer to incorporate blockchain technology. First, if a manufacturer is overly optimistic about his own judgment, decision-making ability, and market prospects, he is more likely to adopt innovative technologies such as blockchain to gain a competitive advantage and expand his market share. This overconfidence drives his willingness to accept higher peaks in operating costs as he believes that the benefits that can be achieved through blockchain technology will far outweigh these costs. Second, the green investment cost coefficient reflects the cost burden manufacturer faces when implementing sustainable technologies. If this coefficient is lowered, it means that the manufacturer will have lower green investment costs to bear when implementing blockchain technology. This not only reduces the financial pressure but also increases the motivation to adopt blockchain technology as lower costs make its adoption more acceptable and achievable.
To strengthen the link between the above conclusions and industrial practice, we take the food industry as an example of the application of blockchain. According to the data, the global blockchain in the agriculture and food supply chain market reached
$190 million in revenue in 2023 and is expected to reach
$1.8 billion by 2030, with a compound annual growth rate of 37.1% (
https://www.gelonghui.com/p/872482 [accessed on 22 December 2024]). Today, green food and food traceability are major trends, and modern consumers are increasingly concerned about food safety and environmental attributes and are more willing to pay a premium for food products that provide transparent supply chain information and proof of green production. This poses a greater challenge for the food industry, and blockchain technology is an effective tool for addressing this challenge. For example, in the US, IBM and Walmart launched a partnership in 2016 to use blockchain technology to track food production, transport, and distribution processes to improve food safety and quality (
https://www.walmart.cn/assist-two/1038.html [accessed on 22 December 2024]). However, currently, the food industry is not equipped to implement blockchain.
Our findings provide a great reference space for the adoption of blockchain in the food industry. First, food companies should not only assess the affordability of blockchain operating costs but also pay attention to the growth of consumer green demand and fluctuations in environmental market policies. When both the carbon tax rate and consumers’ green sensitivity in the market are at a high level, food companies are more likely to actively adopt blockchain. This is because it not only effectively manages carbon emissions and reduces carbon costs but also satisfies consumer green demand by providing traceable supply chain information, which in turn increases brand value and market share. Second, the level of overconfidence is also an important factor to monitor. While a certain level of overconfidence can drive food companies to experiment with blockchain, overconfidence can also lead to blind investments or ignorance of potential risks. In addition, food companies should also pay attention to the impact of the green investment cost factor. For example, Yili and ABP are engaged in green production. Reducing the green investment cost factor or improving the cost-effectiveness of green investment can further encourage companies to adopt blockchain technology. This can be achieved by optimizing the design of blockchain solutions, seeking government subsidies or tax incentives, and collaborating with research institutes or peer companies on research and development. By reducing investment costs, companies can more effectively use blockchain technology to improve the transparency and efficiency of supply chain management while reducing their environmental impact.
8. Conclusions
8.1. Main Findings
In light of the manufacturer’s overconfidence, this paper examines how blockchain technology influences sustainable supply chain investment decisions. A model is developed to examine the pricing and investment approaches of an overconfident manufacturer and a rational retailer, comparing their strategies with and without blockchain. Our key findings are outlined below.
First, we find that the adoption of blockchain technology is only beneficial for the manufacturer under certain conditions. In our study, the manufacturer’s motivation to adopt blockchain is influenced by the coordination of four factors. On the one hand, the maximum blockchain operating cost that the manufacturer is willing to accept increases with carbon tax rates and consumers’ green sensitivity. In other words, manufacturer will be more willing to adopt blockchain if both carbon tax rates and consumer sensitivity are higher in the market. On the other hand, the manufacturer should also consider the combined effect of overconfidence and green investment cost factors. We find that a manufacturer’s overconfident behavior drives his decision to adopt blockchain technology to some extent, while a lower green investment cost coefficient further motivates him to adopt blockchain technology.
Second, the retailer’s profit is affected by both the manufacturer’s overconfidence level and the green investment cost coefficient. When the green investment cost coefficient is low both without and with blockchain, the retailer’s profit always increases with the level of overconfidence. On the contrary, her profit tends to decrease as the manufacturer’s overconfidence level increases. Moreover, when the manufacturer’s overconfidence level is low, blockchain adoption is advantageous for the retailer, and the retailer can always gain more profit from the manufacturer’s decision to adopt blockchain. This is because when the manufacturer’s level of overconfidence is low, his decisions are relatively rational, reducing the retailer’s losses and market risk. In turn, blockchain adoption contributes to a higher demand, which is more favorable for the retailer in this scenario.
Third, we also find that if the blockchain-driven increment in the consumers’ green sensitivity coefficient is significant, then blockchain adoption can improve the product green level. However, if the increment in sensitivity is nominal, it may not be possible to improve the product green level. For society, as the manufacturer’s overconfidence level increases, blockchain adoption can bring greater consumer surplus and social welfare. The higher the manufacturer’s overconfidence, the greater the difference between scenarios without and with blockchain.
8.2. Managerial Implications
The results obtained from this study offer valuable managerial implications for both supply chain participants and the government. First, for policymakers, appropriately increased carbon tax rates and increased consumer environmental awareness can incentivize manufacturing firms to adopt blockchain technology. For firms, management needs to recognize that overconfidence does not always need to be negative and that appropriate overconfidence with low levels of green investment can increase incentives for the adoption of blockchain technology. This means that along with overconfidence, firms should strive to reduce green investment costs, for example, through technological innovation or policy incentives, in order to further promote the widespread adoption of blockchain technology in the manufacturing sector.
Second, retailer should actively communicate with manufacturer about their green investment costs and try to find ways to reduce these costs as low green investment costs can increase retailer’s profits. The retailer also needs to pay close attention to manufacturer’s decision-making processes, especially regarding fluctuations in their overconfidence levels. When manufacturer’s overconfidence levels are low, retailer should encourage manufacturer to adopt blockchain technology to maximize their own profits. When the level of overconfidence is too high, retailer should carefully assess the risks and adjust their supply chain strategies to avoid losses due to poor decisions on behalf of manufacturer.
Finally, in our analysis, we consider a government initiative that exempts the manufacturer from paying carbon taxes if they use blockchain. The findings reveal that a substantial blockchain-driven green sensitivity coefficient among consumers can not only elevate the green level but also generate increased social welfare and bolster consumer surplus as the manufacturer’s level of overconfidence rises. This suggests that implementing environmental exemptions can make a significant difference. To incentivize manufacturer to adopt blockchain, the government needs to introduce carbon tax subsidy policies for manufacturer who adopts blockchain as well as measures such as promotional campaigns that focus more on raising public awareness and sensitivity to green products.
8.3. Future Research Directions
We acknowledge that our paper has certain limitations, which in turn present multiple avenues for further exploration and continuation of this research. First, we only considered one manufacturer as a green investor. It is worth exploring the potential involvement of multiple manufacturers and retailers and how competition up and down the supply chain may affect green investment in the context of overconfidence.
Second, we only focused on certain positive effects of blockchain, such as the elimination of carbon taxes and increased green sensitivity of consumers to products. Therefore, some of the negative effects of blockchain, such as energy consumption and additional emissions due to blockchain adoption, and consumer privacy concerns due to blockchain adoption will be incorporated into our model in future research.
Third, in reality, it is also common for all members of a supply chain to jointly adopt blockchain technology, and in the future, we will also consider cost-sharing scenarios of blockchain adoption by supply chain members.
Fourth, blockchains can be categorized into two main types, namely, permissioned and permissionless, which differ significantly in terms of access control and participation in consensus processes. Due to the complexity of exploring this difference, it was not captured in the model in this paper. However, we are equally interested in the differences between permissioned and permissionless blockchains. Incorporating the variability between these two blockchain types into the research model would certainly be an interesting research direction.
Finally, we look forward to future research paradigms that attempt to combine theoretical and empirical analyses. In this paper, equilibrium decision-making between firms has so far been mainly analyzed using game theory, and some interesting conclusions have been drawn. However, to make the theoretical results more relevant, it is also possible to obtain specific data from, for example, the food or pharmaceutical industries, which have promising blockchain applications. We will continue to enrich and improve our research by adding the validation path of empirical analysis.


