Article

2D Model of a Biomass Single Particle Pyrolysis—Analysis of the Influence of Fiber Orientation on the Thermal Decomposition Process

1
Renewable Energy Department, Institute of Fluid-Flow Machinery, Polish Academy of Sciences, 80-231 Gdańsk, Poland
2
Aerospace Engineering Department, Engineering Faculty, İzmir University of Economics, Izmir 35330, Turkey
3
Independent Researcher, 80-000 Gdańsk, Poland
*
Author to whom correspondence should be addressed.
Sustainability 2025, 17(1), 279; https://doi.org/10.3390/su17010279
Submission received: 28 November 2024 / Revised: 23 December 2024 / Accepted: 28 December 2024 / Published: 2 January 2025
(This article belongs to the Special Issue Thermally Driven Renewable Energy Technologies)

Abstract

Understanding the influence of heat transfer on the pyrolysis process is crucial for optimizing industrial biofuel production processes. While numerous scientific studies focus on experimental investigations of pyrolysis using laboratory-scale devices, many neglect the essential role of thermal energy in initiating and controlling thermal decomposition processes. This study presents a transient two-dimensional numerical model of biomass single-particle pyrolysis, which includes the energy balance, mass conservation equations and pyrolysis gas pressure and velocity equations. The model employs explicit numerical methods to manage the high computational demands of 2D transient simulations, but is successfully validated with the use of experimental data found in the literature. The model reflects the heterogeneous structure of wood by using different thermal conductivity coefficients depending on the wooden fibers’ orientation. The results demonstrate the impact of fiber orientation on the heat transfer and thermal decomposition processes. The anisotropic properties of wood led to varied temperature fields and pyrolysis decomposition stages, aligning well with experimental data, thus validating the model’s accuracy. The proposed approach can provide a better understanding and lead to improvement in biofuel production processes, enabling more efficient and controlled conversion of biomass into fuel. By optimizing the pyrolysis process, it contributes to the development of sustainable energy preservation and regeneration methods, supporting a shift towards more sustainable fuel production patterns using renewable biomass resources like wood.

1. Introduction

This study focuses on wood pyrolysis of a wooden sample. Biomass pyrolysis is a sustainable and promising alternative for non-renewable and sometimes high-pollutant fuels, such as coal, oil, and natural gas [1,2]. Using biomass is the most suitable and affordable technique supporting the objectives of the European Green Deal [3]. The EU Green Deal aims to decarbonize many different sectors, such as farming, transportation, and all production facilities. According to its aims,  CO 2  emissions need to be decreased. With recycling of biomass materials, harmful emissions could be decreased, while generating green power in high energy-consuming industries [4], such as power plants [5], the iron-steel industry [6], cement industry [7], and the automotive [8], glass [9], and ceramic industries [10]. The trend of seeking alternative energy sources that are more environmentally friendly is not limited to Europe. Regardless of whether the goal is to preserve fossil fuels or find more green and sustainable methods for energy generation, the global demand for electricity is increasing, driving the need to find alternatives for conventional energy production.
Pyrolysis is a thermal decomposition technique conducted at high temperatures and in a very low- or no-oxygen atmosphere. Depending on the temperature of the process, low-temperature pyrolysis is when the temperature ranges between 500 °C to 600 °C. If the temperature rises to up to 900 °C and more, the process is referred to as high-temperature pyrolysis [11].
Materials containing a high number of organic carbons, such as biomass, wood or coal, are preferred for biofuel production. The pyrolysis process can be used as a fuel conversion method, which enables bio-fuels to be produced in various forms (bio-gas, bio-char, and bio-oil) [12,13]. Numerous works are devoted to analysing the possibilities of bio-fuel production using the pyrolysis of various sources, such as biomass or other waste materials [14,15,16]. Depending on the conditions (temperature, pressure) and procedures (heating rate, residence time, particle size) different product compositions can be obtained from the same material [11,17,18,19].
Apart from bio-fuel production, the pyrolysis process can also be used in other areas. For example, bio-chars have the potential to be used for activated carbon production [20,21], production of cement-based materials [22], ceramic products production [23], fertilizer production [24] or waste utilization [25,26].
This study proposes a two-dimensional transient model of wooden particle pyrolysis. The model consists of a mass balance equation, energy equation, and gas pressure and velocity equations. The analysis includes the influence of the wooden fiber orientation on the pyrolysis process. It is known that the layered structure of wood significantly affects many of its mechanical, thermal, and other properties [27]. When it comes to pyrolysis or thermal decomposition, the fiber orientation mainly affects properties such as the thermal conductivity coefficient [28] or the permeability. Moreover, thermal stresses present in the wooden sample undergoing pyrolysis might cause fractures, especially in larger particles. These fractures usually occur along the fiber layers which are weaker and more prone to break. This causes density changes, local temperature changes, and sudden pyrolysis gas release due to rapid changes in geometry and local conditions. The pyrolysis gas release also influences the decomposition processes by changing conditions such as the temperature (due to gas flow) and pressure, and by mass transport of different intermediate products present at different stages of pyrolysis.
There are many works focused on the numerical modeling of wooden particle pyrolysis [29,30,31]. Some of them focus more on the kinetics of the process and mass loss only, usually considering very small samples [32,33,34]. Other works include thermal effects by simulating the temperature distribution and emphasize the role of thermal energy, which initiates and controls the process of thermal decomposition in large and medium-sized particles [35,36,37,38]. More complex models also include the effects of pyrolysis gas generation and pressure [39,40].
However, the model proposed in this work offers an efficient tool for fast 2D transient simulation of wooden particle pyrolysis, including temperature, mass loss, gas pressure, and velocity. The novelty of the presented model lies in its simplicity and remarkably low computational power demands, making it exceptionally suitable for integration into larger, more complex simulations. This simplicity allows the model to be adopted in studies involving entire beds of particles, where the computational burden is already substantial. By providing a balanced approach in terms of accuracy and calculation time for particle-level calculations, this model significantly reduces simulation times compared to more intricate models. Consequently, it enables performing detailed pyrolysis simulations without sacrificing efficiency, making it particularly advantageous for applications that require extensive computations, such as multi-particle bed modeling or large-scale industrial process simulations.

2. Materials and Methods

The study presents a transient two-dimensional model for wood pyrolysis. The studied particle is made of pine wood and is square-shaped with a wall length of 20 mm. The model consists of a set of coupled equations describing mass and energy conservation and syngas flow through the porous structure of wood. It involves a mass balance equation, energy balance for temperature distribution in the sample, a pressure equation for pyrolysis gases, and two velocity vector component equations derived from Darcy’s law.

2.1. Governing Equations

The mass balance equation describes the mass loss of the wooden sample during the thermal decomposition process. The formula is proposed in the following form:
m s t = k · ( m s m ¯ s ( T ) ) ,
where  m s  is the mass of the sample  ( k g )  and  m ¯ s  is the reference mass of the sample at a given temperature  ( k g ) . A similar approach was used previously by Postrzednik [41], Wardach-Święcicka [42], and Kardaś et al. [37]. In the above equation, k is the rate of reaction described with the Arrhenius equation:
k = A exp E a R T ,
where A and  E a  are kinetic constants (pre-exponential factor and activation energy, respectively), R is the universal gas constant, and T is temperature. The values of the kinetic constants used in the simulation were  A = 1.4 × 10 10 1 / s  and  E a = 150 kJ / mol  and were measured by Wagenaar et al. [43] for a pine wood sample. To simplify and generalize the analysis, an alternative form of the mass equation was implemented. The normalized mass coefficient  α , or in simpler words a fraction of the non-decomposed mass, was used instead of the absolute mass values to provide a broader and more general description of the phenomenon:
α t = k · ( α α ¯ ( T ) ) ,
where
α = m s m 0 ,
and
α ¯ ( T ) = m ¯ s ( T ) m 0 ,
where  m 0  is the initial mass of the sample.
The energy balance equation governs the temperature distribution in the wooden sample, including the heat transfer through conduction and the energy associated with the decomposition reactions:
ϱ c p T t = λ 2 T x 2 + 2 T y 2 S g · h
where  ϱ  is the density of the sample  ( k g / m 3 ) c p  is the specific heat capacity  ( J / ( k g K ) ) S g  is the  ( k g / ( m 3 s ) )  flux of generated pyrolysis gas, and h is the enthalpy of the pyrolysis gas  ( J / k g ) . The thermal conductivity coefficient  λ ( W / ( m K ) )  is dependent on the orientation of the wooden fibers and is different for the x- and y-directions. The values of the physico-chemical parameters used for calculation are gathered in Table 1. The effective values of  ϱ λ , and  c p  of the sample are evaluated based on the fraction of virgin undecomposed wood and biochar according to the following relations:
ϱ = α ¯ ϱ w o o d + ( 1 α ¯ ) ϱ c h a r ,
c p = α ¯ c p , w o o d ( T ) + ( 1 α ¯ ) c p , c h a r ( T ) ,
and
λ = α ¯ λ w o o d ( T ) + ( 1 α ¯ ) λ c h a r ( T ) ,
where  λ w o o d  is either  λ x  or  λ y , depending on the direction with respect to the wooden fibers.
The pressure equation allows calculation of the pressure distribution in the porous medium. It was derived based on the mass balance equation for pyrolysis gases. It connects the pressure to the flow of gases through the wood sample. The equation includes the effect of pressure gradients and gas generation due to pyrolysis.
p t = K · ϱ g μ · ϱ g p 2 p x 2 + 2 p y 2 + S g ϱ g p ,
where p is pressure (Pa), K is the permeability of wood  ( m 2 ) , and  μ  is the dynamic viscosity  ( Pa · s ) . The values of these parameters can be found in Table 1. The parameters of the gas phase were assigned constant values, estimated for a mixture of carbon monoxide and hydrogen, which are the main components of syngas produced during wood pyrolysis, as demonstrated in the study by Muchiiwa et al. [44]. This simplification allows maintaining balance between accuracy and computational efficiency, making the model suitable for practical applications where short simulation times are essential.
Table 1. Physico-chemical parameters of the simulated sample.
Parameter, UnitValue/FunctionReference
λ x , W / ( mK ) 0.38[28] 1
λ y , W / ( mK ) 0.15[28] 1
λ c h a r , W / ( mK ) 0.0002 · T 0.0183 [45] 1
ρ w o o d , kg / m 3 360[46]
ρ c h a r , kg / m 3 299[46]
c p , w o o d , J / ( kgK ) 524 + 5.46 · T [47]
c p , c h a r , J / ( kgK ) 420 + 2.09 · T + 6.85 · 10 4 T [28]
K , m 2 2.674 · 10 15 · exp ( 1.209 · 10 2 · T ) [48] 1
ρ g , kg / m 3 0.966[49] 1
μ g , Pa · s 2.39 · 10 5 [50] 1
φ , %60[51]
1 Value or function evaluated based on the data found in the reference.
The velocity of the generated syngas in the porous structure is described by Darcy’s law. It relates the velocity components to the pressure gradient and the permeability of the medium. The component of velocity in the x-axis is calculated as:
u = K μ φ p g x ,
and for the component in the direction of the y-axis:
v = K μ φ p g y ,
where  φ  is the porosity (-).
In conclusion, the model consists of five equations: mass balance Equation (3), energy Equation (6), pressure Equation (10), and two equations for the gas velocity components, (11) and (12).

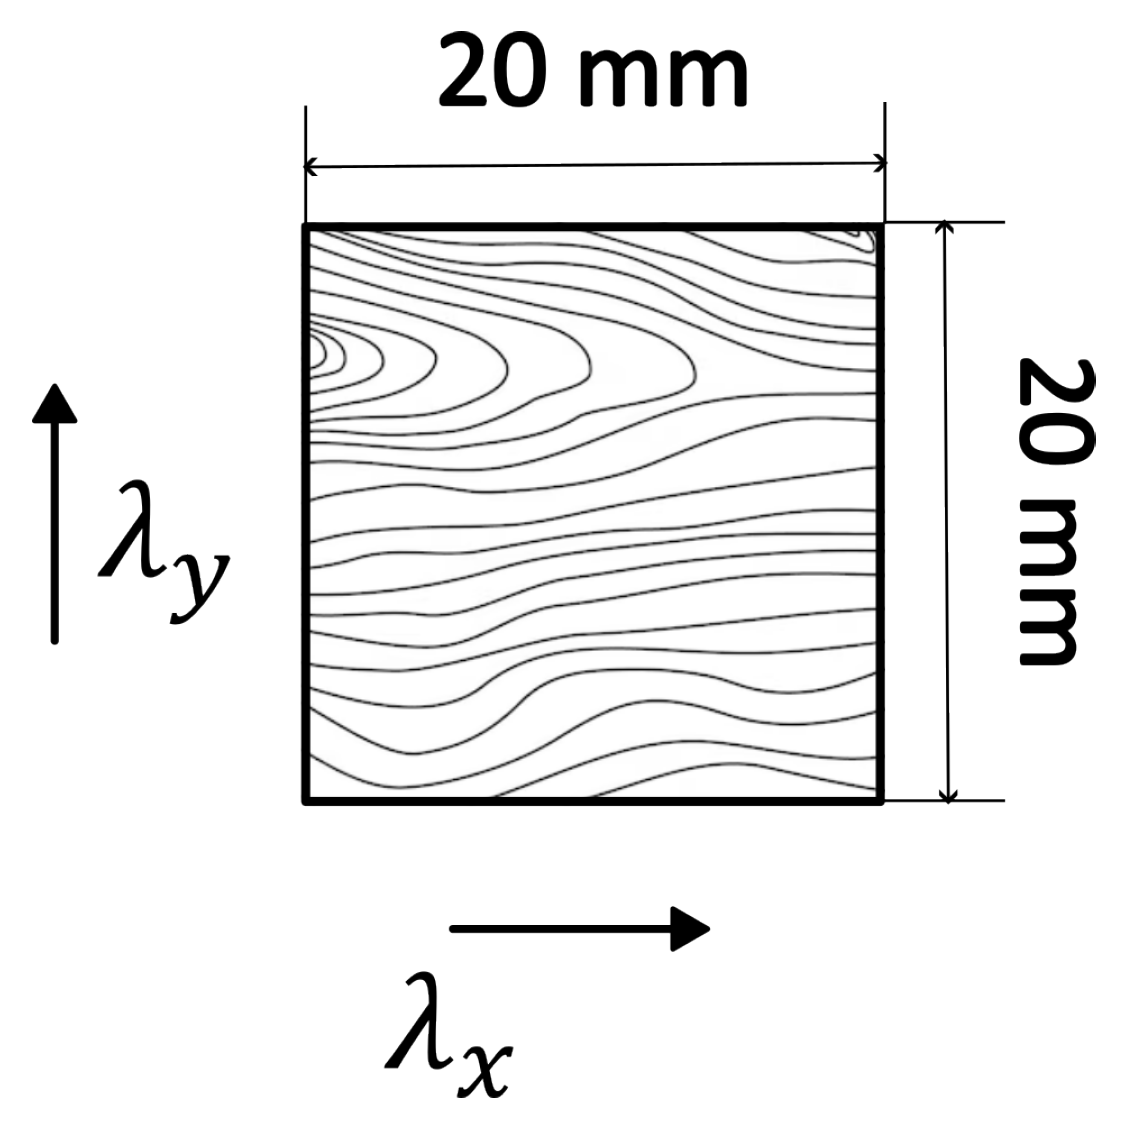
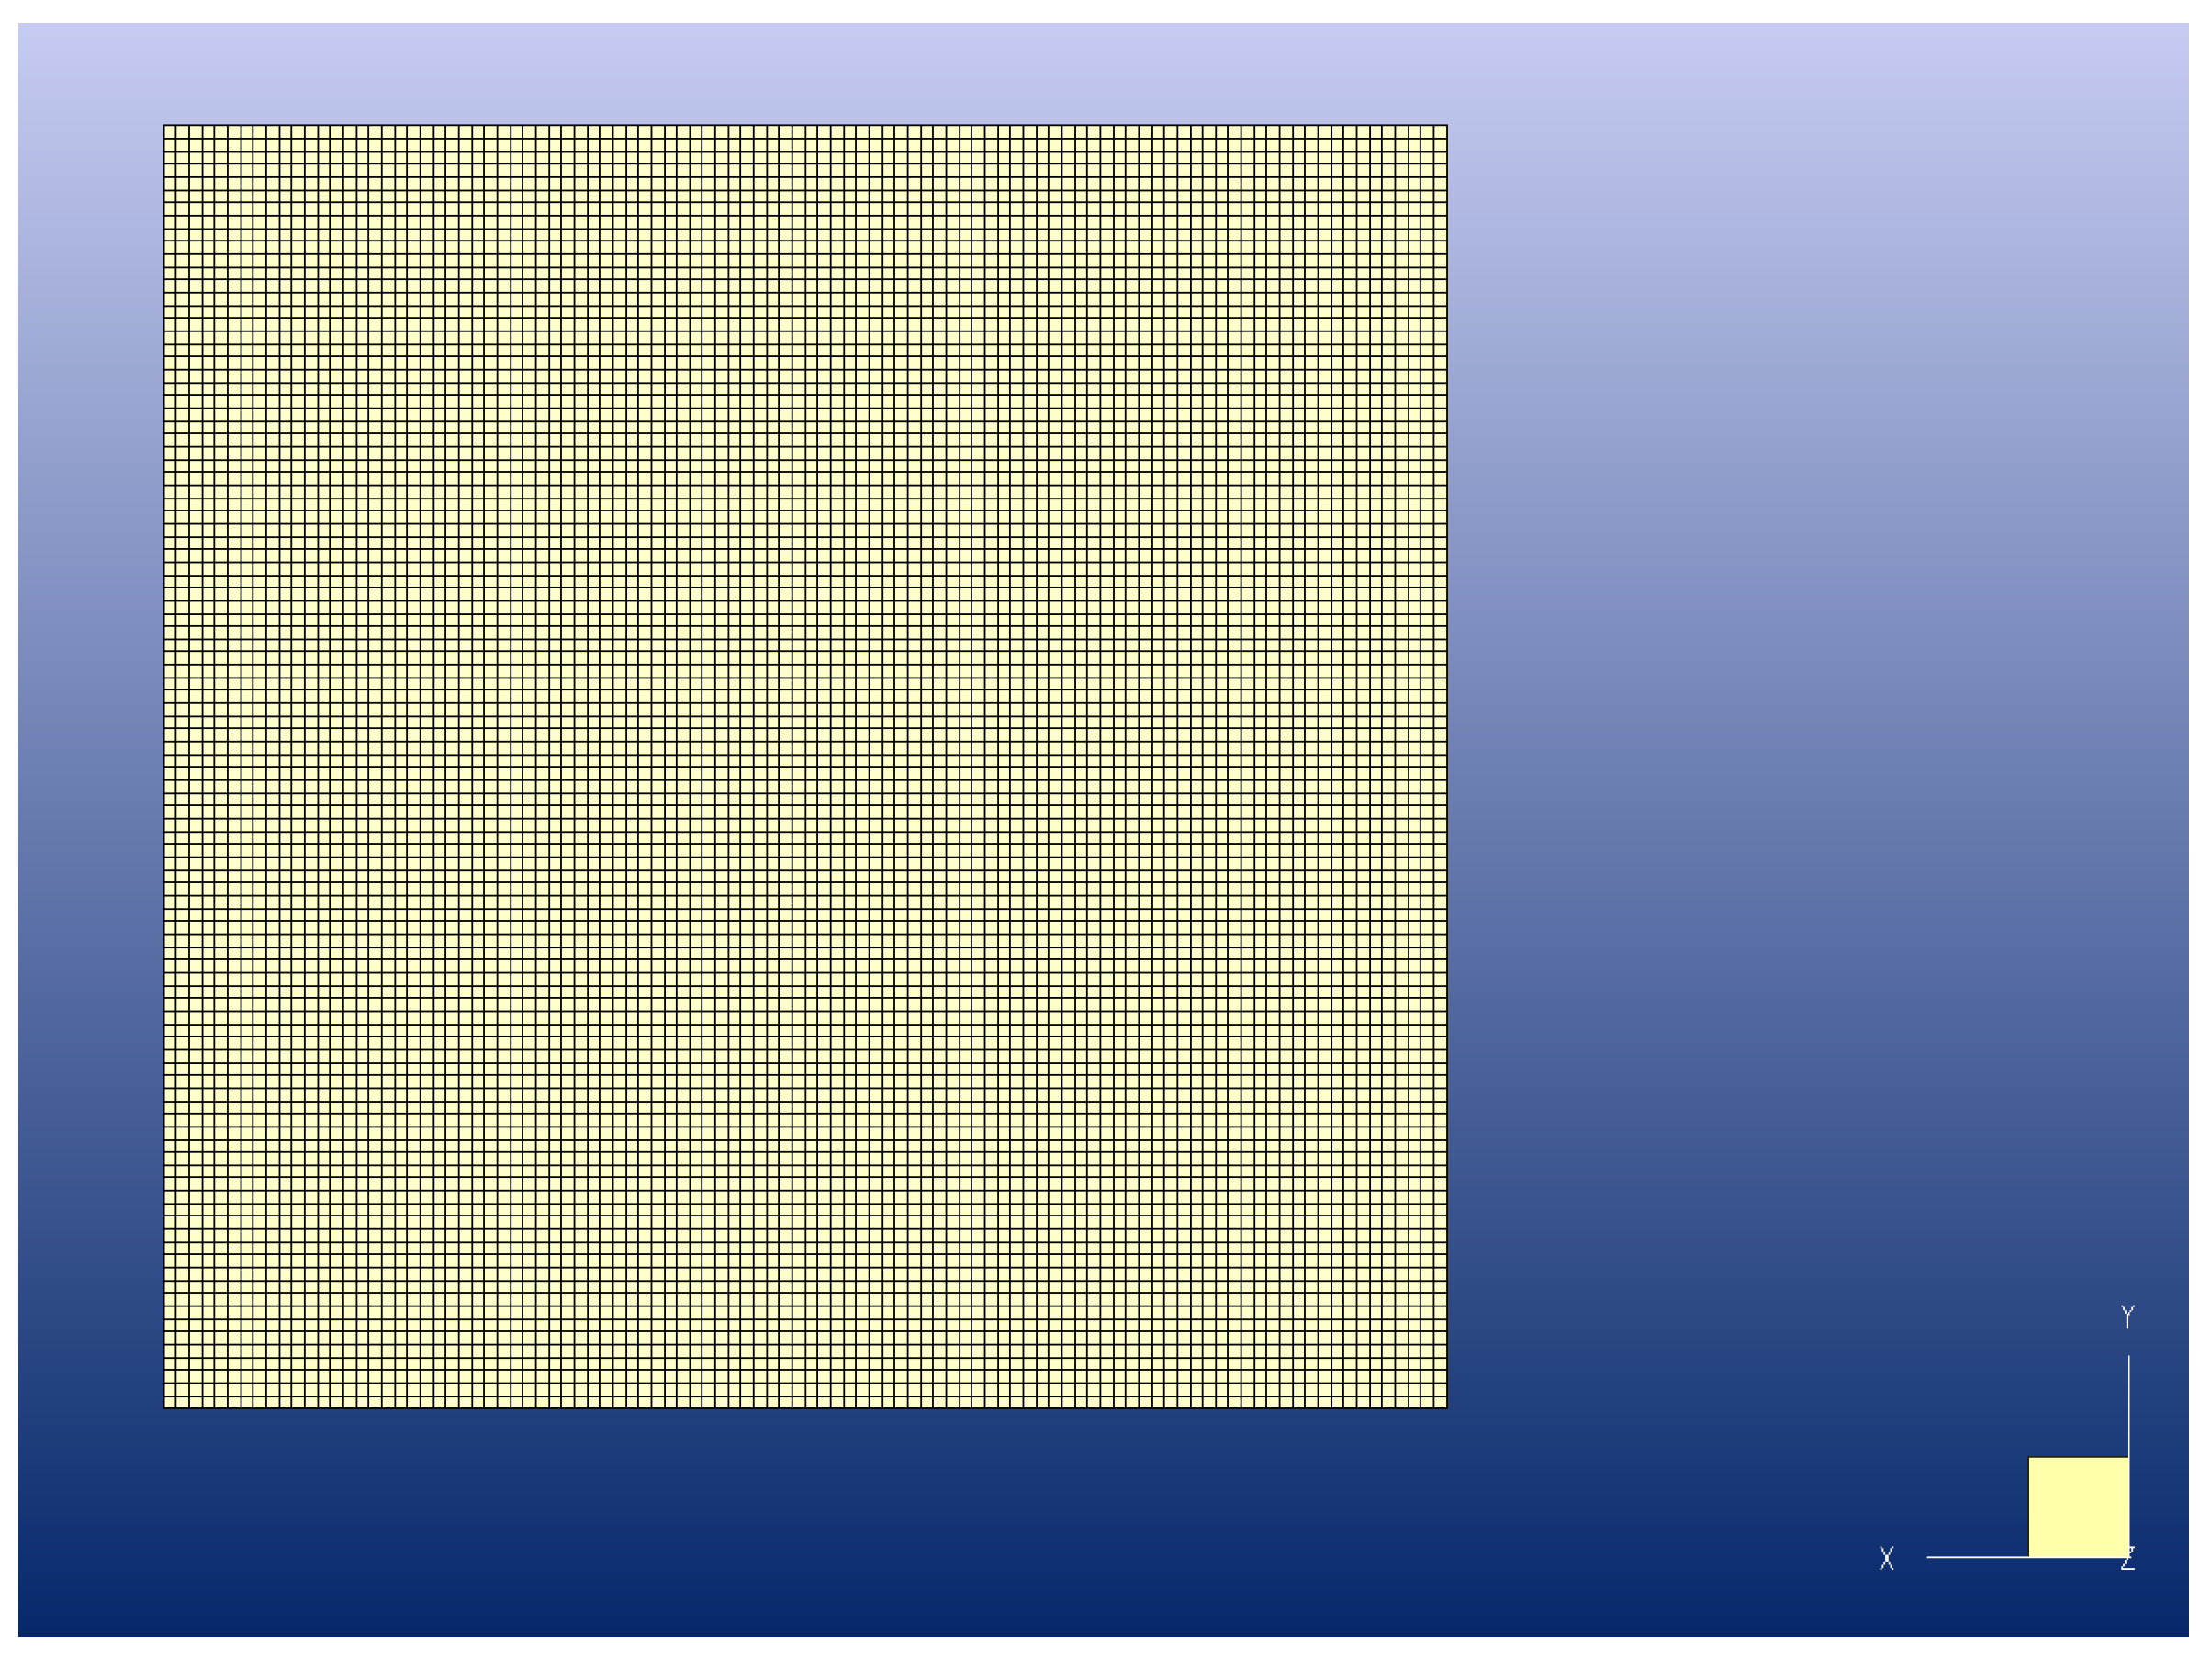
2.2. Geometry and Mesh

The geometry of the analysed sample is presented in Figure 1. The simulated domain is two-dimensional and of square shape with 20 mm wall length. The assumed wooden fibers orientation is along the x-axis.
The domain was divided into 10,000 cells of the same size. The commercial software HEXPRESS™ (Version 11.2) mesh generator from Numeca was used. This means that there were 100 cells in each direction of the domain. The mesh is presented in Figure 2. The generated mesh was exported into the text files format. Then, a script in Fortran language was written to import the coordinates of the mesh nodes. The script was written specifically for this work and allows the importation of any type of structural mesh. Although preparing this type of structural, square shaped and regular mesh in the Fortran language is easy, creating this tool allowed switching between geometries and mesh densities very quickly.
After reading the coordinates of the mesh nodes, this script prepared the geometry and calculated the additional data needed before stepping into the numerical calculations. Values such as the cell volumes, cell wall areas, wall lengths, and the depth of the geometry were calculated. Additionally, at the edges of the domain, additional layers of ghost cells for boundary condition handling were created by the written script.

2.3. Initial and Boundary Conditions

The initial temperature of the domain is 293.15 K. The simulation reflects a situation where a sample at room temperature is placed inside a pre-heated furnace. The temperature boundary conditions are constant and set to 773.15K for each wall. For the mass balance equation, the initial sample mass fraction is set to  α = 1 . The initial value of the pressure is the atmospheric pressure (101,325 Pa). The boundary condition is also 101,325 Pa, the ambient pressure. The velocity components are set to 0 m/s in the initial timestep, and the boundary conditions for the velocity are the Neumann type (zero-gradient boundary conditions).

2.4. Computational Approach

The wood particle pyrolysis model was developed using Modern Fortran. In the first step, the simulation mesh prepared in HEXPRESS™ Numeca was imported with a custom Fortran program, as described before. Then, each of the five govering equations (mass balance Equation (3), energy Equation (6), pressure Equation (10), and the two equations for the gas velocity components (11) and (12)) was discretized. A control volume approach was used. An explicit one-step method was applied for discretization due to its simplicity and low computing power requirements. A Taylor series method was used to discretize each derivative of time (t) and space ( x , y ). For example, for the energy equation:
T i , j t = f i , j ( T i , j , x i , j , y i , j , T i 1 , j . . . )
T i , j n + 1 T i , j n Δ t = f i , j n ( T i , j n , x i , j n , y i , j n , T i 1 , j n . . . )
T i , j n + 1 = T i , j n + Δ t · f i , j n ( T i , j n , x i , j n , y i , j n , T i 1 , j n . . . )
Each of the five equations was re-written.
The calculations were performed step-by-step as follows: Firstly, the value of the temperature in a cell in the following timestep was calculated. Then, values of the sample mass fraction  α  and  S g  were calculated. Based on the calculated value of the released gases  S g , the value of the pressure was calculated, and next the value of the velocity components was calculated. This procedure was iterated over each cell in the domain until the values for the whole domain in the following timestep were calculated. Then, the fields of values of the parameters and boundary conditions were updated for the next set of iterations. The calculations were conducted until  t = 900 s . To ensure the stability of the calculations, the time step  Δ t = 0.009 s  was checked with the use of the Courant–Friedrichs–Lewy (CFL) condition, using the gas density change over pressure change (see Equation (10)) as a characteristic velocity. The results of the simulation were saved in data files enabling further post-processing of the calculated data.

3. Results and Discussion

A custom Python script was developed for simulation data post-processing and visualization. The 2D contours of the temperature, normalized mass coefficient  α , pressure, and velocity over time were generated. These graphics provide insight into the evolution of the sample and the process conditions during the pyrolysis process.

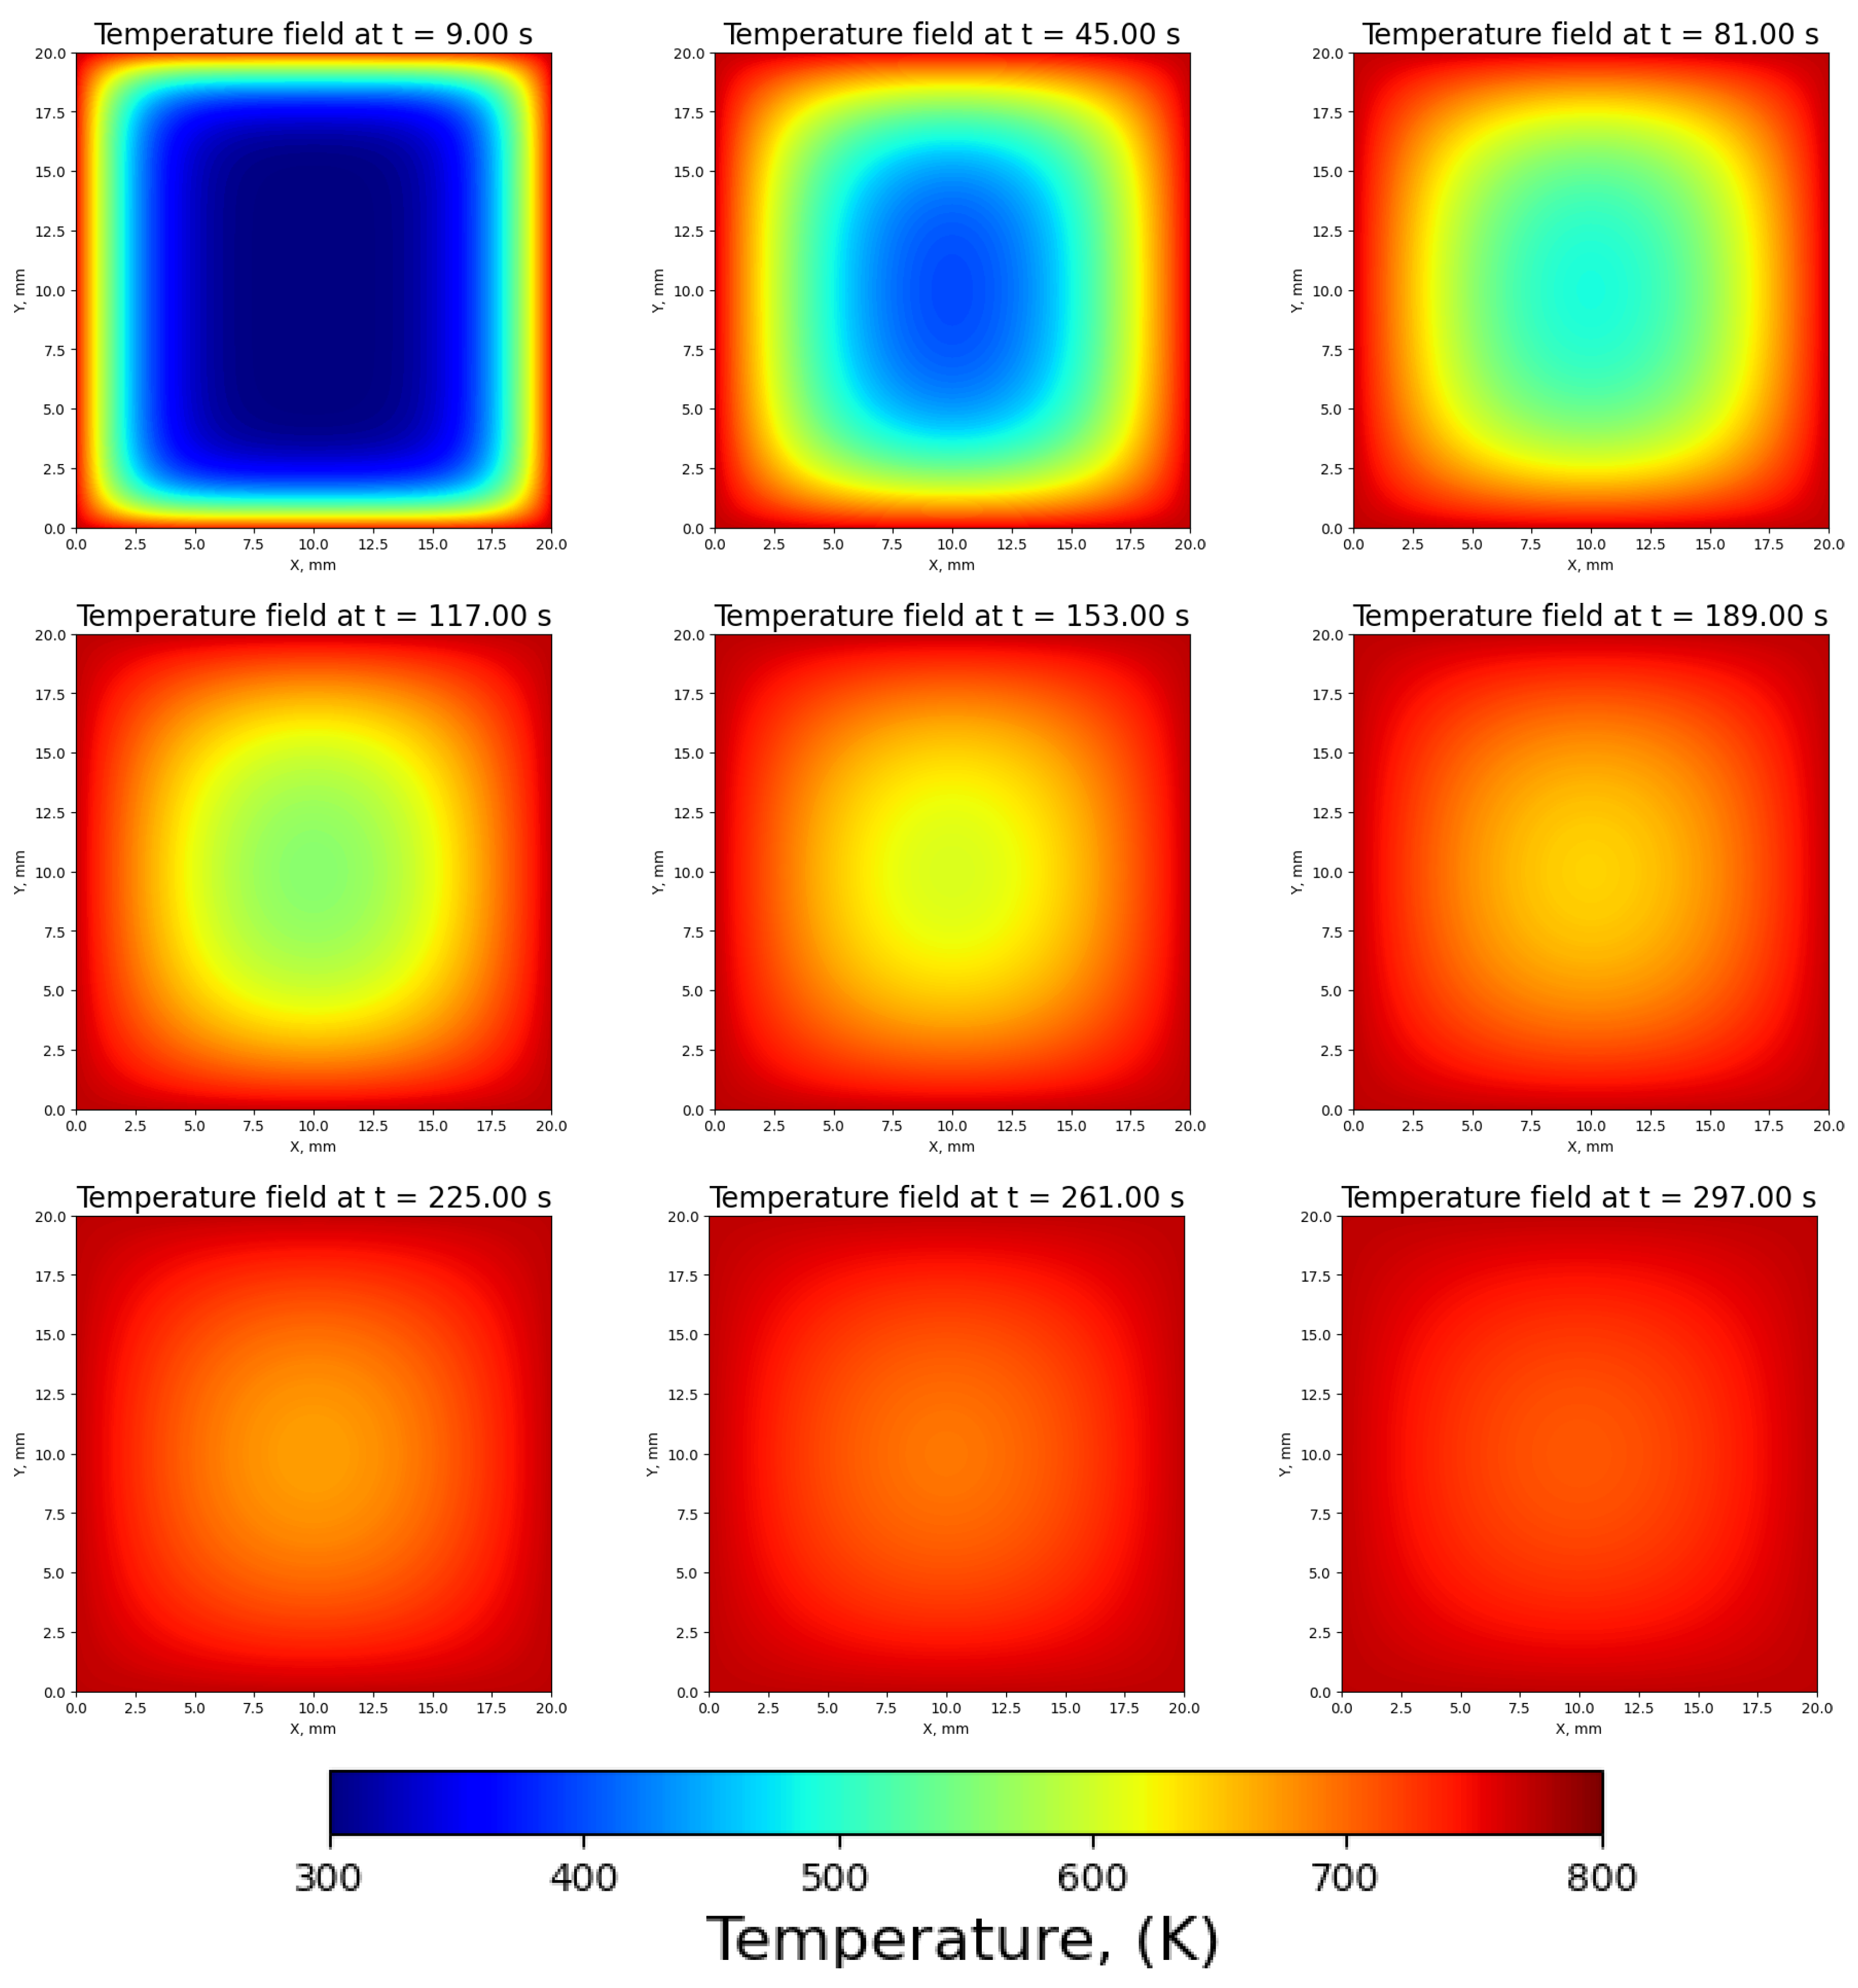
3.1. Temperature Distribution

The temperature distribution, as shown in Figure 3, shows the heat transfer from the walls of the particle toward its interior during the process. The implementation of wooden layers in the model is visible in the asymmetry in the temperature gradients. It is clear that the heat transfer occurs faster in direction x (along the wooden fibers) than in direction y (across the fibers), due to variations in thermal conductivity in these two directions. This temperature distribution contributes to the observed variations in the decomposition dynamics presented in the next subsection. Heating the entire volume of the particle from room temperature up to 750 K takes approximately 300 s. Very similar results were obtained by Sadhukhan et al. [52], where wooden particles of 20 mm diameter (sphere and cylinder) underwent pyrolysis at 320 °C and 410 °C for the experimental data and at 500 °C and 600 °C for the numerical data. In general, their results showed that the center of the particle reached the external temperature after approximately 300–400 s.

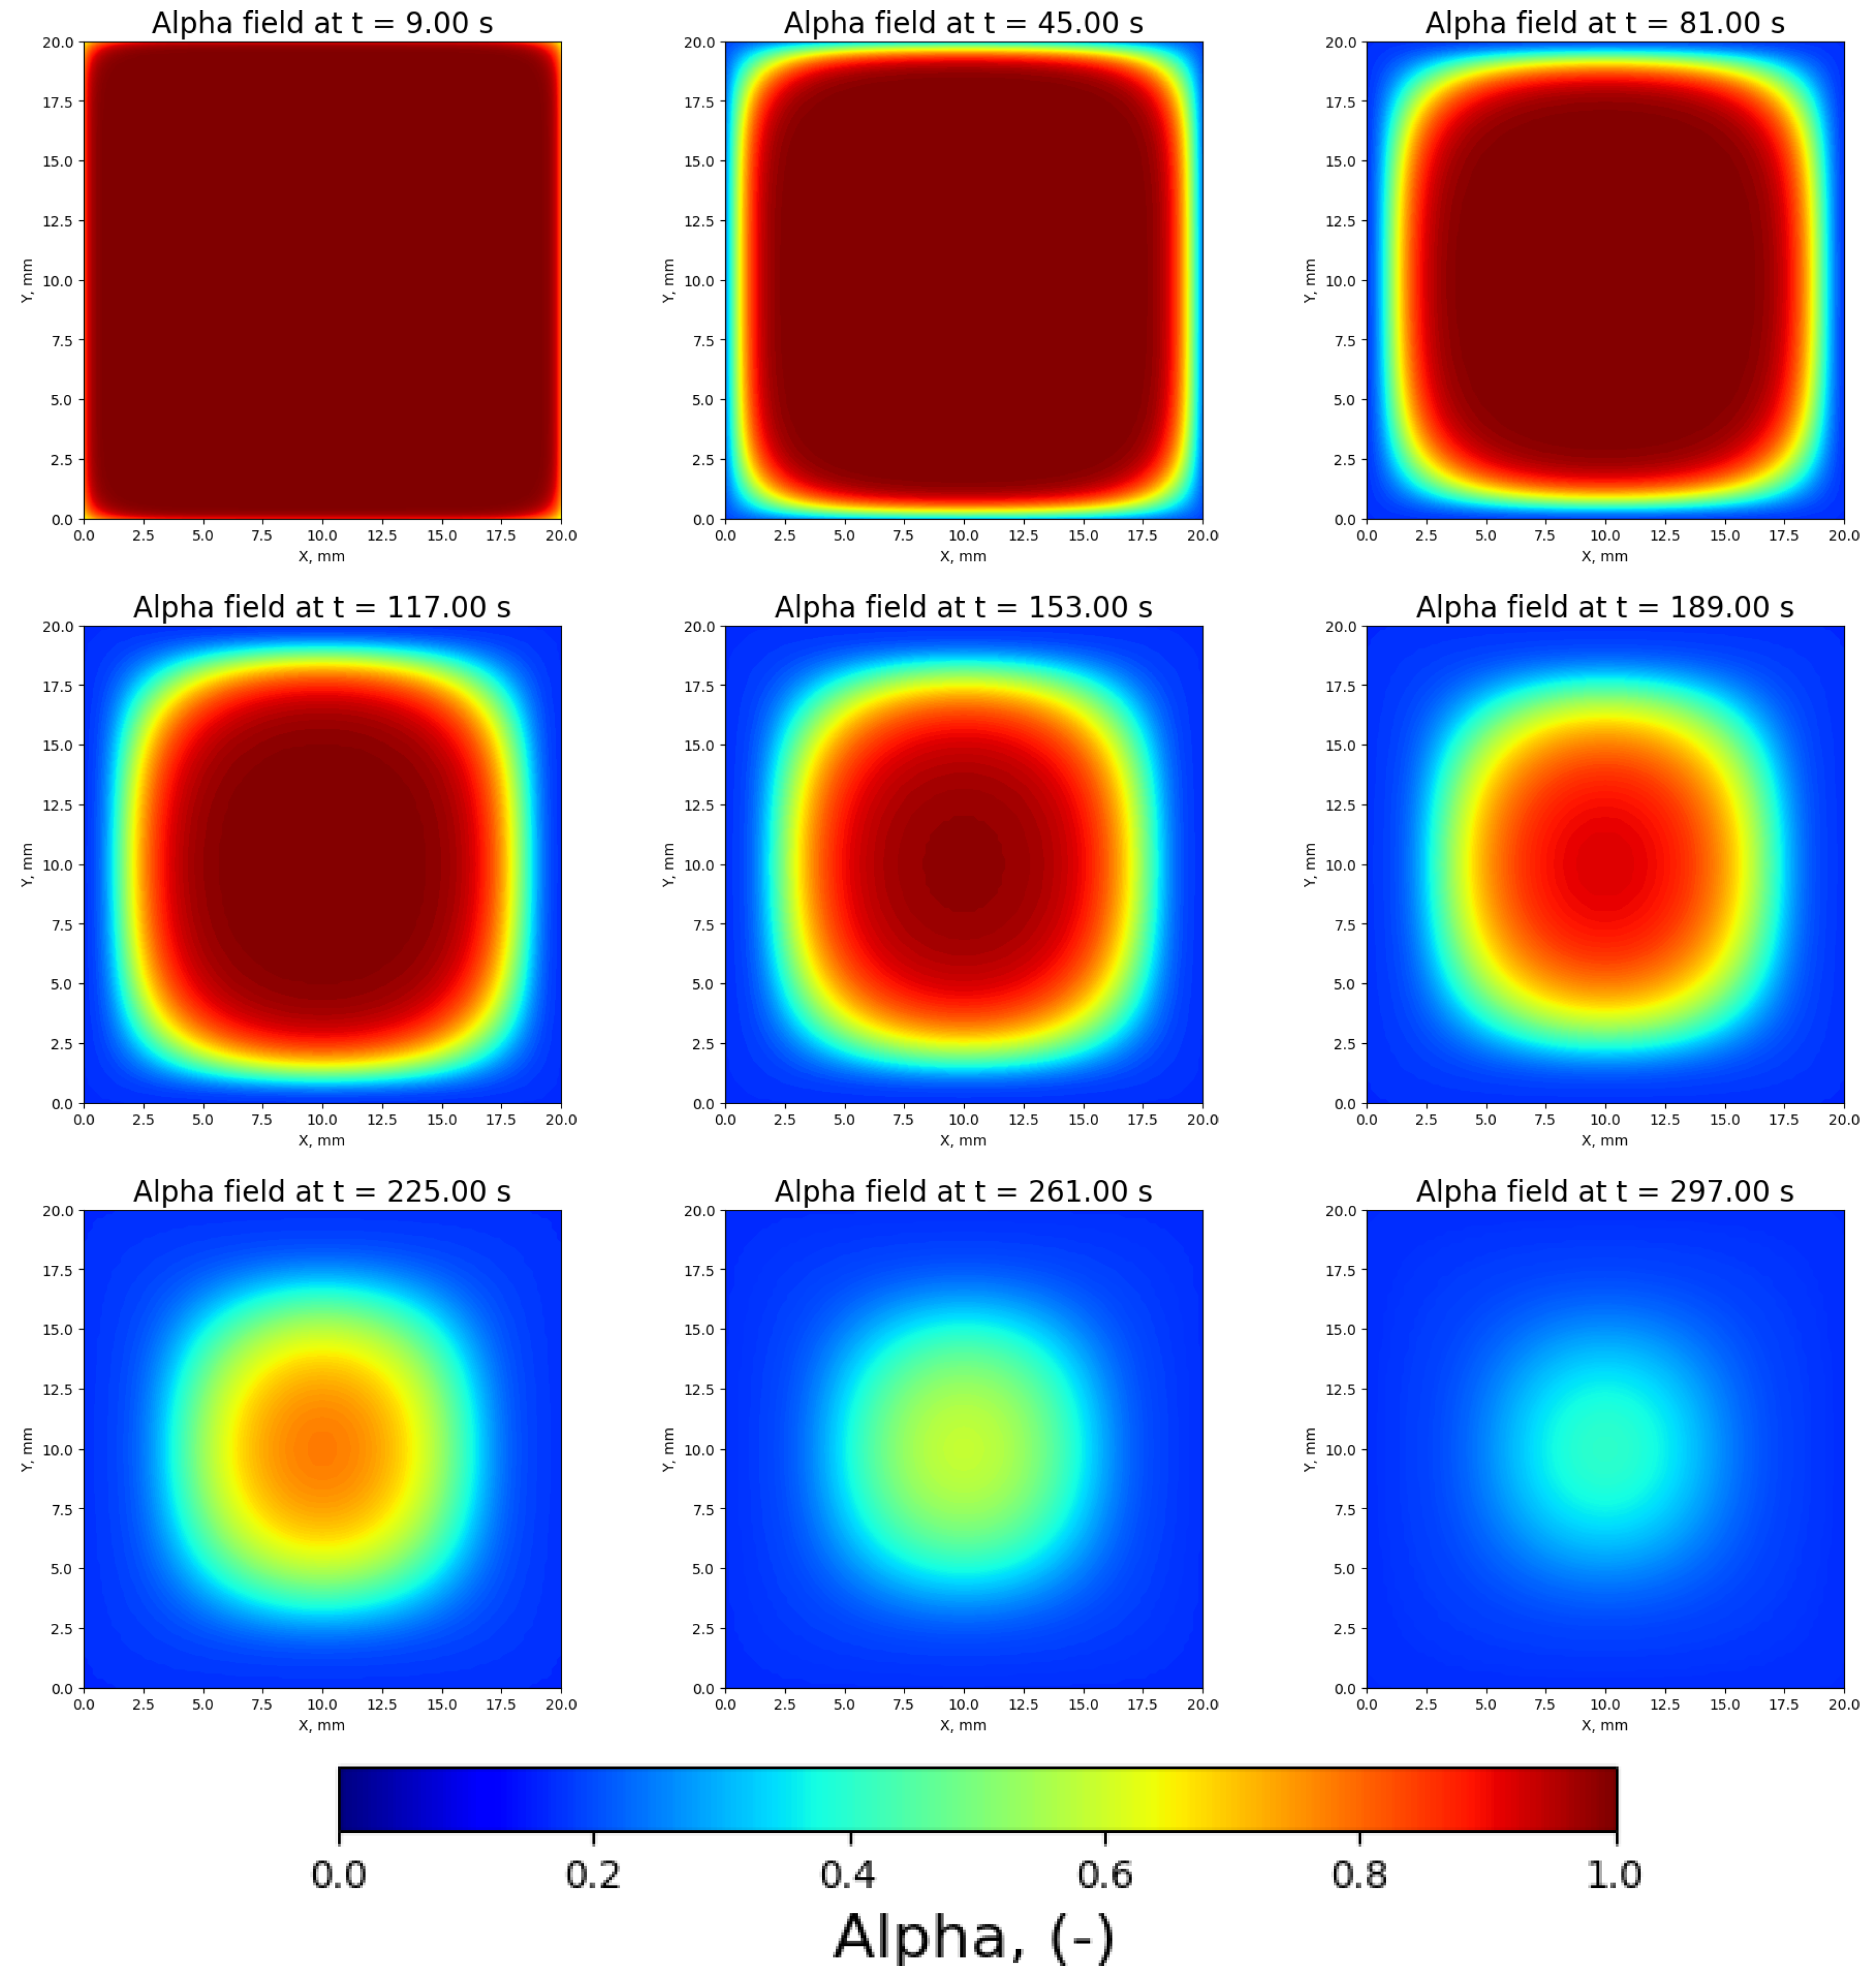
3.2. Normalized Mass Coefficient  α

The mass loss distribution over time is presented in Figure 4. It shows that the decomposition initiates at the edges of the square-shaped particle and expands toward the center as time progresses. This behavior aligns with the expectation that heat transfer drives the decomposition process. Breakdown of chemical components happens only after the needed temperature is reached and then the decomposition reactions take some time; therefore, a “delay” of the mass loss distribution is present. Similarly to the temperature profiles, the influence of the wooden layers is apparent in the asymmetrical distribution of the decomposed and undecomposed mass. However, when comparing the mass loss distributions with the temperature profiles, it can be observed that the asymmetry in decomposition processes is slightly lower.
The decomposition progresses rapidly in the beginning of the process, right after reaching the needed temperature. The alpha value drops down to approximately 0.17 (see Figure 4 for t = 297 s) and further breakdown of the remaining products (char) is impossible. Decomposition of the entire volume of the particle takes approximately 300 s, which is consistent with experimental studies of dry wooden particles of similar dimensions [52,53,54]. In the work of Kazimierski et al. [53], a dry sample of pine wood underwent pyrolysis at a temperature of 500 °C and was mostly decomposed after 150 s. This is twice as fast, but it needs to be mentioned that their sample was of size  20 × 5 × 20  mm; therefore, it was smaller than the sample investigated here and decomposed faster. Very similar results were observed by Soria-Verdugo et al. [55] for particles of beech wood, where the decomposition at 500 °C and 600 °C took approximately 90 s, but again, for samples of various shapes, though smaller than the ones used in this simulation (e.g., a flat disk of 20 mm diameter and 2 mm thickness).
As expected, the obtained results show the characteristic scheme of how larger particles undergo pyrolysis. When the edges of a particle are already decomposed, in the center, there is still raw undecomposed biomass, which has been shown by multiple research groups investigating larger biomass samples [35,36,52]. A unique investigation was undertaken by Kazimierski et al. [56], where this effect was visible on radiographic pictures, which showed that more “dense” undecomposed wooden matter was present in the center of the samples undergoing pyrolysis.

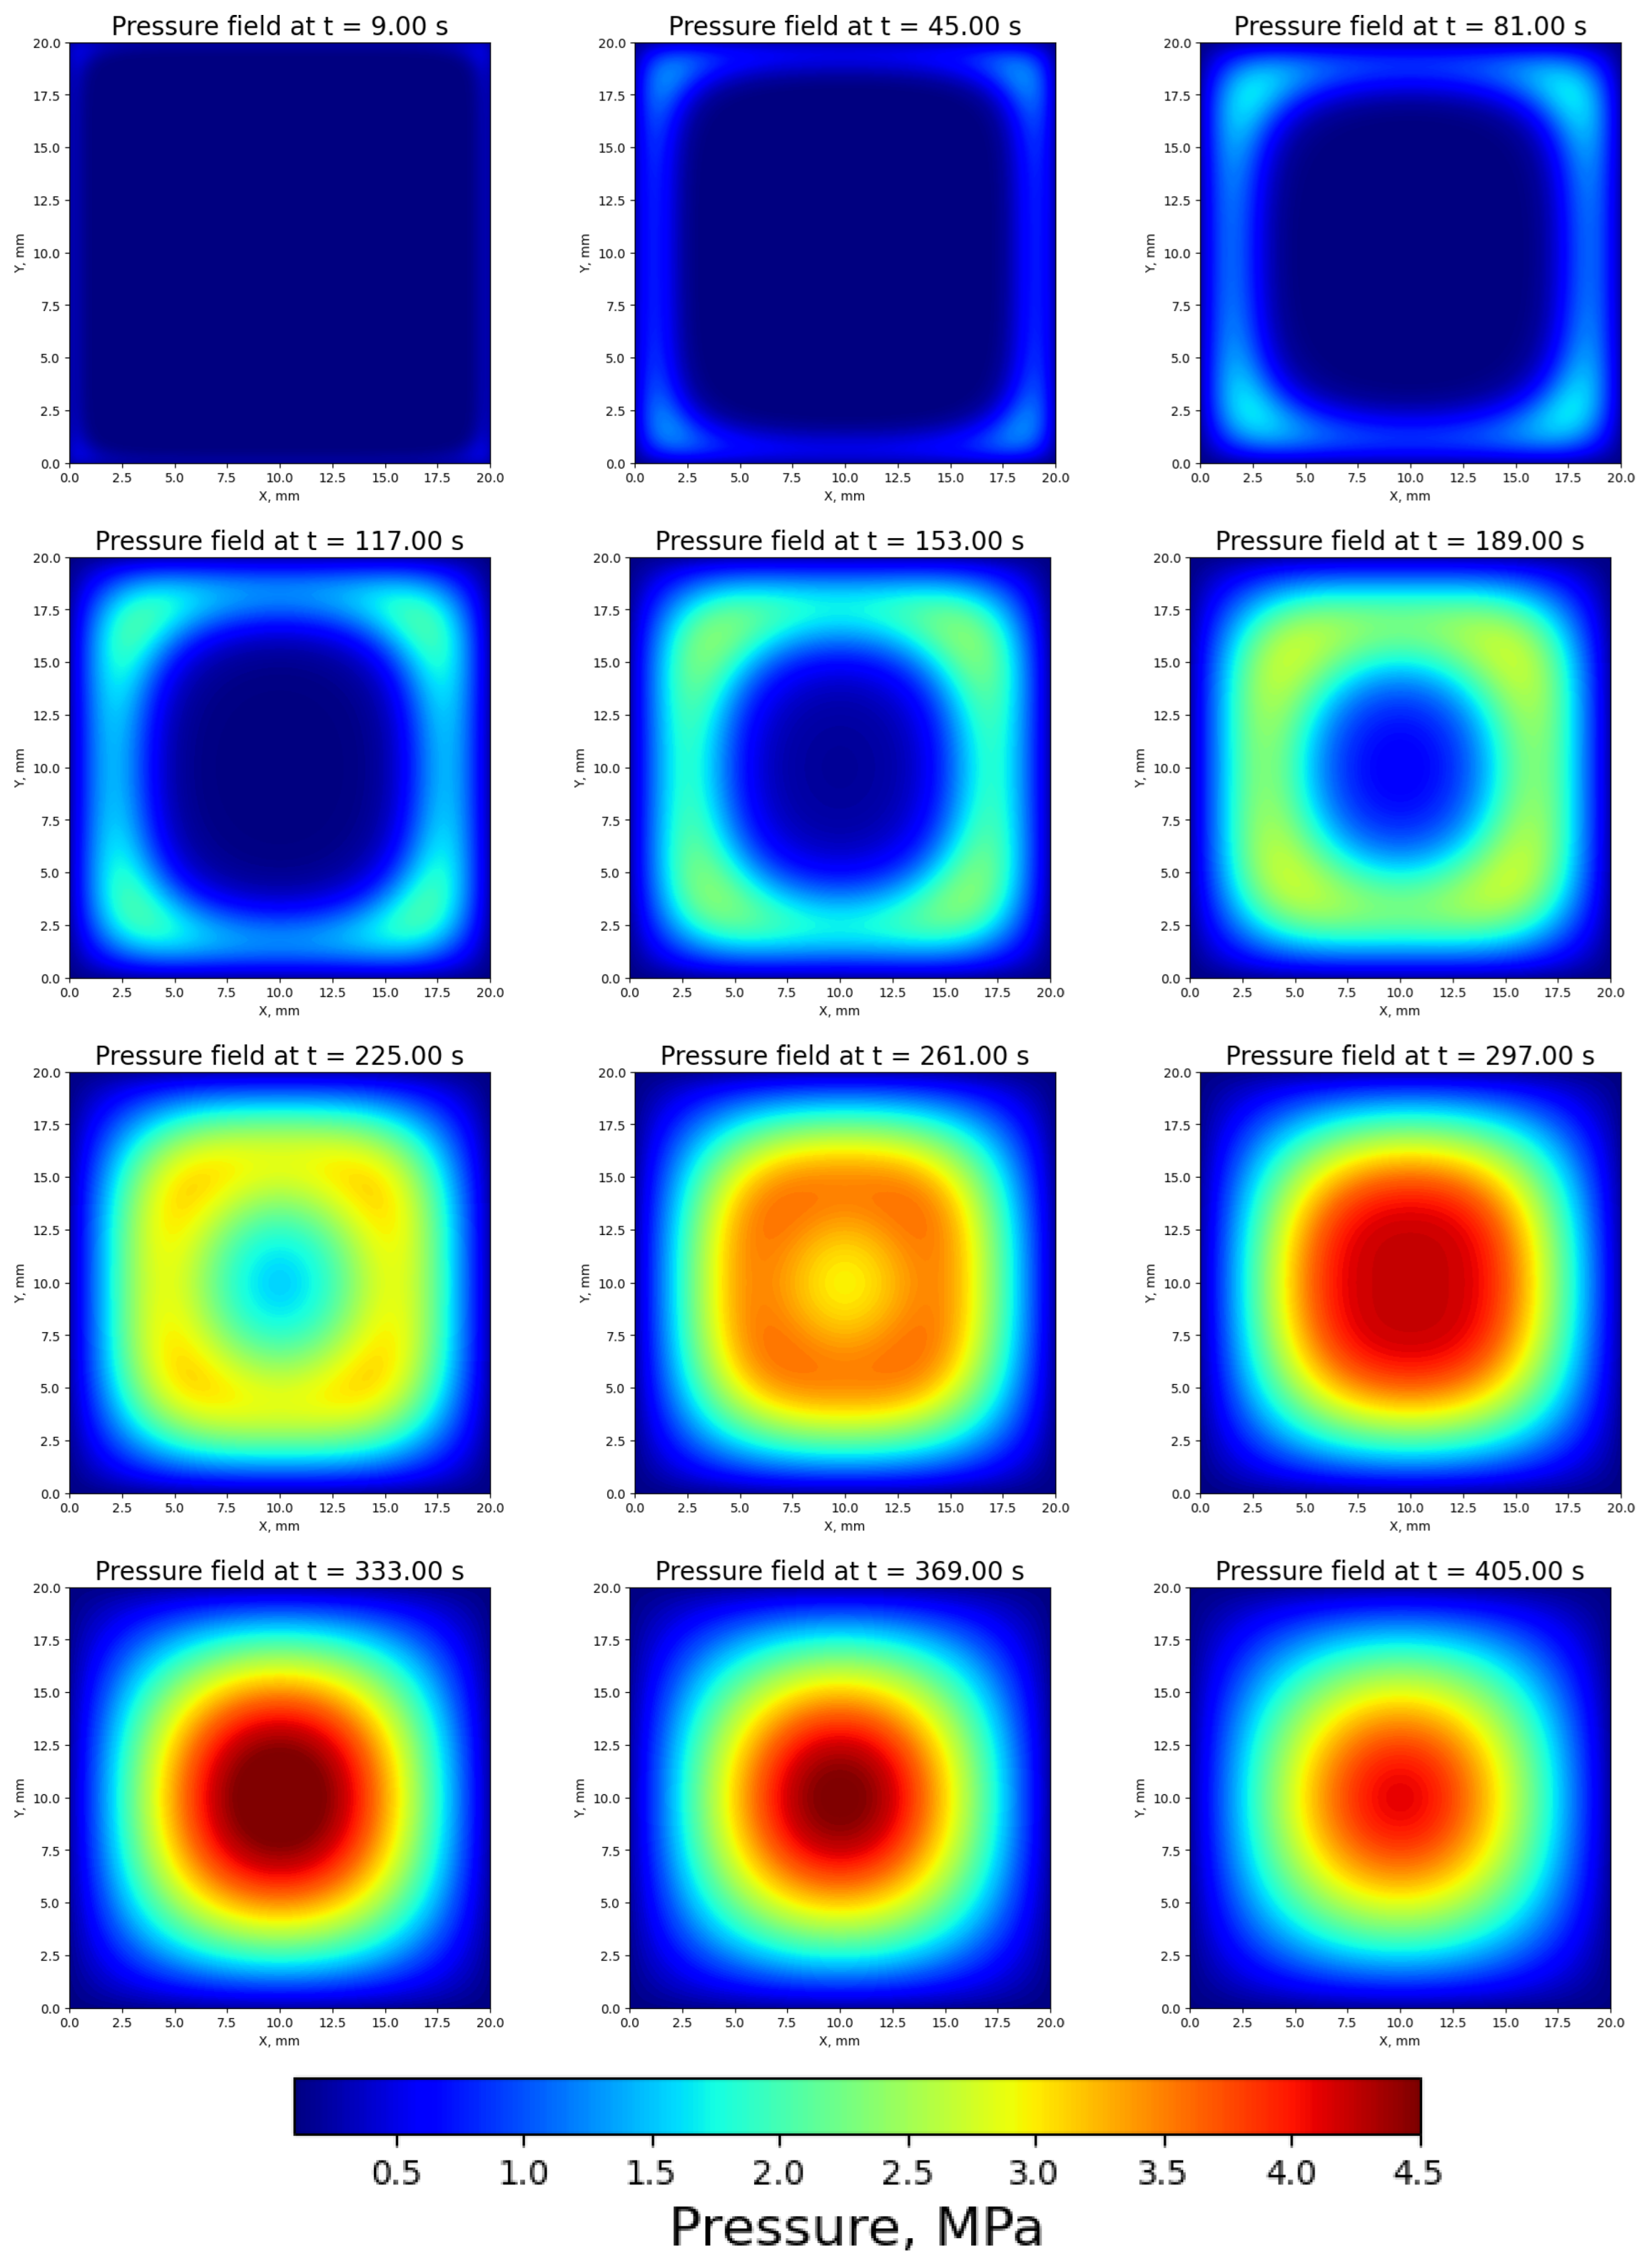
3.3. Pressure Distribution

The pressure distribution, presented in Figure 5, reveals a complex relation between the pyrolysis reactions and the gas dynamics. Pressure increase is caused by the gas released in the pyrolysis reactions. In the beginning of the process, the pressure increases at the edges, consistent with the decomposition shown in the mass loss coefficient distributions. As the reaction progresses, pressure builds up in the center of the particle. However, it decreases back to the initial value once decomposition is complete. Returning to its original value, in contrast to the temperature and normalized mass coefficient, it is possible to observe a “decomposition frontline” in the pressure distribution. The heat transfer occurs inward from the edges, heating the particle, which, in turn, initiates the mass decomposition process as the material undergoes pyrolysis. Following this, the pressure wave, driven by the release of the pyrolysis gases, moves towards the center of the particle. This is clearly visible in the pressure distributions for times from t = 117 s to t = 225 s.
The pressure increases to a maximum of approximately 45 atm at around 300 s—so, right after the decomposition is finished. This seems to be a very high value, but in real-life conditions, thermal stresses in the pyrolysed particle cause macro-fractures, allowing the gas trapped in the wooden structure to be released much faster. Therefore, the real value of the gas permeability may increase locally very rapidly.
The slight visible asymmetry in the pressure distribution further underscores the impact of the wooden layer properties on the pyrolysis process.

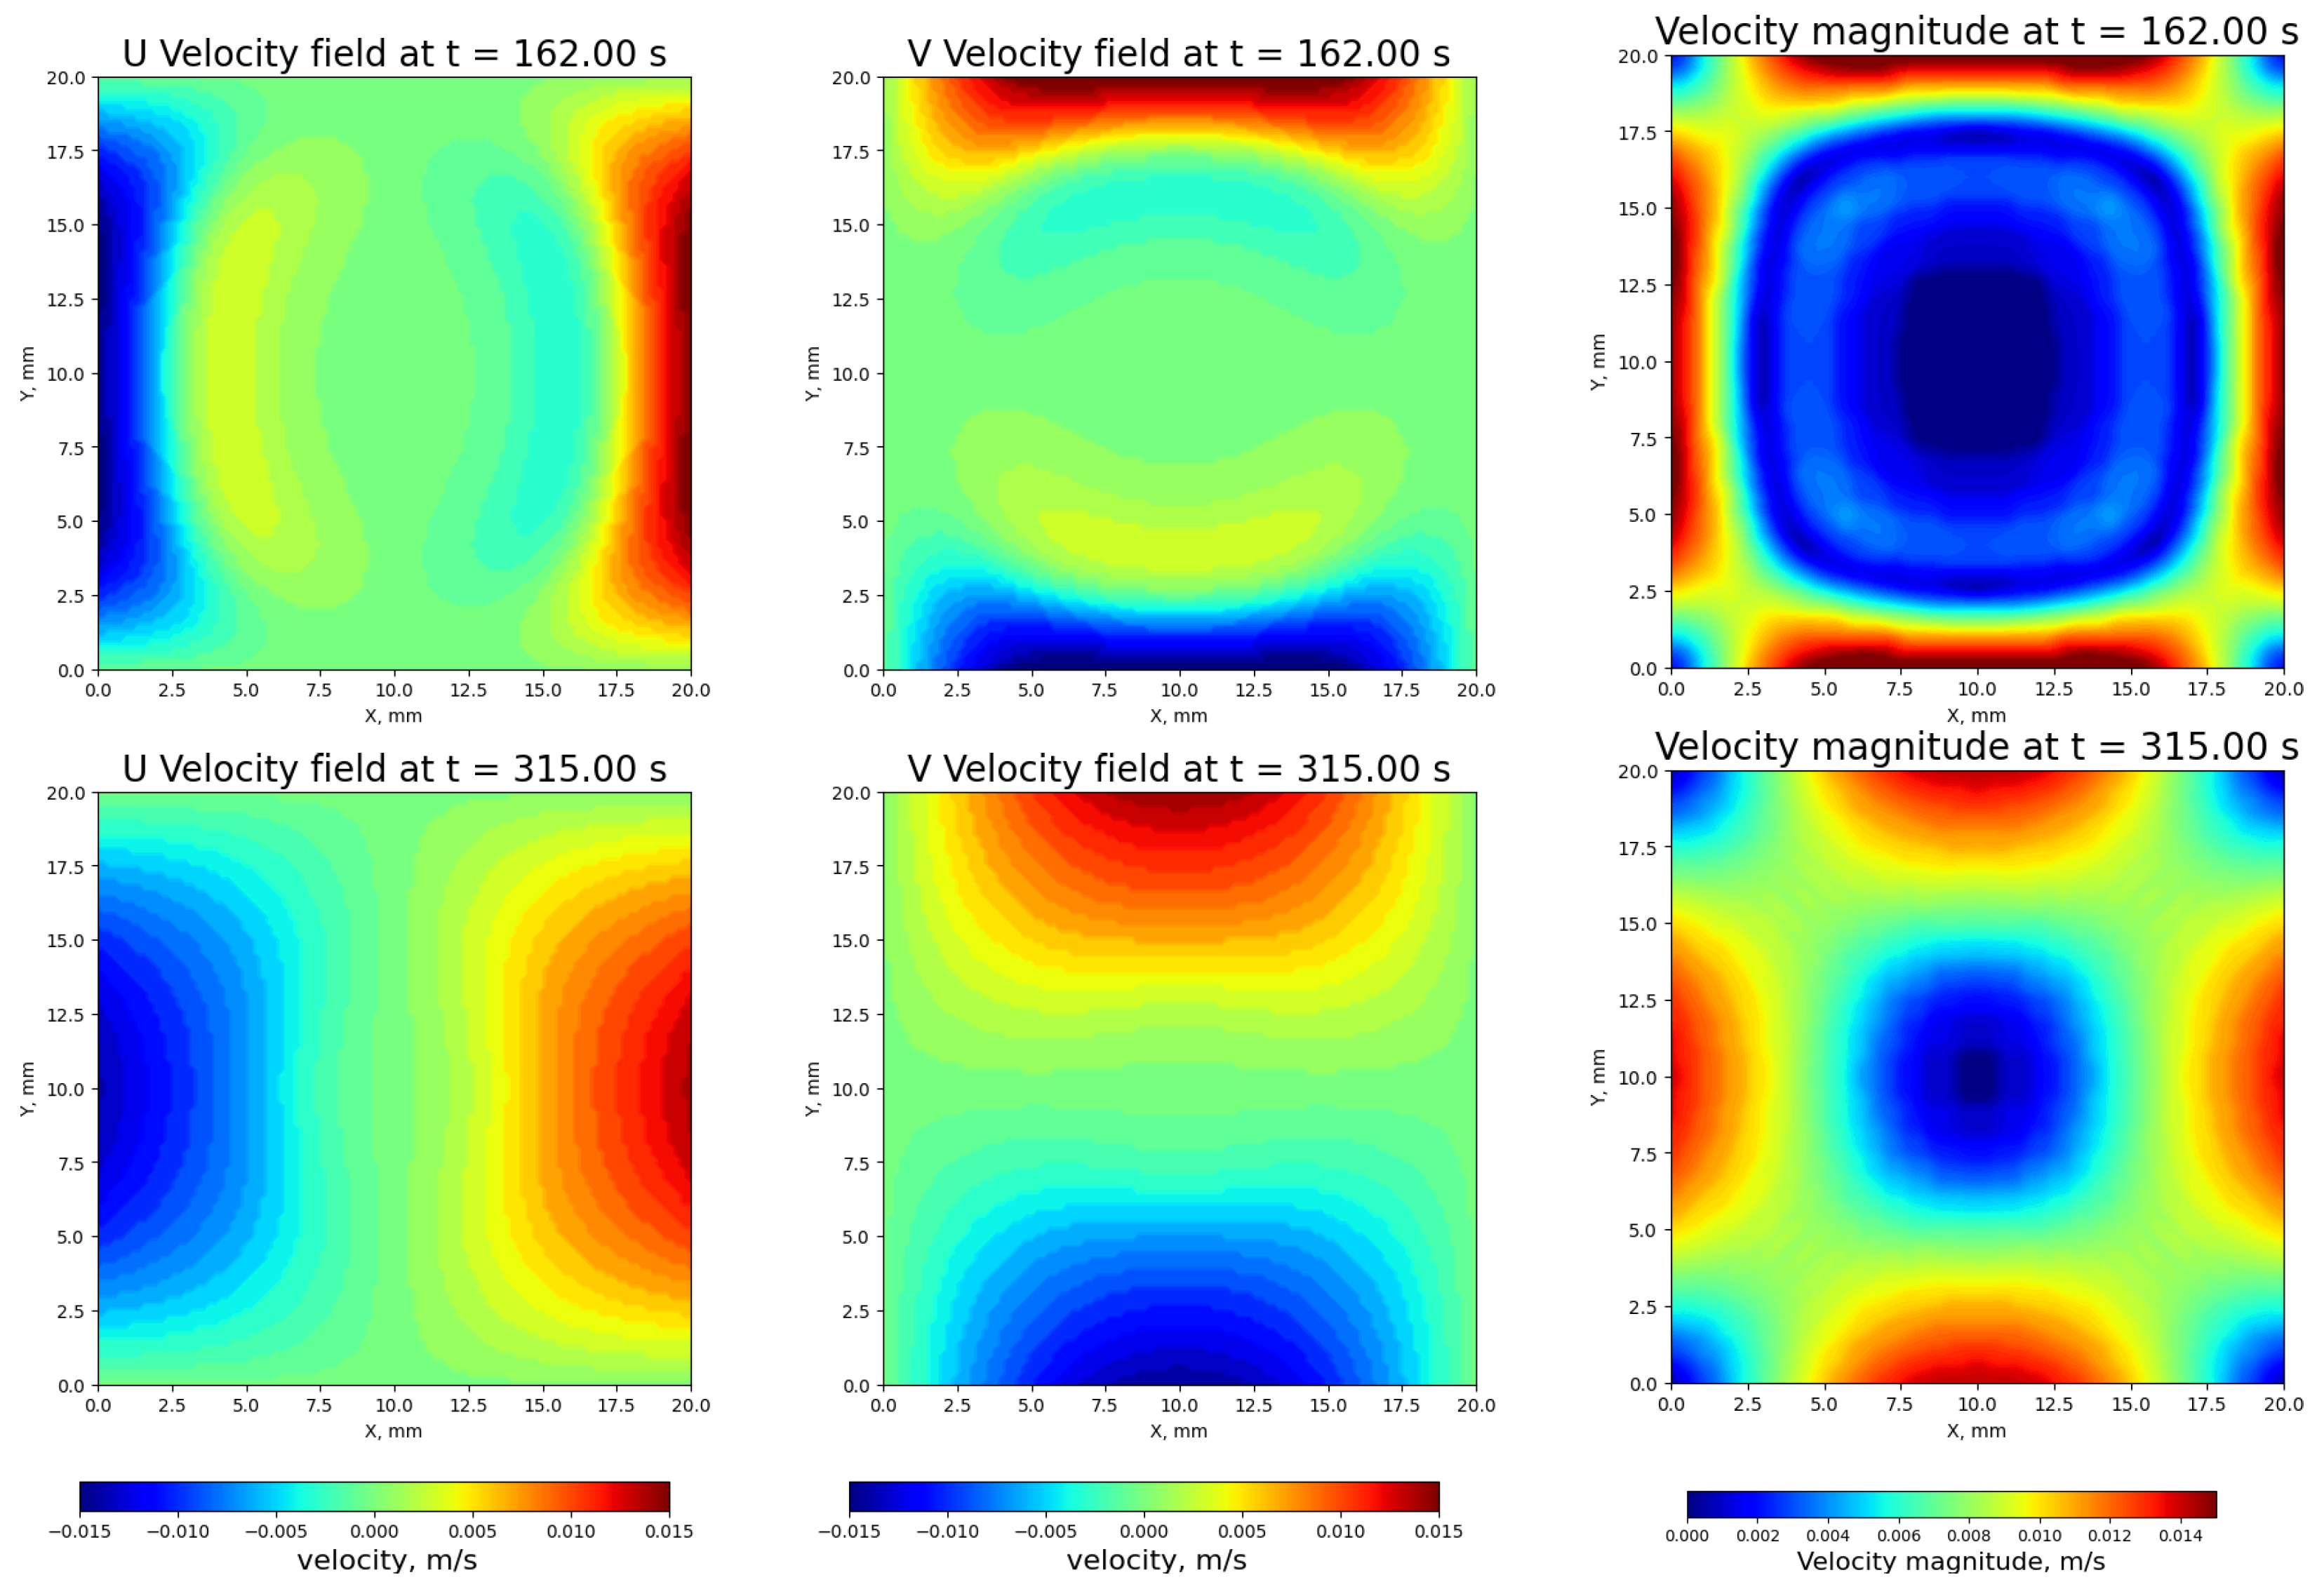
3.4. Velocity Distributions

The velocity components in the x- and y-directions, as well as the velocity vector magnitude, are gathered in Figure 6. The Figure shows the results for two time-steps (t = 162 s and t = 315 s). The left column shows the velocity component on the x-axis u, the center column for the velocity component on the y-axis v, and the right column shows the velocity vector magnitude. Please note that the velocity components are presented in scale from  0.015  to  0.015 m / s , while the velocity vector magnitude is for 0 to  0.015 m / s . The gas movement originates from the particle’s center and flows outward toward the edges, driven by the pressure gradients. The value of the velocity is the highest on the edges of the particle, and the lowest in the center. The maximum values of the velocity vector magnitude are up to 1.5 cm/s. The highest values are observed in the first 200 s of the process, mainly on the edges of the sample, and after the decomposition processes are finished, so after 300 s, the gas starts to slowly move from the center towards the edges to leave the sample. In the whole duration of the process, the velocity of the gas in the central part of the sample is always very low—no higher than 0.2 cm/s. Very similar values were obtained for a biomass sample calculated by Wardach-Święcicka and Kardaś [39].

3.5. Performance

The simulation presented in this study was performed on a personal desktop computer equipped with processor Intel Core i7-9700, 3.00 GHz with 8 cores. However, the calculations were executed using only one core.
For the results presented in this article, the simulation required approximately 15 min to complete. In contrast, comparable 2D simulations of particle systems in the literature often require computation times extending to a couple of hours [57], even when utilizing parallel processing.
As discussed in the Introduction Section, the novelty of this paper lies in the simplicity of the model, its low computational requirements, and the significantly reduced calculation time. The given calculation time supports these claims, showing the model’s ability to balance accuracy and computational efficiency.
Moreover, the model’s simplicity allows for the use of coarser meshes. This is important, particularly for simulations of large-scale systems with particle beds, where each particle is simulated separately. Reducing the mesh size in these scenarios can further decrease the computation time, making the presented method highly adaptable for modeling large installations.

4. Conclusions

This study presented a numerical model of wood particle pyrolysis, including the key physical and chemical processes occurring during the thermal decomposition of biomass. The results provide valuable insights into the dynamics of pyrolysis at the particle scale. The simulation revealed significant temperature gradients in the 2 cm wooden particle during pyrolysis. It showed that heat transfer plays a crucial role in determining the reaction rate. The results enable the inference that for larger wooden particles undergoing pyrolysis, the differences in temperature in the sample at the beginning stages of the process were so significant that while the external walls of the sample were undecomposed, the center of the sample did not reach the temperature of decomposition. The mass loss of the particle was found to occur correspondingly to the temperature increase in the particle, with a final value of 0.17. This means that at the end of the process, 17% of the mass from the initial mass of the sample is left. The pyrolysis gas pressure exhibited local increases of up to 4.5 MPa, driven by the release of volatile compounds during the decomposition processes. The pressure results, however, should be treated more qualitatively than quantitatively, as explained in the Results Section. The value of the velocity of the gas phase amounted to up to 1.5 cm/s, which is consistent with the data obtained by other groups working on numerical simulations of pyrolysis [39,40].
The presented results emphasize the importance of considering material heterogeneity in pyrolysis simulations. The inclusion of wooden layers affects the heat transfer, and therefore the decomposition dynamics. This was visible in the asymmetrical distributions of the temperature and mass values. Moreover, the described results show a sequential progression of distinct phenomena: heat transfer, followed by mass decomposition, and finally, a pressure wave caused by the produced pyrolysis gas.
The model successfully captured the interdependence of the temperature, mass loss, gas pressure, and gas velocity, emphasizing the complexity of the coupled transport and reaction phenomena during pyrolysis. These findings contribute to a deeper understanding of the pyrolysis behavior of wooden particles and provide a simple model, imposing low computing demand, that enables very rapid simulation of the pyrolysis process. The model can serve as a foundation for optimizing biomass conversion processes modeling. Due to its simplicity, rapid computation capabilities, and adaptability, the proposed method is particularly well suited for particle modeling in large-scale installation simulations. This efficiency makes it a valuable tool for optimization in simulations of industrial applications.

Author Contributions

Conceptualization, D.K.; software, P.H., M.J., A.O. and D.K.; validation, P.H.; writing—original draft preparation, P.H. and A.O.; writing—review and editing, P.H. and D.K.; data curation, P.H. and M.J.; visualization, P.H.; supervision, D.K. All authors have read and agreed to the published version of the manuscript.

Funding

This research received no external funding.

Institutional Review Board Statement

Not applicable.

Informed Consent Statement

Not applicable.

Data Availability Statement

The data presented in this study are available on request from the corresponding author due to privacy and licensing reasons.

Conflicts of Interest

The authors declare no conflicts of interest.

References

  1. Azeta, O.; Ayeni, A.O.; Agboola, O.; Elehinafe, F.B. A review on the sustainable energy generation from the pyrolysis of coconut biomass. Sci. Afr. 2021, 13, e00909. [Google Scholar] [CrossRef]
  2. Elfaki, H.; Hemachandra, N.; Stockinger, G.; Al-Sharshani, A.; Solim, S.; Al-Mohannadi, D.M. Sustainable Valorization of Oil and Gas Industry Biosolids: Optimal Reuse Pathways. Sustainability 2024, 16, 9738. [Google Scholar] [CrossRef]
  3. The European Green Deal—Commission.Europa.eu. Available online: https://commission.europa.eu/strategy-and-policy/priorities-2019-2024/european-green-deal_en (accessed on 29 October 2024).
  4. Lenz, V.; Szarka, N.; Jordan, M.; Thrän, D. Status and perspectives of biomass use for industrial process heat for industrialized countries. Chem. Eng. Technol. 2020, 43, 1469–1484. [Google Scholar] [CrossRef]
  5. Ganesh, A.; Banerjee, R. Biomass pyrolysis for power generation—A potential technology. Renew. Energy 2001, 22, 9–14. [Google Scholar] [CrossRef]
  6. Mousa, E.; Wang, C.; Riesbeck, J.; Larsson, M. Biomass applications in iron and steel industry: An overview of challenges and opportunities. Renew. Sustain. Energy Rev. 2016, 65, 1247–1266. [Google Scholar] [CrossRef]
  7. Kusuma, R.T.; Hiremath, R.B.; Rajesh, P.; Kumar, B.; Renukappa, S. Sustainable transition towards biomass-based cement industry: A review. Renew. Sustain. Energy Rev. 2022, 163, 112503. [Google Scholar] [CrossRef]
  8. Prasanth, S.; Kumar, P.S.; Harish, S.; Rishikesh, M.; Nanda, S.; Vo, D.V.N. Application of biomass derived products in mid-size automotive industries: A review. Chemosphere 2021, 280, 130723. [Google Scholar] [CrossRef] [PubMed]
  9. Ireson, R.; Stewart, B.; García, P.G.; Isaac, D.; Backhouse, D.; Toperesu, M.; Ledger, J.; Fuller, A. Renewable Waste-Derived Fuels for Glass and Ceramics Manufacturing: Feasibility Study Final Report; Technical Report; Glass Futures: Saint Helens, UK, 2023. [Google Scholar]
  10. Punnarapong, P.; Promwungkwa, A.; Tippayawong, N. Development and performance evaluation of a biomass gasification system for ceramic firing process. Energy Procedia 2017, 110, 53–58. [Google Scholar] [CrossRef]
  11. Basu, P. Biomass Gasification and Pyrolysis: Practical Design and Theory; Academic Press: Cambridge, MA, USA, 2010. [Google Scholar]
  12. Igliński, B.; Kujawski, W.; Kiełkowska, U. Pyrolysis of Waste Biomass: Technical and Process Achievements, and Future Development—A Review. Energies 2023, 16, 1829. [Google Scholar] [CrossRef]
  13. Gupta, G.K.; Mondal, M.K. Chapter 14 - Pyrolysis: An alternative approach for utilization of biomass into bioenergy generation. In Biofuels and Bioenergy; Gurunathan, B., Sahadevan, R., Zakaria, Z.A., Eds.; Elsevier: Amsterdam, The Netherlands, 2022; pp. 279–300. [Google Scholar] [CrossRef]
  14. Zhu, J.; Guo, Y.; Chen, N.; Chen, B. A Review of the Efficient and Thermal Utilization of Biomass Waste. Sustainability 2024, 16, 9506. [Google Scholar] [CrossRef]
  15. Jahirul, M.I.; Rasul, M.G.; Chowdhury, A.A.; Ashwath, N. Biofuels Production through Biomass Pyrolysis—A Technological Review. Energies 2012, 5, 4952–5001. [Google Scholar] [CrossRef]
  16. Mohanty, A.; Ajmera, S.; Chinnam, S.; Kumar, V.; Mishra, R.K.; Acharya, B. Pyrolysis of waste oils for biofuel production: An economic and life cycle assessment. Fuel Commun. 2024, 18, 100108. [Google Scholar] [CrossRef]
  17. Yu, J.; Liu, X.; Millan, M. A study on pyrolysis of wood of different sizes at various temperatures and pressures. Fuel 2023, 342, 127846. [Google Scholar] [CrossRef]
  18. Banagiri, S.; Parameswaran, M.; Khadakkar, I.; Meadows, J.; Lattimer, B.Y. A reduced wood pyrolysis mechanism for evaluating solid and gas phase parameters. Fuel 2025, 381, 133416. [Google Scholar] [CrossRef]
  19. Dhaundiyal, A.; Singh, S.B. Optimisation of the performance of a pyrolysis reactor for G50 chips. Arch. Thermodyn. 2020, 41, 245–263. [Google Scholar] [CrossRef]
  20. Plavniece, A.; Dobele, G.; Volperts, A.; Zhurinsh, A. Hydrothermal carbonization vs. Pyrolysis: Effect on the porosity of the activated carbon materials. Sustainability 2022, 14, 15982. [Google Scholar] [CrossRef]
  21. Kumar Mishra, R.; Singh, B.; Acharya, B. A comprehensive review on activated carbon from pyrolysis of lignocellulosic biomass: An application for energy and the environment. Carbon Resour. Convers. 2024, 7, 100228. [Google Scholar] [CrossRef]
  22. Rodier, L.; Bilba, K.; Onésippe, C.; Arsène, M.A. Utilization of bio-chars from sugarcane bagasse pyrolysis in cement-based composites. Ind. Crop. Prod. 2019, 141, 111731. [Google Scholar] [CrossRef]
  23. Kizinievic, O.; Kizinievic, V. Utilisation of wood ash from biomass for the production of ceramic products. Constr. Build. Mater. 2016, 127, 264–273. [Google Scholar] [CrossRef]
  24. Liu, Z.; Tian, F.; An, X.; Wu, Z.; Li, T.; Yang, Q. Microwave co-pyrolysis of biomass, phosphorus, and magnesium for the preparation of biochar-based fertilizer: Fast synthesis, regulable structure, and graded-release. J. Environ. Chem. Eng. 2021, 9, 106456. [Google Scholar] [CrossRef]
  25. Gokelma, M.; Diaz, F.; Çapkın, I.Y.; Friedrich, B. A Viability Study of Thermal Pre-Treatment for Recycling of Pharmaceutical Blisters. Sustainability 2024, 16, 8968. [Google Scholar] [CrossRef]
  26. Niu, Y.; Pan, F.; Shen, K.; Yang, X.; Niu, S.; Xu, X.; Zhou, H.; Fu, Q.; Li, X. Status and Enhancement Techniques of Plastic Waste Degradation in the Environment: A Review. Sustainability 2024, 16, 9395. [Google Scholar] [CrossRef]
  27. Rodríguez-Grau, G.; Cordonnier, P.L.; Navarrete, B.; Montero, C.; Alvarado, C.; Pommier, R.; Rosales, V.; Galarce, C. The adhesion performance in green-glued finger joints using different wood ring orientations. Sustainability 2024, 16, 7158. [Google Scholar] [CrossRef]
  28. Grønli, M. Theoretical and Experimental Study of the Thermal Degradation of Biomass. Ph.D. Thesis, Norwegian University of Science and Technology, Trondheim, Norway, 1996. [Google Scholar]
  29. Hameed, S.; Sharma, A.; Pareek, V.; Wu, H.; Yu, Y. A review on biomass pyrolysis models: Kinetic, network and mechanistic models. Biomass Bioenergy 2019, 123, 104–122. [Google Scholar] [CrossRef]
  30. Vikram, S.; Rosha, P.; Kumar, S. Recent Modeling Approaches to Biomass Pyrolysis: A Review. Energy Fuels 2021, 35, 7406–7433. [Google Scholar] [CrossRef]
  31. Xia, C.; Cai, L.; Zhang, H.; Zuo, L.; Shi, S.Q.; Lam, S.S. A review on the modeling and validation of biomass pyrolysis with a focus on product yield and composition. Biofuel Res. J. 2021, 8, 1296–1315. [Google Scholar] [CrossRef]
  32. Seo, D.K.; Park, S.S.; Hwang, J.; Yu, T.U. Study of the pyrolysis of biomass using thermo-gravimetric analysis (TGA) and concentration measurements of the evolved species. J. Anal. Appl. Pyrolysis 2010, 89, 66–73. [Google Scholar] [CrossRef]
  33. Fischer, O.; Lemaire, R.; Bensakhria, A. Thermogravimetric analysis and kinetic modeling of the pyrolysis of different biomass types by means of model-fitting, model-free and network modeling approaches. J. Therm. Anal. Calorim. 2024, 149, 10941–10963. [Google Scholar] [CrossRef] [PubMed]
  34. Wang, W.; Lemaire, R.; Bensakhria, A.; Luart, D. Thermogravimetric analysis and kinetic modeling of the co-pyrolysis of a bituminous coal and poplar wood. Chin. J. Chem. Eng. 2023, 58, 53–68. [Google Scholar] [CrossRef]
  35. Lin, Y.; Cho, J.; Davis, J.M.; Huber, G.W. Reaction-transport model for the pyrolysis of shrinking cellulose particles. Chem. Eng. Sci. 2012, 74, 160–171. [Google Scholar] [CrossRef]
  36. Bates, R.B.; Ghoniem, A.F. Modeling kinetics-transport interactions during biomass torrefaction: The effects of temperature, particle size, and moisture content. Fuel 2014, 137, 216–229. [Google Scholar] [CrossRef]
  37. Kardaś, D.; Hercel, P.; Wardach-Święcicka, I.; Polesek-Karczewska, S. On the kinetic rate of biomass particle decomposition - Experimental and numerical analysis. Energy 2021, 219, 119575. [Google Scholar] [CrossRef]
  38. Assoumani, N.; Simo-Tagne, M.; Kifani-Sahban, F.; Tagne Tagne, A.; El Marouani, M.; Obounou Akong, M.B.; Rogaume, Y.; Girods, P.; Zoulalian, A. Numerical study of cylindrical tropical woods pyrolysis using Python tool. Sustainability 2021, 13, 13892. [Google Scholar] [CrossRef]
  39. Wardach-Święcicka, I.; Kardaś, D. Modeling of heat and mass transfer during thermal decomposition of a single solid fuel particle. Arch. Thermodyn. 2013, 34, 53–71. [Google Scholar] [CrossRef]
  40. Wardach-Święcicka, I.; Kardaś, D. Modelling thermal behaviour of a single solid particle pyrolysing in a hot gas flow. Energy 2021, 221, 119802. [Google Scholar] [CrossRef]
  41. Postrzednik, S. Heat of solid fuel pyrolysis—Determination method, basic properties, in Polish. Karbo-Energochemia-Ekologia 1994, 9, 220. [Google Scholar]
  42. Wardach-Świȩcicka, I. Modelling of Physico-Chemical Processes in a Single Solid Fuel Particle in a Stream of Hot Gases. Ph.D. Thesis, Institute of Fluid-Flow Machinery, Polish Academy of Sciences, Gdańsk, Poland, 2016. (In Polish). [Google Scholar]
  43. Wagenaar, B.; Prins, W.; van Swaaij, W. Flash pyrolysis kinetics of pine wood. Fuel Process. Technol. 1993, 36, 291–298. [Google Scholar] [CrossRef]
  44. Muvhiiwa, R.F.; Sempuga, B.; Hildebrandt, D.; Van Der Walt, J. Study of the effects of temperature on syngas composition from pyrolysis of wood pellets using a nitrogen plasma torch reactor. J. Anal. Appl. Pyrolysis 2018, 130, 159–168. [Google Scholar] [CrossRef]
  45. Park, J.S.; Lee, J.J. Fire resistance of light-framed wood floors exposed to real and standard fire. J. Fire Sci. 2004, 22, 449–471. [Google Scholar] [CrossRef]
  46. Gupta, M. Density of softwood bark and softwood char: Procedural calibration and measurement by water soaking and kerosene immersion method. Fuel 2002, 81, 1379–1384. [Google Scholar] [CrossRef]
  47. Gupta, M.; Yang, J.; Roy, C. Specific heat and thermal conductivity of softwood bark and softwood char particles. Fuel 2003, 82, 919–927. [Google Scholar] [CrossRef]
  48. Ronewicz, K.; Kardaś, D. Experimental and Theoretical Investigation over the Wood Permeability to Air as a Function of Pyrolysis Temperature. Appl. Mech. Mater. 2016, 831, 295–305. [Google Scholar] [CrossRef]
  49. Gases—Densities—Engineeringtoolbox.com. Available online: https://www.engineeringtoolbox.com/gas-density-d_158.html (accessed on 14 November 2024).
  50. Gases—Dynamic Viscosities—engineeringtoolbox.com. Available online: https://www.engineeringtoolbox.com/gases-absolute-dynamic-viscosity-d_1888.html (accessed on 13 November 2024).
  51. Plötze, M.; Niemz, P. Porosity and pore size distribution of different wood types as determined by mercury intrusion porosimetry. Eur. J. Wood Wood Prod. 2011, 69, 649–657. [Google Scholar] [CrossRef]
  52. Sadhukhan, A.K.; Gupta, P.; Saha, R.K. Modelling of pyrolysis of large wood particles. Bioresour. Technol. 2009, 100, 3134–3139. [Google Scholar] [CrossRef] [PubMed]
  53. Kazimierski, P.; Januszewicz, K.; Hercel, P.; Kardaś, D. Experimental and numerical analysis of the pyrolysis dynamics of a single wood particle: Presentation of the radiographic technique. Wood Sci. Technol. 2023, 57, 1157–1173. [Google Scholar] [CrossRef]
  54. Handiso, B.; Pääkkönen, T.; Wilson, B.P. Effect of pyrolysis temperature on the physical and chemical characteristics of pine wood biochar. Waste Manag. Bull. 2024, 2, 281–287. [Google Scholar] [CrossRef]
  55. Soria-Verdugo, A.; Cano-Pleite, E.; Passalacqua, A.; Fox, R.O. Effect of particle shape on biomass pyrolysis in a bubbling fluidized bed. Fuel 2023, 339, 127365. [Google Scholar] [CrossRef]
  56. Kazimierski, P.; Wardach-Święcicka, I.; Tiutiurski, P.; Kardaś, D. Pyrolysis analysis of a single wood particle. Inżynieria Apar. Chem. 2017, 6, 202–204. (In Polish) [Google Scholar]
  57. Hoang, N.Q.; Vanierschot, M.; Croymans, T.; Pittoors, R.; Van Caneghem, J. A two-dimensional pyrolysis model for thermally thick particles. In Proceedings of the 12th European Conference on Industrial Furnaces and Boilers, INFUB, Porto, Portugal, 14–17 April 2021. [Google Scholar]
Figure 1. Geometry of the wooden sample and fibers orientation.
Sustainability 17 00279 g001
Figure 2. Generated mesh.
Sustainability 17 00279 g002
Figure 3. Temperature distribution over time.
Sustainability 17 00279 g003
Figure 4. Normalized mass distribution over time.
Sustainability 17 00279 g004
Figure 5. Pressure distribution over time.
Sustainability 17 00279 g005
Figure 6. Velocity vector components and velocity magnitude distribution over time.
Sustainability 17 00279 g006
Disclaimer/Publisher’s Note: The statements, opinions and data contained in all publications are solely those of the individual author(s) and contributor(s) and not of MDPI and/or the editor(s). MDPI and/or the editor(s) disclaim responsibility for any injury to people or property resulting from any ideas, methods, instructions or products referred to in the content.

