Article

Sources and Application Modes of Phosphorus in a No-Till Wheat–Soybean Cropping System

by
Vanderson M. Duart
1,
Victor G. Finkler
1 and
Eduardo F. Caires
2,*
1
Soil Fertility Laboratory, Ponta Grossa State University, Ponta Grossa 84030-900, Parana, Brazil
2
Department of Soil Science and Agricultural Engineering, Ponta Grossa State University, Ponta Grossa 84030-900, Parana, Brazil
*
Author to whom correspondence should be addressed.
Sustainability 2025, 17(1), 268; https://doi.org/10.3390/su17010268
Submission received: 9 December 2024 / Revised: 20 December 2024 / Accepted: 27 December 2024 / Published: 2 January 2025

Abstract

:
Phosphate fertilization management under no-till farming has important implications for sustainable agriculture, especially in highly weathered soils. A field experiment examined the effects of phosphorus (P) sources and application modes on soil P levels, plant P nutrition, and grain yields of a wheat–soybean cropping system under no-till. Five cycles of a wheat–soybean crop succession were evaluated on an Oxisol in the period from 2016 to 2021 in the State of Parana, Brazil. The treatments consisted of fertilization with monoammonium phosphate (MAP) and single superphosphate (SSP), in addition to a control without P, to subplots within plots with in-furrow and broadcast P applications. The annual application of 100 kg of P2O5 ha−1 from phosphate sources, either broadcast or in the sowing furrow, was sufficient to maintain an adequate level of P in the soil, supply P demand for the secession of wheat–soybean crops, and obtain high grain yields. In a wheat–soybean cropping system, the application of the fertilizers MAP or SSP-based phosphates in the sowing furrow or broadcast in wheat crop is a strategy that should be encouraged in highly weathered soils under no-till to minimize P fixation to soil particles, improve P-leaf concentration, and increase wheat and soybean grain yields.

1. Introduction

No-till farming systems have stood out as one of the most effective strategies to improve the sustainability of agriculture by improving erosion control, soil water storage, and soil quality [1,2,3]. No-till systems have gathered momentum in world agriculture in the face of a new paradigm of “sustainable production intensification” [4]. Brazil is a leading country in South America regarding the cultivated area under no-till—currently estimated at some 35 Mha. Because continuous no-till systems increase the organic matter content via increased plant residue deposition and decreased soil disturbance [5], the importance of this cropping system is even greater for highly weathered soils such as Oxisols and Ultisols which predominate in Brazil.
Phosphorus (P) is the most widely used nutrient in plant fertilization in tropical and subtropical soils [6]. This is mainly due to the high P adsorption capacity of highly weathered soils in these regions [7,8]. In Brazil, P consumption via phosphate fertilizers jumped from 1.2 million tons in 2002 to 2.5 million tons in 2022 [9]. Therefore, high amounts of phosphate fertilizers have been needed in Brazilian agriculture to ensure constant increases in crop yields. Because the life span of phosphate rock reserves globally is an uncertainty that causes great concern [10], the proper management of phosphate fertilization is extremely relevant for food security and sustainable agriculture.
In order to improve the efficiency of P use, good management practices in no-till systems involving the 4R concept of fertilization (right dose, right source, right time, and right place) have been recommended [11,12]. The phosphate fertilization strategy is based on raising the soil P concentration above the critical level and then supplying P through fertilization according to the export of P by crops. The most commonly used P sources in Brazilian agriculture are the fully acidulated fertilizers single superphosphate (SSP) and monoammonium phosphate (MAP). The efficiency of phosphate fertilizer application modes has been questioned in several regions of Brazil. Although the broadcast application of phosphate fertilizers increases the operational efficiency of sowing [7,13], the P uptake by plants may become less efficient with broadcast fertilization than in the sowing furrow [14]. Since long-term studies on P application modes in no-till systems are scarce, this work becomes essential to provide practical information with scientific support. In addition, the uncertainties and the underlying risks prevailing due to the improper use of phosphate resources denote that sustainable soil P management should be set amongst the top priorities in a global level [15,16].
A no-till wheat–soybean cropping system is the most widely adopted by farmers in Southern Brazil. Wheat is one of the most important crops for maintaining food security [17] and soybean is among the most important crops in agribusiness worldwide [18]. In this study, we examined the effects of P sources and application modes on topsoil P levels, plant P nutrition, and grain yield of wheat and soybean during five cycles of a no-till wheat–soybean cropping system. Because P fixation may decrease under no-till soils and the surface-broadcast fertilizers increase the soil’s readily available P down to the 0–10 cm depth, and less-available P, both organic and inorganic, in the soil profile [19], we hypothesized that P fertilization efficiency using fully acidulated fertilizers (MAP and SSP) in a no-till Oxisol with high P concentration does not change with the application mode, either by broadcasting or in-furrow.

2. Materials and Methods

2.1. Site Description and Soil

The experiment was carried out at the “Capão da Onça” Farm School of the State University of Ponta Grossa, in the Center-South region of Parana, Brazil (25°05′35″ S, 50°02′49″ W), on an Oxisol (a loamy, kaolinitic, thermic Typic Hapludox) under no-till. According to the Köppen–Geiger System [20], the climate at the site is classified as a Cfb type (mesothermal, humid, and subtropical), with a mild summer and frequent frosts during the winter, with no defined dry season.
Soil samples were taken in May 2016, before the establishment of the experiment, for chemical and particle-size distribution analyses. To obtain a composite sample, 20 soil cores were sampled at 0–10 and 10–20 cm depths throughout the experimental area using a soil probe. The collected soil samples were air-dried and ground in order to pass through a 2 mm sieve. The soil pH was determined in a 0.01 mol L−1 CaCl2 suspension (1:2.5 soil/solution, v/v). The total acidity pH 7.0 (H + Al) was determined by a SMP buffer procedure [21]. Organic carbon was determined by the wet oxidation method [22]. Extractable P and exchangeable K+ were extracted by a Mehlich-1 solution (0.05 mol L−1 H2SO4 + 0.05 mol L−1 HCl), and exchangeable Al3+, Ca2+, and Mg2+ were extracted with a neutral 1 mol L−1 KCl solution, in a 1:10 (v/v) soil/solution ratio [21]. Phosphorus was determined by UV–visible spectrophotometry, and K+ by flame photometry. Exchangeable Al3+ (KCl-exchangeable acidity) was determined by titration with a 0.025 mol L−1 NaOH solution, and Ca2+ and Mg2+ were titrated with a 0.025 mol L−1 ethylenediaminetetraacetic (EDTA) solution. Extractable SO4–S was extracted with a 0.01 mol L−1 calcium phosphate [Ca(H2PO4)2] in a 1:2.5 (v/v) soil/solution ratio, and later determined by the turbidimetric method [23]. The effective cation exchange capacity (ECEC) was calculated by the summation of exchangeable cations (Al3+ + Ca2+ + Mg2+ + K+), and the cation exchange capacity (CEC) pH 7.0 by the summation of Ca2+ + Mg2+ + K+ + total acidity (H + Al). The base saturation was calculated by 100 (Ca2+ + Mg2+ + K+/CEC pH 7.0). The Al3+ saturation was calculated by 100 Al3+/ECEC. The particle size distribution (clay, silt, and sandy) was determined by the densimeter method [24].

2.2. Experimental Design and Treatments

A randomized complete block design was used, with four replications in a split-plot arrangement. The plot size was 45 by 6 m and the subplot size was 15 by 6 m. The treatments consisted of the fertilization with MAP (11% N and 52% P2O5) and SSP (3% N, 17% P2O5, and 11% S), in addition to a control without P, to subplots within plots with in-furrow and broadcast P applications. Five cycles of a wheat–soybean cropping system were conducted. For each wheat–soybean cycle, a rate of 100 kg ha−1 of P2O5 was applied at the time of wheat sowing. This rate of P2O5 applied was calculated based on the export of P by crops aiming to obtain high yields of wheat and soybean. Phosphate fertilizers in the sowing furrow were applied in a mechanized way using a no-till seeder, placing the fertilizers beside and below the seeds. When phosphate fertilizers were applied by broadcast, the application was done manually to the soil surface at the time of wheat sowing. To balance the amount of S added with the SSP application, the MAP treatment received 65 kg S ha−1 as elemental S annually broadcast on the soil surface at the time of wheat sowing.

2.3. Crop Management

The experiment was performed from 2016 to 2021 using a wheat (Triticum aestivum L.)–soybean [Glycine max (L.) Merrill] cropping system. Wheat was grown in the autumn–winter season and soybean in the spring–summer season. Table 1 shows more details about the crops and fertilization used throughout the experiment period. Wheat was sown at a rate of 150 kg ha−1 of seeds and row spacing of 0.17 m. Because of the composition of phosphate fertilizers, N was applied annually at the time of wheat sowing at a rate of 21 kg N ha−1 via MAP and 18 kg N ha−1 via SSP. For wheat crops, N was also applied as urea topdressing at rates of 60 kg N ha−1 at the beginning of tillering and 40 kg ha−1 at the end of booting. Soybean inoculated with Bradyrhizobium japonicum was sown at a rate of 14 seeds m−1 and row spacing of 0.45 m, without fertilization with N and P. Potassium chloride (KCl) was broadcast to the soil surface at a rate of 84 kg K2O ha−1 immediately after each wheat and soybean sowing. A phytosanitary management of wheat (Table 2) and soybean (Table 3) crops was carried out according to the needs of controlling weeds, pests, and diseases of these crops, aiming to obtain adequate plant health throughout the development cycle.

2.4. Weather Data

Weather data on rainfall, relative humidity, and average minimum and maximum temperatures for the duration of the experiment were obtained from the BASF meteorological station located at the “Capão da Onça” School Farm. Historical average rainfall data from 1954 to 2001 were obtained from the meteorological station of the Agronomic Institute of the State of Parana, Brazil [25].

2.5. Soil Sampling and Chemical Analysis

Soil samples were taken after harvesting the soybean crop in 2017, 2019, and 2021. To obtain a composite sample, 10 soil cores were sampled at 0–10 and 10–20 cm depths in each subplot using a soil probe. Prior to the chemical analysis, soils were air-dried and ground in order to pass through a 2 mm sieve. Extractable P was extracted by a Mehlich-1 solution (0.05 mol L−1 H2SO4 + 0.05 mol L−1 HCl) according to the standard method used by the Agronomic Institute of the State of Parana, Brazil [21]. Phosphorus was determined by UV–visible spectrophotometry.

2.6. Leaf Sampling and Chemical Analysis

Wheat and soybean leaf samples included 30 leaves per subplot, collected during the flowering period of the crops for foliar diagnosis. In wheat, the flag leaf was taken and in soybean, the third trefoil from the apex to the base was taken. The samples were washed in deionized water, dried in a forced-air oven at 60 °C until a constant mass was achieved and subsequently ground. The leaf tissue analysis was performed using nitric-perchloric acid digestion, and the P concentration was determined by the metavanadate colorimetry method [26].

2.7. Grain Yield Assessment

Grain yields of wheat and soybean were assessed by mechanical harvesting after the crops reached physiological maturity. Soybean was harvested from 27 m2 (4 middle rows × 15 m long) and wheat was harvested from 22.95 m2 (9 middle rows × 15 m long). Grain yield was expressed at a 130 g kg−1 moisture content. Cumulative wheat and soybean yields were calculated by summing the yields of the five wheat and soybean harvests.

2.8. Statistical Analysis

Data from the chemical analysis of soil and leaf, and crop grain yields, were analyzed through an analysis of variance using a randomized complete block design in a split-plot arrangement. When there was no significant interaction effect of application modes (main plots) and P sources (subplots) on the variables studied, data were analyzed using the means of the observations. When a significant interaction effect of application modes and P sources was found, the treatment effects were unfolded. Treatment means were compared using the LSD test (p < 0.05). Statistical analyses were performed using Sisvar software version 5.6 [27].

3. Results

3.1. Soil Properties Before the Establishment of the Experiment

Table 4 shows the results of the soil chemical and particle-size distribution analyses for different depths (0–10 and 10–20 cm) in May 2016, before the establishment of the experiment. The soil had high acidity, a toxic level of Al3+, low levels of Ca2+ and Mg2+, and a high concentration of P [28].
In order to alleviate soil acidity, dolomitic lime (327 g kg−1 of CaO, 206 g kg−1 of MgO, and a 95% effective calcium carbonate equivalent (ECCE)) was surface-applied in June 2016, at the rate of 5.4 Mg ha−1 to increase the soil base saturation in the 0–20 cm layer to 70% [29].

3.2. Weather Conditions

Figure 1 shows data on rainfall, relative humidity, and average minimum and maximum temperatures for the duration of the experiment. The monthly rainfall throughout the wheat development period in 2016 was above the historical average. In the following years (2017 to 2020), rainfall was below the historical average for the region after sowing and close to wheat flowering; the driest months occurred in July and September, at important stages of wheat development. During the different soybean growing seasons, rainfall was relatively well distributed; the most severe drought occurred only in February 2018. The relative humidity remained between 72% and 88%, while monthly minimum and maximum temperatures ranged from 9 °C to 19 °C and 16 °C to 29 °C, respectively.

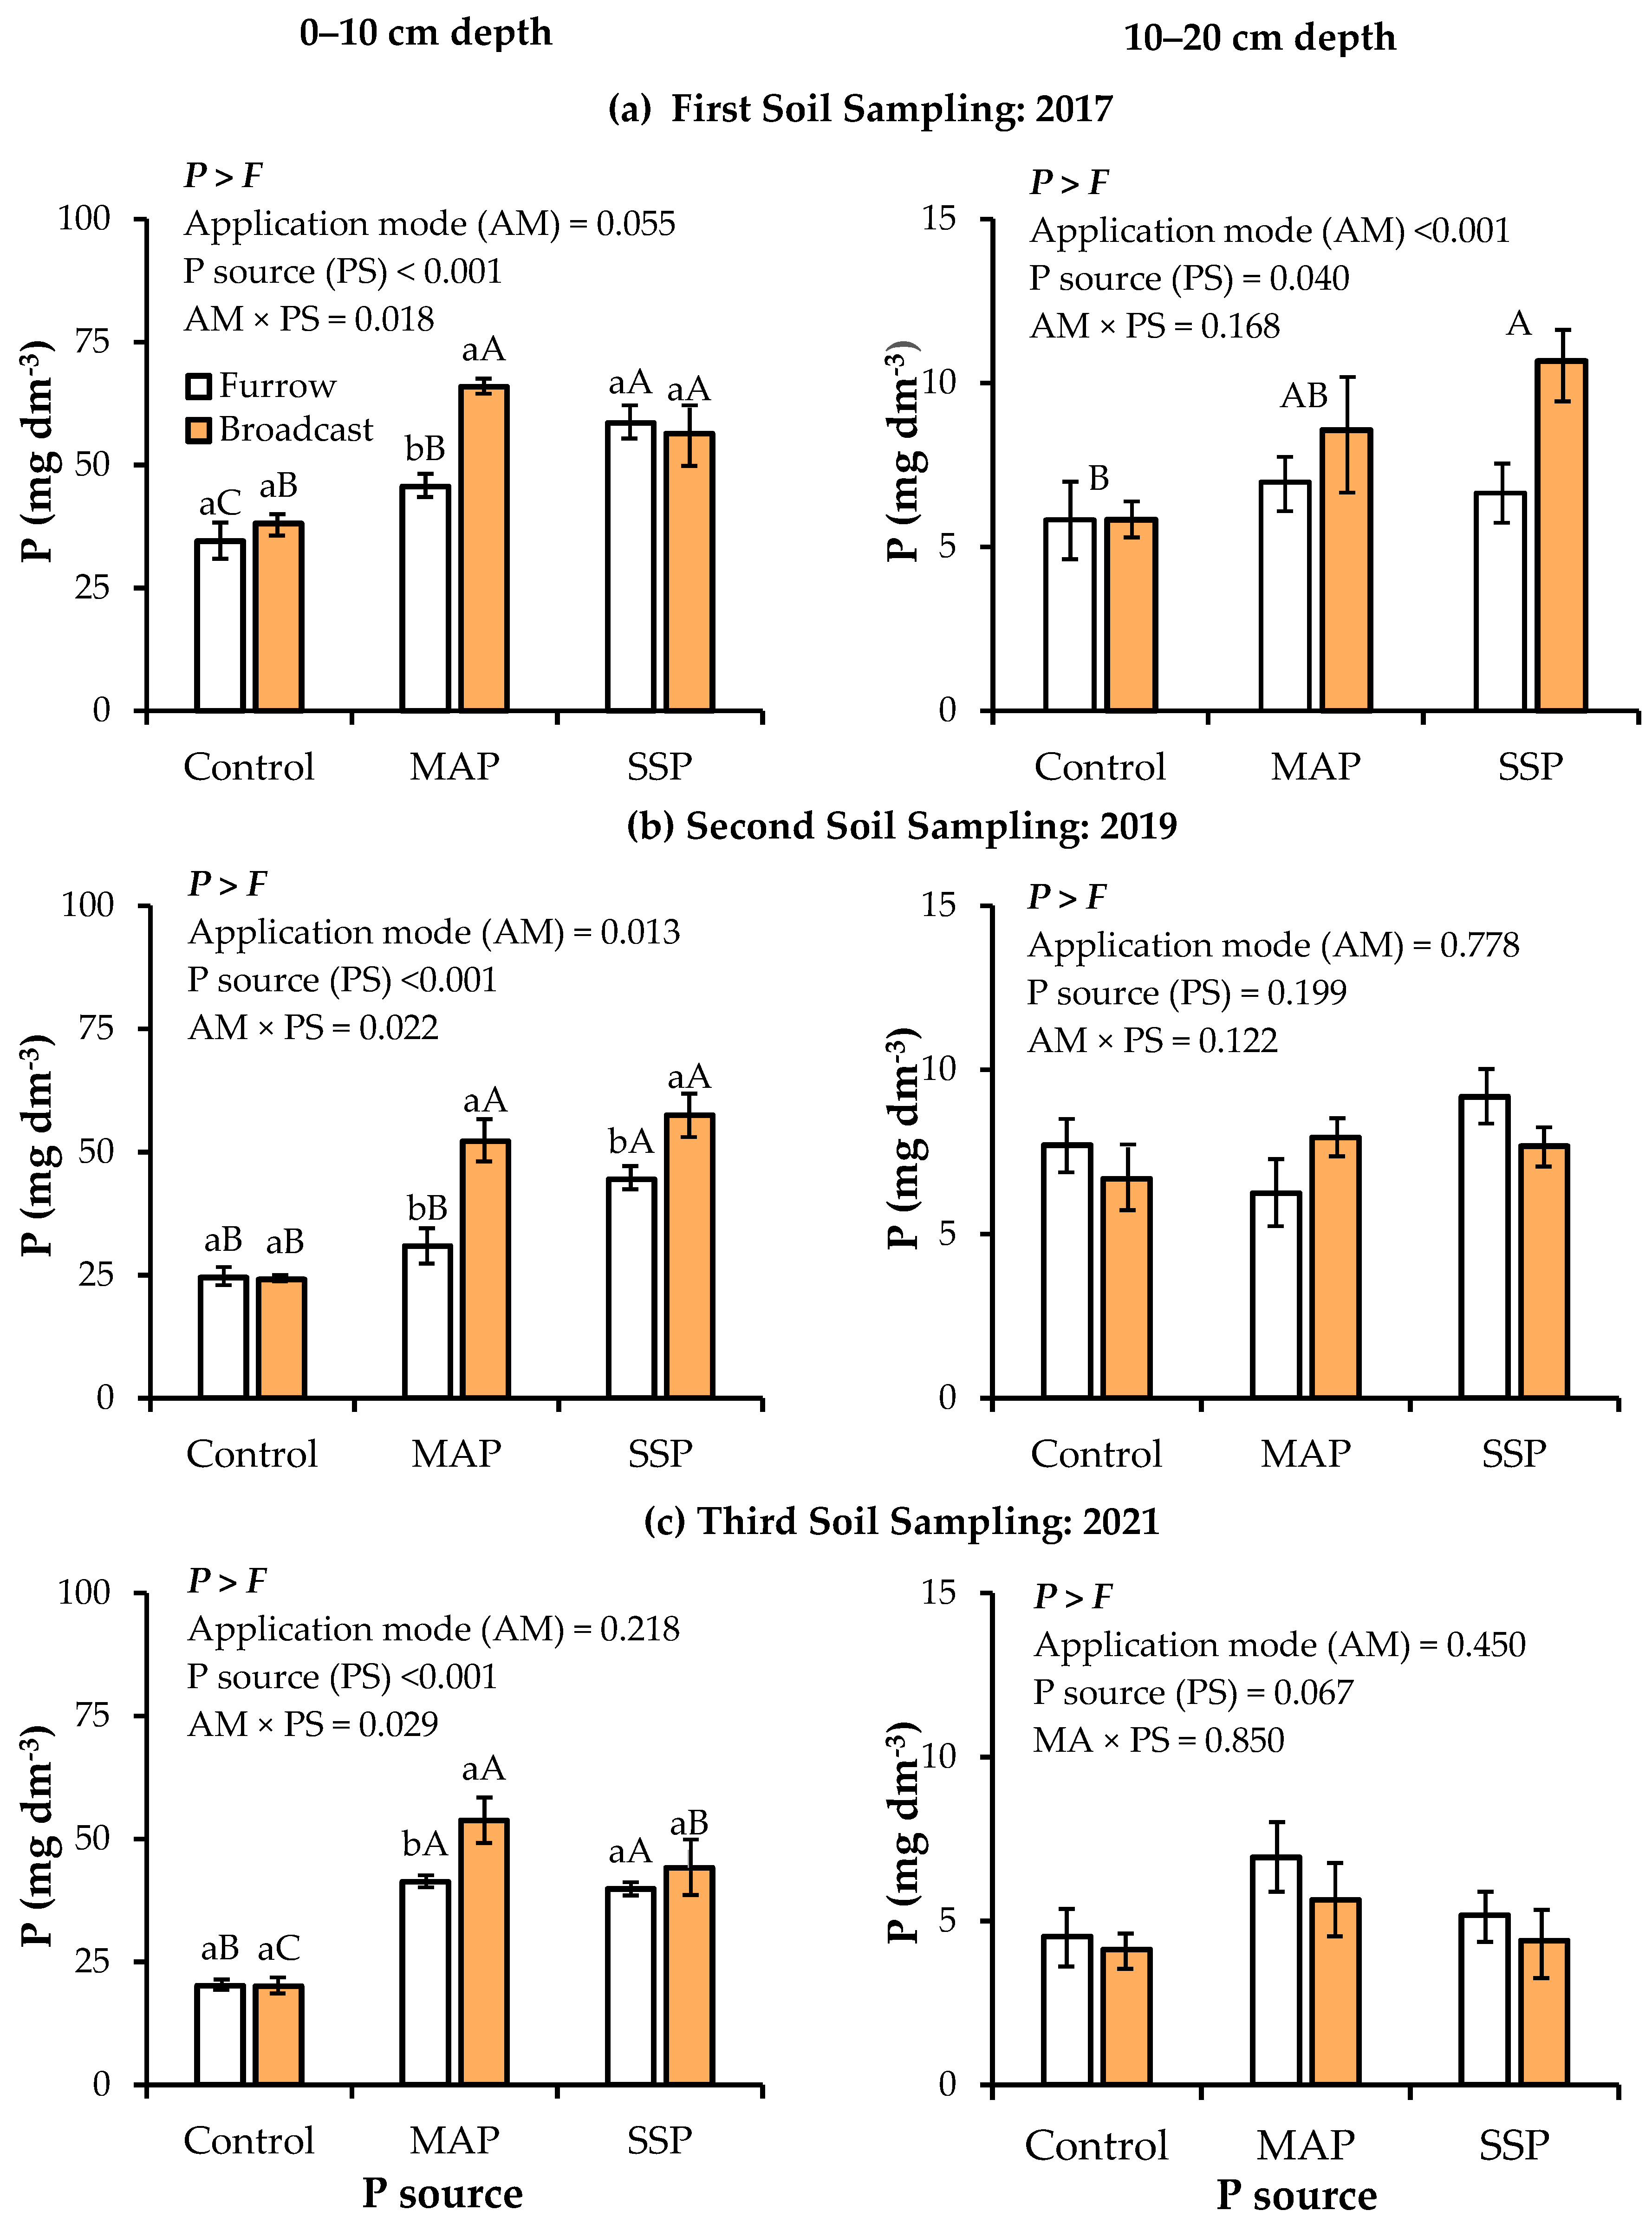
3.3. Soil P Concentration

The analysis of variance revealed a significant interaction effect (p < 0.05) of application modes × P sources for the P concentration in the topsoil (0–10 cm) at the three soil sampling times (1, 3, and 5 years after the start of the experiment) (Figure 2). At a depth of 10–20 cm, the soil P concentration was not significantly influenced by the interaction of application modes × P sources.
At the first soil sampling in 2017, only the broadcast application of MAP increased soil P concentration at a depth of 0–10 cm compared to the application in the sowing furrow (Figure 2a). Soil P concentration at a 0–10 cm depth followed the order: SSP > MAP > control for P applied in the sowing furrow (Figure 2a). For broadcast P application, there was no significant difference in soil P concentration at a 0–10 cm depth between MAP and SSP applications, although both were higher than the control. At a 10–20 cm depth, the application of P by broadcasting provided a higher soil P concentration compared to the sowing furrow, and the application of SSP provided a higher P concentration compared to the control treatment.
At the second soil sampling in 2019, the soil P concentration at a 0–10 cm depth was higher with broadcast P application than in the sowing furrow for both P sources used (MAP and SSP) (Figure 2b). The soil P concentration at a 0–10 cm depth was higher with SSP application compared with MAP and the control treatment for P applied in the sowing furrow (Figure 2b). For broadcast P application, both SSP and MAP provided a higher soil P concentration at a 0–10 cm depth compared with the control treatment. At a 10–20 cm depth, the soil P concentration was not significantly influenced by the sources and application modes of P.
At the third soil sampling in 2021, only the broadcast application of MAP increased soil P concentration at a depth of 0–10 cm compared to application in the sowing furrow (Figure 2c). The soil P concentration at a 0–10 cm depth was higher with both SSP and MAP application compared to the control treatment for P applied in the seeding furrow. For broadcast P application, the soil P concentration at a 0–10 cm depth followed the order: MAP > SSP > control. At a 10–20 cm depth, the soil P concentration was not significantly influenced by the sources and application modes of P.
The P sources (MAP and SSP) applied annually to supply the P demand for the wheat–soybean succession maintained the soil P levels over time (Figure 3). In the first soil sampling in 2017, 1 year after the start of the experiment, there was a reduction in soil P levels at depths of 0–10 and 10–20 cm in the control treatment (without P) compared to the treatments with MAP and SSP. In the second soil sampling in 2019, 3 years after the start of the experiment, the soil P concentration at a 0–10 cm depth was lower with MAP than with SSP, and even lower in the control treatment; at the depth of 10–20 m there was no difference in the soil P concentration at this sampling time. In the third soil sampling in 2021, 5 years after the start of the experiment, the soil P level at a 0–10 cm depth was lower in the control treatment compared to the treatments with MAP and SSP; at the 10–20 cm depth, the P level was lower in the control treatment compared to the MAP treatment. In the topsoil (0–10 cm), the P concentration in the control treatment was reduced by 20%, 46%, and 56% at 1, 3, and 5 years after the start of the experiment, respectively. When phosphate fertilizers were applied, the soil P concentration increased by 24% after 1 year and stabilized at levels close to the initial soil P concentration after 3 and 5 years. At the 10–20 cm depth, the reduction in soil P concentration was 13% in the control treatment at 1 year after the start of the experiment, and at 5 years, the P concentration was reduced by 36% in the control treatment, 28% with the SSP application, and 6% with the MAP application.

3.4. P Nutrition of Wheat and Soybean Plants

The wheat leaf P concentration was not significantly influenced by P application modes in the five crop seasons (Table 5). The application of both MAP and SSP increased the wheat leaf P concentration in 2017 and 2020. There was a significant interaction effect (p < 0.05) between application modes and P sources for the wheat leaf P concentration in 2020. The unfolding of this interaction showed that only MAP increased the leaf P concentration of wheat with phosphate fertilization in the sowing furrow compared to broadcast phosphate fertilization (Table 6). When phosphate fertilizers were applied by broadcasting, both MAP and SSP increased the wheat leaf P concentration compared to the control treatment. However, when P was applied in the sowing furrow, the increase in wheat leaf P concentration occurred in the following order: MAP > SSP > control.
The soybean leaf P concentration was not significantly influenced by P application modes in the five growing seasons (Table 7). Compared to the control treatment, the soybean leaf P concentration was increased with applications of SSP in the 2017–2018 and 2019–2020 growing seasons, MAP in the 2018–2019 growing season, and both SSP and MAP in the 2020–2021 growing season.

3.5. Crop Grain Yield

3.5.1. Wheat

A higher wheat grain yield was obtained in the first growing season (2016) compared to the subsequent growing seasons (Table 8). The wheat grain yield was not significantly influenced by P sources and application modes in the first three growing seasons (2016, 2017, and 2018). The average grain yields obtained in the experiment were 4163, 1329, and 2111 kg ha−1 in 2016, 2017 and 2018, respectively. A significant interaction effect (p < 0.05) between application modes and P sources was found for the wheat grain yield in 2019 (Table 9). The unfolding of this interaction showed that only MAP increased the wheat grain yield in this growing season (2019) when applied in the sowing furrow compared to the broadcast application. For SSP, application modes did not significantly influence the wheat grain yield. When phosphate fertilization was applied by broadcasting, neither MAP nor SSP caused gains in the wheat grain yield. A 60% increase in the wheat grain yield was obtained with the application of MAP in the sowing furrow. The wheat grain yield in 2020, regardless of the application mode, followed the following order: SSP > MAP > control.
The cumulative wheat grain yield in five harvests (2016, 2017, 2018, 2019, and 2020) was not significantly influenced by P application modes or by the interaction of application modes and P sources (Figure 4). Regardless of the P application mode, the average cumulative wheat grain yield in the five harvests of the experiment was 12,562 kg ha−1 (Figure 4a). Phosphate fertilization with both MAP and SSP increased the cumulative wheat grain yield by 15% (1725 kg ha−1) compared to the control treatment (Figure 4b).

3.5.2. Soybean

The soybean grain yield was not significantly influenced by P application modes or by the interaction of application modes and P sources in the five cropping seasons (Table 10).
The average soybean grain yields obtained in the experiment were 4044, 4133, 3545, 4001, and 4179 kg ha−1 in the 2016–2017, 2017–2018, 2018–2019, 2019–2020, and 2020–2021 growing seasons, respectively (Table 10). Phosphate fertilizers significantly influenced the soybean grain yield in the 2017–2018 (p = 0.029) and 2019–2020 (p = 0.065) growing seasons. In the 2017–2018 season, the soybean grain yield was 5% higher with the use of SSP compared with the use of MAP and the control treatment. In the 2019–2020 season, the soybean grain yield was 7% higher with the use of both SSP and MAP compared to the control treatment.
The cumulative soybean grain yield in five crop seasons (2016–2017, 2017–2018, 2018–2019, 2019–2020, and 2020–2021) was not significantly influenced by P application modes or by the interaction of application modes and P sources (Figure 5). Regardless of the P application mode, the average cumulative soybean grain yield obtained in the five crop seasons of the experiment was 19,902 kg ha−1 (Figure 5a). The cumulative soybean grain yield was 4% higher with phosphate fertilization with both MAP and SSP compared to the control treatment (Figure 5b).

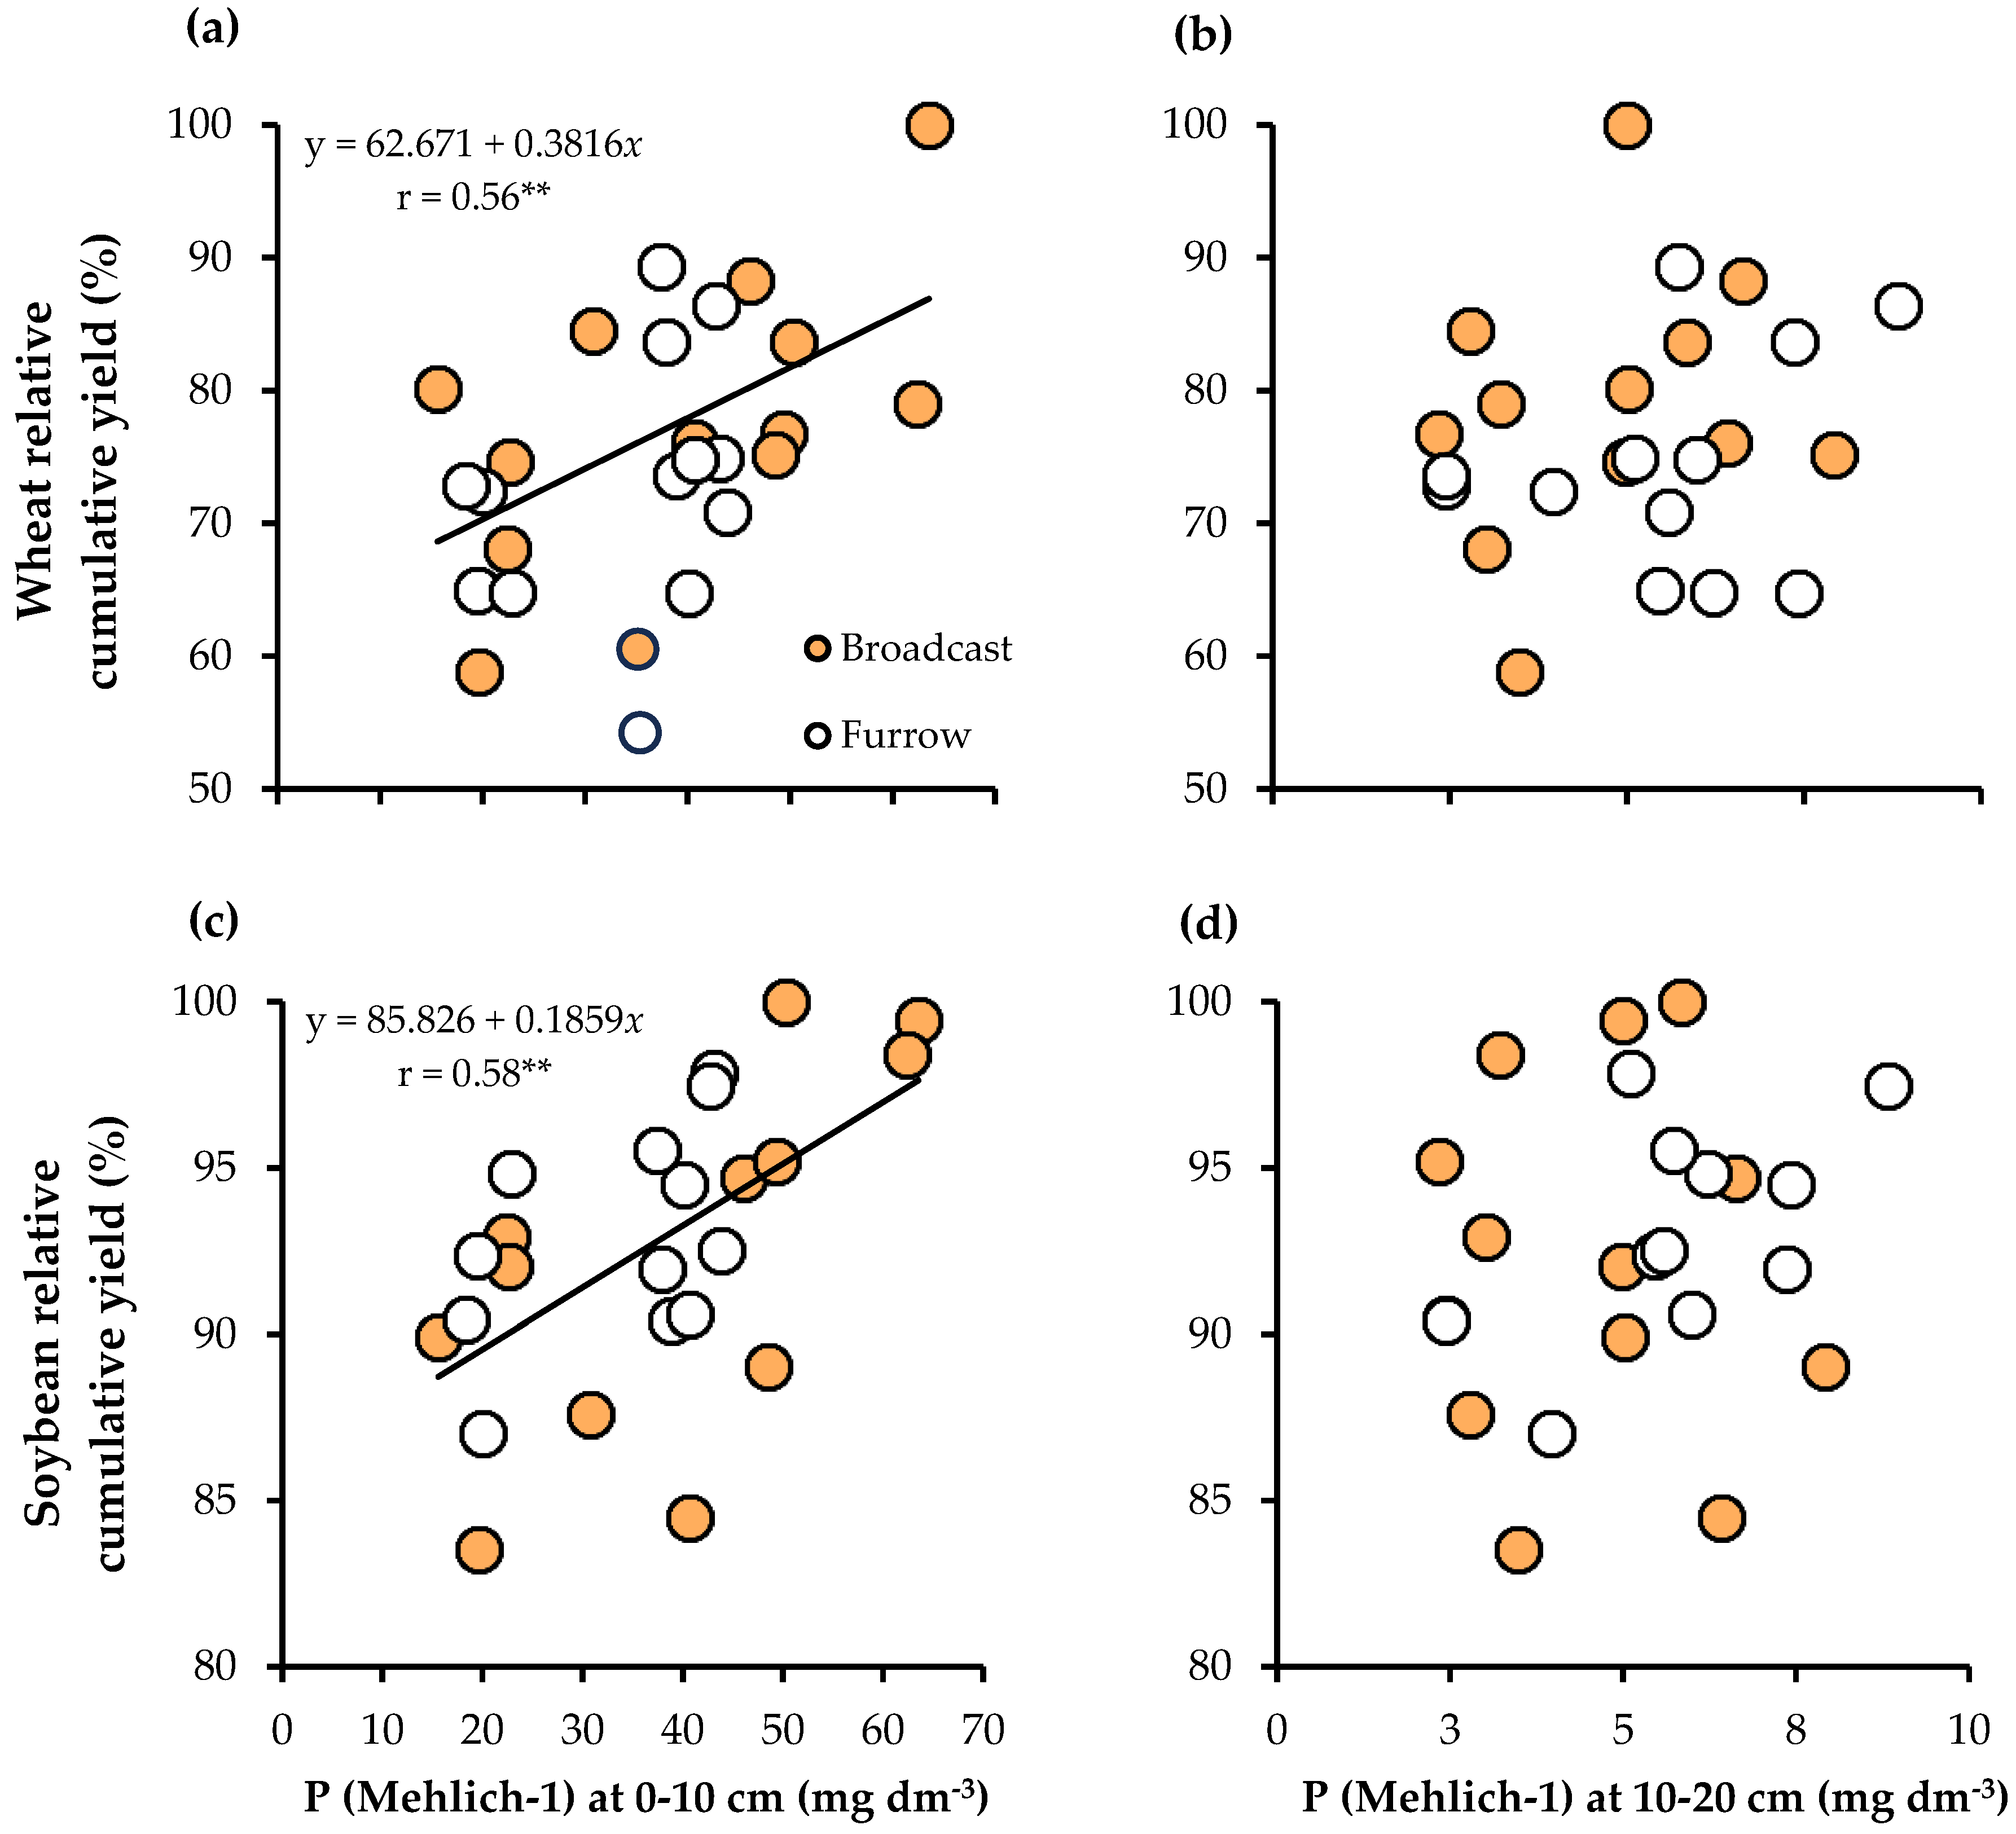
3.6. Correlations Between Crop Grain Yield and Soil P Concentration

The relative cumulative grain yields of wheat (Figure 6a) and soybean (Figure 6c) were positively (p < 0.01) correlated with P (Mehlich-1) concentration in the topsoil (0–10 cm). The soil P concentration at a depth of 10–20 cm did not correlate with relative cumulative grain yields of wheat (Figure 6b) and soybean (Figure 6d).

4. Discussion

4.1. Soil-P Status Changes

A low soil P concentration could limit the grain yield potential of crops [30]. Under no-till cropping systems in the State of Parana, Brazil, P (Mehlich-1) concentrations between 9 and 12 mg dm−3 are classified as an average level for soil with clay content between 250 and 400 g kg−1 [28], as in our study (Table 4). The level of P (Mehlich-1) in the soil at the beginning of the experiment was high (>18 mg dm−3), with concentrations of 45.5 and 6.7 mg dm−3 at the 0–10 and 10–20 cm depths, respectively, i.e., 26.1 mg dm−3 of P in the 0–20 cm layer. In the control plot without P addition, there was a reduction in the soil P (Mehlich-1) concentration of 56% and 36% at depths of 0–10 and 10–20 cm, respectively, at 5 years after the start of the experiment (Figure 3). Even with such reductions, P concentrations still remained apparently high, including in the control treatment [28]. Thus, the soil P concentration did not appear to be a limiting factor for obtaining high wheat and soybean yields.
A reduction in available soil P is frequently found in highly weathered soils of tropical and subtropical regions, which have high levels of iron (Fe) and aluminum (Al) oxides in their composition. The rapid fixation of inorganic P is due to the high adsorption capacity of P to Fe and Al oxides [6,7,8,31]. The efficiency of P use by phosphate fertilizers in Brazilian soils has been relatively low due to the need to apply larger amounts of P than those required by crops to compensate for the P adsorbed in the clay fraction [8,32]. P removal through export by grain harvesting also contributes to reducing the soil P concentration over time.
In our study, conducted in a no-till wheat–soybean cropping system, the annual application of MAP- or SSP-based phosphate fertilizers at a rate of 100 kg P2O5 ha−1 to the wheat crop was sufficient to (i) compensate for P losses through adsorption/fixation in the clay fraction of the soil, maintaining a soil P level (25.1 mg dm−3) after 5 years of conducting the experiment similar to the initial soil P concentration (26.1 mg dm−3) in the 0–20 cm layer (Figure 2 and Figure 3); (ii) supply the P demanded by wheat and soybean crops, maintaining an adequate P concentration in the leaf tissue (Table 5 and Table 7); and (iii) maintain high grain yields of wheat and soybean (Figure 4 and Figure 5).
MAP- and SSP-based phosphate fertilizers were able to maintain adequate soil P levels, but they were influenced by the application mode. Soil P concentrations were higher with broadcast phosphate fertilization compared to that in the sowing furrow with the use of MAP, at a depth of 0–10 cm, after 1, 3 and 5 years from the start of the experiment, and with the use of SSP, at a depth of 0–10 cm after 3 years, and at a depth of 10–20 cm, after 1 year from the start of the experiment (Figure 2).
Because there was no response to the mode of P application, whether broadcast or in the sowing furrow, on the leaf P concentration (Table 5 and Table 7) and on the grain yield of the crops (Table 8 and Table 10) in a wheat–soybean cropping system, it is possible that the lower P concentration (Mehlich-1) found in the soil with the application of P in the sowing furrow was due to the soil sampling system adopted. Soil sampling is a limiting factor in the evaluation of P availability in the soil in response to the application of phosphate fertilizers in the sowing furrow [32]. Systematic sampling is an attempt to minimize the effects of the horizontal variability that occurs in no-till systems, and a systematization relative to the positions in the furrows and between furrows is recommended to minimize such variations [33]. In our study, soil sampling was systematized in soybean sowing lines. However, the phosphate fertilizers were deposited in the wheat sowing furrow, and it was not possible to visualize their lines when taking the soil sample after the soybean harvest. Since the treatments were applied to the wheat crop, broadcast fertilization was not affected by systematic soil sampling, since there was no horizontal difference in the distribution of P in the soil, while the application of P in the sowing furrow could have been affected by the sampling system. Soil sampling after the soybean harvest with phosphate fertilizers applied in the wheat sowing furrow could have resulted in misinterpreted soil P levels. Similar problems arising from the sampling procedure, with soil samples taken after the soybean harvest and phosphate fertilization in the sowing furrow of the autumn–winter crop (black oat) were also reported by Caires et al. [34].

4.2. Effects of P Fertilization on P Nutrition and Grain Yield of Wheat and Soybean

Relative humidity and temperatures (minimum and maximum) remained at adequate levels during the development of the wheat and soybean crops in the different growing seasons (Figure 1). However, in most growing seasons, wheat was more affected than soybean by lower rainfall. Because in the first wheat growing season monthly rainfall was above the historical average for the region and it was very well distributed, the wheat grain yield was higher (Table 8). In subsequent growing seasons, wheat grain yields were lower due to the occurrence of drought stress at important stages of crop development, compromising the grain yield. During the development of the soybean crop, plants were practically unaffected by critical periods of low rainfall and, therefore, grain yields were relatively high throughout the growing seasons (Table 10).
The leaf P concentrations of wheat (Table 5) and soybean (Table 7) remained within or above the levels considered adequate for these crops, including the control treatment, throughout the growing seasons [6]. The P application modes influenced the leaf P concentration in only one wheat season in 2020. In this growing season, MAP fertilization in the sowing furrow provided a higher leaf P concentration of wheat (Table 6). A similar result was obtained for the grain yield (Table 10), since the application of MAP in the sowing furrow increased the wheat grain yield in 2019. The response of wheat and soybean crops to the leaf P concentration and grain yield was not influenced by the SSP application mode.
The lack of crop response of the application modes of phosphate fertilizers, either broadcast or in the sowing furrow, in the plant P nutrition and grain yield of a wheat–soybean cropping system under no-till was possibly related to the fact that the soil contained a high P concentration in our study (Table 4). Under this condition, plants could become less dependent on the application of phosphate fertilizer in the sowing furrow [14]. However, phosphate fertilization, either with MAP or SSP, positively influenced wheat (Table 8 and Figure 4) and soybean (Table 10 and Figure 5) grain yields, resulting in increases of 15% in the cumulative wheat grain yield (Figure 4) and 4% in the cumulative soybean grain yield (Figure 5). In addition, there was a positive correlation between the P concentration in the topsoil (0–10 cm) and the relative cumulative grain yield of wheat and soybean (Figure 6). Therefore, we can conclude that maintaining high grain yields in a wheat–soybean cropping system under a no-till Oxisol with a high P concentration is dependent on the annual application of MAP or SSP-based phosphate fertilizers to supply crop demand and maintain high levels of P in the soil, regardless of the application mode, whether broadcast or in the seeding furrow. It should be added here that within the scope of sustainable agriculture, it is also important to consider the environmental risks involved in the application of broadcast phosphate fertilizers, especially those with greater solubility in water, due to possible losses of P through surface runoff [35].

5. Conclusions

In a no-till wheat–soybean cropping system, the soil P status is reduced after 5 years without P application. In this cropping system, the annual replacement of 100 kg P2O5 ha−1 via MAP or SSP at wheat sowing, regardless of the application mode, whether broadcast or in the sowing furrow, was sufficient to maintain an adequate level of P in the soil, supply P to the plants, and obtain a high grain yield. The in-furrow or broadcast application of phosphate fertilizers to wheat crop using MAP or SSP is a strategy that should be encouraged in highly weathered soils under no-till to minimize the P fixation to soil particles, improve plant P nutrition, and increase grain yields of wheat and soybean. However, due to possible P losses through surface runoff, the risks involved with broadcast phosphate fertilizer application should also be carefully considered.

Author Contributions

Conceptualization, E.F.C. and V.M.D.; methodology, E.F.C., V.M.D. and V.G.F.; software, V.M.D. and V.G.F.; validation, V.M.D. and V.G.F.; formal analysis, V.M.D., V.G.F. and E.F.C.; investigation, V.M.D., V.G.F. and E.F.C.; resources, E.F.C.; data curation, V.M.D. and V.G.F.; writing—original draft preparation, V.M.D.; writing—review and editing, E.F.C.; visualization, V.M.D. and V.G.F.; supervision, E.F.C.; project administration, E.F.C.; funding acquisition, E.F.C. All authors have read and agreed to the published version of the manuscript.

Funding

This research was funded by the National Council for Scientific and Technological Development (CNPq-Brazil), grant number 304246/2021-2 and by the Coordination for the Improvement of Higher Education Personnel (CAPES-Brazil).

Institutional Review Board Statement

Not applicable.

Informed Consent Statement

Not applicable.

Data Availability Statement

The raw data supporting the conclusions of this article will be made available by the authors on request.

Acknowledgments

The authors would like to thank the “Capão da Onça” Farm School of the State University of Ponta Grossa for their support in conducting this research in the experimental field.

Conflicts of Interest

The authors declare no conflicts of interest.

References

  1. Lal, R. Sustainable Management of Soil Resources in the Humid Tropics; The United Nations University: Tokyo, Japan, 1995. [Google Scholar]
  2. Hobbs, P.R.; Sayre, K.; Gupta, R. The role of conservation agriculture in sustainable agriculture. Philos. Trans. R. Soc. Lond. B Biol. Sci. 2008, 363, 543–555. [Google Scholar] [CrossRef] [PubMed]
  3. Dang, Y.P.; Page, K.L.; Dalal, R.C.; Menzies, N.W. No-till farming systems for sustainable agriculture: An Overview. In No-till Farming Systems for Sustainable Agriculture; Dang, Y.P., Dalal, R.C., Menzies, N.W., Eds.; Springer: Cham, Switzerland, 2020; pp. 3–20. [Google Scholar] [CrossRef]
  4. Kassam, A.; Friedrich, T. An ecologically sustainable approach to agricultural production intensification: Global perspectives and developments. Field Actions Sci. Rep. 2012. Available online: http://journals.openedition.org/factsreports/1382 (accessed on 10 March 2016).
  5. Sá, J.C.M.; Tivet, F.; Lal, R.; Briedis, C.; Hartman, D.C.; Santos, J.Z.; Santos, J.B. Long-term tillage systems impacts on soil C dynamics, soil resilience and agronomic productivity of a Brazilian Oxisol. Soil Till. Res. 2014, 136, 38–50. [Google Scholar] [CrossRef]
  6. van Raij, B. Fertilidade do Solo e Manejo de Nutrientes; International Plant Nutrition Institute: Piracicaba, SP, Brazil, 2011. [Google Scholar]
  7. Fink, J.R.; Inda, A.V.; Bavaresco, J.; Barrón, V.; Torrent, J. Adsorption and desorption of phosphorus in subtropical soils as affected by management system and mineralogy. Soil Till. Res. 2016, 155, 62–68. [Google Scholar] [CrossRef]
  8. Withers, P.J.A.; Rodrigues, M.; Soltangheisi, A.; Carvalho, T.S.; Guilherme, L.R.G.; Benites, V.M.; Gatiboni, L.C.; Sousa, D.M.G.; Nunes, R.S.; Rosolem, C.A.; et al. Transitions to sustainable management of phosphorus in Brazilian agriculture. Sci. Rep. 2018, 8, 2537. [Google Scholar] [CrossRef] [PubMed]
  9. Food and Agriculture Organization (FAO). FAOSTAT Online Electronic. 2024. Available online: http://www.fao.org/faostat/en/#data/RFN (accessed on 18 November 2024).
  10. Illakwahhi, D.T.; Vegi, M.R.; Srivastava, B.B.L. Phosphorus’ future insecurity, the horror of depletion, and sustainability measures. Int. J. Environ. Sci. Technol. 2024, 21, 9265–9280. [Google Scholar] [CrossRef]
  11. Fixen, P.E.; Sulewski, G.D. 4R Plant Nutrition Manual: A Manual for Improving the Management of Plant Nutrition; International Plant Nutrition Institute: Norcross, GA, USA, 2012; Available online: http://www.ipni.net/article/IPNI-3255 (accessed on 12 April 2016).
  12. Sousa, D.M.G.; Nunes, R.S.; Rein, T.A.; Santos, J.D.G., Jr. Manejo do fósforo na região do Cerrado. In Práticas de Manejo do Solo para Adequada Nutrição de Plantas no Cerrado; Flores, R.A., Cunha, P.P., Eds.; Universidade Federal de Goiás: Goiânia, Brazil, 2016; pp. 291–358. [Google Scholar]
  13. Olibone, D.; Rosolem, C.A. Phosphate fertilization and phosphorus forms in an Oxisol under no-till. Sci. Agric. 2010, 67, 465–471. [Google Scholar] [CrossRef]
  14. Schmidt, J.; Buol, S.; Kamprath, E. Soil phosphorus dynamics during 17 years of continuous cultivation: A method to estimate long-term P availability. Geoderma 1997, 78, 59–70. [Google Scholar] [CrossRef]
  15. Karamesouti, M.; Gasparatos, D. Sustainable Management of Soil Phosphorus in a Changing World. In Adaptive Soil Management: From Theory to Practices; Springer: Singapore, 2017. [Google Scholar] [CrossRef]
  16. Rowe, H.; Withers, P.J.A.; Baas, P.; Chan, N.I.; Doody, D.; Holiman, J.; Jacobs, B.; Li, H.; MacDonald, G.K.; McDowell, R.; et al. Integrating legacy soil phosphorus into sustainable nutrient management strategies for future food, bioenergy and water security. Nutr. Cycl. Agroecosyst. 2016, 104, 393–412. [Google Scholar] [CrossRef]
  17. Food and Agriculture Organization (FAO). Crop Prospects and Food Situation—Quarterly Global Report No. 3; Food and Agriculture Organization (FAO): Rome, Italy, 2022. [Google Scholar] [CrossRef]
  18. U.S. Department of Agriculture (USDA); Foreign Agricultural Service (FAS). Soybean. 2023. Available online: https://ipad.fas.usda.gov/cropexplorer/cropview/commodityView.aspx?cropid=2222000 (accessed on 6 December 2023).
  19. Rosolem, C.A.; Merlin, A. Soil phosphorus availability and soybean response to phosphorus starter fertilizer. Rev. Bras. Cienc. Solo 2014, 38, 1487–1495. [Google Scholar] [CrossRef]
  20. Peel, M.C.; Finlayson, B.L.; Mcmahon, T.A. Updated world map of the Köppen-Geiger climate classification. Hydrol. Earth Syst. Sci. Discuss. 2007, 11, 1633–1644. [Google Scholar] [CrossRef]
  21. Pavan, M.A.; Bloch, M.F.; Zempulski, H.C.; Miyazawa, M.; Zocoler, D.C. Manual de Análise Química do Solo e Controle de Qualidade; Instituto Agronômico do Paraná (IAPAR): Londrina, PR, Brazil, 1992. [Google Scholar]
  22. Walkley, A.; Black, I.A. An examination of the Degtjareff method for determining soil organic matter and a proposed modification of the chromic acid titration method. Soil Sci. 1934, 37, 29–38. [Google Scholar] [CrossRef]
  23. Cantarella, H.; Prochnow, L.I. Determinação de Sulfato em Solos. In Análise Química para Avaliação da Fertilidade de Solos Tropicais; van Raij, B., Andrade, E., Cantarella, H., Quaggio, J.A., Eds.; Instituto Agronômico: Campinas, Brazil, 2001; pp. 225–230. [Google Scholar]
  24. Empresa Brasileira De Pesquisa Agropecuária (EMBRAPA). Manual de Métodos de Análises de Solos, 2nd ed.; EMBRAPA-Solos: Rio de Janeiro, RJ, Brazil, 2011. [Google Scholar]
  25. Instituto Agronômico do Paraná (IAPAR). Médias Históricas em Estações do IAPAR. 2021. Available online: http://www.idrparana.pr.gov.br/system/files/publico/agrometeorologia/medias-historicas/Ponta_Grossa.pdf (accessed on 27 September 2023).
  26. Malavolta, E.; Vitti, G.C.; Oliveira, S.A. Avaliação do Estado Nutricional das Plantas: Princípios e Aplicações, 2nd ed.; POTAFOS: Piracicaba, SP, Brazil, 1997. [Google Scholar]
  27. Ferreira, D.F. Sisvar: A computer statistical analysis system. Ciênc. Agrotec. 2011, 35, 1039–1042. [Google Scholar] [CrossRef]
  28. Pauletti, V.; Motta, A.C.V. Manual de Adubação e Calagem para o Estado do Paraná; Sociedade Brasileira de Ciência do Solo (SBCS), Núcleo Estadual Paraná: Curitiba, PR, Brazil, 2017. [Google Scholar]
  29. Caires, E.F.; Alleoni, L.R.F.; Cambri, M.A.; Barth, G. Surface application of lime for crop grain production under a no-till system. Agron. J. 2005, 97, 791–798. [Google Scholar] [CrossRef]
  30. Cordell, D.; Neset, T.S.S. Phosphorus vulnerability: A qualitative framework for assessing the vulnerability of national and regional food systems to the multidimensional stressors of phosphorus scarcity. Global Environ. Chang. 2014, 24, 108–122. [Google Scholar] [CrossRef]
  31. Vitousek, P.M.; Porder, S.; Houlton, B.Z.; Chadwick, O.A. Terrestrial phosphorus limitation: Mechanisms, implications, and nitrogen–phosphorus interactions. Ecol. Appl. 2010, 20, 5–15. [Google Scholar] [CrossRef] [PubMed]
  32. Rodrigues, M.; Pavinato, P.S.; Withers, P.J.A.; Teles, A.P.B.; Herrera, W.F.B. Legacy phosphorus and no-tillage agriculture in tropical oxisols of the Brazilian savanna. Sci. Total Environ. 2016, 542, 1050–1061. [Google Scholar] [CrossRef] [PubMed]
  33. Kitchen, N.R.; Westfall, D.G.; Havlin, J.L. Soil sampling under no-till banded phosphorus. Soil Sci. Soc. Am. J. 1990, 54, 1661–1665. [Google Scholar] [CrossRef]
  34. Caires, E.F.; Sharr, D.A.; Joris, H.A.W.; Haliski, A.; Bini, A.R. Phosphate fertilization strategies for soybean production after conversion of a degraded pastureland to a no-till cropping system. Geoderma 2017, 308, 120–129. [Google Scholar] [CrossRef]
  35. Hart, M.R.; Quin, B.F.; Nguyen, M.L. Phosphorus runoff from agricultural land and direct fertilizer effects: A review. J. Environ. Qual. 2004, 33, 1954–1972. [Google Scholar] [CrossRef] [PubMed]
Figure 1. Data on the (a) monthly rainfall that occurred and the 47-year (1954–2001) average monthly rainfall in Ponta Grossa, Southern Brazil, and the (b) relative humidity and monthly minimum and maximum temperatures for the duration of the experiment (2016–2021).
Sustainability 17 00268 g001
Figure 2. Soil P (Mehlich-1) levels at 0–10 and 10–20 cm depths after the soybean harvest in (a) 2017 (first soil sampling), (b) 2019 (second soil sampling), and (c) 2021 (third soil sampling) as affected by application modes and P sources. Values followed by the same letter, lowercase for application modes and uppercase for P sources, are not significantly different by the LSD test at p = 0.05. Error bars denote standard deviation from the mean.
Sustainability 17 00268 g002
Figure 3. Soil P levels (Mehlich-1) at (a) 0–10 cm and (b) 10–20 cm depths considering the P sources (control, MAP, and SSP) throughout the growing years. Values followed by the same letter within each year are not significantly different by the LSD test at p = 0.05. ns = non-significant.
Sustainability 17 00268 g003
Figure 4. Cumulative wheat grain yield of the 2016, 2017, 2018, 2019, and 2020 harvests as affected by (a) application modes and (b) P sources. Values followed by the same letter in columns are not significantly different by the LSD test at p = 0.05. Error bars denote standard deviation from the mean.
Sustainability 17 00268 g004
Figure 5. The cumulative soybean grain yield of the 2016–2017, 2017–2018, 2018–2019, 2019–2020, and 2020–2021 harvests as affected by (a) application modes and (b) P sources. Values followed by the same letter in columns are not significantly different by the LSD test at p = 0.05. Error bars denote standard deviation from the mean.
Sustainability 17 00268 g005
Figure 6. Relative cumulative grain yields of wheat (a,b) and soybean (c,d) as affected by the soil P concentration at 0–10 and 10–20 cm depths. Soils were sampled in 2021, 5 years after beginning the experiment. ** p < 0.01.
Sustainability 17 00268 g006
Table 1. Cropping sequence and amounts (kg ha−1) of nitrogen (N), phosphorus (P2O5), potassium (K2O), and sulfur (S) applied from 2016 to 2020 in an experiment under a continuous no-till system in Southern Brazil.
YearCropCultivationSowingCultivarNP2O5 K2OS
2016WheatAutumn–WinterJuneTBIO Toruk1001008465
SoybeanSpring–SummerDecemberNidera 5909 00840
2017WheatAutumn–WinterJuneTBIO Iguaçu1001008465
SoybeanSpring–SummerNovemberNidera 5445 00840
2018WheatAutumn-WinterJulyQuartzo1001008465
SoybeanSpring–SummerDecemberLG 6015800840
2019WheatAutumn–WinterJuneTBIO Toruk1001008465
SoybeanSpring–SummerDecemberNidera 5445 00840
2020WheatAutumn–WinterJuneTBIO Ponteiro1201008465
SoybeanSpring–SummerNovemberNidera 5445 00840
Table 2. Herbicides, fungicides, and insecticides with the quantities of the active ingredient (ai) used for the phytosanitary management of the wheat growing seasons.
AgrochemicalWheat Crop (g ai ha−1)
20162017201820192020
Herbicide
Glyphosate576810960960960
Tepraloxydim100100
Clodinafop-propargyl4872
Paraquat360400
2,4-D536402536
Iodosulfuron-methyl657
Clethodim192
Saflufenacil57
Fungicide
Triadimenol48
Thiophanate-methyl36
Pyraclostrobin121198169208
Metconazole726064
Kresoxim-methyl88187
Epoxiconazole88104128
Carbendazim250300
Difenoconazole424545
Fluxpyroxade50
Fenpropimorph225450712750
Azoxystrobin60
Tebuconazole382300
Insecticide
Alpha-cypermethrin11262416
Teflubenzuron112624
Fipronil40
Thiametoxam141428
Lambda-cyhalothrin10101010
Beta-cyfluthrin755
Dimethoate160160160250
Triflumuron152443
Imidacloprid8490
Flubendiamide48
Chlorantraniliprole2020
Table 3. Herbicides, fungicides, and insecticides with the quantities of the active ingredient (ai) used for the phytosanitary management of the soybean growing seasons.
AgrochemicalSoybean Crop (g ai ha−1)
2016–20172017–20182018–20192019–20202020–2021
Herbicide
Glyphosate22502160288024402400
Imazethapyr100
Carfentrazone-ethyl2020
Bentazone600
Imazamox28
Clethodim264
Atrazine4000
Tembotrione200
Glufosinate-ammonium600
Fungicide
Azoxystrobin180
Thiophanate-methyl282828
Pyraclostrobin1208414610068
Cyproconazole78
Epoxiconazole509040
Carbendazim250400
Fluxpyroxade5850905040
Protioconazole9311693
Trifloxystrobin8020080
Tebuconazole200100
Fenpropimorph375
Mancozeb2250
Insecticide
Alpha-cypermethrin6011100
Zeta-cypermethrin20
Bifentrin183015
Fipronil313131
Phenpropatrin6045
Beta-cyfluthrin51012
Lambda-cyhalothrin324237
Imidacloprid15075100
Diflubenzuron3434
Thiametoxam427749
Flubendiamide72
Chlorantraniliprole2020
Novalurom20
Chlorphenapyr120
Table 4. Results of the chemical and particle-size distribution analyses at 0–10 and 10–20 cm depths in May 2016 before the establishment of the experiment in Ponta Grossa, Southern Brazil.
Soil PropertiesSoil Depth (cm)
0–1010–20
pH (1:2.5, soil: 0.01 mol L−1 CaCl2)4.54.0
Total acidity pH 7.0 (H + Al) (mmolc dm−3)69.490.1
Organic carbon (g dm−3)1712
P (Mehlich-1) (mg dm−3)45.56.7
SO4–S [(CaH2PO4)2] (mg dm−3)3.75.7
Exchangeable cations (mmolc dm−3)
Ca2+165
Mg2+63
K+1.41.1
Al3+612
Effective cation exchange capacity (ECEC) (mmolc dm−3) 129.421.1
Cation exchange capacity pH 7.0 (CEC) (mmolc dm−3) 292.899.2
Base saturation (%) 3259
Al3+ saturation (%) 42057
Particle-size distribution (g kg−1)
Clay260260
Silt5751
Sand683689
1 Effective cation exchange capacity (ECEC) = Al3+ + Ca2+ + Mg2+ + K+. 2 Cation exchange capacity (CEC) pH 7.0 = Ca2+ + Mg2+ + K+ + total acidity (H + Al). 3 Base saturation = 100 (Ca2+ + Mg2+ + K+/CEC pH 7.0). 4 Al3+ saturation = 100 Al3+/ECEC.
Table 5. The leaf P concentration of wheat as affected by application modes and P sources on an Oxisol under no-till.
TreatmentLeaf P Concentration of Wheat (g kg−1)
20162017201820192020
Application mode (AM)
Broadcast4.064.544.924.173.74
Furrow4.014.264.924.223.90
CV (%) 15.95.94.73.99.2
P source (PS)
Control3.843.93 b4.854.203.26 b
MAP4.194.62 a5.004.264.16 a
SSP4.084.65 a4.924.134.03 a
CV (%)6.67.44.610.16.9
Adequate range 22.1–3.32.1–3.32.1–3.32.1–3.32.1–3.3
P > F
AM0.6930.0760.9420.4470.334
PS0.0660.0010.4360.832<0.001
AM × PS0.8470.3310.4260.9820.025
1 CV (%) = coefficient of variation. 2 van Raij (2011) [6]. Values followed by the same letter in a column within a growing season are not significantly different by the LSD test at p = 0.05.
Table 6. The unfolding of the interaction of application modes and P sources for the wheat leaf P concentration grown in 2020 on an Oxisol under no-till.
Application Mode
of P Fertilizer
P SourceP > F
ControlMAPSSP
g kg−1
Broadcast3.27 aB3.84 bA4.10 aA0.002
Furrow3.25 aC4.49 aA3.96 aB<0.001
P > F0.9380.0050.477
Values followed by the same letter, lowercase for application modes (column) and uppercase for P sources (line), are not significantly different by the LSD test at p = 0.05.
Table 7. The leaf P concentration of soybean as affected by application modes and P sources on an Oxisol under no-till.
TreatmentLeaf P Concentration of Soybean (g kg−1)
2016–20172017–20182018–20192019–20202020–2021
Application mode
(AM)
Broadcast8.096.734.826.176.39
Furrow8.166.194.735.896.22
CV (%) 14.37.65.18.63.9
P source (PS)
Control8.035.90 b4.55 b5.76 b5.91 b
MAP8.056.39 b5.03 a6.12 ab6.51 a
SSP8.297.08 a4.74 ab6.19 a6.50 a
CV (%)5.59.05.95.73.2
Adequate range 22.5–5.52.5–5.52.5–5.52.5–5.52.5–5.5
P > F
MA0.6430.0750.4730.2750.193
PS0.4580.0060.0160.041<0.001
AM × PS0.9290.7000.4440.1590.532
1 CV (%) = coefficient of variation. 2 van Raij (2011) [6]. Values followed by the same letter in a column within a growing season are not significantly different by the LSD test at p = 0.05.
Table 8. The wheat grain yield as affected by application modes and P sources on an Oxisol under no-till.
TreatmentWheat Grain Yield (kg ha−1)
20162017201820192020
Application mode (AM)
Broadcast43321384216323872649
Furrow39941273205923222561
CV (%) 121.413.111.215.97.4
P source (PS)
Control3685 137620202077 b2254 c
MAP4640 125721382547 a2660 b
SSP4163 135221762440 ab2901 a
CV (%)20.618.78.016.87.2
P > F
AM0.4220.2160.3610.6960.345
PS0.1260.3970.2020.042<0.001
AM × PS0.1590.2830.8540.0130.088
1 CV (%) = coefficient of variation. Values followed by the same letter in a column within a growing season are not significantly different by the LSD test at p = 0.05.
Table 9. The unfolding of the interaction of application modes and P sources for the wheat grain yield grown in 2019 on an Oxisol under no-till.
Application Mode
of P Fertilizer
P SourceP > F
ControlMAPSSP
kg ha−1
Broadcast2335 aA2170 bA2657 aA0.245
Furrow1818 aB2923 aA2224 aB0.006
P > F0.0890.0200.149
Values followed by the same letter, lowercase for application modes (column) and uppercase for P sources (line), are not significantly different by the LSD test at p = 0.05.
Table 10. The soybean grain yield as affected by application modes and P sources on an Oxisol under no-till.
TreatmentSoybean Grain Yield (kg ha−1)
2016–20172017–20182018–20192019–20202020–2021
Application mode (AM)
Broadcast40024093356840084156
Furrow40854172352239954202
CV (%) 16.95.714.02.46.4
P source (PS)
Control40234056 b34223813 b4109
MAP40324079 b35844088 a4200
SSP40764264 a36304104 a4228
CV (%)3.13.58.16.23.0
P > F
MA0.5210.4730.8350.7540.705
PS0.6670.0290.3530.0450.190
AM × PS0.5730.8880.6380.8310.367
1 CV (%) = coefficient of variation. Values followed by the same letter in a column within growing season are not significantly different by the LSD test at p = 0.05.
Disclaimer/Publisher’s Note: The statements, opinions and data contained in all publications are solely those of the individual author(s) and contributor(s) and not of MDPI and/or the editor(s). MDPI and/or the editor(s) disclaim responsibility for any injury to people or property resulting from any ideas, methods, instructions or products referred to in the content.

