Article

Spatio-Temporal Dynamics of Fish Community and Influencing Factors in an Urban River (Haihe River), China

1
Institute of Hydrobiology, Chinese Academy of Sciences, Wuhan 430072, China
2
University of Chinese Academy of Sciences, Beijing 100049, China
3
Tianjin Water Conservancy Science Research Institute, Tianjin 300204, China
4
Yangtze Eco-Environment Engineering Research Center, China Three Gorges Corporation, Wuhan 430014, China
5
Hubei Key Laboratory of Three Gorges Project for Conservation of Fishes, Yichang 443100, China
6
Institute of Hydroecology, Ministry of Water Resources, Chinese Academy of Sciences, Wuhan 430079, China
7
School of Biological and Food Engineering, Hefei Normal University, Hefei 230061, China
*
Author to whom correspondence should be addressed.
Sustainability 2025, 17(1), 231; https://doi.org/10.3390/su17010231
Submission received: 7 November 2024 / Revised: 9 December 2024 / Accepted: 21 December 2024 / Published: 31 December 2024

Abstract

:
Urbanization significantly impacts river ecosystems, altering fish community structure and dynamics and posing challenges to the sustainable management of these vital resources. In the heavily urbanized Haihe River in China, understanding the spatial and seasonal variations of fish communities and the environmental factors influencing them is crucial for effective conservation and sustainable management. This study investigated fish communities and environmental variables at ten sites along an urbanization gradient in the upstream reach of the Haihe River over four seasons in 2023. A total of 6710 individual fishes representing 30 species were collected. The results showed that the most urbanized section exhibited higher species diversity but was dominated by tolerant, omnivorous species with similar functional traits, indicating functional homogenization. In contrast, less urbanized sections displayed greater seasonal fluctuations and supported species with specialized traits. Key environmental factors influencing fish community dynamics included nitrogen levels, water temperature, dissolved oxygen, and the abundance of the submerged macrophyte Potamogeton crispus. These factors varied spatially and seasonally, mediating the effects of urbanization on fish communities. The findings highlight the importance of environmental factors in shaping fish community dynamics in urban rivers and underscore the need for integrated management strategies that consider both anthropogenic impacts and natural influences to conserve fish diversity, river maintain ecosystem health and ensure long-term sustainability. Sustainable management practices that balance development with environmental protection are vital for preserving ecological integrity and enhancing the resilience of urban river systems to challenges such as urbanization.

1. Introduction

Urbanization is a global phenomenon that significantly impacts river ecosystems through alterations in land use, increased pollutant loads, habitat modifications, and hydrological changes [1,2,3]. This process is accelerating globally, particularly in developing nations, posing increasing threats to freshwater biodiversity and ecosystem services, hindering progress towards sustainable development goals related to water resources. These anthropogenic influences often lead to degraded water quality, habitat fragmentation, and loss of biodiversity, posing challenges to the conservation and sustainable management of aquatic ecosystems [4]. The effects of rapid urbanization are particularly acute in regions where development outpaces environmental protection measures. Understanding how urbanization impacts aquatic ecosystems is crucial for developing strategies for sustainable urban development.
Fish communities are integral components of river ecosystems and serve as important indicators of ecological health due to their sensitivity to environmental changes [5]. Urbanization can affect fish communities by altering habitat conditions, water quality, and resource availability, leading to changes in species composition, diversity, and functional traits [6,7,8]. Understanding the spatial and seasonal dynamics of fish communities and their influencing factors in urban rivers is essential for developing effective conservation strategies.
The Haihe River in northern China is a heavily urbanized and modified river system, experiencing significant anthropogenic pressures due to rapid urbanization and industrialization [9,10]. Extensive modifications, including channelization, dam construction, and pollution, have profoundly altered its hydrology, geomorphology, and water quality [11]. The upstream reach of the Haihe River flows through regions with a pre-existing gradient of urbanization, ranging from highly urbanized areas to less developed regions. This gradient makes it a particularly suitable location for investigating the impacts of urbanization on fish communities.
Previous studies have documented that urbanization can lead to decreased species richness, altered community composition, and reduced functional diversity in fish assemblages [2,8,12]. However, the spatial and temporal patterns of these changes and the specific environmental factors influencing fish communities in heavily urbanized rivers like the Haihe River remain insufficiently understood. Further investigation is needed to clarify the specific mechanisms through which urbanization affects these communities.
The objectives of this study were to (1) assess the spatial and seasonal variations in fish community composition, species diversity, and functional diversity in the upstream reach of the Haihe River; (2) identify key environmental factors influencing fish community dynamics and examine how these factors vary spatially and seasonally; (3) understand the relationships between urbanization indicators, environmental variables, and fish community metrics, providing insights into how urbanization impacts fish communities through environmental changes.
By addressing these objectives, this study contributes to a better understanding of the mechanisms driving fish community dynamics in urban rivers and provides valuable insights for the sustainable management and conservation of aquatic ecosystems. It offers information for balancing urban development with ecological sustainability, ensuring the preservation of biodiversity and water quality in rapidly urbanizing regions.

2. Materials and Methods

2.1. Study Area and Site Selection

The study was conducted in the upstream reach of the Haihe River mainstem within the Tianjin Municipality, China (Figure 1). The Haihe River is one of the largest rivers in northern China, with a drainage area of approximately 320,000 km2. It is formed by the confluence of five major rivers: the North Canal, Yongding, Daqing, Ziya, and South Canal Rivers [13]. The upstream reach flows through regions with varying degrees of urbanization, making it suitable for studying the effects of urbanization on river ecosystems.
Ten sampling sites were selected along an urbanization gradient and grouped into three sections based on impervious surface area (ISA) and population density:
Section A (Sites A1–A3): This section represents the most urbanized area with a high impervious surface area and population density.
Section B (Sites B1–B3): This section is moderately urbanized, with intermediate levels of urban development.
Section C (Sites C1–C4): This section represents the least urbanized area, characterized by lower impervious surface area and population density and higher proportions of agricultural land and natural vegetation.
Site selection was based on land use data from the China Land Cover Dataset (CLCD 30 m) [14] and population density data from the LandScan Global Population Database [15], ensuring that the sites captured varying levels of urbanization intensity.

2.2. Fish Sampling

Fish sampling was conducted quarterly in 2023, covering four seasons: spring (March), summer (July), autumn (September), and winter (December). At each site, fish were collected using standardized sampling methods to ensure consistency across sites and seasons.
Multi-mesh gillnets were used to sample a wide range of fish species and sizes. The gillnets measured 30 m in length and 2 m in height and consisted of 12 mesh-size panels ranging from 1.0 to 12.5 cm, each panel being 2.5 m in length. Both floating and sinking gillnets were set at each site to sample pelagic and benthic species, respectively. Additionally, cage nets measuring 18 m × 0.33 m × 0.45 m with a mesh size of 2 cm were deployed to capture smaller species and juveniles.
Nets were set in the afternoon between 14:00 and 17:00 and retrieved the following morning between 08:00 and 10:00, resulting in a soak time of approximately 15 h. This timing was chosen to cover diurnal variations and maximize the chance of capturing both nocturnal and diurnal species.
Captured fish were identified at the species level using the identification keys provided by Li [16]. Total length (TL, mm) and weight (W, g) were measured for each individual. Unidentified specimens were preserved in 10% formalin and later identified in the laboratory. Species were assigned to functional groups based on their feeding habits, tolerance levels, habitat preferences, and life-history traits (see Supplementary Table S1).

2.3. Environmental Variables and Urbanization Indicators

At each sampling site and season, various environmental variables were measured to characterize habitat conditions and water quality.
Physical Parameters included water depth (WD) and water transparency (SD). Water depth was measured using a portable depth sounder (Hondex PS-7, located in Sakai City, Osaka Prefecture, Japan), while water transparency was determined using a Secchi disk.
Water Quality Parameters were measured in situ using a multi-parameter water quality meter (YSI 6920, YSI Incorporated, located in Yellow Springs, Ohio, USA.). Parameters measured included water temperature (WT), dissolved oxygen (DO), pH, oxidation-reduction potential (ORP), and total dissolved solids (TDS).
Nutrient Concentrations were assessed by collecting water samples from three layers: surface (0.5 m below the surface), mid-layer (half of the water depth), and bottom (0.5 m above the sediment). Samples were analyzed for total nitrogen (TN), total phosphorus (TP), ammonia nitrogen (NH4+-N), and phosphates (PO4-P) following standard methods outlined by the American Public Health Association [17].
The abundance of the submerged macrophyte Potamogeton crispus was recorded as percent coverage within the sampling area based on visual assessments. This species is dominant in the river and can influence habitat structure and water quality.
Urbanization indicators were quantified to assess the level of urban influence at each site. Impervious Surface Area (ISA) was calculated within a 500 m radius buffer zone around each sampling site using GIS analysis in QGIS software 3.32.1 [18]. Land use data from the CLCD 30 m dataset [14] were used to identify impervious surfaces. Population density was derived from the LandScan Global Population Database [15], which provides an estimate of the human population within the buffer zones.

2.4. Data Analysis

2.4.1. Fish Community Metrics

Species diversity indices were calculated to assess biodiversity at each site and season. These included the Shannon-Wiener diversity index (H’), Margalef richness index (D), Simpson diversity index (λ’), and Pielou evenness index (J’). Functional diversity indices were also computed to evaluate the diversity of functional traits within fish communities. These included functional richness (FRic), functional evenness (FEve), functional divergence (FDiv), and functional dispersion (FDis), using species’ functional traits as described in Supplementary Table S1. The Index of relative importance (IRI) was used to identify dominant species [19].

2.4.2. Statistical Analysis

Two-way Analysis of Variance (Two-way ANOVA) was used to test for significant differences in species diversity and functional diversity among sections (spatial variation) and seasons (temporal variation). When significant differences were detected, post hoc tests were conducted to identify specific differences between groups.
Non-metric Multidimensional Scaling (NMDS) was employed to visualize patterns in fish community composition based on Bray-Curtis similarity matrices of square-root transformed abundance data. Permutational Multivariate Analysis of Variance (PERMANOVA) was used to test for significant differences in community composition among sections and seasons. Similarity Percentage (SIMPER) Analysis identified species contributing most to dissimilarities between groups.
Redundancy Analysis (RDA) was conducted to explore relationships between fish community composition and environmental variables. Prior to RDA, Detrended Correspondence Analysis (DCA) was performed to assess gradient lengths and determine the suitability of linear methods. Environmental variables were selected through forward selection with Monte Carlo permutation tests (999 permutations), and multicollinearity was assessed using Variance Inflation Factors (VIF < 10 considered acceptable).
Structural Equation Modeling (SEM) was performed to assess the direct and indirect effects of urbanization indicators on fish communities, mediated by environmental variables and P. crispus abundance. SEM allows for the evaluation of complex relationships among multiple variables and was conducted using the lavaan package in R. The model fit was evaluated using the chi-square test, Root Mean Square Error of Approximation (RMSEA), and Comparative Fit Index (CFI), following the recommendations of Lefcheck [20].
All statistical analyses were performed using R software 4.2.2 [21]. A significance level of p < 0.05 was adopted for all statistical tests.

3. Results

3.1. Spatial and Seasonal Variations in Fish Community Composition

A total of 6710 individual fishes representing 30 species from 5 orders and 10 families were collected across all sampling sites and seasons. The family Cyprinidae was the most dominant, comprising 19 species and accounting for 63.33% of the total species richness (Table 1). The collected species exhibited a range of feeding habits, tolerance levels, habitat preferences, and other functional traits (Table S1), including herbivorous, piscivorous, omnivorous, planktivorous, detritivorous, and zoobenthivorous diets.
The number of species recorded varied among the sections: 24 species were identified in Section A (most urbanized), 19 species in Section B (moderately urbanized), and 22 species in Section C (least urbanized). Dominant species were determined using the Index of Relative Importance (IRI) (Table 2). Small omnivorous fish species such as Carassius auratus, Hemiculter leucisculus, and Toxabramis swinhonis had high IRI values (≥1000), indicating their dominance in terms of abundance and biomass across different sections and seasons.

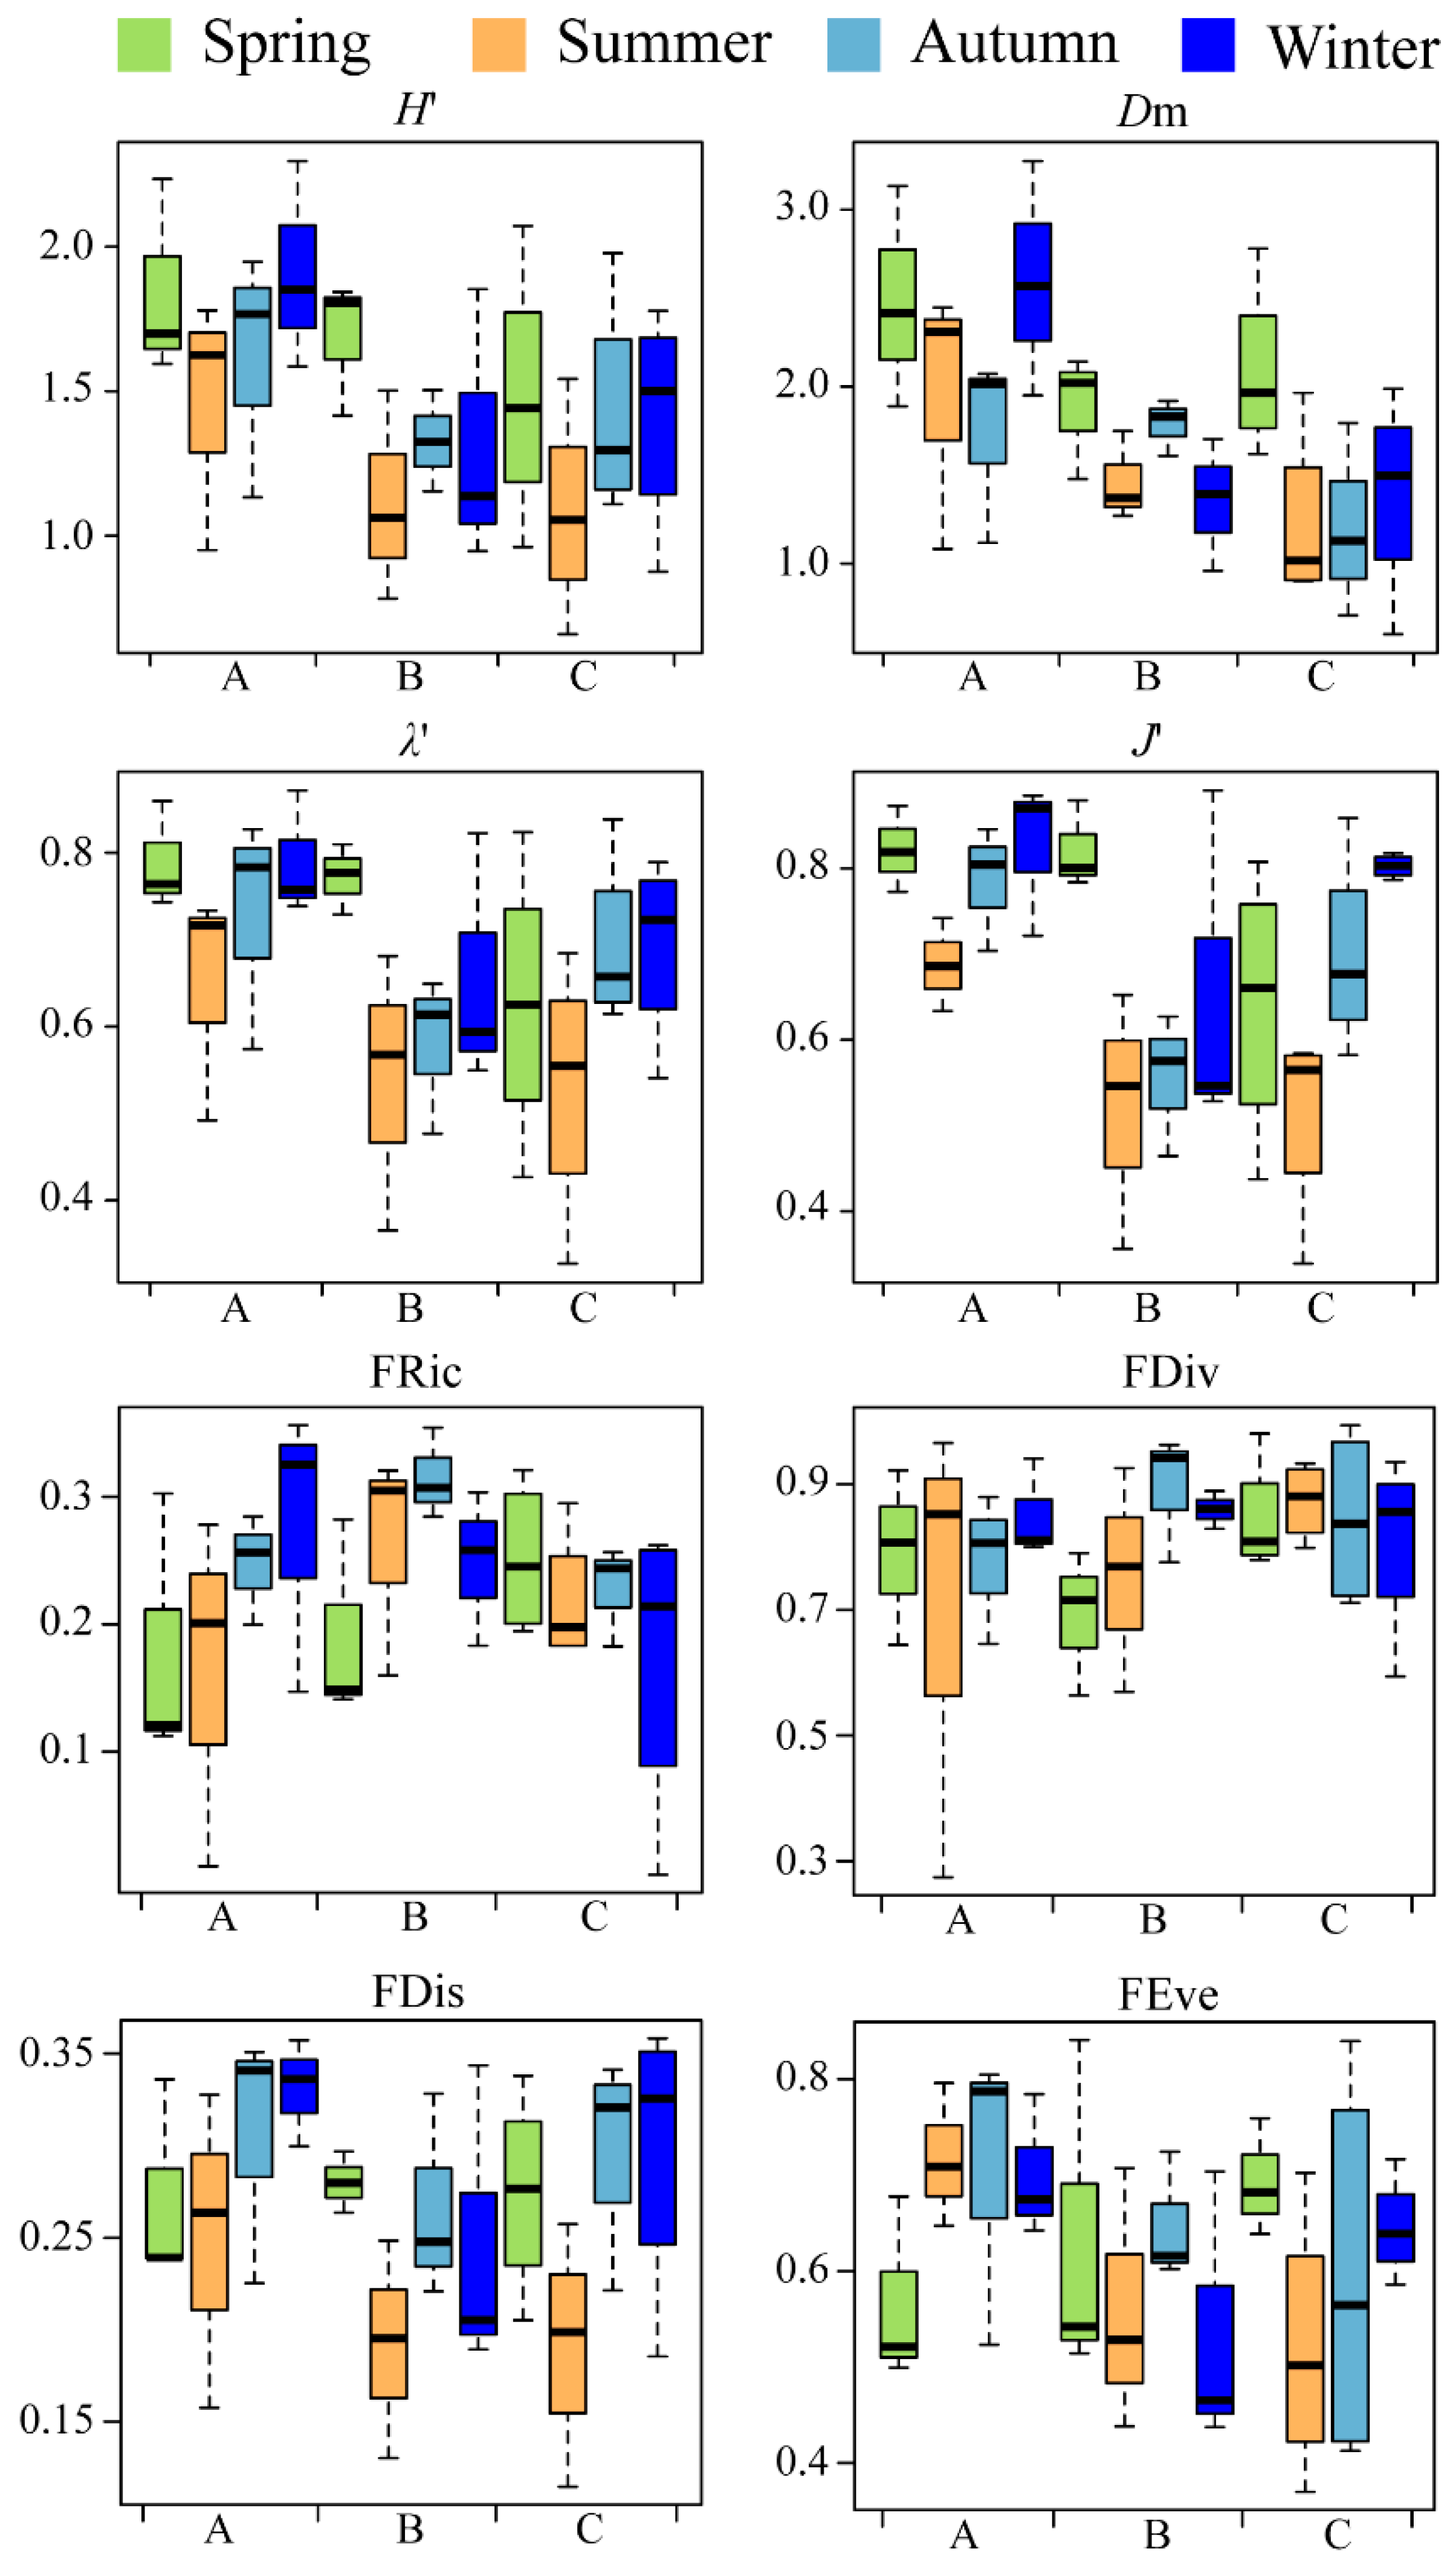
3.2. Species Diversity and Functional Diversity

Species diversity indices differed significantly among sections and seasons (Two-way ANOVA, p < 0.05). The Shannon-Wiener diversity index (H’) was highest in Section A (most urbanized) and lower in Sections B and C (Figure 2). This pattern suggests that species diversity, as measured by the Shannon-Wiener index, was greater in the most urbanized areas. Temporally, species diversity indices were generally lower in summer and higher in other seasons across all sections. This seasonal variation indicates that fish diversity was affected by seasonal environmental changes.
Functional diversity indices showed varied patterns. Functional richness (FRic) and functional evenness (FEve) did not differ significantly among sections or seasons. However, functional dispersion (FDis) differed significantly among seasons, being lowest in summer and higher in winter (Two-way ANOVA, p < 0.05), indicating a seasonal convergence of functional traits during summer (Table 3).

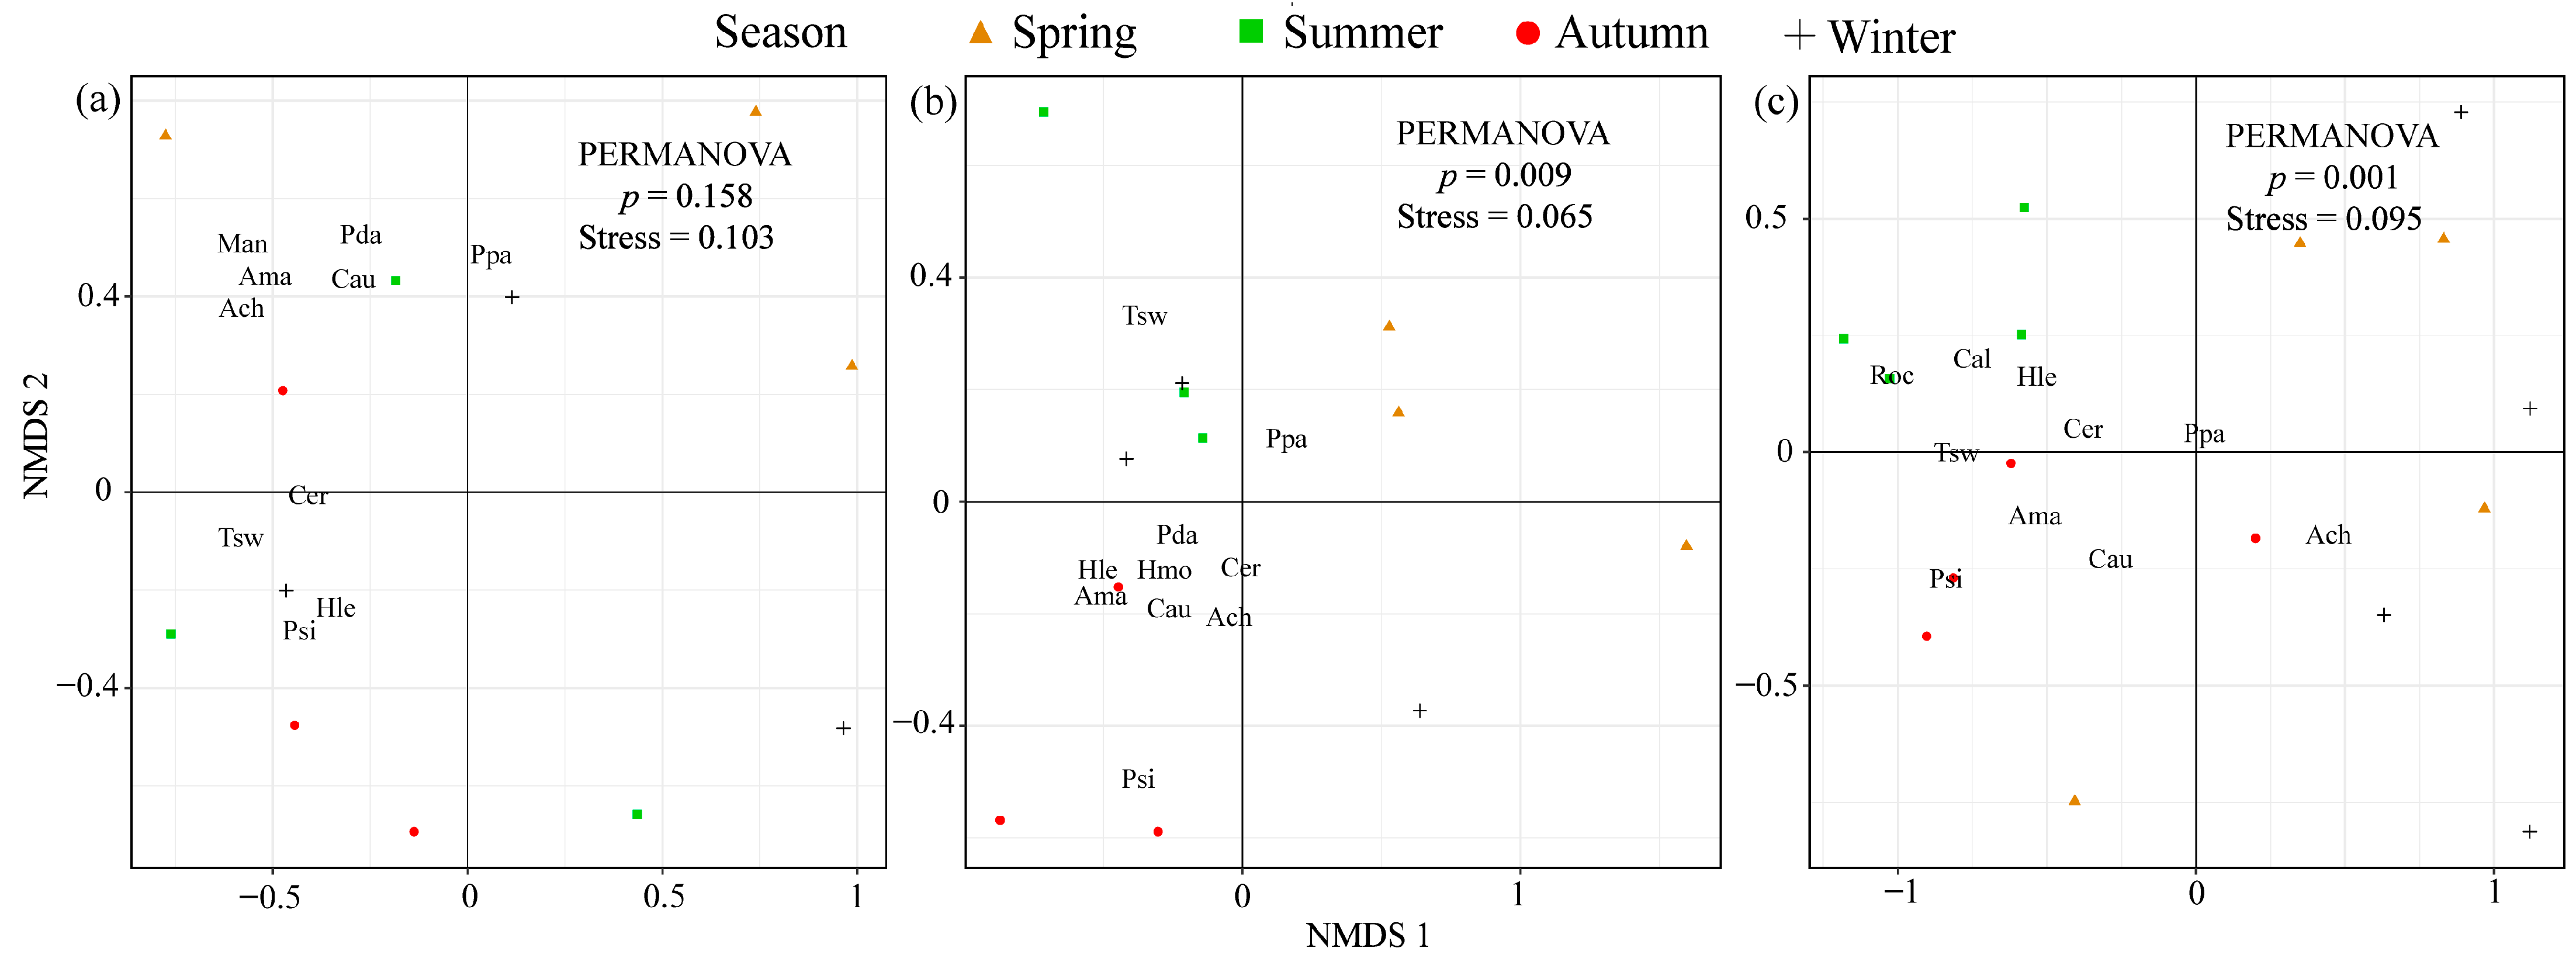
3.3. Fish Community Composition Analysis

Non-metric multidimensional scaling (NMDS) ordination revealed distinct patterns in fish community composition among sections and seasons (Figure 3). In Section A, NMDS and PERMANOVA results indicated that fish communities were not significantly different between seasons (stress = 0.103, p > 0.05), suggesting relative stability in community composition. In contrast, fish communities in Sections B and C showed significant seasonal differences (Section B: stress = 0.065, p < 0.01; Section C: stress = 0.095, p < 0.01).
Similarity percentage (SIMPER) analyses indicated that the variation in fish community composition between river sections ranged from 43% to 57%. The species contributing most to the differences among sections were T. swinhonis, H. leucisculus, and Paramisgurnus dabryanus. Seasonal differences ranged from 43% to 56%, with species such as Pseudobrama simoni, Hypophthalmichthys molitrix, Culterichthys erythropter, and Misgurnus anguillicaudatus being the main contributors.

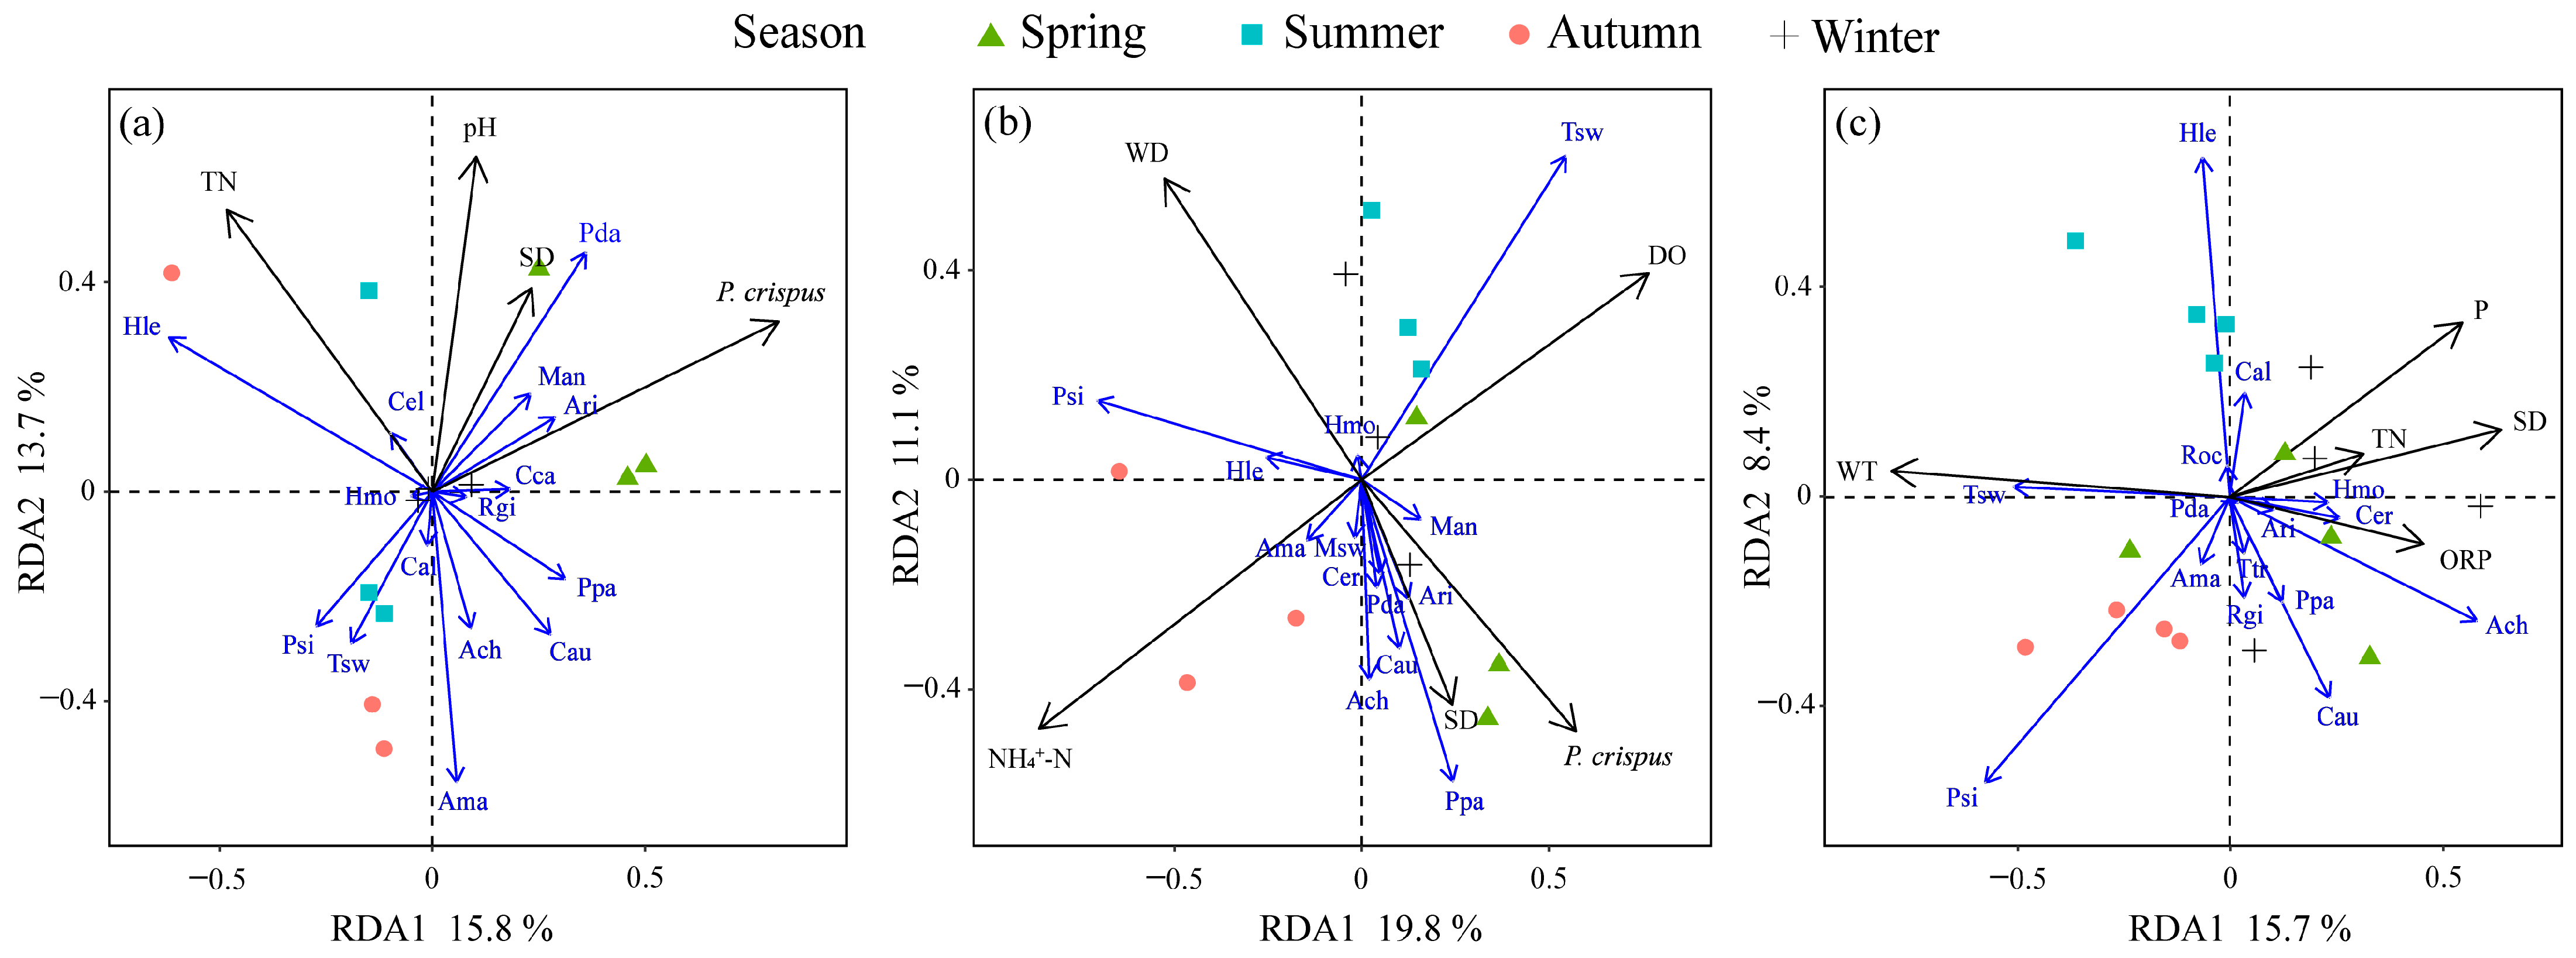
3.4. Environmental Factors Influencing Fish Communities

Redundancy Analysis (RDA) identified key environmental factors influencing fish community dynamics in each section (Figure 4). The significant environmental variables included nitrogen levels (TN and NH4+-N), water temperature (WT), dissolved oxygen (DO), and the abundance of P. crispus.
In Section A, TN, pH, and P. crispus were positively correlated with tolerant and omnivorous species like C. auratus and M. anguillicaudatus and negatively correlated with sensitive species like T. swinhonis and P. simoni (Figure 4a).
In Section B, water depth (WD) showed a positive correlation with T. swinhonis, P. simoni, and H. molitrix. Additionally, P. crispus and NH4+-N were positively correlation with species such as C. erythropter and H. molitrix (Figure 4b).
In Section C, WT had a positive effect on mall-bodied, fast-reproducing species like T. swinhonis and P. simoni and a negative effect on larger, less tolerant species C. erythropter (Figure 4c). TN and NH4+-N had negative effects on small species like T. swinhonis and P. simoni but a positive effect on C. erythropter.

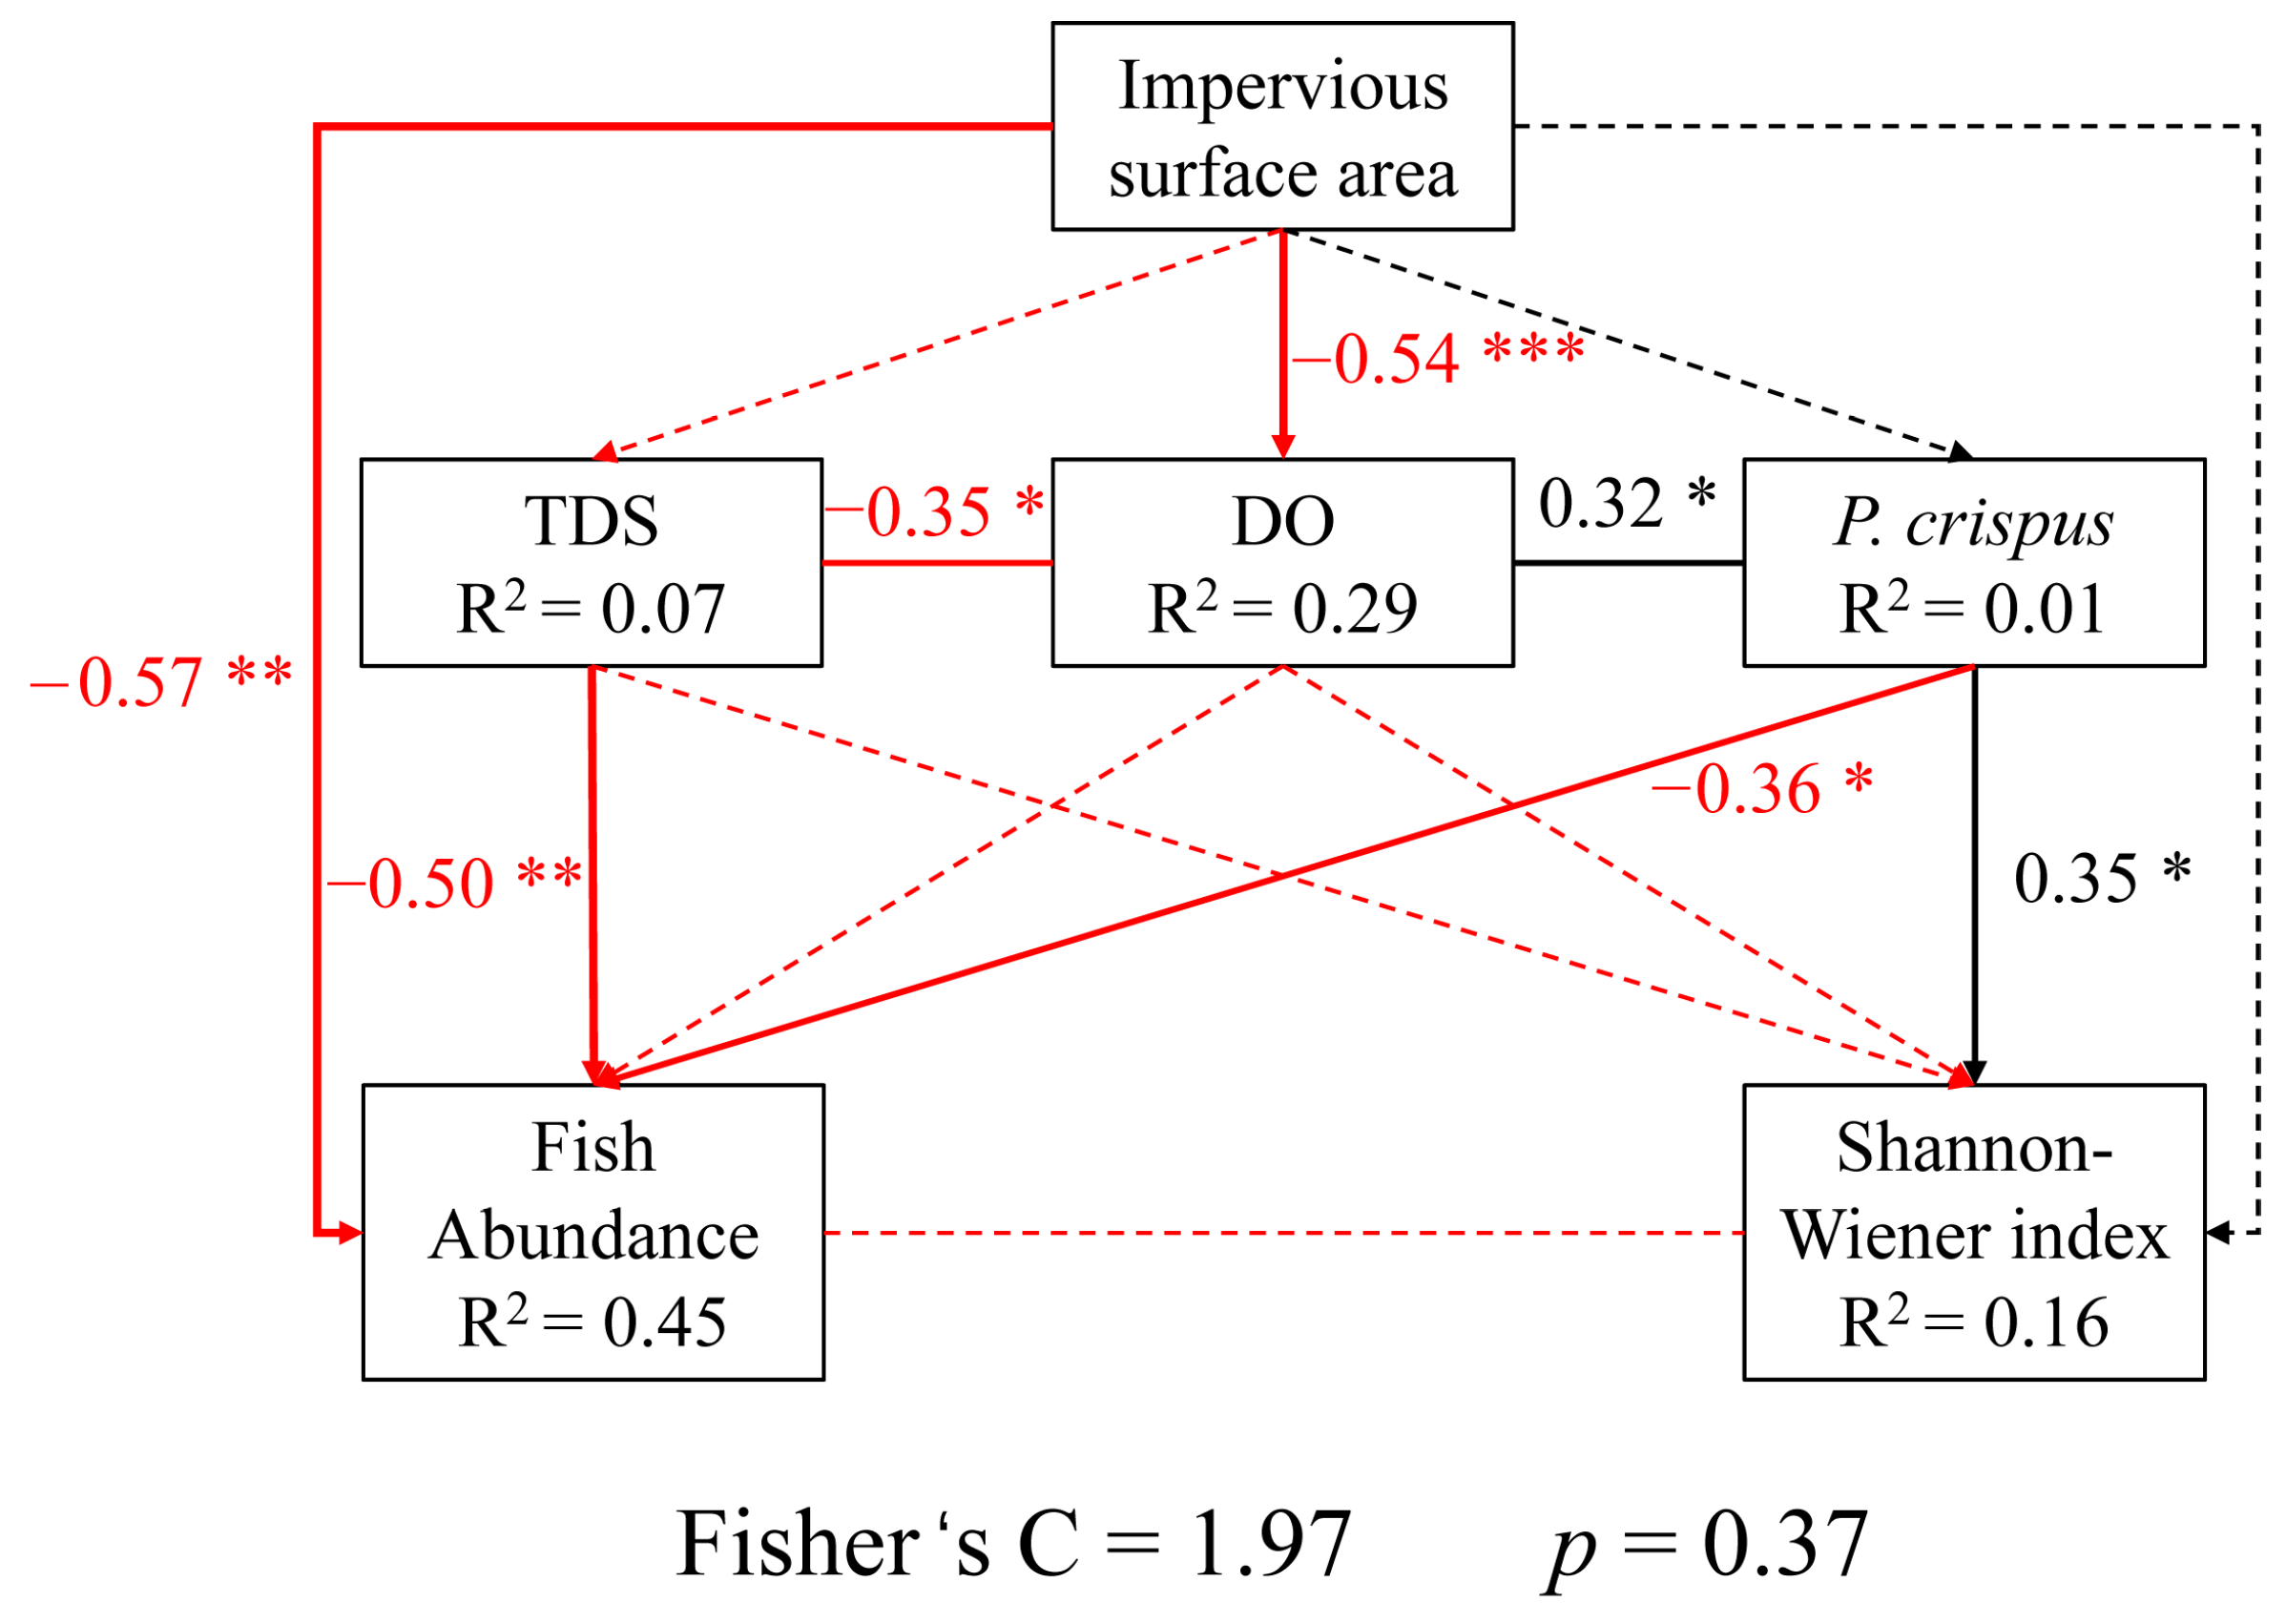
3.5. Relationships Between Urbanization Indicators, Environmental Variables, and Fish Communities

Linear regression analysis revealed significant relationships between urbanization indicators and environmental variables. Impervious surface area (ISA) was positively correlated with TN (R2 = 0.68, p < 0.01) and NH4+-N (R2 = 0.65, p < 0.01), indicating that urbanization contributes to increased nutrient levels in the river. ISA was negatively correlated with DO (R2 = −0.52, p < 0.05), suggesting that urbanization may lead to decreased dissolved oxygen levels.
Fish abundance was negatively correlated with ISA (R2 = 0.14, p < 0.05) and population density (R2 = 0.12, p < 0.05). This suggests that higher levels of urbanization are associated with lower fish abundance. Species diversity (H’) showed a positive but non-significant relationship with ISA (R2 = 0.04, p > 0.05), indicating that species diversity may not be directly affected by urbanization level.
Structural equation modeling (SEM) revealed the pathways by which urbanization affects fish communities (Figure 5). The final model fit the data well (p = 0.37 and Fisher’s C = 1.97). ISA had a significant negative direct effect on fish abundance (standardized coefficient β = −0.57, p < 0.05) and a non-significant positive direct effect on species diversity (β = 0.13, p > 0.05). ISA also had indirect effects via environmental variables. Specifically, ISA was negatively correlated with dissolved oxygen (DO; β = −0.54, p < 0.001) and total dissolved solids (TDS; β = −0.27, p > 0.05). In turn, TDS negatively affected fish abundance (β = −0.5, p < 0.01), indicating that higher TDS levels associated with increased ISA negatively impact fish abundance.
Additionally, ISA positively affected the abundance of P. crispus (β = 0.05, p > 0.05). P. crispus was significantly positively correlated with species diversity (β = 0.35, p < 0.05) and significantly negatively correlated with fish abundance (β = −0.36, p < 0.05). These results suggest that ISA indirectly influences fish communities through alterations in environmental conditions and aquatic vegetation, affecting both fish abundance and species diversity.

4. Discussion

4.1. Spatial and Seasonal Dynamics of Fish Communities

The study revealed significant spatial and seasonal variations in fish community composition, species diversity, and functional diversity in the upstream reach of the Haihe River. Interestingly, the most urbanized area (Section A) exhibited higher species diversity compared to the less urbanized sections. This finding contrasts with the common expectation that urbanization leads to decreased biodiversity due to habitat degradation and pollution [5,6].
One possible explanation for the higher diversity in Section A could be the presence of habitat heterogeneity created by urban structures. While urban environments can lead to habitat degradation, they can also inadvertently create new habitat features, such as bridge pilings and bank reinforcements, that might offer niches for certain species [22]. Altered flow patterns associated with urban modifications could also contribute to habitat diversity. Furthermore, the presence of introduced species, such as S. asotus and X. argentea, in Section A may contribute to the increased species richness observed in this section. Introduced species are often successful in disturbed urban environments and can increase overall species counts [23,24]. Increased nutrient input from urban runoff could also support a larger and more diverse fish community in Section A. Additionally, altered predation dynamics in urbanized areas could contribute to the observed patterns. Finally, Section A may function as an “urban refugia” for certain species, offering favorable conditions despite the general degradation associated with urbanization.
However, despite the higher species diversity in Section A, the fish communities in this section were dominated by a few tolerant, omnivorous species with specific functional traits, indicating functional homogenization. This dominance suggests that urbanization favors species capable of thriving in disturbed environments, potentially at the expense of specialized species with unique functional roles [8]. This pattern of functional homogenization could have implications for the long-term resilience and functioning of the fish community in the most urbanized section of the Haihe River.
Seasonally, species diversity and functional diversity indices were generally lower in the summer across all sections. Elevated water temperatures and reduced dissolved oxygen levels during summer months can stress aquatic organisms, leading to decreased diversity [25,26]. The significant seasonal differences observed in Sections B and C, particularly the lower species diversity and functional dispersion in the summer, suggest that fish communities in less urbanized areas are more sensitive to environmental fluctuations. This sensitivity may be attributed to the presence of species with specialized functional traits that are less tolerant of environmental stressors, such as temperature and oxygen fluctuations. These specialized species may be more reliant on specific habitat conditions and resources that are more susceptible to disruption during summer months.

4.2. Influence of Environmental Factors

Key environmental factors, including nitrogen levels (TN and NH4+-N), water temperature (WT), dissolved oxygen (DO), and the abundance of P. crispus, were found to significantly influence fish community dynamics.
Elevated nitrogen levels, often associated with urban and agricultural runoff, contribute to eutrophication, leading to algal blooms and hypoxia [27]. In the Haihe River, tolerant species such as C. auratus thrived in areas with high TN and NH4+-N, while sensitive species were adversely affected. This suggests that nutrient pollution can shift community composition toward more tolerant species. Domestic waster water discharge further contributes to elevated nitrogen levels in urban rivers, significantly increasing nitrogen concentrations [28]. Our findings indicate that fish communities at sections A and B are significantly influenced by changes in nitrogen levels. These nitrogen levels also fluctuate seasonally. In spring, abundant aquatic plants like P. crispus can reduce t nitrogen through uptake. Conversely, during summer and autumn, P. crispu decomposition can release nitrogen into the water [29].
Water temperature significantly influenced species distribution, with warmer temperatures favoring small-bodied, fast-reproducing species in Section C [25]. Seasonal variations in WT contributed to temporal shifts in community composition, affecting metabolic rates and spawning cycles. Species with specific thermal preferences or spawning requirements may be more vulnerable to temperature fluctuations.
Dissolved oxygen (DO) is a critical factor influencing the growth and reproduction of aquatic organisms. In the Haihe River, DO is influenced by factors such as the abundance of aquatic plants like P. crispus. Higher DO levels were generally observed in spring when P. crispus is abundant. However, during the warmer summer and autumn months, eutrophication can lead to lower DO levels. This seasonal trend is consistent with observations in the main channel of the Hai River [29]. While a negative correlation was found between DO and impervious surface area, there was no significant direct effect of DO on fish abundance according to the SEM. However, total dissolved solids (TDS), which increased with higher ISA, had a significant negative effect on fish abundance. Elevated TDS levels can lead to osmotic stress in fish, interfere with physiological processes, and reduce habitat suitability [30].
The abundance of P. crispus also influenced fish communities. While P. crispus can enhance species diversity by providing habitat complexity [29], excessive proliferation may negatively impact fish abundance due to oxygen depletion during decomposition and physical habitat alteration [31]. Our findings suggest a complex role of P. crispus in mediating urbanization impacts on fish communities, showing a positive correlation with fish diversity. Aquatic plants provide a habitat for fish, reduce predation pressure, and attract more fish species to settle [32]. P. crispus offers habitat for prey species, creating favorable conditions for fish feeding while also serving as a direct food source for some herbivorous fish. However, excessive P. crispus growth can lead to oxygen depletion and negatively alter habitat structure. Therefore, a balance in P. crispus abundance is important for maintaining a healthy fish community.

4.3. Implications for Urban River Management

The findings of this study emphasize the critical role of environmental factors in shaping fish community dynamics in urban rivers. Effective management strategies should focus on mitigating urbanization impacts through environmental interventions.
Reducing nutrient and dissolved solid inputs by improving wastewater treatment and managing stormwater runoff can alleviate eutrophication and high TDS levels, thereby enhancing water quality [30]. Implementing green infrastructure, such as permeable surfaces and riparian buffers, can reduce impervious surface areas, enhance infiltration, and improve hydrological processes, supporting healthier aquatic habitats [1,33]. Specifically for the Haihe River, constructing riparian buffer zones along urbanized stretches could help filter pollutants and reduce nutrient runoff. Creating constructed wetlands within the Haihe River system could further enhance water purification and provide valuable habitat.
Managing aquatic vegetation, including monitoring and controlling the growth of P. crispus, is essential to balance its beneficial effects on habitat complexity with potential negative impacts on fish abundance [29]. Conservation efforts should also focus on preserving and restoring natural habitats to support a balanced fish community with diverse functional traits and maintain ecosystem services [5]. Restoring degraded riparian habitats and reconnecting fragmented sections of the river would also be beneficial.
Engaging stakeholders in urban planning and promoting public awareness of the ecological value of urban rivers are crucial for the success of conservation initiatives [34,35]. Furthermore, policy changes, such as stricter regulations on industrial and wastewater discharge, are crucial for the Haihe River. These regulations should aim to reduce pollutant loads and improve water quality.

5. Conclusions

This study demonstrates that environmental factors significantly influence the spatial and seasonal dynamics of fish communities in the heavily urbanized Haihe River. Urbanization impacts fish communities through changes in environmental conditions, particularly nutrient levels, water temperature, dissolved oxygen, and the abundance of Potamogeton crispus. The most urbanized areas exhibited higher species diversity but were dominated by tolerant species with similar functional traits, indicating functional homogenization. Less urbanized areas supported species with specialized traits and showed greater seasonal variability. Understanding these dynamics is essential for developing effective, sustainable management strategies to conserve fish diversity, maintain ecosystem health, and promote the long-term sustainability of urban rivers like the Haihe River. By balancing urban growth with the preservation of biodiversity and water quality, these strategies support the sustainable use of aquatic resources, ensuring the ecological integrity and sustainability of urban ecosystems in rapidly urbanizing regions. These findings contribute to a better understanding of the challenges and opportunities for achieving sustainable urban development in rapidly urbanizing regions, particularly in the context of managing critical water resources.

Supplementary Materials

The following supporting information can be downloaded at: https://www.mdpi.com/article/10.3390/su17010231/s1, Table S1: Functional traits of fish species in the upstream reach of the Haihe River, including feeding habits, tolerance levels, water column positions, migratory habits, flow rate preferences, spawning types, orifice positions, body shape, and maximum lengths.

Author Contributions

Writing—original draft, Writing—review and editing, Investigation, Data curation, Formal analysis, Revision, B.T., Project administration, Conceptualization, Data curation, Revision., S.C., Writing—original draft, Writing—review and editing, Conceptualization, Methodology, Data curation, Visualization, Revision, S.Y., Investigation, Data curation, Field sampling, Sample measurements, Y.Z., Project administration, Conceptualization, Data curation, Y.W., Methodology, Field sampling, S.W., Writing—review and editing, Conceptualization, Methodology, L.W., Supervision, Writing—review and editing, Conceptualization, Methodology, T.Z. All authors have read and agreed to the published version of the manuscript.

Funding

This research was funded by the National Natural Science Foundation of China, grant number 32072983.

Institutional Review Board Statement

Not applicable.

Data Availability Statement

The data presented in this study are available upon reasonable request from the corresponding author. The data are not publicly available at this moment as the research project to which they belong is currently ongoing. This ensures that the integrity of the ongoing research is maintained and that all data sharing complies with the ethical standards and protocols set forth by our institution.

Acknowledgments

The authors sincerely thank the Haihe River Administration Bureau for their invaluable assistance with field sampling and providing access to boats used during the research.

Conflicts of Interest

The authors declare no conflicts of interest. The funders had no role in the design of the study, in the collection, analyses, or interpretation of data, in the writing of the manuscript, or in the decision to publish the results.

References

  1. Allan, J.D. Landscapes and riverscapes: The influence of land use on stream ecosystems. Annu. Rev. Ecol. Evol. Syst. 2004, 35, 257–284. [Google Scholar] [CrossRef]
  2. Walsh, C.J.; Roy, A.H.; Feminella, J.W.; Cottingham, P.D.; Groffman, P.M. The urban stream syndrome: Current knowledge and the search for a cure. J. N. Am. Benthol. Soc. 2005, 24, 706–723. [Google Scholar] [CrossRef]
  3. Vörösmarty, C.J.; McIntyre, P.B.; Gessner, M.O.; Dudgeon, D. Global threats to human water security and river biodiversity. Nature 2010, 467, 555–561. [Google Scholar] [CrossRef] [PubMed]
  4. Booth, D.B.; Roy, A.H.; Smith, B.; Capps, K.A. Global perspectives on the urban stream syndrome. Freshw. Sci. 2016, 35, 412–420. [Google Scholar] [CrossRef]
  5. Karr, J.R. Assessment of biotic integrity using fish communities. Fisheries 1981, 6, 21–27. [Google Scholar] [CrossRef]
  6. Wang, L.; Lyons, J.; Kanehl, P.; Bannerman, R. Impacts of urbanization on stream habitat and fish across multiple spatial scales. Environ. Manag. 2001, 28, 255–266. [Google Scholar] [CrossRef] [PubMed]
  7. Walters, D.; Freeman, M.; Leigh, D.; Freeman, B.J.; Pringle, C.M. Urbanization effects on fishes and habitat quality in a southern Piedmont River basin. Am. Fish. Soc. Symp. 2005, 47, 69–85. [Google Scholar]
  8. Leitão, R.P.; Zuanon, J.; Mouillot, D.; Leal, C.G.; Hughes, R.M.; Kaufmann, P.R.; Villéger, S.; Pompeu, P.S. Disentangling the pathways of land use impacts on the functional structure of fish assemblages in Amazon streams. Ecography 2018, 41, 219–232. [Google Scholar] [CrossRef] [PubMed]
  9. Jing, Z. Encyclopedia of Chinese Rivers and Lakes: Haihe River Volume; China Water Power Press: Beijing, China, 2013. [Google Scholar]
  10. Ding, Y.; Shan, B.; Zhao, Y. Assessment of river habitat quality in the Hai River Basin, Northern China. Int. J. Environ. Res. Public Health 2015, 12, 11699–11717. [Google Scholar] [CrossRef]
  11. Wang, L.; Mo, K.; Chen, Q.; Zhang, J.; Xia, J.; Lin, Y. Estimating ecological flows for fish overwintering in plain rivers using a method based on water temperature and critical water depth. Ecohydrology 2019, 12, e2098. [Google Scholar] [CrossRef]
  12. Brown, L.R.; Cuffney, T.F.; Coles, J.F.; Fitzpatrick, F.; McMahon, G.; Steuer, J.; Bell, A.H.; May, J.T. Urban streams across the USA: Lessons learned from studies in 9 metropolitan areas. J. N. Am. Benthol. Soc. 2009, 28, 1051–1069. [Google Scholar] [CrossRef]
  13. Xu, H.; Zheng, H.; Chen, X.; Ren, Y.; Ouyang, Z. Relationships between river water quality and landscape factors in Haihe River Basin, China: Implications for environmental management. Chin. Geogr. Sci. 2016, 26, 197–207. [Google Scholar] [CrossRef]
  14. Yang, J.; Huang, X. The 30 m annual land cover dataset and its dynamics in China from 1990 to 2019. Earth Syst. Sci. Data 2021, 13, 3907–3925. [Google Scholar] [CrossRef]
  15. Bright, E.A.; Rose, A.N.; Urban, M.L. LandScan Global Population Database. Available online: https://landscan.ornl.gov/ (accessed on 22 May 2024).
  16. Li, M.D. The Fauna of Fishes in Tianjin; Tianjin Science and Technology Press: Tianjin, China, 2011. [Google Scholar]
  17. American Public Health Association (APHA). Standard Methods for Examination of Water and Wastewater, 23rd ed.; APHA: Washington, DC, USA, 2017. [Google Scholar]
  18. QGIS Development Team. QGIS Geographic Information System. Available online: https://www.qgis.org/ (accessed on 17 October 2024).
  19. Pinkas, L.; Oliphant, M.S.; Iverson, I.L. Food habits of albacore, bluefin tuna, and bonito in California waters. Calif. Fish Game Fish Bull. 1971, 152. [Google Scholar]
  20. Lefcheck, J.S. piecewiseSEM: Piecewise structural equation modeling in R for ecology, evolution, and systematics. Methods Ecol. Evol. 2016, 7, 573–579. [Google Scholar] [CrossRef]
  21. R Core Team. R: A Language and Environment for Statistical Computing. Available online: https://www.R-project.org/ (accessed on 17 October 2024).
  22. Francis, R.A.; Chadwick, M.A. Urban Ecosystems: Understanding the Human Environment; Routledge: London, UK, 2013. [Google Scholar]
  23. Alberti, M.; Marzluff, J.; Hunt, V.M. Urban driven phenotypic changes: Empirical observations and theoretical implications for eco-evolutionary feedback. Philos. Trans. R. Soc. B 2017, 372, 20160029. [Google Scholar] [CrossRef] [PubMed]
  24. Scott, M.C. Winners and losers among stream fishes in relation to land use legacies and urban development in the southeastern US. Biol. Conserv. 2006, 127, 301–309. [Google Scholar] [CrossRef]
  25. Wolter, C. Temperature influence on the fish assemblage structure in a large lowland river, the lower Oder River, Germany. Ecol. Freshw. Fish 2007, 16, 493–503. [Google Scholar] [CrossRef]
  26. Tomasetti, S.J.; Gobler, C.J. Dissolved oxygen and pH criteria leave fisheries at risk. Science 2020, 368, 372–373. [Google Scholar] [CrossRef]
  27. Gücker, B.; Brauns, M.; Pusch, M.T. Effects of wastewater treatment plant discharge on ecosystem structure and function of lowland streams. J. N. Am. Benthol. Soc. 2006, 25, 313–329. [Google Scholar] [CrossRef]
  28. Zhang, X.; Wu, Y.; Gu, B. Urban rivers as hotspots of regional nitrogen pollution. Environ. Pollut. 2015, 205, 139–144. [Google Scholar] [CrossRef] [PubMed]
  29. Kang, L.; Xu, H.; Zhu, G.; Chen, J. Influence of Potamogeton crispus on lake water environment and phytoplankton community structure. Environ. Sci. 2020, 41, 4053–4061. [Google Scholar]
  30. Chapman, P.M.; McPherson, C.A. Development of a total dissolved solids (TDS) chronic effects benchmark for a northern Canadian lake. Integr. Environ. Assess. Manag. 2016, 12, 371–379. [Google Scholar] [CrossRef] [PubMed]
  31. Sand-Jensen, K.; Prahl, C.; Stokholm, H. Oxygen release from roots of submerged aquatic macrophytes. Oikos 1982, 38, 349–354. [Google Scholar] [CrossRef]
  32. Ye, S.; Zhang, T.; Li, Z.; Liu, J. Relationships between spatial distribution of two dominant small-sized fishes and submerged macrophyte cover in Niushan Lake of China. Chin. J. Appl. Ecol. 2012, 23, 2566–2572. [Google Scholar]
  33. Keeler, B.L.; Hamel, P.; McPhearson, T.; Hamann, M.H. Mapping ecological and social values of urban green infrastructure: Guidance for practitioners. Sustainability 2019, 11, 1696. [Google Scholar]
  34. Allan, J.D.; Abell, R.; Hogan, Z.; Revenga, C.; Taylor, B.W.; Welcomme, R.L.; Winemiller, K. Overfishing of inland waters. BioScience 2005, 55, 1041–1051. [Google Scholar] [CrossRef]
  35. Wenger, S.J.; Roy, A.H.; Jackson, C.R.; Bernhardt, E.S.; Carter, T.L.; Filoso, S.; Gibson, C.A.; Hession, W.C.; Kaushal, S.S.; Martí, E.; et al. Twenty-six key research questions in urban stream ecology: An assessment of the state of the science. J. N. Am. Benthol. Soc. 2009, 28, 1080–1098. [Google Scholar] [CrossRef]
Figure 1. Map of the upstream reach of the Haihe River in Tianjin, China, showing the location and distribution of the ten sampling sites categorized into Section A (most urbanized), Section B (moderately urbanized), and Section C (least urbanized).
Sustainability 17 00231 g001
Figure 2. Spatial and temporal variations in fish diversity indices across the three sections (A, B, C) of Haihe River (Mean ± Standard Deviation). Species diversity indices include Shannon-Wiener Index (H’), Margalef Richness Index (Dm), Simpson Diversity Index (λ’), and Pielou Evenness Index (J’). Functional diversity indices include Functional Richness (FRic), Functional Divergence (FDiv), Functional Dispersion (FDis), and Functional Evenness (FEve).
Sustainability 17 00231 g002
Figure 3. Non-metric Multidimensional Scaling (NMDS) ordination plots illustrating fish community composition patterns in (a) Section A, (b) Section B, and (c) Section C across four seasons. Different shapes and colors of the points represent the four seasons. Abbreviations for fish species are detailed in Table 1.
Sustainability 17 00231 g003
Figure 4. Redundancy Analysis (RDA) ordination plots demonstrating the relationships between fish species and environmental variables in (a) Section A, (b) Section B, and (c) Section C in the Haihe River. Environmental indicators are represented by black arrows and include Water Depth (WD), Transparency (SD), Water Temperature (WT), Dissolved Oxygen (DO), pH, Total Nitrogen (TN), Ammonia Nitrogen (NH4+-N), Phosphates (P), and Oxidation-Reduction Potential (ORP). Fish species are represented by blue arrows; abbreviations (blue arrows) are detailed in Table 1. Different shapes and colors of the points indicate the four seasons.
Sustainability 17 00231 g004
Figure 5. Structural equation model depicting the direct and indirect effects of urbanization on fish communities through environmental variables and P. crispus abundance. Solid arrows represent significant paths (p < 0.05), while dashed arrows indicate non-significant paths. Standardized path coefficients (β) are provided next to each arrow. Red arrows indicates negative correlations, while black arrows indicates positive correlations. “*”indicates p < 0.05, “**”indicates p < 0.01 and “***”indicates p < 0.001.
Sustainability 17 00231 g005
Table 1. Fish species recorded in the Haihe River, their feeding habits, and occurrence in each section.
Species (Coding)Feeding HabitSection ASection BSection C
Cypriniformes
   Cyprinidae
      Carassius auratus (Cau)Omnivorous+++
      Cyprinus carpio (Cca)Omnivorous+++
      Pseudorasbora parva (Ppa)Planktivorous+++
      Toxabramis swinhonis (Tsw)Omnivorous+++
      Abbottina rivularis (Ari)Planktivorous+++
      Hemiculter bleekeri (Hbl)Omnivorous++
      Hemiculter leucisculus (Hle)Omnivorous+++
      Acheilognathus macropterus (Ama)Detritivorous+++
      Pseudobrama simoni (Psi)Detritivorous+++
      Acanthorhodeus chankaensis (Ach)Detritivorous+++
      Xenocypris argentea (Xar)Detritivorous+
      Culter alburnus (Cal)Piscivorous+++
      Culterichthys erythropter (Cer)Piscivorous+++
      Hemibarbus maculatus (Hem)Zoobenthivorous+
      Hypophthalmichthys molitrix (Hmo)Planktivorous+++
      Squalidus argentatus (Sar)Omnivorous+
      Aristichys nobilis (Ano)Planktivorous+
      Rhodeus ocellatus (Roc)Detritivorous++
      Ctenopharyngodon idella (Cid)Herbivorous+
   Cobitidae
      Misgurnus anguillicaudatus (Man)Omnivorous+++
      Paramisgurnus dabryanus (Pda)Omnivorous+++
Perciformes
   Channidae
      Channa argus (Car)Piscivorous+
   Odontobutidae
      Micropercops swinhonis (Msw)Piscivorous+
   Osphronemidae
      Macropodus chinensis (Mch)Piscivorous+
   Gobiidae
      Tridentiger trigonocephalus (Ttr)Piscivorous+
      Rhinogobius giurinus (Rgi)Piscivorous+++
Siluriformes
   Bagridae
      Pelteobagrus fulvidraco (Pfu)Zoobenthivorous++
   Siluridae
      Silurus asotus (Sas)Piscivorous+
Mugiliformes
   Mugilidae
      Liza haematocheila (Lha)Omnivorous+
Beloniformes
   Hemiramphidae
      Hyporhamphus intermedius (Hin)Planktivorous++
Table 2. Index of Relative Importance (IRI) for dominant fish species in each section and season.
SpeciesN (ind.)N (%)B (g)B (%)Occurrence IRI
Section ASpring
    Carassius auratus3313%2235.2630%67%2857.36
    Paramisgurnus dabryanus4116%900.8612%83%2317.17
    Cyprinus carpio73%1699.0523%83%2141.9
    Acheilognathus macropterus5922%912.1112%50%1740.14
    Misgurnus anguillicaudatus3112%359.755%67%1111.05
Summer
    Hemiculter leucisculus7734%1567.9838%100%7236.65
    Toxabramis swinhonis4821%401.510%67%2065.99
Autumn
    Hemiculter leucisculus3823%340.37%100%2970.15
    Toxabramis swinhonis4024%264.25%100%2938.35
    Pseudobrama simoni2213%316.56%100%1958.67
    Hypophthalmichthys molitrix21%264553%33%1804.52
Winter
    Hypophthalmichthys molitrix138%19,71083%50%4549.83
    Hemiculter leucisculus5431%482.572%100%3325.78
    Carassius auratus159%810.333%100%1210.27
Section BSpring
    Toxabramis swinhonis5332%601.4919%83%4173
    Hemiculter leucisculus3923%674.1321%83%3665.03
    Carassius auratus1811%984.6330%83%3420.42
Summer
    Toxabramis swinhonis38862%4283.9534%100%9523.93
    Hemiculter leucisculus16727%3161.8225%100%5131.5
    Hypophthalmichthys molitrix61%2337.1618%67%1283.98
Autumn
    Hemiculter leucisculus41851%3882.529%100%8044.44
    Pseudobrama simoni18022%2163.616%83%3195.14
    Carassius auratus526%2149.816%83%1879.29
    Toxabramis swinhonis729%427.63%83%1003.46
Winter
    Hemiculter leucisculus17043%2583.9748%100%9062.75
    Toxabramis swinhonis16742%1003.219%100%6049.83
    Carassius auratus164%706.6313%67%1142.81
Section CSpring
    Hemiculter leucisculus8926%1691.2531%75%4283.5
    Toxabramis swinhonis11133%844.4615%63%3005.89
    Carassius auratus134%975.9318%88%1896.61
    Acanthorhodeus chankaensis4112%381.747%75%1428.13
Summer
    Hemiculter leucisculus92748%20,837.5960%125%13,508.9
    Toxabramis swinhonis73738%5483.416%100%5386.75
Autumn
    Pseudobrama simoni51736%7788.837%100%7355.45
    Hemiculter leucisculus35125%4981.524%100%4846.99
    Toxabramis swinhonis36626%2511.912%88%3298.34
    Carassius auratus886%4790.323%100%2911.11
Winter
    Hemiculter leucisculus4125%878.048%100%3300.3
    Hypophthalmichthys molitrix64%6546.9860%50%3166.6
    Carassius auratus3119%1867.7417%75%2694.47
    Acanthorhodeus chankaensis3018%256.52%63%1289.41
    Toxabramis swinhonis3018%203.52%63%1259.22
Table 3. Two-way ANOVA results assessing the effects of section (A, B, C) and season on species diversity and functional diversity indices.
Diversity IndexFactorsFp
Shannon-Wiener indexseason2.490.08
spatial3.59<0.05
season × spatial0.260.95
Margalef Richness indexseason3.320.03
spatial7.28<0.01
season × spatial1.070.4
Simper Diversity indexseason3.23<0.05
spatial2.970.068
season × spatial0.70.65
Pielou Evenness indexseason6.62<0.01
spatial5.75<0.01
season × spatial1.810.13
Functional richnessseason0.750.5
spatial0.80.4
season × spatial1.130.3
Functional divergenceseason0.440.72
spatial0.670.52
season × spatial0.680.66
Functional dispersionseason4.06<0.05
spatial0.190.24
season × spatial0.420.86
Functional evennessseason0.350.78
spatial1.280.29
season × spatial1.250.31
Disclaimer/Publisher’s Note: The statements, opinions and data contained in all publications are solely those of the individual author(s) and contributor(s) and not of MDPI and/or the editor(s). MDPI and/or the editor(s) disclaim responsibility for any injury to people or property resulting from any ideas, methods, instructions or products referred to in the content.

