Article

Problems of the US Recycling Programs: What Experienced Recycling Program Managers Tell

Environmental Science and Policy, George Mason University, Fairfax, VA 22030, USA
*
Author to whom correspondence should be addressed.
Sustainability 2024, 16(9), 3539; https://doi.org/10.3390/su16093539
Submission received: 26 February 2024 / Revised: 27 March 2024 / Accepted: 12 April 2024 / Published: 24 April 2024
(This article belongs to the Section Waste and Recycling)

Abstract

:
Recycling is a cornerstone of waste management. Despite its significance and growing interest, the US recycling rate has stagnated at around 35% for more than the past decade. In this study, we investigate an effective waste collection method as well as factors that may negatively affect recycling program management as a proxy measure of the recycling rate. To this end, recycling program managers and coordinators were surveyed since they play a pivotal role in the flow of recyclable materials. We found a combination of curbside and drop-off recycling to be the most cost-effective, but when managers’ experience level is factored in, the perceived significance of the combination approach decreases. Concerning barriers to recycling, we found that market variability for recycled materials, insufficient public participation in waste collection, and knowledge of best practices are critical inhibiting factors. In addition, China’s complete ban on waste import by 2030, an organizational framing effect of recycling, and a strong need for public education and outreach activities about recycling have emerged as new problems for recycling. Our findings point out recycling systems that reduce those setbacks to improve recycling performance and increase the recycling rate.

1. Introduction

In the United States, the first recorded recycling rate (percent of generation recycled and composted) in 1960 was 6.4% [1]. By 1985, the recycling rate had only increased to 10.1%. However, from 1985 to 2005, the recycling rate accelerated to 31.4% and then became stagnant from 2005–2017 at ~34% [1]. The recycling rate of municipal solid waste (MSW) is defined by dividing the total amount of MSW recycled by the total amount of MSW generated in a year [2]. The fact that a third of MWS collected is recycled indicates that US recycling programs have worked and diverted waste from landfills and incinerators through recycling programs. Several laws, including the Resource Conservation and Recovery Act (RCRA) and the Comprehensive Environmental Response, Compensation, and Liability Act (CERCLA), relate to waste management and recycling, and the US Environmental Protection Agency (EPA) has been authorized to regulate recycling in cooperation with state and local governments [3]. States share some regulatory power through partial preemption insofar as state laws do not conflict with federal statutes [4]. Local governments are the most involved in implementing and managing waste management, while the autonomy level of local governments varies by state [5]. They report compliance to their respective state governments, and state governments document compliance to the EPA.
However, if a comparative perspective is taken, the US recycling rate is relatively low and ranked 25th in the world. Germany (56.1%), Austria (53.8%), South Korea (53.7%), and Wales (52.2%) show far higher recycling rates, in part due to their national policies that encourage recycling and set clear performance targets and policy objectives for local governments [6]. The relatively low recycling performance in the US signifies foregone environmental and economic benefits associated with recycling, such as reduced natural resource extraction and raw material use, decreases in waste flown to landfills and incinerators, and reduction in pollution in groundwater, soil, and freshwater ecosystems. Recycling also saves energy consumption for natural resource extraction and thereby reduces greenhouse gas (GHG) emissions [7,8]. Overall, by increasing the recycling rate, the US could minimize negative environmental impacts, encourage the responsible method of solid waste management, and advance environmental sustainability.
Against this backdrop, this study aims to investigate barriers to US recycling programs to extrapolate the challenges of nationwide recycling practices from an industrial management perspective. We first intend to understand the most effective waste collection method amongst curbside pickup, drop-off recycling center service, or a combination of curbside and drop-off approaches. It is known that collection methods affect public participation in recycling and recycling rates [9,10,11]. We also examine both pre-identified and emerging factors that result in stagnant recycling rates. With respect to the pre-identified factors, we rely on Folz’s two seminal studies [12,13] on recycling and explore if factors found to be problematic in the past are still an issue and remain ongoing challenges. Lastly, we assess what emerging factors are perceived to be most significant when managing household recycling programs. Our focus in this study is on the recycling portion of waste diversion and materials collected from only residential sources, not commercial or industrial ones. In 2008, residential recycling programs accounted for 55 to 65 percent of total MSW generated, so the focus was limited to household waste [14].
To this end, we conducted a nationwide survey, and randomly selected recycling program managers were invited to participate. Recycling program managers were assumed to provide a holistic perspective on recycling, as they are at the core of recycling material flow. They are consumers of waste as well as producers of recycled materials, which are sold as secondary products [15,16,17]. Our study sheds light on critical inhibiting factors, including market variability for recycled materials, insufficient public participation in waste collection, and knowledge of best practices. It identifies areas for further discussion that could improve recycling program performance by hedging the external barrier and driving more internal public attention to recycling.

2. Recycling Program Management in the US

Recycling in the US has taken place since 1960. In this study, recycling refers to a collective form of waste divergence that includes all levels, from primary, secondary, and tertiary to quaternary [16]. The EPA defines the recycling rate as a combined recycling and composting rate [2] and has collected data since 1960. The recycling rate has been split into three periods (Figure 1). Period one (1960–1985) was characterized by a period of slow growth, in which the recycling rate increased by less than 4% in 25 years. Period two (1985–2010) was a period of rapid growth, where the recycling rate increased by approximately 25% in 25 years. Since 2010, the percentage of recycled and composted material has plateaued at around 35%, with the recycling rate leveling at 25% and composting rate leveling at 10%, which is a period of stagnation [1].
In relation to recycling and recycling rates, prior research has actively studied recycling programs as an integral part of sustainable waste management and creating a circular economy. Some scholars have focused on the phase of collecting recyclables [9,10,11,12,13,18] while others have studied material processing [19,20] and markets for recycled materials [15,16,17,18]. In taking an industrial ecology perspective, research has also focused on industrial recycling networks in which different industries are grouped to recycle byproducts such as cinder, waste paper, wood residuals, ashes, and scrap metals and discussed the role of industrial symbiosis networks as starting points for broader cooperation toward sustainability [21,22]. Furthermore, in line with sustainable production and consumption, individual consumers’ awareness and public perception of recycling have been studied [23,24,25,26].
While the national recycling rate has stagnated at 35%, recycling rates within each state and at the local level have varied. According to an in-depth analysis of state recycling rates, states like Maine and California had high performances, but Arizona, Mississippi, Alaska, Oklahoma, Utah, and Louisiana were found to be low performers [27]. At the local level, the cities with the highest recycling rates are San Francisco (80%), Los Angeles (76.4%), San Jose (75%), Portland, Oregon (70%), and San Diego (68%), which are all well above the national recycling rate [28]. California does have a long-term goal of transitioning to zero waste, setting strict landfill diversion percentages with a statewide goal of 75% by 2025. The strong state mandate along with a pro-environmental culture and knowledge networks could be attributed to four Californian cities’ strong recycling culture and practices [28].
Such variance in recycling rates partly relates to unfunded state mandates in which recycling programs of local governments are expected to be financed by state governments [12,13]. Recycling programs have costs associated with collection, processing, and separation, as well as the additional cost of MSW landfill tipping fees for the disposal of contaminated materials. Some states mandate a certain proportion of materials in the waste stream to be recycled and, under the mandates, fund recycling programs [29]. However, states’ funding and incentives to local governments are not always equal to the recycling program costs. Municipalities point out that limited resources are a significant hindrance since they cannot properly manage, reinvest, and improve recycling programs. It is evident that states’ funding support is essential but has not been sufficiently given.
Tipping fees and landfill capacity also influence local authorities’ waste management performance [30]. Tipping fees are directly correlated with landfill capacity, and in regions where the landfill capacity is limited, the tipping fees are higher. For example, the average tipping fees for Northeastern states are highest, ranging from 70 to 115 dollars per ton, and those of southeastern states are lowest, from 35 to 50 dollars per ton [31]. The difference in tipping fees and landfill capacity thus indicates the strong need for recycling to reduce costs associated with waste landfills in local jurisdictions.

2.1. Collection Type

Recycling programs for residential MSW gain their source materials through three collection methods, which are curbside pickup, drop-off recycling center service, or a combined curbside and drop-off approach. Curbside collection involves a service that picks up recyclable materials at an individual’s home and then transports it to a waste management facility [9]. Drop-off recycling center service requires a separate predetermined collection location, like a waste management facility or a sorting center, where participants can go and drop off their recyclable materials. This collection method can be further split into single-stream or multi-stream. Single-stream is when all recycled materials are collected in a single comingled container and separated later in recycling and/or waste management facilities. Multi-stream collection is when participants must pre-separate recyclable materials and then those separated materials are collected in compartmentalized trucks [9].
The single-stream method lowers collection costs by eliminating the need for special compartmentalized trucks, but it tends to have higher operational costs for material separation [9]. High levels of contamination are concerned [20], which can reduce acceptance rates at the facility [19] and lower prices for commodities [9,17]. In contrast, the multi-stream collection method can lower the associated operational costs, but the collection costs are overall high due to the need for specialized trucks [9]. Prior studies found that collection methods affect recycling rates [10] and public participation in waste collection [11].

2.2. Factors Determining Recycling

Recycling depends much on recycling program managers’ ability to recycle or sell recyclable materials. Many significant factors affect recycling, including material characteristics, market variability, contamination of recyclable materials, and global waste trade policy, particularly a Chinese policy to ban industrial and nonindustrial waste imports by 2030 completely. Key factors underlying recycling rates are as follows.
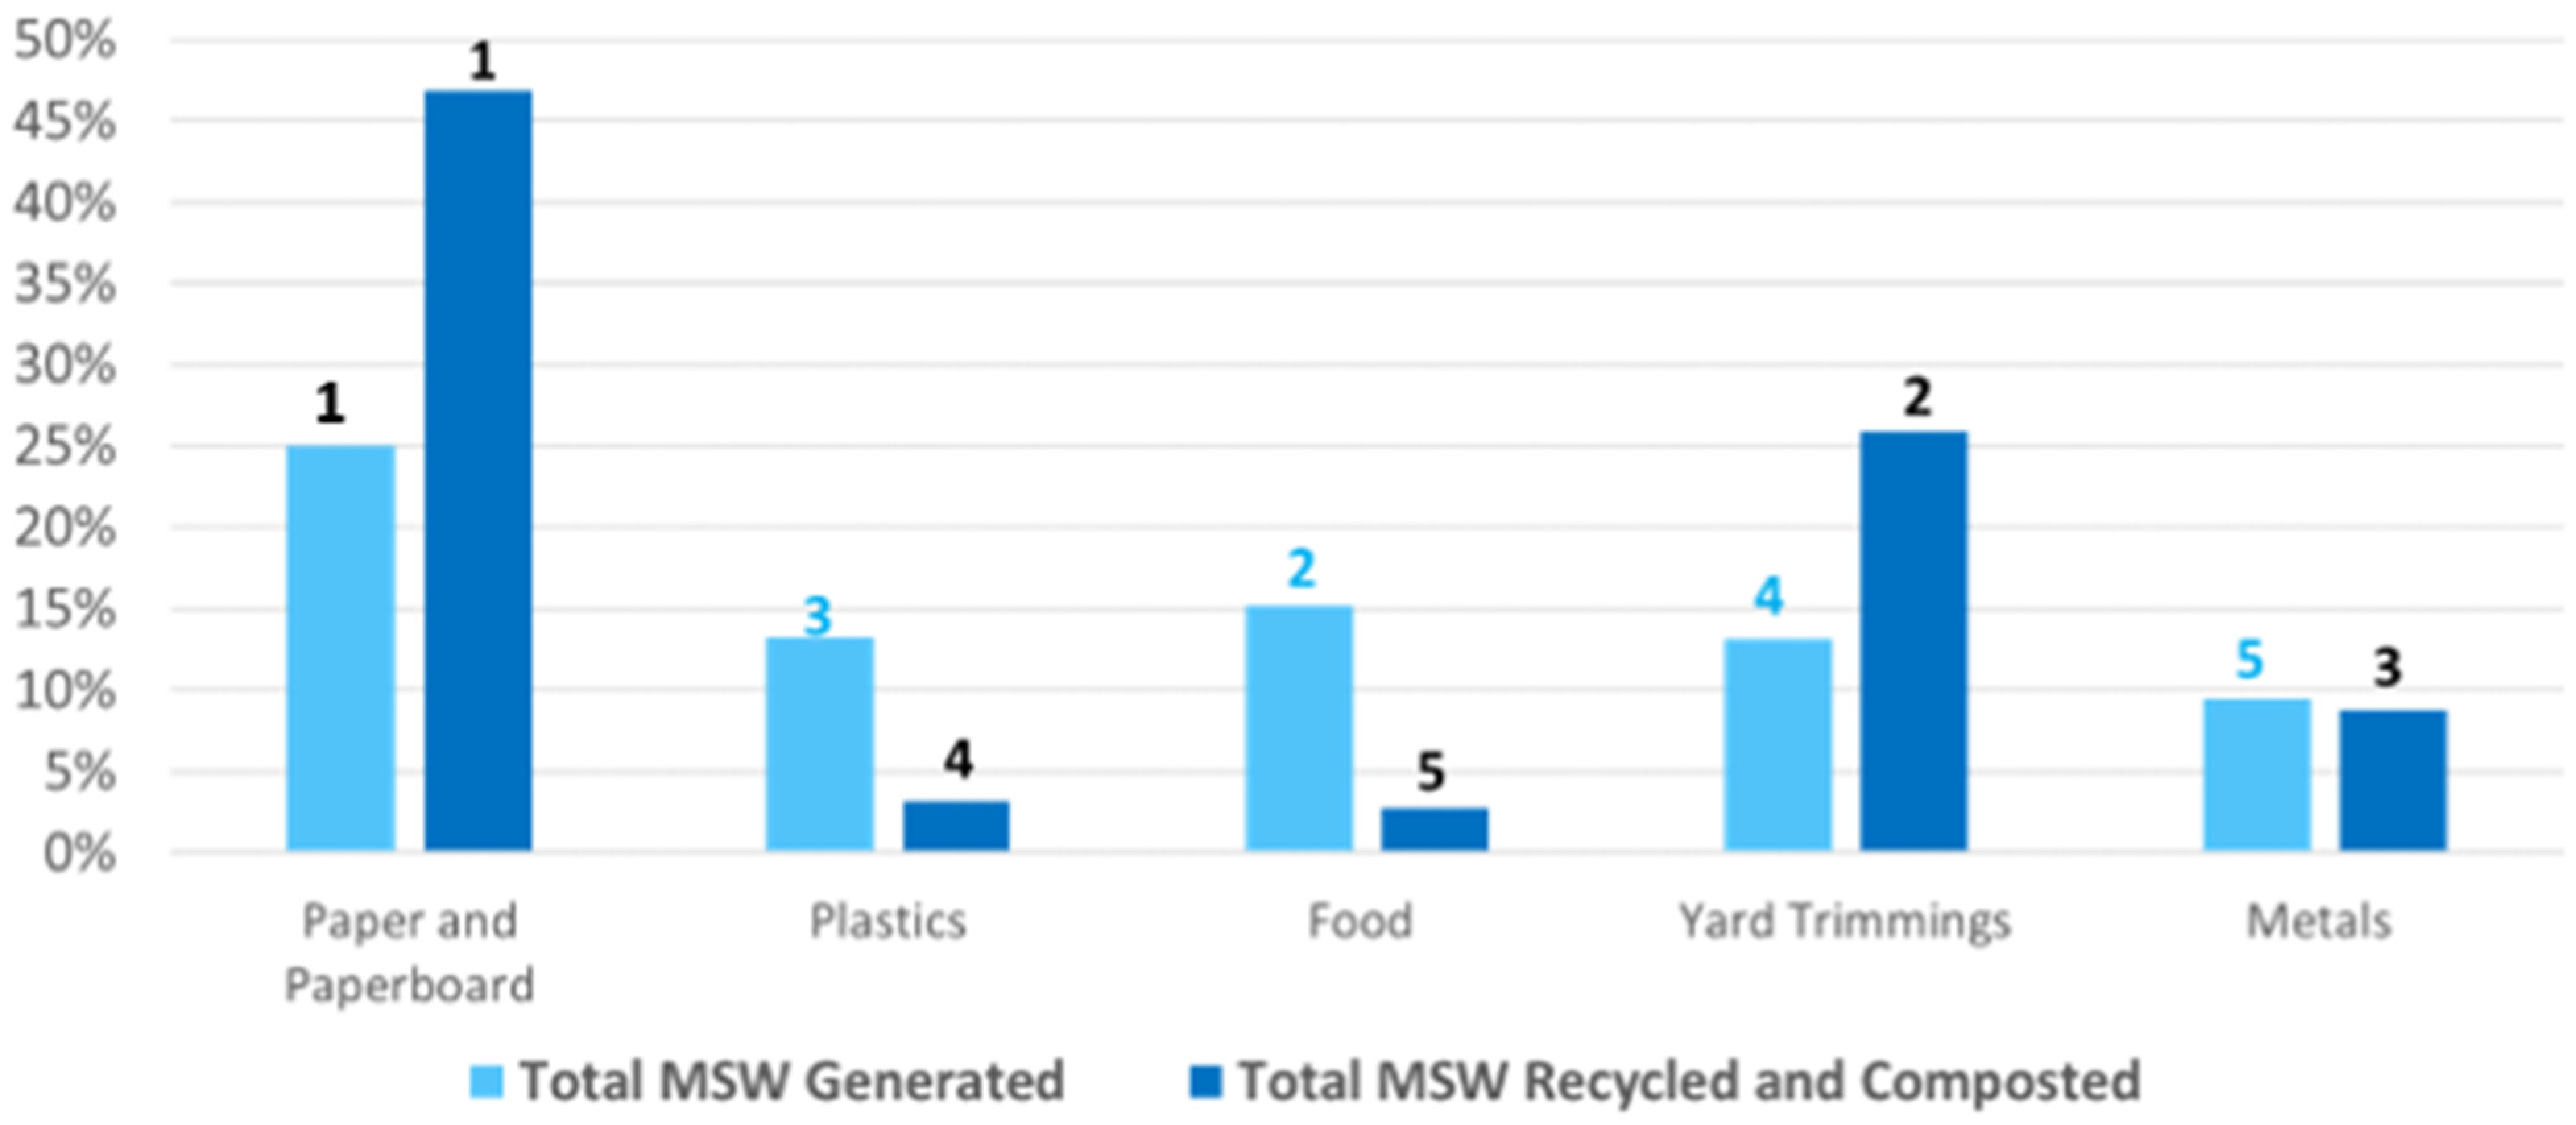
First, material characteristics determine a material’s recyclability. In 2017, the total MSW was 267.8 million tons, and paper and paperboard accounted for a quarter of it. Food (15.2%), plastics (13.2%), yard trimmings (13.1%), and metals (9.4%) followed. However, as to recycling, paper and paperboard (46.9%), yard trimmings (25.9%), metals (8.8%), glass (3.2%), and wood (3.2%) account for 97.2 million tons of recycled items [1]. Recycling in plastics and food was drastically low, showing the challenges of recycling the materials (Figure 2).
Paper and cardboard, as well as metals (i.e., aluminum, steel, etc.), have standardized methods for collection and processing and pre-established secondary markets. However, plastics are hard to recycle as they are versatile with multiple applications, cheap to produce, and have a high strength to weight ratio that indicates strong durability [7,32,33]. However, the rapid production and consumption of plastics have introduced a new material into the MSW stream, adding more burdens on recycling managers. It is alarming that global plastic production has grown from 2 million tons annually to over 381 million tons annually from early 1950 to 2015 [7,34].
Secondly, market variability plays a significant role in recycling. Recycling managers must operate in a complex secondary market that has high variability. Price volatility is driven by uncertainty in secondary recycling markets [17]. Contamination, uncertainty of the total volume of recyclables collected, and the price of virgin materials have all contributed to fluctuating market prices for recyclables. For instance, some virgin materials like steel and plastic resin have a higher price volatility because of natural resources, and the prices of recycled materials, including plastics, fluctuates [17].
Third, contamination can decrease the quality of materials during sorting and recycling, thereby lowering the recycling rate. Contamination of paper can reduce the strength of secondary fiber [35], while contaminated plastics can cause visual imperfections and reduce the strength and integrity of secondary products [35]. For instance, fiber products, including paper and cardboard, can be recycled on average six or seven times. However, the bonds that hold fibers together are weakened when recycled, and the fibers lose resilience [35]. Recycled fibers thus have a lower quality or value and often need to be combined with virgin fibers for structural integrity. Also, public perception that recycled materials are of inferior quality or have a higher potential for contamination results in reducing recycling [17,36].
Lastly, global waste trade policies like the Chinese ban on waste imports by 2030 would crucially affect recycling. For instance, since the 1980s, China has imported foreign waste to subsidize the shortfall of raw materials, becoming the world’s largest importer of solid waste [37]. However, recently, China banned the import of over 24 distinct types of solid waste, including several recyclable materials like scrap metals and non-industrial and industrial plastics, and dedicated 100% of the implementation of the ban by 2030 [38,39,40]. This policy would be highly impactful to countries exporting waste to China, including the US [40]. Scholars have found that the Chinese ban policy has already started shifting waste exports to other South Asian countries like Malaysia, Vietnam, and Taiwan [38,40], where cost-effective recycling technologies are not equipped [39]. In the US, over sixty curbside recycling programs seem to have been affected by the ban policy [41].

3. Research Design and Methods

3.1. Survey Plan

To understand problems associated with the stagnated recycling rate in the US, we decided to conduct a survey targeting recycling program managers. Folz’s surveys conducted in 1989 and expanded in 1996 were insightful, as they investigated recycling program managers’ perceived problems in recycling [12,13].
In 1989, Folz distributed a national survey to the recycling coordinators of 450 cities across 25 states, and 264 officials responded to the survey. Overall, 60% of the survey respondents were full-time recycling coordinators and 40% were part-time employees. Some of the part-time employees held positions in local public works departments [12]. The second survey was undertaken in 1996, inviting the same individuals. In total, 158 recycling program managers and coordinators responded, showing a response rate of 64%. The respondents’ average years of experience in the industry increased from 6.7 years (1989) to 8.9 years (1996). Folz found that financing recycling programs, getting residents to participate in recycling, and the lack of reliable material markets were critical issues impeding recycling, as shown in Table 1 [13]. We surmised that the factors identified by Folz provide a baseline for consideration in designing our survey, even though we acknowledge that there may be other factors that should be counted and reflected in the current context of recycling markets and the global waste trade. Table 1 summarizes the mean scores of each factor from Folz’s 1989 and 1996 surveys and subsequent ranking based on the means. In Folz’s studies, program managers scored each problem with a 5-point Likert scale, and the mean scores were averaged out and divided by the number of managers answering the survey [13].

3.2. Data Collection and Analysis

The survey was posted on the open forum for the Planning & Management Technical Division www.community.swana.org (accessed on 1 February 2024) of the Solid Waste Association of North America (SWANA). SWANA is a nationally reputed organization of public- and private-sector professionals committed to solid waste management and resource management, working directly with local governments and their private sector partners [1]. The survey was open for three weeks, from 16 March 2020 to 3 April 2020. Survey responses did not include any personal information except for participants’ dwellings in the industry. To qualify for the study, participants must have at least one year of experience in the waste management industry and be 18 years or older.
The survey questionnaire was composed of three sections. The first section focused on survey participants’ experience level and their perception of the effectiveness of waste collection methods amongst curbside pickup, drop-off recycling center service, and a combination of curbside and drop-off approaches. Section two asked how the factors known as barriers to recycling in Folz’s studies, namely, established factors, are still perceived to be important by respondents. Responses to each factor were rated on a 5-point Likert scale from 1 (not important) to 5 (highly important).
Section three focused on identifying respondents’ viewpoints on emerging factors that may influence recycling management program performance. Relying on prior research, we selected eight key factors and asked survey participants to answer using the 5-point Likert scale of 1 (strongly disagree) to 5 (strongly agree) about the influence of each factor. For instance, in order to measure an organizational framing effect on recycling, we asked “how an organization communicates and/or defines recycling to the public would influence recycling program management”.
As one of the critical research questions, we focused on how recycling program managers’ experience level affects their preference for collection methods. We posited that more experienced participants could have a deeper understanding of recycling performance depending on waste collection types. Data analysis was conducted using an independent t-sample test in R Studio after creating a categorical variable of “experience in the waste management industry”. For this analysis, 0 to 9 years of experience was coded as 1, 10 to 25 years of experience was coded as 2, and more than 25 years of experience was coded as 3. Also, we used descriptive statistics for emerging and established factors that are setbacks to recycling program management.

4. Results

We collected 54 responses from recycling program managers and coordinators, and they worked for at least one year to forty-plus years, with an average of nineteen years working in the industry. Table 2 presents how the years of experience were divided into experience categories; 15 individuals met the qualifications for level one (<10 years), 24 individuals met the qualification for level two (10–25 years), and 15 individuals met the qualifications for level three (>25 years).
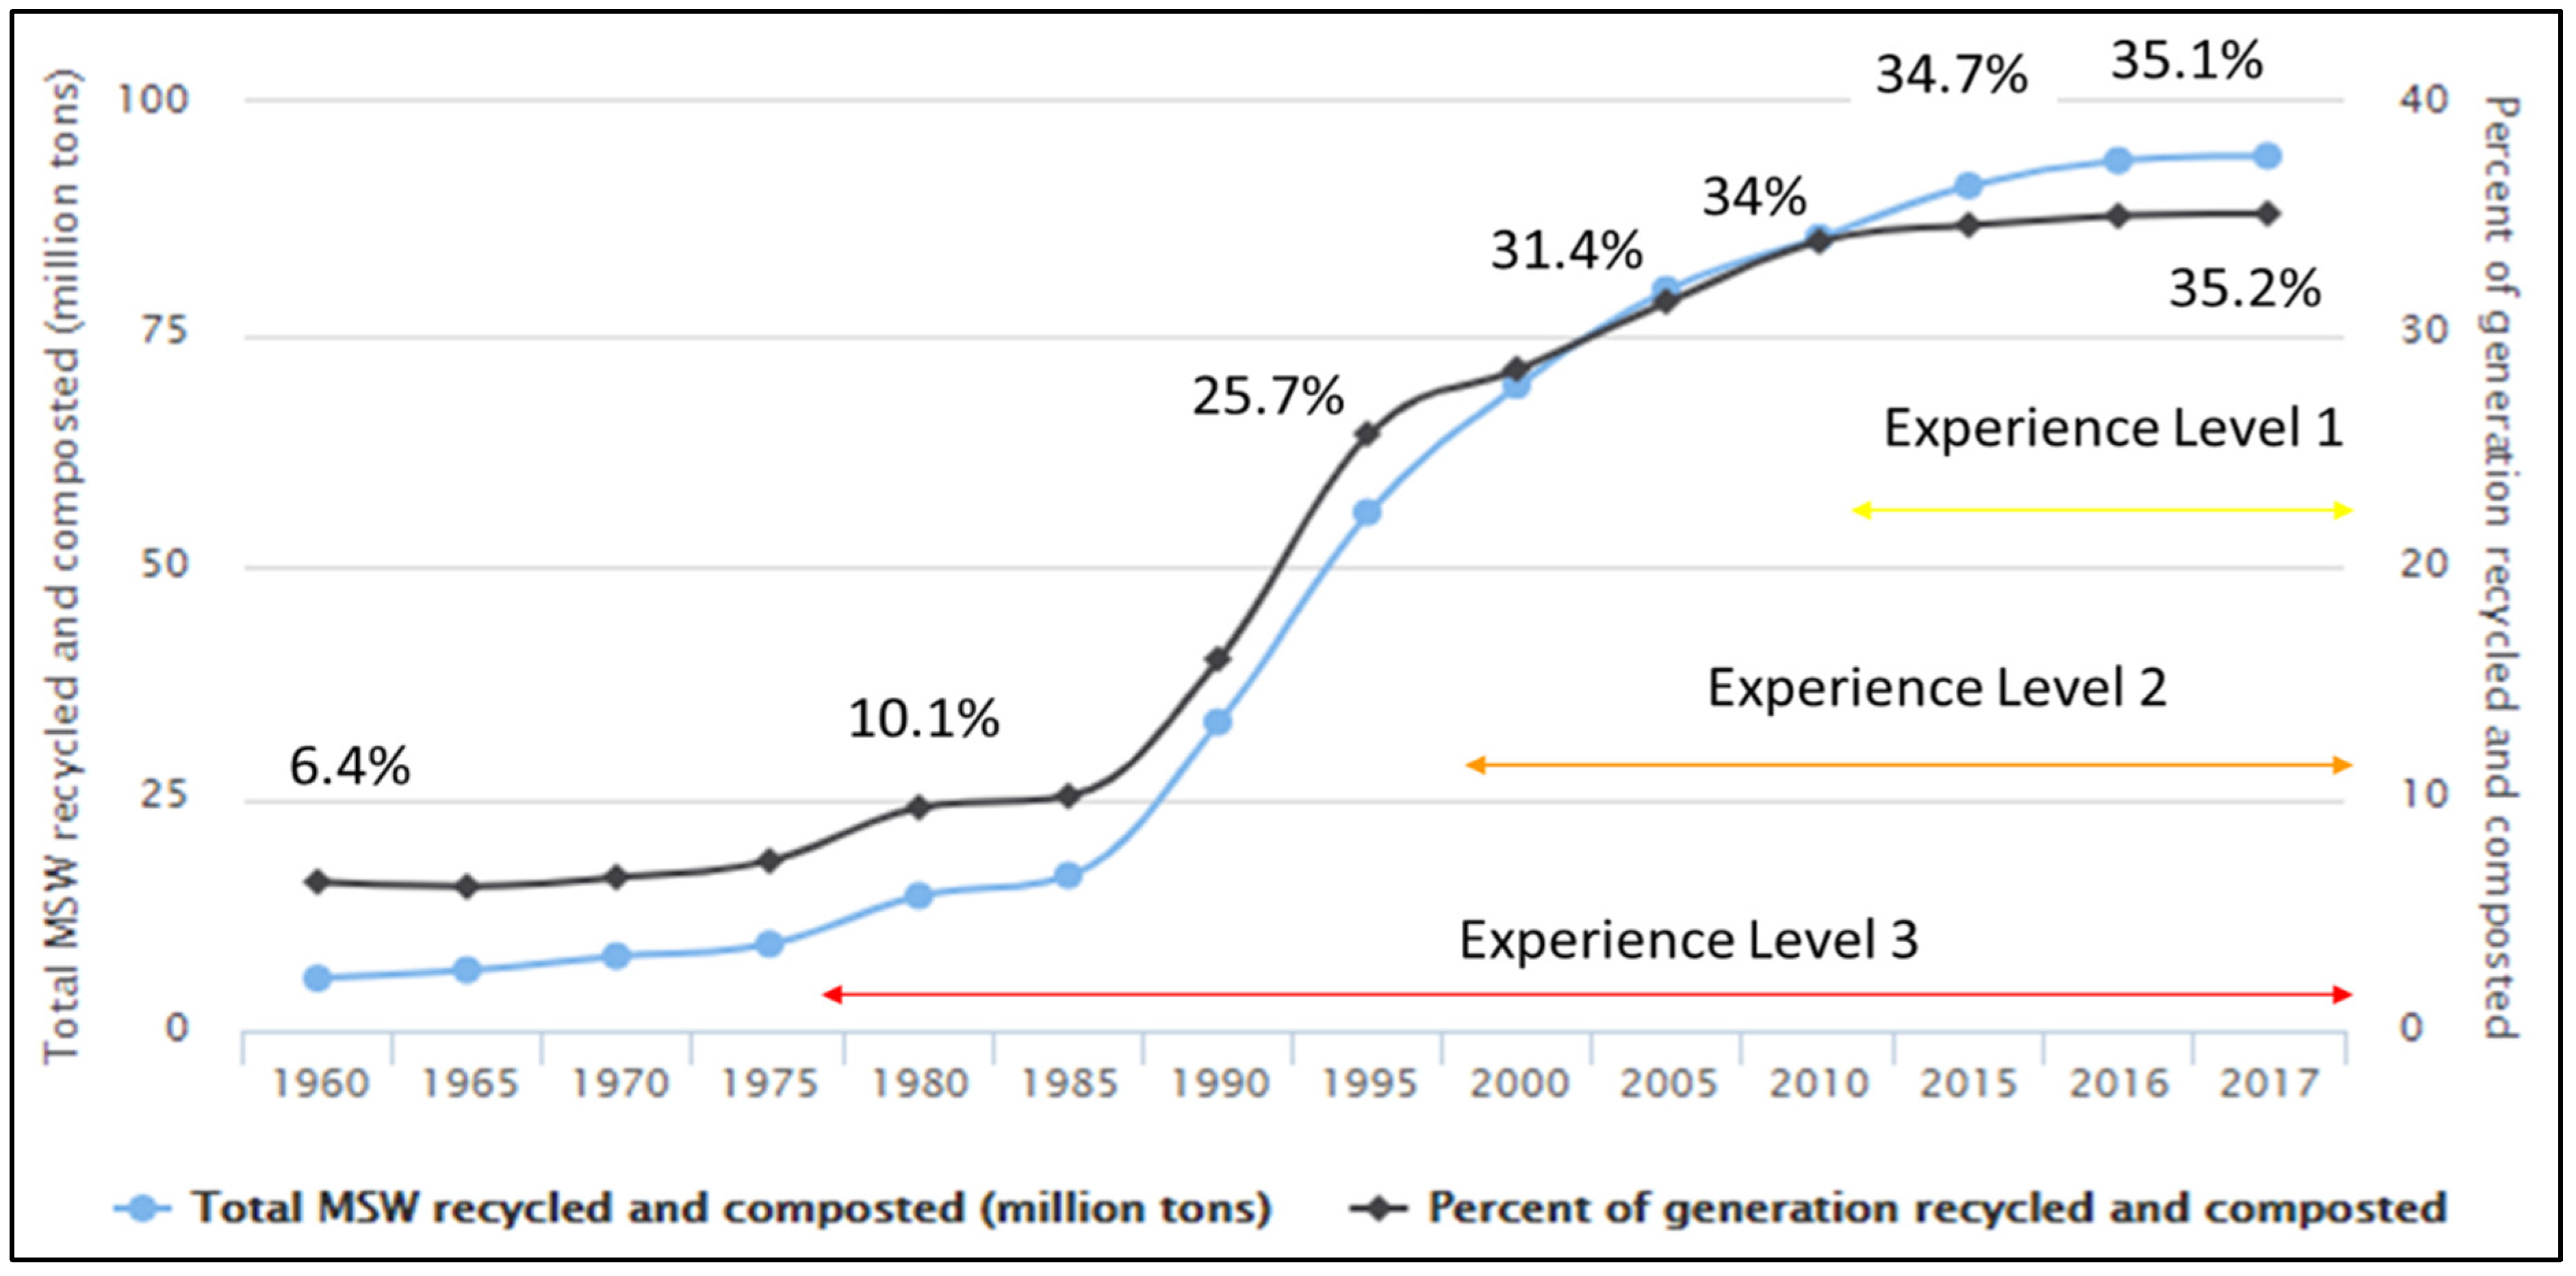
Figure 3 shows the three experience levels with changes in the US recycling rates. The EPA graphic extends from 1960 to 2017, and experience levels would be by 2020. The reported recycling rates can be split into three major periods in relation to this research. Period one (1985–1994) represents a rapid increase in the percentage of MSW recycled and composted, approximately 15%. Level 1 individuals worked in the waste management industry when the recycling rate began to become stagnant. Period two (1995–2009) represents a slower increase and/or rise in recycling rate, approximately 10%. Level 2 individuals would have experienced slowed growth and eventual stagnation of the recycling rate. Finally, period three (2010–2017) was the period when the recycling rate began to stagnate, and that period extends to the present day. Respondents in experience level 3 would have knowledge of the recycling industry throughout multiple transitions.

4.1. Collection Types

Regarding collection types, we asked which collection method is more effective among the three collection types compared: curbside only, drop-off only, or a combination of both. Table 3 shows the percentage of respondents who reported that curbside only, drop-off only, or a combination of collection types were the most effective. The percentages were computed by adding all responses divided by the total number of respondents in each experience group, experience level 1, 2, and 3. The results showed that 75.9% of respondents believed that a combination of both curbside and drop-off collection was the most effective, 20.3% stated that curbside only was the most effective, and only 3.7% stated that drop-off only was the most effective. We also find that as experience level increases, the number of responses for curbside only or drop-off only increases, but the number of combination responses decreases.
Table 4 depicts the results of two-sample t-tests between experience levels and collection type responses. Our findings suggest that the differences between experience levels and curbside only responses are not statistically significant (p > 0.10), but the differences between experience levels and drop-off only (p < 0.5) and combination (p < 0.1) responses are statistically significant. This means that, as managers’ experience increases, they find that drop-off only could also be cost-effective in some cases, while managers of experience levels 1 and 2 never consider drop-off only as an effective waste collection method. As far as a combination approach is concerned, the less-experienced managers favored the approach as a cost-effective option.

4.2. Established Factors Associated with Recycling

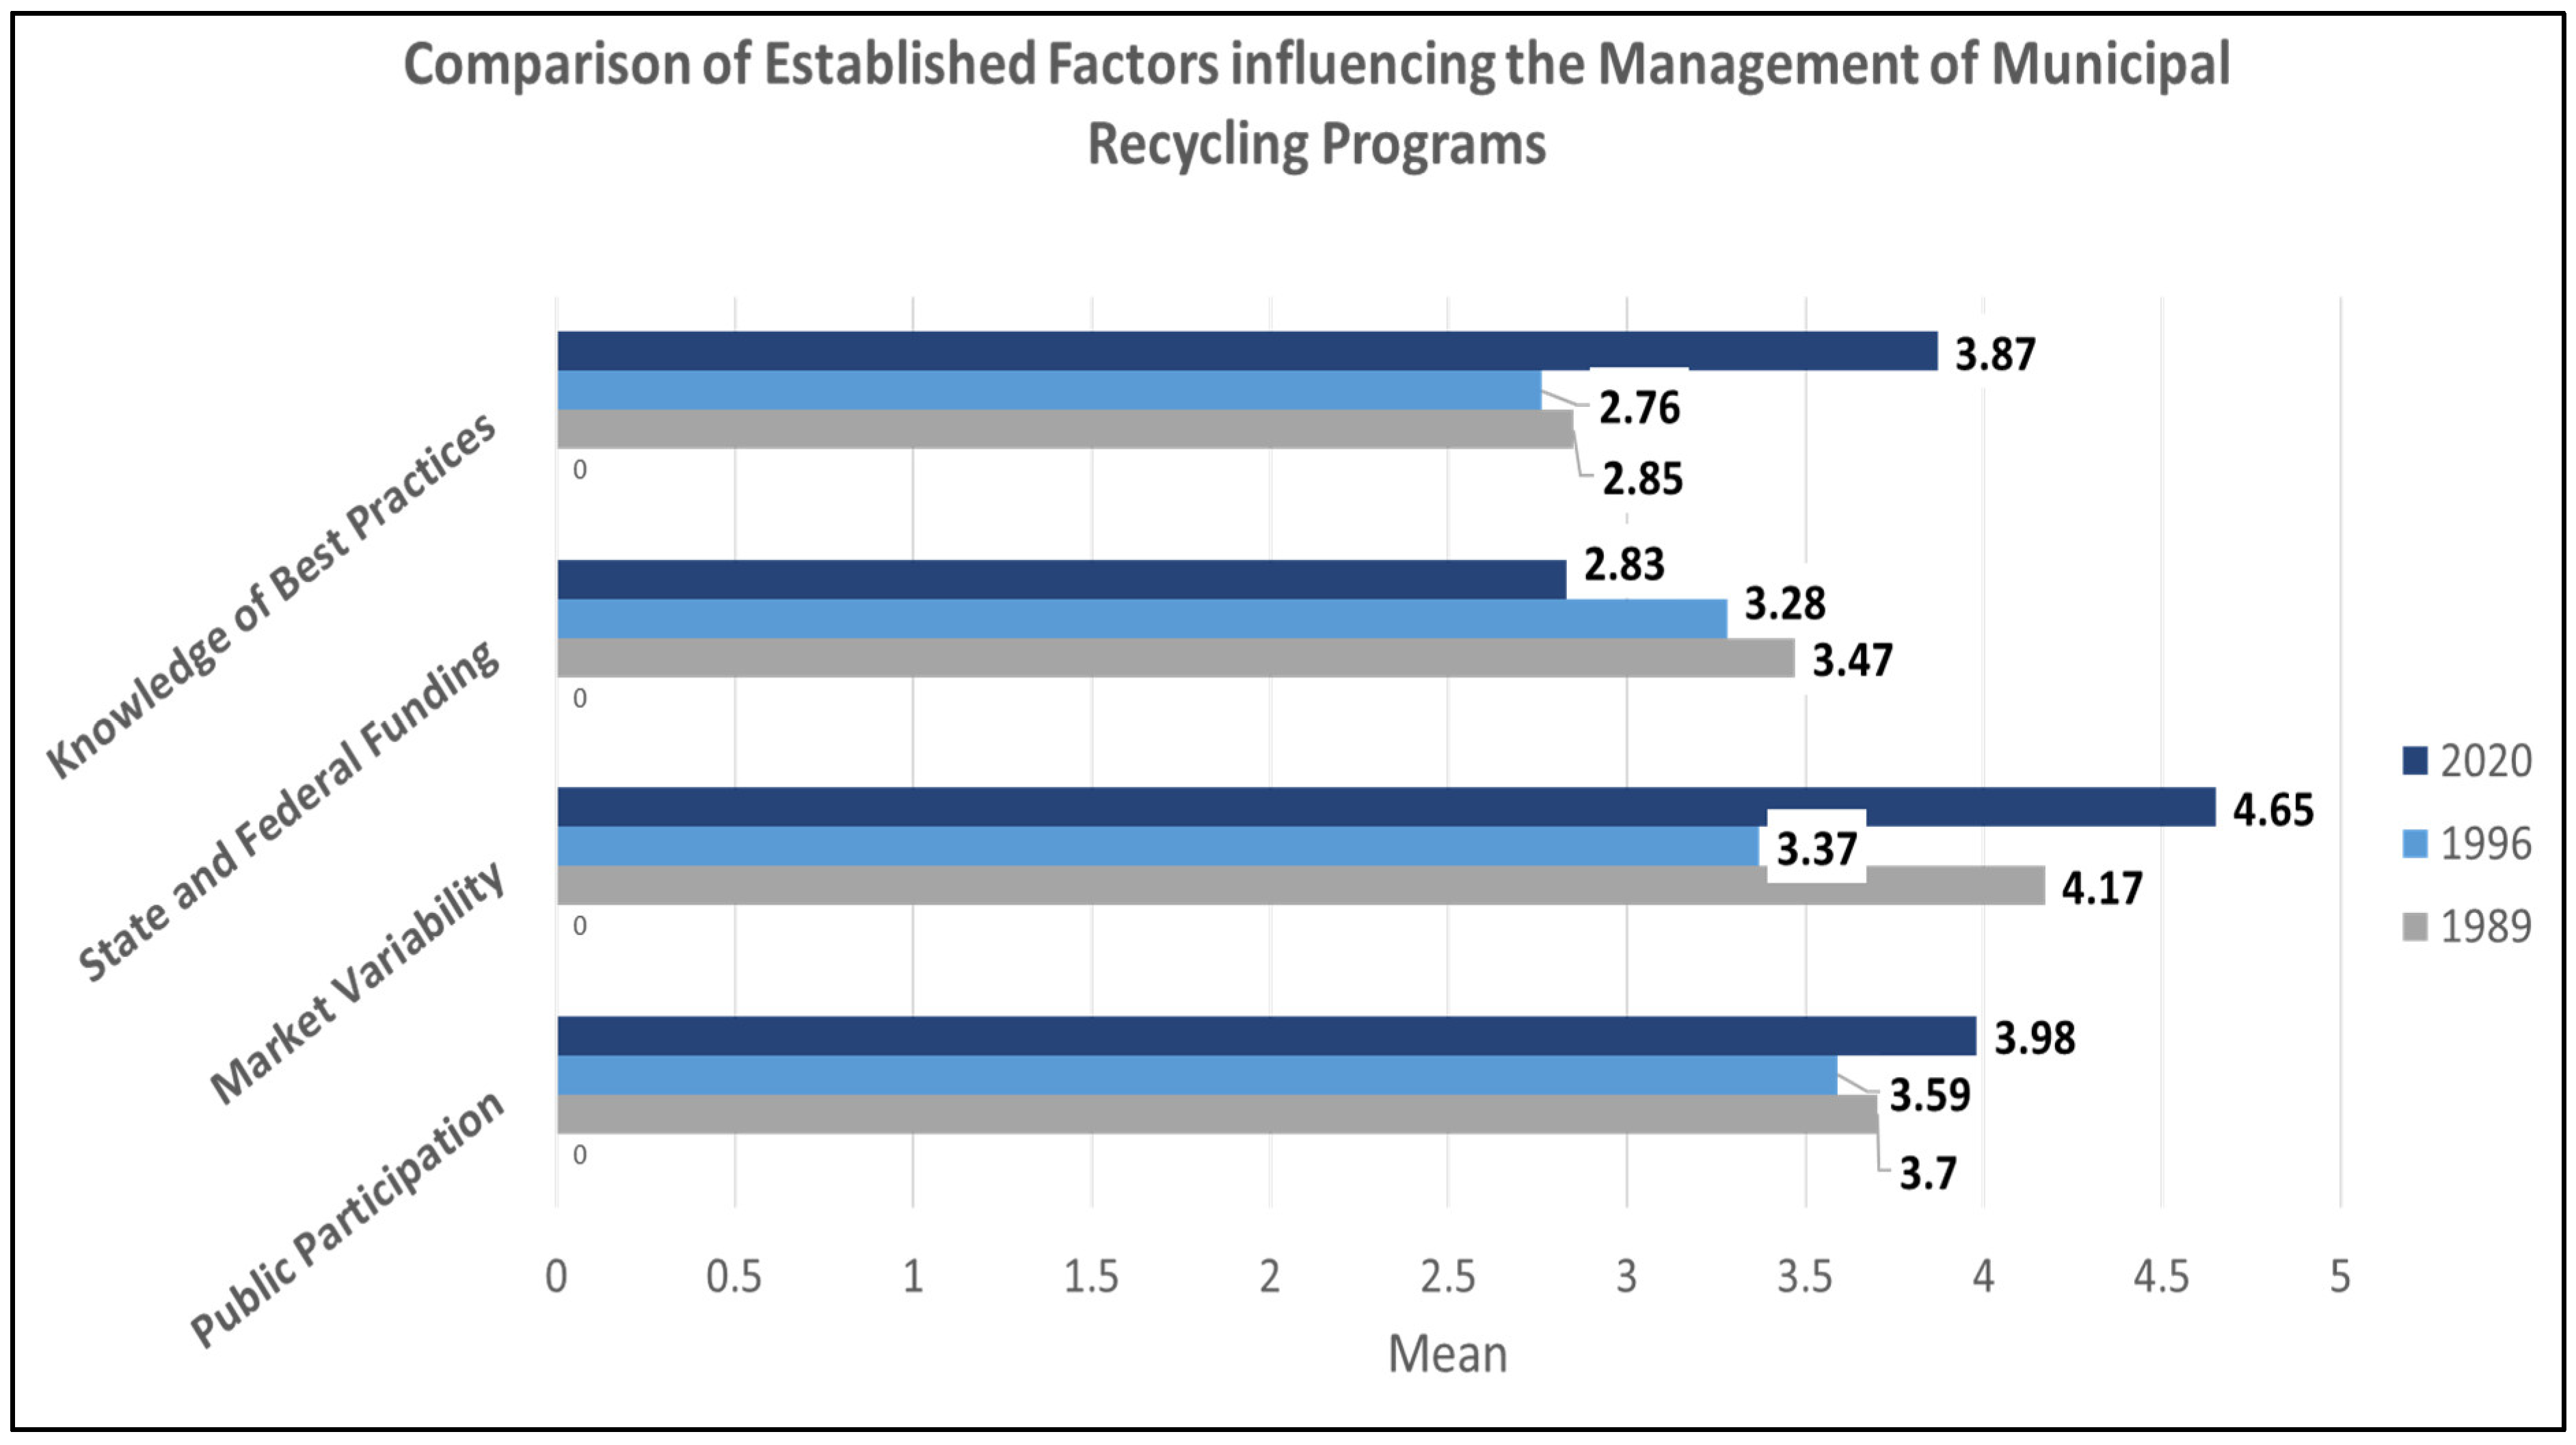
Figure 4 shows a comparison of mean scores of the established factors influencing the management of municipal recycling programs in 1989, 1996, and 2020. Originally, there were six factors listed in Folz’s studies; our study included four factors after eliminating the lowest-scored factor, “theft and scavenging of recyclables”, and simplifying financial assistance-related factors into “state and federal funding”. Therefore, four factors, “knowledge of best practices”, “state and federal funding”, “market variability”, and “public participation”, were examined as established factors. Also, Folz’s studies and our studies have unequal sample sizes. Figure 4 gives an approximate idea of whether certain factors are still regarded as important or not, rather than directly comparing Folz’s prior studies and this study. The mean scores in 1989 and 1996 were adopted from Folz’s studies, while the mean scores of 2020 were computed using a descriptive statistic of means for each factor in our survey.
Note that if the problems identified in Folz’s studies [12,13] were addressed, the means of the established factors in our study should be lower. For instance, Folz found that recycling program managers’ perceived importance of market variability was reduced from 1989 to 1996, when the recycling rate was sharply soaring. Market variability thus was a less significant problem in 1996 than in 1989 [13].
However, our survey showed that the mean of “market variability” increased compared to 1996. Also, “public participation” and “knowledge of best practices” were found to be important, as their mean scores were higher than those in the 1989 and 1996 studies. It is interesting to know that those established factors are still perceived to be important, contributing to the stagnant recycling rate at 35% since 2010. In contrast, “state and federal funding” was perceived to be less problematic, indicating that financial support from higher governments in 2020 has been more available than in 1989 and 1996.

4.3. Emerging Factors Associated with Recycling

When the importance of emerging factors in recycling was asked, China’s policy to ban waste imports by 2030 was found to be highly important (mean = 4.48/5.00, in Table 5). Organizations’ approach to defining and/or communicating recycling (mean = 4.09/5.00), as well as a strong need for public education and outreach activities (mean = 4.07/5.00), were perceived to be important to affect recycling. Both factors relate to the significance of organizational attitudes toward recycling internally and externally to the public. Depending on material characteristics, costs of managing recycling programs, and willingness to reduce landfills and disposals via recycling, organizations may decide what to recycle and how to collect and communicate the prioritized cost-effective recyclable items to the public.
Extended Producer Responsibility (EPR) is a prevalent concept in the EU and other countries with high recycling rates [6], but it is relatively less practiced in the US. As such, it is unsurprising that this factor was not considered very important. The factor of “growing plastic consumption” ranked sixth out of eight factors, indicating that increasing plastic production and consumption has not greatly affected recycling performance, while plastic recycling has emerged as a significant waste management issue. The availability of technical assistance from federal and state governments was also not found to be highly important, implying that recycling program performance is more likely to rest with local governments and recycling management organizations’ capacity to prioritize recyclable items and communicate them with the public [42]. Table 5 summarizes the importance of emerging problems in managing recycling programs.

5. Discussion

In this study, we aimed to understand an effective waste collection type and problems associated with managing recycling programs and thereby contributing to the stagnant US recycling rate at around 35%. Recycling involves multiple stakeholders, but the perspectives of recycling program managers and coordinators are crucial to understanding the material flow in recycling. Recycling program managers provide a holistic perspective in their roles, as they are consumers of waste and producers of recycled materials, which are sold as secondary products [15,16,17]. We thus relied on recycling managers’ viewpoints regarding the barriers to recycling and weighed on their experiences, through which they could have experienced varying speed of recycling rate growth.
We found that the combination method of curbside and drop-off is most cost-effective, but when the experience of recycling managers was accounted for, either curbside only (26%) or drop-off (13%) was perceived to be cost-effective compared to their perceived cost-effectiveness by managers with low experience levels. Concerning the curbside approach, 59% of US households have access to curbside recycling programs [43], and curbside pickups are mostly carried out in a single stream and thus assumed to be cost-ineffective with mixed recyclables [24]. When recyclable items are mixed in single-stream recycling bins, the curbside approach can increase program costs, although providing convenience to consumers and increasing the volume of recyclable items collected. Accordingly, recycling program managers’ perspective illuminates the value of combined recycling collection with curbside pickup and drop-off service.
With respect to the problems of recycling, we included the established factors that have historically affected the management of recycling programs and the emerging factors that have impacted the management and operation of recycling programs after Folz’s studies. As to established factors, we found that market variability for recycled materials, insufficient public participation in waste collection, and knowledge of best practices remain problematic, affecting recycling performance. Market variability and its associated price volatility in secondary recycling markets are hard to correct, as they would depend on the total volume of recyclables collected, contamination in recyclable materials, and the virgin price of materials. Preventing contamination during collection, selecting a collection type suitable for towns, and improving education and government policy for the financial stability of recycling markets could alleviate this problem. Insufficient public participation in waste collection and knowledge of best practices, which ranked second and third of the remaining issues, need to be approached with more strategic public education and outreach as well as knowledge sharing on multiple information sharing platforms [23]. Individual consumers’ attitudes and preferences towards recycling and products based on recycling, age, region, and education create variances, which indicates segmentation of the public is important to communicate recycling, create demands for recycled products, and thereby raise the national recycling rate [44].
Concerning emerging factors, the Chinese policy to ban waste imports by 2030 raises the biggest concern for US waste management, as much of the US waste is exported to China [38,39,40]. This fact illustrates a solid reason to expand and invest in recycling programs to mitigate the impact of the ban policy. The organizational framing impact is ranked second, indicating conceptualizing recycling is critical. Recycling can be understood differently, including remanufacturing, closing the loop, cycling, and reusing waste [31]. A win-win rhetoric of sustainability could appeal to the public rather than grounding in individuals’ moral motives [23,45]. Furthermore, public education and outreach activities to inform effective recycling methods were revealed to be critical. Recycling performance is highly dependent on material characteristics, and the public should be informed about the details of the collection, such as recyclable materials and the need to rinse and wash recycling items at the source. Accordingly, recycling program managers must develop and implement effective public information campaigns with concrete and specific messages on how and what to recycle [23] while educating the public on recycling as an essential means to promote environmental sustainability, create a circular economy, and lessen social inequality with reduced landfilling or incineration needs [26].
Our study sheds light on the complexities of recycling challenges, drawing on insights from recycling program managers who bring years of experience to the table. This approach has enriched our comprehension of the obstacles to recycling and provided a precise depiction of national recycling efficacy. Despite the value of this study, it is worth acknowledging the limitations of our research. First, the experience level of recycling program managers is critical in assessing problems associated with recycling, but other factors may need to be considered. For instance, while some program coordinators indicate their long-term experience in waste management, their understanding of recycling problems could differ by sector (i.e., public vs. private) and location (i.e., urban vs. rural). Demographic and geographic factors, including population density and distance to recycling facilities, could also tell a difference in whether drop-off could be more cost-effective than a curbside approach. Future research may replicate this study by considering those factors on multiple distribution platforms that could allow a larger sample size.

6. Conclusions

Recycling stands at the core of waste management, fostering both economic and environmental health. By reducing the need for raw materials, it lowers both the financial and environmental impacts associated with landfill usage or burning waste. The simple act of recycling by individuals contributes to a decrease in the extraction of natural resources, cuts energy use and soil pollution, combats greenhouse gas emissions, and encourages sustainable living practices. Acknowledging its benefits to economic, environmental, and social sustainability, the United States has implemented recycling practices since 1960, with nearly one-third of discarded waste now being recycled. Reflecting this tradition, there has been significant research exploring various aspects of recycling, including the steps involved in recycling programs like collection [9,11,12,13,15,18,19], material processing [19,42], the markets for recycled goods [15,16,17], trends worldwide, and international policies [37,39,40].
The United States leads the world in the generation of municipal solid waste, yet its recycling rates have plateaued since 2010, prompting questions about both internal and external challenges. A distinct survey involving waste management and recycling professionals has revealed that well-known issues, along with emerging factors, could hinder the increase in recycling rates. The array of emerging challenges underscores the complexity of enhancing recycling through behavioral changes, rather than simply raising environmental awareness, confirming the results from prior research [44,46]. New concerns include the necessity for EPR, funding shortfalls in recycling programs, and the rising consumption of plastics, all of which demand cooperative efforts and innovative solutions. For example, replacing plastic packaging with bio-based materials, supported by research and development policies and entrepreneurial ventures, could significantly promote the circular economy and environmental sustainability [7].
This study paves the way for numerous research opportunities. Firstly, considering the significant increase in US recycling rates between 1995 and 2009, identifying which sustainability measures played a key role in this growth would be insightful. Secondly, there is a need for further study into the most effective recycling management practices and how these can be applied in regions and states with lower recycling rates, particularly in light of new challenges. Thirdly, examining the readiness of local governments to enhance recycling policies, especially with the impending bans on waste exports and the push for broader adoption of EPR in the US [47], warrants attention. Fourthly, it is crucial for those managing recycling programs to craft and execute targeted public awareness campaigns that provide clear guidance on recycling practices and promote waste minimization alongside recycling [23,26]. Lastly, engaging various stakeholders—including the general public, community and environmental leaders, and policymakers at all levels—could broaden our understanding of how to optimize the financial and environmental benefits of recycling. In summary, our findings indicate a significant scope for research aimed at overcoming these challenges to enhance recycling efforts and foster a circular economy and sustainable future.

Author Contributions

Conceptualization, K.T. and Y.K.; methodology, K.T. and Y.K.; software, K.T.; validation, Y.K.; formal analysis, K.T.; writing—original draft preparation, K.T. and Y.K.; writing—review and editing, K.T. and Y.K.; visualization, K.T.; supervision, Y.K. All authors have read and agreed to the published version of the manuscript.

Funding

This research received no external funding.

Institutional Review Board Statement

Ethical Review and approval were waived for this study (1573508-1) due to exemption category #2 by George Mason University IRB.

Informed Consent Statement

Not applicable.

Data Availability Statement

Data can be available upon request.

Conflicts of Interest

The authors declare no conflict of interest.

References

  1. U.S. Environmental Protection Agency. Advancing Sustainable Materials Management: Fact Sheet. 2019; pp. 1–22. Available online: https://www.epa.gov/sites/production/files/2019-11/documents/2017_facts_and_figures_fact_sheet_final.pdf (accessed on 9 September 2023).
  2. U.S. Environmental Protection Agency. Measuring Recycling: A Guide for State and Local Governments. 1997. Available online: https://archive.epa.gov/wastes/conserve/tools/recmeas/web/pdf/guide.pdf (accessed on 21 November 2023).
  3. Shahnawaz, M.; Sangale, M.K.; Ade, A.B. Bioremediation Technology for Plastic Waste; Springer: Singapore, 2019. [Google Scholar]
  4. Lester, J.P. Environmental Politics & Policy: Theories and Evidence; Duke University Press: Durham, NC, USA, 1995. [Google Scholar]
  5. Scheberle, D. Environmental federalism and the role of state and local governments. In Oxford Handbook of U.S. Environmental Policy; Kraft, M.E., Kamieniecki, S., Eds.; Oxford University Press: Oxford, UK, 2012. [Google Scholar]
  6. Gilles, R.; Jones, P.; Papineschi, J.; Hogg, D. Recycling: Who Really Leads the World? Eunomia and the European Environmental Bureau: Bristol, UK, 2017; pp. 1–39. Available online: https://www.eunomia.co.uk/reports-tools/recycling-who-really-leads-the-world-issue-2/ (accessed on 21 January 2024).
  7. Kim, Y.; Ruedy, D. Mushroom Packages: An Ecovative Design Approach in Packaging Industry. In Handbook of Engaged Sustainability; Dhiman, S., Marques, J., Eds.; Spring Nature Publishing: Cham, Switzerland, 2019. [Google Scholar]
  8. Minunno, R.; O’Grady, T.; Morrison, G.M.; Gruner, R.L. Exploring environmental benefits of reuse and recycle practices: A circular economy case study of a modular building. Resour. Conserv. Recycl. 2020, 160, 04855. [Google Scholar] [CrossRef]
  9. Lakhan, C. A comparison of single and multi-stream recycling systems in Ontario, Canada. Resources 2015, 4, 384–397. [Google Scholar] [CrossRef]
  10. Sidique, S.F.; Joshi, S.V.; Lupi, F. Factors influencing the rate of recycling: An analysis of Minnesota counties. Resour. Conserv. Recycl. 2010, 54, 242–249. [Google Scholar] [CrossRef]
  11. Starr, J.; Nicolson, C. Patterns in trash: Factors driving municipal recycling in Massachusetts. Resour. Conserv. Recycl. 2015, 99, 7–18. [Google Scholar] [CrossRef]
  12. Folz, D.H. Recycling program design, management, and participation: A national survey of municipal experience. Public Adm. Rev. 1990, 51, 222–231. [Google Scholar] [CrossRef]
  13. Folz, D.H. Municipal recycling performance: A public sector environmental success story. Public Adm. Rev. 1999, 59, 336–345. [Google Scholar] [CrossRef]
  14. U.S. Environmental Protection Agency. Municipal Solid Waste in the United States: 2007 Facts and Figures. pp. 1–178. Available online: https://archive.epa.gov/epawaste/nonhaz/municipal/web/pdf/msw07-rpt.pdf (accessed on 21 November 2023).
  15. Geda, A.; Ghosh, V.; Karamemis, G.; Vakharia, A. Coordination strategies and analysis of waste management supply chain. J. Clean. Prod. 2020, 256, 120298. [Google Scholar] [CrossRef]
  16. Hopewell, J.; Dvorak, R.; Koisor, E. Plastic recycling: Challenges and opportunities. Philos. Trans. R. Soc. B 2009, 364, 2115–2126. [Google Scholar] [CrossRef]
  17. Stromberg, P. Market imperfections in recycling markets: Conceptual issues and empirical study of price volatility in plastics. Resour. Conserv. Recycl. 2004, 41, 339–364. [Google Scholar] [CrossRef]
  18. Tabernero, C.; Hernandez, B.; Cuadrado, E.; Luque, B.; Pereira, C.R. A multilevel perspective to explain recycling behavior in communities. J. Environ. Manag. 2015, 159, 192–201. [Google Scholar] [CrossRef]
  19. Brooks, A.L.; Wang, S.; Jambeck, J.R. The Chinese import ban and its impact on global plastic waste trade. Sci. Adv. 2018, 4, eaat0131. [Google Scholar] [CrossRef]
  20. Todd, C.E. Technical and Economic Analysis of the New York City Recycling System. Columbia University. 2002. Available online: http://www.seas.columbia.edu/earth/wtert/sofos/Todd_thesis.pdf (accessed on 15 August 2023).
  21. Porsch, A. Industrial recycling networks as starting points for broader sustainability-oriented cooperation? J. Ind. Ecol. 2010, 14, 242–257. [Google Scholar] [CrossRef]
  22. Colpo, I.; Martins, M.E.S.; Buzuku, S.; Sellitto, M.A. Industrial symbiosis in Brazil: A systematic literature review, Waste Management & Research. J. A Sustain. Circ. Econ. 2022, 40, 1462–1479. [Google Scholar]
  23. Kim, E.; Moon, M.J.; Park, S.-Y. Impact of public information campaign on citizen behaviors: Vignette experimental study on recycling program in South Korea. Rev. Policy Res. 2024, 00, 1–14. [Google Scholar] [CrossRef]
  24. Maier, J.; Geyer, R.; Steigerwald, D.G. Curbside recycling increases household consumption. Resour. Conserv. Recycl. 2023, 199, 107271. [Google Scholar] [CrossRef]
  25. Barber, J. Mapping the movement towards sustainable production and consumption in North America. J. Clean. Prod. 2007, 15, 499–512. [Google Scholar] [CrossRef]
  26. Barnett, M.; Hancock, P.I.; Klotz, L.E.; Attari, S.Z. Recycling bias and reduction neglect. Nat. Sustain. 2023, 6, 1418–1425. [Google Scholar] [CrossRef]
  27. Kiernan, J.S. Greenest States. Evolution Finance, Inc. 2019. Available online: https://wallethub.com/edu/greenest-states/11987/ (accessed on 1 February 2024).
  28. Tufano, L. Which U.S. Cities Are Recycling Champions? Waste Dive. 2015. Available online: https://www.wastedive.com/news/which-us-cities-are-recycling-champions/403347/ (accessed on 1 November 2023).
  29. Feiock, R.; Kalan, L.G. Assessing the performance of solid waste recycling programs over time. Am. Rev. Public Adm. 2001, 31, 22–32. [Google Scholar] [CrossRef]
  30. Zimlich, R. Regional Landfill Capacity Problems Do Not Equate to a National Shortage. Waste 360. 2015. Available online: https://www.waste360.com/operations/regional-landfill-capacity-problems-do-not-equate-national-shortage (accessed on 19 November 2023).
  31. Analysis of MSW Landfill Tipping Fees. Environmental Research & Education Foundation. Available online: https://erefdn.org/product/analysis-of-msw-landfill-tipping-fees-2022-pdf/ (accessed on 21 January 2024).
  32. Barnes, S.J. Out of sight, out of mind: Plastic waste exports, psychological distance, and consumer plastic purchasing. Glob. Environ. Chang. 2019, 58, 101943. [Google Scholar] [CrossRef]
  33. Geyer, R.; Jambeck, J.R.; Law, K.L. Production, use, and fate of all plastics ever made. Sci. Adv. 2017, 3, e1700782. [Google Scholar] [CrossRef]
  34. Ritchie, H.; Roser, M. Plastic Pollution. Our World in Data. 2018. Available online: https://ourworldindata.org/plastic-pollution (accessed on 10 October 2023).
  35. Rigamonti, L.; Niero, M.; Haupt, M.; Grosso, M.; Judl, J. Recycling processes and quality of secondary materials: Food for thought for waste-management-oriented life cycle assessment studies. Waste Manag. 2018, 76, 261–265. [Google Scholar] [CrossRef] [PubMed]
  36. Nicolli, F.; Johnstone, N.; Soderholm, P. Resolving failures in recycling markets: The role of technological innovation. Environ. Econ. Policy Stud. 2012, 14, 261–288. [Google Scholar] [CrossRef]
  37. General Office of the State Council. Notice of the General Office of the State Council on Issuance of Reform and Implementation Plan to Enhance Solid Waste Import Management System by Prohibiting the Entry of Foreign Waste. 2017. Available online: https://www.isri.org/docs/default-source/int’l-trade/170727chinaannouncement-en.pdf (accessed on 21 January 2024).
  38. Hook, L.; Reed, J. Why the World’s Recycling System Stopped Working. Financial Times. 24 October 2018. Available online: https://www.ft.com/content/360e2524-d71a-11e8-a854-33d6f82e62f8 (accessed on 2 February 2020).
  39. Qu, S.; Gue, Y.; Ma, Z.; Chen, W.; Lui, J.; Lui, G.; Wang, Y.; Xu, M. Implications of China’s foreign waste ban on the global circular economy. Resour. Conserv. Recycl. 2019, 144, 252–255. [Google Scholar] [CrossRef]
  40. Wang, C.; Zhao, L.; Lim, K.; Chen, W.; Sutherland, J. Structure of the global plastic waste trade network and the impact of China’s import Ban. Resour. Conserv. Recycl. 2020, 153, 104591. [Google Scholar] [CrossRef]
  41. Tucker, B.; Rosengren, C.; Witynski, M.; Li, R.; Crunden, E.A.; Boteler, C.; Pyzyk, K. How Recycling Has Changed in all 50 States. Waste Dive. 2019. Available online: https://www.wastedive.com/news/what-chinese-import-policies-mean-for-all-50-states/510751/ (accessed on 9 September 2023).
  42. Chen, X.; Huang, P.; Xiao, Z. Uncovering the verticality and temporality of environmental policy mixes: The case of agricultural residue recycling in China. Rev. Policy Res. 2022, 39, 632–653. [Google Scholar] [CrossRef]
  43. Mouw, S. State of Curbside Recycling Report; The Recycling Partnership: Washington, DC, USA, 2020. [Google Scholar]
  44. Lakatos, E.S.; Cioca, L.-I.; Dan, V.; Ciomos, A.O.; Crisan, O.A.; Barsan, G. Studies and Investigation about the Attitude towards Sustainable Production, Consumption and Waste Generation in Line with Circular Economy in Romania. Sustainability 2018, 10, 865. [Google Scholar] [CrossRef]
  45. Kirchherr, J.; Reike, D.; Hekkert, M. Conceptualizing the circular economy: An analysis of 114 definitions. Resour. Conserv. Recycl. 2017, 127, 221–232. [Google Scholar] [CrossRef]
  46. Hargreaves, T. Practicing behavior change: Applying social practice theory to pro-environmental behavior change. J. Consum. Cult. 2011, 11, 79–99. [Google Scholar] [CrossRef]
  47. Recent EPR Proposals. Available online: https://epr.sustainablepackaging.org/policies (accessed on 3 March 2024).
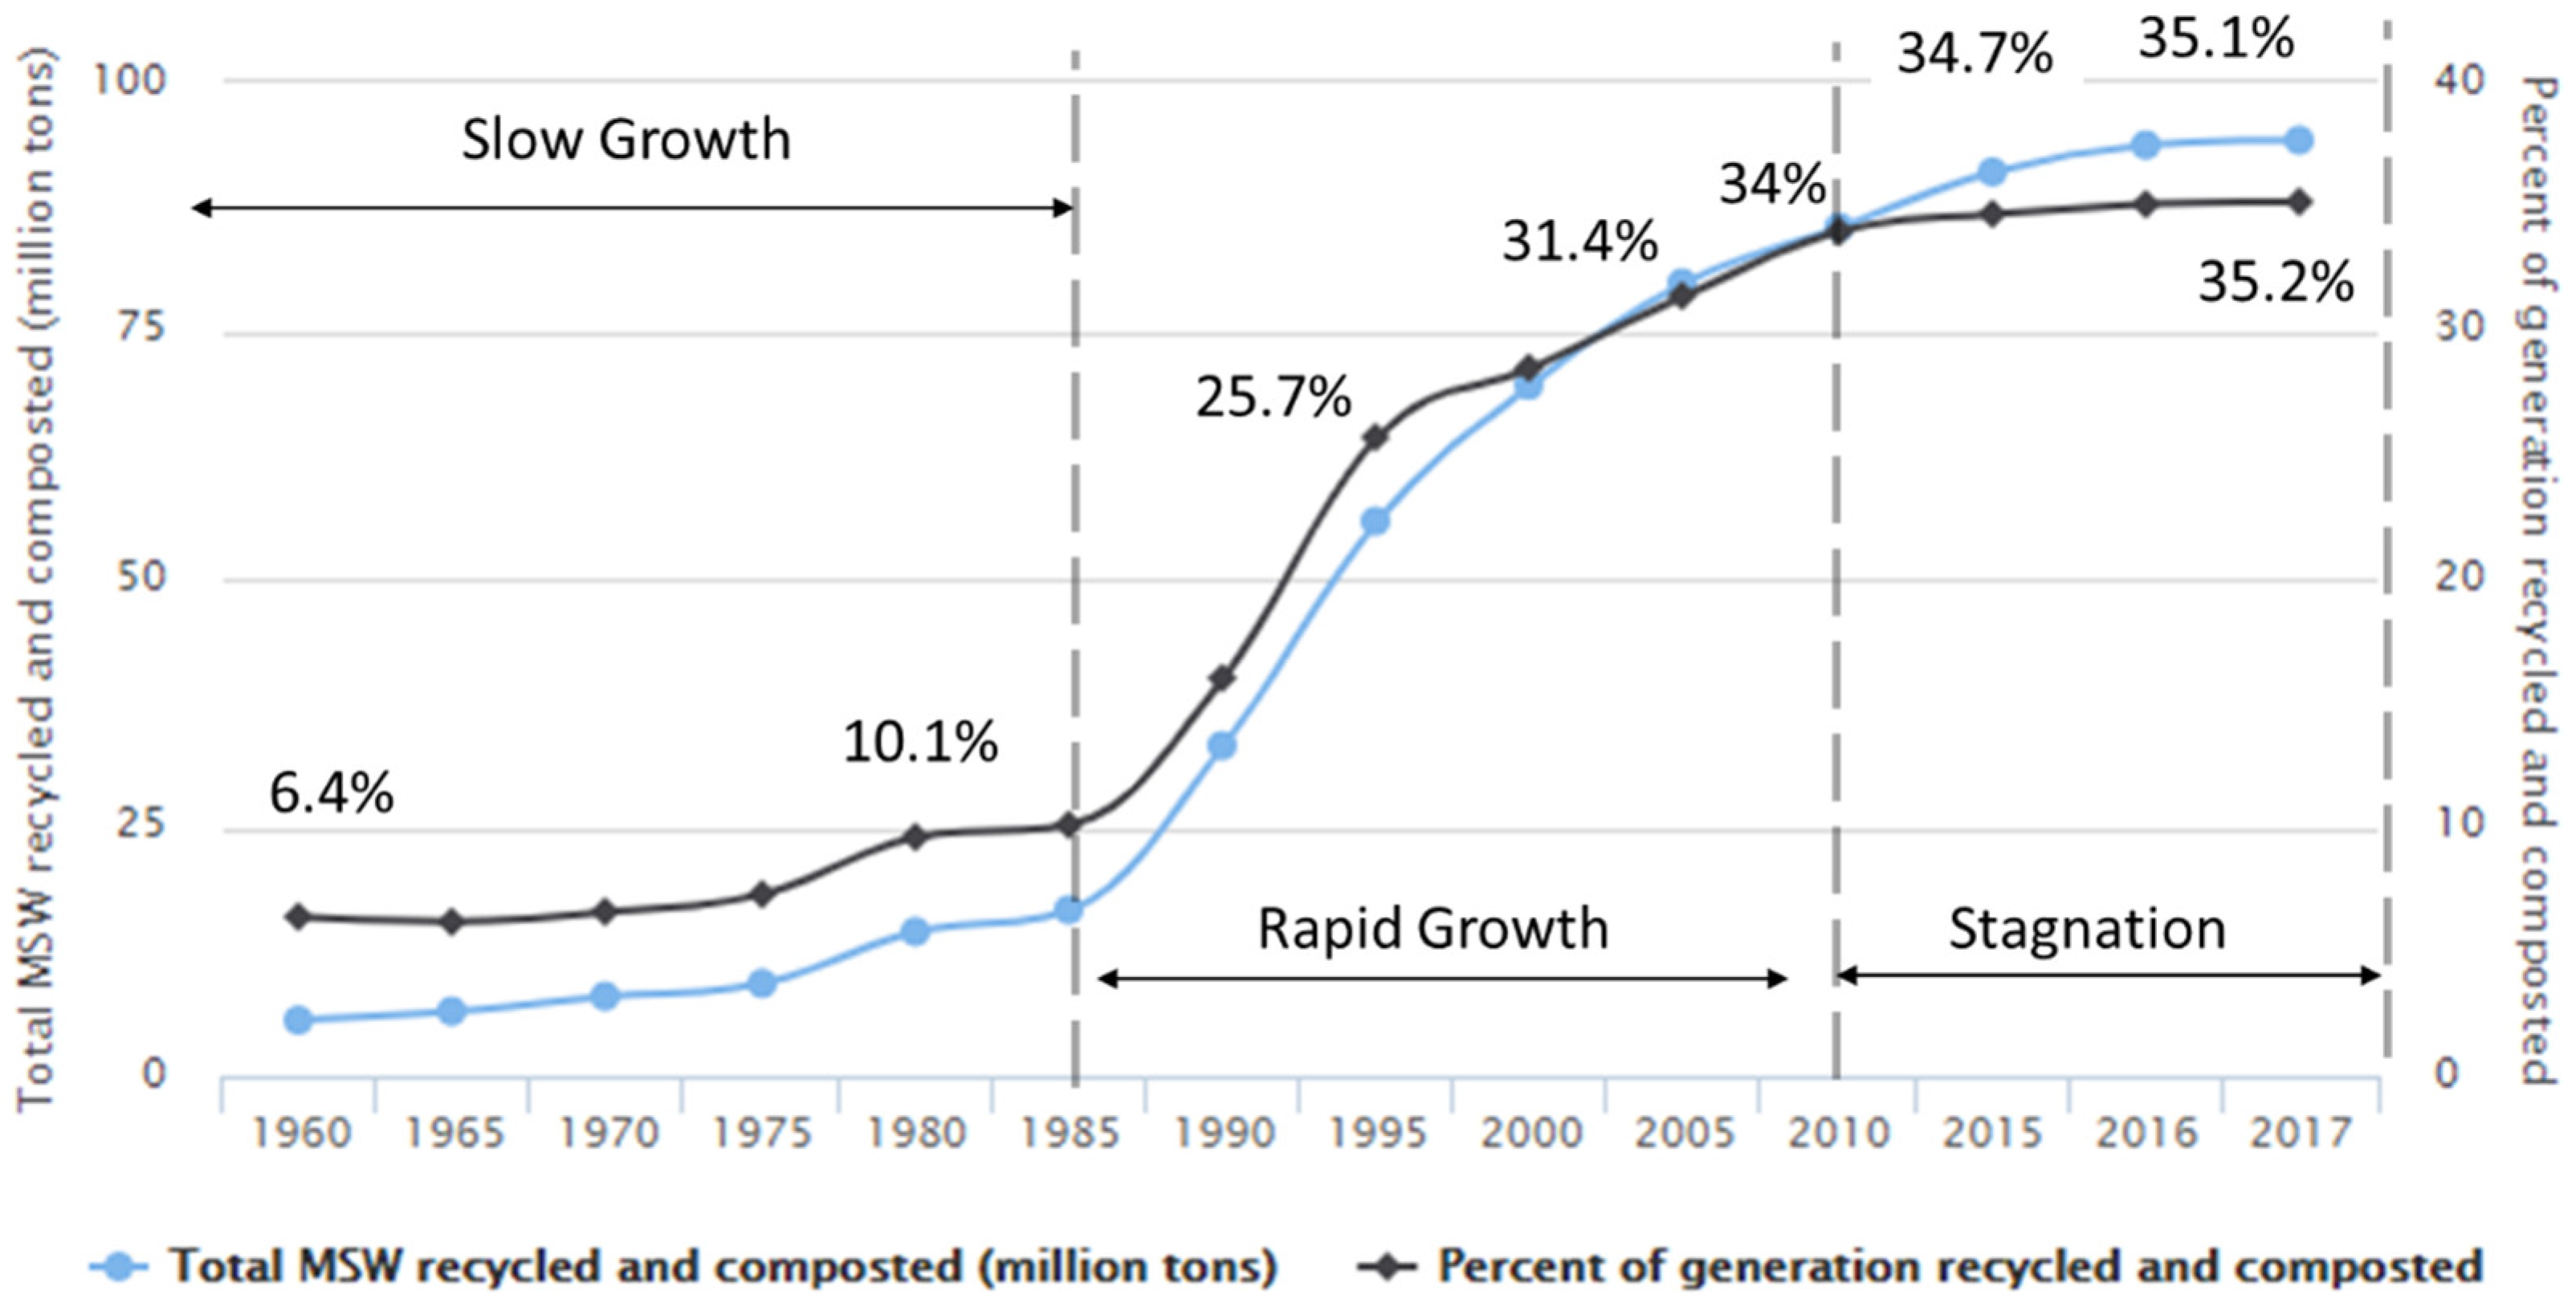
Figure 1. MSW recycling and composting rates, 1960–2017. This figure was adapted from the US EPA’s MSW recycling and composting rates [1].
Sustainability 16 03539 g001
Figure 2. Total MSW generated vs. recycled and composted by materials, 2017. Numbers above in each bar graph represent the ranked order of Total MSW Generated or Total MSW Recycled and Composted. This figure was adapted from the US EPA’s Total MSW Generated figure [1].
Sustainability 16 03539 g002
Figure 3. Experience levels in waste management industry and the US recycling rate.
Sustainability 16 03539 g003
Figure 4. Established factors (problems) influencing the management of recycling programs.
Sustainability 16 03539 g004
Table 1. The importance of problems in municipal recycling programs in 1989 and 1996.
Mean 1989 *Mean 1996 *Rank in 1989Rank in 1996
Financing recycling programs and securing adequate budgets for recycling 3.373.6841
Getting residents to participate in recycling 3.703.5922
Lack of reliable material markets 4.173.3713
Unfunded state mandates3.473.2834
Obtaining information about best recycling practices2.852.7655
Theft and scavenging of recyclables1.782.1666
Source: This table was created based on the findings from Folz’s studies [6,7] and ranks were added by authors. * 1 = not important, 2 = slightly important, 3 = moderately important, 4 = important, 5 = highly important.
Table 2. Survey respondents’ experience level (n = 54).
Experience LevelYears of ExperienceNumber of Recycling Program Managers or CoordinatorsPercentage Points (%)
1<10 year1527.8
210–25 years2444.4
3>25 years1527.8
Table 3. Most effective collection type by recycling program managers’ experience level (n = 54).
Curbside OnlyDrop-Off OnlyCombination
Experience Level 113.33%0%86.6%
Experience Level 220.8%0%76.16%
Experience Level 326.6%13%60%
Table 4. Two-sample t-test of equality of means.
Experience Level 1 vs. Experience Level 2Experience Level 2 vs. Experience Level 3Experience Level 1 vs. Experience Level 3
Curbside OnlyPercentage Difference7.475.813.3
T statistic
p-value
−0.603
0.55 *
−0.401
0.691 *
−0.894
0.379 *
Drop-off OnlyPercentage Difference01313
T statistic
p-value
−2.46
0.021 **
−2.25
0.040 **
−2.25
0.040 **
CombinationPercentage Difference10.44−16.16−26.6
T statistic
p-value
5.30
0.001 ***
3.61
0.001 ***
4.02
0.001 ***
the number of observations was 54 in all t-tests. * p > 0.10; ** p < 0.05; *** p < 0.01.
Table 5. The importance of emerging factors influencing the management of recycling programs.
FactorsExplanation of FactorsMean ScoreRank
China’s policy to ban waste importsChina’s policy announced in 2018 to ban the illegal imports of solid waste including non-industrial plastics by 20304.48/5.001
Organizational framing effect of recyclingHow an organization communicates and/or defines recycling to the pubic4.09/5.002
Public education and outreach activities Strong need for public education and outreach activities to inform effective recycling methods including waste collection4.07/5.003
Extended Producer Responsibility (EPR) Establishing Extended Producer Responsibility (EPR) laws and policies to establish a holistic approach to product production and waste management 3.98/5.004
Budget deficits of recycling programsShortfall between operation costs of recycling programs and financial assistance from external entities3.81/5.005
Growing plastic consumption Rapid increases in plastic production and consumption fed into the MSW treatment stream 3.72/5.006
Technical assistance from state and federal governments Technical assistance provided by state and federal government3.53/5.007
Reasonable waste collection charges Waste collection and disposal fees that are adequate to cover the deficit created by the decrease in profits from recyclables 3.50/5.008
5-Likert scale was used for the mean scores (1 = strongly disagree, 2 = disagree, 3 = neither agree nor disagree, 4 = agree, 5 = strongly agree).
Disclaimer/Publisher’s Note: The statements, opinions and data contained in all publications are solely those of the individual author(s) and contributor(s) and not of MDPI and/or the editor(s). MDPI and/or the editor(s) disclaim responsibility for any injury to people or property resulting from any ideas, methods, instructions or products referred to in the content.