1. Introduction
The introduction section begins by discussing the advantages of using attribute (or instance) weighting instead of attribute (or instance) selection. It also highlights the challenges associated with attribute (or instance) weighting. To address the challenge of determining optimal weights, this study proposes the use of bio-inspired optimization algorithms. A short introduction to the concepts of multipopulation and ensemble algorithms is also discussed. The discussion then focuses on the precision–recall tug-of-war phenomenon. Finally, the introduction lists the research gaps, emphasizes the strong motivation behind this research, and outlines its significant contributions.
1.1. Attribute and Instance Weighting
Our study adopts a unique approach to improving classification performance. Instead of using the most commonly used feature or instance selection approach, which solely selects the most important attributes (or instances) and disregards the less important ones, we assign weight to attributes (or instances) based on their importance in the classification process. The inclusion of even a small piece of information associated with an attribute (or instance) holds the potential to significantly enhance the overall classification performance [
1].
The disadvantages of the attribute (or instance) selection approach are the curse of dimensionality, data loss, and overfitting. The attribute (or instance) weighting strategy has the advantages of detecting subtle trends in a dataset.
There are three types of attribute weighting:
Global attribute weighting involves assigning weights to attributes without taking the class label into account. It gives equal weight to all traits, regardless of their relevance to specific classes.
In the local attribute weighting approach, attribute weights are assigned based on the class label as well as the attribute’s applicability to certain classes. It acknowledges that different traits may be of differing relevance based on the considered class.
In the attribute value weighting method, the weights are applied to specific attribute values. It enables a more detailed evaluation of attribute relevance by taking into account the precise values within each attribute.
The application of bio-inspired algorithms, for instance, and attribute selection are performed by many researchers and have produced good results. Christo [
2] and Derrac [
3] used the Genetic algorithm for selecting instances and features. Akinyelu and Ezugwu [
4] aimed to improve the training speed and prediction accuracy of SVM using the instance selection technique. The authors proposed two novel instance selection algorithms based on the Social Spider Instance Selection Algorithm (SSISA) and the Flower Pollination Instance Selection Algorithm (FPISA). The fitness function designed for filter-based technique is data reduction, and the one for wrapper-based techniques is prediction accuracy using SVM. Their results suggest that it is advisable to use a filter-based technique when classification speed is more important e.g., video surveillance, and use wrapper-based techniques when prediction accuracy is more important, e.g., email filtering.
Czarnowski [
5] used the Firefly algorithm for instance selection. The process is carried out in two stages. In stage 1, training data are clustered using a similarity-based clustering algorithm. The similarity coefficient of the instance is calculated, and then the disjoint cluster is created. In the second stage, the instances selected from the created clusters form the reduced dataset. Suganthi and Karunakaran [
6] applied instance selection and feature extraction to reduce datasets. The Cuttlefish algorithm was used for instance selection, and Principal Component Analysis (PCA) was used for feature extraction. The reduced dataset given as input to the SVM classifier reduced the training time by 142 min. The accuracy, false positive rate, and detection rate were used as the performance metrics, and the testing was carried out using 4 popular datasets.
Based on the above idea of using bio-inspired optimization algorithms for instance/feature selection, this paper also determines the optimal weight of instances (or features) by deploying bio-inspired optimization algorithms.
1.2. Bio-Inspired Optimization Algorithms
Bio-inspired optimization algorithms are a diverse set of techniques that draw inspiration from the principles of nature, the theory of evolution, and specific behaviors observed in living organisms. These algorithms are highly effective in addressing various optimization challenges by mimicking natural processes.
According to Ni [
7], bio-inspired optimization algorithms can be categorized into three groups based on their behavior, structure, and evolutionary approach. This classification helps in understanding the underlying mechanisms and characteristics of these algorithms.
Multi-objective optimization is a complex process that aims to find a set of solutions that simultaneously optimize multiple conflicting objectives. Unlike single-objective optimization, where there is a single best solution, multi-objective optimization involves finding a trade-off between different objectives. This trade-off is represented by the Pareto front, which consists of solutions where improving one objective may result in the deterioration of another. Bio-inspired algorithms are well suited for multi-objective optimization due to their inherent ability to efficiently explore the search space and handle complex objective functions with trade-offs.
In research on drought prediction with machine learning algorithms, the authors predict drought indices from their past values, and a bio-inspired optimization algorithm is used to fine-tune the machine algorithm’s hyperparameters. Some works of this kind are discussed below. Aghelpour [
8] predicted PDSI, which is used as a reference index for agricultural drought; it was predicted using the machine learning models Radial Basis Function Neural Network (RBFNN) and Support Vector Machine (SVM). The Dragonfly algorithm was used to tune the SVM parameters, and there was a 29% improvement in results.
Reconnaissance drought index (RDI) prediction for the timescales of 6, 9, and 12 months was found using a hybrid SVR with a Firefly and Whale optimization algorithm by Ahamadi [
9]. Here also, the Firefly and Whale optimization algorithm are used to optimize the SVR parameters. In RDI 6 prediction, hybrid SVR produced slightly better performance than standard SVR.
A random vector functional link (RVFL) network [
10] is a randomized version of a single hidden layer feedforward neural (SLFN) network. RVFL integrated with Particle Swarm Optimization (PSO), the Genetic Algorithm (GA), Grey Wolf Optimization (GWO), Social Spider Optimization (SSO), Salp Swarm Algorithm (SSA), and Hunger Game Search (HGS) is used in predicting SPI3, SPI6, SPI9, and SPI12. Hybrid algorithms have proven to be powerful than standalone RVFL; in particular, the hybrid RVFL with the Hunger Game Search algorithm has given the best results.
Ali Danandeh Mehr [
11] performed SPEI3 and SPEI6 prediction using hybrid Extreme Learning Machine (ELM) with the water cycle and bacterial foraging. To improve the accuracy of ELM, identification of the optimum value of the total number of hidden neurons and maximum number of iterations is required, and this task was carried out using the water cycle and bacterial foraging. In SPEI 3 forecasting, ELM–water cycle improved the model accuracy up to 72% compared to standalone ELM.
In the work of Nabipour [
12], short-term hydrological drought was predicted using the index known as the Standardized Hydrological Drought Index (SHDI). SHDI was calculated on 1-, 3-, and 6-month scales using the previous SHDI, SPI, and precipitation values. These indices were predicted using ANN coupled with SSA, Biogeography-Based Optimization (BBO), the Grasshopper Optimization Algorithm (GOA), and PSO. The hybridized ANN’s performance was better than the conventional ANN’s performance, and in particular, the ANN with PSO gave superior performance.
Soil moisture is estimated from the input variables of maximum air temperature, minimum air temperature, soil temperature, relative humidity, sunshine hours, and humidity using the hybrid Adaptive Neuro-Fuzzy Inference System (ANFIS) model [
13]. Three hybrid ANFIS models were generated by adding the bio-inspired algorithms WOA, the Krill Herd Algorithm (KHA), and the Firefly algorithm (FA) to find optimal parameter values for ANFIS.
Babak Mohammadi [
14] used a hybrid ANN–FA model to predict SPI3, SPI6, SPI18, and SPI24 using neighboring stations’ SPI series. This method is useful when there is a lack of data. Here also, FA was used to find the optimal weight and bias of the ANN.
1.3. Drought
Drought has a slow onset; hence, with the use of machine learning models, it can be forecasted and mitigation plans can be taken. Drought indices are computed using the climatic variables, and they represent drought severity. There are four types of drought: meteorological drought, hydrological drought, agricultural drought, and socio-economic drought. There are nearly 100 drought indices in use for identifying drought of specific types or for a specific geographical location [
15].
In the handbook of drought indicators and indices, it is suggested to use multiple indices [
16]. Each drought index has its own advantages and disadvantages. At present, however, there is no drought index that is globally accepted. The SPI and Aridity Anomaly Index (AAI) are commonly used in India. The Palmer Drought Severity Index (PDSI) is used in the USA and Canada [
17,
18].
Machine learning techniques were applied to predict the drought index, which shows the drought severity level.
Ekmekcioğlu [
19] employed a self-calibrated PDSI (Palmer Drought Severity Index) to forecast short-term, mid-term, and long-term outcomes. The study conducted a comparison between XGBoost and two signal processing techniques, namely, Discrete Wavelet Transform (DWT) and Variable Mode Decomposition (VMD). The evaluation of results, measured using the Root Mean Square Error (RMSE), clearly indicated that VMD-XGBoost outperformed DWT-XGBoost. Ali Danandeh Mehr [
20] proposed an evolutionary explicit model, Variable Mode Decomposition Genetic Programming (VMD-GP) for SPEI prediction in ungauged catchment areas. GP is a regression technique. The transfer of data from the Global Drought Monitoring (GDM) data repository to the required areas is performed using the inverse distance weighting interpolation technique. The fluctuation in the SPEI series is removed using VMD by first changing it into multiple intrinsic mode functions (IMFs) and then applying a noise reduction filter. The results showed that VMD provided better results than Empirical Mode Decomposition (EMD).
Another decomposition technique, Multivariate empirical mode decomposition (MEMD) [
21], is applied to the handle mode alignment and factorize IMF of wind speed data, which have a high degree of non-linearity and non-stationarity. Hai Tao developed it as a hybrid MEMD–Random Forest–PSO and MEMD–Kernel Ridge Regression (KRR)-PSO model for wind speed prediction, and its performance was compared with that of standalone RF and KRR. Optimization algorithms were used to optimize the parameters of the hybrid model.
Wavelet decomposition [
9] was used to decompose the RDI time series. Six-wavelet function performance was evaluated with hybrid SVR, and the Coifflet with SVR gave the best results. Two levels of decomposition were performed. and it proved its excellence. In a separate study conducted by Danandeh [
22], the performance of Genetic Programming, Decision Tree, and Gradient Boosting was evaluated. The results of meteorological drought forecasting suggested that the Gradient Boosting Decision Tree classifier exhibited the highest effectiveness.
In a separate study conducted by Reihanifar [
23], a multi-objective genetic algorithm was utilized to optimize both the root mean square error and expressional complexity. This approach aimed to achieve higher accuracy while reducing the complexity of the model. The study focused on meteorological drought forecasting, utilizing a 50-year dataset of the SPI 6 series.
The use of the climatic indicators ENSO and El Niño in drought prediction has been adopted by many authors. A strong connection existing between ENSO and SPEI in drought prediction has been found in the South African region [
24]. The study performed by Malak Henchiri also proved the strong relationship existing between ENSO-SPI in West Africa and North Africa [
25]. Streefkerk et al. [
26] put forth the idea of integrating local farmers’ knowledge into climate change studies, alongside the commonly used ENSO (El Niño-Southern Oscillation) indicators. The authors assert that the inclusion of this local knowledge enriches the comprehension of climate change dynamics.
As per the recommendation of the Indian Meteorological Department (IMD), SPI is used in drought prediction in all the Indian states. There were studies on other indices, such as SPI, DI, EDI, PNI, and RAI [
27]. Pandiyarajhan Govindasamy [
28] compared the efficiency of SPI with the percent of normal precipitation index method used by IMD in drought forecasting.
There have been may works on drought index prediction for the state of Tamil Nadu through machine learning methods, ARIMA, SARIMA, and many more using in situ and remote sensing data.
Sellaperumal Pazhanivelan [
29] used satellite precipitation products in SPI estimation. He proved that the satellite precipitation data products from CHIRPS, TRMM, PERSIANN, and GPM3IMERGE were more accurate than rain-gauge data. He also recommended the rainfall deviation score method for meteorological drought prediction.
ANFIS was used to estimate the SPI at a 3-month scale for the Erode district of Tamil Nadu using 39 years of data by Indhuja [
30]. The efficiency of the result was measured using the metrics RMSE and MAE. The drought years of 2002, 2009, and 2016 were marked as extremely dry by the SPI value.
The ARIMA model was applied to predict meteorological drought in the Thirumanimuthar Sub-basin, a semi-arid region, by Karthika [
31]. The model performance was evaluated using the minimum Akaike Information Criterion (AIC) and Schwarz Bayesian Criterion (SBC). The results showed that the model was able to predict drought 2 years ahead.
1.4. Precision and Recall—Tug-of-War
Precision refers to the proportion of instances correctly classified as positive, regardless of their overall accuracy. It measures how accurately positive instances are identified. On the other hand, recall focuses on correctly identifying the total number of positive instances. The formulas for precision and recall are provided below in Equations (1) and (2):
The classification threshold plays a crucial role in determining the assignment of instances to either the positive or negative class. Adjusting this threshold has a direct impact on the occurrence of false positives or false negatives. To be more specific, an increase in false positives leads to a reduction in precision, indicating a higher rate of incorrect positive classifications. Similarly, an increase in false negatives causes a decrease in recall, indicating a higher rate of missed positive instances. It is important to find the right balance when setting the classification threshold to optimize precision and recall simultaneously.
1.5. Research Challenges and Limitations
There is no drought index that is universally accepted as efficient in predicting the drought.
Previous research has predominantly concentrated on predicting the Standardized Precipitation Index (SPI) and Standardized Precipitation Evapotranspiration Index (SPEI) based on historical data, while the exploration of other climatic indicators in relation to meteorological drought has been relatively limited [
19,
32].
There is a significant need for algorithms that specifically address the challenge of improving the performance of the minority class in imbalanced datasets.
Relying solely on the accuracy metric can lead to misleadingly high-performance results, as it primarily reflects the accuracy of predicting the majority class. It is crucial to develop dedicated algorithms that focus on precision and recall performance metrics for the minority class, rather than relying on weighted averages or macro averages.
To enhance multi-objective optimization, it is valuable to explore new concepts by developing frameworks that utilize an ensemble of optimization algorithms.
When evaluating the performance of a classifier model on imbalanced datasets, it is essential to carefully assess and improve on a per-class basis, with particular emphasis on the minority class.
1.6. Motivation and Contributions of This Work
Drought presents a significant and persistent challenge due to its gradual onset, which allows for the implementation of effective mitigation plans. Our primary objective is to accurately predict drought occurrences using climatic indicators and drought indices. However, the existing body of research on the correlation between climatic indicators and drought is currently limited. Additionally, the scarcity of drought-occurrence years has resulted in imbalanced datasets, posing a significant obstacle to improving classification performance. Hence, our research aims to explore novel approaches such as attribute and instance weighting to enhance predictive performance and address the challenges associated with imbalanced datasets. We hope to increase drought forecast accuracy and contribute to more effective drought management by using these unique methodologies.
The primary contributions of this work are as follows:
Our approach does not involve predicting specific drought index values. Instead, we forecast whether a particular year will experience drought based on the values of multiple climatic indicators and drought indices.
To the best of our knowledge, this is the first attempt to correlate drought occurrence with the climatic indicators suggested by GCOS. The Centre for Climate and Energy Solutions and NASA have also highlighted how climate change and global warming contribute to drought occurrence. Hence, we have selected important climatic indicators and studied their influence in drought occurrence [
33,
34].
We develop a novel approach that incorporates attribute (or instance) weighting to enhance the performance of imbalanced datasets.
We utilize bio-inspired optimization algorithms to assign appropriate weights to attributes (or instances), aiming to improve precision and recall for minority classes.
We introduce a synergistic optimization algorithm (SOA) that leverages multiple populations generated by various nature-inspired optimization algorithms.
We apply multi-objective optimization using SOA to strike a balance between precision and recall in predicting occurrences of drought within weighted datasets.
We evaluate attribute and instance importance in our dataset to achieve accurate prediction of meteorological drought occurrences.
The following section of this paper offers a thorough literature review that encompasses various concepts, including multipopulation algorithms, ensemble learning, neighborhood learning, and the application of machine learning techniques in drought forecasting.
Section 2 delves into the proposed framework for accurately predicting meteorological drought occurrences, outlining the underlying concept and the steps involved in its implementation. Finally,
Section 4 presents a detailed discussion of the experimental results obtained in this study.
2. Methodology
2.1. Study Area
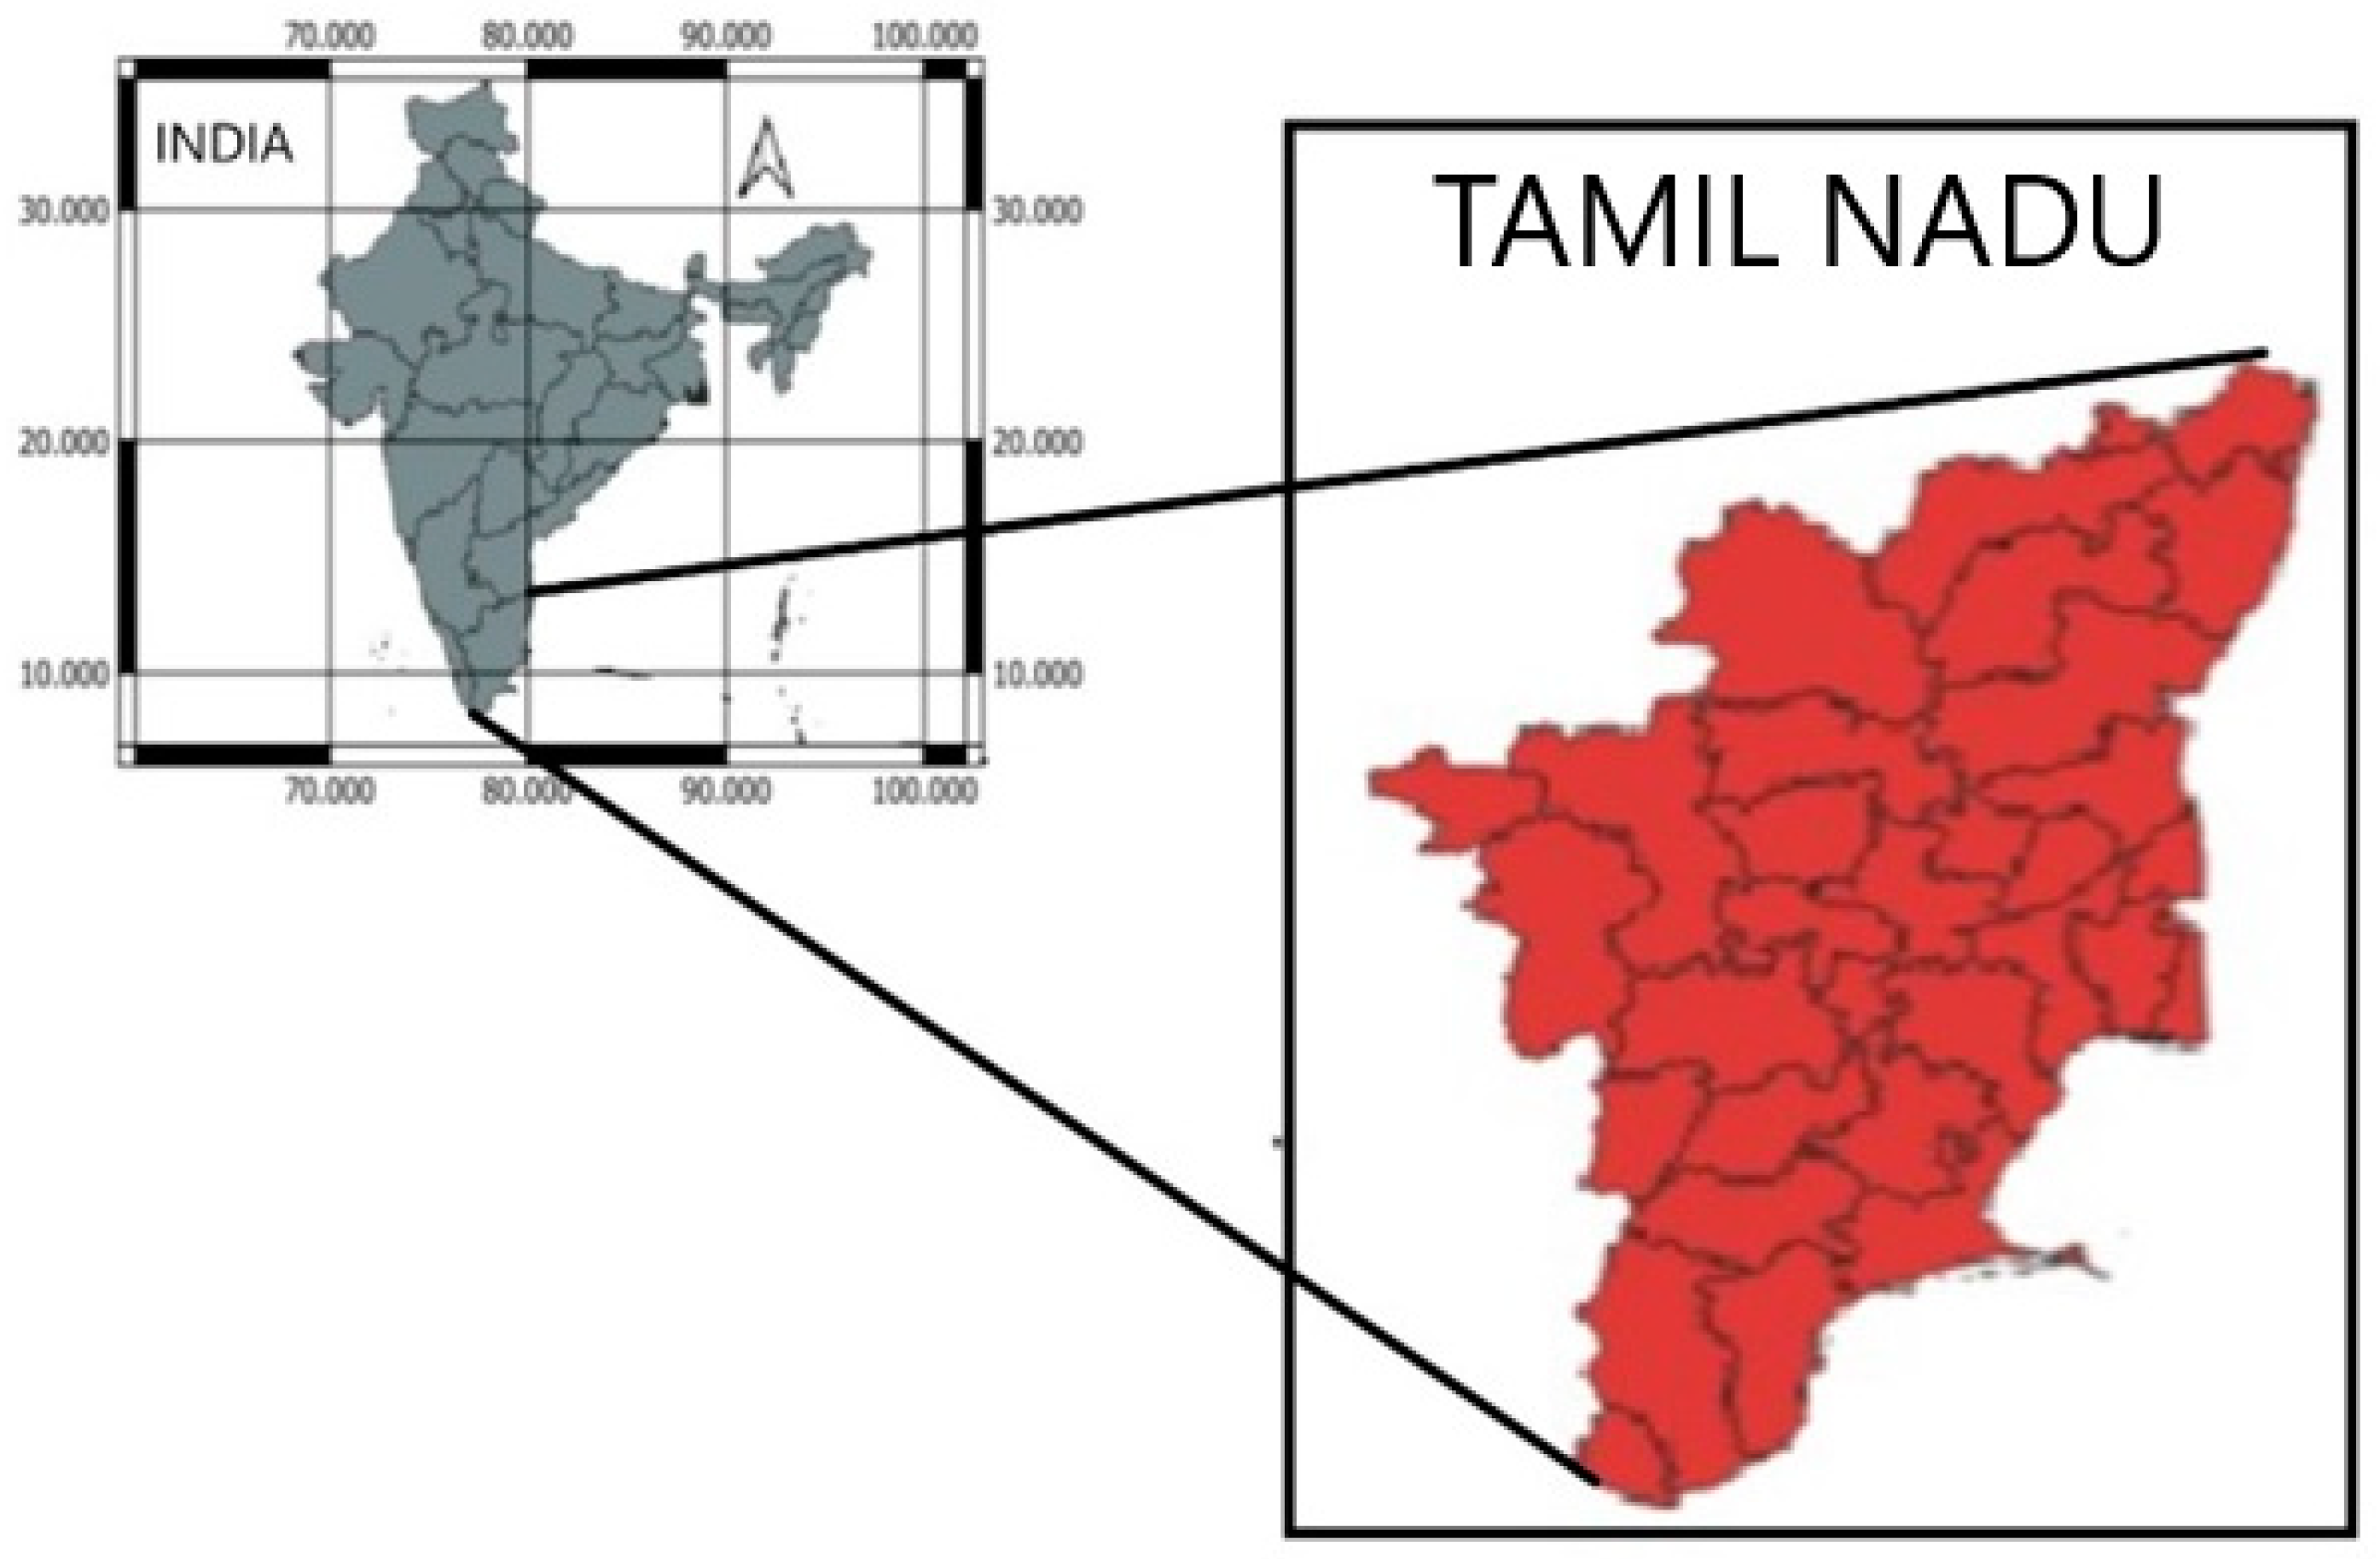
The study area selected is the state of Tamil Nadu, located in the southern part of India. The latitude of Tamil Nadu is 11.127123, and the longitude is 78.656891. The state has a tropical climate and has moderately hot temperatures during the year except during the monsoon seasons. The average yearly temperature is 87.48° F (30.82 °C). Tamil Nadu’s geography consists of the Indian Ocean to the south, the Bay of Bengal to the east, the western ghats and Deccan plateau to the west, and the eastern ghats to the north. A map of the study map is given in
Figure 1. Tamil Nadu has seven Agro-Climatic Zones (ACZ), namely the Cauvery Delta Zone, the High-Altitude Zone, the Heavy-Rainfall Zone, the Northeastern Zone, the Northwestern Zone, the Southern Zone, and the Western Zone. In the past 42 years, the Cauvery Delta zone, the High-Altitude Zone, and the Heavy-Rainfall Zone have suffered from 1 annual drought; the Western Zone, Northwestern Zone, and Northeastern Zone have experienced 2 annual droughts; and the Southern Zone has experienced 3 annual droughts.
2.2. Proposed Framework
Our research introduces a framework aimed at predicting occurrences of meteorological drought. This framework utilizes attribute-weighted (or instance-weighted) datasets and leverages the Synergistic Optimization Algorithm (SOA), as illustrated in
Figure 2. Attribute weighting and instance weighting are performed as separate experiments in this study.
The input for the drought-occurrence prediction framework is the dataset containing 21 attributes (including 6 drought indices and 15 climatic indicators) and 312 instances. The attribute (or instance) weights are found using the Synergistic Optimization Algorithm (SOA). SOA is the combination of three algorithms, namely the Genetic Algorithm, Firefly Algorithm, and modified PSO algorithm. For attribute weighting, the 21 attributes’ weight values are returned by the SOA. In the case of instance weighting, SOA returns 312 instances’ weights. The next step is the construction of a weighted dataset using the weights returned by SOA and the actual data values. The last step is the classification of “Drought” or “Not Drought” using the weighted dataset. The performance metrics used in evaluating the classification are precision and recall.
Most existing research focuses on assessing drought severity using indices such as SPI, SPEI, and PDSI, which are calculated based on precipitation and evapotranspiration. Additionally, this work aims to investigate the use of attribute and instance weighting approaches to improve minority-class prediction in imbalanced datasets. To implement the proposed framework, Python and the Sci-kit library were utilized. The classifiers employed default hyperparameter values provided by Sci-kit. Three classifiers, namely, Random Forest, Decision Tree, and Gradient Boosting, were used for model evaluation. Five main comparison studies were conducted to assess the performance of the proposed framework.
2.3. Weighted-Dataset Construction
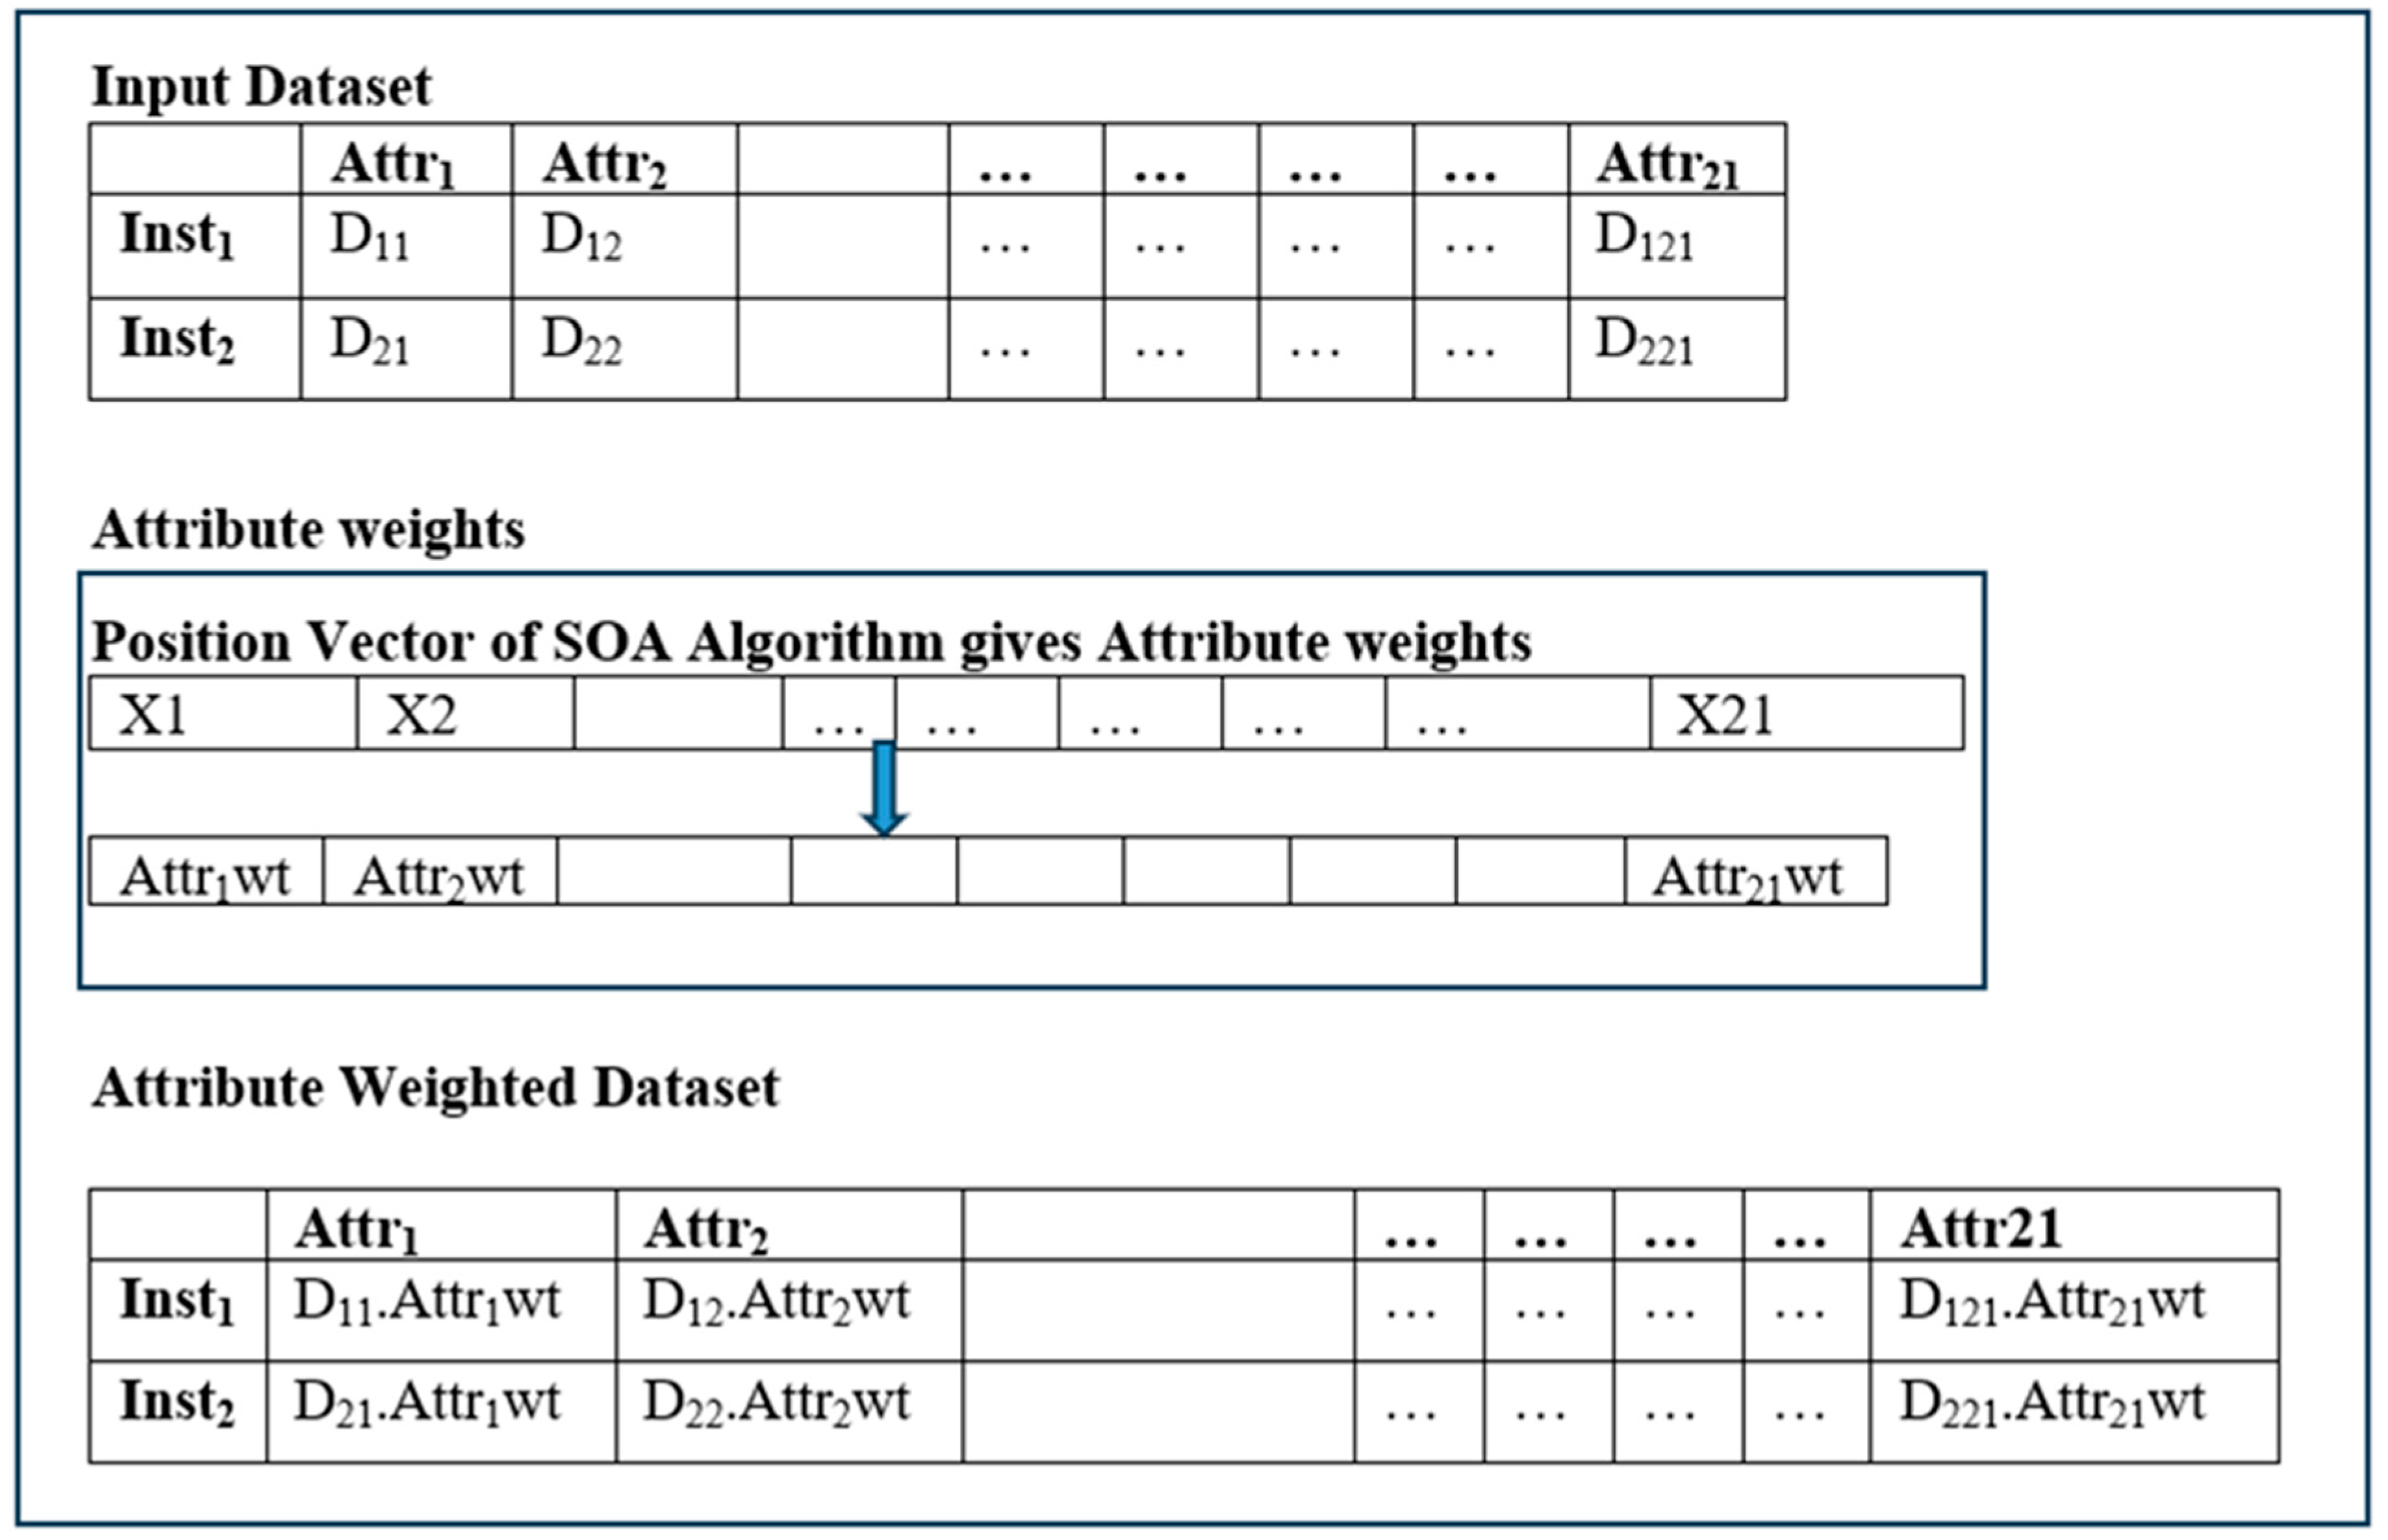
The attribute (or instance) weights given by SOA are used to generate a weighted dataset, referred to as D’. The position vector of SOA holds the weights.
Figure 3 depicts the processes involved in weighted-dataset construction using attribute weighting. The data point D
ij is multiplied by the attribute value weight Attr
iwt, and the weighted data value of D
ij. Attr
iwt is created. Next,
Figure 4 depicts weighted-dataset construction using instance weighting, where the instance weight Inst
‘j’wt is multiplied by the actual data point D
ij and the weighted data value D
ij. Inst
‘j’wt is updated in the weighted dataset.
Dij: Data value for attribute ‘i’ at the instance ‘j’
Attri: ‘i’th attribute
Instj: ‘j’th instance
Xk: ‘k’th position value of the position vector of SOA
Attr‘i’wt: Weight value of the ‘i’th attribute
Inst‘j’wt: Weight value of the ‘j’th attribute
2.4. Algorithms Used in the Proposed Framework
A short introduction of the standard algorithms (PSO, the Genetic Algorithm, and the Firefly Algorithm) used in the implementation of SOA are discussed below. These algorithms have demonstrated a performance in resolving a variety of engineering optimization issues.
The PSO algorithm has shown its efficiency in healthcare applications for disease diagnosis, medical image segmentation, and many more tasks. It has also proved its efficiency in business to predict cost, risk, and profit. In our environmental applications, it helps in monitoring wild vegetation, flood control and routing, and pollution level and water quality monitoring.
The Firefly Algorithm has been widely employed in optimizing diverse applications. For instance, it has been utilized in node placement for underwater wireless sensor networks, with a particular emphasis on achieving optimal coverage [
35], connectivity rates, and communication criteria. Additionally, the algorithm has found successful applications in routing for cognitive radio ad hoc networks (CRAHN) [
8] and even in facial emotion recognition [
36].
Genetic algorithm is used in solving a variety of problems in ship routing, traffic routing, and scheduling construction projects. Jinquan [
37] proposed Dynamic Neighborhood Genetic Learning PSO (DNGL-PSO), which is an enhancement of Genetic Learning PSO (GL-PSO). This approach was designed primarily to maximize the power density of an electric propulsion motor.
2.4.1. Genetic Algorithm
Genetic algorithms are based on natural evolution and genetics, offering a faster and more efficient approach to solving both continuous and discrete optimization functions [
38]. A genetic algorithm’s key strength is its ability to depict a problem’s solution as an individual defined by a set of parameters known as genes that make up the chromosome, which contains the potential solution. The fitness value of a chromosome signifies its usefulness or ‘goodness’ in handling a specific situation.
To optimize a solution, the genetic algorithm executes a sequence of processes. The procedure starts with initialization, which creates a population of chromosomes representing potential solutions. Following that, a fitness function is constructed to evaluate each member of the population based on the objectives, which aids in determining their fitness value. Subsequently, selection takes place, in which chromosomes with high fitness values are chosen as parents for the immediate next generation. Crossover happens when these parents choose a crossover point and exchange genes to produce new offspring. This adds diversity and possibilities for advancement. Mutation is used to increase diversity by introducing random changes in the genes of the offspring. This aids in exploring various parts of the solution space. The subsequent phase is replacement, which involves replacing the old population with a new generation of offspring. Finally, termination criteria specify when the algorithm should be terminated, such as upon reaching a maximum number of iterations or after finding a satisfactory solution. Following these steps, the genetic algorithm iteratively evolves a population of chromosomes across numerous generations to find optimal solutions.
2.4.2. Firefly Algorithm
The Firefly Algorithm draws inspiration from the natural behavior of fireflies, specifically their attraction to each other’s light, and harnesses this behavior to search for optimal solutions. By modifying key components, various variants of the Firefly Algorithm can be created, allowing for customization based on specific requirements [
39]. These modifications include altering the representation of fireflies (binary or real), the population scheme (swarm or multi-swarm), the fitness function’s evolution, the calculation of the best solution (elitism or non-elitism), and the movement patterns of fireflies (uniform, Levy flights, Gaussian, or chaos distribution).
The Firefly Algorithm follows these steps:
Initialization: Generate an initial population of fireflies, where each firefly represents a potential solution to the optimization problem.
Attraction and Movement Calculation: Determine the level of attraction (A) between two fireflies based on their fitness values and the distance separating them. The attraction diminishes as fitness values increase (lower values being more desirable) and as the distance between fireflies increases (greater distance being less desirable). The attractiveness calculation is defined by Equation (3).
A: Attractiveness
γ: Light absorption coefficient
r: Euclidean distance between two fireflies’ positions
Move each firefly in the direction of fireflies that are more appealing. The formula for the movement of firefly ‘i’ toward firefly ‘j’ is given in Equation (4) as:
where:
: New position of firefly ‘i’ in the next generation.
: Current position of firefly ‘i’.
: Attractiveness factor.
: Attractiveness between fireflies ‘i’ and ‘j’.
: Current position of firefly ‘j’.
: Randomization parameter for exploration.
rand (−1, 1): A random number between −1 and 1.
- 3.
Light Intensity Update: Calculate the light intensity for each firefly based on its fitness value.
- 4.
Sorting: Arrange the fireflies in descending order according to their light intensity, with the brightest fireflies (those with the best fitness values) placed at the top positions.
- 5.
Selection and Replacement: Select a subset of the highest-performing fireflies to be retained for the next generation. Replace the remaining fireflies with newly generated solutions chosen randomly.
- 6.
Termination: Repeat steps 3 to 6 until the specified cycle count is reached or a termination condition is met, such as the discovery of an acceptable solution.
2.4.3. Modified PSO Algorithm
The standard Particle Swarm Optimization (PSO) algorithm has undergone several enhancements over the years and is widely employed in various domains [
40]. According to the standard PSO Equations (5) and (6) provide the formulas for updating particle positions and velocities.
wi: Inertia weight
V(t): Particle’s velocity at time ‘t’
X(t): Position of the particle at time ‘t’
c1: Personal learning factor
c2: Neighborhood learning factor
rand: Random number distributed between 0 and 1 uniformly
Ppbest: Particle’s best position
Pgbest: Global best position
A linearly decreasing weight is employed, where the inertia weight is determined based on the iteration and can be represented by Equation (7).
wmax = 0.9, wmin = 0.2, wi = weight at iteration ‘i’, max_iteration = Maximum Iteration.
In the modified PSO, the concept of neighborhood learning is expanded. Unlike standard PSO, which only learns from the personal best and global best, the modified PSO incorporates populations generated by other optimization algorithms. In our work specifically, the best population sets obtained from the Firefly Algorithm (known for high precision) and the Genetic Algorithm (known for high recall) are utilized as neighborhood learners for the modified PSO algorithm. The velocity formula of the modified PSO algorithm encompasses three learning components: self-best (Ppbest), the best population of the Genetic Algorithm (geneticpop), and the best population of the Firefly Algorithm (fireflypop).
The modified formula to find the velocity of the particle is given in Equation (8)
fireflypop—Best firefly returned by the Firefly Algorithm.
geneticpop—Best chromosome returned by the Genetic Algorithm.
V(t): Particle’s velocity at time ‘t’
X(t): Position of the particle at time ‘t’
c1: Personal learning factor
c2,c3: Neighborhood learning factor
rand: Random number distributed between 0 and 1 uniformly
Ppbest: Particle’s best position
Pgbest: Global best position
2.4.4. Synergistic Optimization Algorithm (SOA)
The fundamental concept of the proposed SOA is that collaboration leads to superior outcomes compared to individual efforts. By employing multiple optimization algorithms and utilizing multiple populations, the performance is significantly enhanced compared to using a single optimization algorithm. Increasing population diversity provides the optimization algorithm with a wider range of options for discovering superior solutions. Therefore, the central idea of the SOA revolves around enhancing population diversity through the incorporation of multiple populations derived from various optimization algorithms.
In the context of solving multi-objective optimization problems, the SOA strategy involves dividing the problem into subproblems. Each subproblem focuses on optimizing an individual objective using a dedicated optimization algorithm. Subsequently, the best populations obtained from these subproblems are used as neighborhood learners for the optimization algorithm, which aims to find a balanced solution that addresses the conflicting objectives.
The SOA returns weight values ranging from 0 to 50 for each climatic indicator, which are then multiplied by the corresponding climate indicator value, as shown in
Figure 3. If the classifier properly identifies the drought years, this weight value is preserved; otherwise, SOA calculates the weight values again and re-builds the weighted dataset. The classification performance of this weighted dataset is evaluated, and if necessary, the process is repeated.
In our SOA-weighted drought occurrence detection framework, we utilize an ensemble process that incorporates three optimization algorithms: the Firefly Algorithm, the Genetic Algorithm, and the Modified Particle Swarm Optimization Algorithm. These algorithms generate multiple populations aimed at achieving the multi-objective of enhancing precision and recall. To address this multi-objective optimization problem, we divide it into three subproblems as follows:
- a
Enhancing precision with the Firefly Algorithm;
- b
Improving recall with the Genetic Algorithm;
- c
Balancing the increases in precision and recall without them adversely affecting each other using the modified PSO.
Below are the detailed steps for executing the aforementioned subproblems:
- a.
Enhancing precision with the Firefly Algorithm
In the firefly algorithm, each firefly holds attribute (or instance) weights and measures its fitness value through the precision score. The objective of the algorithm is to maximize the precision score, which is achieved by constructing a fitness function. This function takes the attribute (or instance) weight values as input, creates a weighted dataset, applies classification, and calculates the precision score. By comparing the fitness scores of the fireflies and using the best global firefly as a reference, new fireflies are generated. This process is repeated until the maximum iteration is reached. Please refer to
Appendix A.1 for the detailed steps of the attribute weighting algorithm. In the case of instance weighting, please substitute the 21 weight values with 312 weight values.
- b.
Improving recall with the Genetic Algorithm
Each gene in the Genetic Algorithm represents an attribute or instance weight. The chromosome contains the attribute (or instance) weights, and its fitness value is measured by the recall score. The objective of the Genetic Algorithm’s fitness function is to maximize the recall score. To achieve this, the fitness function takes the attribute (or instance) weight values as input, constructs a weighted dataset, applies classification techniques, and calculates the precision score. The chromosomes’ fitness scores are compared, and new chromosomes are generated based on the best chromosome using mutation operations. Please refer to
Appendix A.2 for the detailed steps of the attribute weighting algorithm using the Genetic Algorithm. In the case of instance weighting, instead of using 21 weight values, we utilize 312 weight values. The program returns The module returns the individual(s) with the highest fitness (highest recall score) obtained by the Genetic Algorithm.
- c.
Balancing the increase in precision or recall
The task of maximizing precision and recall without them affecting one another is performed using the Modified PSO algorithm. It receives the ‘m’ best particles from the Firefly Algorithm and Genetic Algorithm. The neighborhood learning is performed using these particles, and the velocity is updated using Equation (8). The position is updated using Equation (5).
2.5. Multipopulation Communication
Our modified PSO algorithm incorporates the use of both the Genetic Algorithm and the Firefly Algorithm to enhance its performance. Modified PSO requests ‘m’ fireflies and chromosomes from the respective algorithms. This requisition communication interval is set to occur at the end of every 10th iteration until the maximum iteration count is reached. After the requisition, the Genetic Algorithm and Firefly Algorithm are each run for 5 iterations. The Genetic Algorithm identifies the best precision population, while the Firefly Algorithm identifies the best recall population. The top ‘m’ fireflies and chromosomes, where ‘m’ is the number of particles set by the modified PSO algorithm is returned.
The detailed workflow of attribute weighting with SOA using the Gradient Boosting Classifier is given in
Figure 5.
2.6. Dataset
The research focuses on the state of Tamil Nadu in India, specifically analyzing drought patterns from 1995 to 2020. Three significant drought years within this period: 2002, 2009, and 2017 are declared as drought years by the government based on the recommendation of the Indian Meteorological Department (IMD) [
41]. To conduct the analysis, the study utilizes various input attributes, including drought indices recommended by the IMD and climatic indicators suggested by the Global Climate Observing System (GCOS), co-sponsored by the World Meteorological Organization (WMO). The GCOS categorizes the climatic indicators into three main categories: land, atmosphere, and sea. The following monthly climatic indicators are considered: average maximum temperature [
42], pean temperature [
42], minimum temperature [
42], vapor pressure [
42], wind speed [
42], precipitation [
42], shortwave radiation [
42], mean dew point [
42], cloud amount [
43], mean sea levels in three locations (Bay of Bengal, Arabian Sea, and Indian Ocean) [
44], PM2.5 [
45], and CO
2 [
46]. In terms of drought indices, the study employs the Standardized Precipitation Index (SPI) [
47] with timescales of 3, 6, and 12 months, as well as the Standardized Precipitation Evapotranspiration Index (SPEI) [
48] with timescales of 3, 6, and 12 months.
2.7. Explainable AI–SHAP Method
Machine learning models are black boxes, one cannot understand how the final output was predicted. Explainable AI helps in understanding any machine learning model; it gives an interpretation of how the prediction was made [
49]. Hence, the model transparency creates trust in the model. The popular explainable AI techniques are SHAP, or SHapley Additive explanations; LIME, or Local Interpretable Model-agnostic Explanations; Permutation Importance; Partial Dependence Plots; and many more. The SHAP method was based on the coalitional game theory, which calculates the Shapley value of the players. Here shapely value is the feature importance score given among the participating features. SHAP summary plot shows the shapely value of feature per instance.
3. Results
This research aims to assess the impact of various climatic indicators on drought occurrence. A total of 21 attributes were considered, including SPI3, SPI6, SPI12, SPEI3, SPEI6, SPEI12, monthly average maximum temperature, mean temperature, minimum temperature, vapor pressure, wind speed, precipitation, shortwave radiation, mean dew point, cloud amount, PM2.5, and mean sea levels in three locations (Bay of Bengal, Arabian Sea, and Indian Ocean). The output variable is a binary class indicating the presence or absence of drought. Interestingly, not many researchers have explored the relationship between these climatic indicators and drought occurrence, making this study unique.
The first comparison involved comparing the performance of the model with and without attribute weighting and instance weighting using the three wrapper classifiers. The second comparison focused on predicting the minority drought class using stratified cross-validation. The third comparison involved selecting the top 15 attributes and evaluating the results achieved using the attribute selection approach. The fourth comparison study evaluated the performance of attribute and instance weighting carried out with two-stage PSO and SOA. The fifth comparison study investigated how attribute and instance weighting with standalone use of the standard PSO, standard Genetic Algorithm, and standard Firefly Algorithm performed in drought class prediction using the three classifiers.
In the first comparison experiment, the dataset was directly applied to the classifier without any weighting or selection operation on either attributes or instances. In imbalanced datasets, the prediction performance for the majority class tends to be excellent, while it is lower for the minority (target) class. Higher performance values for the majority class result in increased precision average, recall average, and accuracy values automatically.
Table 1 presents the classwise performance report, highlighting the performance differences between the prediction of the drought class (minority) and the Not Drought class (majority) in this study. For all classifiers, the precision value for the Not Drought class is above 0.9, and importantly, the recall value is also above 0.95. However, the recall values for the Drought class are below 0.6 with different classifiers, with Random Forest achieving a precision value of 0.9 and Gradient Boosting achieving a moderately good precision value of 0.81, while Decision Tree shows a lower precision value. Another observation is the difference between precision and recall. Random Forest exhibits a difference of (0.9–0.3 = 0.6), and Gradient Boosting shows a difference of (0.8–0.6 = 0.2). To address this, a multi-objective optimization technique is employed to achieve a balance between precision and recall values. Additionally, high accuracy values are noted. Despite the recall value for the minority class (drought) being below 0.5, the accuracy remains above 0.9 for all three classifiers. This indicates that accuracy is not a reliable measure for imbalanced datasets, as it includes the performance of the majority class prediction, leading to inflated accuracy values.
The fitness function of the SOA is designed to enhance both precision and recall in predicting the minority drought class. Our objective was to improve these values using SOA in conjunction with three wrapper classifiers. The initial experiment focused on predicting the minority drought class using SOA attribute-weighted datasets, and the results are presented in
Table 2. Subsequently, SOA instance-weighted datasets were utilized, and the outcomes are provided in
Table 3. A significant performance improvement is observed when comparing the experimental results in
Table 2 and
Table 3 with those in
Table 1. The results indicate that the Random Forest Classifier solely increases precision without affecting the recall value. The Decision Tree Classifier achieves a balance between precision and recall, albeit not at high levels. On the other hand, the Gradient Boosting Classifier demonstrates greater success in achieving high precision and recall values while maintaining balance. When comparing attribute weighting and instance weighting results under different wrapper classifiers, the Gradient Boosting classifier with attribute weighting yields superior outcomes compared to instance weighting. The precision value with attribute weighting reaches 9.2, while simultaneously increasing recall to 0.79. In contrast, instance weighting results in a precision value of 0.9 and a recall value of 0.76.
Based on the SOA weighting with the Gradient Boosting Classifier, the attribute and instance weights are analyzed as follows. The attribute weights provide insights into the significance of each attribute in predicting drought. Remarkably, the primary attribute contributing to drought prediction is the drought index SPEI, followed by other notable factors such as CO
2 pollution, PM2.5 pollution, and sea level rise (refer to
Figure 6).
Moreover, by utilizing the explainable AI technique SHAP, a classwise analysis of attribute importance is conducted and displayed in
Figure 7.
As per SHAP the contributions of the climatic variables SPI12, PM2.5, CO2, SPI6, mean sea level of the Bay of Bengal, SPEI12, and mean sea level of the Indian Ocean are prominent in drought-occurrence prediction. A comparison of
Figure 6 and
Figure 7 shows that both SOA weighting and SHAP give high weighting to climatic variables such as mean sea level and pollution. The attribute of mean sea level of the Bay of Bengal is contradictory, since SOA assigns it a lesser priority, while SHAP assigns it a higher importance. Classwise, the attributes are equally weighted. The dataset consists of a comprehensive collection of data spanning 26 years, with information available for each month. The instance weights are calculated based on the 312 monthly instances, indicating that the months of March, April, July, and August significantly contribute to the prediction of drought (refer to
Figure 8).
The second set of comparison experiments aimed to evaluate the performance of the SOA-weighted classification approach in handling imbalanced datasets, in comparison to the popular stratified cross-validation technique. The Repeated Stratified K-Fold function with n_splits = 10 was utilized for this evaluation. Upon comparing the results of drought class prediction using the SOA attribute weighting and stratified cross-validation (as shown in
Table 4), it is evident that our proposed SOA method achieved results that were nearly equivalent to stratified cross-validation.
For the third comparison study, attribute selection was implemented, and the attribute importance scores given by all three classifiers were analyzed. Based on these scores, the 15 most common attributes with high importance scores across all classifiers were selected. The drought classification process was then conducted using these 15 attributes, and the results are presented in
Table 5. When comparing the performance of the Attribute selection technique with our proposed SOA attribute weighting, it was observed that attribute selection yielded a precision and recall score of 0.76 with the Gradient Boosting Classifier. However, the performance of attribute selection with the other two classifiers was poor. Similarly, Random Forest exhibited a significant difference between precision and recall, whereas Decision Tree provided a more balanced performance, albeit with lower overall accuracy.
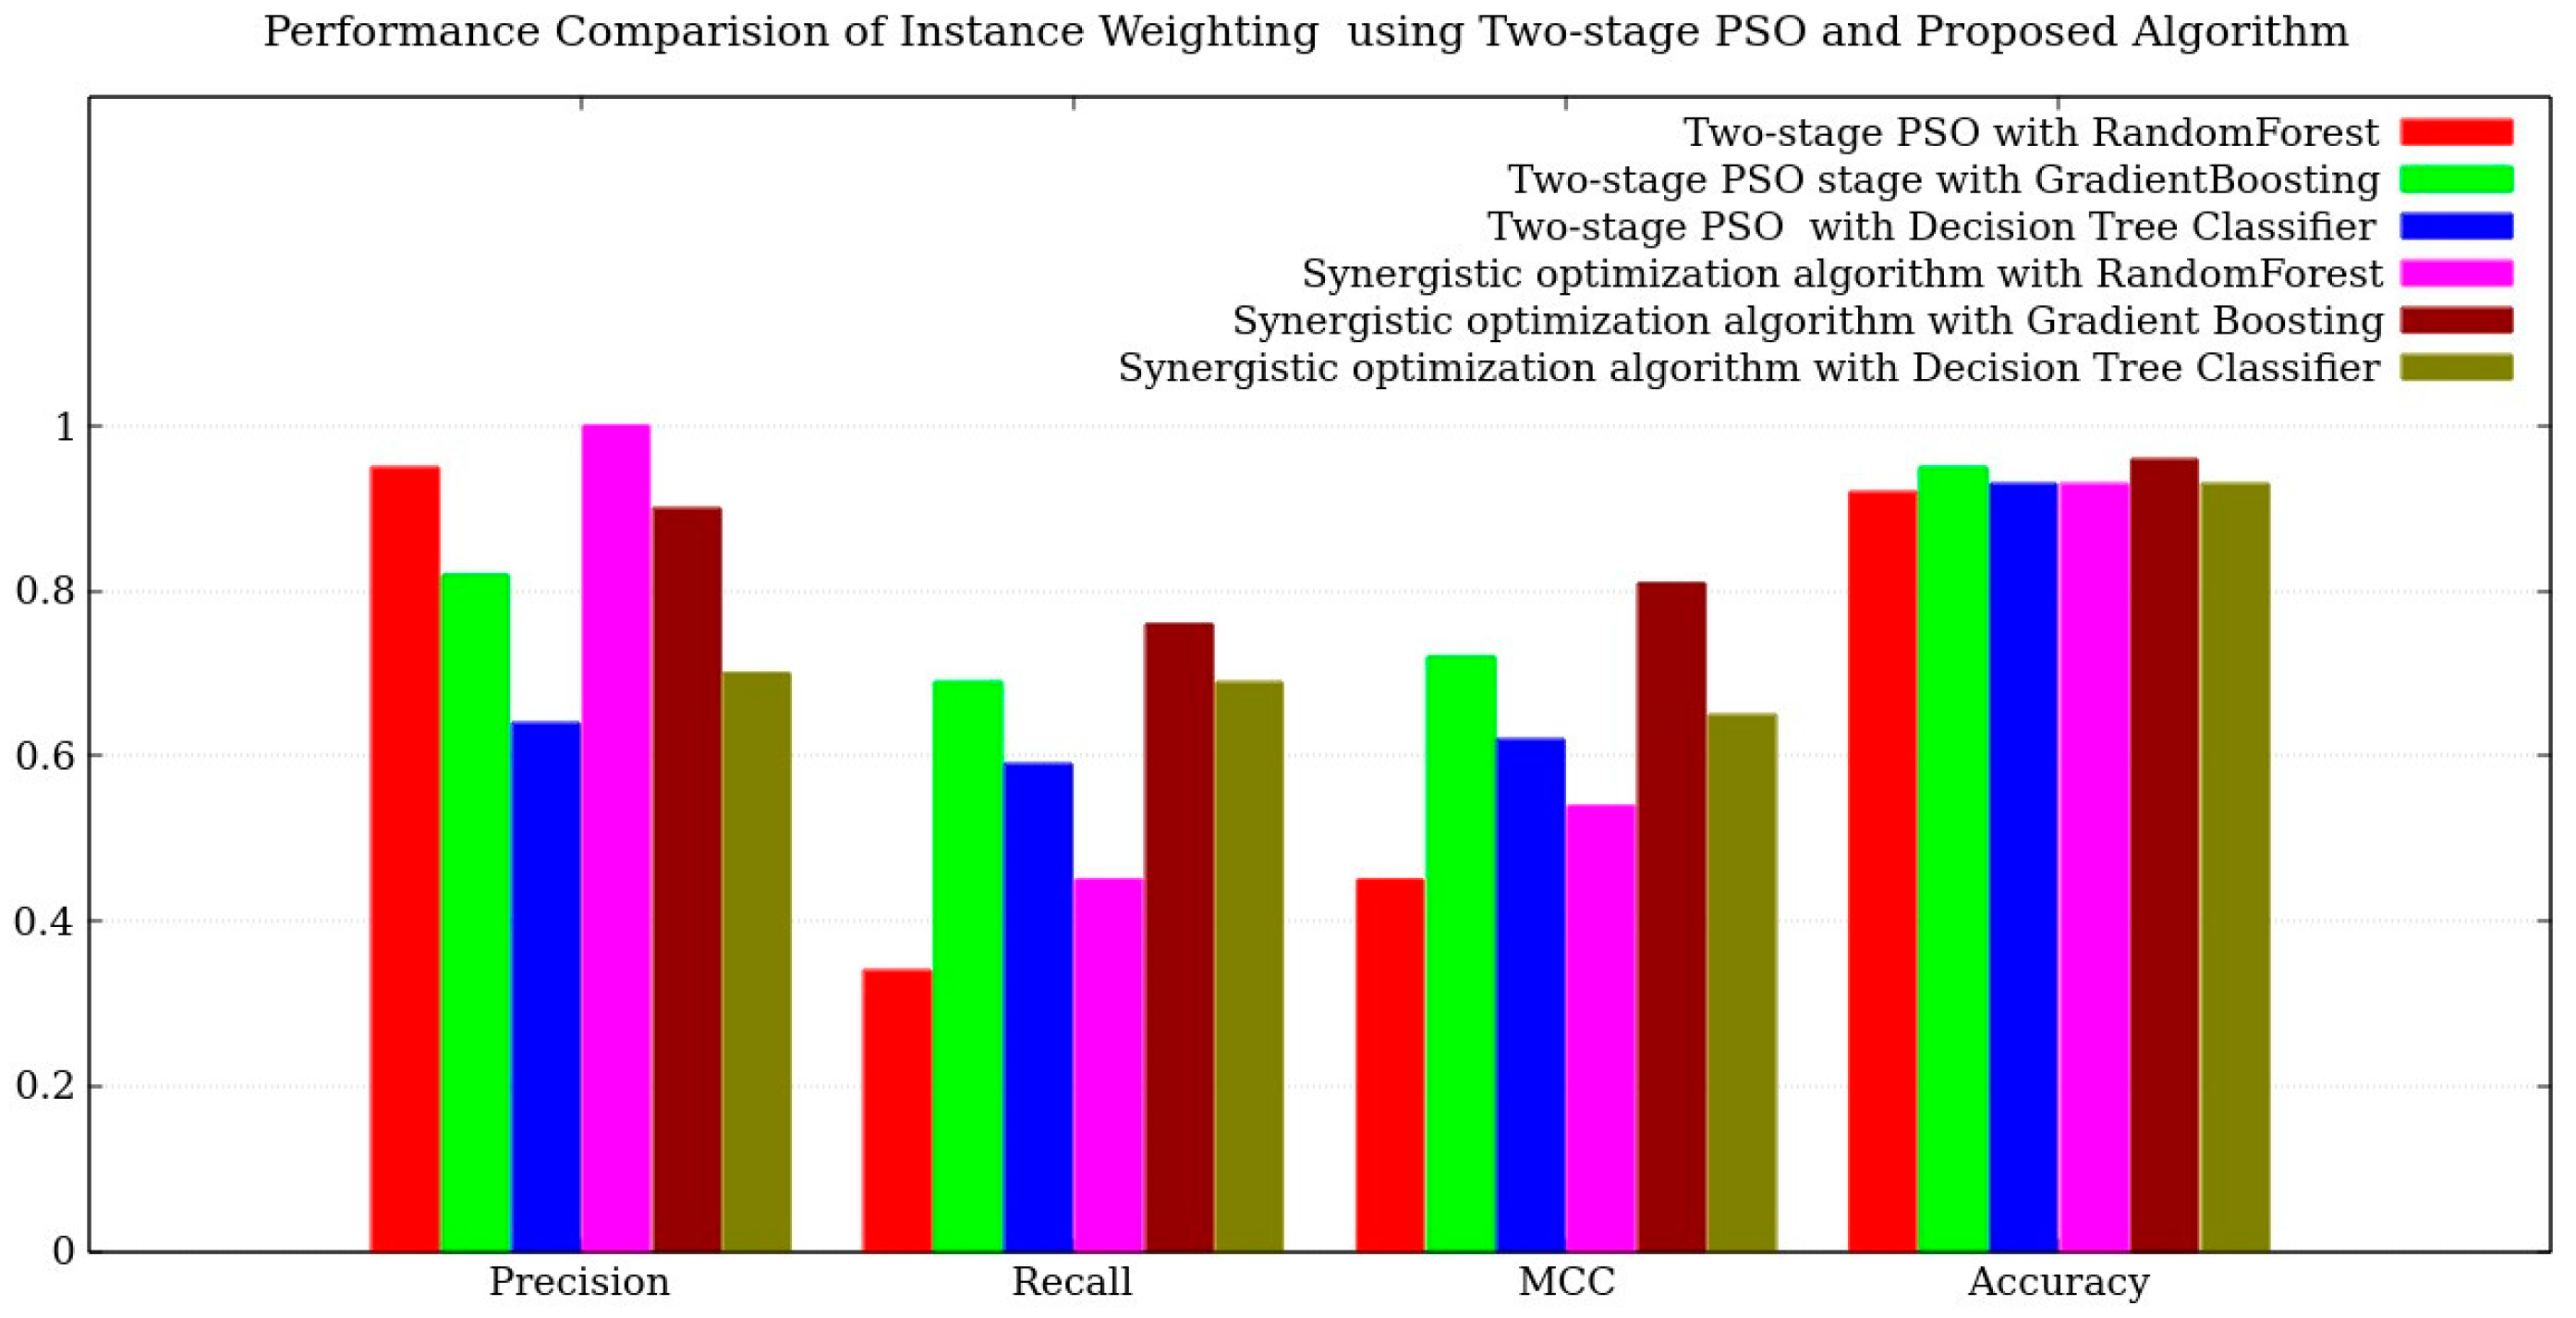
The comparison work involved attribute and instance weighting using two-stage PSO [
50]. The results are presented in
Figure 9 and
Figure 10. It was observed that the wrapper classifier Gradient Boosting performs exceptionally well, ranking at the top. Both instance weighting and attribute weighting yielded similar results when combined with gradient boosting. However, a limitation of two-stage PSO is its inability to improve the recall value equal to precision, regardless of attribute or instance weighting and the wrapper classifier. The best precision and recall value pair achieved was 0.82 and 0.69.
Comparing two-stage PSO with the SOA attribute and instance weighting, the results in
Figure 9 and
Figure 10 demonstrate that SOA exhibited significant improvements in recall compared to two-stage PSO. In terms of precision enhancement, both methods performed equally well.
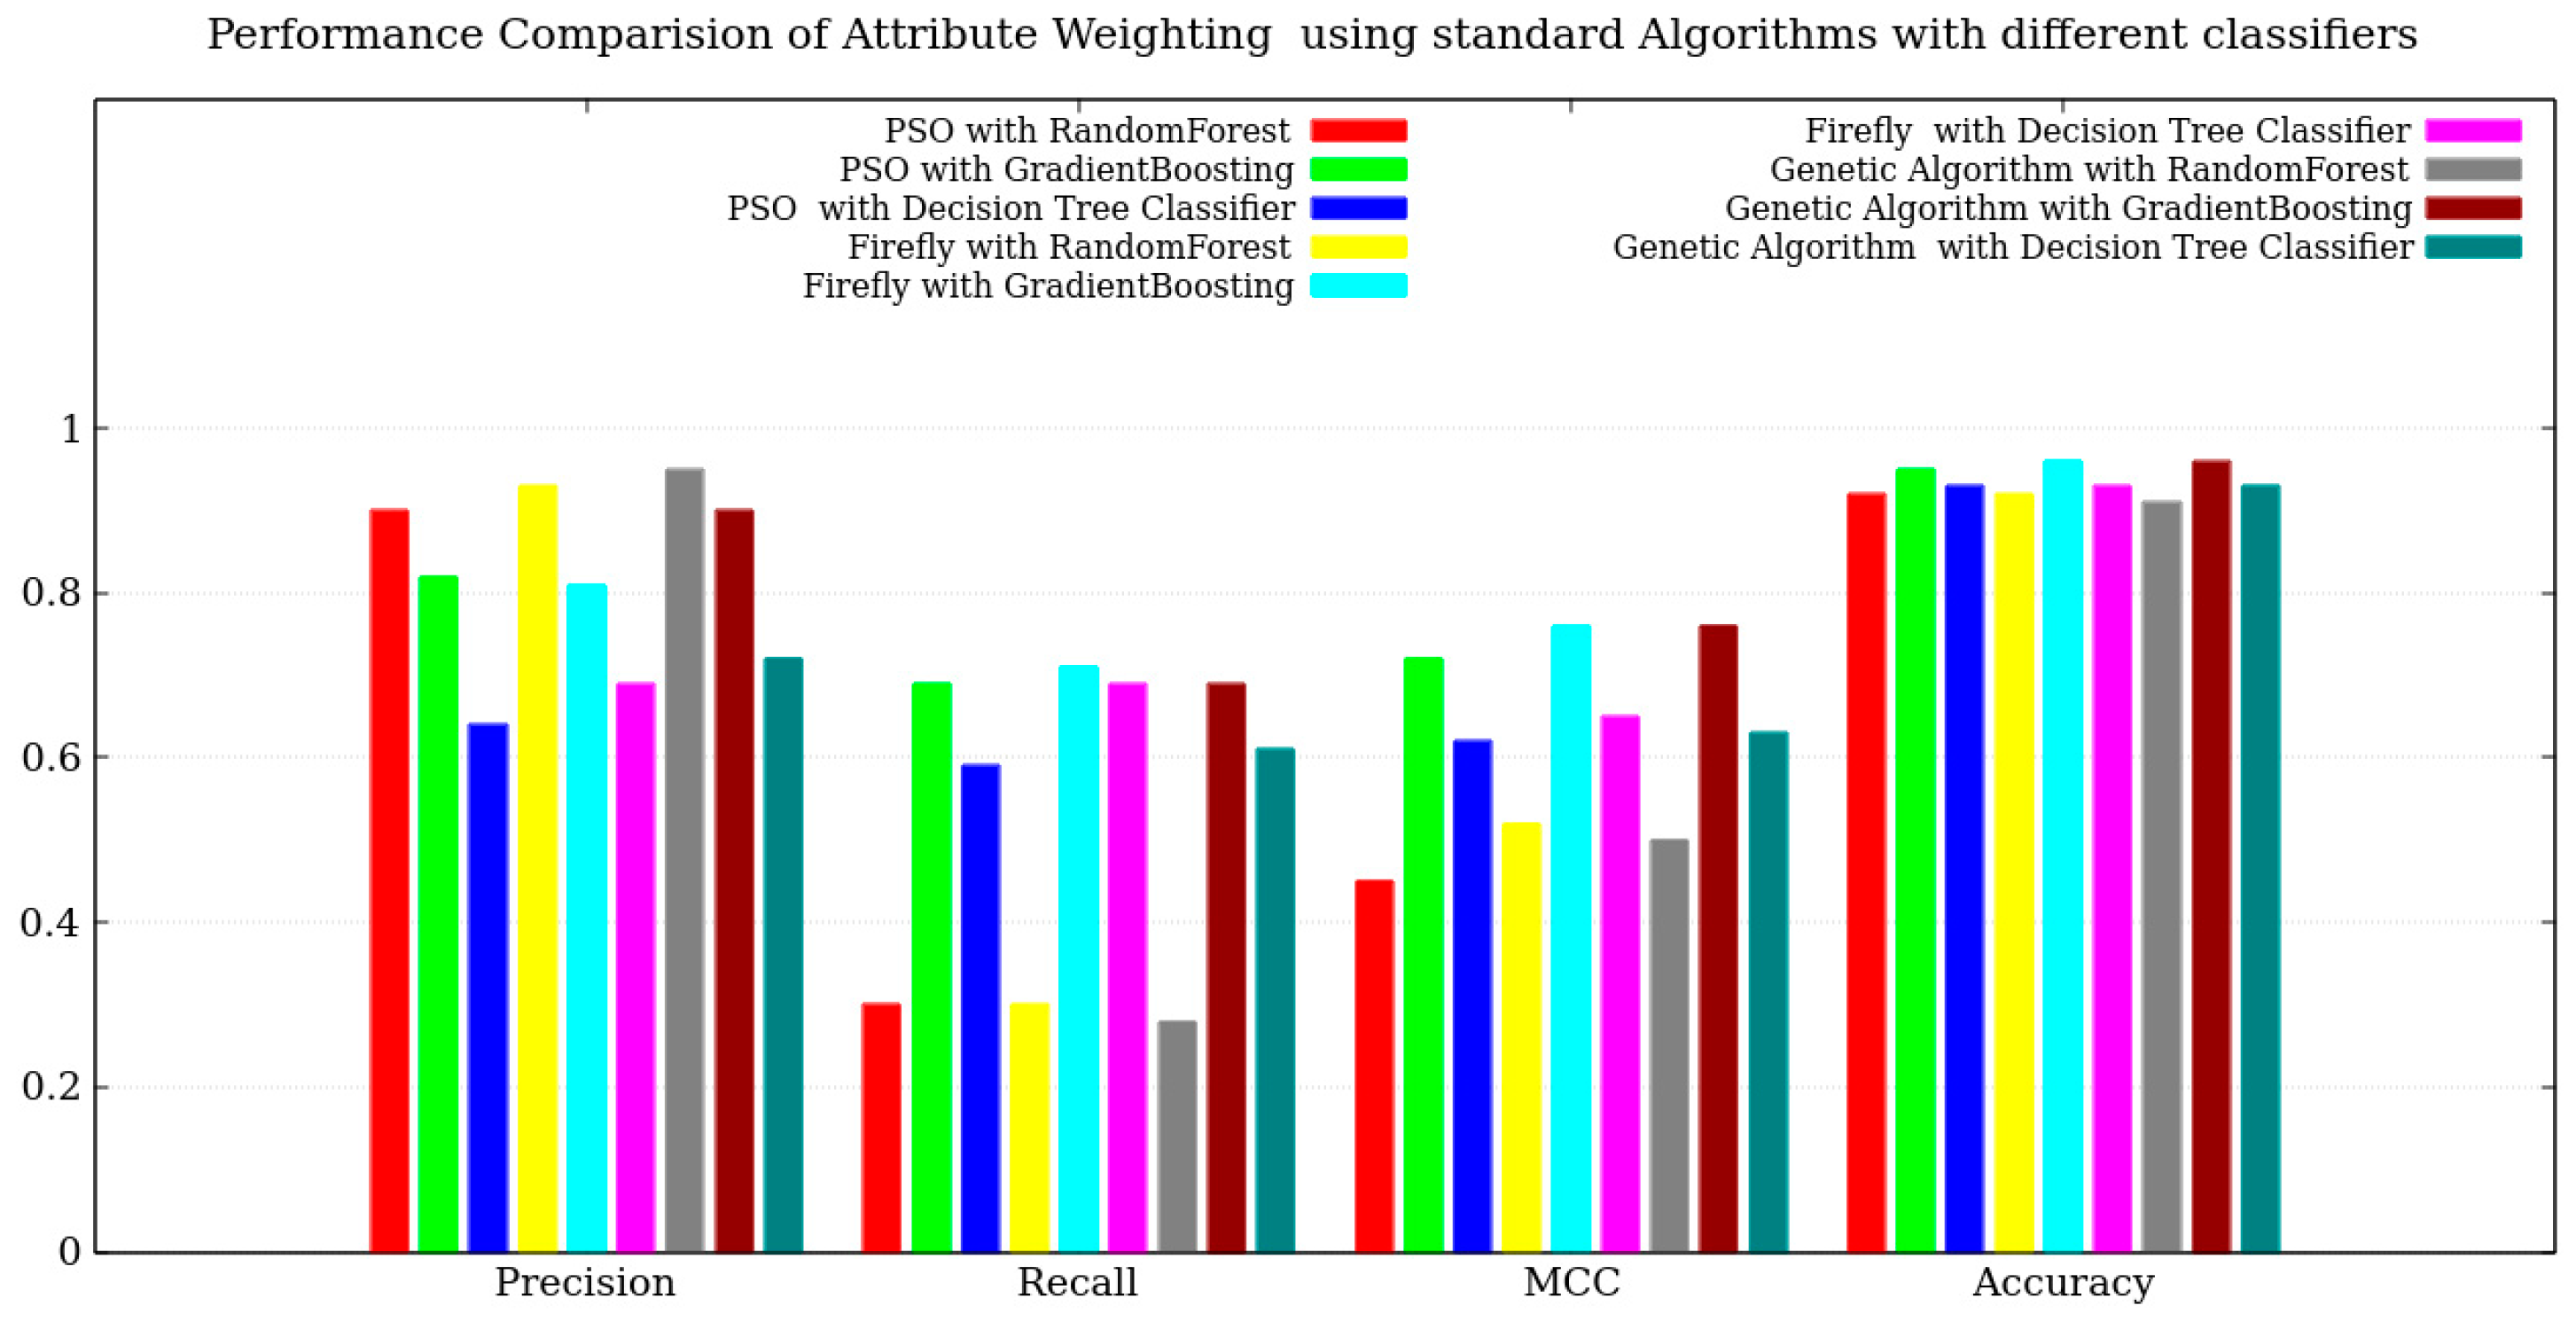
The fifth comparison pertained to the performance of a single optimization algorithm in comparison to SOA performance. The outcomes revealed that collective performance yielded favorable results. Specifically, the standard PSO algorithm in conjunction with the Gradient Boosting Classifier demonstrated promising results. However, the standard Firefly and Genetic algorithms failed to surpass a recall value of 0.7. Please refer to
Figure 11 and
Figure 12 for a visual representation of the obtained results.
The analysis focuses on the performance of the Gradient Boosting Classifier in conjunction with attribute weighting, which yielded the most optimal results. The precision–recall curve of this combination is examined in
Figure 13. Notably, the achieved AUC score for drought-occurrence prediction was 0.85.
4. Discussion
From the review work, we developed an understanding that most works on drought prediction have been on predicting drought indices using statistical techniques or machine learning techniques. Nonetheless, every drought index has a flaw, and at present, there does not exist a drought index that is universally accepted by all the scientists of the world. There are many successful works that include factors such as wind speed, solar radiation, SST, ENSO, El Niño, and many more along with drought indices in the prediction of drought [
51]. Hence, as per the list of climatic indicators given by GCOS, we included the indicators under the categories of temperature, atmosphere, and sea. The atmosphere category included the pollution element, since pollution plays a major role in global climate changes; thus, in our work, we have included the pollution element as well. We used the drought indices and climatic indicators to predict whether a year would be a drought year or not. The study aimed to find the relationship between climatic indicators and drought occurrence, and it also aimed to determine which months’ data strongly contributed to drought occurrence.
As per the results, SOA gives the topmost importance to SPEI and, more specifically, SPEI on a 6-month scale in predicting drought. The reason is that SPI is based on the precipitation data, whereas SPEI is based on a complete package of precipitation and evapotranspiration. The next most important factors discovered are sea level changes and pollution factors. They are marked as important climatic indicators of global climate change by the United States Environmental Protection Agency (US EPA) and National Oceanic and Atmospheric Administration (NOAA) [
52,
53]. From the instance weighting, it was identified that the summer months of March and April and the southwest monsoon months of July and August play the crucial roles in predicting drought. We can conclude that sea level changes, wind speed, and pollution levels in the summer and southwest monsoon periods will contribute highly to drought-occurrence prediction for a given year.
The drought-occurrence prediction dataset created by us is an imbalanced one; hence, to increase its precision and recall, attribute (or instance) weighting with SOA was used. This new approach achieved good improvements in precision and recall. The prediction of Drought or Not Drought is determined by the classification threshold value. Determining the classification threshold is a crucial task in classification. The multi-objective optimization employed will tune the weights of attributes (or instances) and find the perfect threshold value that results in maximizing both precision and recall. Since the weight tuning is performed using an optimization algorithm in an iterative manner, it is able to find the perfect threshold value. In this study, the precision–recall curve was able to reach an AUC score of 0.85.
Our previous work with two-stage PSO employed a single optimization algorithm and a fine-tuned population. In this way, it was able to achieve precision of 0.82 and recall of 0.69. However, the proposed SOA algorithm combines the capabilities of multiple optimization algorithms and neighborhood learning. As a result, the population diversity increases and optimal weights of attributes (or instances) were successfully determined. In this way, a precision score of 0.9 and a recall score of 0.76 were achieved.


