Article

Hydrological Implications of Recent Droughts (2004–2022): A SWAT-Based Study in an Ancient Lowland Irrigation Area in Lombardy, Northern Italy

1
Department of Earth and Environmental Sciences, Università degli Studi di Pavia, Via Ferrata 1, 27100 Pavia, Italy
2
Department of Agroecosystem Analysis and Modelling, Faculty of Organic Agricultural Sciences, University of Kassel, 37213 Witzenhausen, Germany
3
Department of Watershed Management Engineering, Faculty of Natural Resources, Tarbiat Modares University, Noor 46417-76489, Iran
4
Department of Landscape Functioning, Leibniz Centre for Agricultural Landscape Research, 15374 Müncheberg, Germany
*
Author to whom correspondence should be addressed.
Sustainability 2023, 15(24), 16771; https://doi.org/10.3390/su152416771
Submission received: 31 October 2023 / Revised: 29 November 2023 / Accepted: 11 December 2023 / Published: 12 December 2023
(This article belongs to the Special Issue Drought and Sustainable Water Management)

Abstract

:
This study examines the hydrological dynamics of the Ticino irrigation cascade in northern Italy from 2004 to 2022. The region, which is shaped by human activity, is characterized by its flat topography and complex management of water resources, featuring a unique historic irrigation cascade. Utilizing the Soil and Water Assessment Tool (SWAT), we investigated the water availability during recent severe droughts in this complex agricultural environment, which lacks natural drainage. This area faces risks due to increasing temperatures and increased rainless days. Therefore, understanding the soil water dynamics is essential for maintaining the system’s sustainability. Calibrating and validating the SWAT model with runoff data was challenging due to the absence of natural drainage. Thus, we utilized MOD16 evapotranspiration (AET) data for calibration. Generally, the calibration and validation of the SWAT model yielded satisfactory results in terms of the Kling–Gupta efficiency (KGE). Despite some discrepancies, which were mainly related to the data sources and resolution, the calibrated model’s outputs showed increased actual evapotranspiration that was influenced by climate and irrigation, leading to water deficits and droughts. The soil water content (SWC) decreased by 7% over 15 years, impacting crop productivity and environmental sustainability. This also resulted in rising water stress for crops and the ecosystem in general, highlighting the direct impact of adverse climate conditions on soil hydrology and agriculture. Our research contributes to the understanding of soil–water dynamics, as it specifically addresses recent droughts in the Lombardy lowlands.

1. Introduction

It is widely accepted that global climate change can cause significant changes in hydrological processes due to the higher temperatures, more frequent and intense heatwaves, and changes in precipitation regimes [1,2,3]. In particular, droughts have been recognized as natural phenomena that can significantly impact ecosystems, agriculture, and water resources, posing substantial challenges to societies worldwide [4,5,6].
Italy has experienced several droughts in recent years, with drought episodes that have become stronger in frequency and length since 2001. In Northern Italy, 2022 was the warmest year since 1800 according to the Institute of Atmospheric and Climate Sciences (ISAC) of the National Research Council (CNR) [7]. Anomalies were found in February and March with 88% and 55% less precipitation, respectively, and in the summer of 2022—especially in July—with 65% less precipitation. Indeed, a significant lack of rain was observed across most of the European continent during 2022 [8]. This led to significant water shortages, affecting agricultural production and, thus, impacting the local and regional economies [9]. In this context, irrigation plays a crucial role in supporting local agricultural production, as it ensures that crops have adequate water supply in periods of droughts. Without irrigation, crops may experience water stress, resulting in reduced growth, adverse impacts on plant health [10], and lower yields in terms of both quantity and quality. Furthermore, in our study area, irrigation is fundamental for groundwater recharge. Particularly, the flooding of rice fields during winter alleviates water scarcity in spring and early summer by recharging aquifers. Essentially, irrigation serves as a fundamental tool for managing agricultural production during periods of drought. It helps to mitigate the effects of water scarcity, promotes crop productivity, and keeps the whole system balanced. The region of Lombardy in Northern Italy, which is renowned for its ancient lowland irrigation areas characterized by the presence of springs [11,12], has historically been a vital agricultural region due to its rich soils and favorable water supply. The area covers the main terraces and escarpments of the Ticino River. In the past, irrigation water was diverted from the Ticino River through irrigation channels and infiltrated as irrigation water on the uppermost terrace level, re-emerging in the form of springs at the base of the fluvial terrace escarpments [13]. Over centuries, this represented a sustainable water-use cycle that was quite unique in the world and allowed for intensive rice cultivation. However, this traditional irrigation system is now facing new challenges due to changing climate patterns. The region experienced significant droughts in the last few years that affected the water cycle and groundwater levels, e.g., through variations in recharge rates [14]. Therefore, traditional irrigation schemes based on water reuse, which have operated in the region since the eleventh century [15], might be seriously affected. Specific measures and strategies for water scarcity situations should be developed to prevent and mitigate the effects of any severe reductions in water resource availability and to protect agricultural production as much as possible.
In this context, our study aims to examine the complex hydrological dynamics of the area using the Soil and Water Assessment Tool (SWAT), a physically based and complex hydrological model designed to operate at the basin scale [16,17]. The SWAT is widely used to model runoff, non-point source pollution, and other intricate hydrological, ecological, and environmental processes under changing land uses and climate conditions [18,19,20,21,22,23,24]. We used the SWAT to investigate the occurrence and severity of last year’s droughts in Lombardy’s ancient lowland irrigation area. Despite the existence of several hydrological models that were used to study droughts in recent years, such as the DTVGM, GWAVA, SWAT, and HEC-HMS [25], their application in lowland areas is still challenging [26]. Lowlands are characterized by a flat topography and low hydraulic gradients [27]. Furthermore, these areas are often heavily modified in terms of drainage systems due to human activity, such as intensive agriculture. These characteristics make it challenging to delineate first-order watersheds [28] and to assess their hydrological dynamics. Moreover, it is difficult to obtain adequate information about the quantity and quality of irrigation water. Irrigation schemes are highly variable, as they depend on the actual crop water availability and the agricultural management strategies. The dense network of irrigation channels is managed at different administrative levels, ranging from the local field scale to large consortia (consorzio di bonifica Est Ticino Villoresi) that manage general water resources. Thus, a detailed assessment of the irrigation schemes is challenging due to the various levels of administrative competences, as well as missing monitoring and/or documentation activity.
However, in this intensely used agricultural lowland area, calibrating and validating a hydrological model in a traditional way using discharge data is difficult or impossible due to the lack of natural drainage and information on the water resources used for irrigation [29]. Therefore, we propose alternative procedures for calibrating and validating the model. As shown by Becker et al., Odusanya et al., and Shah et al. [29,30,31], model calibration can also be conducted using evapotranspiration data. Various products that provide evapotranspiration information based on remotely sensed data are freely available. Satellite-based products, such as the Global Evaporation data (MOD16), which are based on measurements from the Moderate-Resolution Imaging Spectroradiometer (MODIS), were successfully used to calibrate spatially distributed hydrological models [30,32,33,34]. However, as stated by Becker et al. [29], the calibration of a hydrological model in a flat, complex agricultural environment is quite challenging, particularly when human activities such as irrigation interfere with the natural system or there is a general lack of observed information in terms of their spatiotemporal scales [30].
In this study, we aim to contribute to the understanding of the conditions and dynamics of local water resources in this intensively used agricultural region, with a particular emphasis on the impacts of droughts, especially in the last few years. By addressing the challenges of hydrological modeling in an anthropic landscape, our research represents an innovative approach to understanding the complexities of hydrological dynamics in response to changing climatic conditions.

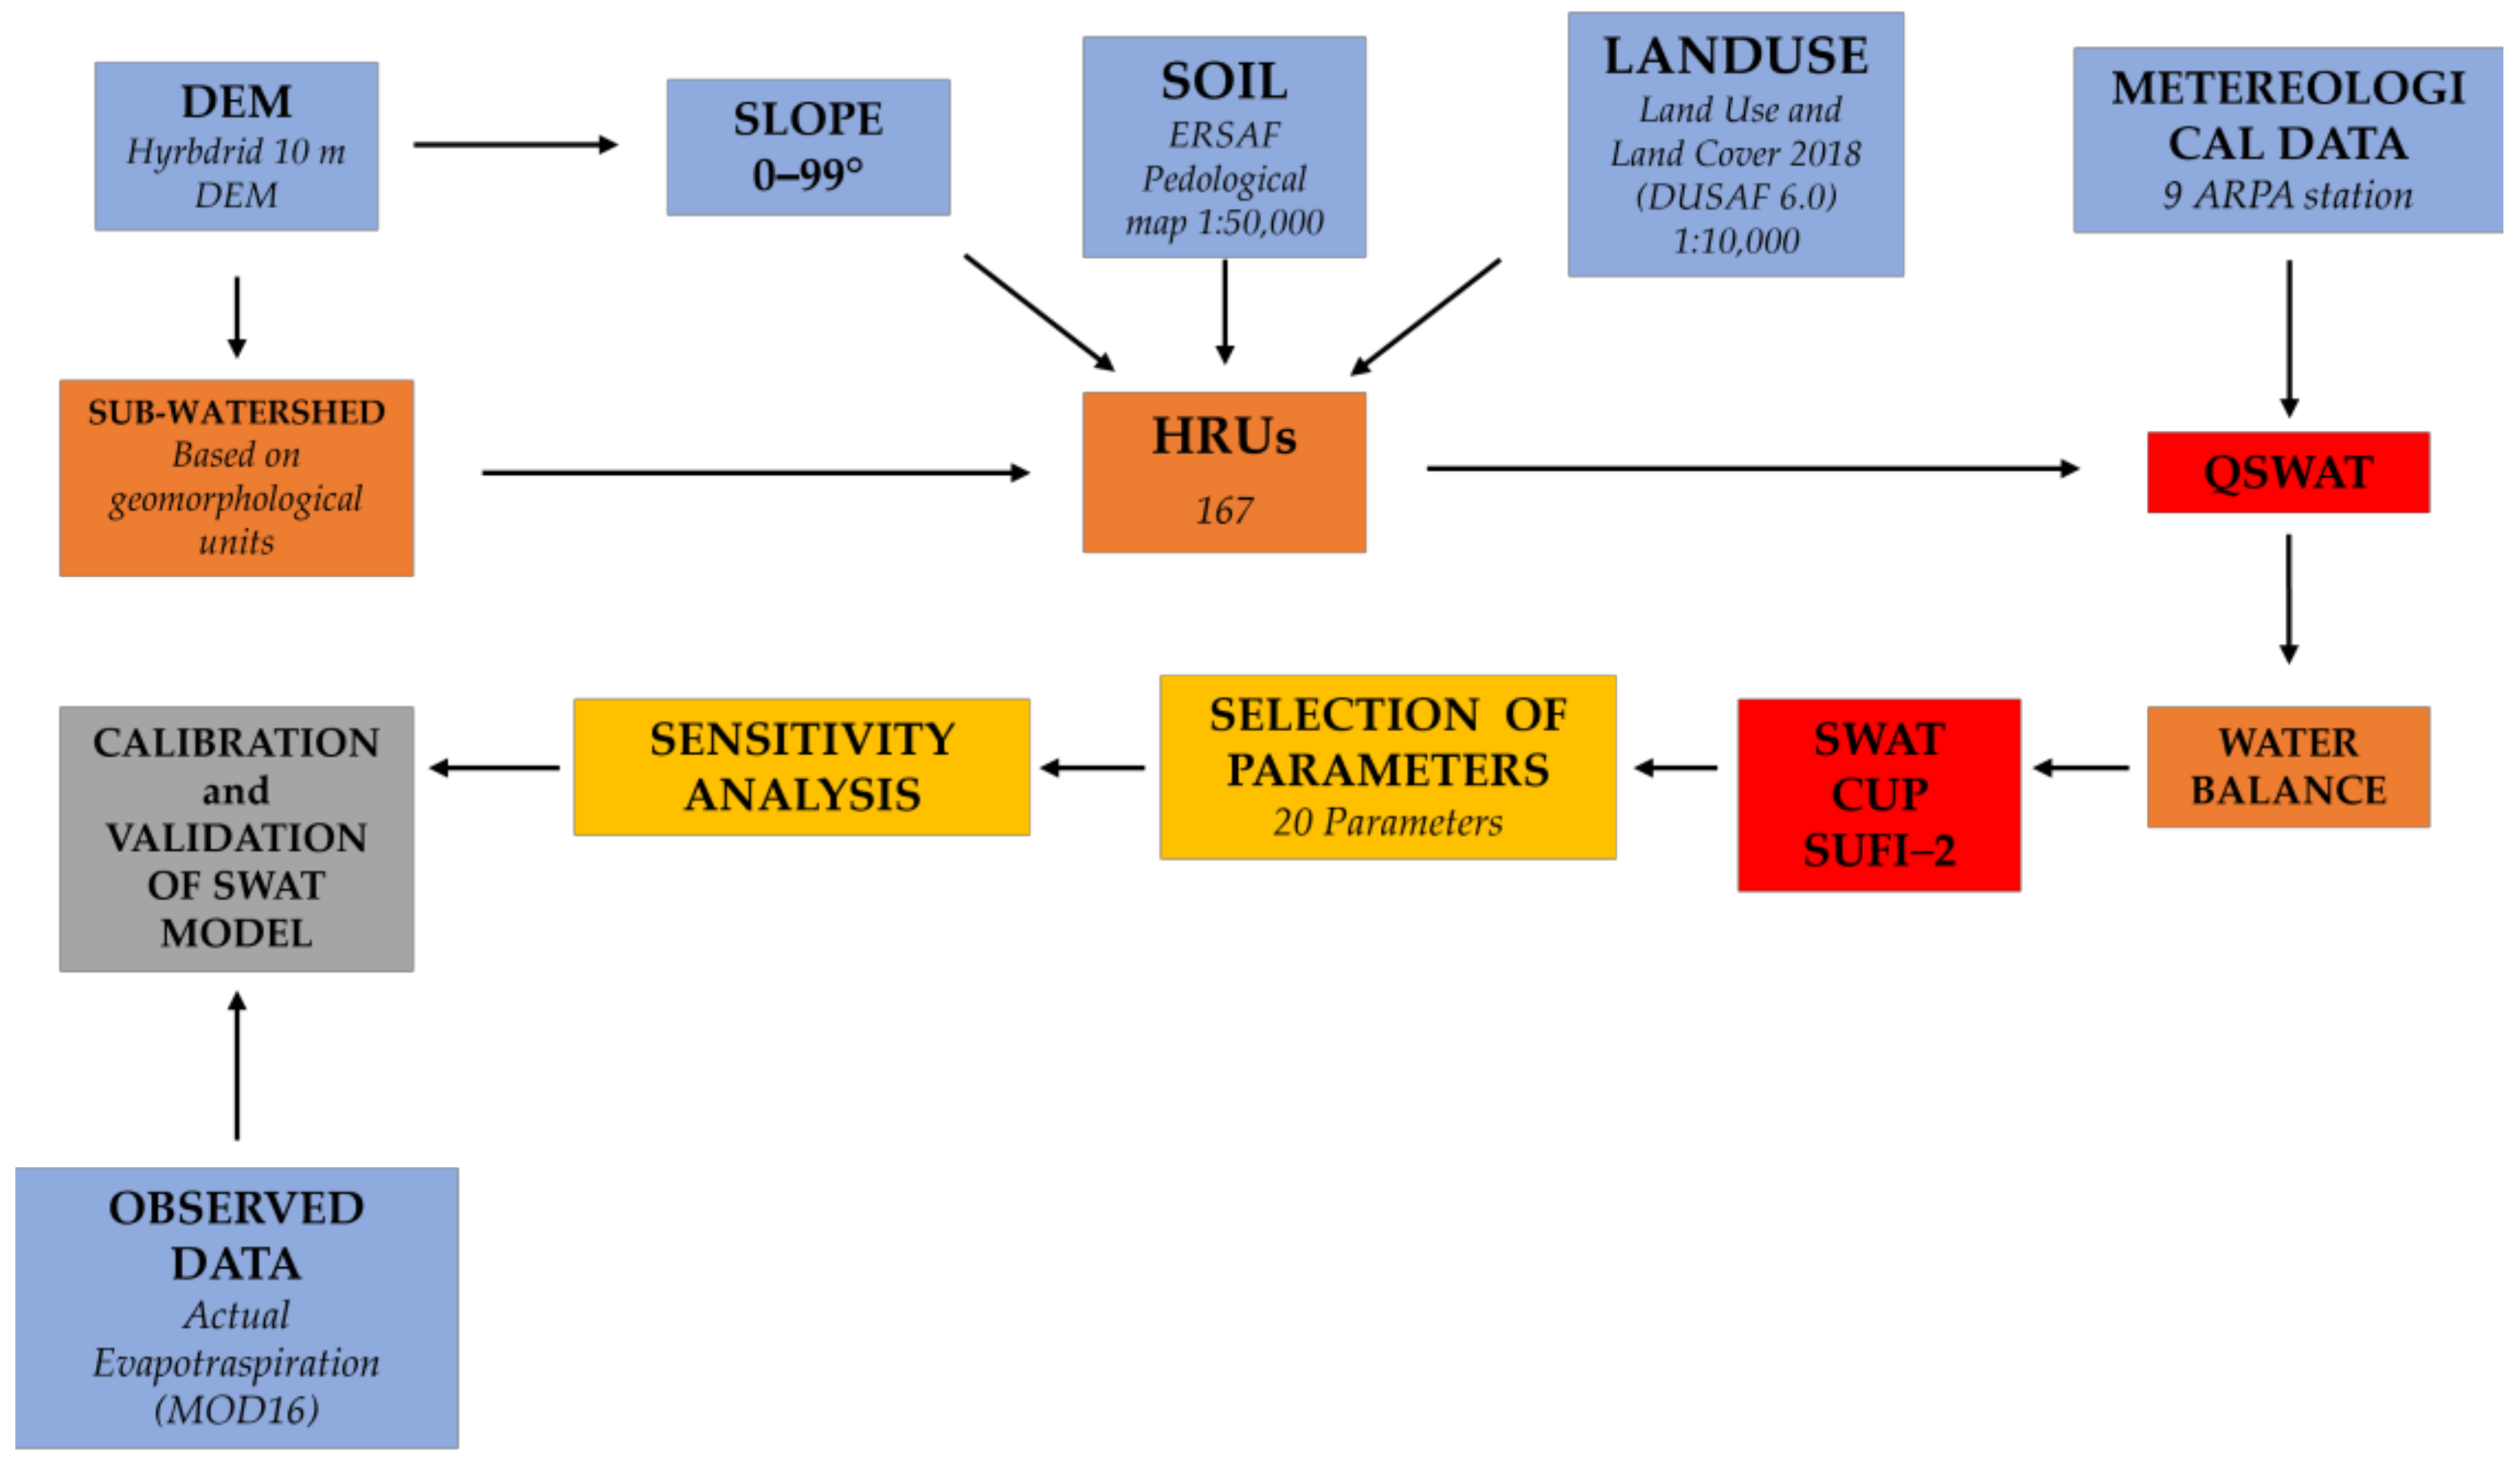
2. Materials and Methods
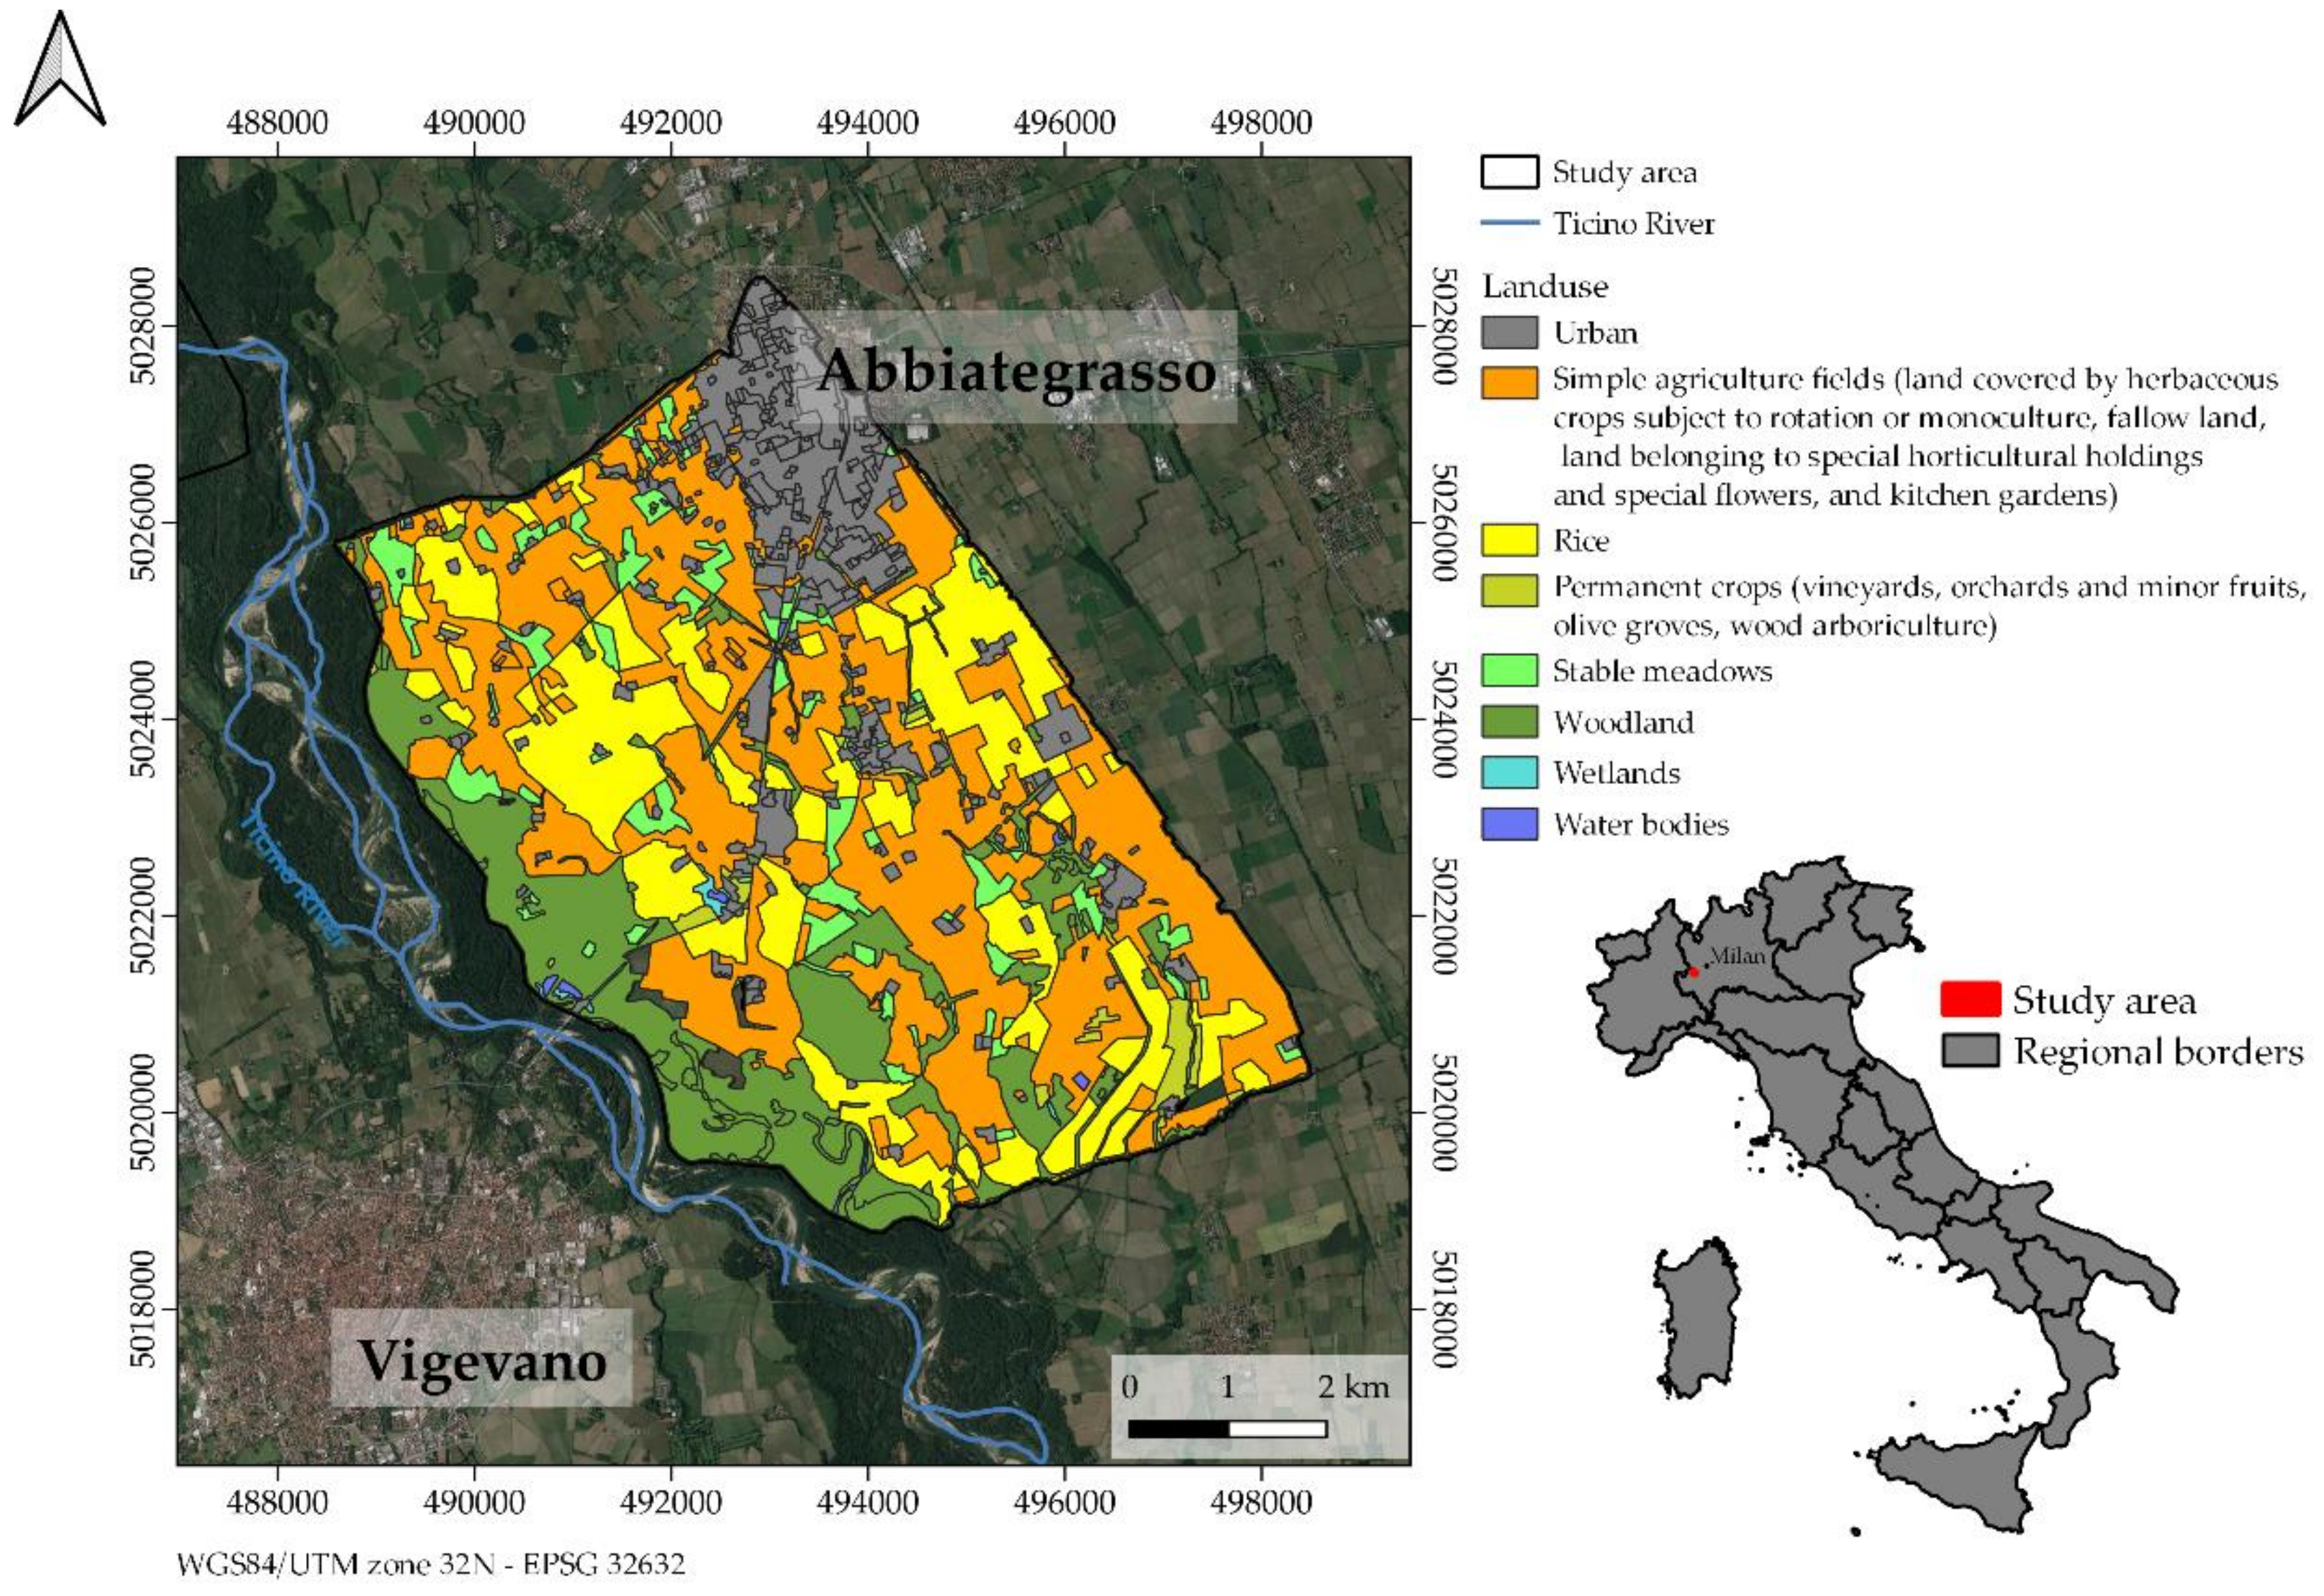
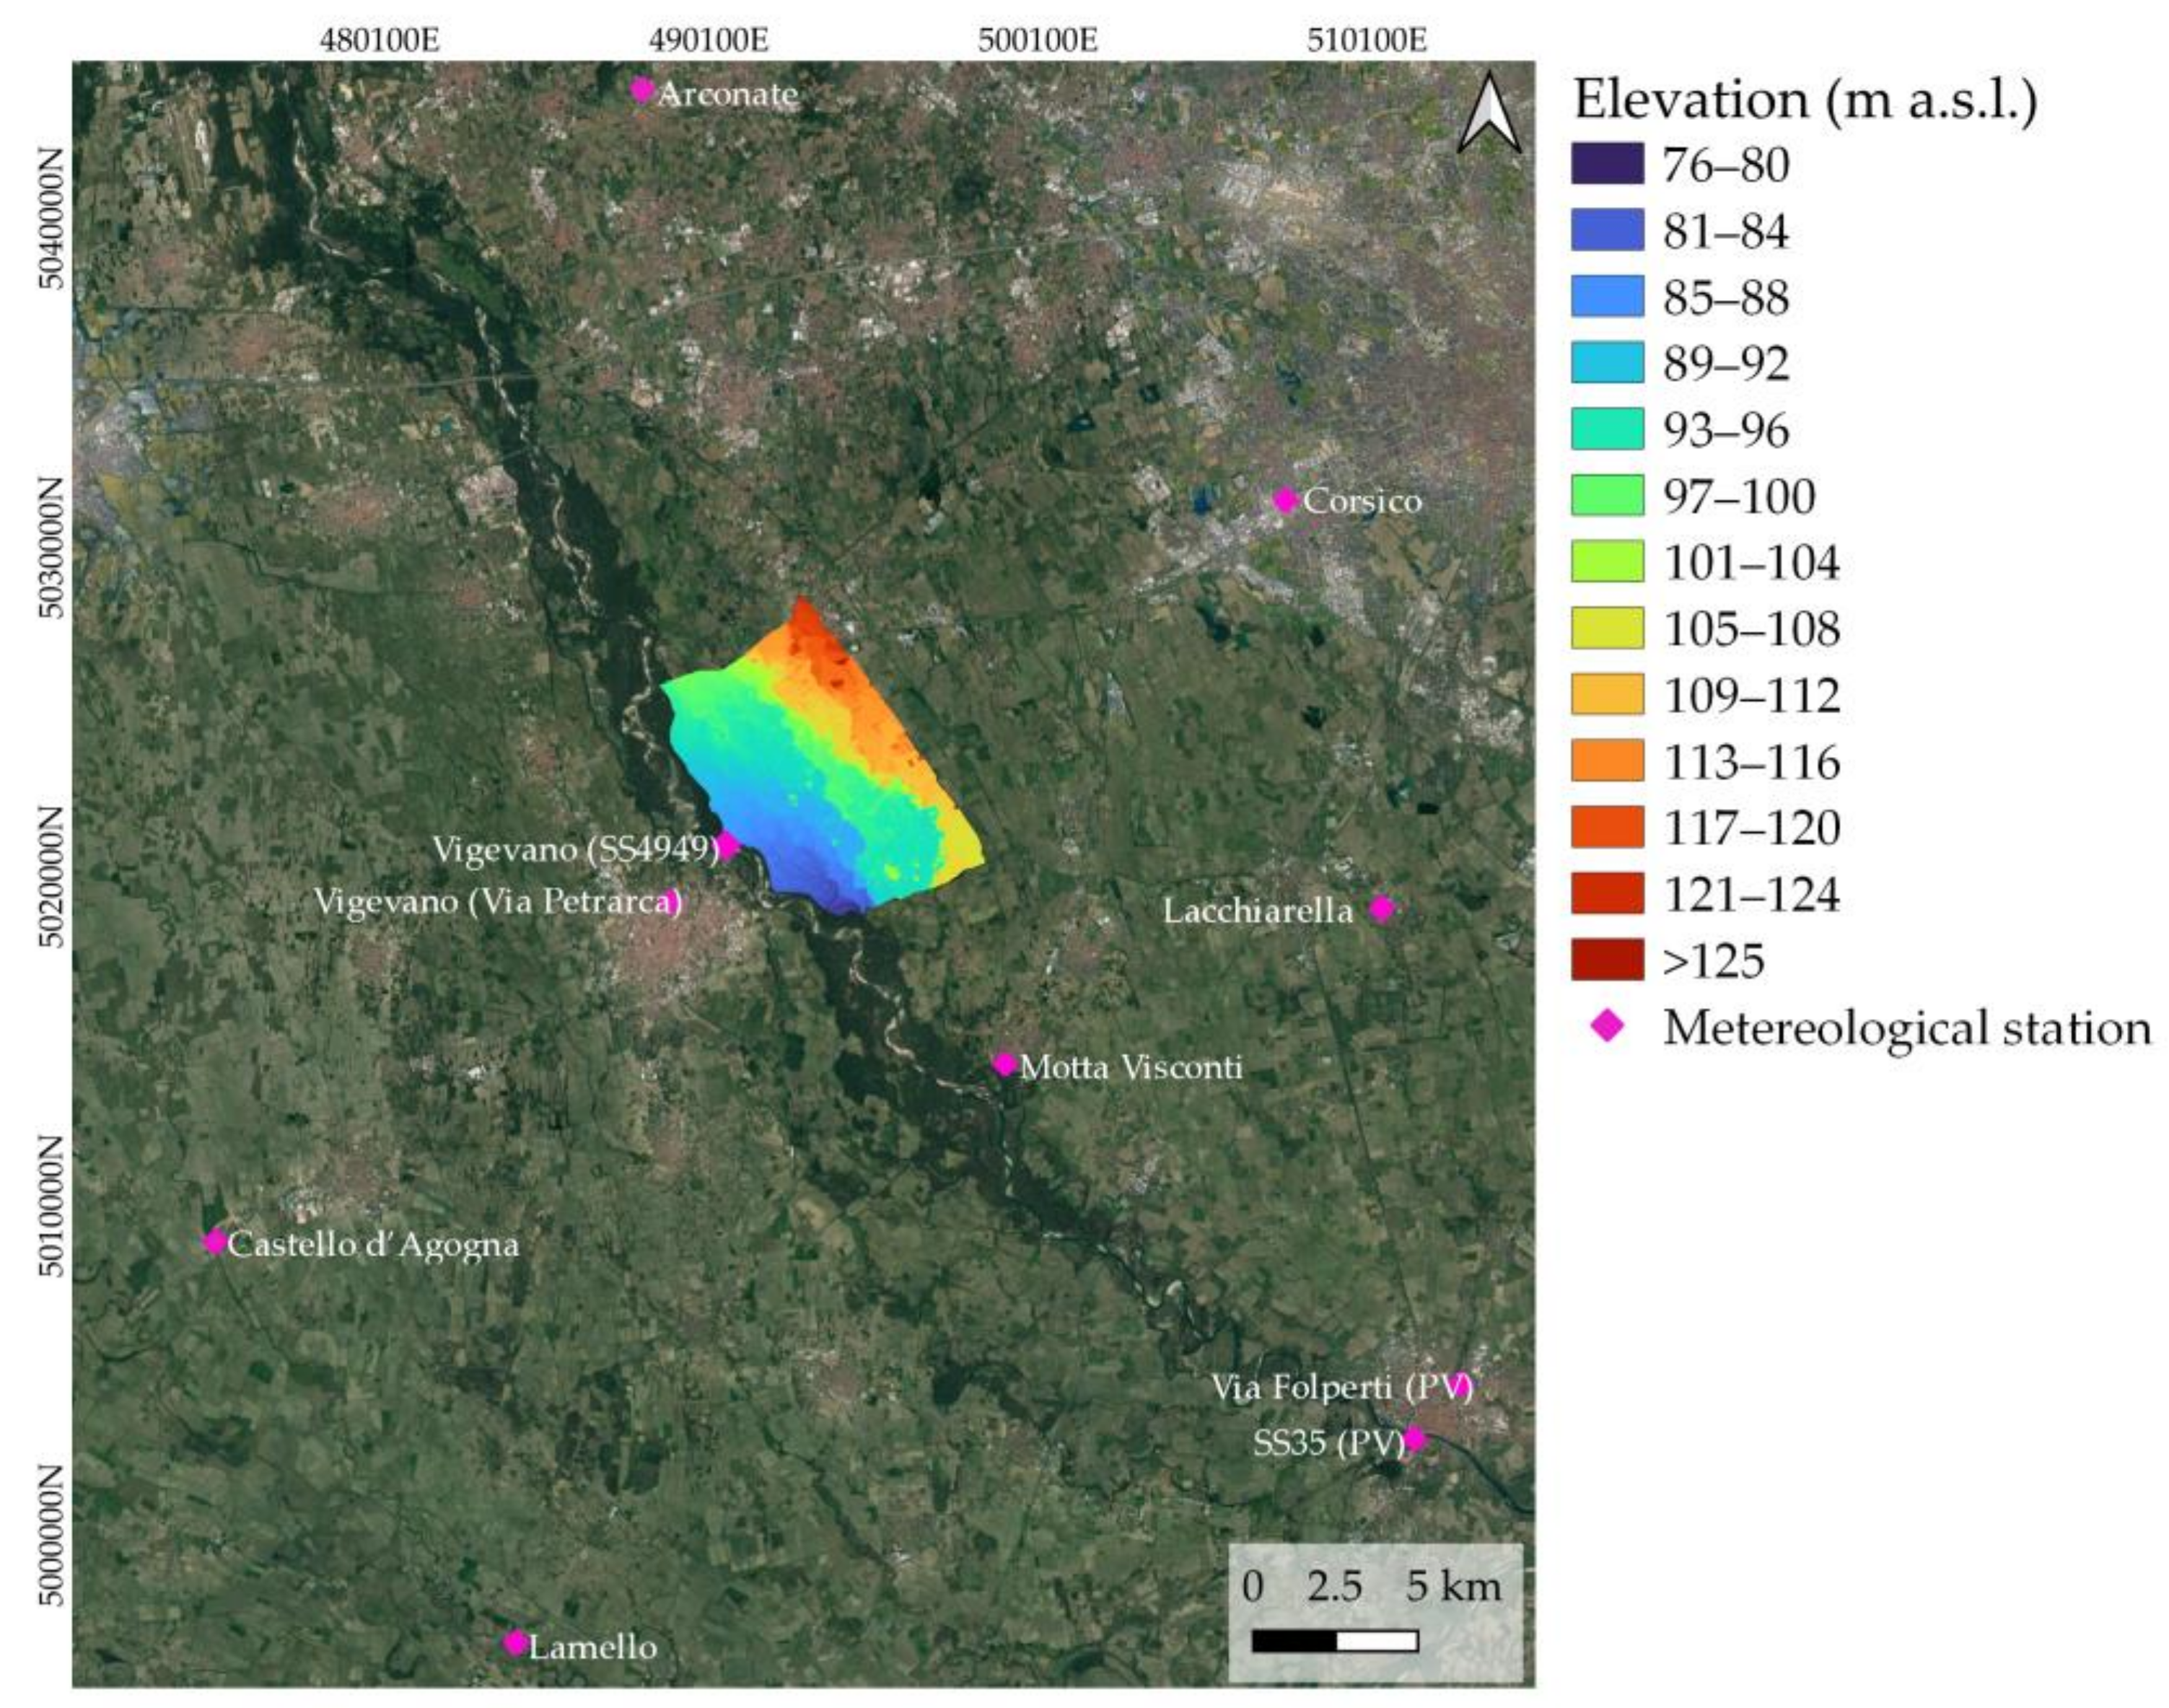
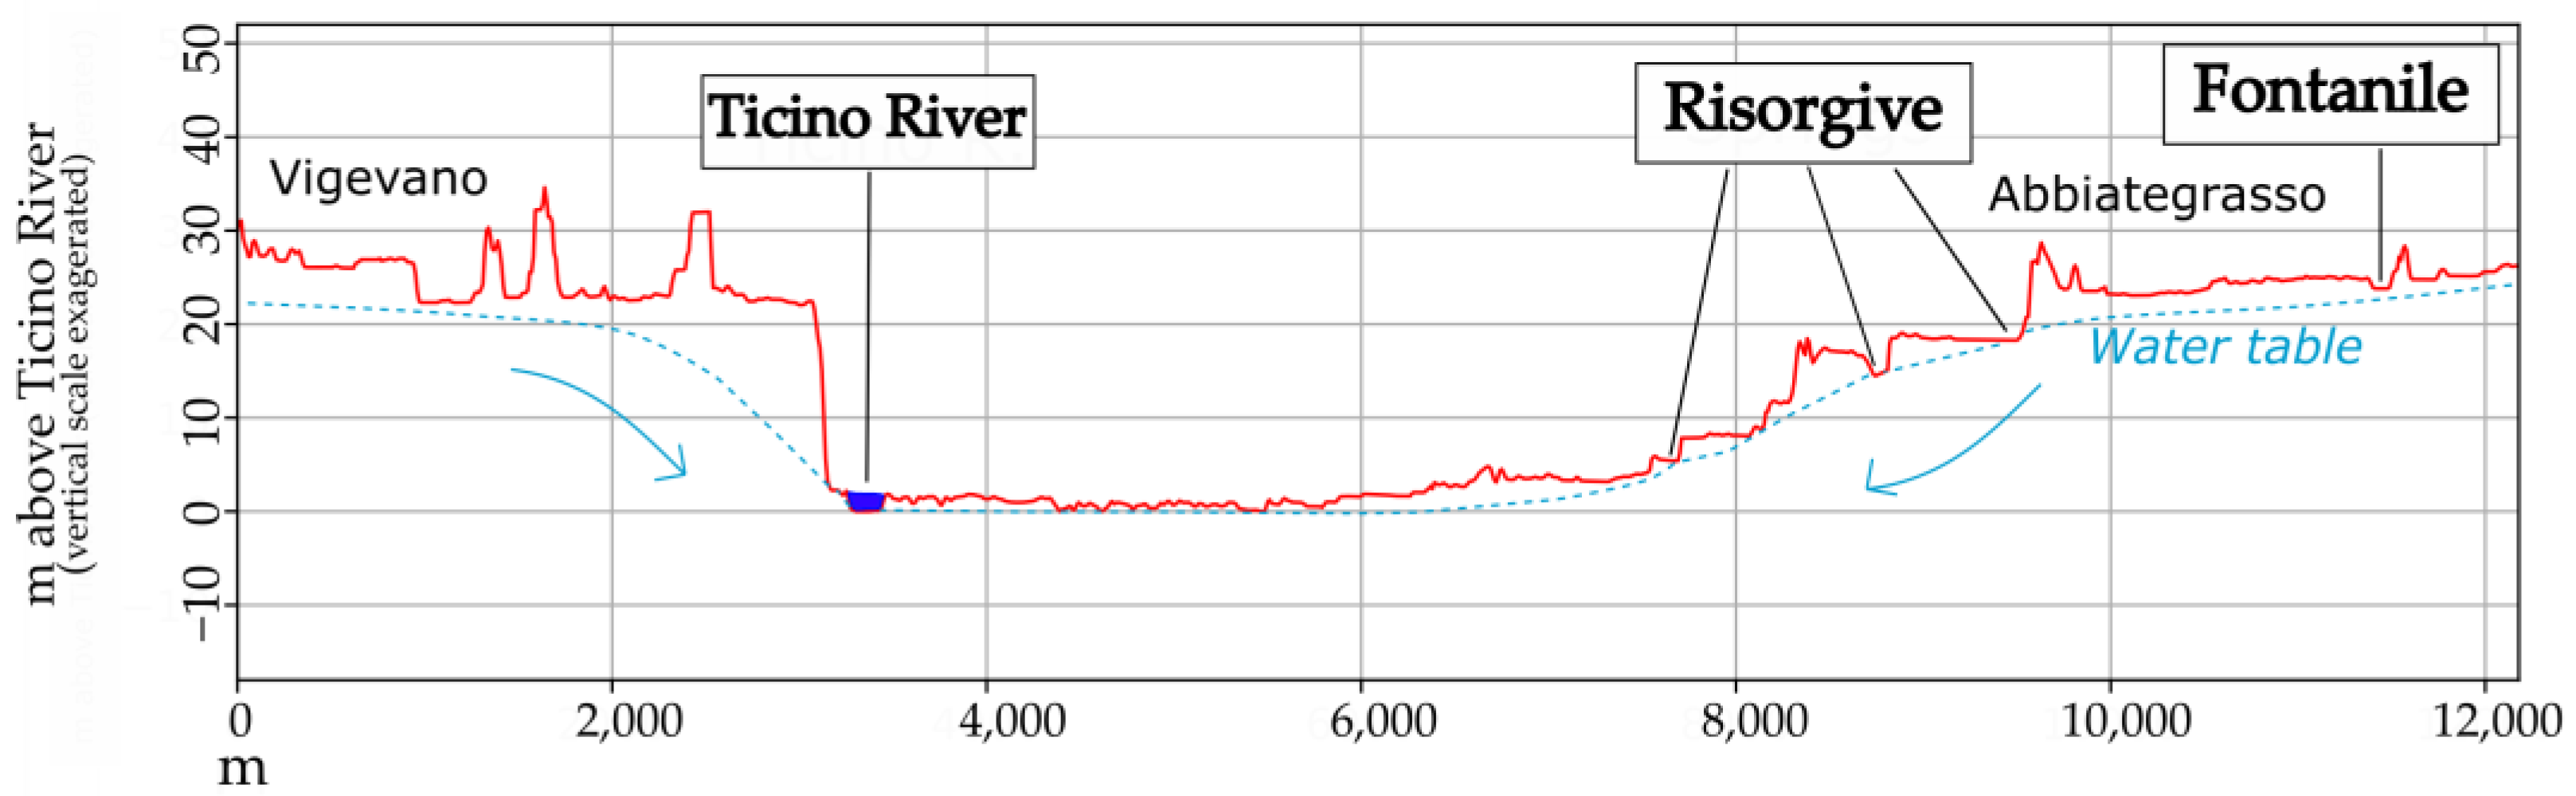
2.1. Study Area

The study area (Figure 1) covers approximately 50 km2 and was located about 20 km southwest of the city of Milan in the intensively used agricultural lowlands of Lombardy, close to the border with the region of Piedmont.
The area covered parts of the Ticino River Valley, with elevations ranging between 76 m.a.s.l. in the southwestern part of the Ticino River to 127 m.a.s.l. around the town of Abbiategrasso (Figure 2). The region is characterized by a humid subtropical climate (Cfa) according to the Köppen climate classification [36], with warm summers, cold winters, and a mean annual temperature of 14 °C. The mean annual rainfall amounts to 782 mm/year—measured at Vigevano SS494 Arpa Lombardia station (Figure 2), which is located close to the Ticino River in the central part of the study area at an elevation of 94 m.a.s.l.
The Ticino River is the only natural drainage system in the area flowing towards the southeast. This area is characterized by artificial drainage and irrigation channels that completely modify the natural drainage system. The study area is flat, except for the river terraces that were formed as a result of the erosive activity of the Ticino River. The area can be divided into three main terrace levels that stretch parallel to the Ticino River. On the left side, these terraces are more developed, while on the right side, there is only one order of terraces. The terrace escarpments have a slope of approximately 20° and are characterized by springs at their base. The oldest terrace, with higher topographic altitudes, is known as the “Ripiano Generale della Pianura,” and it dates back to the upper Pleistocene. It consists of gravelly–sandy fluvioglacial deposits [12] of the last Wurmian glaciation [37]. These coarse deposits allow water to infiltrate and serve as a significant source of aquifer recharge. The intermediate level, which was formed during a subsequent phase of erosive action of the Ticino River, is characterized by terraced fluvial deposits of the Middle Holocene, and it consists of sandy–gravelly and silty textures. The most recent fluvial deposits represent the youngest level of the Ticino valley, attributed to the Upper Holocene, and they are composed of sandy–gravelly and slightly silty textures. Soil has developed above these fluvial and fluvioglacial deposits, with varying depths based on the age of the terrace level. According to the World Reference Base for Soil Resources [38], the soil types range from regosols in the lower part to luvisols and umbrisols on the upper terrace level, which is characterized by a sandy–loamy texture.
From the hydrogeological point of view, groundwater primarily flows towards the Ticino River (Figure 3).
As mentioned previously, this part of the Ticino Valley is characterized by the presence of springs, which are classified as “risorgive” and “fontanili.” “Risorgive” are formed by groundwater that naturally emerges due to changes in topography and the permeability of sediments at the base of the terrace escarpments. On the other hand, “fontanili” refers to springs in lowland areas that have been modified by human intervention [15,39].
The fontanili and risorgive are primarily fed by groundwater. The phreatic aquifer is supplied by local infiltration, streams, and irrigation channels [32]. However, due to the flat nature of the study area (except for the terrace’s slope), the contribution of the surface runoff is negligible [15]. The variation in spring discharge is mainly attributable to water infiltration after periods of rain or irrigation [11].
During the spring–summer period, substantial quantities of water are distributed through a complex channel network for field irrigation. Thus, the water allocated for irrigation serves a dual purpose: It supports agriculture and significantly contributes to recharging the water table, subsequently sustaining the springs at different terrace base levels (see Figure 3). The region has a long history of distinctive land-use and land management practices dating back to the eleventh century, and these involve the construction of irrigation channels [39] and the reuse of water along the fluvial terrace cascade of the Ticino River (risorgive). This has represented a sustainable and effective method of reusing irrigation water for centuries.
Presently, based on the DUSAF 6.0 land-use map (Regione Lombardia, 2019) [40], the main crops in the area are corn and rice. Corn—including maize, along with other simple arable crops, such as wheat, sorghum, and barley—for both grain or silage covers approximately 32% of the area. However, rice covers up to 21%. Furthermore, about 18% of the study area is covered by woodlands, which are predominantly concentrated on the lowermost terrace level. Both corn and rice require substantial amounts of irrigation water [11,41]. As indicated in Figure 4, the irrigation seasons for corn typically run from June to September [14], and furrow irrigation is usually performed. In contrast, the rice fields are generally flooded from mid-April to early May and remain submerged until the end of August or September [11,14,15]. In 2022, one of the hottest years of the century in the study area, the rice fields were flooded from late May to late August, with intermittent flooding. The substantial water usage in rice paddies significantly affects the recharging of the water table [42]. In these rice paddy areas, the primary factor influencing water levels is the agricultural technique for rice cultivation, as described by Lasagna et al. [14].
Crop rotation patterns, sowing and harvesting times, and irrigation practices were obtained through a comprehensive study that included a detailed literature analysis (e.g., [43,44]), on-site inspections, and interviews with local farmers (Figure 4).
Our findings revealed that the most cultivated summer crops were corn and rice, with corn being sown between mid-April and early May, reaching maturity by mid-June, and being harvested in late September. Rice, on the other hand, was typically sown later than corn—between mid-April and late May. It grew from early June to mid-October and was harvested in the middle and end of October. Double cultivation with crops such as corn and sorghum after the harvesting of fodder crops such as ryegrass or winter cereals (such as barley or wheat) is common. Additionally, herbaceous legumes such as alfalfa and clover were prevalent and were usually mowed and harvested multiple times from May to August.
For our study area, the most common crop rotation (ryegrass–corn rotation) was considered by defining the sowing, irrigation, and harvesting times, as shown in Figure 4.

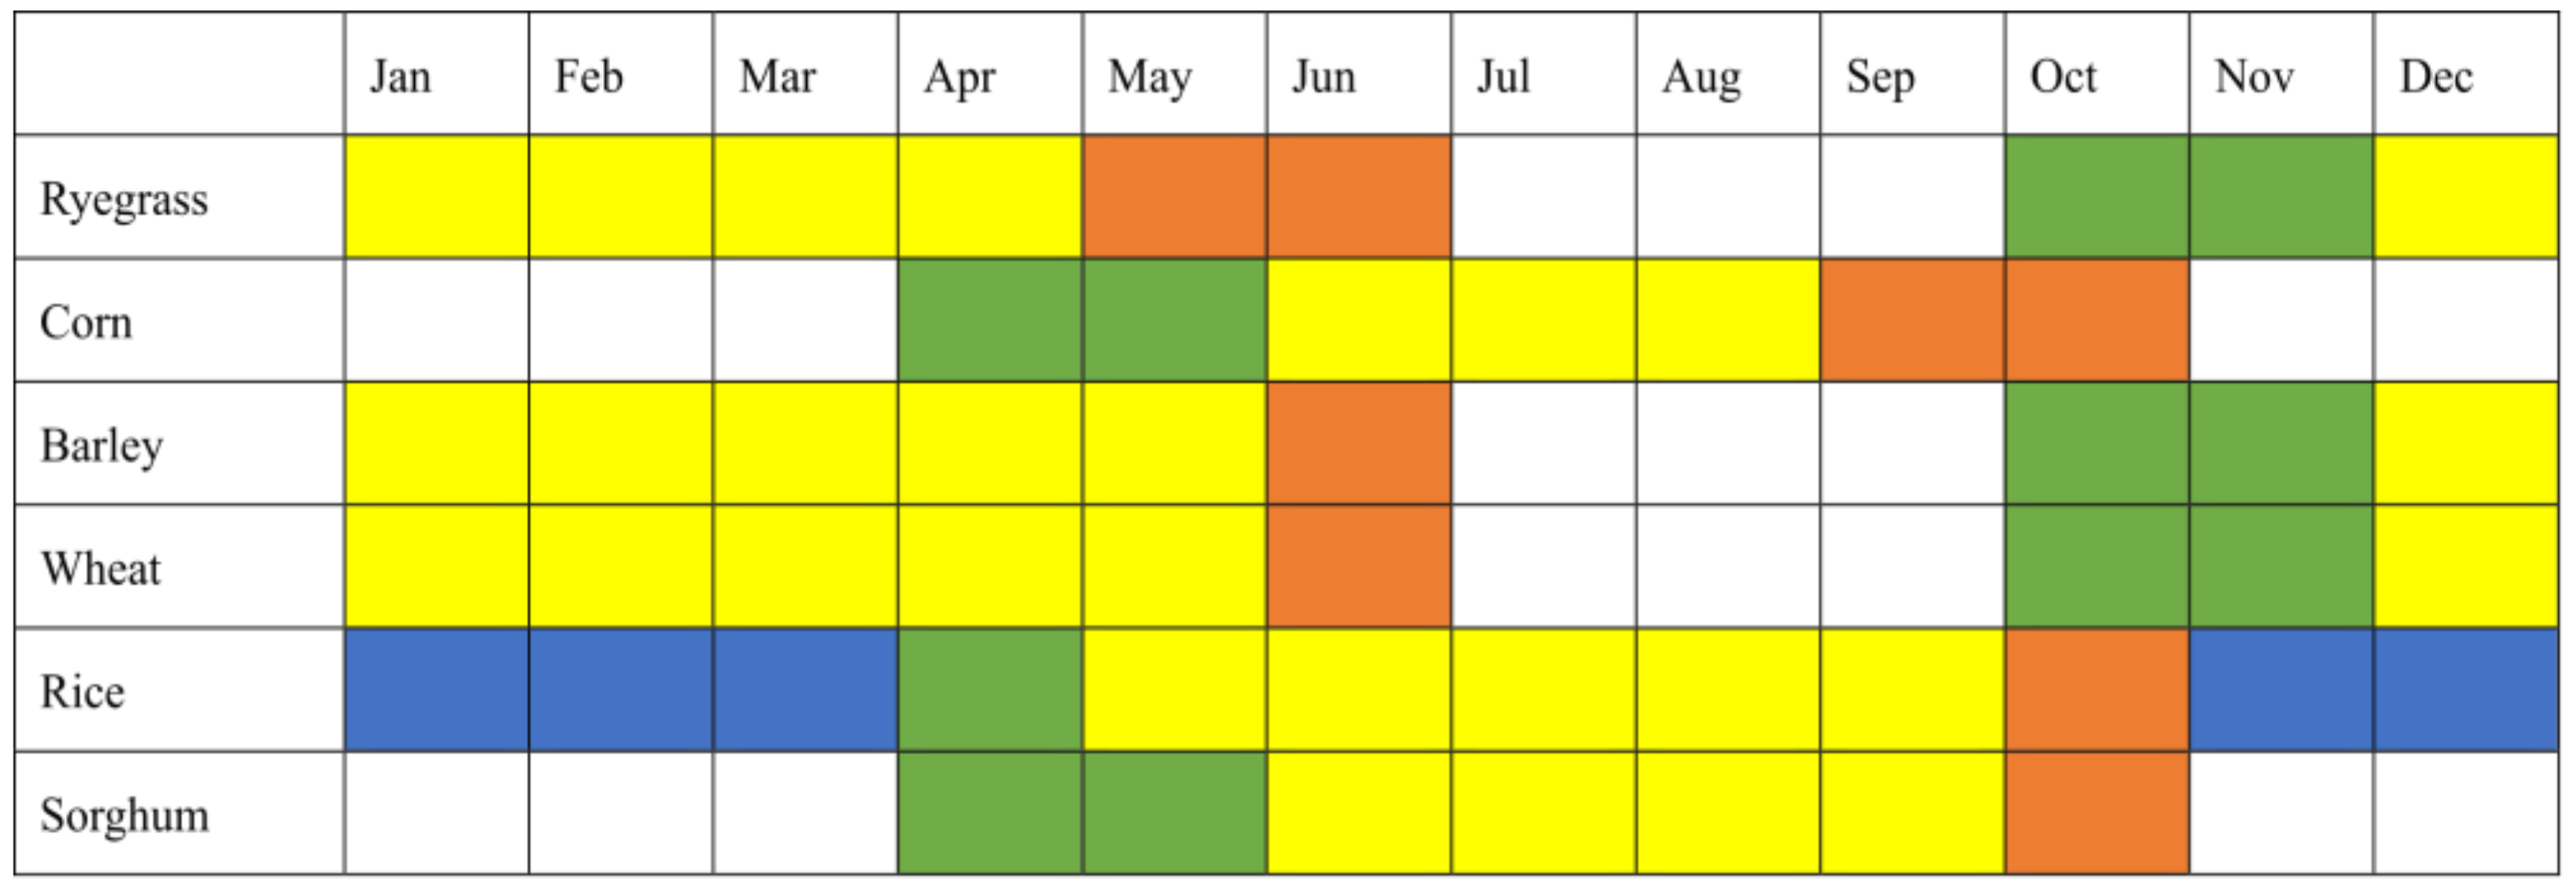
2.2. Application of the SWAT

The approach used to study the hydrological dynamics of the study area over the last decade is depicted in Figure 5.
To assess the effects of droughts on the hydrological dynamics of a Lombardy lowland system, the Soil and Water Assessment Tool (SWAT) model [17] was applied. The SWAT is a physically based model that operates at the basin scale, and it was developed to predict the impacts of climate and land management practices on water, sediment, and chemical yields [16]. It requires specific input data, such as an elevation model, soil and land-use maps, and climate data (precipitation, temperature, solar radiation, relative humidity, and wind speed) [45]. The sources and the temporal and spatial resolutions of the datasets used are documented in Table 1.
The SWAT divides a watershed into sub-basins, which are further split into hydrological response units (HRUs) that represent areas with homogenous topographies, soils, and land uses. The SWAT also considers spatially distributed changes in land use and management (e.g., irrigation schemes) and their effects on individual components of the water balance, such as the actual evapotranspiration (AET) [29], which was used as a variable in the calibration procedure.
In this study, the Penman–Monteith method was applied to calculate the evapotranspiration for the SWAT. Sub-basins were delineated in a GIS environment based on geomorphological units (river terrace levels), since traditional watershed subdivision methods were not feasible in this flat, intensively irrigated area. The 5 sub-basins obtained were further divided into 167 HRUs, with varying surface areas ranging from approximately 100 m2 to 4.7 km2 and an average extension of approximately 0.308 km2. We ran the SWAT model on a monthly basis to match the temporal resolution of the observed AET data. A monthly AET time series was generated for each HRU, and these AET values were used in the calibration phase from 2007 to 2010 and in the validation phase from 2011 to 2013.
Due to a lack of information on irrigation schemes and practices (see above), the SWAT auto-irrigation module was applied. Auto-irrigation can be triggered within HRUs by soil water deficiency or plant water stress [49,50]. If sufficient water is available from the irrigation source, the model adds water to the soil until it reaches field capacity [51].

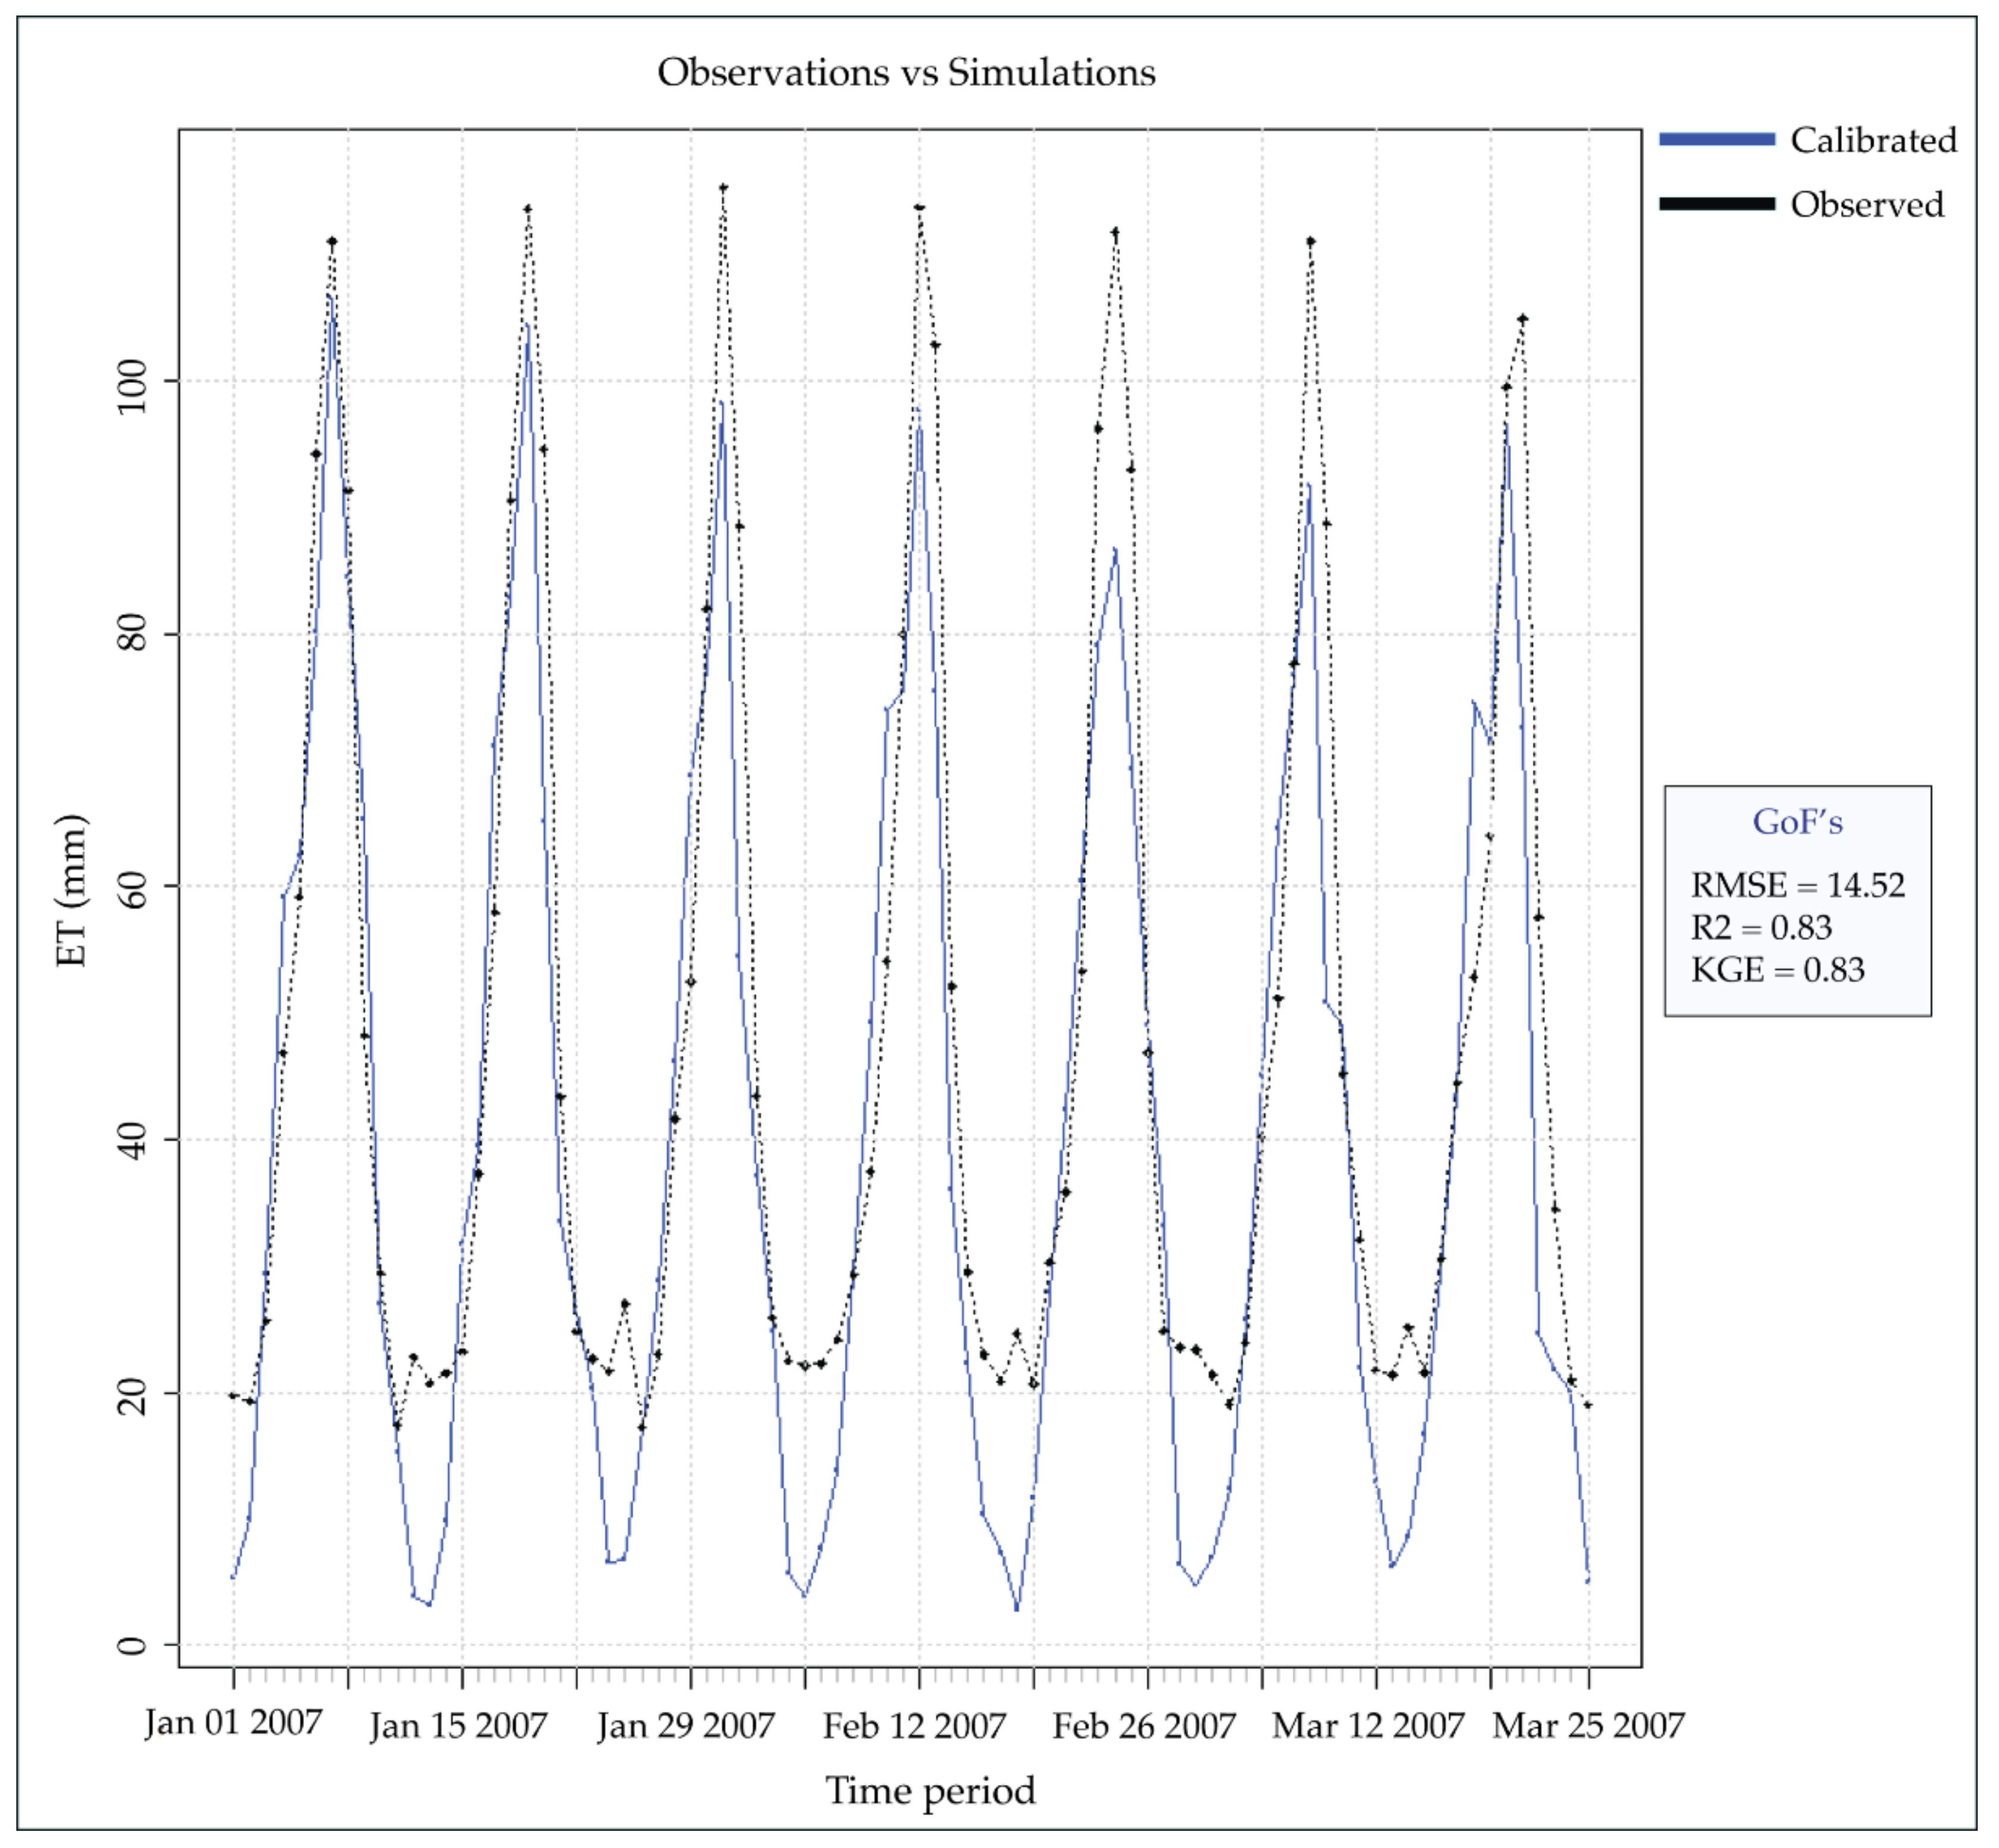
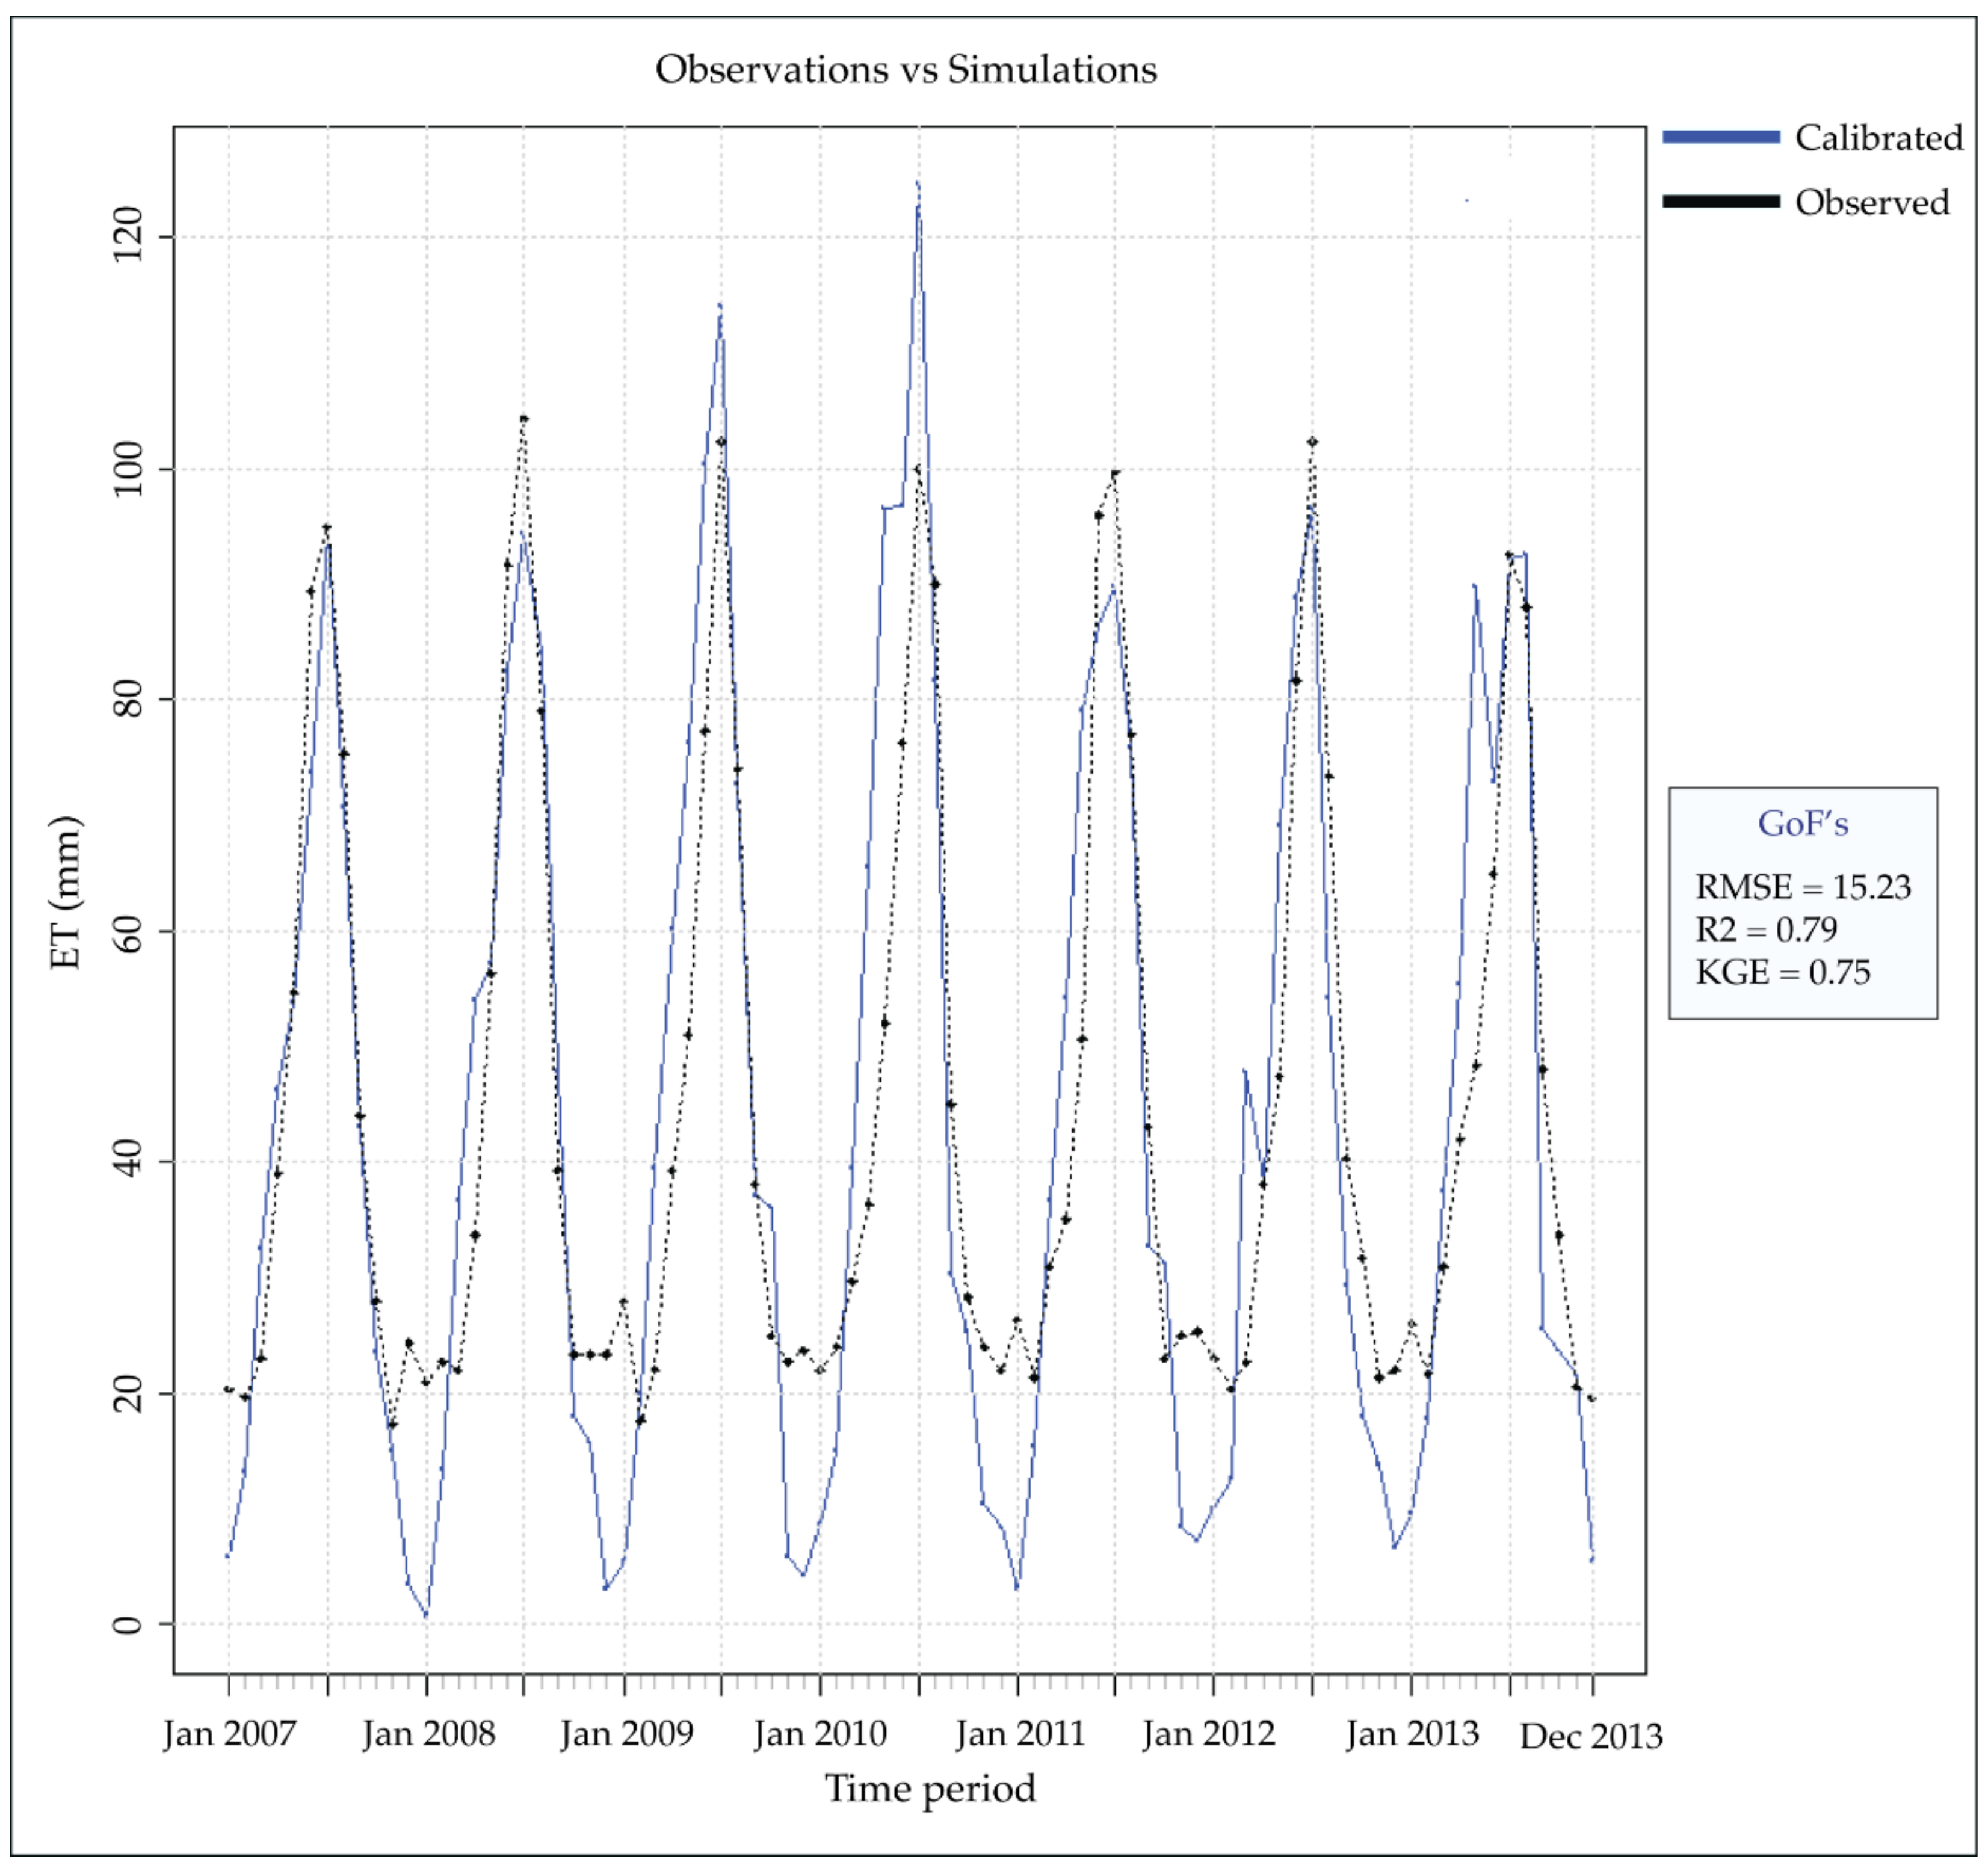
2.3. Calibration and Validation of the Model

The SWAT model was calibrated and validated using the SWAT-CUP software (Calibration and Uncertainty Procedures) version 5.1.6.2. [52,53] and applying the “Sequential Uncertainty Fitting” (SUFI-2) algorithm [54]. This algorithm performs a “stochastic” calibration, considers uncertainties related to parameters, the conceptual model, or input data, and reflects these uncertainties in the model’s output [55]. The Kling–Gupta efficiency (KGE) was used as the objective function [56] to assess the model’s performance. The KGE index ranges from negative infinity to 1, and a value closer to 1 indicates a better match between the model and the observed data.
In this study, monthly evapotranspiration data provided by Moderate-Resolution Imaging Spectroradiometer (MODIS) were used as the observed data for the calibration period from 2007 to 2010 and the validation period from 2011 to 2013. Runoff data were not considered because the study area lacks natural streams. The latter was the main reason for why AET data derived from satellite products were selected. Consequently, MOD16 data with a resolution of 1 km were used for the calibration.
In order to compare the monthly SWAT-AET values of each HRU with the respective MOD16 AET pixel, the mean monthly evapotranspiration of each HRU was extracted. The model was calibrated for 149 HRUs out of a total of 167—excluding urbanized areas—from 2007 to 2010.
A set of 20 calibration parameters (Table 2) were selected based on previous SWAT calibration studies [27,29,52], and the parameters’ sensitivity to changes in AET was determined. These parameters were adjusted to optimize the KGE criteria between the SWAT and MODI16 AET values.

2.4. Trend Analysis

In our study, we also conducted a trend analysis using the Mann–Kendall test [57,58] to discern patterns and directional trends in the climate and hydrological data. The Mann–Kendall test is a non-parametric statistical method that is commonly used in environmental studies to detect monotonic trends in time-series data [59,60,61]. Specifically, the test assesses the presence of an increasing or decreasing trend over time by evaluating the rank correlation of data points. In this study, climate data graphs, including those of temperature and rainless days, were subjected to the Mann–Kendall test. For each dataset, the Kendall coefficient (tau) was calculated to quantify the strength and direction of the observed trend. Simultaneously, p-values were determined to ascertain the statistical significance of the identified trends. A p-value below a predetermined significance level (e.g., 0.05) indicated a statistically significant trend. The test was performed using the “MannKendall” function in the “Kendall” package [61] in R [62].

2.5. Soil Moisture Sensors

In 2022, three TEROS 12 soil moisture sensors were installed at various depths, facilitating a preliminary correlation between the soil moisture and precipitation patterns allowing the identification of irrigation activities. The sensors were deployed in three distinct areas characterized by different land uses as follows: (i) simple arable land with a rotation of ryegrass and corn—sensors were installed at depths of 10 cm and 35 cm; (ii) rice cultivation, with sensor depths of 10 cm and 30 cm; (iii) a forested area in which sensors were placed at depths of 10 cm, 30 cm, and 65 cm. This configuration enabled a comparative analysis of the soil moisture across the three distinct land uses.

3. Results

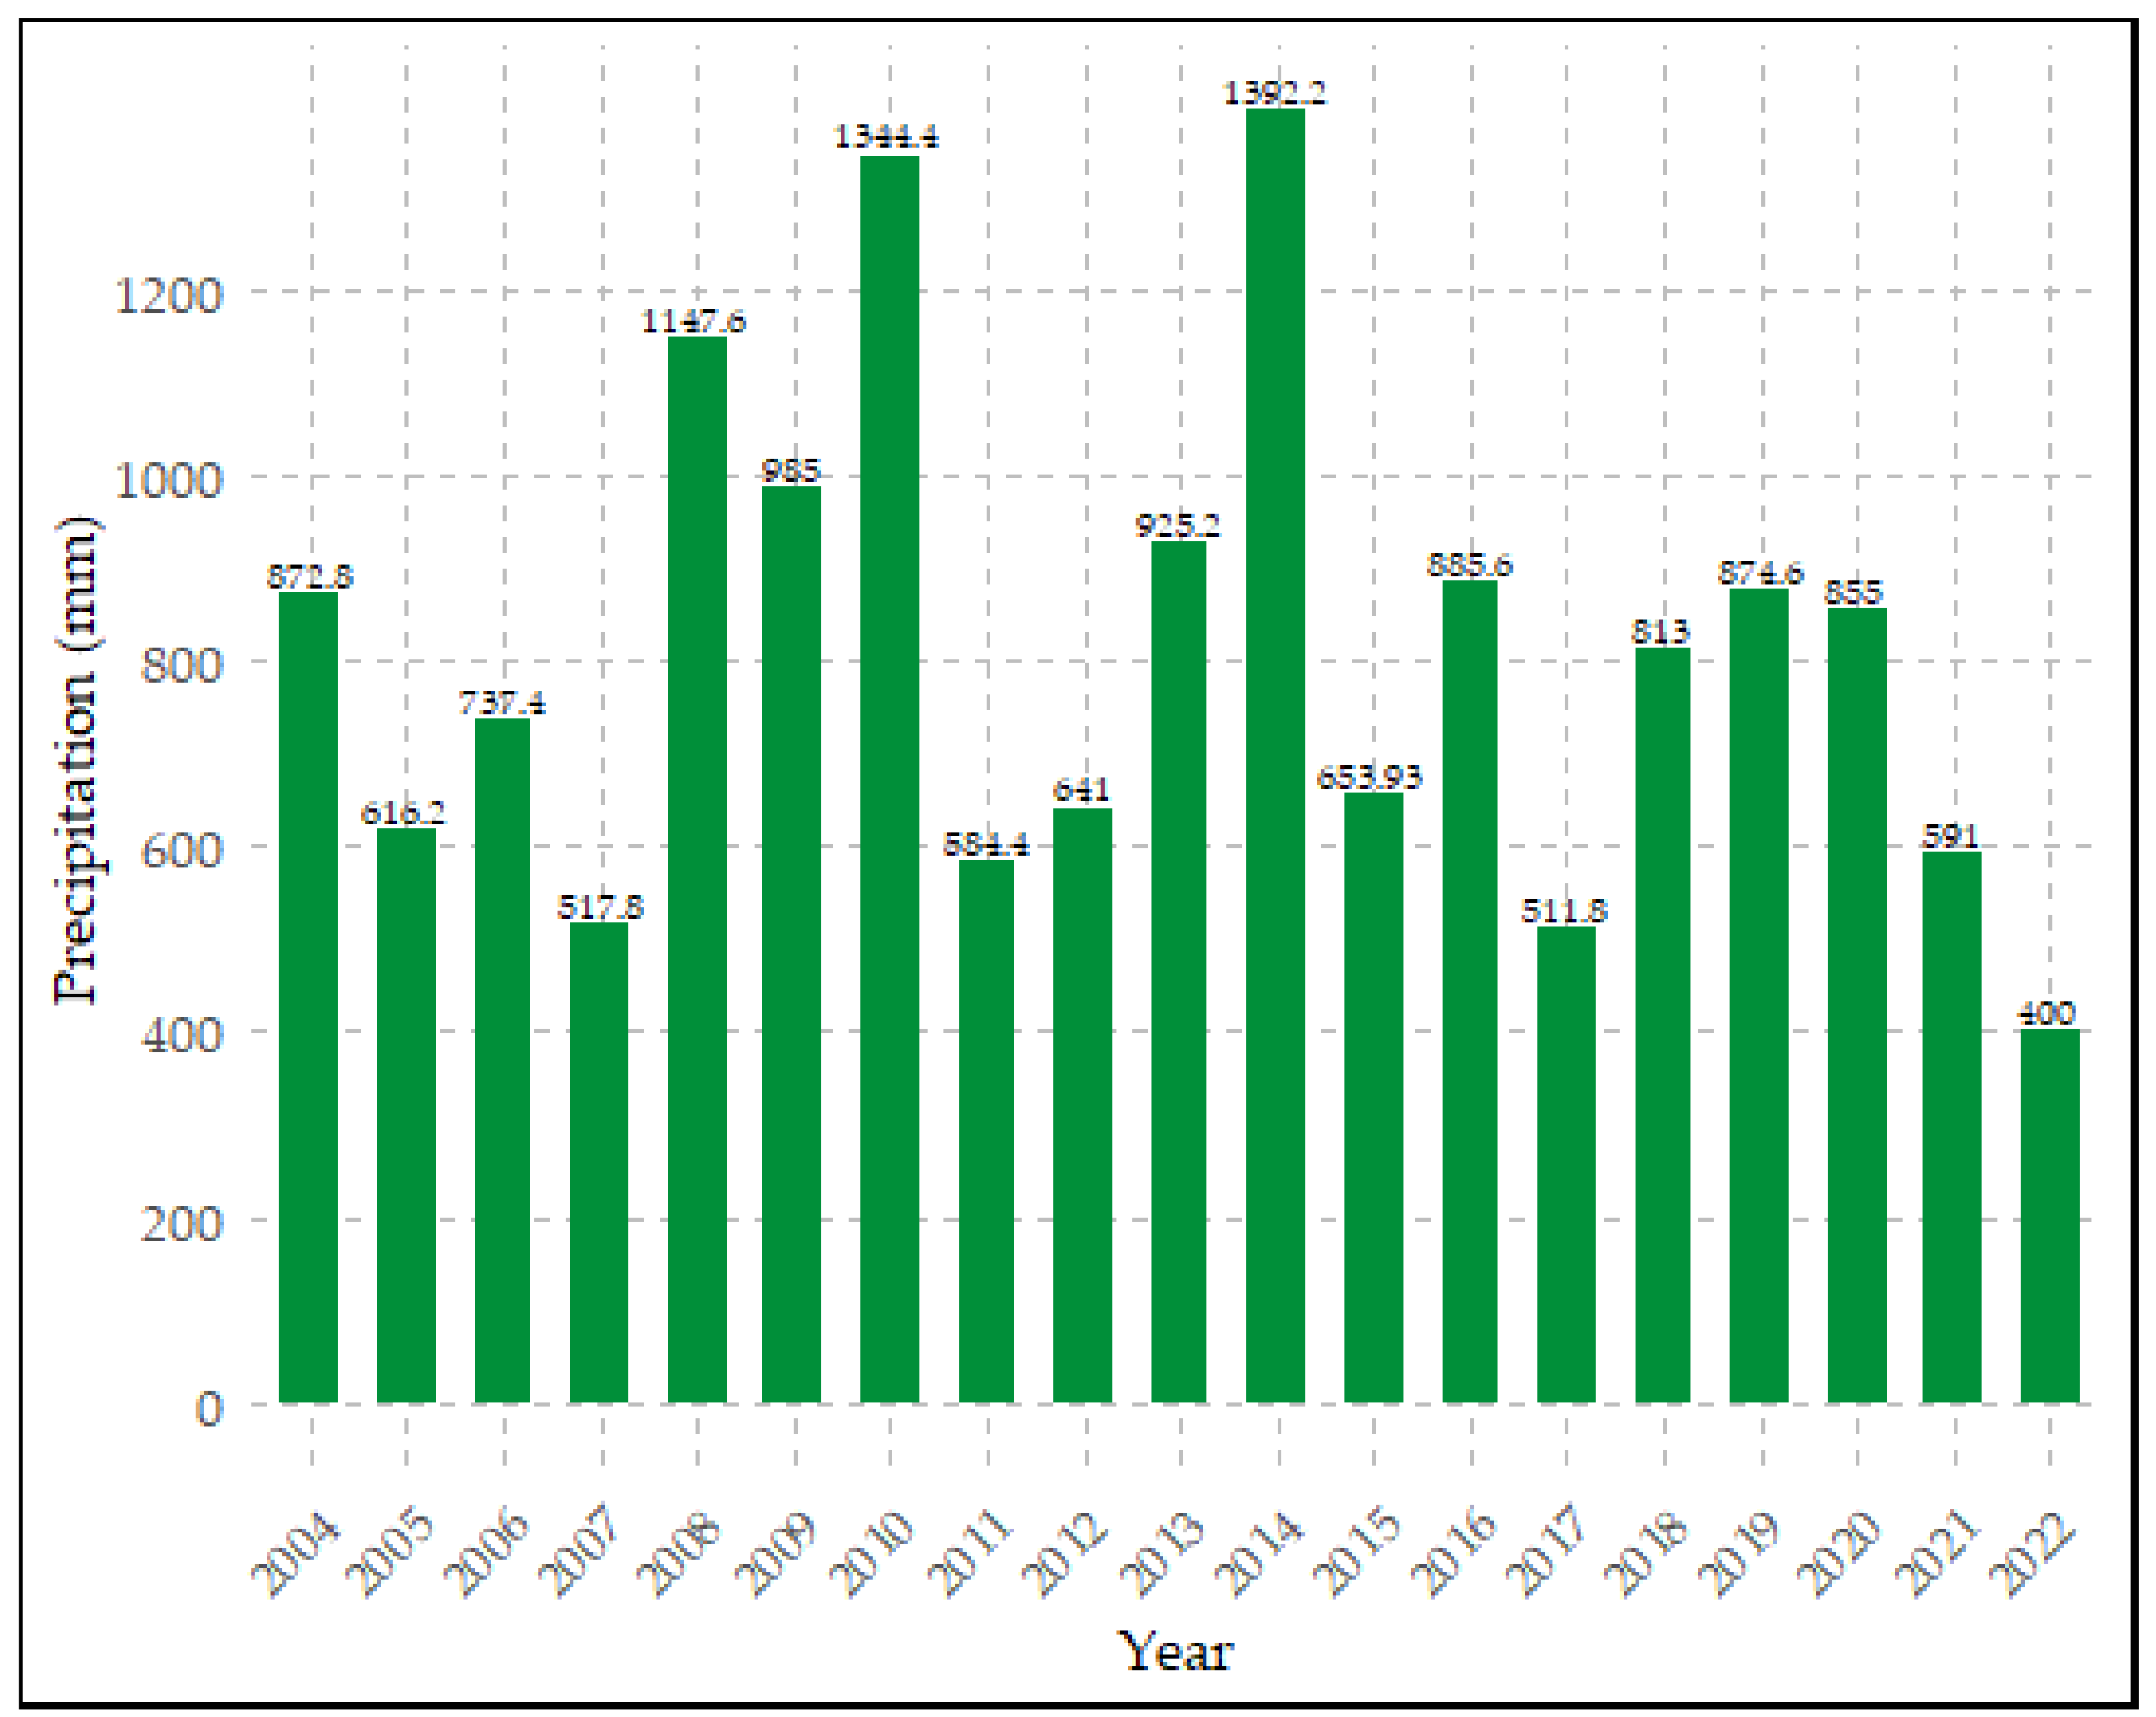
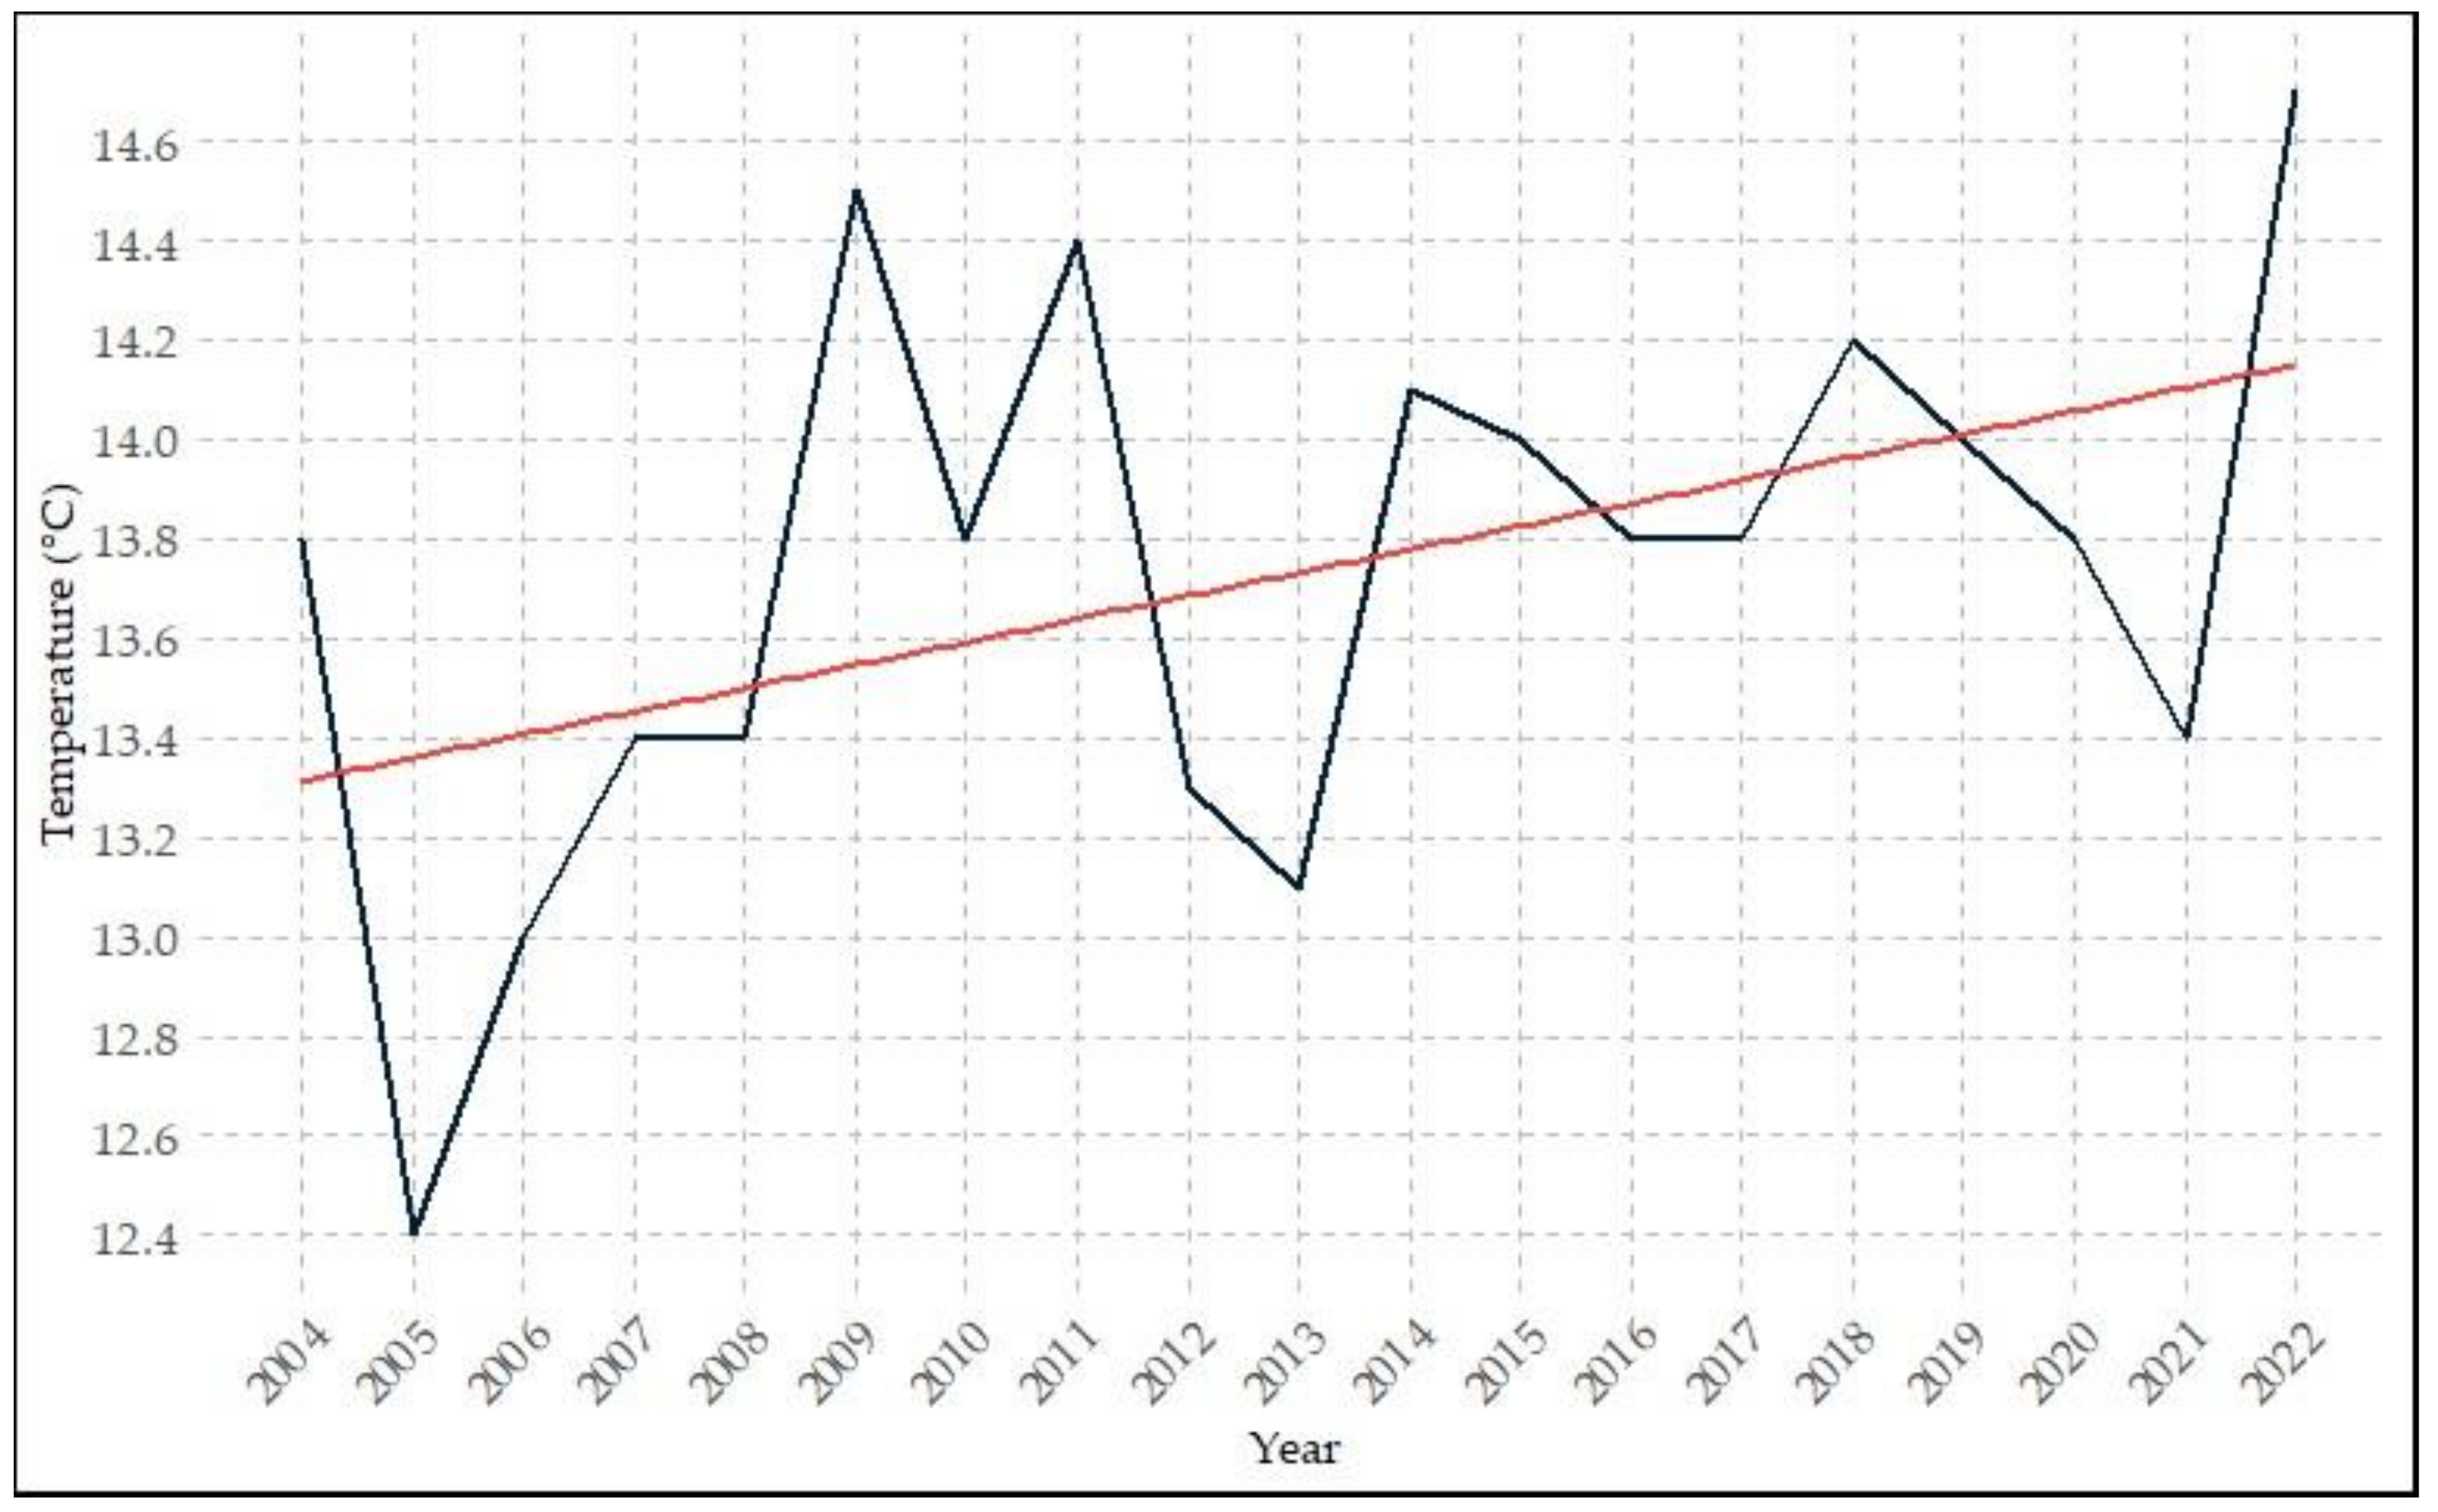
3.1. Input Data Analysis

Figure 6 presents the trend of temperature in the study area from 2004 to 2022 according to measurements at the Vigevano SS494 station. There was a noticeable increase in the mean temperature over the 19-year period. Starting at around 13.8 °C in 2004, the temperature peaked at 14.7 °C in 2022. The coldest year was registered in 2005, while 2022 was the hottest. Though there were notable fluctuations, the overall trend showed an increase in temperature.
Figure 7 illustrates the amount of precipitation over the same 19-year period. There was an overall decrease of 0.86%. The rainiest year was observed in 2014, while the driest year was 2022. Moreover, a notable increase in rain-free days was observed (Figure 8). The two years with the most precipitation-free days were 2017 and 2022. Generally, precipitation only marginally decreased over the last 19 years, but the number of rain-free days increased. This suggested that, on average, single precipitation events were more intensive, and the number of extreme precipitation events increased [63]. Examining the data from the Vigevano station revealed that in 2022, the year with the least rainfall and the fewest rainless days, 11 extreme weather events occurred. While this aligned with the mean for the other years, the prolonged drought periods have significant consequences.
The Mann–Kendall test [57,58] was conducted to analyze the climate data trends, with a focus on temperature (Figure 6) and rainless days (Figure 8). For temperature, a positive Kendall coefficient (tau) of 0.287 implied that there was an increasing trend, but the non-statistically significant p-value of 0.10294 at the 5% confidence level suggested caution in interpreting this trend. The proximity of the p-value to 5% signaled the potential for further investigation or analysis. On the other hand, the rainless days exhibit a more pronounced trend, with a tau value of 0.567 and a significantly low p-value of 0.00078332 (<0.05). This indicated a noteworthy and statistically significant increase in rain-free days. The results highlight the complexity of the climate dynamics, urging a nuanced interpretation that considers statistical significance and the need for additional scrutiny, especially in the context of potential impacts on the local environment and water resources.

3.2. Calibration and Validation of the Model
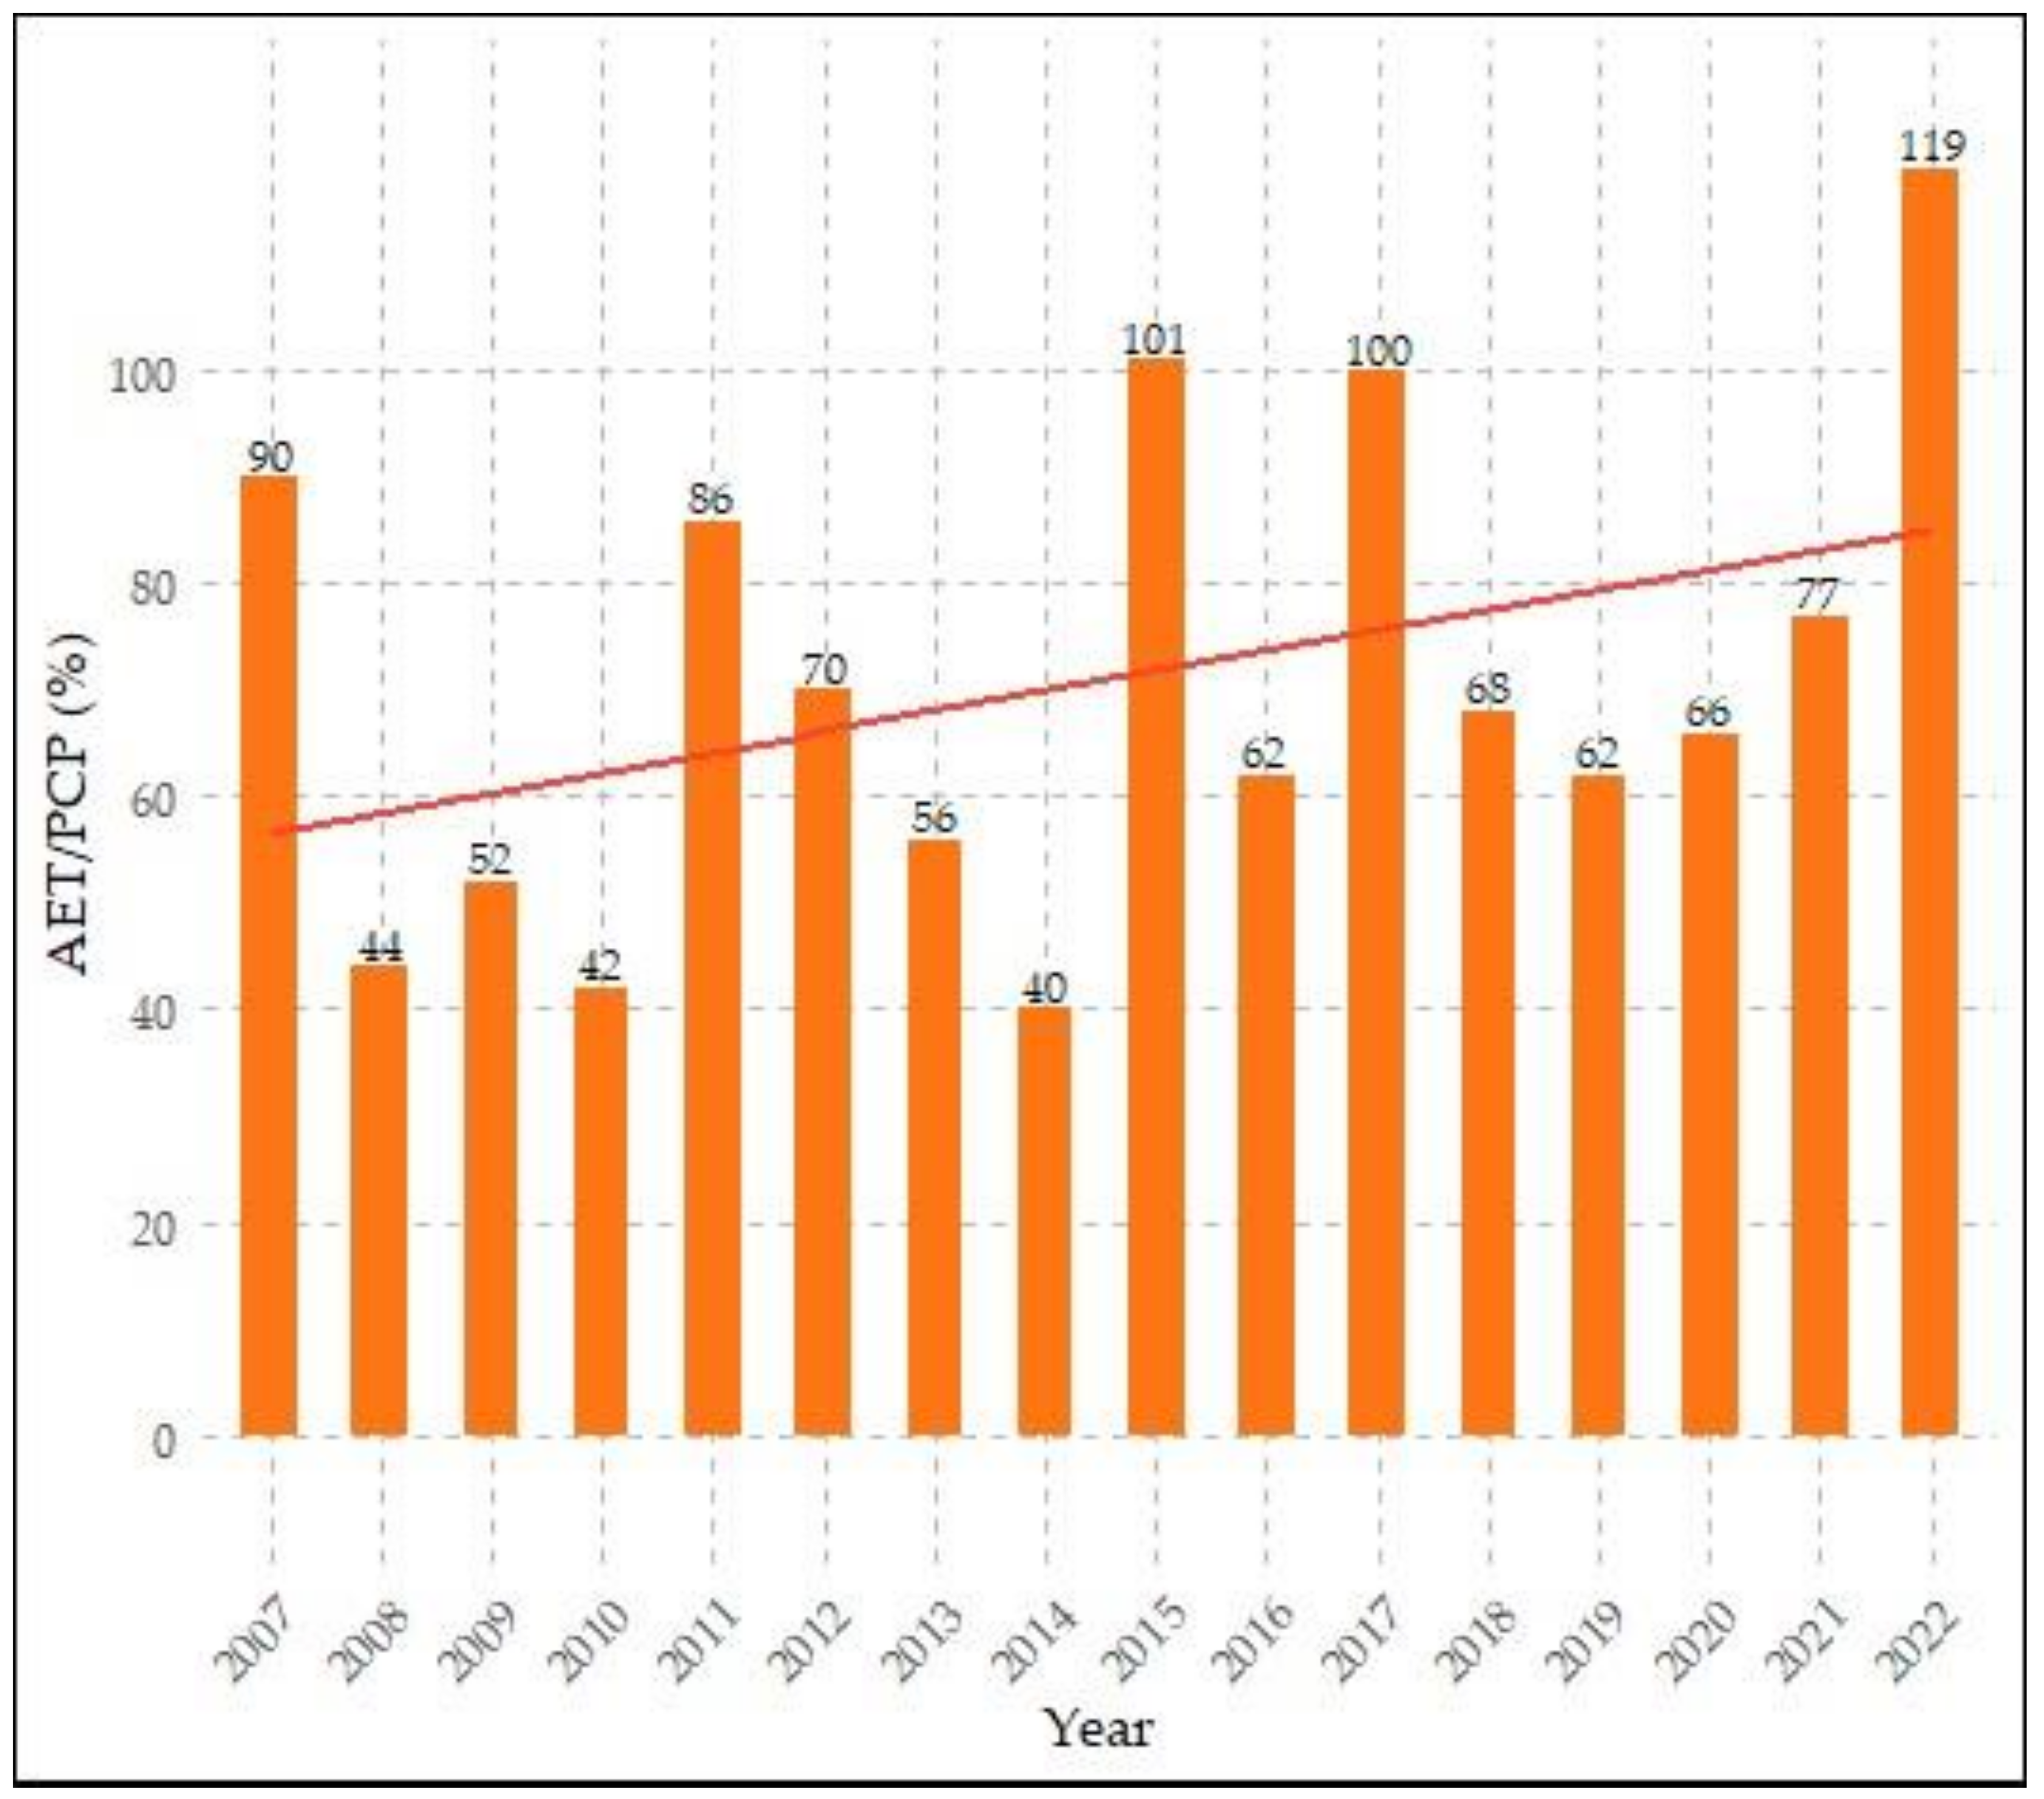
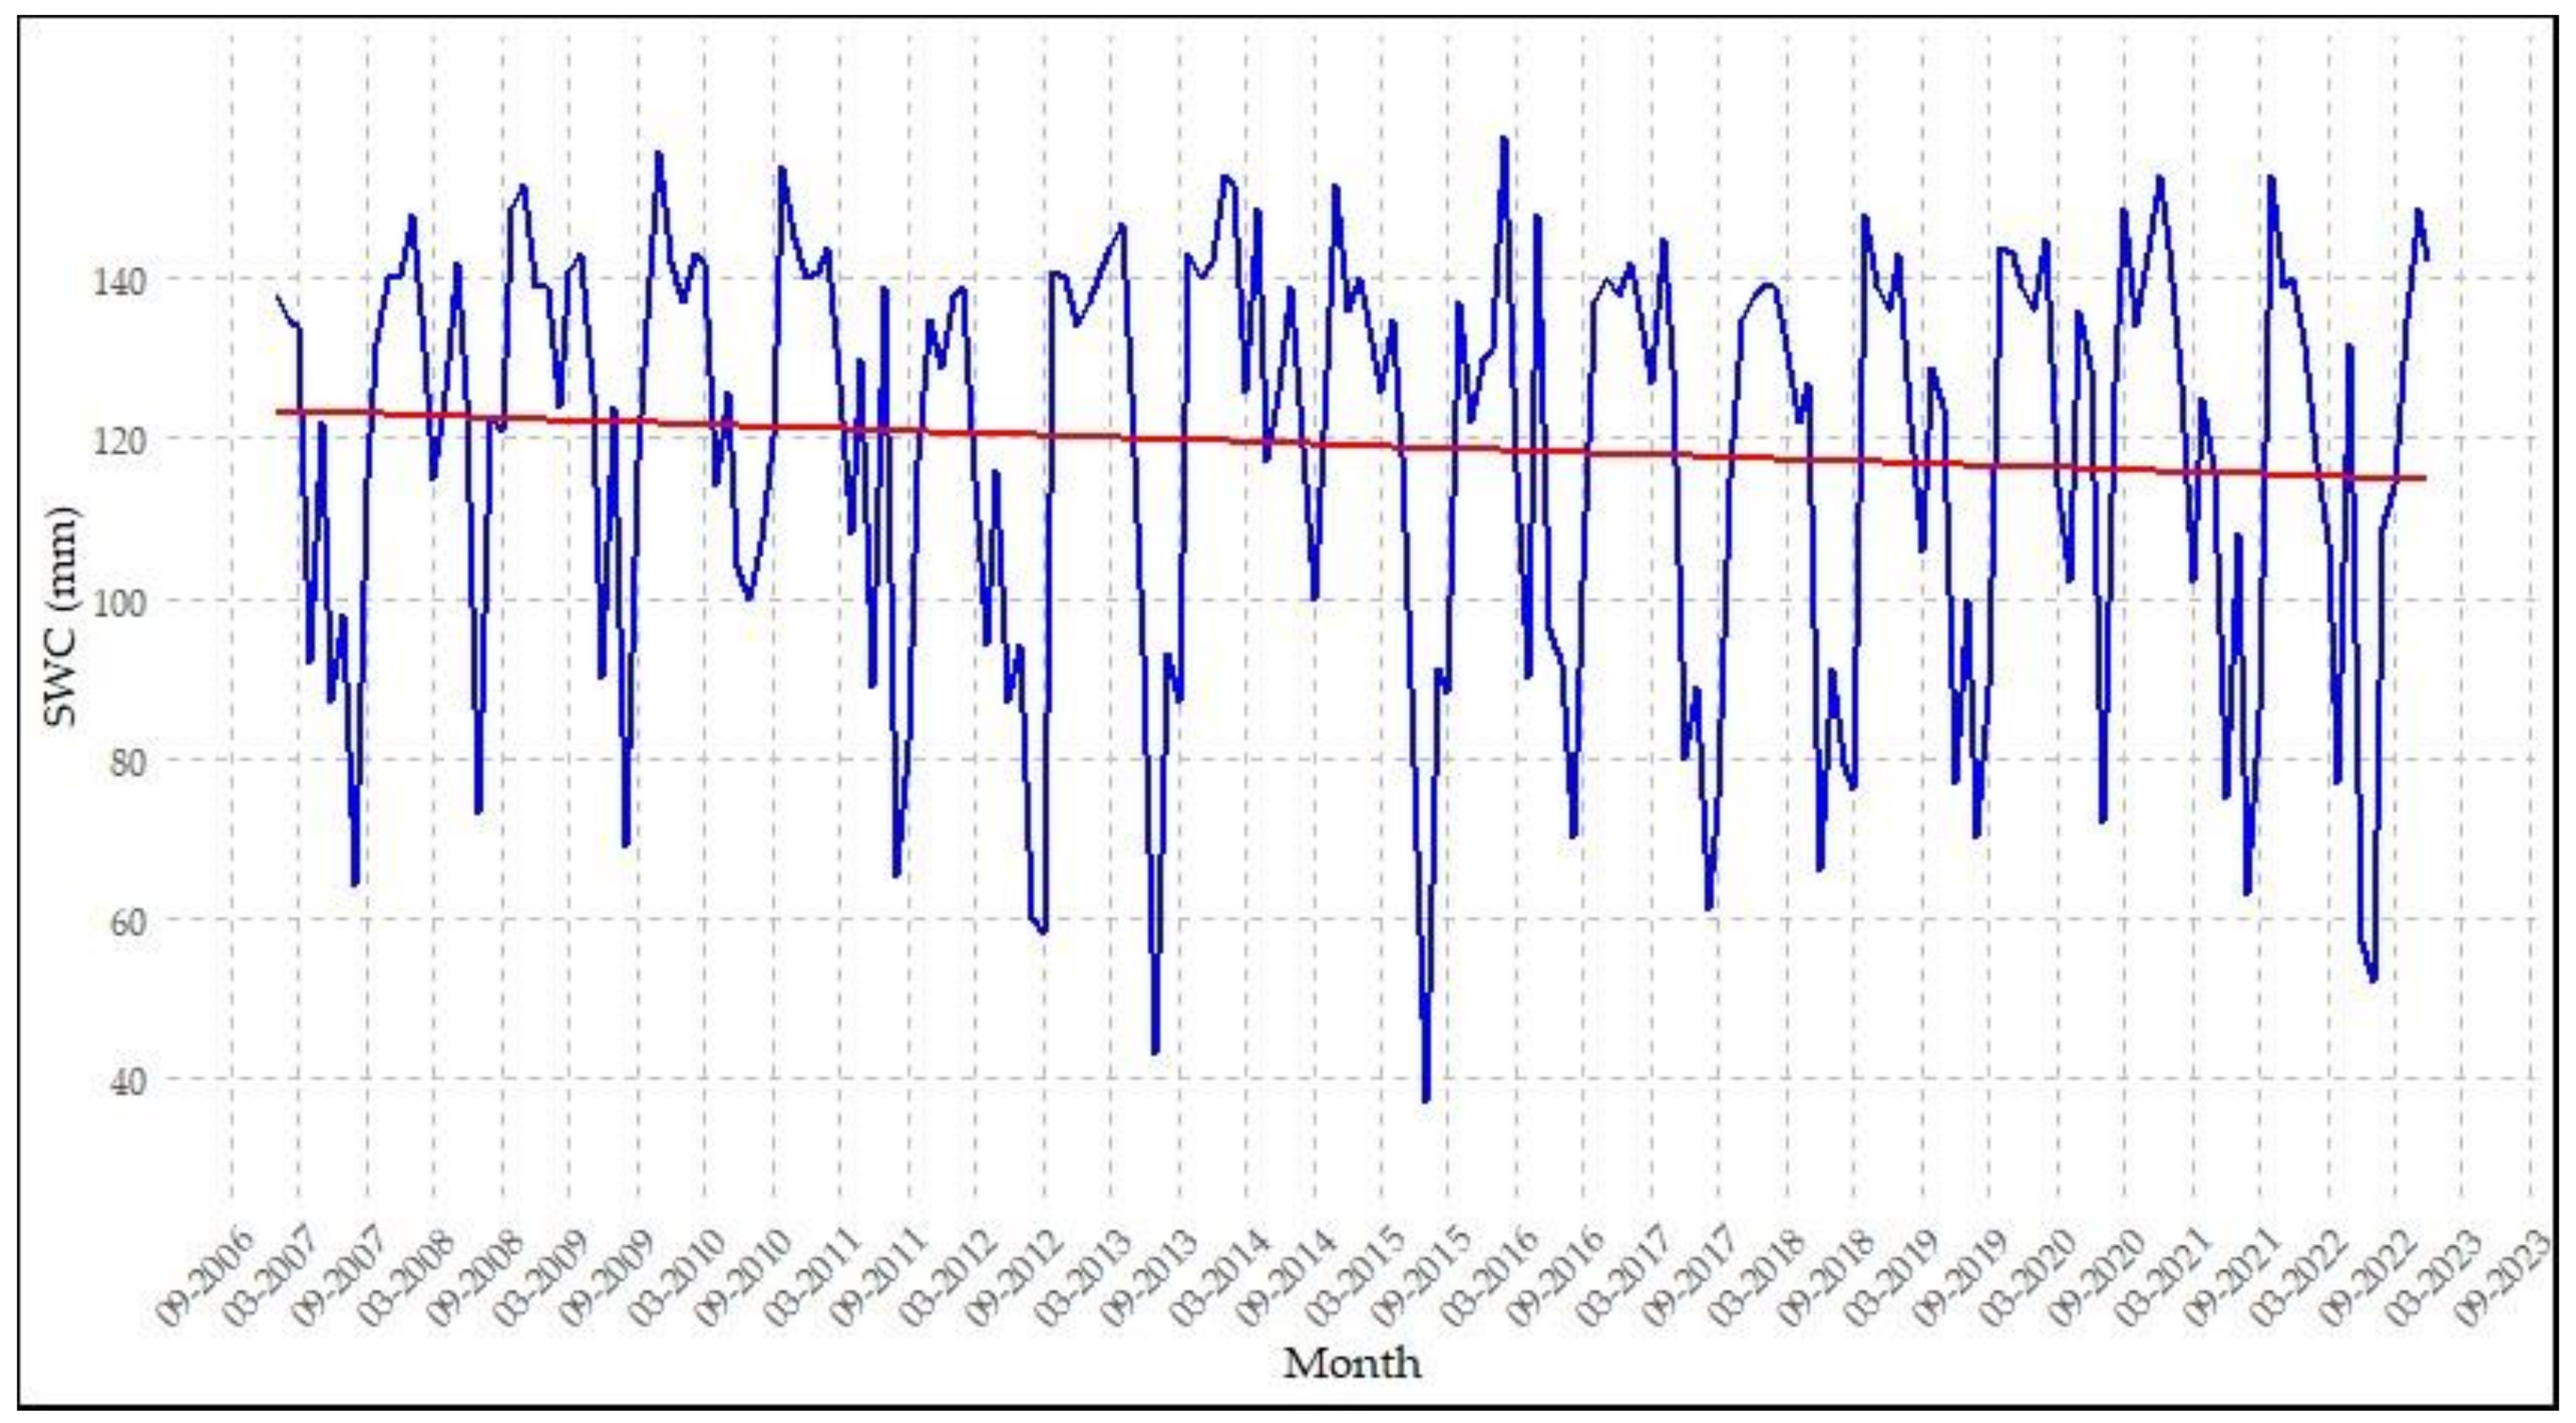
The uncalibrated SWAT model’s output demonstrated a tendency to underestimate the AET when compared to the AET data derived from the MOD16 satellite observations. This underestimation was particularly pronounced during the winter months. However, from the uncalibrated model to the calibrated model, there was a remarkable improvement in the Kling–Gupta efficiency values, which were calculated by averaging the individual KGEs of all 149 HRUs in the SWAT-CUP. Initially, the uncalibrated SWAT model exhibited a KGE value of 0.4. Through the calibration of the SWAT model using the SUFI-2 algorithm, an increase in the KGE from 0.4 to 0.59 was achieved. The KGE of 0.59 was derived from the mean of the individual HRUs. Notably, a KGE value that changed from 0.41 to 0.83 for the entire basin (Figure 9) was observed. Furthermore, a more in-depth analysis of the results of this calibration process revealed that the calibration results clearly differed between the individual HRUs. The best HRU reached KGE values of up to 0.8 after the calibration, while some areas showed values lower than –1, indicating a poor fit between the observed and simulated data. These HRUs with low values had very limited areal dimensions (less than 0.7 km2) (Table 3).
Figure 10 and Figure 11 present the calibrated SWAT model in a field with a rotation of corn- ryegrass and rice paddies. Here, a clear improvement in the model’s performance was observed during the calibration process.
Calibration increased the AET found with the SWAT model, particularly during the summer months. While during most of the year, there was a good match between the values from the SWAT and MOD16, during the winter months, the SWAT values (both calibrated and uncalibrated) were much lower than those of MOD16.
The validation results showed a mean KGE of 0.48, with the highest KGE values reaching up to 0.85 for some HRUs (Table 3). Even in this case, the HRUs in extremely limited areas had low KGE values, while areas of our interest with larger surface areas and agricultural land use had satisfactory KGE values.

3.3. Model Results

The SWAT output results showed that there was no significant increase in evapotranspiration over the last 15 years (+4%) in the study area (Figure 12). However, it turned out that the ratio of evapotranspiration and precipitation varied (Figure 13). The graphical representation of the evapotranspiration-to-precipitation ratio provides valuable insights into the water balance dynamics in the study area. Peaks in the ratio, such as in 2015, 2017, and 2022, where the precipitation was less than the actual evapotranspiration, are indicative of periods with increased water demand by plants due to drought conditions.
Additionally, we analyzed the soil water content (SWC), which showed a declining trend for HRUs with agricultural land use. The graph in Figure 14 illustrates that there was a significant decrease (−7%) in soil water content over the last 15 years.
The Mann–Kendall test was also applied to assess trends in the AET (Figure 12), AET/PCP ratio (Figure 13), and SWC (Figure 14). For the AET, a tau value of 0.142 indicated an increasing trend, but the non-significant p-value of 0.47085 warrants caution in interpreting the trend’s statistical significance. The AET/PCP ratio demonstrated a positive correlation with a tau value of 0.259, suggesting a tendency to increase evapotranspiration relative to precipitation over time. Despite the p-value of 0.1763 being higher than the significance level, this underscores the need for careful consideration. Regarding the SWC, the tau value of −0.0522 implied a weak negative correlation, indicating a slight tendency toward a decrease in soil water content over time. However, the p-value of 0.2867 is not statistically significant, emphasizing the absence of evidence for a significant decreasing trend for the SWC.

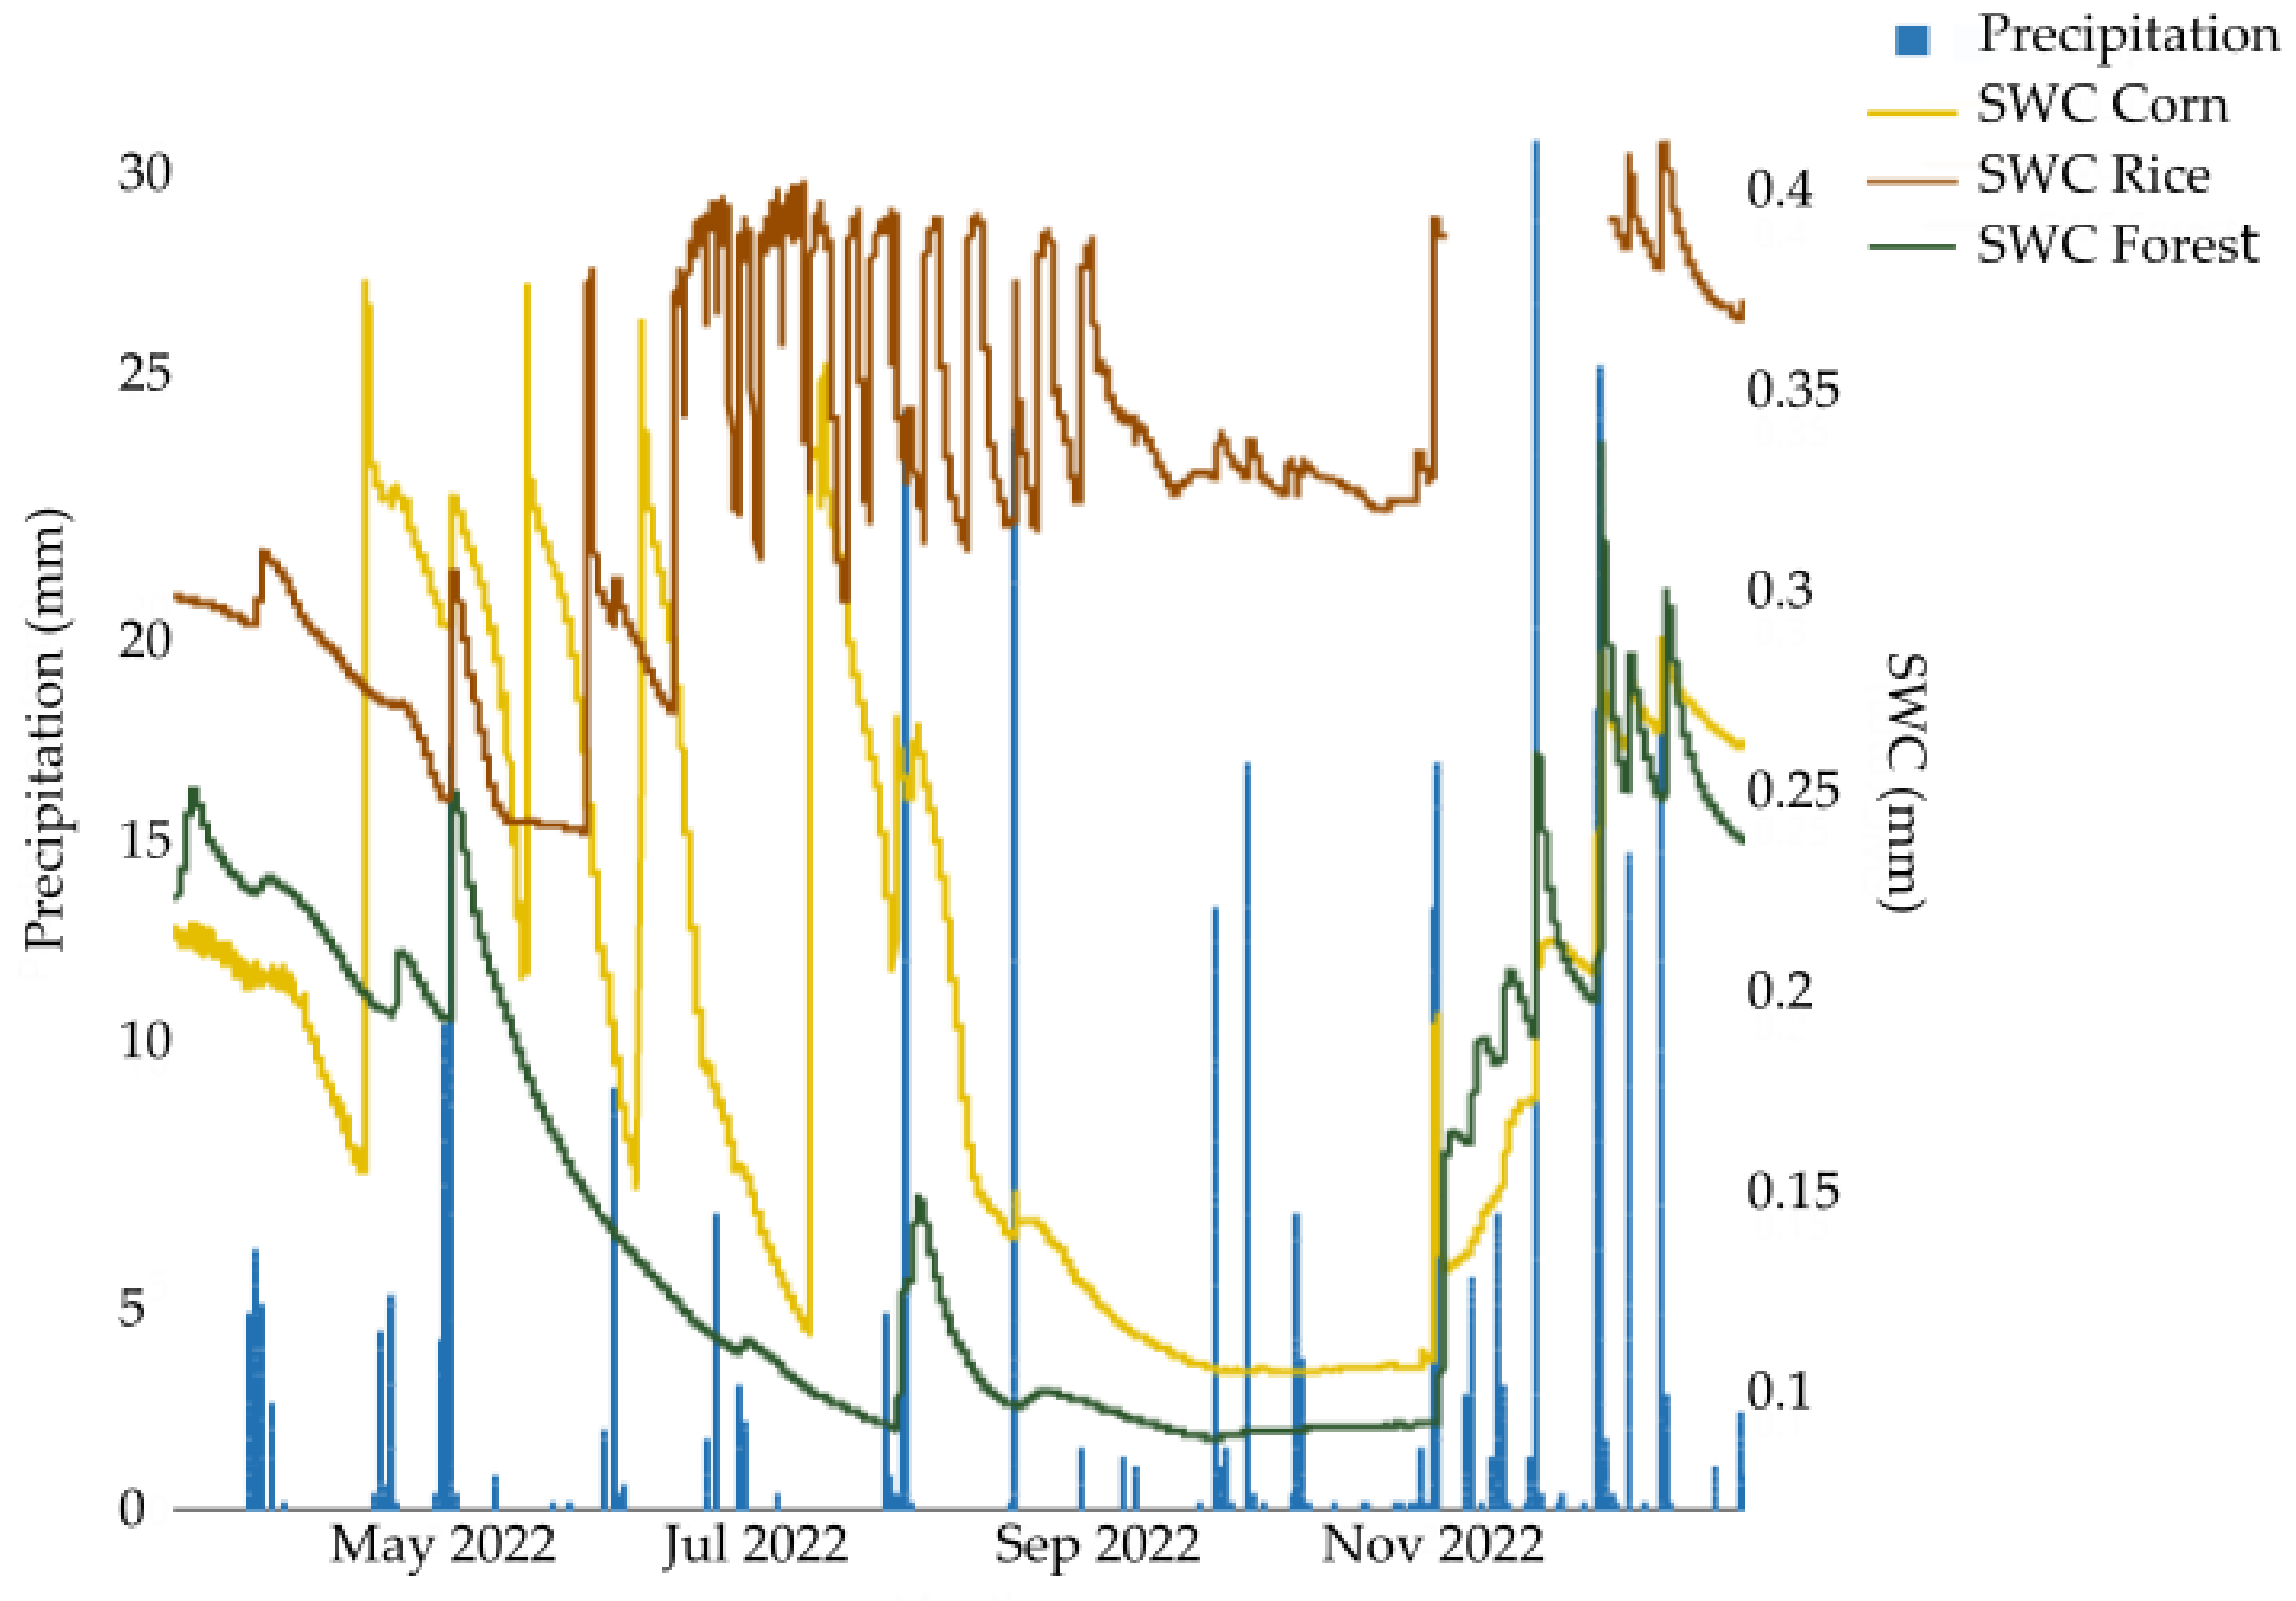
3.4. Soil Moisture Sensor Results

Comparing the soil moisture content modeled with the SWAT with field measurements taken with soil moisture sensors (TEROS 12), we observed a consistent underestimation in the model. This discrepancy can be attributed to the differences in measurement scales, as the sensors measured the water content locally [64], while the SWAT simulated it at the HRU scale. Furthermore, the inclusion of auto-irrigation in the SWAT added a certain degree of complexity to the soil moisture dynamics. It was assumed that actual irrigation events may have impacted the soil moisture levels differently from the model’s HRUs due to their representative scale. These findings highlight the importance of considering both the spatial scale and local practices in understanding and interpreting soil moisture dynamics within the model system.
As shown in Figure 15, the soil moisture sensors in different land-use conditions helped to identify irrigation patterns. The sensors in the forest area reflected natural conditions in which the soil water content depended solely on precipitation. In contrast, the sensors in the corn and rice fields indicated irrigation. Notably, the peaks in the soil water content in the forest area were related to rainfall, and this trend was also observed in rice and corn. In the case of corn, additional peaks occurred during irrigation periods, while for rice, the timing of the first irrigation flood was clearly visible.

4. Discussion

The process-based modeling of hydrological dynamics is a valuable tool for gaining insights into the general water cycle and for assessing future conditions through scenario analysis. However, it has been noted by various authors that applying physically based hydrological models such as the SWAT in lowland areas presents unique challenges. In general, hydrological models are calibrated and validated with discharge data, but in lowland areas, obtaining discharge data can be difficult. Additionally, the flat topography of lowlands promotes vertical water dynamics; thus, the surface runoff is often negligible [11,15]. Furthermore, flat topographies and fertile soils favor intensive agriculture, particularly in areas such as the Ticino and Po Plains in northern Italy. This type of agriculture often involves irrigation, but in many cases, information about irrigation schemes and water supplies is lacking [65]. Irrigation can also lead to significant alterations in drainage patterns due to the construction of irrigation and drainage channels, as seen in the ancient Ticino irrigation cascade system dating back to the 11th century.
To assess the hydrological dynamics of the Ticino Plain between Abbiategrasso and Pavia, the SWAT was applied for the period of 2004–2022. Since there were no reliable discharge data available and there were no clear drainage patterns, the SWAT model was calibrated using AET observations derived from MOD16 data. Generally, the calibration and validation of the model yielded satisfactory KGE values of 0.59 HRUs; these were derived from the mean of the individual HRUs. This result served as a valuable indicator of the model’s ability to capture and simulate the hydrological processes within HRUs, but there was a substantial improvement in the model’s performance when considering the basin as a whole (0.83). This result is particularly encouraging due to the accuracy in representing the hydrological dynamics of the entire study area. However, notably lower KGE values were found in HRUs classified as having a “WATER” land use. These areas primarily consisted of irrigation channels and small artificial lakes, and their representation within the HRU framework was problematic. Excluding these “WATER” areas led to an increase in the overall average KGE value to 0.64 (not considering WATER HRUs), as seen in Table 3. Referring individual HRUs, instead, as seen in Figure 10 and Figure 11, the model was able to simulate the AET in an area with different crops and land-use practices, highlighting the success of the calibration process. However, differences between the model’s output and the observed data were noted. These differences could be attributed to the fact that the MOD16 data relied on remote satellite measurements with a 1 km resolution, which covered areas with heterogeneous land uses. MOD16 also used parameters such as Earth’s surface temperature, the NDVI, and other indicators to calculate evapotranspiration. In contrast, the SWAT is a physical hydrological model that simulates the water cycle in a specific area with a higher spatial resolution, necessitating detailed data on soil and land uses that are unique for each HRU (e.g., [66,67]). Consequently, examining the differences between the SWAT and MOD16, we noticed that HRUs with a low KGE were characterized by a smaller area than the resolution provided by MOD16. This meant that the MOD16 data always yielded a mean of the land use in the 1 km pixel covering the area, whereas the HRUs were specifically related to a single land use and, thus, represented the hydrological processes within the HRUs in a much more detailed way. The differences between the SWAT and MOD16 were mainly observed during winter months. As mentioned by Abiodun et al. [66], one potential reason could be the variance in land cover. Winter months are typically characterized by vegetation entering a dormant phase or losing foliage. If the land cover information used in the SWAT differs significantly from that in MOD16, this could result in discrepancies in the respective simulations of evapotranspiration. In our study, the land cover differences between the SWAT and MOD16 were compounded by their data coming from different years. Additionally, as noted in [68], the simulated evapotranspiration from the SWAT tends to be higher during the crop growth season and lower during the inactive season, while the MOD16-derived AET remains relatively constant. Consequently, the differences in the simulated AET between the SWAT and MOD16 were more significant during the less active winter months due to the SWAT’s consideration of climatic conditions, land uses, and soil characteristics.
Analysis of meteorological input data revealed significant climate changes over recent decades. Notably, there has been an alarming upward trend in the mean temperature with a pronounced increase in the number of rain-free days, despite the modest 0.86% decrease in overall precipitation. The results of the Mann–Kendall test confirmed that the temperature showed an increasing trend, but this trend was not statistically significant. However, the number of days without rain significantly increased, and these trends could have important implications for agriculture, water supply, and other climate-related aspects, and further research may be needed to better understand these trends and their potential consequences. These findings align with global concerns about climate change [69] and highlight the need for further investigations of the underlying factors. The impacts of changes in temperature and precipitation patterns on water availability, especially in intensely cultivated environments, are of major concern. The data indicate a trajectory toward increasing temperatures and related drought conditions, consistently with global and national patterns. As delineated in the Annual Global Climate Report issued by the National Centre for Environmental Information [70], the ten warmest years within the past 143 years occurred after 2010. Notably, Italy faced challenges due to elevated temperatures and droughts in recent years, particularly in 2017 and 2022, causing significant issues in water management [71,72]. The report from the SNPA emphasized that 2022 was Italy’s warmest and driest year on record, leading to multifaceted consequences, especially in the agricultural sector, where drought-induced damages and reduced crop yields, particularly in corn cultivation, were reported [73]. These repercussions have had strong implications for the national economy. The growing complexity and unpredictability of climate change and its repercussions underscore the need to understand its impacts on various components of the hydrological cycle.
Analysis of the calibrated model’s output data confirmed these general changes. The actual evapotranspiration, under the influence of various climatic factors, such as temperature, wind, relative humidity, and irrigation practices, increased. The relationship between the SWAT’s calculated actual evapotranspiration and precipitation is a key indicator of water deficits in an area, leading to drought conditions and affecting water availability for plants and other purposes [74,75]. The persistent lack of precipitation over time and the rising temperatures led to increased evaporation of water from soils and plants [76], resulting in a decrease in the available water resources.
These changes were also reflected in the dynamics of the soil water content. The reduction in soil water content (Figure 14) could be attributed to changes in precipitation patterns, rising temperatures, and modifications in land management practices [77,78,79]. Notably, we observed a 7% decrease in soil water content over a 15-year period, which is a notable finding due to the potential impact of soil water content on crop productivity and yield [80].
The results of the Mann–Kendall test suggested that there were trends in the data too, such as an increase in the AET and a decrease in SWC, but none of these trends were statistically significant at the 0.05 level. This means that while there were trends in the data, we cannot conclusively say that these were not due to random variations. However, given the limited number of years, these trends can be considered significant in this context. In future research, it will be necessary to extend the analyzed data.
Understanding this long-term trend may have significant implications for water resource management and environmental sustainability in the study area. In this context, considering the differences between the SWAT and soil moisture sensors, the measured and modeled quantities of irrigation water and the timing of irrigation differed significantly, in line with other studies (e.g., [81]). Given the model’s accurate calibration and the reliability of the simulated results, it can be assumed that farmers may be applying more irrigation water than predicted by the SWAT’s auto-irrigation, opening avenues for optimizing irrigation practices and contributing to sustainable water resource management.
Land-use changes—especially variations in rice cultivation—significantly impact water use and the hydrological balance. While the SWAT model used a static land use, it is important to note that land use changes over time. For example, from 2007 to 2018, the land area used for rice cultivation significantly increased (41%), but from 2015 to 2018, it decreased (−11%). This fluctuation was influenced by choices made by producers, often in response to drought conditions [82]. This fluctuation in rice cultivation has substantial consequences both hydrologically and socioeconomically. A reduction in rice cultivation can modify water-use patterns, as traditional paddy rice fields significantly influence water flow and retention, particularly in the study area. Rice fields often serve as a natural reservoir that aids in flood control and groundwater recharge. A decline in rice cultivation can disrupt this balance [15,42,83]. Conversely, an increase in rice cultivation could intensify water demand, leading to higher irrigation requirements [84,85]. This can strain local water resources. Therefore, maintaining a sustainable equilibrium in rice cultivation practices is, thus, crucial for maintaining the hydrological balance in the study area. Moreover, land-use changes can significantly impact evapotranspiration [38], affecting the water cycle and balances. An analysis of the land-use history shows an expansion of the agricultural areas and a decrease in woodlands, thus influencing the amount of water absorbed and released through plant transpiration.

5. Conclusions

This study provides a comprehensive overview of the hydrological dynamics within the Ticino irrigation cascade in northern Lombardy over the last 15 years. The integration of the SWAT calibrated with MOD16 data is a crucial step in accurately interpreting the effects of climate change, especially in areas characterized by crops such as rice and corn, which require a large quantity of irrigation water, particularly during periods of drought. However, it is important to note that the study area represents a lowland area with complex hydrology and a lack of natural water courses. These features led to limitations in terms of the traditional application of the SWAT using discharge for the calibration and validation of the model. In particular, the lack of irrigation data and the use of the auto-irrigation function in the SWAT may affect the results obtained. On the one hand, the model yields optimal irrigation patterns that might help farmers optimize their own irrigation schemes. However, real irrigation data might further improve the work in terms of the actual water consumption in irrigation, groundwater recharge, and soil water dynamics. Nevertheless, the calibration and validation results were satisfactory, and the study revealed a significant increase in temperatures in recent years, even though the decrease in rainfall was relatively small. However, there was a substantial increase in the number of rain-free days. These factors collectively led to reduced water availability. The increased actual evapotranspiration and the decreased soil water content are indicative of the growing water stress for crops and the surrounding ecosystem. These findings highlight the need for resilient and sustainable water management strategies that consider the increasing frequency of climate challenges.
Our research explored the peculiarities of a unique area, shedding light on its morphological and hydrological characteristics that, up till now, have been little studied. This region, although complex, poses a challenge because of the limited data available, particularly for hydrological modeling. Therefore, we applied a hydrological model that was adapted to the complex study area and was calibrated and validated with MOD16 evapotranspiration data, and this yielded valuable insights into the impacts of climate change on the water resources of the unique landscape setting of the Ticino irrigation cascade. Emphasizing the importance of adapting water management strategies and suggesting possible future developments will help refine further research, such as through a better understanding of the hydrological dynamics in the study area and the development of innovative solutions for mitigating the impacts of droughts. In particular, the application of advanced water management technologies and the development of more climate-resilient agricultural strategies should be tackled. Furthermore, given the increasing frequency of climate challenges, integrated approaches involving both hydrological management and agricultural practices should be further explored.

Author Contributions

Conceptualization, A.B., M.M. and R.B.; methodology, A.B. and R.B.; software, A.B.; validation, R.B., M.M. and A.B.; formal analysis, A.B.; investigation, A.B. and M.M.; resources, A.B.; data curation, A.B. and R.B.; writing—original draft preparation, A.B. and M.M.; writing—review and editing, R.B., O.D.A., S.H.S. and G.P.; visualization, A.B. and O.D.A.; supervision, M.M. and R.B.; project administration, M.M.; funding acquisition, M.M. All authors have read and agreed to the published version of the manuscript.

Funding

This research was supported by Regione Lombardia, POR FESR 2014–2020—Call HUB Ricerca e Innovazione, Project 1139857 CE4WE: Approvvigionamento energetico e gestione della risorsa idrica nell’ottica dell’Economia Circolare (Circular Economy for Water and Energy).

Institutional Review Board Statement

Not applicable.

Informed Consent Statement

Not applicable.

Data Availability Statement

Data is available on request.

Acknowledgments

We acknowledge the DLR and the TDX Science Team for providing the Tandem-X dataset of the study area.

Conflicts of Interest

The authors declare no conflict of interest.

References

  1. Giorgi, F.; Im, E.S.; Coppola, E.; Diffenbaugh, N.S.; Gao, X.J.; Mariotti, L.; Shi, Y. Higher hydroclimatic intensity with global warming. J. Clim. 2011, 24, 5309–5324. [Google Scholar] [CrossRef]
  2. Egidio, E.; Mancini, S.; De Luca, D.A.; Lasagna, M. The Impact of Climate Change on Groundwater Temperature of the Piedmont Po Plain (NW Italy). Water 2022, 14, 2797. [Google Scholar] [CrossRef]
  3. Forootan, E.; Sadeghi, S.H.R. Relative importance of climatic and anthropogenic factors on runoff change at watershed scale. Int. J. Environ. Sci. Technol. 2023, 20, 3059–3070. [Google Scholar] [CrossRef]
  4. Kuwayama, Y.; Thompson, A.; Bernknopf, R.; Zaitchik, B.; Vail, P. Estimating the impact of drought on agriculture using the U.S. Drought Monitor. Am. J. Agric. Econ. 2019, 101, 193–210. [Google Scholar] [CrossRef]
  5. Wilhite, D.A.; Svoboda, M.D.; Hayes, M.J. Understanding the complex impacts of drought: A key to enhancing drought mitigation and preparedness. Water Resour. Manag. 2007, 21, 763–774. [Google Scholar] [CrossRef]
  6. Ding, Y.; Hayes, M.J.; Widhalm, M. Measuring economic impacts of drought: A review and discussion. Disaster Prev. Manag. 2011, 20, 434–446. [Google Scholar] [CrossRef]
  7. ISAC. CNR MEAN TEMPERATURE—Latest Month Analysis. Available online: https://www.isac.cnr.it/climstor/climate/latest_month_TMM.html (accessed on 10 July 2023).
  8. Straffelini, E.; Tarolli, P. Climate change-induced aridity is affecting agriculture in Northeast Italy. Agric. Syst. 2023, 208, 103647. [Google Scholar] [CrossRef]
  9. Freire-González, J.; Decker, C.; Hall, J.W. The Economic Impacts of Droughts: A Framework for Analysis. Ecol. Econ. 2017, 132, 196–204. [Google Scholar] [CrossRef]
  10. Walker, W.R. Guidelines for Designing and Evaluating Surface Irrigation Systems; FAO, Ed.; FAO: Rome, Italy, 1989; ISBN 92-5-102879-6. [Google Scholar]
  11. Balestrini, R.; Delconte, C.A.; Sacchi, E.; Buffagni, A. Groundwater-dependent ecosystems as transfer vectors of nitrogen from the aquifer to surface waters in agricultural basins: The fontanili of the Po Plain (Italy). Sci. Total Environ. 2021, 753, 141995. [Google Scholar] [CrossRef]
  12. De Caro, M.; Perico, R.; Crosta, G.B.; Frattini, P.; Volpi, G. A regional-scale conceptual and numerical groundwater flow model in fluvio-glacial sediments for the Milan Metropolitan area (Northern Italy). J. Hydrol. Reg. Stud. 2020, 29, 100683. [Google Scholar] [CrossRef]
  13. Fumagalli, N.; Senes, G.; Ferrario, P.S.; Toccolini, A. A minimum indicator set for assessing fontanili (lowland springs) of the Lombardy Region in Italy. Eur. Countrys. 2017, 9, 1–16. [Google Scholar] [CrossRef]
  14. Lasagna, M.; Mancini, S.; De Luca, D.A. Groundwater hydrodynamic behaviours based on water table levels to identify natural and anthropic controlling factors in the Piedmont Plain (Italy). Sci. Total Environ. 2020, 716, 137051. [Google Scholar] [CrossRef]
  15. Baker, E.A.; Cappato, A.; Todeschini, S.; Tamellini, L.; Sangalli, G.; Reali, A.; Manenti, S. Combining the Morris method and multiple error metrics to assess aquifer characteristics and recharge in the lower Ticino Basin, in Italy. J. Hydrol. 2022, 614, 128536. [Google Scholar] [CrossRef]
  16. Neitsch, S.; Arnold, J.; Kiniry, J.; Williams, J. Soil and Water Assessment Tool Theoretical Documentation Version 2009; Report No. 406; Texas A&M Univerity System: College Station, TX, USA, 2011. [Google Scholar]
  17. Arnold, J.G.; Srinivasan, R.; Muttiah, R.S.; Williams, J. Large area hydrologic modeling and assessment part I: Model development. J. Am. Water Resour. Assoc. 1998, 34, 73–89. [Google Scholar] [CrossRef]
  18. Janjić, J.; Tadić, L. Fields of Application of SWAT Hydrological Model—A Review. Earth 2023, 4, 331–344. [Google Scholar] [CrossRef]
  19. Norouzi Nazar, M.; Asgari, E.; Baaghideh, M.; Lotfi, S. Quantifying the long-term flood regulation ecosystem service under climate change using SWAT Model. Ecopersia 2020, 8, 169–180. [Google Scholar]
  20. Mahzari, S.; Kiani, F.; Azimi, M.; Khormali, F. Using SWAT Model to Determine Runoff, Sediment Yield and Nitrate Loss in Gorganrood Watershed, Iran. Ecopersia 2016, 4, 1359–1377. [Google Scholar] [CrossRef]
  21. Sareshtehdari, A.; Ghafouri, M.; Ardakani, A.J.; Bayat, R. Reliability of Land Capability Map in Watershed Hydrological Simulation using SWAT Model. Ecopersia 2015, 2, 715–725. [Google Scholar]
  22. Arnold, J.C.; Moriasi, D.N.; Gassman, P.W.; Abbaspour, K.C.; White, M.J.; Srinivasan, R.; Santhi, C.; Harmel, R.D.; Van Griensven, A.; Van Liew, M.W.; et al. SWAT: Model use, calibration, and validation. Trans. ASABE 2012, 55, 1491–1508. [Google Scholar] [CrossRef]
  23. Francesconi, W.; Srinivasan, R.; Pérez-Miñana, E.; Willcock, S.P.; Quintero, M. Using the Soil and Water Assessment Tool (SWAT) to model ecosystem services: A systematic review. J. Hydrol. 2016, 535, 625–636. [Google Scholar] [CrossRef]
  24. Baker, T.J.; Miller, S.N. Using the Soil and Water Assessment Tool (SWAT) to assess land use impact on water resources in an East African watershed. J. Hydrol. 2013, 486, 100–111. [Google Scholar] [CrossRef]
  25. Xing, Z.; Ma, M.; Su, Z.; Lv, J.; Yi, P.; Song, W. A review of the adaptability of hydrological models for drought forecasting. Proc. Int. Assoc. Hydrol. Sci. 2020, 383, 261–266. [Google Scholar] [CrossRef]
  26. Sun, Y.; Bao, W.; Valk, K.; Brauer, C.C.; Sumihar, J.; Weerts, A.H. Improving Forecast Skill of Lowland Hydrological Models Using Ensemble Kalman Filter and Unscented Kalman Filter. Water Resour. Res. 2020, 56, e2020WR027468. [Google Scholar] [CrossRef]
  27. Lam, Q.D.; Schmalz, B.; Fohrer, N. Modelling point and diffuse source pollution of nitrate in a rural lowland catchment using the SWAT model. Agric. Water Manag. 2010, 97, 317–325. [Google Scholar] [CrossRef]
  28. Donmez, C.; Sari, O.; Berberoglu, S.; Cilek, A.; Satir, O.; Volk, M. Improving the applicability of the swat model to simulate flow and nitrate dynamics in a flat data-scarce agricultural region in the mediterranean. Water 2020, 12, 3479. [Google Scholar] [CrossRef]
  29. Becker, R.; Koppa, A.; Schulz, S.; Usman, M.; aus der Beek, T.; Schüth, C. Spatially distributed model calibration of a highly managed hydrological system using remote sensing-derived ET data. J. Hydrol. 2019, 577, 123944. [Google Scholar] [CrossRef]
  30. Odusanya, A.E.; Mehdi, B.; Schürz, C.; Oke, A.O.; Awokola, O.S.; Awomeso, J.A.; Adejuwon, J.O.; Schulz, K. Multi-site calibration and validation of SWAT with satellite-based evapotranspiration in a data-sparse catchment in southwestern Nigeria. Hydrol. Earth Syst. Sci. 2019, 23, 1113–1144. [Google Scholar] [CrossRef]
  31. Shah, S.; Duan, Z.; Song, X.; Li, R.; Mao, H.; Liu, J.; Ma, T.; Wang, M. Evaluating the added value of multi-variable calibration of SWAT with remotely sensed evapotranspiration data for improving hydrological modeling. J. Hydrol. 2021, 603, 127046. [Google Scholar] [CrossRef]
  32. Parajuli, P.B.; Jayakody, P.; Ouyang, Y. Evaluation of Using Remote Sensing Evapotranspiration Data in SWAT. Water Resour. Manag. 2018, 32, 985–996. [Google Scholar] [CrossRef]
  33. López, P.L.; Sutanudjaja, E.H.; Schellekens, J.; Sterk, G.; Bierkens, M.F.P. Calibration of a large-scale hydrological model using satellite-based soil moisture and evapotranspiration products. Hydrol. Earth Syst. Sci. 2017, 21, 3125–3144. [Google Scholar] [CrossRef]
  34. Immerzeel, W.W.; Droogers, P. Calibration of a distributed hydrological model based on satellite evapotranspiration. J. Hydrol. 2008, 349, 411–424. [Google Scholar] [CrossRef]
  35. ERSAF. Ente Regionale per i Servizi alla Agricoltura e alle Foreste—Regione; Lombardia. Losan Database. Available online: https://losan.ersaflombardia.it/oss/oss_index.html (accessed on 12 February 2022).
  36. Kottek, M.; Grieser, J.; Beck, C.; Rudolf, B.; Rubel, F. World map of the Köppen-Geiger climate classification updated. Meteorol. Z. 2006, 15, 259–263. [Google Scholar] [CrossRef] [PubMed]
  37. Comune di Abbiategrasso Piano di Governo del Territorio 2009, 0–33. Available online: https://www.multiplan.servizirl.it/pgtwebn/#/public/dettaglio-piano/120662/documenti (accessed on 29 May 2023).
  38. IUSS Working Group WRB. World Reference Base for Soil Resources 2014, Update 2015—International Soil Classification System for Naming Soils and Creating Legends for Soil Maps; World Soil Resources Reports No. 106; FAO: Rome, Italy, 2015. [Google Scholar]
  39. De Luca, D.A.; Destefanis, E.; Forno, M.G.; Lasagna, M.; Masciocco, L. The genesis and the hydrogeological features of the Turin Po Plain fontanili, typical lowland springs in Northern Italy. Bull. Eng. Geol. Environ. 2013, 73, 409–427. [Google Scholar] [CrossRef]
  40. ERSAF. Ente Regionale per i Servizi alla Agricoltura e alle Foreste—Regione Lombardia Uso del suolo in Regione Lombardia. Atlante Descrittivo. 2019, p. 51. Available online: https://www.ersaf.lombardia.it/pubblicazioni/uso-del-suolo-in-regione-lombardia-atlante-descrittivo/ (accessed on 29 May 2023).
  41. Perego, A.; Sanna, M.; Giussani, A.; Chiodini, M.E.; Fumagalli, M.; Pilu, S.R.; Bindi, M.; Moriondo, M.; Acutis, M. Designing a high-yielding maize ideotype for a changing climate in Lombardy plain (northern Italy). Sci. Total Environ. 2014, 499, 497–509. [Google Scholar] [CrossRef]
  42. Bove, M. Il Risicoltore; Ente Nazionale Risi: Milan, Italy, 2021; pp. 2–3. [Google Scholar]
  43. Azar, R.; Villa, P.; Stroppiana, D.; Crema, A.; Boschetti, M.; Brivio, P.A. Assessing in-season crop classification performance using satellite data: A test case in Northern Italy. Eur. J. Remote Sens. 2016, 49, 361–380. [Google Scholar] [CrossRef]
  44. Bux, C.; Lombardi, M.; Varese, E.; Amicarelli, V. Economic and Environmental Assessment of Conventional versus Organic Durum Wheat Production in Southern Italy. Sustainability 2022, 14, 9143. [Google Scholar] [CrossRef]
  45. Douglas-Mankin, K.R.; Srinivasan, R.; Arnold, J.G. Soil and water assessment tool (SWAT) model: Current developments and applications. Trans. ASABE 2010, 53, 1423–1431. [Google Scholar] [CrossRef]
  46. Deutsches Zentrum für Luft- und Raumfahrt (German Aerospace Center). Available online: https://www.dlr.de/EN/Home/home_node.html (accessed on 1 October 2020).
  47. Regione Lombardia, 2013. Basi informative dei suoli. Geoportale della Lombardi. Available online: https://www.geoportale.regione.lombardia.it/metadati?p_p_id=detailSheetMetadata_WAR_gptmetadataportlet&p_p_lifecycle=0&p_p_state=normal&p_p_mode=view&_detailSheetMetadata_WAR_gptmetadataportlet_uuid=%257BA7138B8A-9025-4802-82BC-52267B60A3D7%257D# (accessed on 1 November 2020).
  48. FORM RICHIESTA DATI. Available online: https://www.arpalombardia.it/temi-ambientali/meteo-e-clima/form-richiesta-dati/ (accessed on 1 October 2020).
  49. Uniyal, B.; Dietrich, J. Modifying Automatic Irrigation in SWAT for Plant Water Stress scheduling. Agric. Water Manag. 2019, 223, 105714. [Google Scholar] [CrossRef]
  50. Arnold, J.G.; Kiniry, J.R.; Srinivasan, R.; Williams, J.R.; Haney, E.B.; Neitsch, S.L. Input/Output Documentation Soil & Water Assessment Tool; Texas Water Resources Institute: Thrall, TX, USA, 2012; pp. 1–650.
  51. Abbaspour, K.C.; Rouholahnejad, E.; Vaghefi, S.; Srinivasan, R.; Yang, H.; Kløve, B. A continental-scale hydrology and water quality model for Europe: Calibration and uncertainty of a high-resolution large-scale SWAT model. J. Hydrol. 2015, 524, 733–752. [Google Scholar] [CrossRef]
  52. Abbaspour, K.C.; Yang, J.; Maximov, I.; Siber, R.; Bogner, K.; Mieleitner, J.; Zobrist, J.; Srinivasan, R. Modelling hydrology and water quality in the pre-alpine/alpine Thur watershed using SWAT. J. Hydrol. 2007, 333, 413–430. [Google Scholar] [CrossRef]
  53. Abbaspour, K.C.; Vejdani, M.; Haghighat, S. SWAT-CUP calibration and uncertainty programs for SWAT. In Proceedings of the MODSIM 2007 International Congress on Modelling and Simulation, Modelling and Simulation Society of Australia and New Zealand, Christchurch, New Zealand, 10–13 December 2007; pp. 1596–1602. [Google Scholar]
  54. Abbaspour, K.C.; Vaghefi, S.A.; Yang, H.; Srinivasan, R. Global soil, landuse, evapotranspiration, historical and future weather databases for SWAT Applications. Sci. Data 2019, 6, 263. [Google Scholar] [CrossRef] [PubMed]
  55. Kling, H.; Fuchs, M.; Paulin, M. Runoff conditions in the upper Danube basin under an ensemble of climate change scenarios. J. Hydrol. 2012, 424–425, 264–277. [Google Scholar] [CrossRef]
  56. Henry, M. Nonparametric Tests Against Trend. Econometrica 1945, 13, 245–259. [Google Scholar]
  57. Kendall, A.M.G. Further Contributions to the Theory of Paired Comparisons. Biometrics 1955, 11, 43–62. [Google Scholar] [CrossRef]
  58. Aboelnour, M.; Gitau, M.W.; Engel, B.A. A comparison of streamflow and baseflow responses to land-use change and the variation in climate parameters using SWAT. Water 2020, 12, 191. [Google Scholar] [CrossRef]
  59. Atta-ur-Rahman; Dawood, M. Spatio-statistical analysis of temperature fluctuation using Mann–Kendall and Sen’s slope approach. Clim. Dyn. 2017, 48, 783–797. [Google Scholar] [CrossRef]
  60. Ahmad, I.; Tang, D.; Wang, T.; Wang, M.; Wagan, B. Precipitation trends over time using Mann-Kendall and spearman’s Rho tests in swat river basin, Pakistan. Adv. Meteorol. 2015, 2015, 431860. [Google Scholar] [CrossRef]
  61. McLeod, A.I. Kendall Rank Correlation and Mann-Kendall Trend Test. R Package “Kendall”. Available online: https://cran.r-project.org/web/packages/Kendall/ (accessed on 27 November 2023).
  62. SNPA Cambiamento Climatico: In Lombardia, Oltre un Secolo di Dati Dall’osservatorio Milano Brera. Available online: https://www.snpambiente.it/2019/03/13/cambiamento-climatico-in-lombardia-oltre-un-secolo-di-dati-a-milano-brera/ (accessed on 10 October 2023).
  63. Abdullah, N.H.H.; Kuan, N.W.; Ibrahim, A.; Ismail, B.N.; Majid, M.R.A.; Ramli, R.; Mansor, N.S. Determination of soil water content using time domain reflectometer (TDR) for clayey soil. AIP Conf. Proc. 2018, 2020, 020016. [Google Scholar] [CrossRef]
  64. Masseroni, D.; Ricart, S.; de Cartagena, F.R.; Monserrat, J.; Gonçalves, J.M.; de Lima, I.; Facchi, A.; Sali, G.; Gandolfi, C. Prospects for improving gravity-fed surface irrigation systems in mediterranean european contexts. Water 2017, 9, 20. [Google Scholar] [CrossRef]
  65. Abiodun, O.O.; Guan, H.; Post, V.E.A.; Batelaan, O. Comparison of MODIS and SWAT evapotranspiration over a complex terrain at different spatial scales. Hydrol. Earth Syst. Sci. 2018, 22, 2775–2794. [Google Scholar] [CrossRef]
  66. Qiao, L.; Will, R.; Wagner, K.; Zhang, T.; Zou, C. Improvement of evapotranspiration estimates for grasslands in the southern Great Plains: Comparing a biophysical model (SWAT) and remote sensing (MODIS). J. Hydrol. Reg. Stud. 2022, 44, 101275. [Google Scholar] [CrossRef]
  67. Parajuli, P.B.; Risal, A.; Ouyang, Y.; Thompson, A. Comparison of SWAT and MODIS Evapotranspiration Data for Multiple Timescales. Hydrology 2022, 9, 103. [Google Scholar] [CrossRef]
  68. Lindsey, R.; Dahlman, L. Climate Change: Global Temperature. Available online: https://www.climate.gov/news-features/understanding-climate/climate-change-global-temperature (accessed on 30 September 2023).
  69. National Center for Environmental Information Annual 2022 Global Climate Report. Available online: https://www.ncei.noaa.gov/access/monitoring/monthly-report/global/202213 (accessed on 10 October 2023).
  70. SNPA. SNPA Presenta il Rapporto “GLI INDICATORI DEL CLIMA IN ITALIA NEL 2017”. 2018. Available online: https://www.isprambiente.gov.it/it/evidenza/pubblicazioni/no-homepage/gli-indicatori-del-clima-in-italia-nel-2017 (accessed on 14 October 2023).
  71. SNPA. Il Clima in Italia Nel 2022; Report SNPA n. 36/2023; SNPA: Rome, Italy, 2023; pp. 1–177. [Google Scholar]
  72. Coldiretti. Siccità: 250mila Aziende a Rischio Crack. Available online: https://www.coldiretti.it/economia/siccita-250mila-aziende-a-rischio-crack (accessed on 14 October 2023).
  73. Milly, P.C.D. Climate, soil water storage, and the average annual water balance. Water Resour. Res. 1994, 30, 2143–2156. [Google Scholar] [CrossRef]
  74. Glenn, E.P.; Scott, R.L.; Nguyen, U.; Nagler, P.L. Wide-area ratios of evapotranspiration to precipitation in monsoon-dependent semiarid vegetation communities. J. Arid Environ. 2015, 117, 84–95. [Google Scholar] [CrossRef]
  75. Faranda, D.; Pascale, S.; Bulut, B. Persistent anticyclonic conditions and climate change exacerbated the exceptional 2022 European-Mediterranean drought. Environ. Res. Lett. 2023, 18, 034030. [Google Scholar] [CrossRef]
  76. Gao, X.; Wu, P.; Zhao, X.; Wang, J.; Shi, Y. Effects of land use on soil moisture variations in a semi-arid catchment: Implications for land and agricultural water management. Land Degrad. Dev. 2014, 25, 163–172. [Google Scholar] [CrossRef]
  77. Mimeau, L.; Tramblay, Y.; Brocca, L.; Massari, C.; Camici, S.; Finaud-Guyot, P. Modeling the response of soil moisture to climate variability in the Mediterranean region. Hydrol. Earth Syst. Sci. 2021, 25, 653–669. [Google Scholar] [CrossRef]
  78. Zhou, T.; Han, C.; Qiao, L.; Ren, C.; Wen, T.; Zhao, C. Seasonal dynamics of soil water content in the typical vegetation and its response to precipitation in a semi-arid area of Chinese Loess Plateau. J. Arid Land 2021, 13, 1015–1025. [Google Scholar] [CrossRef]
  79. Datta, S.; Taghvaeian, S.; Stivers, J. Understanding Soil Water Content and Thresholds for Irrigation Management Managing Irrigations Based on Soil Water Content Managing irrigations based on VWC data Managing Irrigations based on SMP data. Okla. Coop. Ext. Serv. 2017, BAE-1537-1–BAE-1537-7. Available online: https://extension.okstate.edu/fact-sheets/understanding-soil-water-content-and-thresholds-for-irrigation-management.html (accessed on 1 October 2020).
  80. Qi, J.; Zhang, X.; McCarty, G.W.; Sadeghi, A.M.; Cosh, M.H.; Zeng, X.; Gao, F.; Daughtry, C.S.T.; Huang, C.; Lang, M.W.; et al. Assessing the performance of a physically-based soil moisture module integrated within the Soil and Water Assessment Tool. Environ. Model. Softw. 2018, 109, 329–341. [Google Scholar] [CrossRef]
  81. Ente Risi Riso Italiano. Available online: https://www.risoitaliano.eu/ci-siamo-giocati-la-lombardia/ (accessed on 9 October 2023).
  82. Giuliana, V.; Lucia, M.; Marco, R.; Simone, V. Environmental life cycle assessment of rice production in northern Italy: A case study from Vercelli. Int. J. Life Cycle Assess. 2022, 1–18. [Google Scholar] [CrossRef]
  83. Wu, D.; Cui, Y.; Xie, X.; Luo, Y. Improvement and testing of SWAT for multi-source irrigation systems with paddy rice. J. Hydrol. 2019, 568, 1031–1041. [Google Scholar] [CrossRef]
  84. Tsuchiya, R.; Kato, T.; Jeong, J.; Arnold, J.G. Development of SWAT-paddy for simulating lowland paddy fields. Sustainability 2018, 10, 3246. [Google Scholar] [CrossRef]
  85. Crespi, A.; Brunetti, M.; Ranzi, R.; Tomirotti, M.; Maugeri, M. A multi-century meteo-hydrological analysis for the Adda river basin (Central Alps). Part I: Gridded monthly precipitation (1800–2016) records. Int. J. Climatol. 2021, 41, 162–180. [Google Scholar] [CrossRef]
Figure 1. Right: Location of the study area in Italy. Left: Overview of the study area with its dominant land-use classes based on the “Atlante descrittivo—Uso del Suolo Regione Lombardia” [35]. Simple agricultural fields includ herbaceous crops that aresubjected to rotation or monoculture (excluding permanent grasslands and pastures), fallow land, and land belonging to special horticultural crops, special flowers, and gardens (excluding those in private residences), while the permanent crops included vineyards, orchards and minor fruits, olive groves, and wood arboriculture.
Sustainability 15 16771 g001
Figure 2. Elevation of the study area and geographical locations of the meteorological stations.
Sustainability 15 16771 g002
Figure 3. Schematic representation of the geohydrological settings of the study area. The topographical profile was obtained from a “hybrid“ DEM (10 m resolution) joining a 12 m TanDemX and 1 m Lidar. The figure represents the different orders of terraces with the respective springs at their bases and the drainage action of the Ticino River. The water table shows where it has contact with the surface (Fontanili, Risorgive) (after the CE4WE report, Pilla 2020).
Sustainability 15 16771 g003
Figure 4. Crop calendar of the main crops in the study area. Green represents the sowing of crops, yellow represents their development/growth, orange represents harvesting, and blue represents residues.
Sustainability 15 16771 g004
Figure 5. Flowchart of the methodology and results: The red color indicates the software used, blue indicates the input data, orange indicates the outputs, gray indicates the actions conducted, and yellow indicates the steps performed for the calibration and validation.
Sustainability 15 16771 g005
Figure 6. Mean temperature from 2004 to 2022, with the trend represented by the red line.
Sustainability 15 16771 g006
Figure 7. Mean annual precipitation.
Sustainability 15 16771 g007
Figure 8. Rain-free days over the last 19 years, with the trend represented by the red line.
Sustainability 15 16771 g008
Figure 9. Time series of AET for the study area from MOD16 (black) and the SWAT (blue) after calibration.
Sustainability 15 16771 g009
Figure 10. Time series of AET in a corn–ryegrass field from MOD16 (black) and the SWAT (blue) after calibration.
Sustainability 15 16771 g010
Figure 11. Time series of AET in a rice field from MOD16 (black) and the SWAT (blue) after calibration.
Sustainability 15 16771 g011
Figure 12. Actual evapotranspiration trend in the study area according to the SWAT, with the trend represented by the red line.
Sustainability 15 16771 g012
Figure 13. The ratio of evapotranspiration to precipitation (as a percentage) in the study area, with the trend represented by the red line.
Sustainability 15 16771 g013
Figure 14. SWC trend over the last 15 years in the study area according to the SWAT, with the trend represented by the red line.
Sustainability 15 16771 g014
Figure 15. Correlation between soil water content and precipitation in the study area.
Sustainability 15 16771 g015
Table 1. Sources and descriptions of the input data utilized to set up the SWAT model.
Data TypeSourcesResolution and Description
TopographyDeutsches Zentrum für Luft und Raumfahrt (DLR) and Ministero dell’Ambiente: Geoportale Nazionale, 2019 [46]10 m “Hybrid” Digital Elevation Model
SoilGeoportale della Lombardia [47]1:50,000, Soil information bases
Land-UseGeoportale della Lombardia [40]1:10,000, Land Use and Land Cover 2018 (DUSAF 6.0)
ClimateArpa Lombardia [48]Daily, ARPA Lombardia hydro-nivo-meteorological data archive.
Table 2. Parameters selected for the calibration and the range of the corrections.
Parameter NameMin_ValueMax_ValueDescription
1:R__HRU_SLP.hru00.2Average slope steepness for overland flow
2:V__ESCO.hru0.61Soil evaporation compensation factor
3:R__CN2.mgt−0.20.2SCS runoff curve number for moisture conditions
4:V__ALPHA_BF.gw−0.070760.109Baseflow recession coefficient
5:V__GW_DELAY.gw020.281Groundwater delay
6:V__GWQMN.gw0500Threshold depth of water in the shallow aquifer required for return flow to occur
7:V__GW_REVAP.gw0.10.2Groundwater ‘revap’ coefficient
8:V__REVAPMN.gw143.0484342.720Threshold depth for water in the shallow aquifer for revap or percolation to occur
9:V__EPCO.hru01Plant evaporation compensation factor
10:V__RCHRG_DP.gw0.0091080.336Deep aquifer percolation fraction
11:V__CANMX.hru9.9341429.805Maximum canopy storage
12:R__SOL_BD(..).sol0.1905121.571Moist bulk density
13:R__SOL_AWC(..).sol−0.50.95Available water capacity of the soil layer
14:R__SOL_K(..).sol−0.80.8Saturated hydraulic conductivity
15:R__SOL_ALB(..).sol−0.030.2Moist soil albedo
16:R__SOL_ZMX.sol24.9602141.659Maximum rooting depth of soil profile
17:V__SLSOIL.hru0150Slope length for lateral subsurface flow
18:R__SOL_Z(..).sol−0.030.2Depth from the soil surface to the bottom of the layer
19:R__SOL_CBN(..).sol0.0419250.1855Organic carbon content
20:V__FFCB.bsn01Initial soil water storage
Table 3. KGE results for the calibration and validation.
Mean (All HRUs)5th Percentile95th Percentile
Calibration0.590.220.85
Validation0.49−0.170.79
Disclaimer/Publisher’s Note: The statements, opinions and data contained in all publications are solely those of the individual author(s) and contributor(s) and not of MDPI and/or the editor(s). MDPI and/or the editor(s) disclaim responsibility for any injury to people or property resulting from any ideas, methods, instructions or products referred to in the content.

