
A Study of Sustainability Concepts for Developing Green Universities in Thailand


Abstract
1. Introduction
2. Materials and Methods
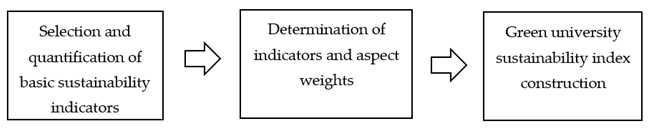
2.1. Selection and Quantification of Basic Sustainability Indicators
- 3.
- Strong/excellent/maximum;
- 2.
- Good/satisfactory/medium;
- 1.
- Weak/unsatisfactory/minimum.
2.2. Determination of Indicators and Aspect Weights
- (1)
- Data for the individual comparison matrices are collected from a questionnaire survey. The questionnaire survey is designed to produce individual comparison matrices by relevant experts in the field, as shown in Table 3.
- (2)
- After constructing a pairwise comparison matrix, weights can be calculated using the maximum eigenvalue vector method (MEVM) [21,25]. To validate the reliability of the AHP model, a consistency index is used to measure the comparison matrix. To calculate the consistency index (CI), the deviation from consistency is calculated as follows [21,25]:
- (3)
- The random index (RI) is identified to evaluate consistency. The RI is calculated following Saaty [25].
- (4)
- The consistency ratio (CR) is calculated.
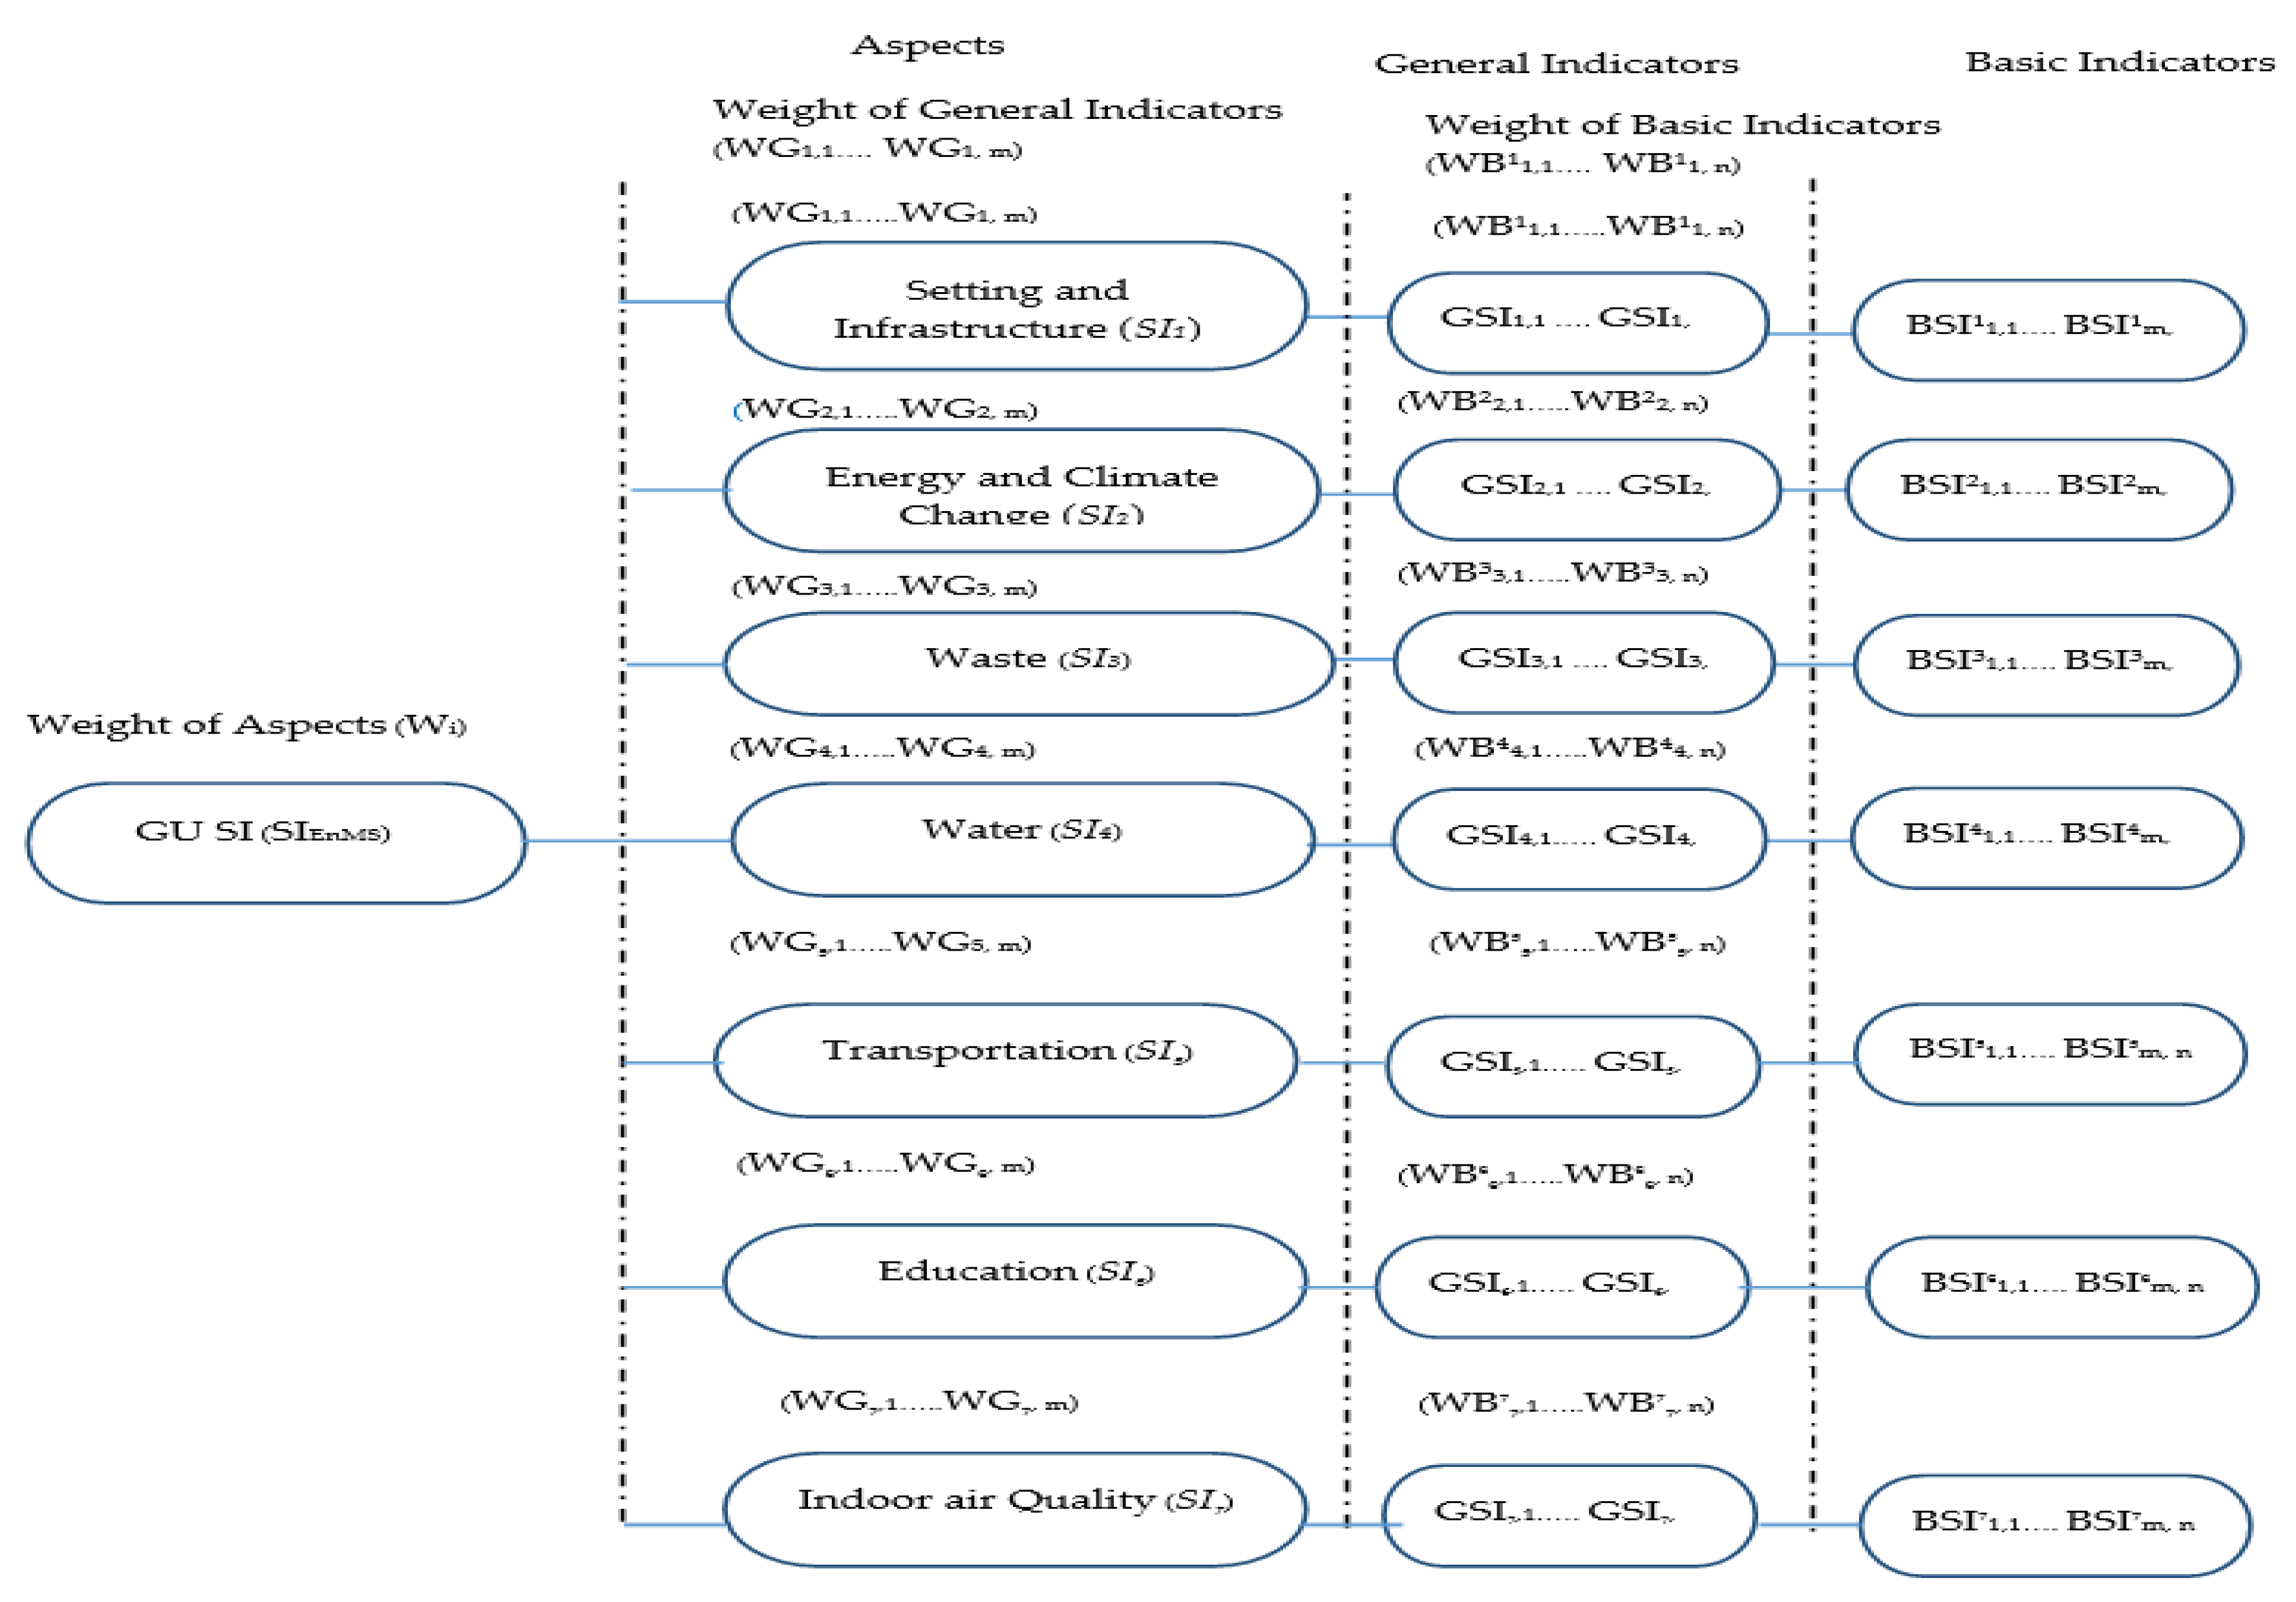
2.3. Green University Sustainability Index Construction
- (GUSIi,m)A is the value of the general indicator m according to the GU SI’s sustainability aspect i for University A.
- (BSIim,n) A is the value of the basic indicator n that corresponds to the general indicator m and is associated with the GU SI’s sustainability aspect i for University A.
- WBim,n is the weight of the basic indicator n for the general indicator m, which is associated with the GU SI’s sustainability aspect i.
- (SIi)A is the value of the GU SI’s sustainability aspect i for University A.
- (GIi,m)A is the value of the general indicator m that corresponds to the GU SI’s sustainability aspect i for University A
- WGi,m is the weight of the basic indicator m, which corresponds to the GU SI’s sustainability ity aspect i.
- (SIGUSI)A is the value of the GU SI for University A, assuming a value between 1 (less sustainable) and 3 (extremely sustainable); (SIi)A is the value of the quality of each GU SI‘s sustainability aspect for University A; and Wi is the weight of each considered aspect.
3. Results
3.1. Selection and Quantification of Basic Sustainability Indicators
3.2. Determination of Indicator Weights
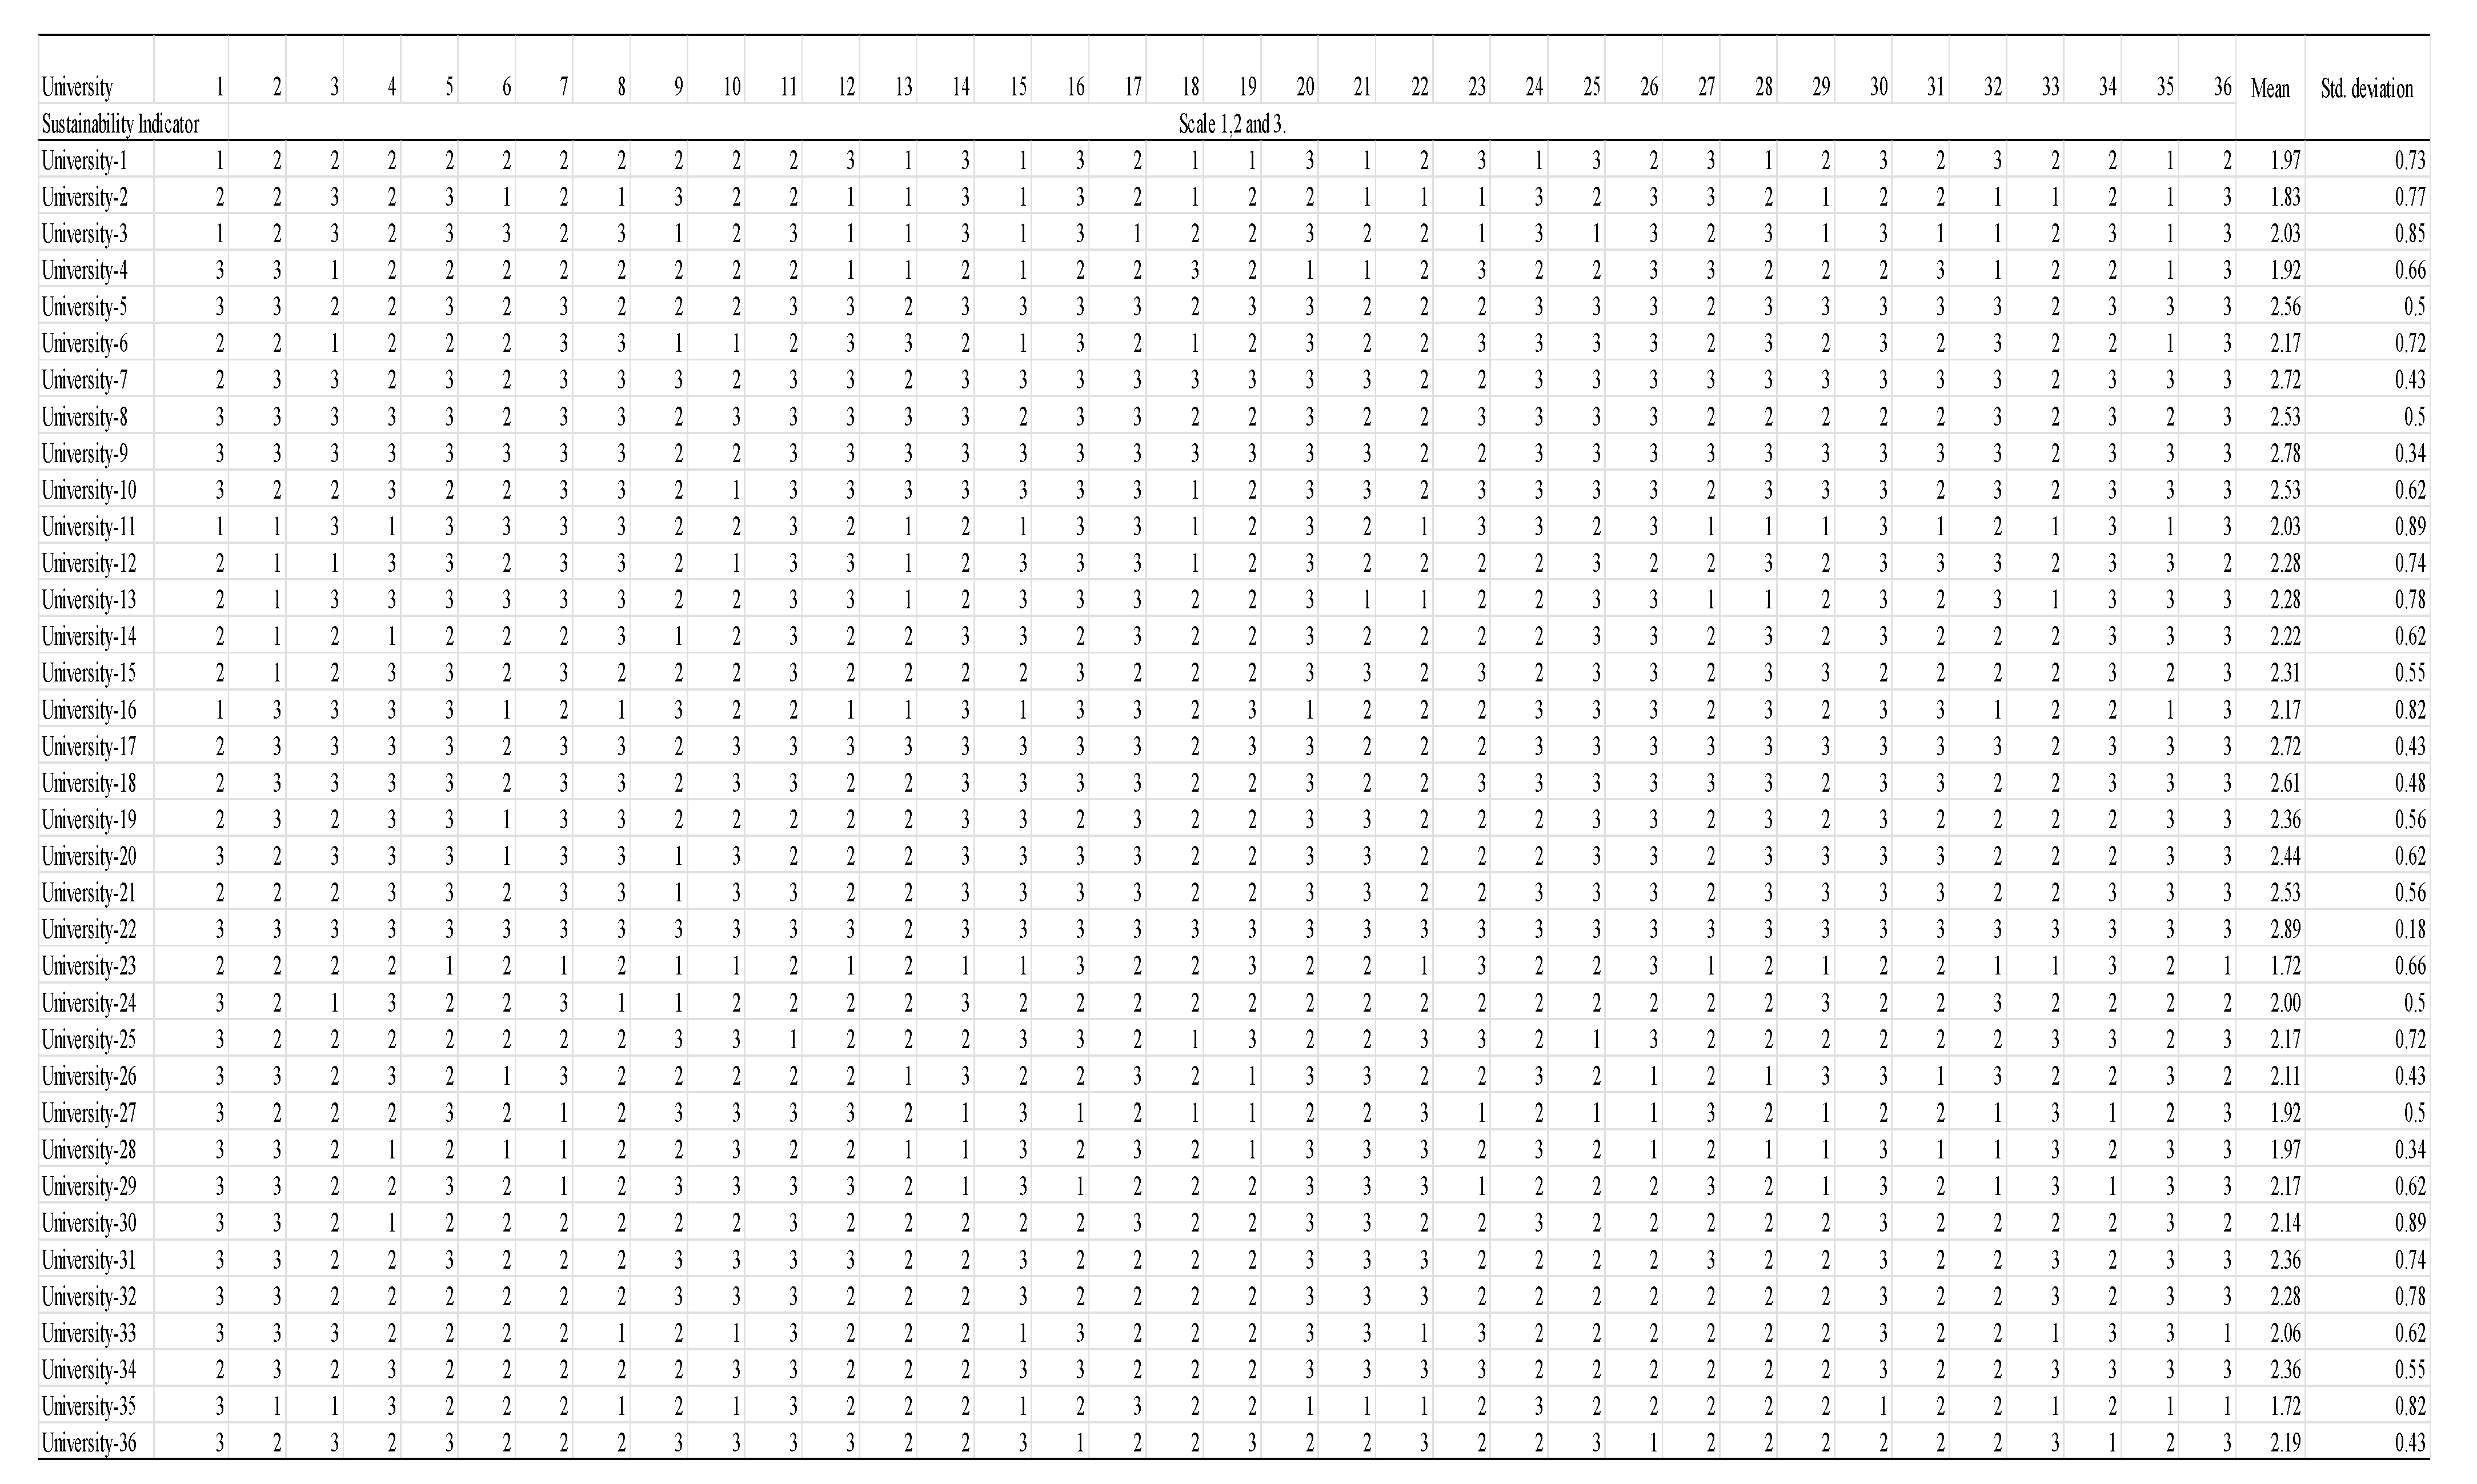
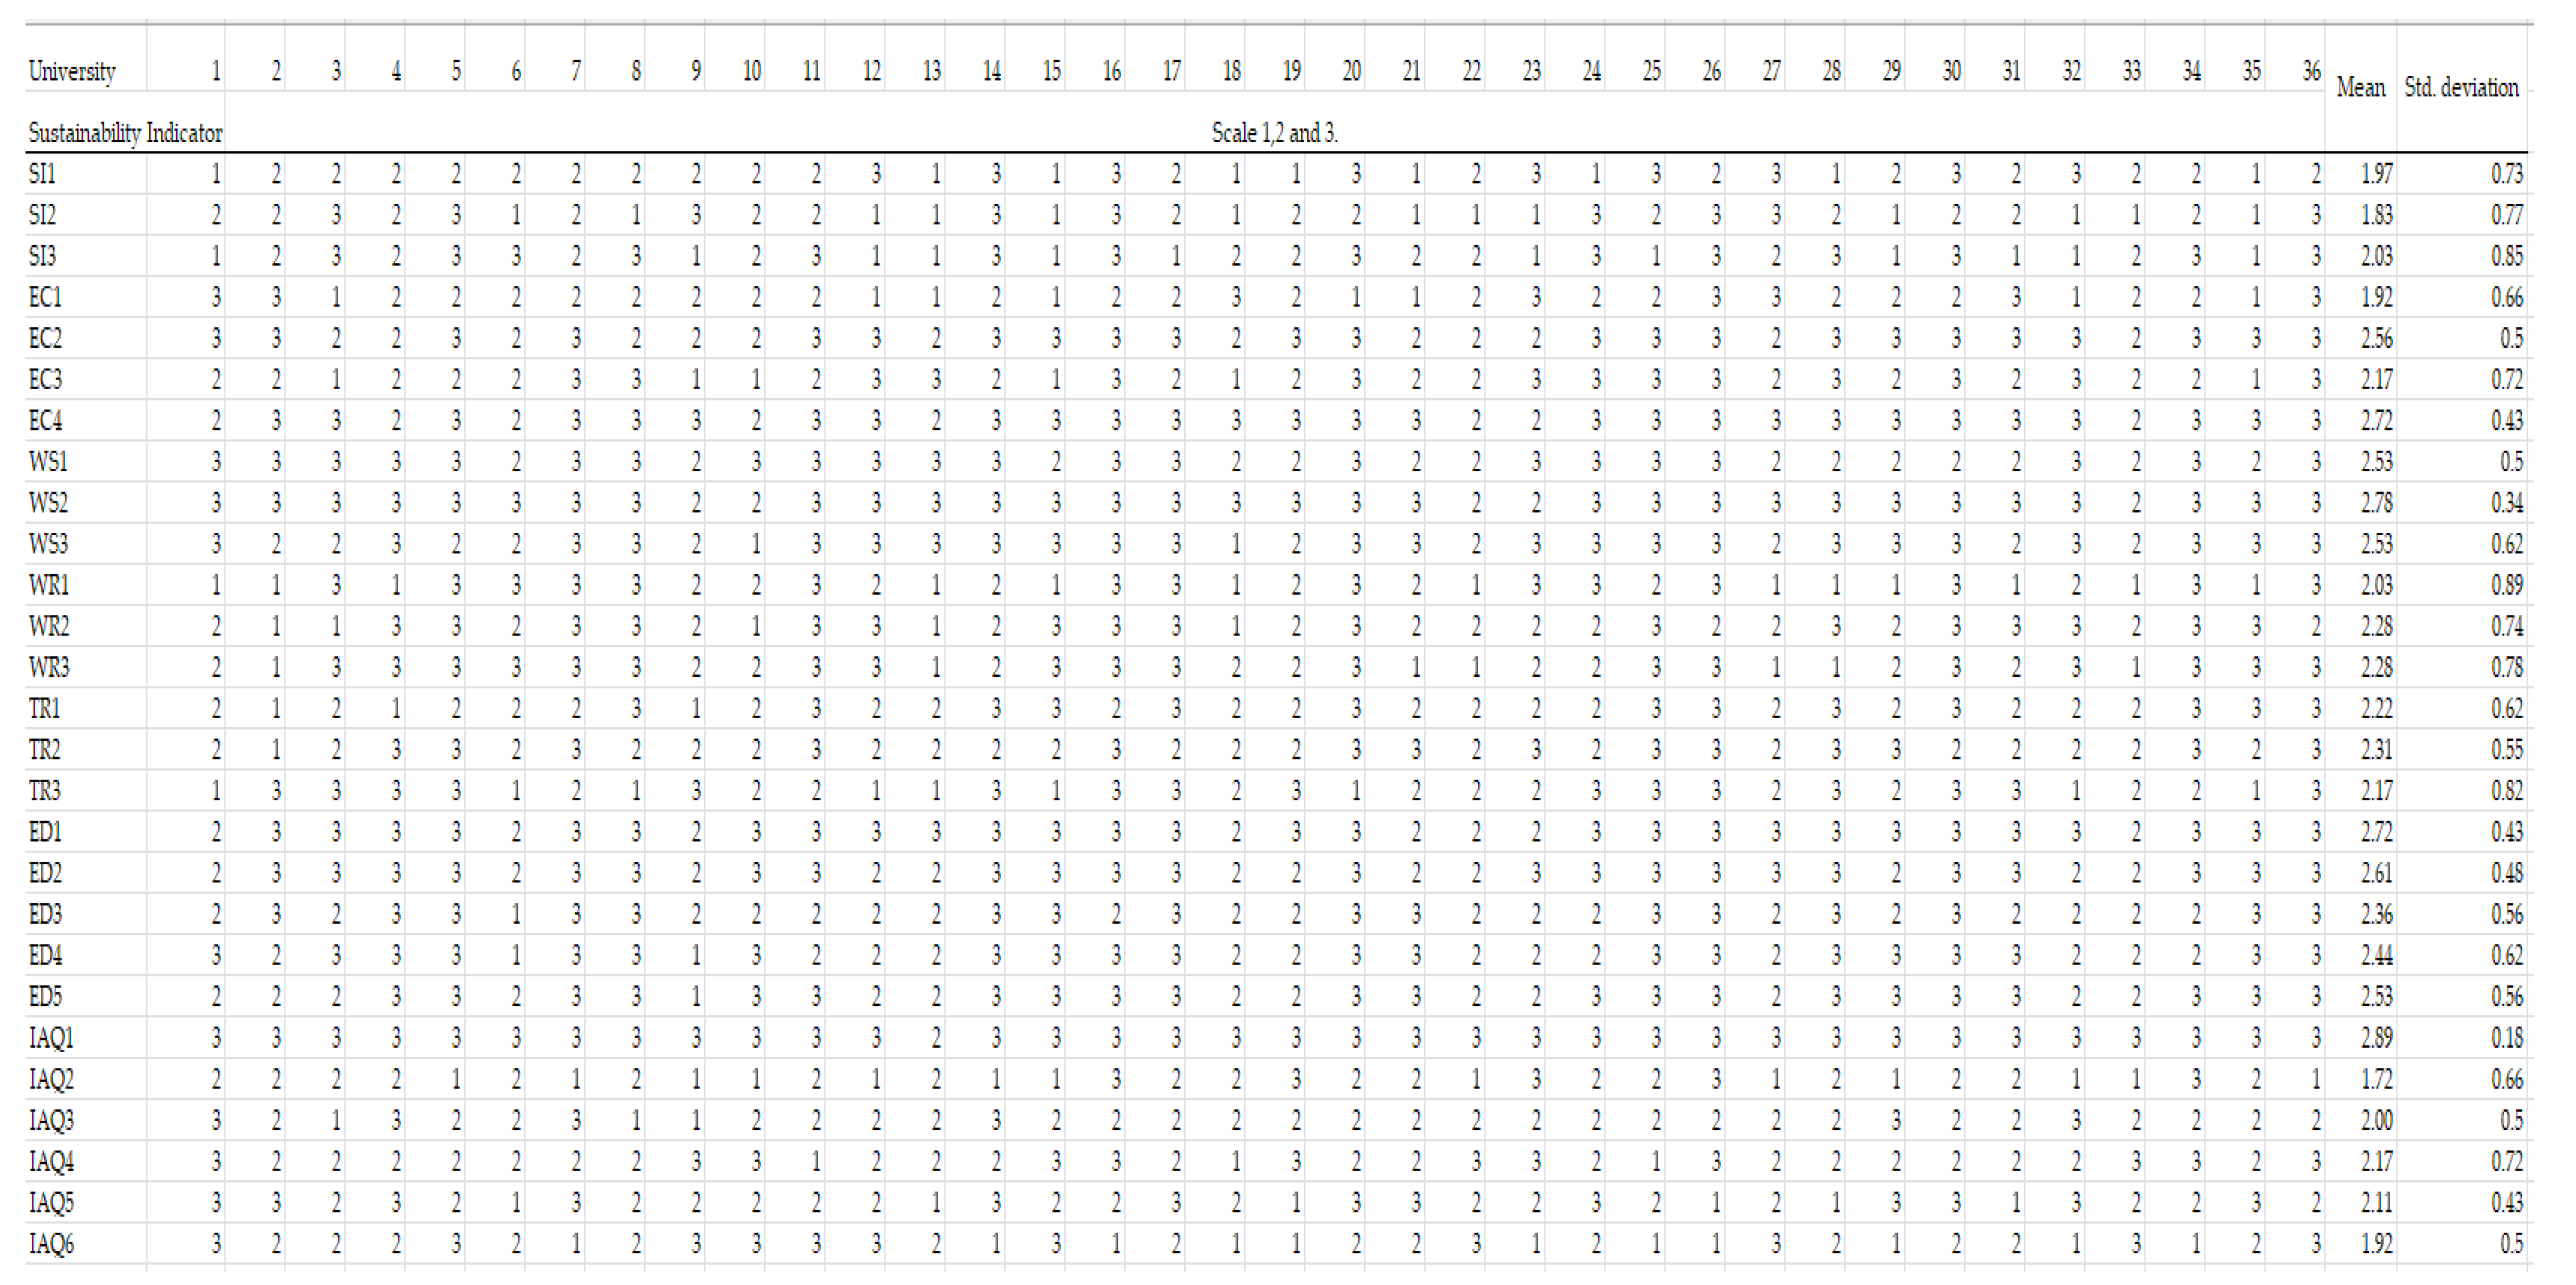
3.3. Survey and Assessment of Sustainability Indicators within a University Sample
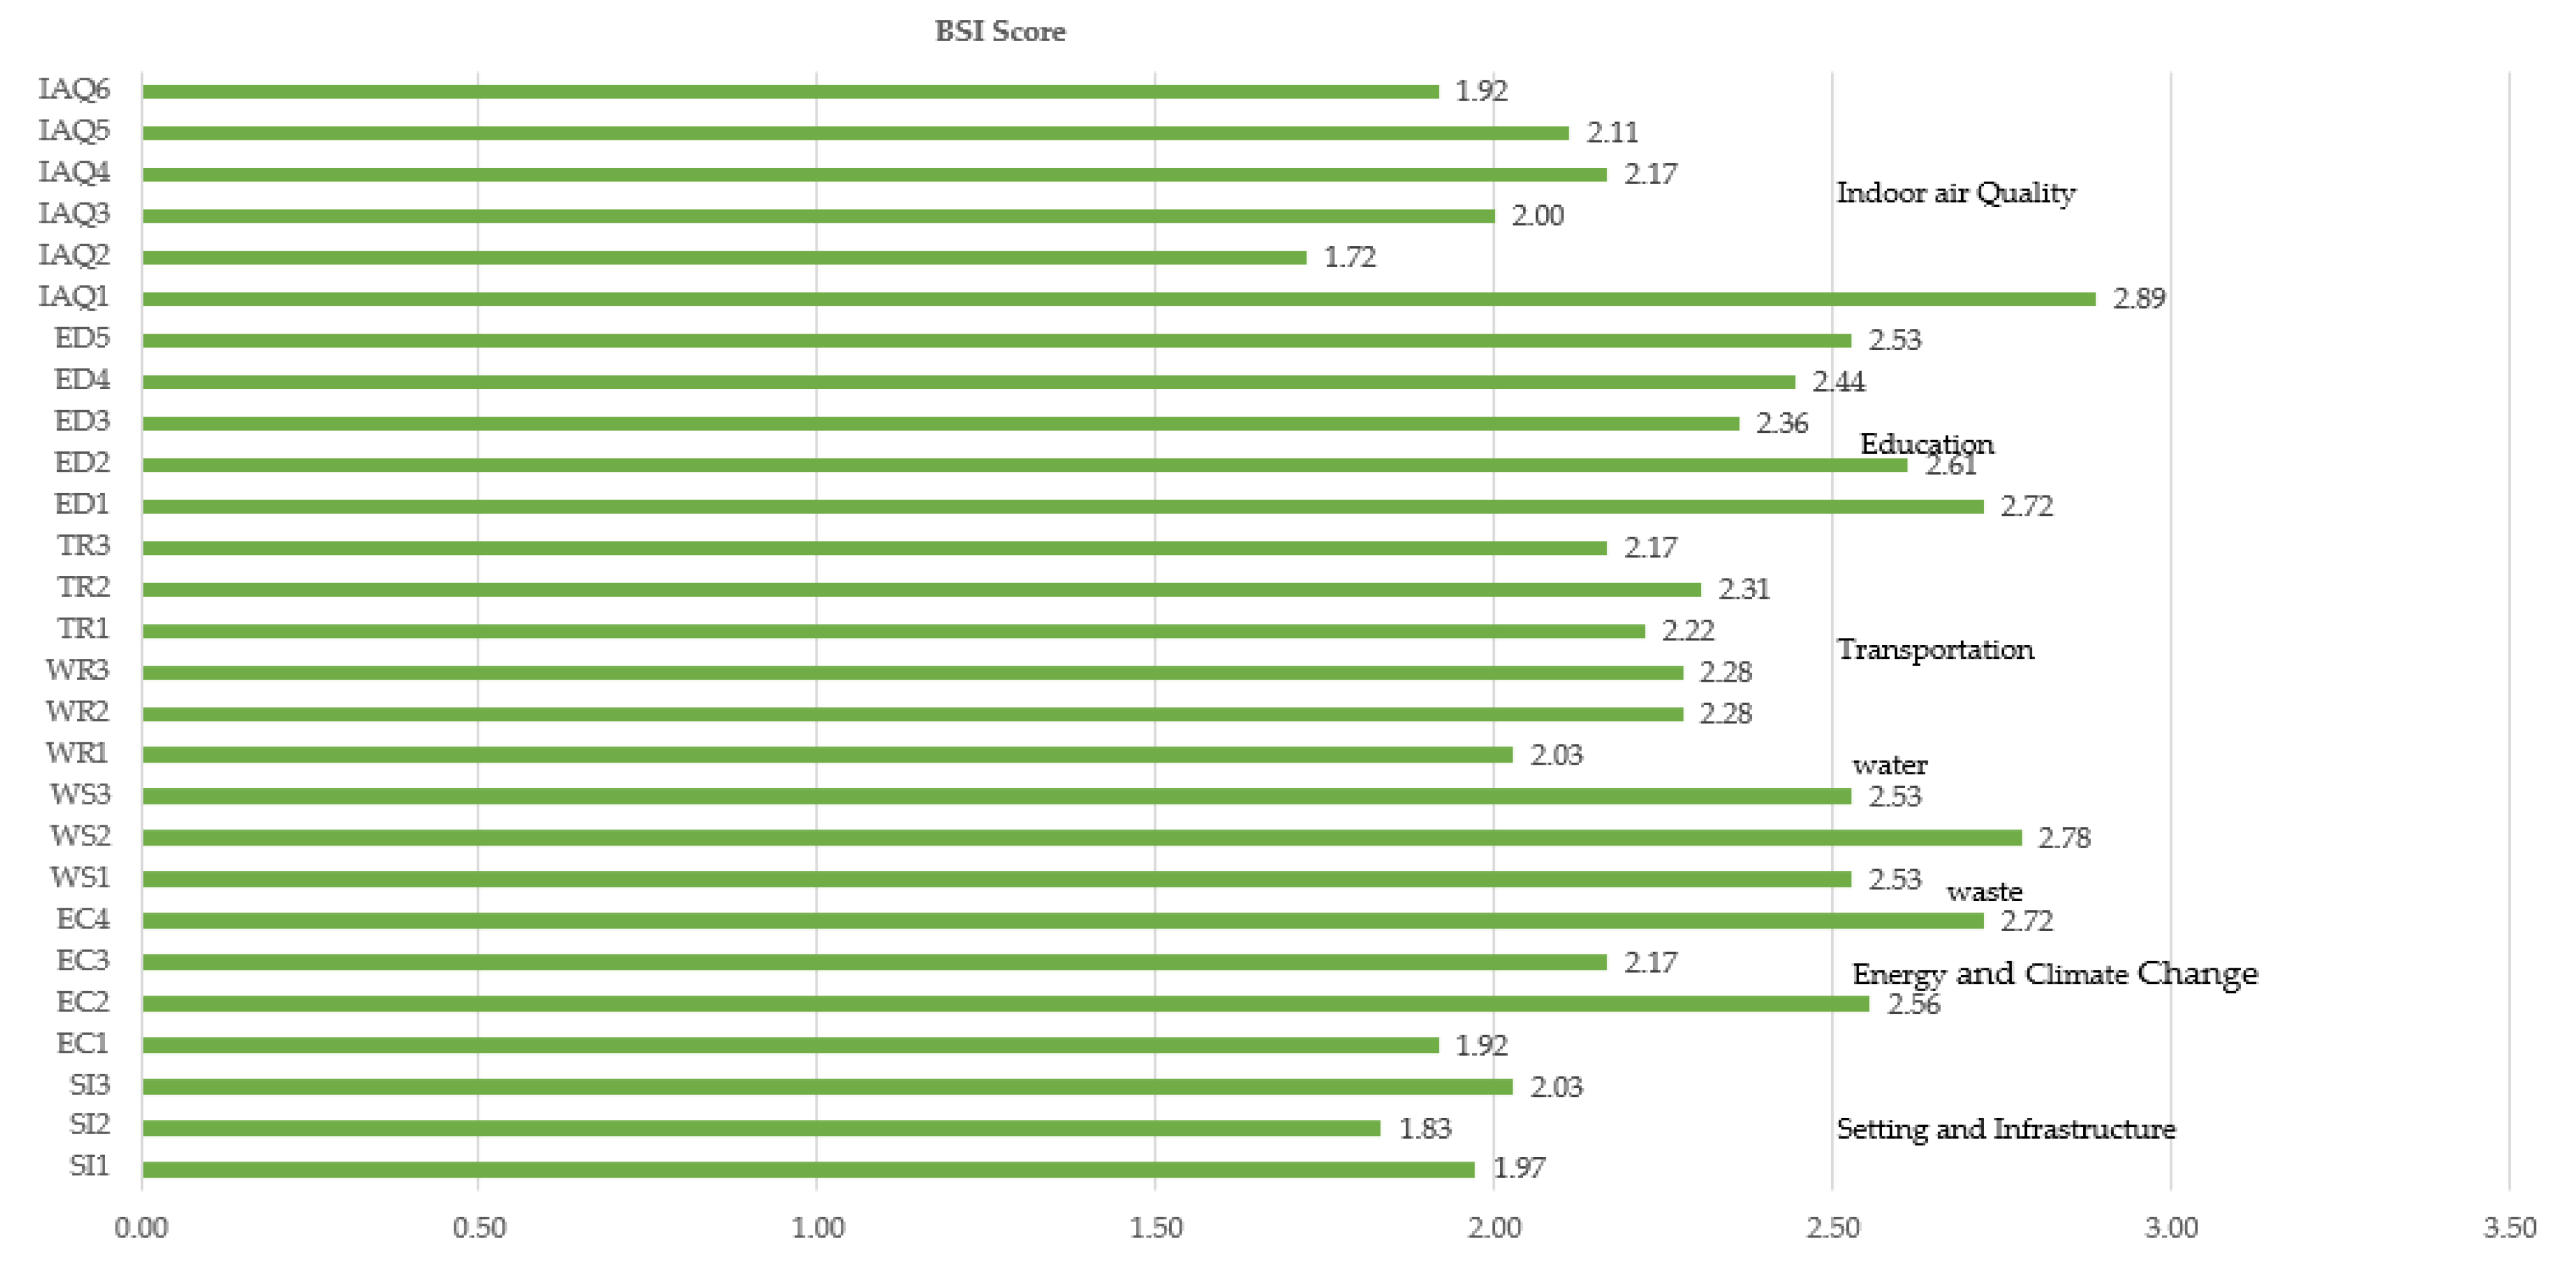
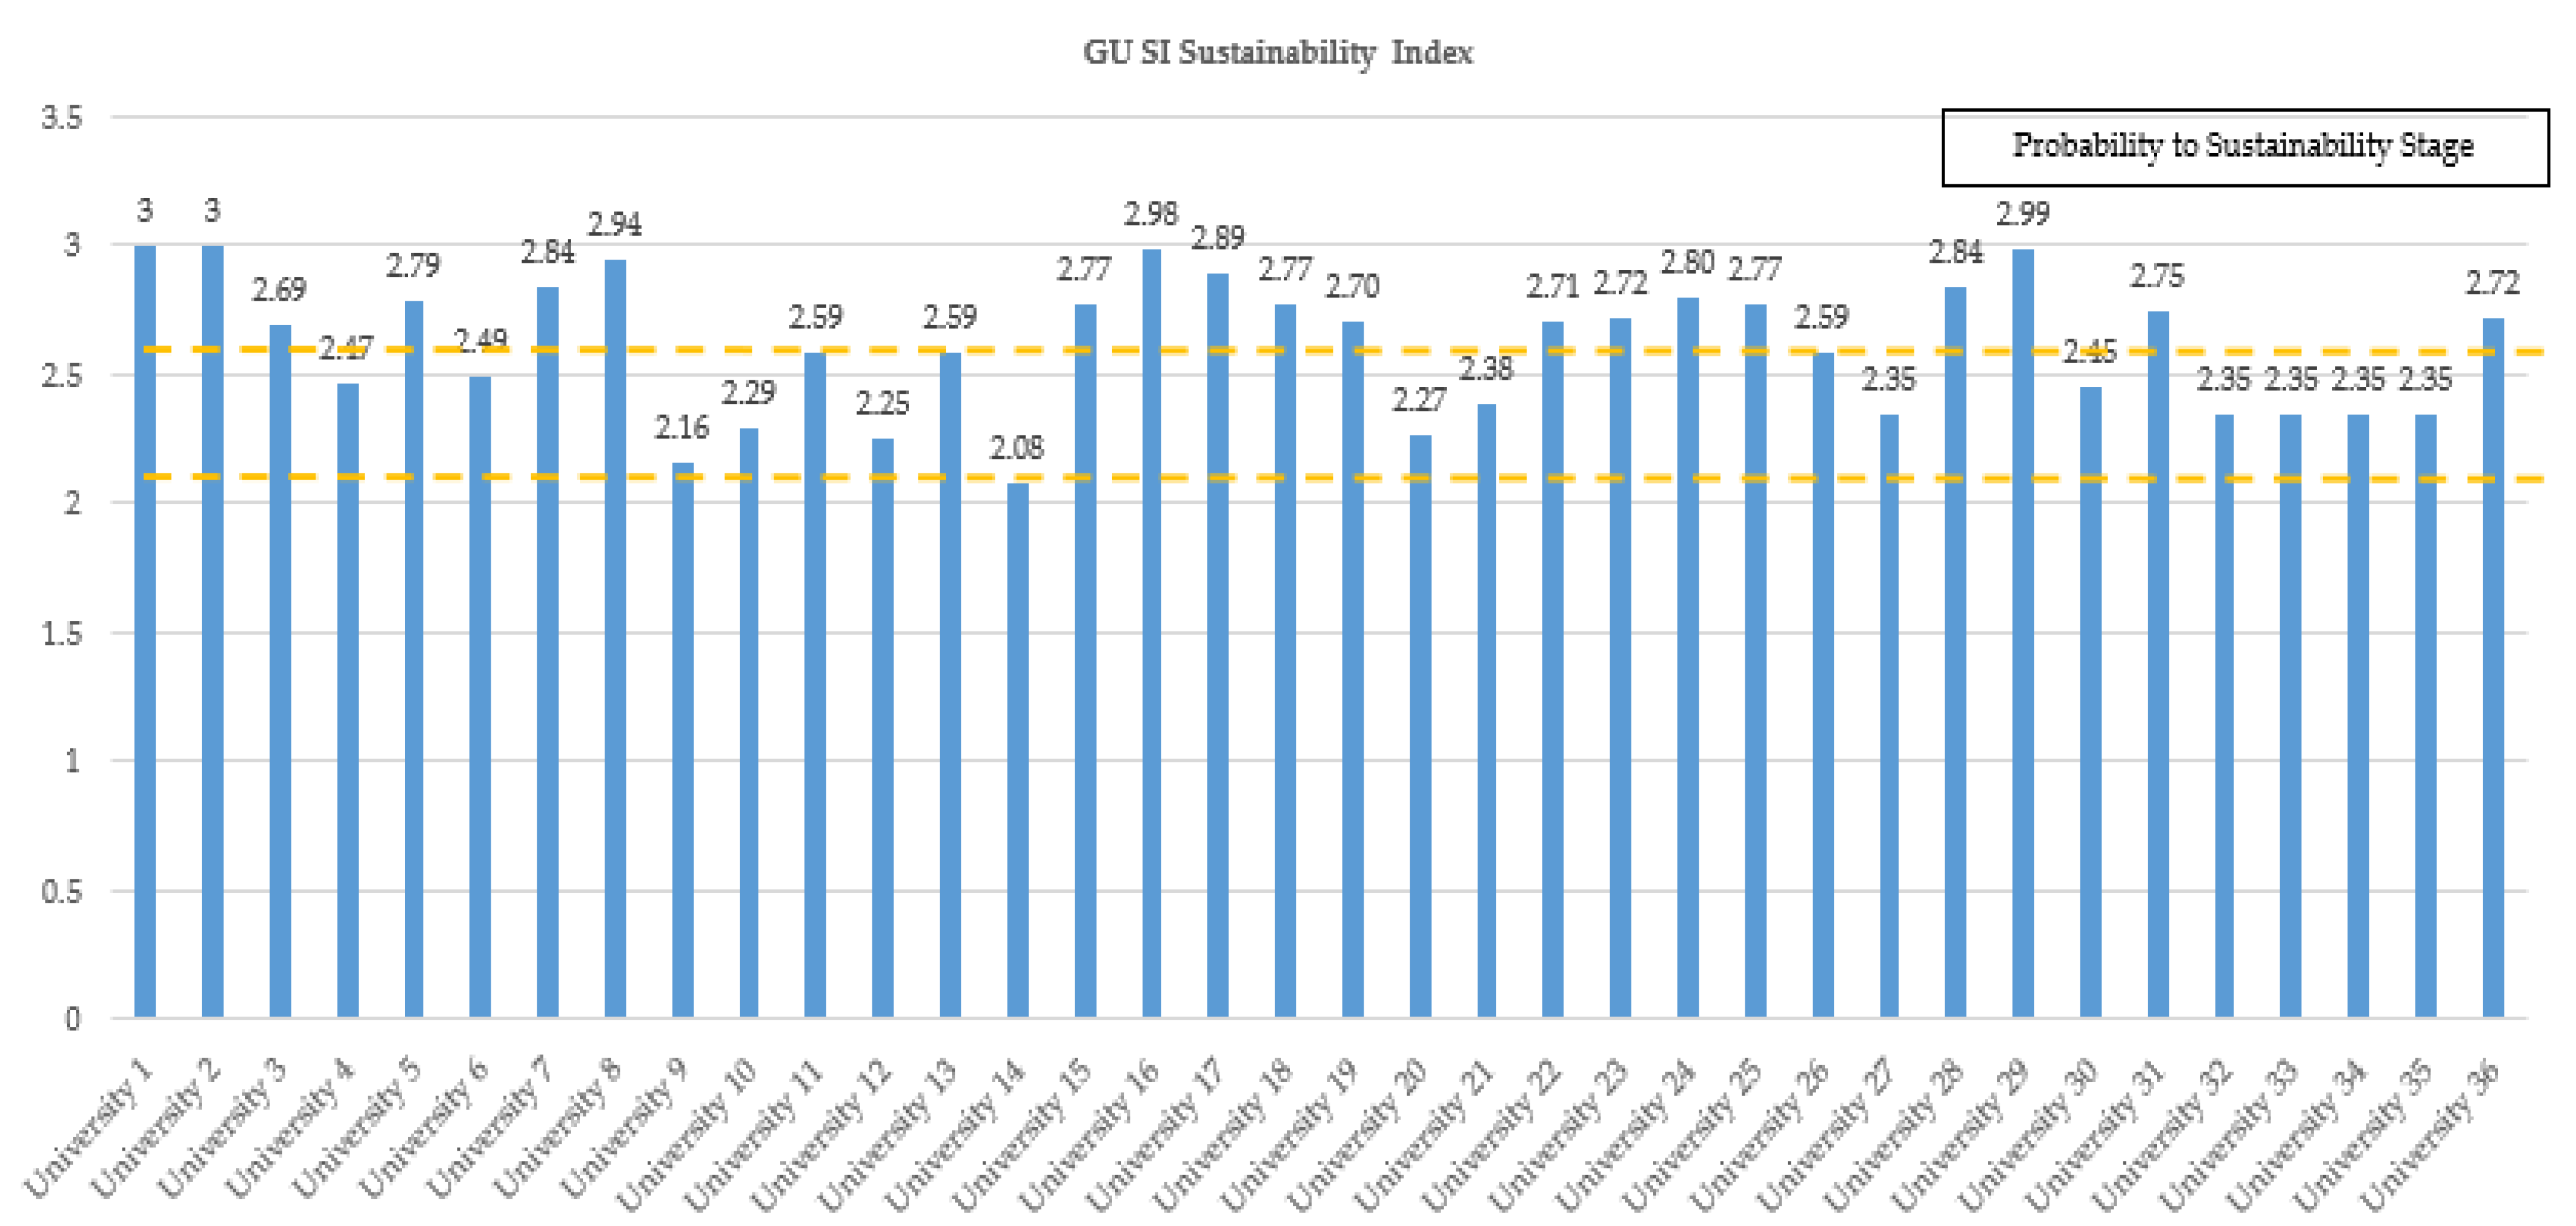
3.4. Index Construction
4. Discussion
5. Conclusions
Author Contributions
Funding
Institutional Review Board Statement
Informed Consent Statement
Data Availability Statement
Acknowledgments
Conflicts of Interest
Abbreviations
| AAS | aggregated academic score |
| ACUPCC | The American College & University Presidents’ Climate Commitment |
| AHP | analytic hierarchy process |
| ARWU | Academic Ranking of World Universities |
| AS | academic scores |
| AUN | ASEAN University Network |
| CWCU | Center for World-Class Universities |
| EC | energy and climate change |
| ED | education and research |
| EfSD | education for sustainable development |
| EMS | energy management system |
| EPI | Environmental Performance Index |
| GM | GreenMetric |
| GRI | Global Reporting Initiative |
| GMTS | GreenMetric Total Score |
| GO | Green Office |
| GU SI | Green University Sustainability Index |
| HEIs | higher education institutions |
| HESI | Higher Education Sustainability Initiative |
| HiCi | highly cited |
| N&S | nature and science |
| NTU | National Taiwan University |
| PCP | per capita performance |
| PUB | papers indexed in the Science Citation Index (as an ARWU ranking sub-dimension) |
| QS | Quacquarelli Symonds |
| SD | sustainable development |
| SI | setting and infrastructure |
| SJTU | Shanghai Jiao Tong University |
| STARS | Sustainability Tracking, Assessment & Rating System |
| THE | Times Higher Education |
| TR | transportation |
| UGI | University Greenness Index Developed by the University of Indonesia (Universitas Indonesia, UI) |
| UMI | Urban Morphology Index |
| UN | United Nations |
| US | United States |
| WR | water |
| WS | waste |
| UNEP | United Nations Environment Program |
| ZEV | zero emission vehicles |
Appendix A

| Basic Indicators | Evaluation | Scale |
|---|---|---|
| Implementation and operation | Level of satisfaction regarding continuous benefits from the aspect of setting and infrastructure | |
| Proportion of open space per campus population | 1 | |
| Proportion of campus area used as water absorption area | 2 | |
| - Percentage of university budget for sustainable development | 3 | |
| Implementation and operation | Level of satisfaction regarding continuous benefits from the aspect of energy and climate change | |
| - (Total number of No. 5 electrical equipment/total number of electrical equipment)*100 | 1 | |
| - Electric energy used per year/population | 2 | |
| - (Electric energy produced per year/total electrical energy used)*100 | 3 | |
| - Carbon emissions in 1 year/population | 3 | |
| Environmental impact | Level of satisfaction regarding continuous benefits from the aspect of waste management | |
| - (Total paper and plastic reduction per year/total paper and plastic consumption)*100 | 1 | |
| - (Amount of recycled waste per year/total amount of waste)*100 | 2 | |
| - Total amount of waste per day/population | 3 | |
| Environmental impact | Level of satisfaction regarding continuous benefits from the aspect of water management | |
| - (Total water reduction per year/total water conservation projects per year)*100 | 1 | |
| - (Amount of wastewater recycled per year/total wastewater per year)*100 | 2 | |
| - Amount of water consumption within the university | 3 | |
| Environmental impact | Level of satisfaction regarding continuous benefits from the aspect of transportation | |
| - (Total number of private cars reduced per year/total number of private cars per year)*100. | 1 | |
| - (Total number of electric cars per year/total number of private cars per year)*100 | 2 | |
| - (Total parking area per year/total number of private cars per year)*100. | 3 | |
| Level of satisfaction regarding continuous benefits from the aspect of education | ||
| - (Sustainability courses/all courses)*100 | 1 | |
| - (Sustainability research grants/total research grants)*100 | 2 | |
| - (Publication articles on sustainability (previous 3 years)/total publication articles (previous 3 years))*100 | 3 | |
| - (Sustainability activities (previous 3 years)/total activities (previous 3 years))*100 | 3 | |
| - (Sustainability courses/all subjects)*100 | 3 | |
| Implementation and operation | Level of satisfaction regarding continuous benefits from the aspect of IAQ (indoor air quality) | |
| - Temperature measurement position of 24–26 degrees | 1 | |
| - Measurement position of relative humidity at 50–65% | 1 | |
| - Measurement location for CO2 not exceeding 1000 ppm | 1 | |
| - PM measurement location not exceeding 2.5 (24-h average) | 2 | |
| - PM measurement location not exceeding 10 (average over 24 h) | 2 | |
| - TVOC measurement position not exceeding 1000 ppb | 3 |
References
- Patiphan, K. Environmental Operations of a University. EAU Herit. J. Sci. Technol. 2020, 14. [Google Scholar]
- Phrut, S. Educational Management for Sustainable Development: Fundamentals of Economic, Social and Environmental Education; Thai Samphan Printing: Bangkok, Thailand, 2012. [Google Scholar]
- Piyamas, S.; Somtip, D. The Participation of Students in Environmental Management Related to the Learning and Teaching Activities in Prince of Songkhla University, Surat Thani Campus. In Proceedings of the 2nd STOU Graduate Research Conference, Nonthaburi, Thailand, 4–5 September 2012. [Google Scholar]
- Tiyarattanachai, R.; Hollmann, N.M. Green Campus initiative and its impacts on quality of life of stakeholders in Green and Non-Green Campus universities. SpringerPlus 2016, 5, 84. [Google Scholar] [CrossRef] [PubMed]
- Suwartha, N.; Sari, R.F. Evaluating UI GreenMetric as a tool to support green universities development: Assessment of the year 2011 ranking. J. Clean. Prod. 2013, 61, 46–53. [Google Scholar] [CrossRef]
- Shi, H.; Lai, E. An alternative university sustainability rating framework with a structured criteria tree. J. Clean. Prod. 2013, 61, 59–69. [Google Scholar] [CrossRef]
- Lukman, R.; Tiwary, A.; Azapagic, A. Towards greening a university campus: The case of the University of Maribor, Slovenia. Resour. Conserv. Recy. 2009, 53, 639–644. [Google Scholar] [CrossRef]
- Gheewala, S.H.; Ghani, H.U.; Nilsalab, P.; Pongpat, P.; Farooq, A.; Mahmood, A.; Adeniyi, G.A.; Akbar, H.; Fangmongkol, K. Regional Assessment Report Examining the Interlinkage between SCP and Regional Issues in Asia; SWITCH-Asia RPAC—TERI (SWITCH-Asia Regional Policy Advocacy Component and The Energy and Resources Institute): Bangkok, Thailand, 2022; Available online: https://www.switch-asia.eu/resource/regional-assessment-report-examining-the-interlinkage-between-scpand-regional-issues-in-asia/ (accessed on 20 July 2023).
- Gheewala, S.H.; Ghani, H.U.; Nilsalab, P.; Pongpat, P.; Mahmood, A.; Fangmongkol, K.; Farooq, A.; Akbar, H.; Adeniyi, G.A. Regional Indicators and Database on Resource Efficiency in Asia—Measuring Progress of Sustainable Consumption and Production, Green Economy, and Resource Efficiency; SWITCH-Asia RPAC—TERI (SWITCH-Asia Regional Policy Advocacy Component and The Energy and Resources Institute): Bangkok, Thailand, 2022. [Google Scholar]
- Lioutov, I. Rapid Urbanization, Air Transport Demand, and Land Scarcity: WhereWill the Industry Build New Airports? 2020. Available online: https://blog.aci.aero/rapid-urbanization-air-transport-demand-and-land-scarcity-where-will-the-industrybuild-new-airports/ (accessed on 15 August 2023).
- Statista. Forecast of the Global Middle Class Population from 2015 to 2030, by Region. 2022. Available online: https://www.statista.com/statistics/255591/forecast-on-the-worldwide-middle-class-population-by-region/ (accessed on 9 June 2023).
- UNFCCC. What Is the Triple Planetary Crisis? 2022. Available online: https://unfccc.int/blog/what-is-the-triple-planetary-crisis (accessed on 1 June 2023).
- UNEP. Make Peace with Nature. 2021. Available online: https://www.unep.org/resources/making-peace-nature (accessed on 27 July 2023).
- Passarelli, D.; Denton, F.; Day, A. Beyond Opportunism—The UN Development Systems’ Response to the TriplePlanetaryCrisis. 2021. Available online: https://ukraine.un.org/sites/default/files/2021-07/UNUTriplePlanetaryCrisis2021.pdf (accessed on 1 June 2023).
- UNEP. Sustainable Digitalization and the Triple Planetary Crisis in West Asia. 2023. Available online: https://wedocs.unep.org/handle/20.500.11822/43115 (accessed on 3 June 2023).
- ADB. Asian Development Outlook 2021—Renewed Outbreaks and Divergent Recoveries; ADB: Mandaluyong, Philippines, 2021. [Google Scholar]
- Rhea, C.H. APEC Regional Trends Analysis—Multiple Headwinds Derail Recovery. 2022. Available online: https://www.apec.org/docs/default-source/publications/2022/2/apec-regional-trends-analysis-february-2022-update-multipleheadwinds-derail-recovery/222_psu_arta-update_feb-2022.pdf?sfvrsn=b6bf4dec_2 (accessed on 10 June 2023).
- Amicarelli, V.; Primiceri, M.; Misino, E.; Bux, C. An Application of the UNI/TS 11820: 2022 on the Measurement of Circularity in an Electrical Equipment Manufacturing Organization in Italy. J. Clean. Prod. 2023, 420, 138439. [Google Scholar] [CrossRef]
- Liu, G. Development of a general sustainability indicator for renewable energy systems: A review. Renew. Sustain. Energy Rev. 2014, 31, 611–621. [Google Scholar] [CrossRef]
- Suebpru, C. Landscape improvement guidelines for Khon Kaen University under green campus concept. Master’s Thesis, Chulalongkorn University, Bangkok, Thailand, 2014. [Google Scholar]
- Goldrathn, T.; Ayalon, O.; Shechter, M. A combined sustainability index for electricity eciency measures. Energy Policy 2015, 86, 574–584. [Google Scholar] [CrossRef]
- Salvado, F.M.; Azevedo, S.G.; Matias, J.C.O.; Ferreira, L.M. Proposal of a Sustainability Index for the Automotive Industry. Sustainability 2015, 7, 2113–2144. [Google Scholar] [CrossRef]
- Yang, Y.; Li, B.; Yao, R. A method of identifying and weighting indicators of energy eciency assessment inChinese residential buildings. Energy Policy 2010, 38, 7687–7697. [Google Scholar] [CrossRef]
- Saaty, T.L. The Analytic Hierarchy Process: Planning, Priority Setting, Resource Allocation; McGraw-Hill: NewYork, NY, USA, 1990; ISBN 0070543712. [Google Scholar]
- Tonsirimongkol, V. AHP—The Most Popular Decision Making Process in the World; Graphic and Printing Center: Bangkok, Thailand, 1999; ISBN 9748707369. [Google Scholar]
- International Organization for Standardization. ISO 50001; Energy Management System—Requirements with Guidance for Use. International Organization for Standardization: Geneva, Switzerland, 2011.
- International Organization for Standardization. ISO Survey. 2017. Available online: https://www.iso.org/iso/iso-survey (accessed on 15 October 2018).
- International Organization for Standardization. ISO 50004; Energy Management Systems—Guidance for the Implementation, Maintenance and Improvement of an Energy Management System. International Organization for Standardization: Geneva, Switzerland, 2014.
- Bottcher, C.; Müller, M. Insights on the impact of energy management systems on carbon and corporate performance. An empirical analysis with data from German automotive suppliers. J. Clean. Prod. 2016, 137, 1449–1457. [Google Scholar] [CrossRef]
- International Organization for Standardization. ISO 14001; Environmental Management Systems—Requirements with Guidance for Use. International Organization for Standardization: Geneva, Switzerland, 2015.
- Laskurain, I.; Ibarloza, A.; Larrea, A.; Allur, E. Contribution to Energy Management of the Main Standards for Environmental Management Systems: The Case of ISO 14001 and EMAS. Energies 2017, 10, 1758. [Google Scholar] [CrossRef]
- Issa, I.I.; Pigosso, D.C.; McAloone, T.C.; Rozenfeld, H.; Pigosso, D.C.A. Leading product-related environmental performance indicators: A selection guide and database. J. Clean. Prod. 2015, 108, 321–330. [Google Scholar] [CrossRef]
- Brunke, J.-C.; Johansson, M.; Thollander, P. Empirical investigation of barriers and drivers to the adoption of energy conservation measures, energy management practices and energy services in the Swedish iron and steel industry. J. Clean. Prod. 2014, 84, 509–525. [Google Scholar] [CrossRef]
- Rohdin, P.; Thollander, P.; Solding, P. Barriers to and drivers for energy efficiency in the Swedish foundry industry. Energy Policy 2007, 35, 672–677. [Google Scholar] [CrossRef]
| Items | Criteria | Percentage of All Scores |
|---|---|---|
| 1 | Setting and infrastructure | 15% |
| 2 | Energy and climate change | 21% |
| 3 | Waste management | 18% |
| 4 | Water management | 10% |
| 5 | Transportation | 18% |
| 6 | Education | 18% |
| Total | 100% |
| Factors | Weights (%) | Indicators | |
|---|---|---|---|
| 1 | Setting and Infrastructure (SI) | 15 | The ratio of open space area to total area; area on campus covered in forest; area on campus covered in planted vegetation; area on campus for water absorbance; total open space area divided by total campus population; and university budget for sustainable efforts. |
| 2 | Energy and Climate Change (EC) | 21 | Usage of energy-efficient appliances; smart building implementation; number of renewable energy sources on campus; total electricity usage divided by total campus population (kWh per person); the ratio of renewable energy produced to total energy usage; elements of green building implementation as reflected in all construction and renovation policies; greenhouse gas emission reduction programs; and the ratio of total carbon footprint divided by total campus population. |
| 3 | Waste Management (WS) | 18 | Recycling program for university waste; program to reduce the use of paper and plastic on campus; organic waste treatment; inorganic waste treatment; toxic waste treatment; and sewage disposal. |
| 4 | Water Management (WR) | 10 | Water conservation program implementation; water recycling program implementation; use of water-efficient appliances (water tap, toilet flush, etc.); and treated water consumption. |
| 5 | Transportation (TR) | 18 | Total number of vehicles (cars and motorcycles) divided by total campus population; shuttle services; zero-emission vehicle (ZEV) policy on campus; ratio of zero-emission vehicles (ZEVs) to total campus population; ratio of parking area to total campus area; transportation programs designed to limit or decrease parking area on campus in the last three years (from 2015 to 2017); number of transportation initiatives to decrease private vehicles on campus; and pedestrian path policies on campus. |
| 6 | Education and Research (ED) | 18 | The ratio of sustainability courses to total number of courses/modules; the ratio of sustainability research funding to total research funding; number of scholarly publications on environment and sustainability; number of scholarly events related to environment and sustainability; number of student organizations related to environment and sustainability; existence of a university-run sustainability website; and existence of published sustainability reports. |
| Criteria | A | B | C | D |
|---|---|---|---|---|
| A | 1 | X12 | X13 | X14 |
| B | 1/X12 | 1 | X23 | X24 |
| C | 1/X13 | 1/X23 | 1 | X34 |
| D | 1/X14 | 1/X24 | 1/X34 | 1 |
| Aspect | General Indicator | Basic Indicator | Definition |
|---|---|---|---|
| 1. Setting and infrastructure | Implementation and operation [26,27,28] | B11,1: proportion of open space area/population | SI1: proportion of open space per campus population |
| B11,2: proportion of water absorption area | SI2: proportion of campus area used as water absorption area | ||
| B11,3: proportion of total budget used as sustainability budget | SI3: percentage of university budget for sustainable development | ||
| 2. Energy and climate change | Implementation and operation [26,27,28] | B21,1: proportion of usage of energy-saving devices | EC1: (continuous total number of No. 5 electrical equipment/total number of electrical equipment)*100 |
| B21,2: the ratio of total electricity consumption to campus population | EC2: electric energy used per year/population | ||
| B21,3: proportion of renewable energy produced to energy consumption | EC3: (electric energy produced per year/total electrical energy used)*100 | ||
| B21,4: carbon footprint per capita | EC4: carbon emissions in 1 year/population | ||
| 3. Waste managemen | Environmental impact [29,30,31] | B31,1: proportion of reduction in the use of paper and plastic on campus | WS1: (total paper and plastic reduction per year/total paper and plastic consumption)*100 |
| B31,2: proportion of the amount of waste within the university to be recycled | WS2: (amount of recycled waste per year/total amount of waste)*100 | ||
| B31,3: amount of waste per person per day | WS3: total amount of waste per day/population | ||
| 4. Water management | Environmental impact [29,30,31] | B41,1: proportion of the amount of water that can be reduced by water conservation projects | WR1: (total water reduction per year/total water conservation projects per year)*100 |
| B41,2: proportion of wastewater reuse | WR2: (amount of wastewater recycled per year/total wastewater per year)*100 | ||
| B41,3: total water consumption per year/population | WR3: amount of water consumption within the university | ||
| 5. Transportation | Environmental impact [29,30,31] | B51,1: proportion of reduction in the number of private cars on campus | TR1: (total number of private cars reduced per year/total number of private cars per year)*100. |
| B51,2: proportion of electric car users on campus | TR2: (total number of electric cars per year/total number of private cars per year)*100 | ||
| B51,3: proportion of parking space to total university area | TR3: (total parking area per year/total number of private cars per year)*100. | ||
| 6. Education | B61,1: the ratio of sustainability courses to all courses/curricula | ED1: (sustainability courses/all courses)*100 | |
| B61,2: proportion of sustainability research funding to total research funding | ED2: (sustainability research grants/total research grants)*100 | ||
| B61,3: proportion of articles published on sustainability (previous 3 years) | ED3: (published articles on sustainability (in previous 3 years)/total published articles (previous 3 years))*100 | ||
| B61,4: proportion of sustainability activities (previous 3 years) | ED4: (sustainability activities (previous 3 years)/total activities (previous 3 years))*100 | ||
| B61,5: proportion of sustainability courses/total subjects | ED5: (sustainability course/all subjects)*100 | ||
| 7. Indoor air quality | Implementation and operation [28,32,33] | B71,1: temperature | IAQ 1: temperature measurement position of 24–26 degrees |
| B71,2: relative humidity | IAQ2: relative humidity measurement position of 50–65% | ||
| B71,3: carbon dioxide (CO2) | IAQ3: measurement location for CO2 not exceeding 1000 ppm | ||
| B71,4: particulate matter with diameter less than 2.5 micrometers (PM2.5) | IAQ4: PM measurement location not exceeding 2.5 (24-hour average) | ||
| B71,5: particulate matter with diameter less than 10 micrometers (PM10) | IAQ5: PM measurement location not exceeding 10 (average over 24 hours) | ||
| B71,6: total volatile organic compounds (TVOCs) | IAQ6: TVOC measurement position not exceeding 1000 ppb |
| Aspect | Statistics | Aspect | Statistics |
|---|---|---|---|
| AHP Model | Weight | AHP Model | Weight |
| W1: setting and infrastructure | 0.20 | ||
| W2: energy and climate change | 0.20 | ||
| W3: waste management | 0.20 | ||
| W4: water management | 0.08 | ||
| W5: transportation | 0.10 | ||
| W6: education | 0.10 | ||
| W7: indoor air quality | 0.12 | ||
| Average eigenvalue (λ) | 7.17 | ||
| Consistency ratio (CR) | 0.03 | ||
| Setting and infrastructure aspect | Weight | Energy and climate change aspect | Weight |
| B11,1: proportion of open space area/population | 0.40 | B21,1: proportion of usage of energy-saving devices | 0.15 |
| B11,2: proportion of water absorption area | 0.40 | B21,2: the ratio of total electricity consumption to campus population | 0.15 |
| B11,3: proportion of total budget used as sustainability budget | 0.30 | B21,3: proportion of renewable energy produced to energy consumption | 0.35 |
| Average eigenvalue (λ) | 3.10 | B21,4: carbon footprint per capita | 0.35 |
| Consistency ratio (CR) | 0.05 | Average eigenvalue (λ) | 4.25 |
| Consistency ratio (CR) | 0.08 | ||
| Waste management aspect | Weight | Water management aspect | Weight |
| B31,1: proportion of reduction in the use of paper and plastic on campus | 0.30 | B41,1: proportion of amount of water that can be reduced by water conservation projects | 030 |
| B31,2: proportion of the amount of waste within the university to be recycled | 0.30 | B41,2: proportion of wastewater reuse | 0.30 |
| B31,3: amount of waste per person per day | 0.40 | B41,3: total water consumption per year/population | 0.40 |
| Average eigenvalue (λ) | 3.59 | Average eigenvalue (λ) | 4.44 |
| Consistency ratio (CR) | 0.25 | Consistency ratio (CR) | 0.46 |
| Transportation aspect | Weight | Education aspect | Weight |
| B51,1: proportion of reduction in the number of private cars on campus | 0.30 | B61,1:the ratio of sustainability courses to all courses/curricula | 0.20 |
| B51,2: proportion of electric car users on campus | 0.30 | B61,2: proportion of sustainability research funding to total research funding | 0.20 |
| B51,3: proportion of parking space to total university area | 0.40 | B61,3: proportion of articles published on sustainability (previous 3 years) | 0.20 |
| Average eigenvalue(λ) | 5.77 | B61,4: proportion of sustainability activities (previous 3 years) | 0.20 |
| Consistency ratio (CR) | 0.64 | B61,5: proportion of sustainability courses/total subjects | 0.20 |
| Average Eigenvalue (λ) | 5.22 | ||
| Consistency ratio (CR) | 0.05 | ||
| Indoor air quality aspect | Weight | ||
| B71,1: temperature | 0.15 | ||
| B71,2: relative humidity | 0.15 | ||
| B71,3: carbon dioxide (CO2) | 0.15 | ||
| B71,4: particulate matter with diameter less than 2.5 micrometers (PM2.5) | 0.20 | ||
| B71,5: particulate matter with diameter less than 10 micrometers (PM10) | 0.20 | ||
| B71,6: total volatile organic compounds (TVOCs) | 0.15 | ||
| Average eigenvalue (λ) | 6.37 | ||
| Consistency ratio (CR) | 0.07 |
Disclaimer/Publisher’s Note: The statements, opinions and data contained in all publications are solely those of the individual author(s) and contributor(s) and not of MDPI and/or the editor(s). MDPI and/or the editor(s) disclaim responsibility for any injury to people or property resulting from any ideas, methods, instructions or products referred to in the content. |
© 2024 by the authors. Licensee MDPI, Basel, Switzerland. This article is an open access article distributed under the terms and conditions of the Creative Commons Attribution (CC BY) license (https://creativecommons.org/licenses/by/4.0/).
Share and Cite
Aregarot, P.; Kubaha, K.; Chiarakorn, S. A Study of Sustainability Concepts for Developing Green Universities in Thailand. Sustainability 2024, 16, 2892. https://doi.org/10.3390/su16072892
Aregarot P, Kubaha K, Chiarakorn S. A Study of Sustainability Concepts for Developing Green Universities in Thailand. Sustainability. 2024; 16(7):2892. https://doi.org/10.3390/su16072892
Chicago/Turabian StyleAregarot, Preecha, Kuskana Kubaha, and Siriluk Chiarakorn. 2024. "A Study of Sustainability Concepts for Developing Green Universities in Thailand" Sustainability 16, no. 7: 2892. https://doi.org/10.3390/su16072892
APA StyleAregarot, P., Kubaha, K., & Chiarakorn, S. (2024). A Study of Sustainability Concepts for Developing Green Universities in Thailand. Sustainability, 16(7), 2892. https://doi.org/10.3390/su16072892