


A Science and Community-Driven Approach to Illustrating Urban Adaptation to Coastal Flooding to Inform Management Plans

Abstract
1. Introduction
2. Materials and Methods
- Survey and summarize existing standards, guides, and precedent projects with flood adaptation strategies that may be viable in Waikīkī.
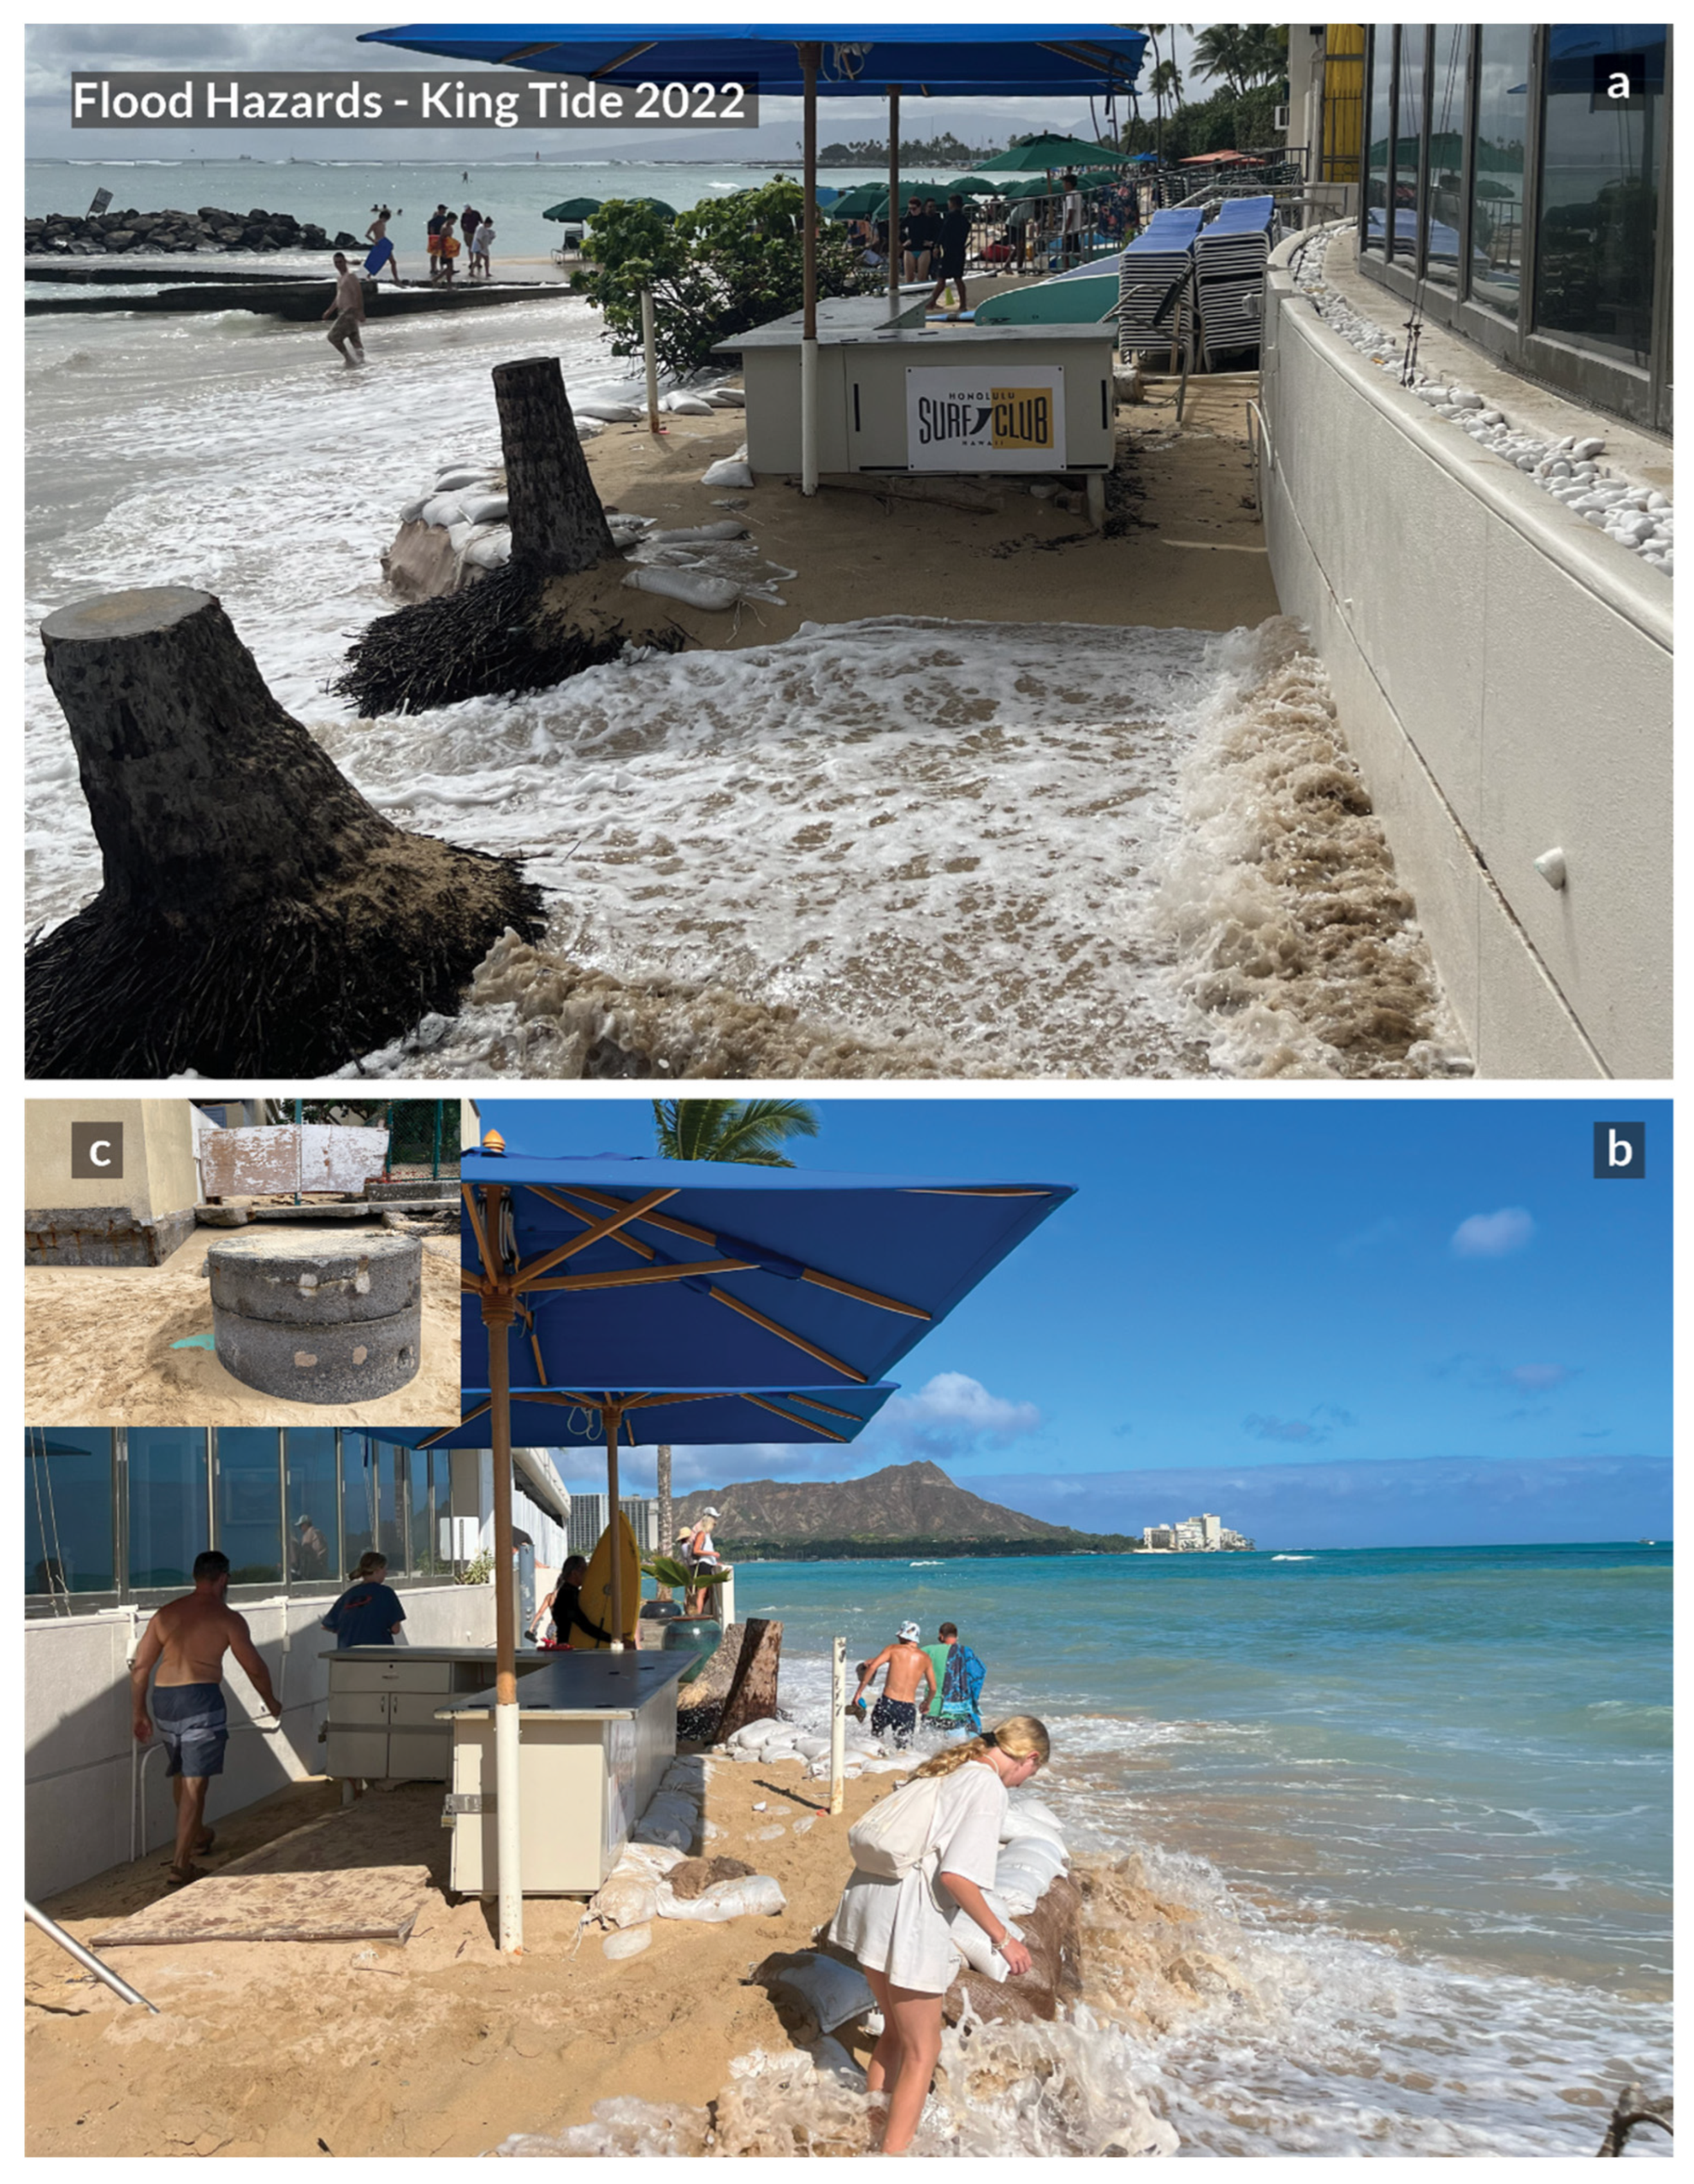
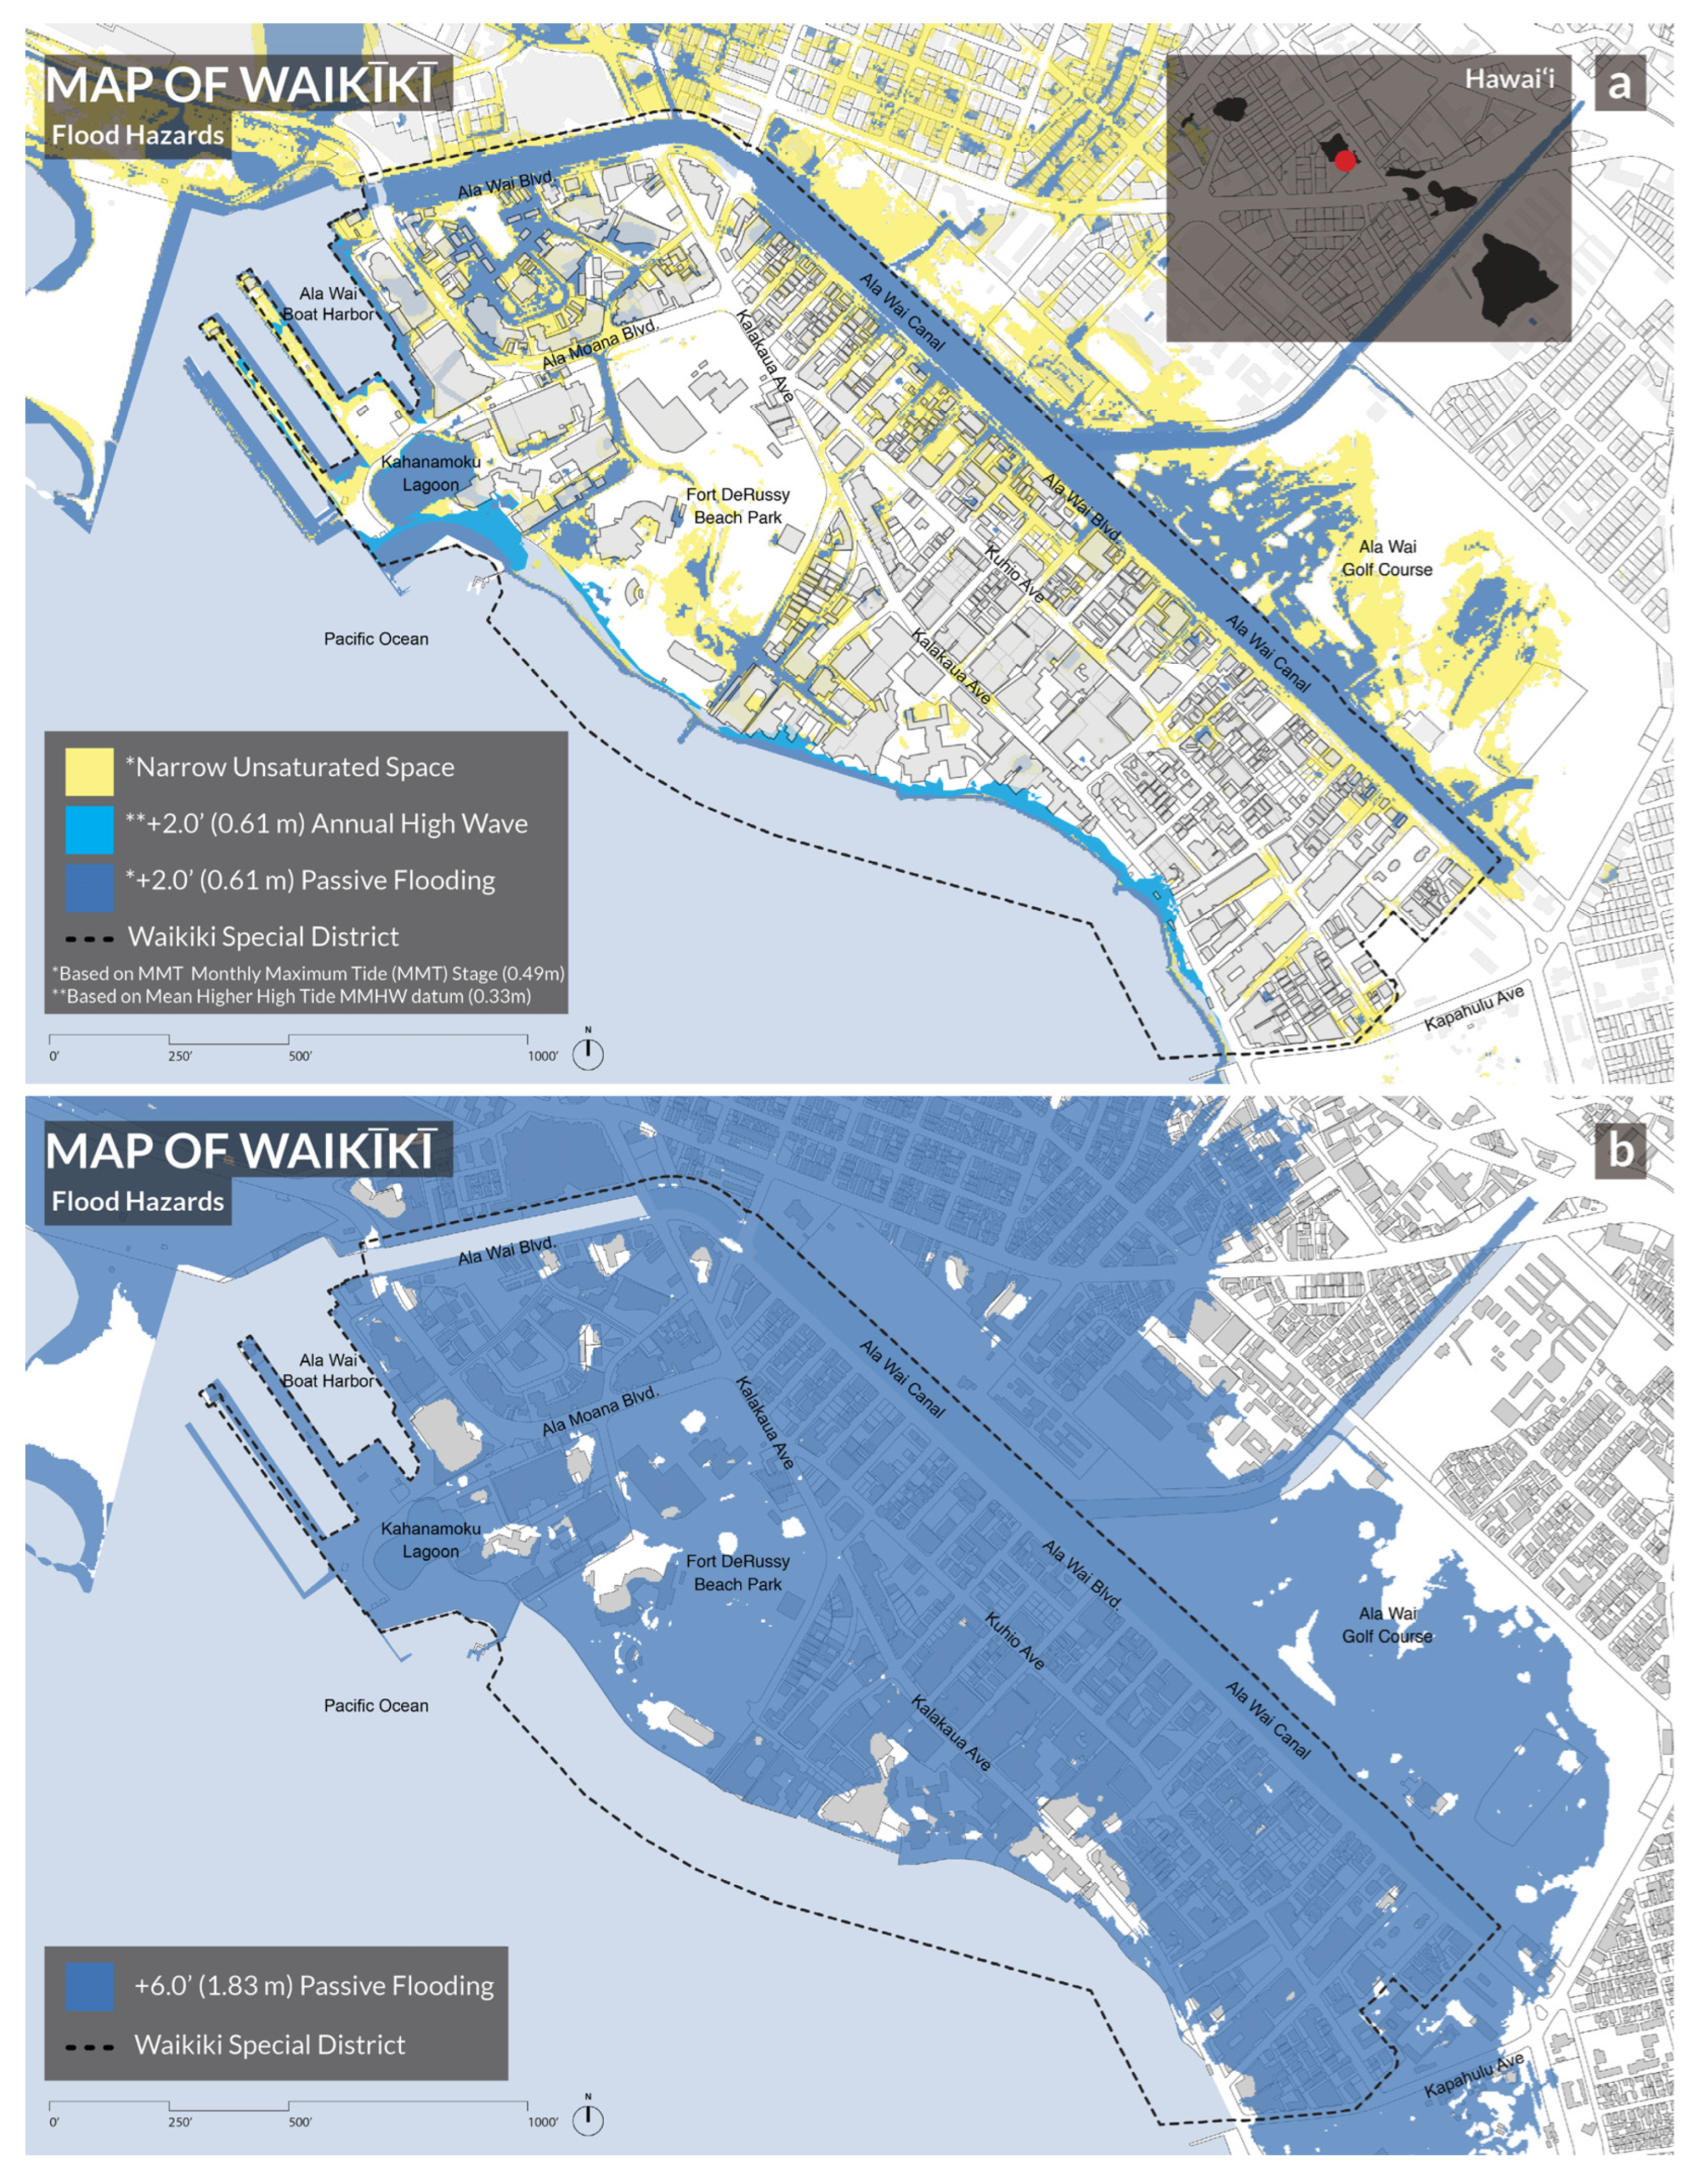
- Identify episodic and chronic flood hazards in 2050 and 2100.
- Visit sites and analyze site-specific potential sea level rise adaptation strategies for buildings, open space, transportation, and utilities.
- Produce conceptual 3D architectural renderings incorporating flood adaptation strategies utilizing newly proposed sea level rise-adjusted design flood elevations.
- Present and discuss potential adaptation strategies in a public webinar between academia, community, and government.
- Summarize and share public feedback.
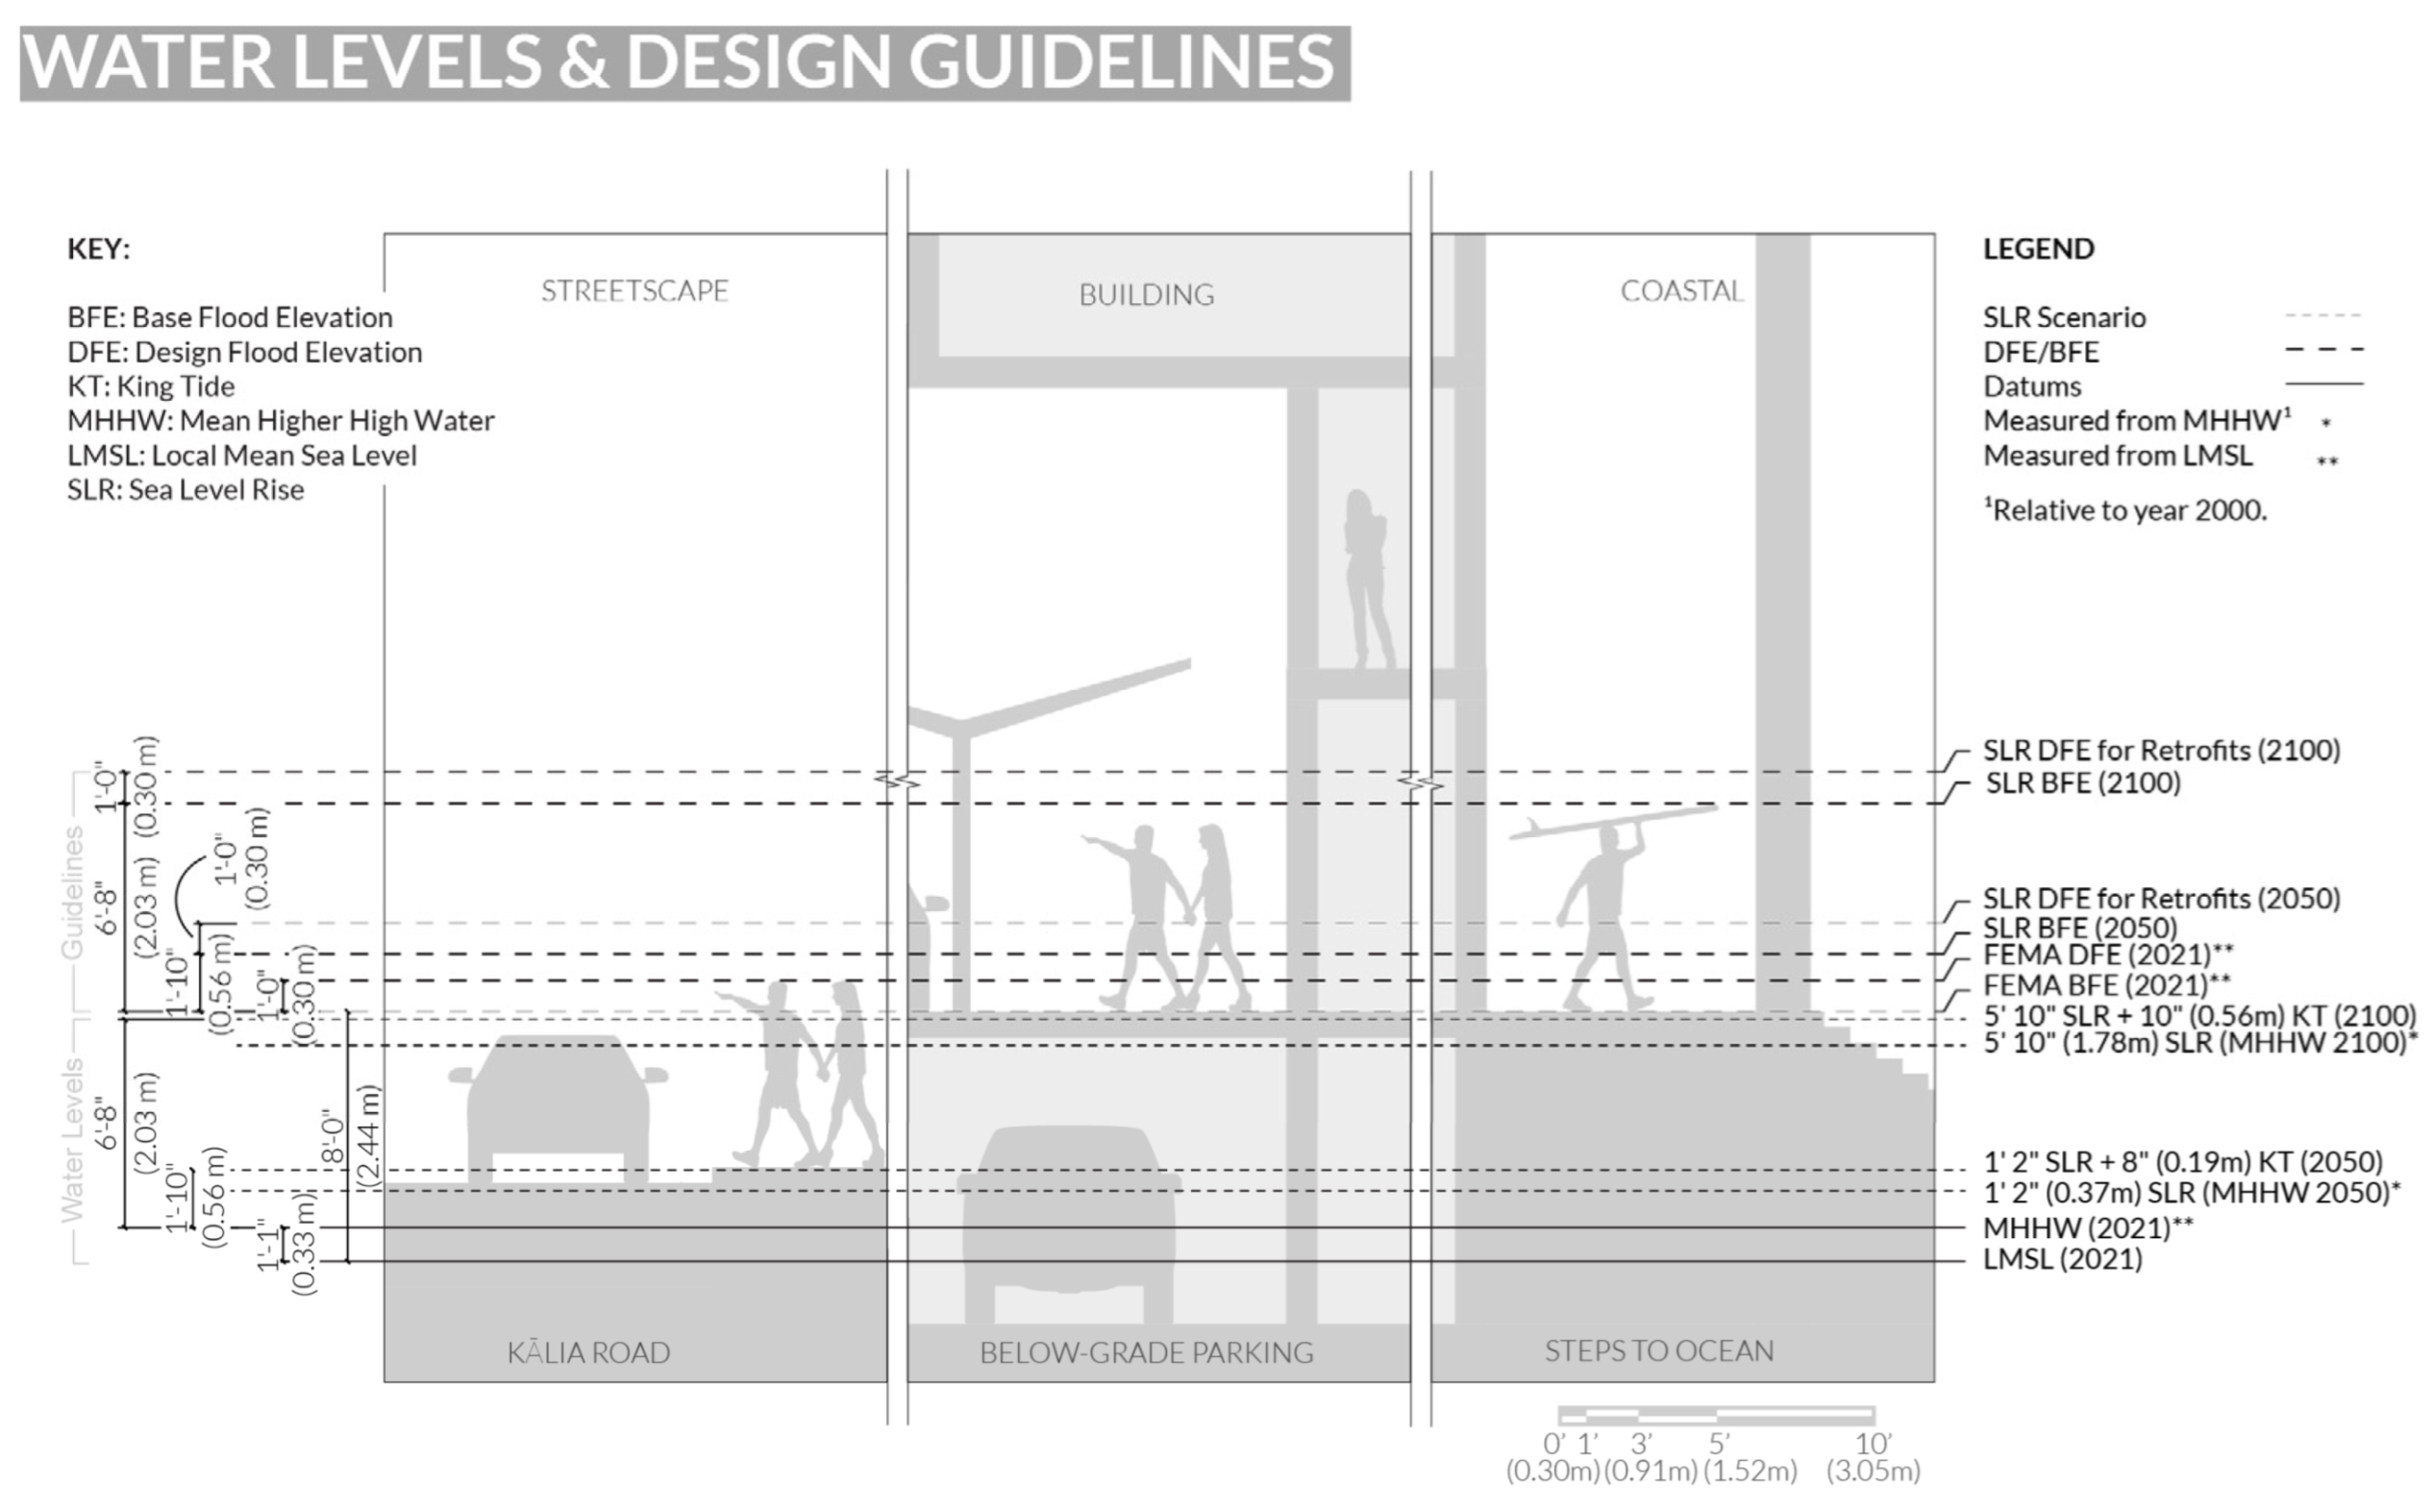
2.1. Development of SLR-DFE
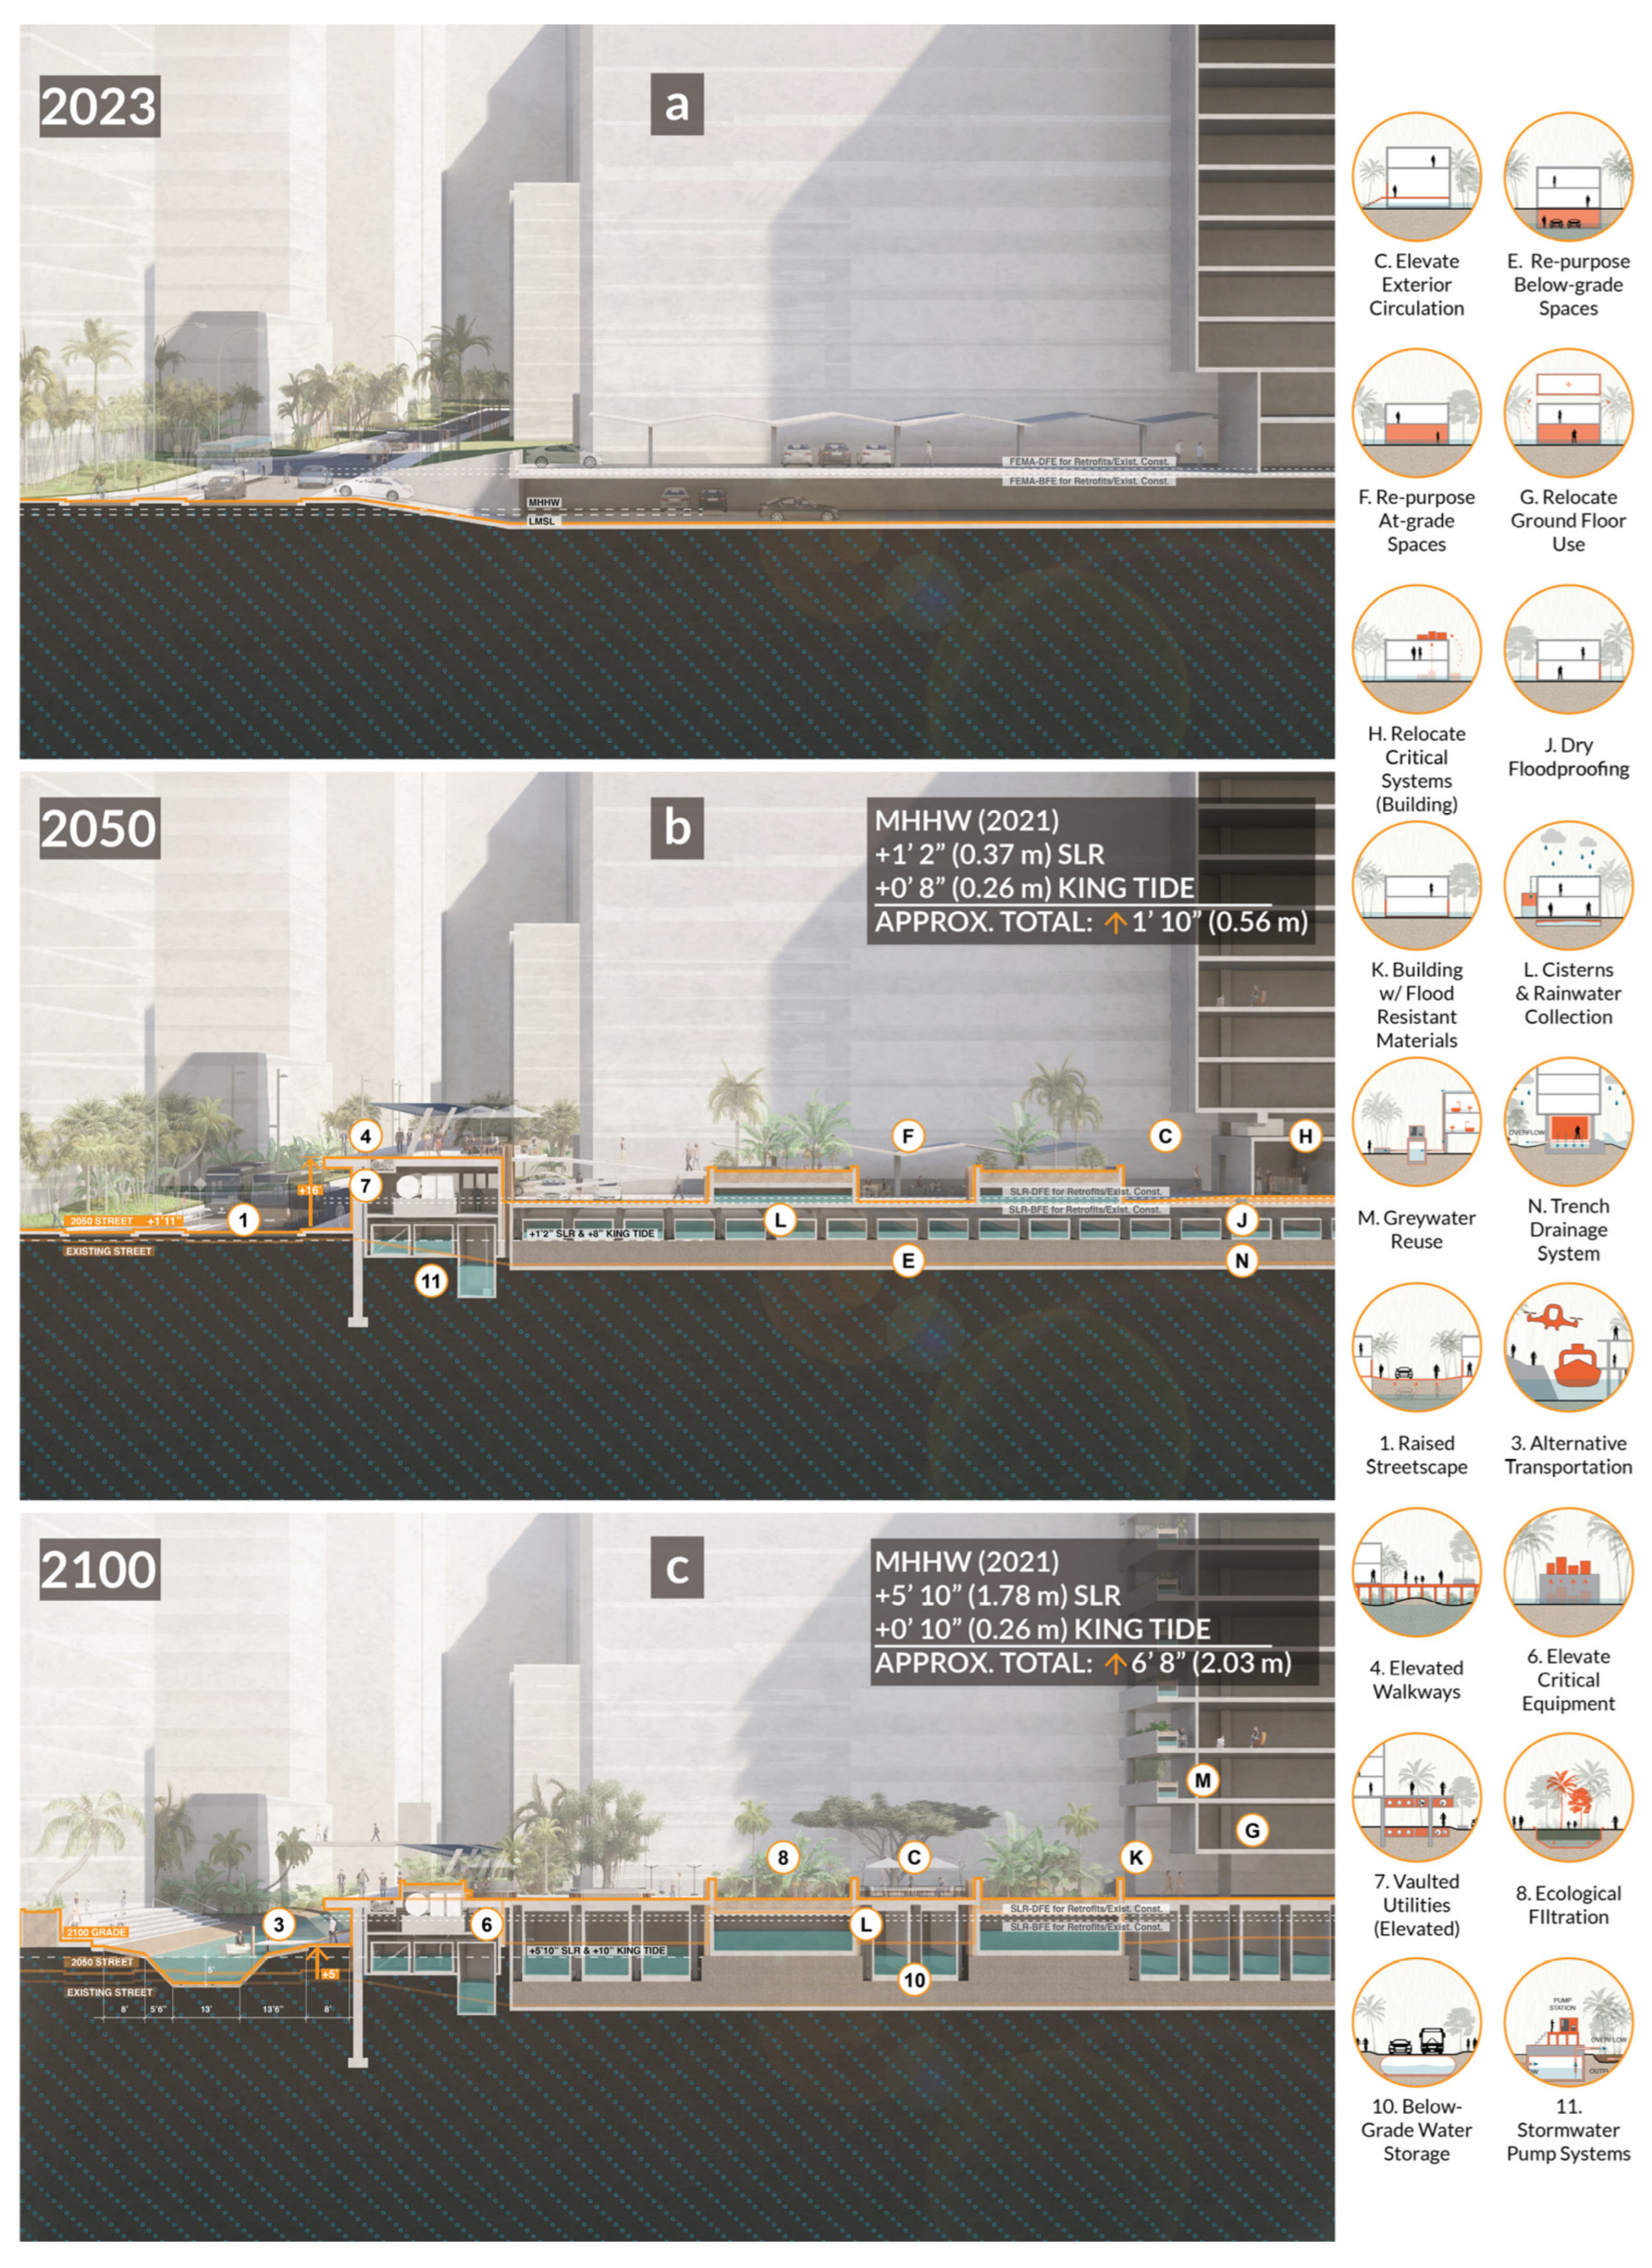
2.2. Rendering Site-Specific Adaptation Strategies
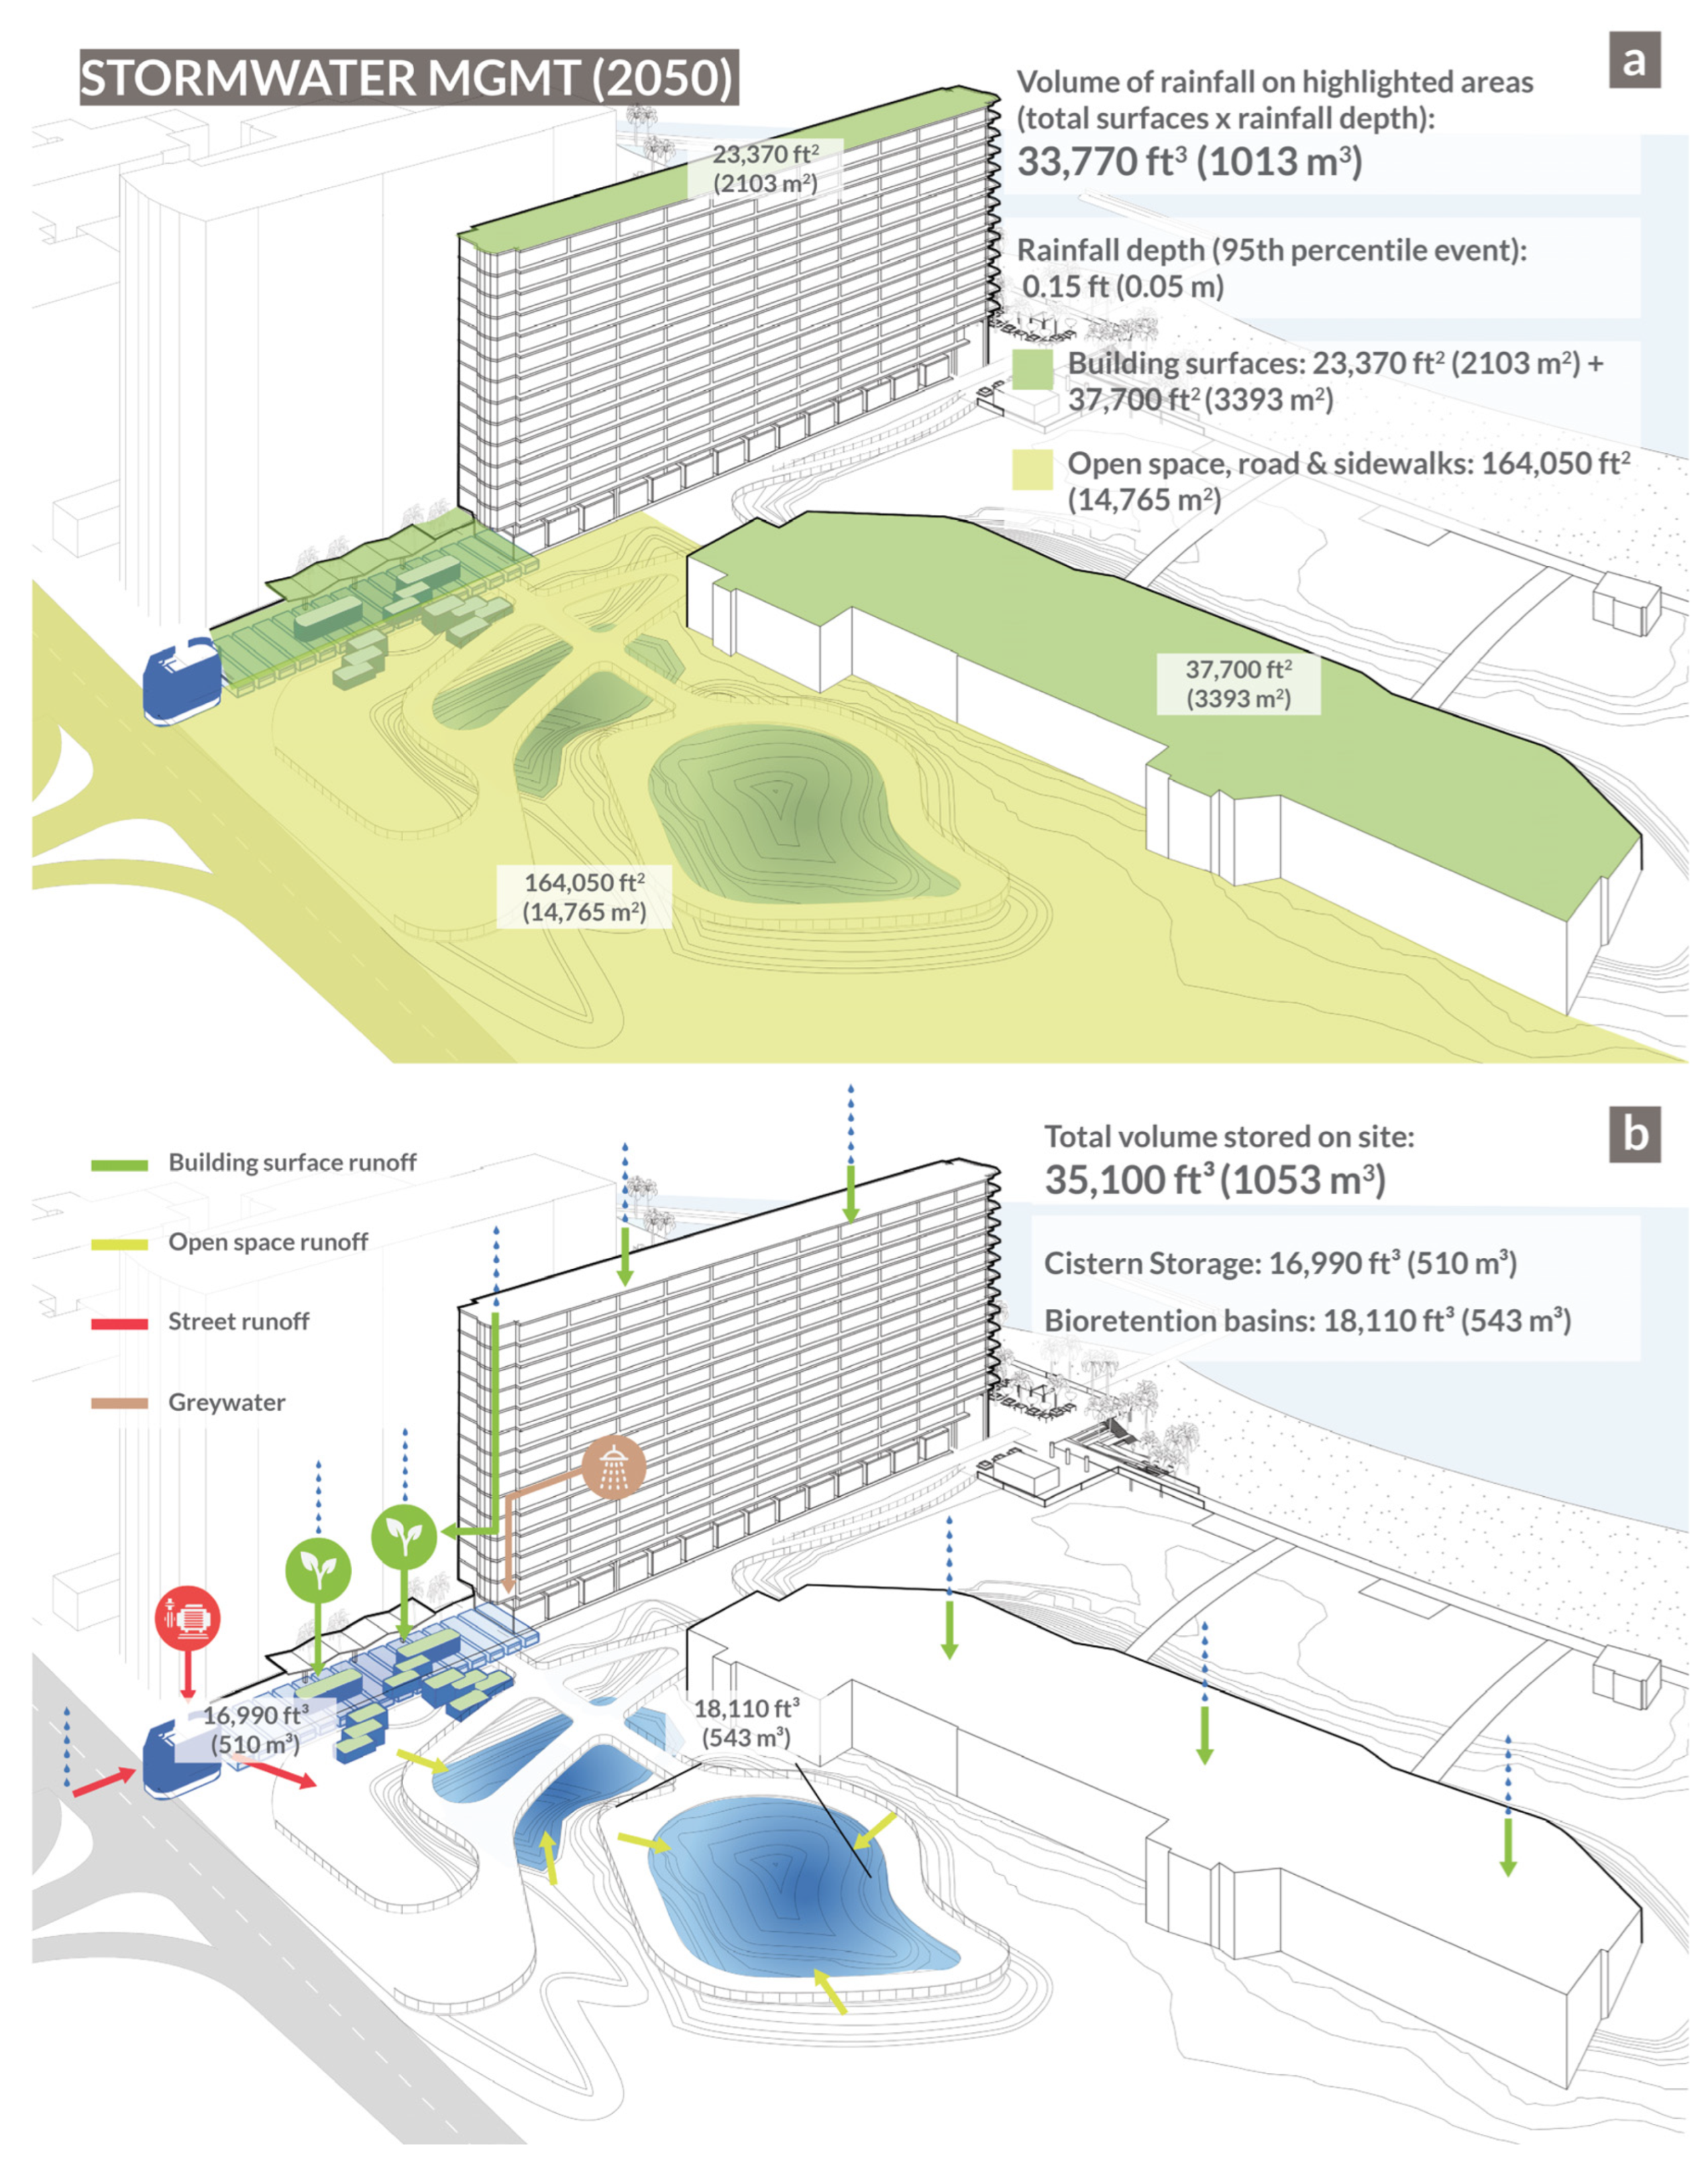
On-Site Stormwater Retention
2.3. Public Outreach and Survey
3. Results
3.1. Development of SLR-DFE
3.2. Rendering Site-Specific Adaptation Strategies
3.2.1. Building and Street
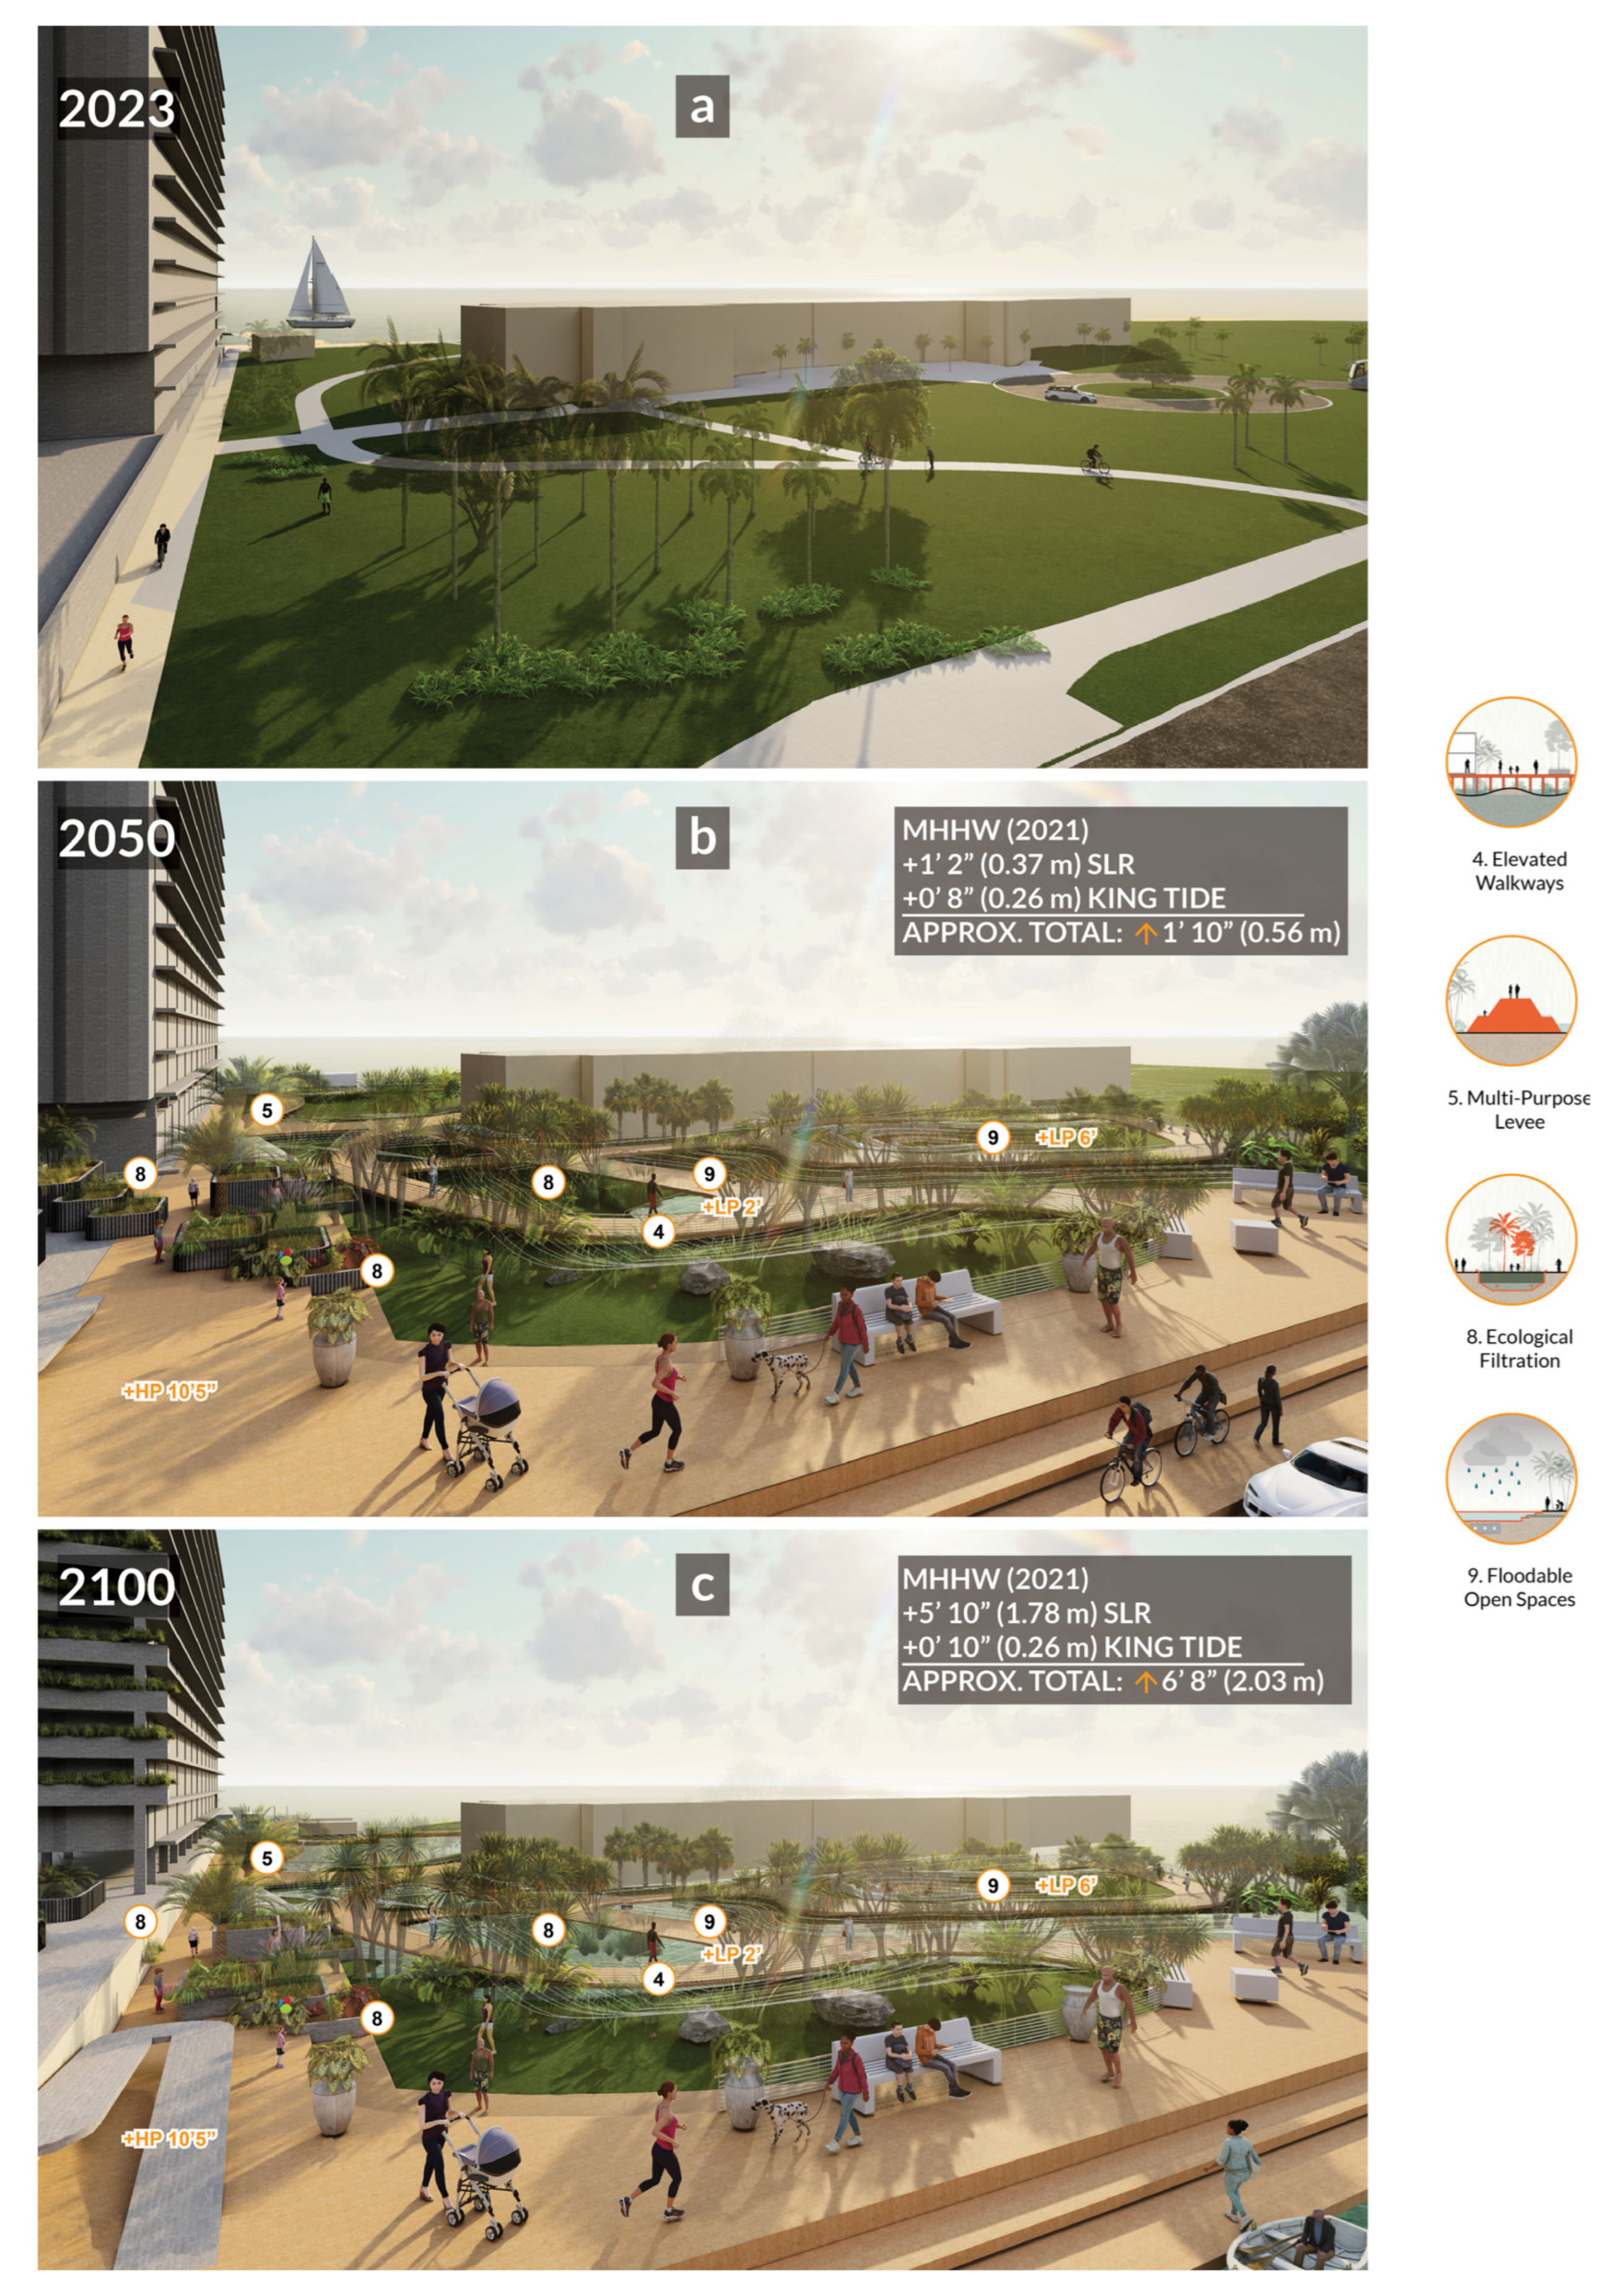
3.2.2. Open Space
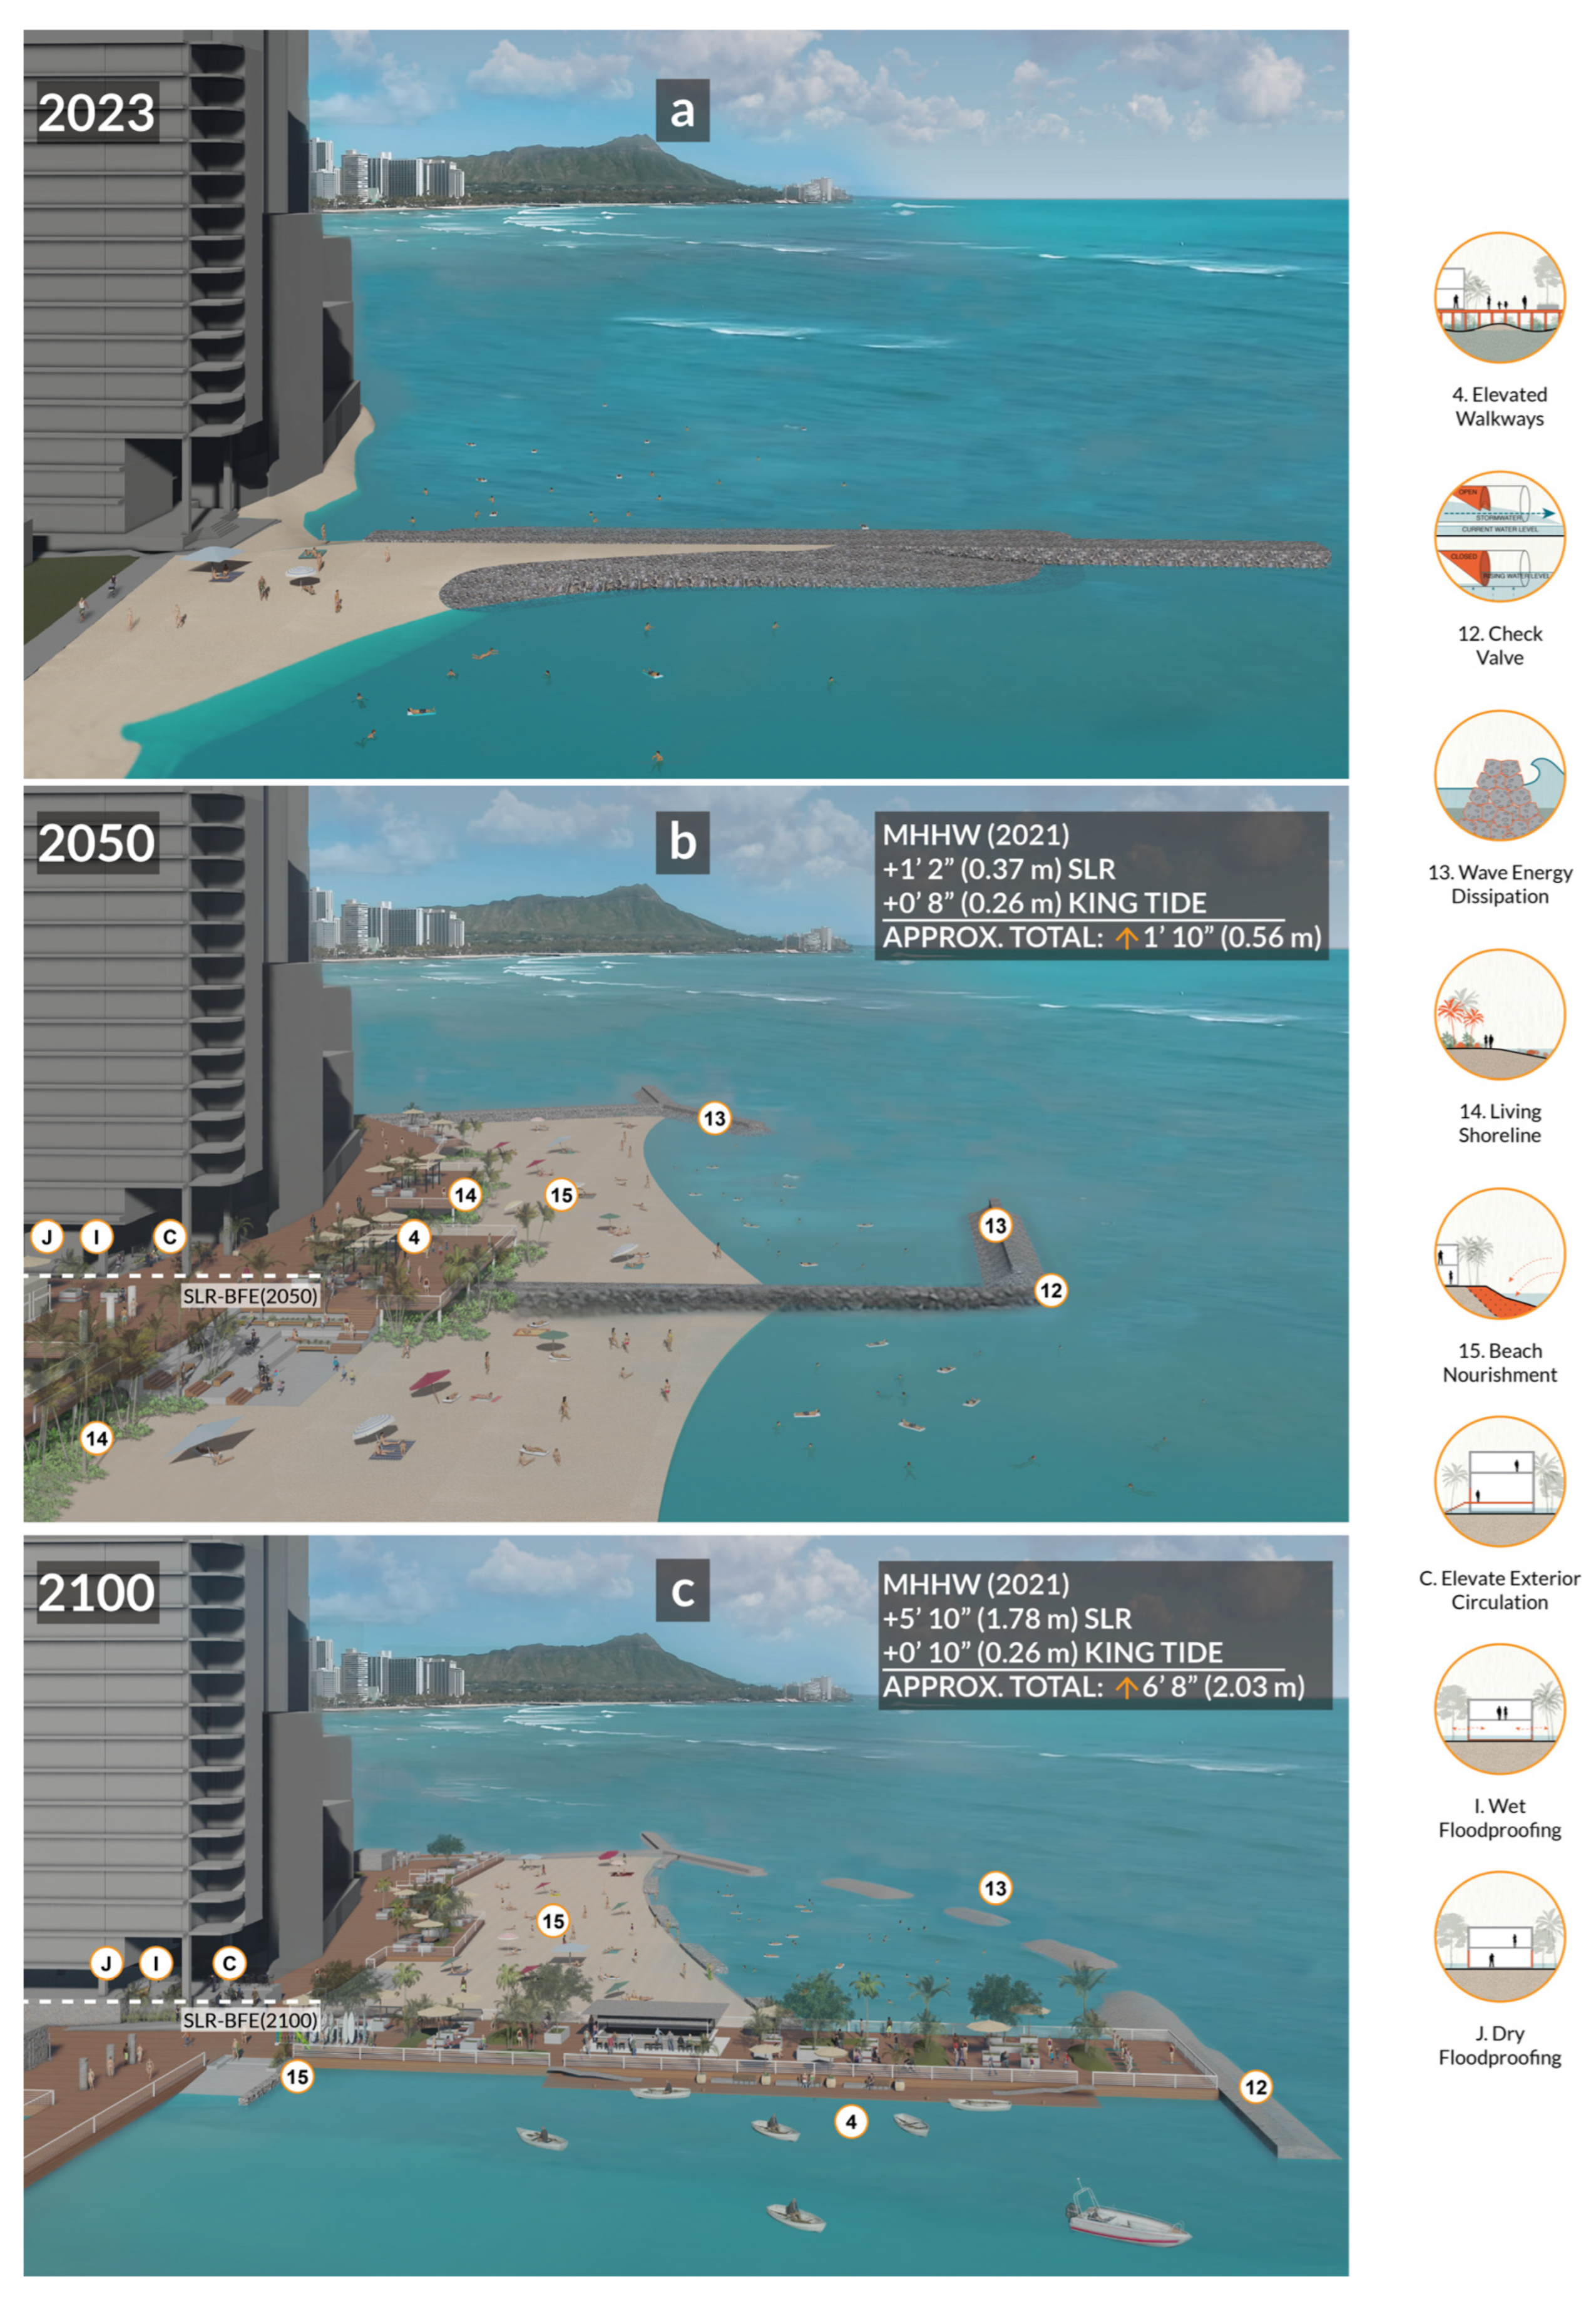
3.2.3. Coastal
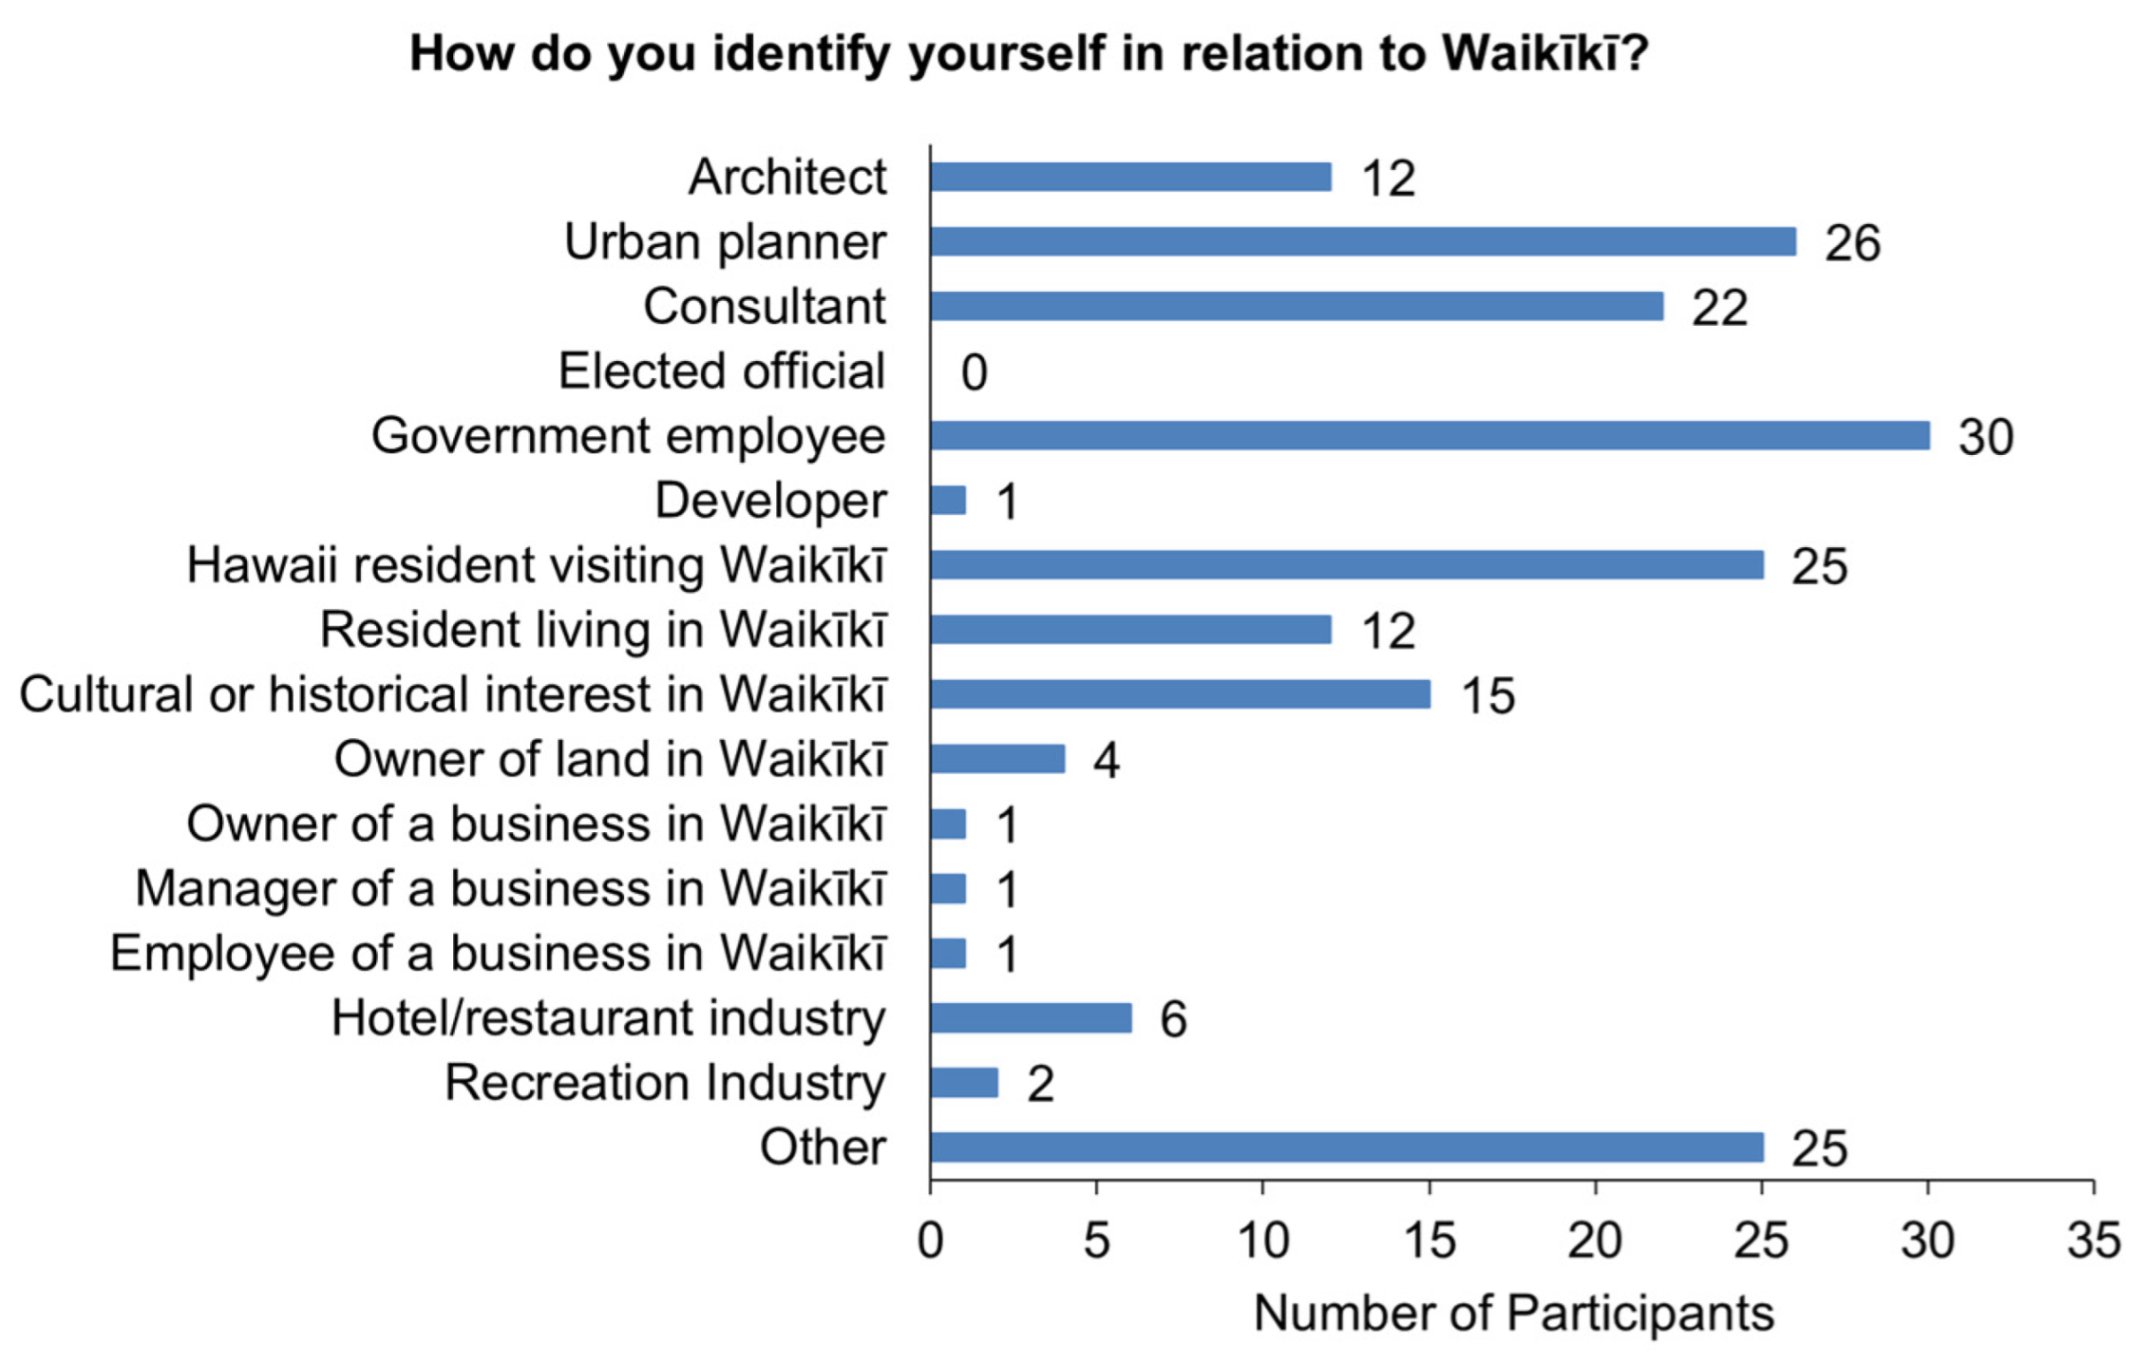
3.3. Public Outreach and Survey
4. Discussion
Author Contributions
Funding
Institutional Review Board Statement
Informed Consent Statement
Data Availability Statement
Acknowledgments
Conflicts of Interest
References
- Honolulu Police Department, 2024. District 6: Waikīkī. Available online: https://www.honolulupd.org/d6/ (accessed on 30 December 2023).
- Waikīkī Beach Special Improvement Association. Background. Available online: https://www.wbsida.org/background (accessed on 30 January 2023).
- Habel, S.; Fletcher, C.H.; Rotzoll, K.; El-Kadi, A.I. Development of a model to simulate groundwater inundation induced by sea-level rise and high tides in Honolulu, Hawaii. Water Res. 2017, 114, 122–134. [Google Scholar] [CrossRef] [PubMed]
- Habel, S.; Fletcher, C.H.; Anderson, T.R.; Thompson, P.R. Sea-Level Rise Induced Multi-Mechanism Flooding and Contribution to Urban Infrastructure Failure. Sci. Rep. 2020, 10, 3796. [Google Scholar] [CrossRef] [PubMed]
- McKenzie, T.; Habel, S.; Dulai, H. Increased Coastal Pollution Expected Under Future Sea Level Stands: Chemical Evidence for Tidal Groundwater Inundation of Coastal Wastewater Infrastructure. In Proceedings of the Geological Society of America (GSA) Annual Meeting, Phoenix, AZ, USA, 22–25 September 2019. [Google Scholar]
- Hawai‘i Department of Land and Natural Resources (DLNR). Draft Programmatic Environmental Impact Statement: Waikīkī Beach Improvement And Maintenance Program. 2021. Available online: https://files.hawaii.gov/dbedt/erp/Doc_Library/2021-06-08-OA-DEIS-Waikiki-Beach-Improvement-and-Maintenance-Program.pdf (accessed on 30 November 2023).
- City and County of Honolulu (CCH) Office of Climate Change, Sustainability and Resiliency. Climate Ready Oʻahu. 2023. Available online: https://www.climatereadyoahu.org/ (accessed on 30 November 2023).
- Hawai‘i State Office of Planning, Coastal Zone Management Program. Assessing the Feasibility and Implications of Managed Retreat Strategies for Vulnerable Coastal Areas in Hawai‘i: Final Report. 2019. Available online: https://files.hawaii.gov/dbedt/op/czm/ormp/assessing_the_feasibility_and_implications_of_managed_retreat_strategies_for_vulnerable_coastal_areas_in_hawaii.pdf (accessed on 28 November 2023).
- Association of Collegiate Schools of Architecture (ACSA). ACSA White Paper on Accessing the Quality of Architectural Research & Scholarship. 2019. Association of Collegiate Schools of Architecture. Available online: https://www.acsa-arch.org/wp-content/uploads/2019/08/2019-qualityarchitecturalresearch-whitepaper-workingdoc.pdf (accessed on 28 November 2023).
- Morris, J.C.; McNamara, M.W.; Belcher, A. Building Resilience Through Collaboration Between Grassroots Citizen Groups and Governments: Two Case Studies. Public Work. Manag. Policy 2019, 24, 50–62. [Google Scholar] [CrossRef]
- Washington State Department of Ecology. Lessons Learned from Local Governments Incorporating Sea Level Rise in Shoreline Master Programs. 2021. Available online: https://apps.ecology.wa.gov/publications/documents/2106014.pdf (accessed on 30 November 2023).
- University of Hawai‘i at Mānoa Team. Presentation of Site-Specific Application of Flood Adaptation Strategies for Waikīkī, Hawai‘i. (Stakeholder Report); University of Hawai‘i at Mānoa Team: Honolulu, HI, USA, 2023; Available online: https://seagrant.soest.hawaii.edu/meguro-adapting-waikiki/ (accessed on 30 November 2023).
- Birch, T.; Carney, J. Delta Urbanism: Aligning Adaptation with the Protection and Restoration Paradigm in Coastal Louisiana. Technol. Archit. Des. 2019, 3, 102–114. [Google Scholar] [CrossRef]
- Southeast Climate Adaptation Science Center. 2020. Building Adaptive Capacity in a Coastal Region Experiencing Global Change. NC State University. Available online: https://secasc.ncsu.edu/2020/05/20/building-adaptive-capacity-in-a-coastal-region-experiencing-global-change/ (accessed on 26 February 2024).
- CCH Department of Planning and Permitting (DPP). Waikiki Special District Guidelines. 2021. Available online: https://www.honolulu.gov/rep/site/dpp/dpp_docs/waikiki-special-district-guidebook.pdf (accessed on 30 November 2023).
- Bauer, I. Waikiki climate change study underway, city says. Honolulu Star Advertiser, 30 October 2023. [Google Scholar]
- Addabbo, N.; Clemente, M.F.; Quesada-Ganuza, L.; Abdel Khalek, R.; Labattaglia, F.; Nocerino, G.; Prall, M.; Ruggiero, A.; Stoffels, S.; Tersigni, E.; et al. A Framework for Climate Resilient Urban Design: The Case of Porte de Montreuil, Paris. Sustainability 2023, 15, 13857. [Google Scholar] [CrossRef]
- American Institute of Architects. Resilient Project Process Guide. 2022. Available online: https://www.aia.org/resource-center/aia-resilient-project-process-guide (accessed on 30 November 2023).
- Richmond, L.; Anderson, J.; Archibald, J.; Brown, A.; Cashman, E.; Cashman, E.; Chang, J.; De Smet, C.; Everett, Y.; Graham, J.; et al. Transformative Sea-level Rise Research and Planning: Establishing a University, Tribal, and Community Partnership for a Resilient California North Coast. Humboldt J. Soc. Relat. 2023, 1, 67–93. [Google Scholar] [CrossRef]
- Hawai‘i Climate Change Mitigation and Adaptation Commission. State of Hawai‘i Sea Level Rise Viewer. 2021. Version 1.12. Prepared by the Pacific Islands Ocean Observing System (PacIOOS) for the University of Hawai’‘i Sea Grant College Program and the State of Hawai’i Department of Land and Natural Resources, Office of Conservation and Coastal Lands, with Funding from National Oceanic and Atmospheric Administration Office for Coastal Management Award No. NA16NOS4730016 and under the State of Hawai’i Department of Land and Natural Resources Contract No. 64064. Available online: http://hawaiisealevelriseviewer.org (accessed on 30 November 2023).
- Honolulu Land Information System (HoLIS). Available online: https://www.honolulugis.org/ (accessed on 11 November 2022).
- CCH Real Property Assessment Division. Parcel number: 260040120000. 2014. Available online: https://qpublic.schneidercorp.com/Application.aspx?AppID=1045&LayerID=23342&PageTypeID=4&PageID=9746&KeyValue=260040120000 (accessed on 28 November 2023).
- Hawai‘i Department of Land and Natural Resources (DLNR). Flood Hazard Assessment Tool. 2022. Available online: http://gis.hawaiinfip.org/FHAT/ (accessed on 28 July 2022).
- Simmons, E. New Flood Maps for Hawai‘i! What Are the Differences? June 2022. State of Hawai‘i: Wai Halana. Available online: https://waihalana.hawaii.gov/2022/06/09/new-flood-maps-for-hawaii-what-are-the-differences/ (accessed on 21 November 2023).
- Federal Emergency Management Agency (FEMA). Zone AE. 2023. Available online: https://www.fema.gov/glossary/zone-ae (accessed on 24 September 2022).
- FEMA. Designing for Flood Levels above the Minimum Required Elevation after Hurricane Ian. 2023. Available online: https://www.fema.gov/sites/default/files/documents/fema_mat-hurricane-ian-recovery-advisory-1.pdf (accessed on 28 November 2023).
- FEMA. Flood Insurance. Available online: https://www.fema.gov/flood-insurance (accessed on 28 September 2022).
- FEMA. Freeboard. Available online: https://www.fema.gov/glossary/freeboard (accessed on 25 July 2022).
- FEMA Flood Insurance Rate Map. Map Number 15003C0368G. 2011. FEMA Flood Map Service Center: FIRMette Web. Available online: https://map1.msc.fema.gov/firm?id=15003C0368G (accessed on 28 July 2022).
- CCH DPP. Climate Adaptation Design Principles for Urban Development. December 2020. Available online: https://www.honolulu.gov/rep/site/dpptod/climate_docs/Climate_Adaptation_Design_Principles.pdf (accessed on 26 November 2023).
- Hawai‘i State Building Code (2012 International Building Code). 2018. Available online: https://ags.hawaii.gov/wp-content/uploads/2012/09/buildingcode-20170918.pdf (accessed on 26 November 2023).
- Sweet, W.V.; Hamlington, B.D.; Kopp, R.E.; Weaver, C.P.; Barnard, P.L.; Bekaert, D.; Brooks, W.; Craghan, M.; Dusek, G.; Frederikse, T.; et al. Global and Regional Sea Level Rise Scenarios for the United States: Updated Mean Projections and Extreme Water Level Probabilities along U.S. Coastlines. NOAA Technical Report NOS 01. 2022. National Oceanic and Atmospheric Administration, National Ocean Service, Silver Spring, MD, 111. Available online: https://oceanservice.noaa.gov/hazards/sealevelrise/noaa-nostechrpt01-global-regional-SLR-scenarios-US.pdf (accessed on 28 September 2022).
- CCH Climate Change Commission. Sea Level Rise II—Guidance Document. July 2022. Available online: https://static1.squarespace.com/static/5e3885654a153a6ef84e6c9c/t/62f46b3fff589f651af14410/1660185409937/HonoluluClimateChangeCommission-SeaLevelRiseGuidance_Updated-July2022.pdf (accessed on 28 September 2022).
- Boston Planning and Development Agency. Coastal Flood Resilience Design Guidelines. 2019. Available online: https://www.bostonplans.org/getattachment/d1114318-1b95-487c-bc36-682f8594e8b2 (accessed on 19 April 2022).
- Boston Planning & Development Agency. Article 25A. 2021. Available online: https://library.municode.com/ma/boston/codes/redevelopment_authority?nodeId=ART25ACOFLREOVDI (accessed on 28 October 2023).
- Glaas, E.; Ballantyne, A.G.; Neset, T.S.; Linnér, B.O. Visualization for supporting individual climate change adaptation planning: Assessment of a web-based tool. Landsc. Urban Plan. 2017, 158, 1–11. [Google Scholar] [CrossRef]
- Hawaii Statewide GIS. Available online: https://geoportal.hawaii.gov/ (accessed on 16 April 2022).
- University of Hawai‘i Coastal Geology Group and Tetra Tech, Inc. Sea Level Rise—Annual High Wave Flooding & Passive Flooding. 2017. Available online: https://planning.hawaii.gov/gis/download-gis-data-expanded/ (accessed on 26 January 2024).
- NOAA Office for Coastal Management (OCM). Sea Level Rise Data: 1-10 ft Sea Level Rise Inundation Extent. Available online: https://www.fisheries.noaa.gov/inport/item/48106 (accessed on 28 June 2022).
- TK Studio. Forest Pavilion. Landezine. 2020. Available online: https://landezine.com/forest-pavilion-by-tk-studio/ (accessed on 28 September 2022).
- Turenscape. Qinhuangdao Beach Restoration: An Ecological Surgery. World Architects. 2008. Available online: https://www.world-architects.com/en/ (accessed on 28 September 2022).
- Scape Studio. Living Breakwaters 2021. Available online: https://www.scapestudio.com/projects/living-breakwaters/ (accessed on 26 September 2022).
- NOAA OCM. Topographic Lidar DEM. 2013. Available online: https://www.fisheries.noaa.gov/inport/item/52020 (accessed on 25 June 2022).
- McNeel. Rhinoceros (Rhino) 3D; Version 6.0; McNeel: Seattle, WA, USA, 2010. [Google Scholar]
- Rhino TerrainTM. 2022. Available online: https://www.rhinoterrain.com/en/rhinoterrain.html (accessed on 25 September 2022).
- Lumion, Version 12.5. 2022. Available online: https://lumion.com/ (accessed on 24 September 2022).
- NOAA Climate Data Online 1992–2022. Station: Honolulu, HI. Available online: https://www.weather.gov/climateservices/nowdatafaq (accessed on 25 January 2023).
- United States Environmental Protection Agency (EPA). Technical Guidance on Implementing Stormwater Runoff Requirements for Federal Projects. 2009. Available online: https://www.epa.gov/sites/default/files/2015-08/documents/epa_swm_guidance.pdf (accessed on 24 May 2023).
- Zoom Video Communications, Inc. Version 5.17.1. Available online: https://zoom.us/ (accessed on 26 November 2023).
- Mentimeter. Version 3.0.0. Available online: https://www.mentimeter.com/ (accessed on 26 November 2023).
- City and County of Honolulu (CCH). The Revised Ordinances of Honolulu, Chapter 21A-1.8 Flood fringe area. March 2021. American Legal Publishing. Available online: https://codelibrary.amlegal.com/codes/honolulu/latest/honolulu/0-0-0-23327. (accessed on 25 March 2022).
- NOAA. NOAA Tides and Currents: Datums for 1612340, Honolulu, HI. Available online: https://tidesandcurrents.noaa.gov/datums.html?datum=MSL&units=0&epoch=0&id=1612340&name=Honolulu&state=HI (accessed on 24 March 2022).
- CCH. CCH Complete Streets Design Manual. 2016. Available online: https://www4.honolulu.gov/docushare/dsweb/Get/Document-187742/160908%20Honolulu%20Complete%20Streets%20Design%20Manual_Final.pdf (accessed on 16 February 2024).
- Florida Department of Economic Opportunity (DEO). Integrating Sea Level Rise Adaptation in Local Mitigation Strategies. 2014. Available online: https://floridadep.gov/sites/default/files/CRI_Integrating_Local_Mitigation_Strategy.pdf (accessed on 28 February 2024).
- CCH. O‘ahu Resilience Strategy. 2019. Available online: https://static1.squarespace.com/static/5e3885654a153a6ef84e6c9c/t/5f10eaf7cb44284ef9c93e4d/1594944287505/Ola_Oahu_Resilience_Strategy.pdf (accessed on 27 February 2024).
- U.S. EPA. Case Studies Analyzing the Economic Benefits of Low Impact Development and Green Infrastructure Programs. 2013. Available online: https://www.epa.gov/sites/default/files/2015-10/documents/lid-gi-programs_report_8-6-13_combined.pdf (accessed on 16 February 2024).


| Stormwater Management Calculations (2050) | |||
|---|---|---|---|
| Total Surface Area (Open Space, Roads, and Sidewalks (Highlighted in Yellow in Figure 6) + Building Surfaces (Highlighted in Green in Figure 6)) | Rainfall Depth (95th Percentile Rain Event) | Volume of Rainfall on Highlighted Areas (Total Surface Areas × Rainfall Depth) | Total Volume Stored on-Site (Cisterns + Bioretention Basin) |
| 20,261 m2 (225,120 ft2) | 0.05 m (0.15 ft) | 1013 m3 (33,770 ft3) | 1053 m3 (35,100 ft³) |
Disclaimer/Publisher’s Note: The statements, opinions and data contained in all publications are solely those of the individual author(s) and contributor(s) and not of MDPI and/or the editor(s). MDPI and/or the editor(s) disclaim responsibility for any injury to people or property resulting from any ideas, methods, instructions or products referred to in the content. |
© 2024 by the authors. Licensee MDPI, Basel, Switzerland. This article is an open access article distributed under the terms and conditions of the Creative Commons Attribution (CC BY) license (https://creativecommons.org/licenses/by/4.0/).
Share and Cite
Meguro, W.; Briones, J.; Failano, G.; Fletcher, C.H. A Science and Community-Driven Approach to Illustrating Urban Adaptation to Coastal Flooding to Inform Management Plans. Sustainability 2024, 16, 2849. https://doi.org/10.3390/su16072849
Meguro W, Briones J, Failano G, Fletcher CH. A Science and Community-Driven Approach to Illustrating Urban Adaptation to Coastal Flooding to Inform Management Plans. Sustainability. 2024; 16(7):2849. https://doi.org/10.3390/su16072849
Chicago/Turabian StyleMeguro, Wendy, Josephine Briones, German Failano, and Charles H. Fletcher. 2024. "A Science and Community-Driven Approach to Illustrating Urban Adaptation to Coastal Flooding to Inform Management Plans" Sustainability 16, no. 7: 2849. https://doi.org/10.3390/su16072849
APA StyleMeguro, W., Briones, J., Failano, G., & Fletcher, C. H. (2024). A Science and Community-Driven Approach to Illustrating Urban Adaptation to Coastal Flooding to Inform Management Plans. Sustainability, 16(7), 2849. https://doi.org/10.3390/su16072849