Article

Can the Synergy of Digitalization and Servitization Boost Carbon-Related Manufacturing Productivity? Evidence from China’s Provincial Panel Data

School of Economics Management, Xi’an University of Posts & Telecommunications, Xi’an 710061, China
*
Author to whom correspondence should be addressed.
Sustainability 2024, 16(7), 2655; https://doi.org/10.3390/su16072655
Submission received: 8 February 2024 / Revised: 18 March 2024 / Accepted: 20 March 2024 / Published: 24 March 2024

Abstract

:
With the goal of carbon peaking and neutrality, carbon productivity has become a means of sustainability in manufacturing, and the impact of the synergy of digitalization and servitization (DSS) on carbon productivity (CP) deserves in-depth study. Based on data with respect to manufacturing in 30 provinces in China from 2013 to 2020, a coupled coordination degree model is used to calculate the degree of manufacturing coordination. A regression effect model is used to explore the intrinsic mechanism of the impact of DSS on CP. The main results show the following: (1) The DSS in manufacturing positively contributes to enhancing CP, and there are non-linear features in both. (2) Technological innovation can contribute to the impact of DSS on CP, as does industry structure, and there is a mediating effect between the two. (3) When economic growth is used as the threshold, DSS and CP reflect a positive “U” relationship. Based on the above findings, policy recommendations are made to promote the sustainable development of manufacturing.

1. Introduction

Serious environmental degradation has accompanied economic development [1]. Economic growth has increased the emission of greenhouse gases [2], of which CO2 is representative, exacerbating harm to the ecosystem. Environmental protection has also become a widespread concern in the world. China has become a large CO2-emitting country due to its rapid economic development and industrialization [3]. China proposes carbon peaking and carbon neutrality targets to realize global environmental protection [4]. In order to steadily achieve this goal, manufacturing in China needs to realize green and sustainable development [5]. Carbon productivity improvement can be used as a sustainable development indicator to coordinate economic growth and reduce CO2 emissions. It is a sustainable development path for the green development of manufacturing in China [6].
Carbon productivity is mainly concerned with the economic efficiency of carbon emissions and has a reciprocal relationship with carbon emissions. Its essence lies in achieving the maximum economic output while minimizing carbon emissions [7]. The synergy of digitalization and servitization can be a viable path to increasing carbon productivity. Digitalization has the potential to enhance the carbon productivity of manufacturing by improving its R&D intensity and efficiency [8]. Servitization, the process by which manufacturing firms integrate services into their offerings, can indeed contribute to increasing carbon productivity by improving their competitive advantage [9]. Enterprises harness the synergies between manufacturing and productive services to broaden and deepen their impact in the industry, thereby fostering sustainable development [10]. This includes optimizing industrial layouts through industrial synergies to increase carbon productivity [11], and it also includes promoting high-quality manufacturing through digitalization and servitization synergies and increasing carbon productivity [12].
In an analysis of the influence path of digitalization and servitization on carbon productivity, both industrial structure and technological innovation have important transmission roles. Technological innovation can delay the emergence of the servitization paradox and promote the servitization of manufacturing [13]. Similarly, technological innovation positively regulates the influence of manufacturing digitalization on carbon emissions [14] and improves the carbon productivity of manufacturing. The digitalization and servitization of manufacturing can promote a low-carbon economy and improve carbon productivity by optimizing industrial structures [15,16]. As a result, technological innovation and industrial structure can be an effective pathway for the synergy of digitalization and servitization to enhance carbon productivity. Drawing from the environmental Kuznets curve theory, the investigation into economic growth and carbon emissions reveals that the relationship between them is mostly nonlinear. Yu studied economic growth as a threshold variable and found the threshold effect of manufacturing on carbon emissions [17].
Most research involving carbon productivity focuses on the enhancement effect of digitalization [8]. Digitalization improves carbon productivity by fostering technological innovation and transforming industrial structures [14]. There is a scarcity of research focusing on the enhancing effect of servitization on carbon productivity [9]. Research on the specific path of enhancing carbon productivity is unclear. Current research mostly focuses on a single dimension of digitalization or servitization to verify the impact on carbon productivity, and there is a lack of relevant research on both dimensions. We aim to fill the research gap by exploring the impact of the synergy between digitalization and servitization on carbon productivity.
To sum up, this paper reviews the theoretical mechanism of the synergy of digitalization and servitization (abbreviated as DSS) affecting carbon productivity (CP) in manufacturing and explores the following aspects: First, based on the coupled coordination degree model, the synergy level of digitalization and servitization in manufacturing is measured across provinces in China, and the development degree of DSS in each province is clarified. Second, the regression effect model is used to verify the influence of manufacturing DSS on CP. Third, in the intrinsic mechanism of the impact of DSS on CP, the mediating effects of technological innovation and industrial structure are further investigated, and we verify the threshold effect of economic growth in the effect of DSS on CP. This will provide theoretical reference and advice for eliminating the development gap of DSS among provinces and enhancing the CP of manufacturing.
The first part provides a literature review, which discusses the literature related to DSS and carbon productivity. The second part measures the degree of manufacturing DSS and evaluates the developmental status of manufacturing DSS in the provinces of China. The third part uses a dual fixed-effect model to explore the internal mechanism of the impact of DSS on CP in manufacturing. Finally, we offer pertinent policy recommendations to furnish manufacturing with a theoretical framework and guidance for advancing carbon productivity.

2. Literature Review and Hypothesis

2.1. Manufacturing DSS and Carbon Productivity

The digitalization and servitization of manufacturing exert a beneficial influence on the expansion of carbon productivity, and the relationship between digitalization, servitization, and carbon productivity does not comprise simple linear relationships [18,19]. Through the value-added and substitution effects of digitalization, manufacturing can improve operation efficiency, reduce unnecessary energy consumption, and improve carbon productivity [20]. Heo and others [21] believe that digitalization can directly promote technological innovation, and technological innovation and industrial structure positively contribute to a reduction in carbon emissions and the enhancement of carbon productivity [18]. On the one hand, the development of digitalization needs the support of technology, infrastructure, and other aspects. The development of digitalization, while increasing economic growth, also increases carbon emissions. The contribution to carbon productivity in manufacturing is therefore not significant [22,23]. On the other hand, digitalization makes rational use of resources in manufacturing by means of digital technology, which reduces energy consumption and improves energy utilization efficiency [24,25]. This promotes industrial economic growth and improves carbon productivity [26]. Similarly, manufacturing promotes the development of servitization and carbon productivity based on its own technological and industrial advantages [27]. Servitization can curtail energy consumption and diminish carbon emissions within the manufacturing sector by increasing the input of service elements [28]. Technological innovation, energy structure optimization, and other means are utilized to curtail energy consumption in manufacturing, enhance energy efficiency, and increase carbon productivity [29]. However, some scholars have pointed out that the technology required for the servitization of manufacturing to develop can accelerate resource consumption, creating the servitization paradox [30]. This makes servitization and carbon productivity reflect a non-linear relationship.
Current studies on carbon productivity found that there are positive “U” [31], positive “N” [32], and other characteristics of carbon productivity. Xu and others [31] confirmed that the interplay between manufacturing and producer services, along with carbon productivity, exhibits “U” characteristics. Only a high level of synergies can promote carbon productivity. Song and Han [32] found that environmental regulation has an “N” relationship with carbon productivity across time and geography. Zhang [33] proposed that there exists a positive “U“ feature between economic growth and carbon productivity, but the conclusion has not been further empirically tested.
Based on the above theories, it becomes evident that digitalization and servitization exert a positive promotional impact on carbon productivity. Digitalization can realize low-carbon development and improve carbon productivity in manufacturing [34]. Similarly, manufacturing uses its collaboration in the process of servitization development to promote manufacturing production efficiency and enhance carbon productivity [35]. Therefore, further research is carried out to verify the influence of DSS on carbon productivity and explore the nonlinear relationship between DSS and carbon productivity.
H1. 
The DSS exerts a positive influence on carbon productivity, and the two have nonlinear characteristics.

2.2. Conduction Path Analysis

Industrial structure and technological innovation are important paths for manufacturing digitalization and servitization to reduce carbon emissions [15,29] and improve carbon productivity. Digitalization development can stimulate enterprises to change the traditional production model, develop a low-carbon model, and optimize industrial structure [36]. Through the upgrading of the enterprise’s industrial structure, improvements in the level of technological innovation and carbon productivity can be achieved. [37]. The optimization of industrial structure and improvements at the level of technological innovation can improve resource utilization and reduce carbon emissions. They have a direct or indirect impact on enhancing carbon productivity [14]. The advancement of servitization fosters technological innovation within enterprises and optimizes their industrial structure, contributing positively to enhancing carbon productivity in manufacturing [38]. Optimizing industrial structure through the servitization approach has become a development trend in manufacturing. The substitution effect of service factors is utilized to reduce the input of energy factors and optimize the industrial structure of manufacturing. This provides an important impetus to decrease carbon emissions and bolster carbon productivity [39]. Manufacturing servitization improves the level of technological innovation in manufacturing through the input of knowledge factors. It leverages the positive externality of technological innovation to influence production activities positively, enhancing energy efficiency and carbon productivity [40].
H2. 
Industrial structure and technological innovation serve as effective strategies for DSS to enhance carbon productivity.
There are many research studies on economic growth and carbon emissions, but their conclusions are not consistent. Mujtaba and others [41] believe that there exists an inverse relationship between economic growth and carbon emissions, while Adjei and others [42] found a positive correlation between the two through empirical tests. Chen [43] empirically established an inverted “U” feature between economic growth and carbon emissions. However, Jiang [44] proposed that economic growth and carbon emissions do not exhibit an inverted “U” feature; instead, long-term changes with other shapes are exhibited. In the short term, economic growth raises carbon emissions at the cost of energy consumption. In the long term, economic growth contributes positively to reducing carbon emissions by changing the economic system and optimizing industrial structure [45]. Yu [17] verified that economic growth has a threshold effect on carbon emissions. He found that when economic growth exceeded the threshold, carbon emissions from enterprises relying on the development of highly polluting industries would increase. Li and Wang [46] discovered a positive influence between GDP and carbon productivity, which indicates that economic growth promotes carbon productivity. Wu and Yao [47] estimated economic growth patterns through economic growth and carbon productivity. They concluded that economic growth and carbon productivity had a two-way promoting effect. To sum up, economic growth significantly contributes to the enhancement of carbon productivity. We further verify the impact of DSS on carbon productivity with the development of the manufacturing economy when economic growth is the threshold variable.
H3. 
There is a threshold effect in the relationship between DSS and carbon productivity, which results in a positive “U” relationship between DSS and carbon productivity.

3. DSS Analysis for Manufacturing

3.1. The Coupling Coordination Degree

The coupling coordination degree measures the degree to which many elements within a system interact with each other. Based on the practices of Ma and others [48], by improving existing models, the DSS models of manufacturing industries in different provinces are proposed as follows:
C i t = 2 u i t × v i t / ( u i t + v i t )
In Equation (1), C i t indicates the degree of coupling between digitalization and servitization in manufacturing, and a larger C i t indicates better coupling between the two systems. u i t is the digitalization score of province i in year t, and v i t is the servitization score of province i in year t.
T i t = α × u i t + β × v i t
D S S i t = C i t × T i t
The coupling coordination degree is a further confirmation of the relationship between digitalization and servitization in manufacturing, and it more accurately reflects the DSS in manufacturing for each province. In Equation (2), α and β are coefficients to be determined; α represents the weighting in the manufacturing digitalization score and β represents the weighting in the manufacturing servitization score: α + β = 1 and α = β = 0.5. In Equation (3), D S S i t represents the degree of the DSS development of province i in year t.
Combining the criteria for classifying the levels of coupling coordination by Yang and others [49], this paper classifies manufacturing DSS into five types. The classification of DSS is shown in Table 1.

3.2. Index Selection and Data Source

3.2.1. Manufacturing Digitalization

In this paper, we select the indicators related to the regional digitalization level and apply the entropy value method to obtain the scores of each indicator. Finally, the index value of manufacturing digitization level in 30 provinces of China is obtained, as shown in Table 2 and Table 3.

3.2.2. Manufacturing Servitization

To assess the extent of servitization in manufacturing, we draw on the measures of Li [56] and Oh [57] for empirical exploration. The DEA–Malmquist index is utilized to assess the evolution of total factor productivity in servitization within the manufacturing sector across 30 provinces in China over the period from 2013 to 2020. The relevant indicators of regional service levels were selected, as shown in Table 4. The scores of each index were obtained using the DEA–Malmquist index and the entropy value method, as shown in Table 5.

3.2.3. Data Source

The data in this paper cover the period 2013–2020. The main sources of data are the China Statistical Yearbook (2014–2021), China Industry Statistical Yearbook (2014–2021), China Energy Statistical Yearbook (2014–2021), China Statistical Yearbook on Science and Technology (2014–2021), National Bureau of Statistics, and statistical yearbooks for each region. Xizang has been excluded from the measurement due to more serious data deficiencies, while Hong Kong, Macau, and Taiwan are not included.

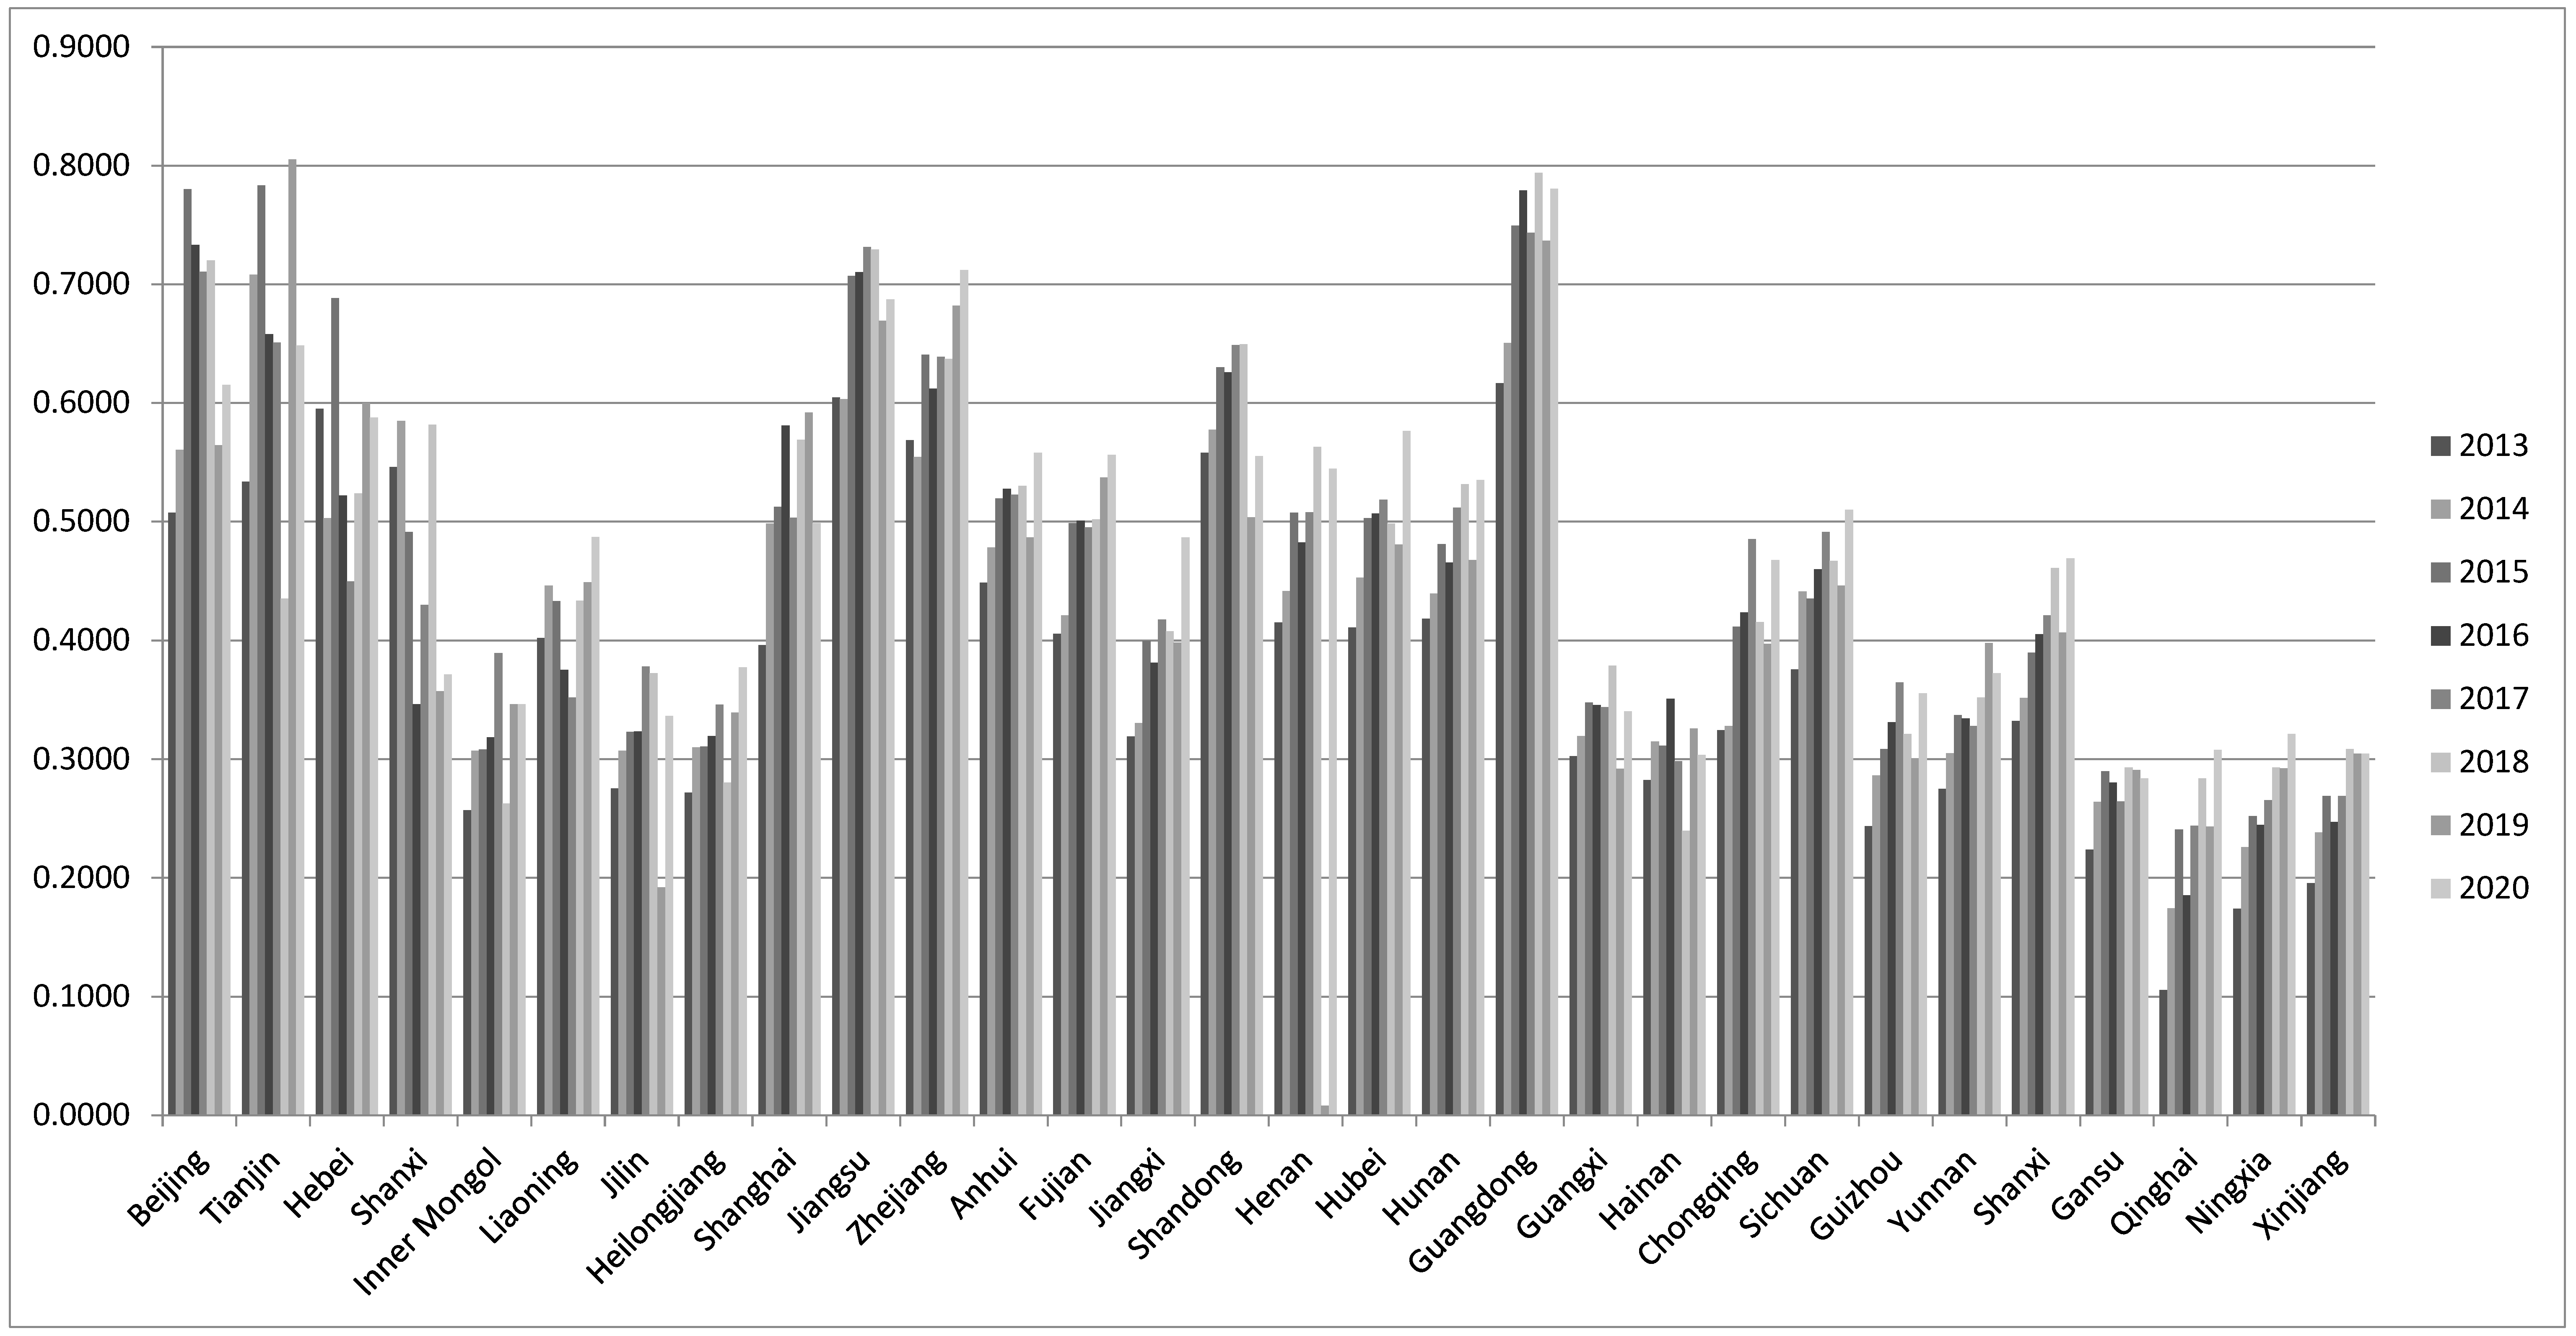
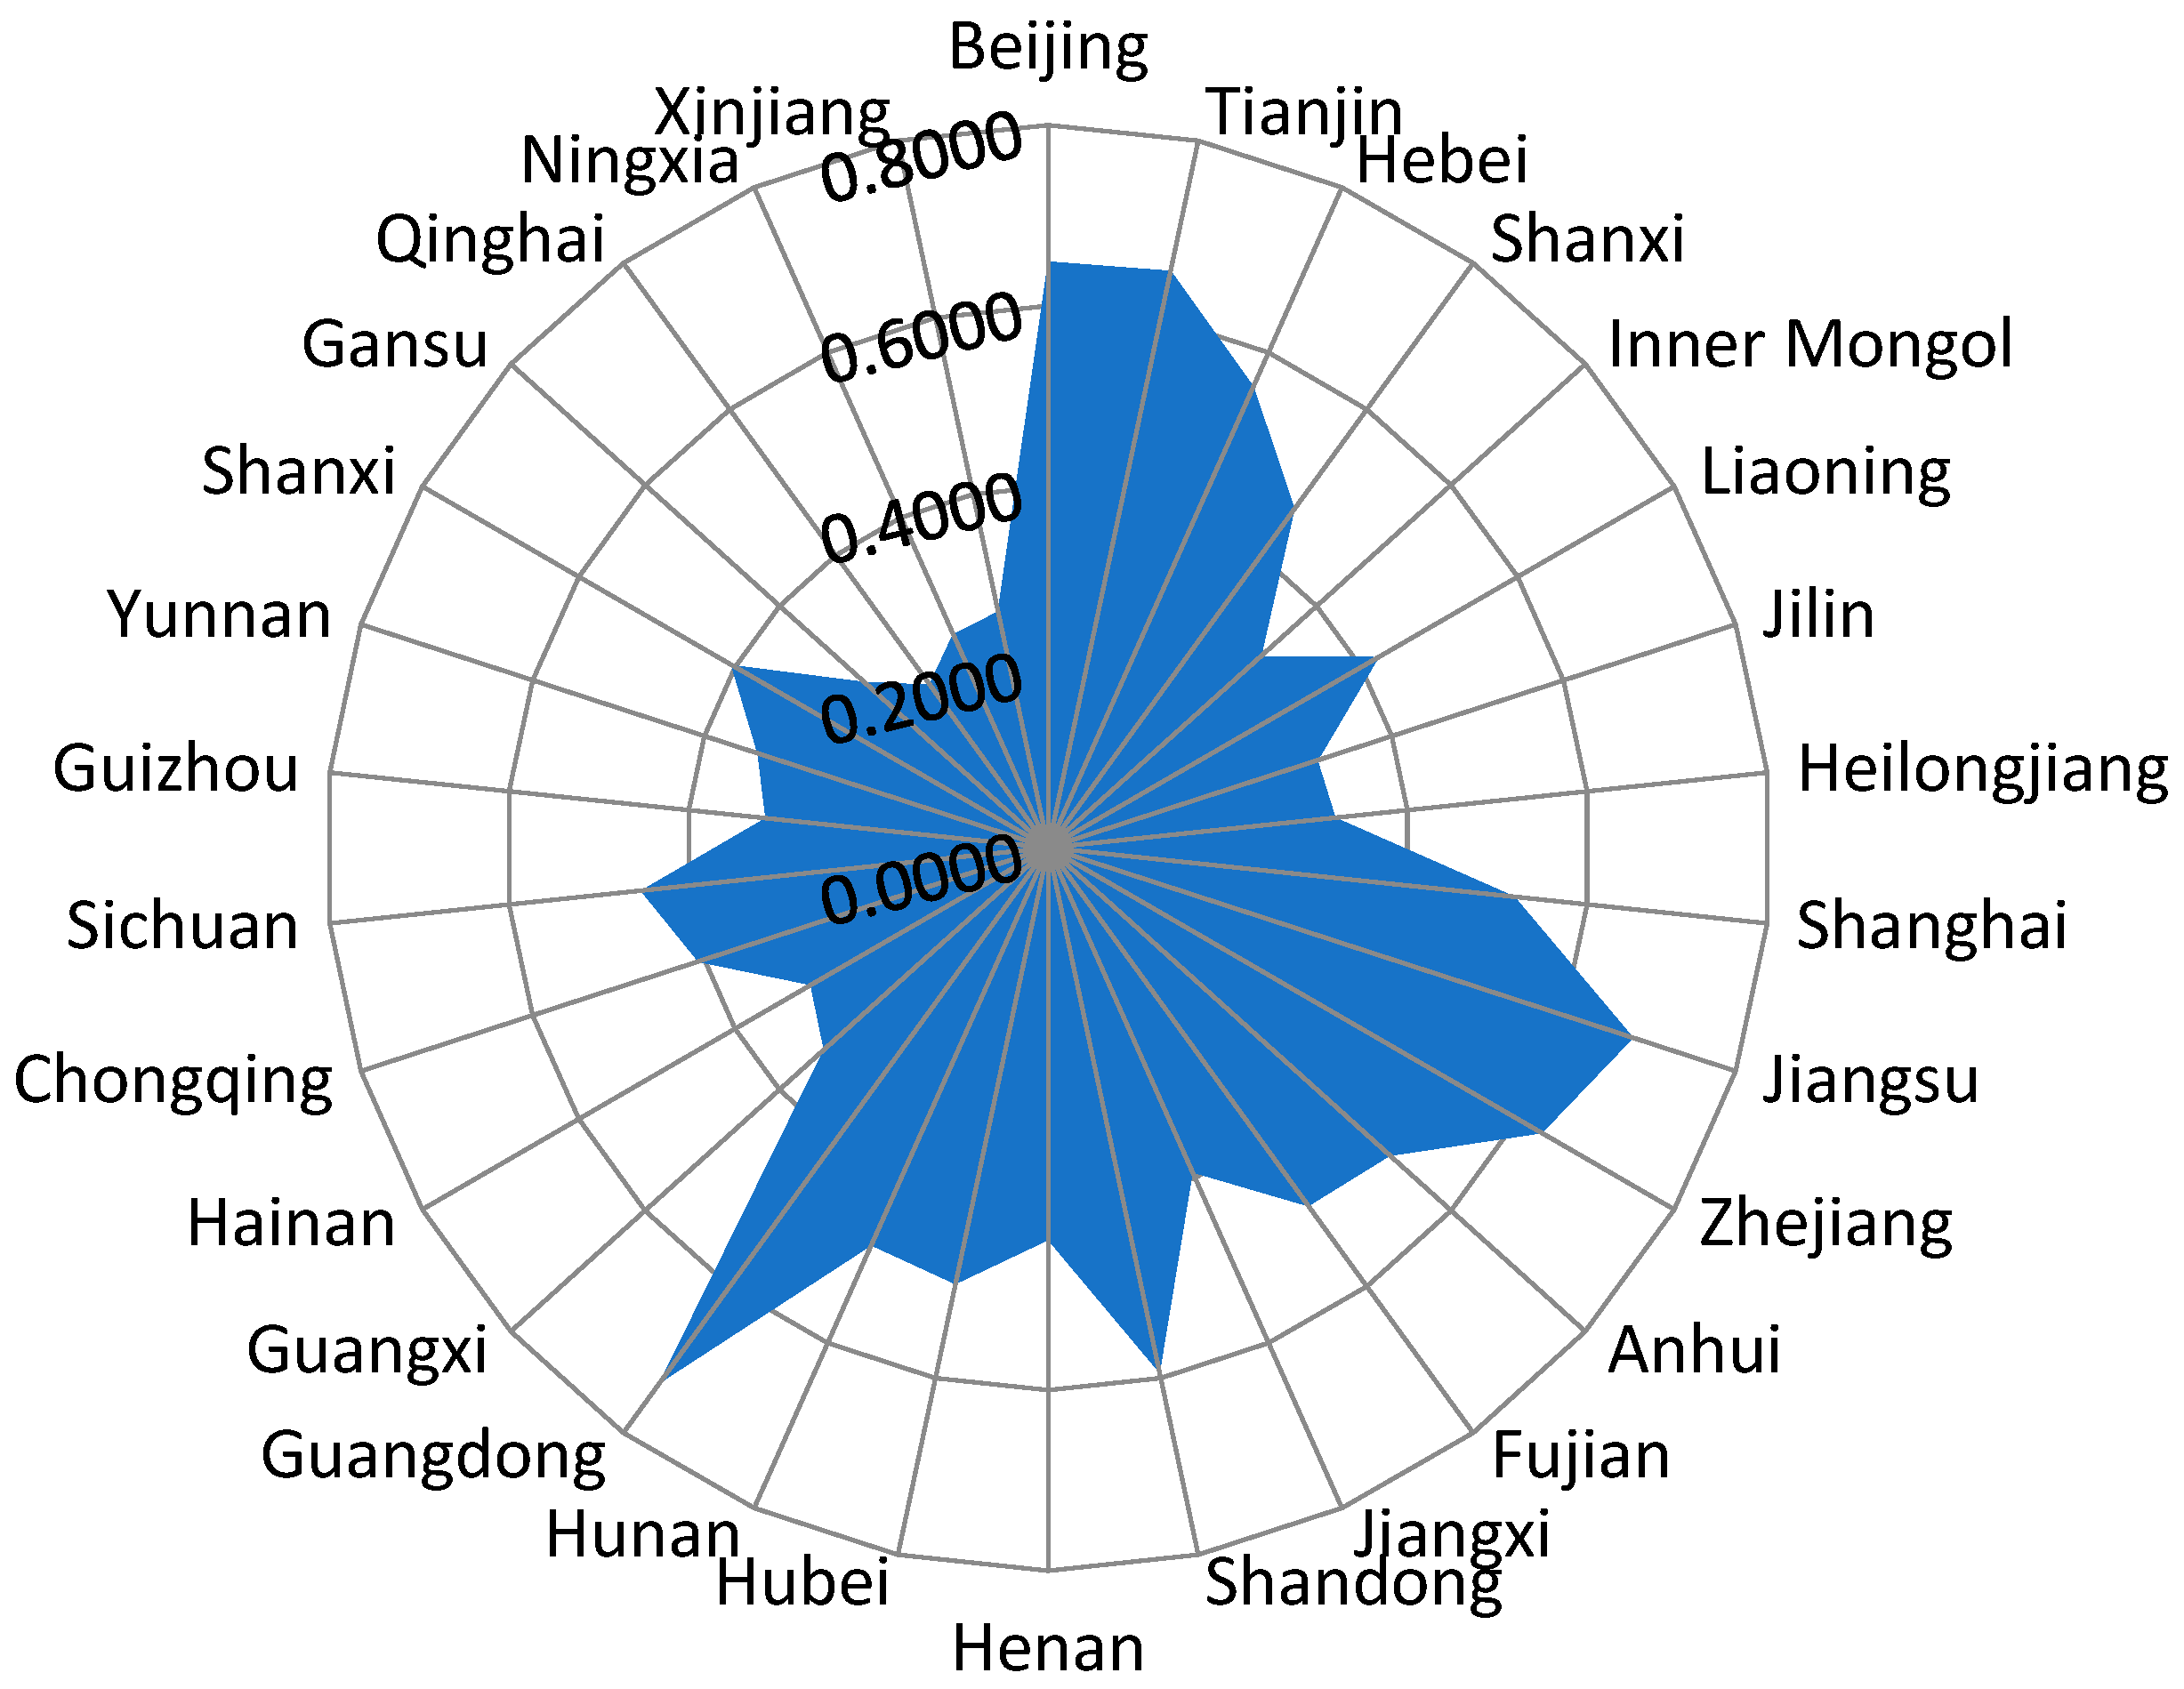
3.3. The Manufacturing DSS

According to the development level of the digitalization and servitization of manufacturing measured in the previous section, this study used the coupling coordination degree model to calculate DSS for the 30 provinces of China and their coordination levels, as shown in Table 6. The specific trends are shown in Figure 1.
By calculating manufacturing DSS in 30 provinces of China, the degree of the manufacturing DSS was measured. As depicted in Table 4, the manufacturing DSS across 30 provinces in China tends to rise from 2013 to 2020, but the overall level is low and in a state of imbalance. The manufacturing DSS of most provinces is maintained in a state of loose cooperation and low coordination, but the overall DSS comprises a stage of growth.
In terms of distribution (Figure 2), Beijing, Tianjin, Jiangsu, Guangdong, and other economically developed regions have a good economic foundation and technical support, and DSS is relatively high. Their digitalization and servitization coupling coordination degree is good, and they are in the general coordination stage. The DSS in Hebei, Shandong, Sichuan, Shaanxi, and other regions is relatively low, and it is at a low level of coordination. DSS relationships tend to develop in an orderly manner, but there is still a certain distance to the high-level goal. The DSS in Gansu, Yunnan, Xinjiang, and other regions is at a lower level as it is limited by economic and technological constraints, and the DSS is lower than that in other regions. Therefore, while emphasizing rapid economic development, manufacturing needs to pay special attention to injecting digital capabilities and service capabilities into the industry.
In general, the collaborative development of digitalization and servitization in manufacturing is in the early stages, and it comprises good resources and industrial and sustainable development. However, the development of DSS in manufacturing is a long-term process, and the average DSS level within China’s manufacturing is far from a high level of synergy. Hence, there is a need to expedite the coordinated advancement of digitalization and servitization to a greater extent.

4. Empirical Study on The Impact of DSS on Carbon Productivity

4.1. Model Building

To explore the influence of DSS on carbon productivity in manufacturing, we have constructed the following regression model, which is built upon the extended STIRPAT model [61]:
C P i t = α 0 + α 1 D S S i t + β X i t + γ y e a r + γ p r o + θ i t
In Equation (4), C P i t is the carbon productivity of province i in year t. D S S i t is the DSS score of province i in year t. X i t represents the control variables, including administrative control, infrastructure development, profit performance, enterprise scale, and industry debt ratios. γ y e a r and γ p r o are the fixed effects of the province and time, and θ i t is an error term.
The above theories show that both technological innovation and industrial structure exert a notable influence on carbon productivity in manufacturing. This paper further draws on relevant studies on mediating effect tests [62] to set up a mediating effect test model:
C P i t = α 0 + α 1 D S S i t + β X i t + γ y e a r + γ p r o + θ i t
M i t = α 0 + α 1 D S S i t + β X i t + γ y e a r + γ p r o + θ i t
C P i t = α 0 + α 1 D S S i t + α 2 M i t + β X i t + γ y e a r + γ p r o + θ i t
In Equations (6) and (7), M i t is the mediating variable, including technological innovation and industrial structure.
To examine the threshold effect between DSS and carbon productivity, we utilize the threshold regression model proposed by Hansen [63]. The threshold effect test model is described as follows:
C P i t = α 0 + α 1 D S S i t × I ( q i t ε 1 ) + α 2 D S S i t × I ( q i t > ε 1 ) + β X i t + γ y e a r + γ p r o + θ i t
In Equation (8), q i t is the threshold variable, and ε 1 is the threshold value.

4.2. Variable Selection

The explained variable comprises carbon productivity (CP). According to the measure of KAYA [64], carbon productivity is used to measure carbon productivity in manufacturing, which is expressed as the ratio of sales revenue to carbon emissions in manufacturing.
The core explanatory variables comprise the synergy of digitalization and servitization (DSS). The DSS is used as the core explanatory variable.
The mediating variables comprise technological innovation (sit) [65], measured as a ratio of the number of valid invention patents to R&D expenditure in manufacturing in each provincial administrative region. Industrial structure (str) [66] is expressed by adopting the ratio of the added value of the tertiary industry to the added value of the secondary industry.
The threshold variable, economic growth (income) [33], is expressed as the logarithm of manufacturing operating income.
Control variables were included to reduce model estimation bias, and five control variables were included in the empirical analysis.
Administrative control (gov) [67] is indicated by the share of government fiscal expenditure to GDP.
The enterprise scale (scal) [58] is expressed as the ratio of the main business income to the number of business units in manufacturing.
Infrastructure development (tra) [68] is measured using the logarithm of the total number of bus passengers traveling in the city at the year’s end.
Profit performance (pro) [69] is selected to express the share of profits relative to the main business revenue in each province.
Industry debt ratios (idebt) [70] are selected as the ratio of total liabilities to total assets for manufacturing.

4.3. Result Analysis

4.3.1. Descriptive Statistics

In Table 7, carbon productivity in manufacturing varies widely across provinces. The mean of CP is 0.976, the minimum of CP is 0.163, and the maximum of CP is 3.678. This indicates that overall carbon productivity in manufacturing needs to be improved. Manufacturing DSS has a standard deviation of 0.151 and minimum and maximum values of 0.008 and 0.803, respectively. This shows that the DSS level in manufacturing exhibits substantial variations in different regions. The mean of DSS is 0.441, which indicates that the vast majority of provinces have their DSS at a low level and that the DSS in manufacturing in most regions has more room for development.

4.3.2. Correlation Analysis

The Pearson correlation coefficient was used to examine the relationship between variables, and the outcomes are presented in Table 8. The results show that DSS and CP are positively correlated. This is a preliminary indication that DSS positively affects CP in manufacturing, and it lays the foundation for investigating the intrinsic link between the two.

4.3.3. Panel Data Model Selection

The model used needs to be screened before conducting the empirical test. As shown in Table 9, the Hausman test is 678.42, and the p-value is 0.0000. As a result of this correlation, the fixed-effect model was ultimately chosen for adoption, and the p-values of the F-test statistics were all 0.00, so the two-way fixed-effect model was chosen.

4.3.4. Basic Regression Analysis

This paper conducts regression analyses using panel data for 30 Chinese provinces spanning the period 2013–2020. The sample is further analyzed by dividing the sample into the East (China’s East region includes 12 provinces, autonomous regions, and municipalities directly under the Central Government, including Beijing, Tianjin, Hebei, Liaoning, Shanghai, Jiangsu, Zhejiang, Fujian, Shandong, Guangdong, Guangxi, and Hainan) and the Midwest (China’s Midwest region includes 19 provinces and autonomous regions, including Shanxi, Inner Mongolia, Jilin, Heilongjiang, Anhui, Jiangxi, Henan, Hubei, Hunan, Sichuan, Chongqing, Guizhou, Yunnan, Tibet, Shaanxi, Gansu, Ningxia, Qinghai, and Xinjiang. This study does not include the Tibet Autonomous Region) according to the classification of the Ministry of Finance’s “Opinions on Clarifying the Division of Eastern, Midwestern and Western Regions”.
Column (1) in Table 10 shows that DSS has a significant positive relationship with CP in manufacturing. Column (2) is a double fixed-effect regression controlling for time and province. The results in column (2) show a positive correlation between DSS and carbon productivity in China, the East, and the Midwest sample levels. This suggests that DSS has a significant contribution to CP in manufacturing. The effect of enterprise scales on CP is not significant, and the industrial debt ratios has a significant negative influence on CP in manufacturing in the East. The result shows that during the development of DSS in manufacturing, the input of DSS elements reduces energy resource inputs. This reduces carbon emissions, raises manufacturing revenues, and effectively increases manufacturing carbon productivity. By region, each 1% increase in manufacturing DSS in the East is associated with a 0.75% increase in CP, while the influence of DSS on CP is insignificant in the Midwest. The East has abundant human capital elements and technological elements, which guarantee the input of economic, technological, and service elements in the East. These resources strongly support the development of DSS in manufacturing in the East and promote the CP of manufacturing. Manufacturing in the Midwest is still mostly resource-dependent, with insufficient inputs of service factors, and the level of technology and human capital needs to be upgraded. Thus, a high degree of manufacturing DSS is not present, and the Midwest has not yet paid dividends in terms of increased CP in manufacturing [68].
Columns (3) and (4) show the nonlinear effect of DSS on CP for the two cases in the existence and nonexistence of control variables. The findings of the study indicate that the coefficient of the primary term of DSS is negative at the 5% significance level, while the coefficient of its quadratic term is positive at the 1% significance level, regardless of whether the control variable is included or not. This reveals a positive “U” association between DSS and CP. Upon further inspection, the extreme point of the positive “U” relationship in column (4) is 0.311, and the values of DSS are in the range of [0.161, 0.579]. It can be observed that the turning point lies within the range of the independent variable, and the initial hypothesis is rejected at the 1% significance level, confirming the validity of the test. A positive “U” relationship between DSS and CP is established, and there is a nonlinear relationship between the two. As a result, H1 is valid.

4.3.5. Robustness and Endogeneity

To alleviate the endogeneity problem of the model, the first-order lag of the DSS is used. Column (1) in Table 11 demonstrates that the coefficient of the first-order lag of the DSS is 0.184, with a significance level of 10%, thereby confirming the robustness of the baseline regression results.
Considering the model’s autocorrelation, a dynamic panel with the first-order lag of CP was constructed using the systematic GMM model for regression tests. In model (2), the regression results from the GMM model indicate that DSS continues to have a significant promoting effect on CP, suggesting that the baseline results remain robust.

4.3.6. Intermediary Effects Test

This paper further studies the impact of DSS on CP in manufacturing through two factors: technological innovation and industrial structure. Columns (2) and (3) of Table 12 demonstrate a notable positive impact of DSS on industrial structure, and DSS has a non-significant relationship with technological innovation. Column (4) and column (5) show that on the basis of basic regression, with the addition of the mediator variable, DSS and the mediator variable still have a contributing effect on CP. The boosting effect remains significantly positive at the 1% level. This suggests a mediating effect. Comparing column (1), the coefficients in columns (4) and (5) drop to 0.268 and 0.281 when technological innovation and industrial structure are added. This indicates that technological innovation and industrial structure are mediators in the influence of DSS on CP. The improvements in industrial structure and technological innovation can improve the effect of DSS on CP. As a result, H2 is valid.
Table 13 shows the findings of the Soble test for mediating effects. According to the Z-statistic, Z is significant at the 0.05% level, so the Soble test passes the hypothesis of mediating effects. The indirect effects of DSS on carbon productivity through technological innovation and industrial structure are 0.166 and 0.120, respectively. The direct effects were 1.959 and 2.005, respectively. The intermediary effects accounted for 7.79% and 5.63%, respectively. This shows that technological innovation and industrial structure are important ways for DSS to improve CP. As a result, H2 is again valid.

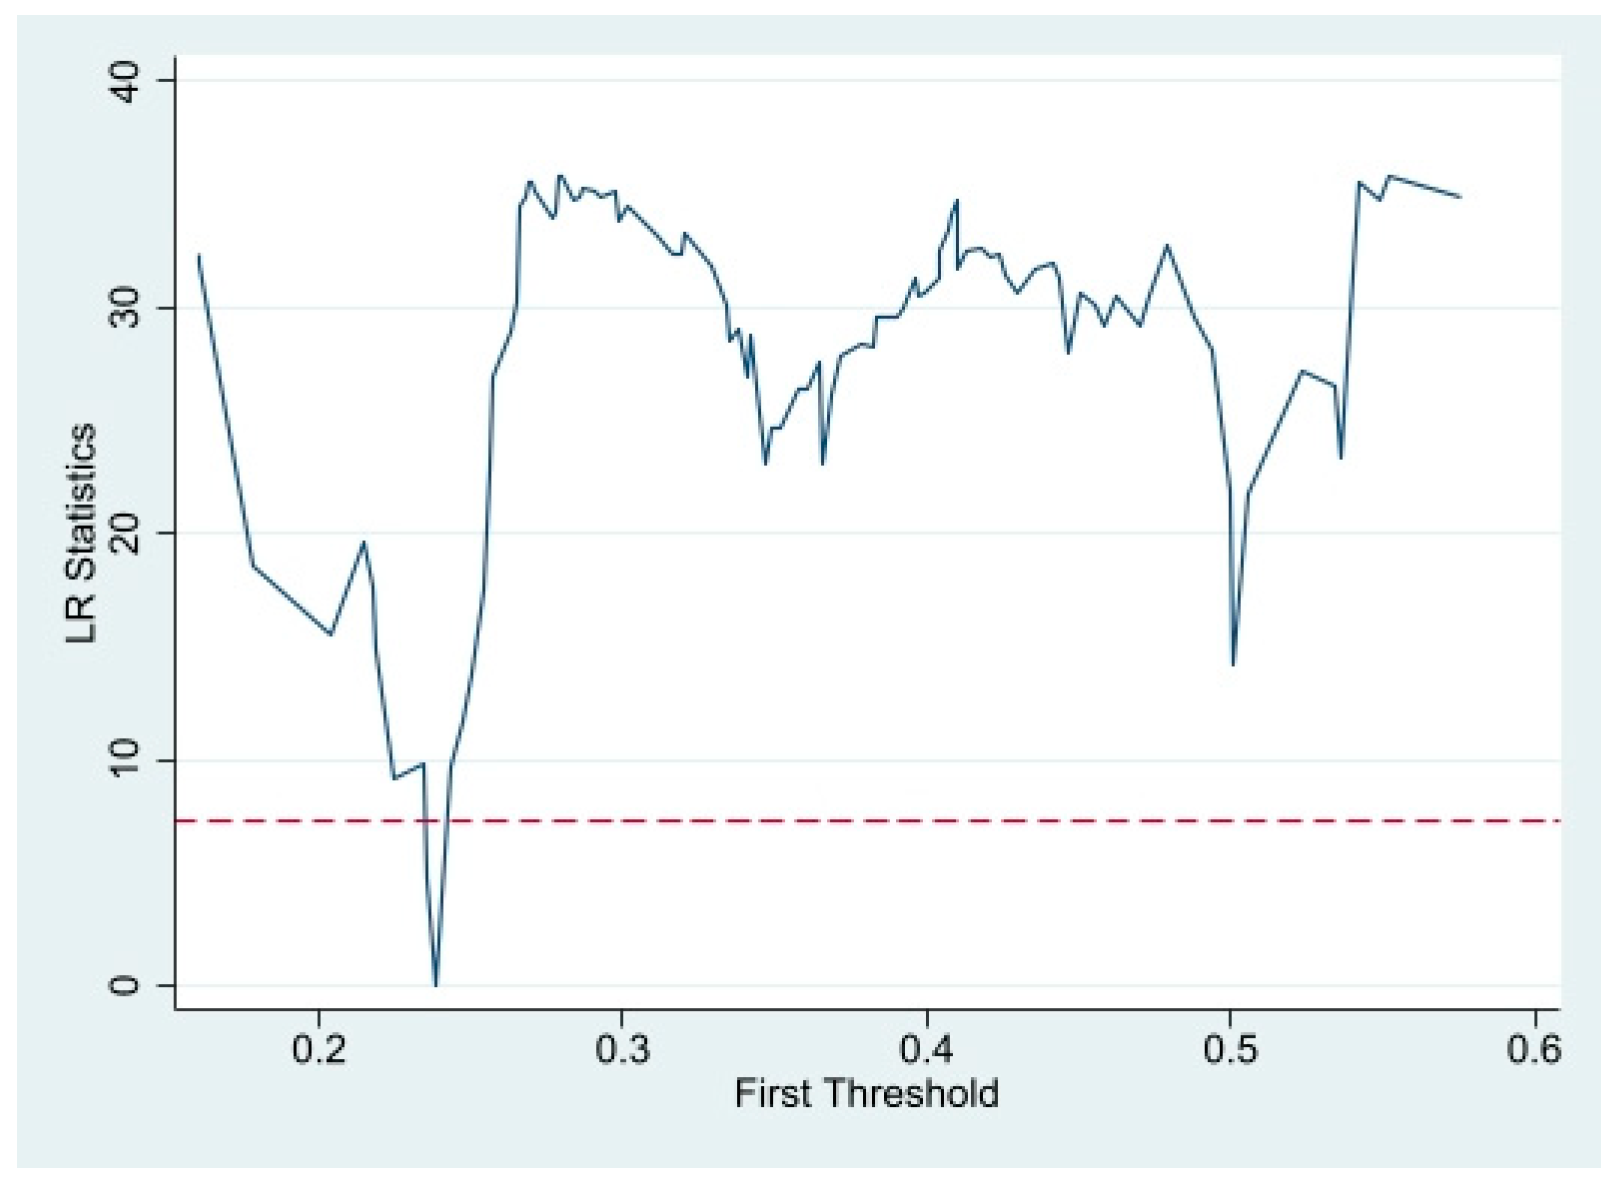
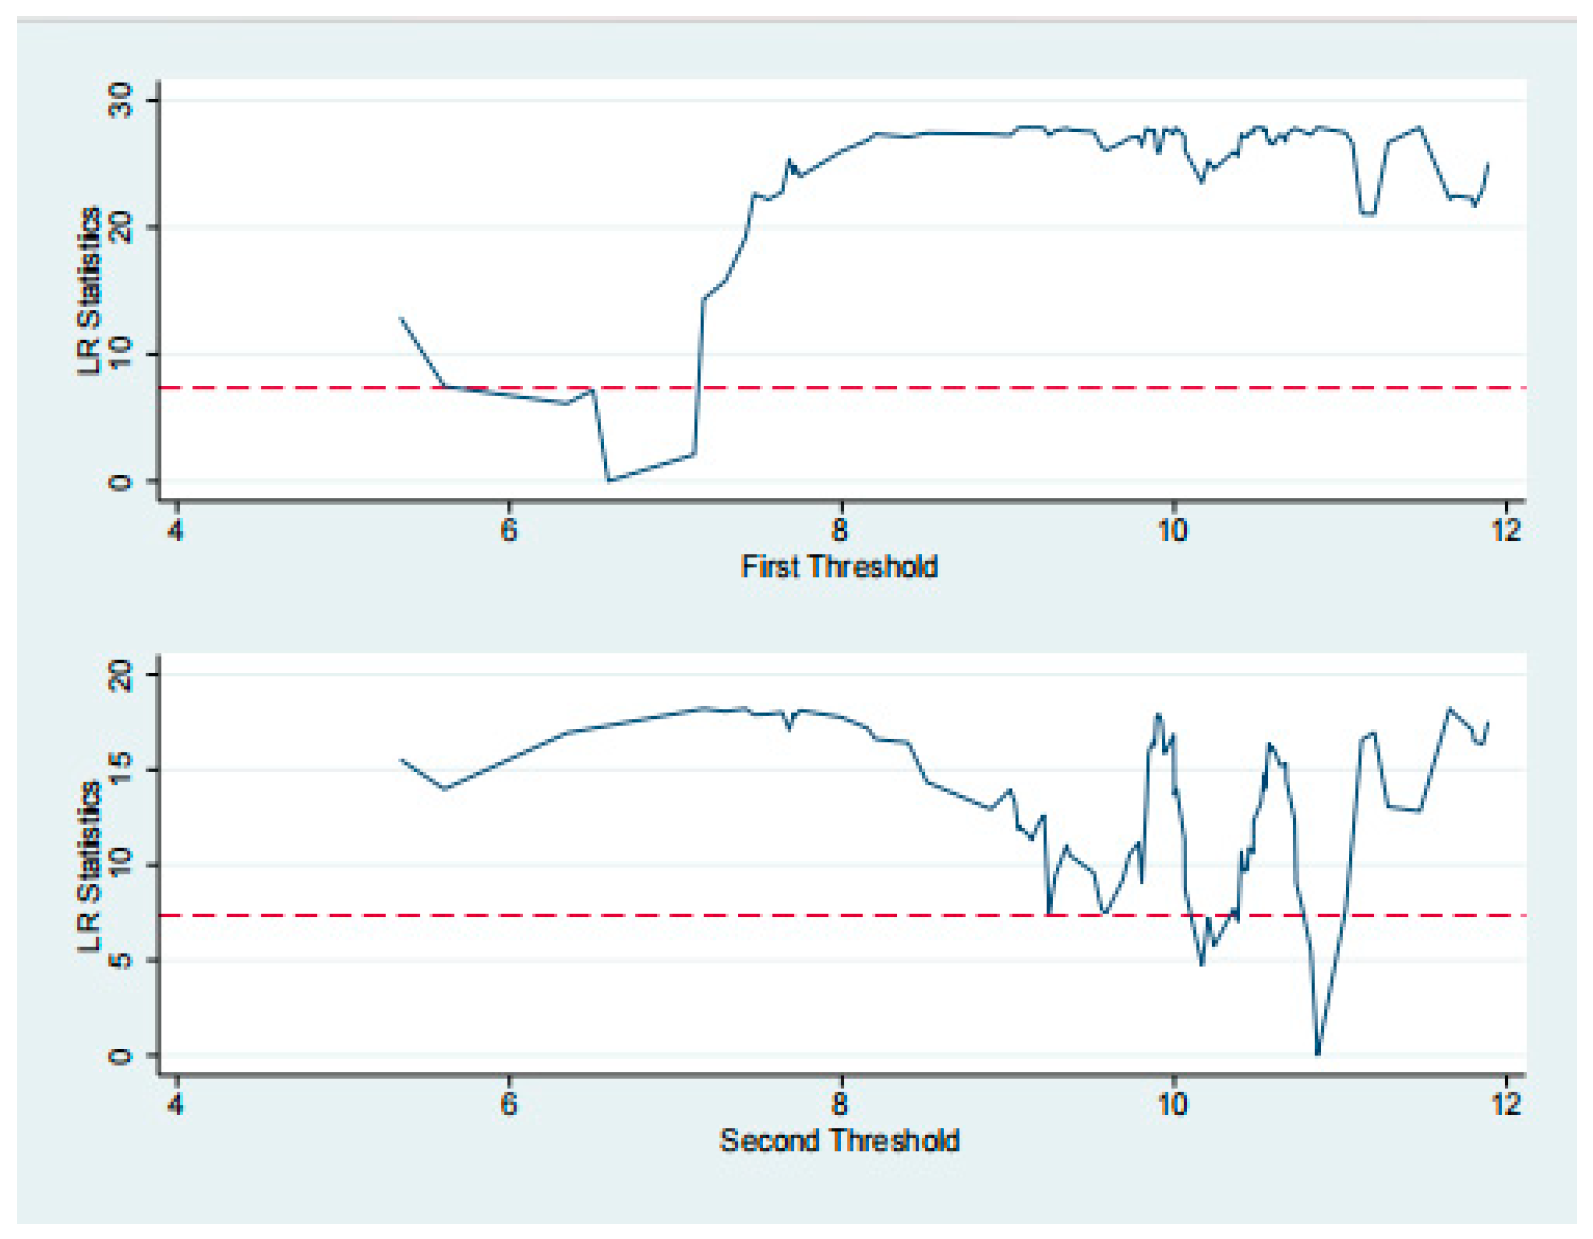
4.3.7. Threshold Effect Analysis

Through the above tests, it is evident that there exists a positive “U” relationship between DSS and CP. This paper takes DSS as the independent variable and DSS and economic growth as the threshold variables to conduct the threshold test.
Table 14 displays the test’s outcomes. We find that the test results for the single threshold of the DSS are significant at the 1% level. Nonetheless, the double and triple thresholds do not show significance. Hence, there exists a single threshold for DSS with an estimated threshold of 0.2383. Single threshold regression is used for the next analysis. The tests for economic growth indicate significance for both the single and double thresholds, while the triple threshold test is non-significant. Therefore, there are single and double thresholds for economic growth, and these thresholds are 6.5937 and 10.8619, respectively. Double threshold regression was used for further analysis.
The threshold effect was tested by drawing the likelihood ratio function graph of DSS and economic growth. The likelihood ratio function was used to express the relationship between LR values and threshold values. As shown in Figure 3 and Figure 4, the 95% confidence interval for the threshold estimate is the interval formed by the critical value of 7.35 (corresponding to the dotted line in Figure 3 and Figure 4) for all LR values less than the 5% significance level. It indicates that the threshold value of threshold regression is equivalent to the actual threshold value, which is in agreement with the findings from the earlier significance test.
We conducted regression analyses using the threshold model, and the outcomes are presented in Table 15.
Column (1) shows that when DSS is used as the threshold variable, a significant positive correlation exists between DSS and CP at the 1% significance level when DSS < 0.2383, with a coefficient of 0.864. When DSS ≥ 0.2383, DSS and CP are still significantly positively correlated at the 1% level, but the coefficient is 0.418, and its contribution decreases as DSS increases. Currently, most of the DSS in manufacturing is in the low-synergy stage, and the effect of DSS on CP does not reach a higher level of facilitation for the time being. The effect is differentiated by the development stage of DSS. Therefore, there is a nonlinear positive correlation between DSS and CP, and H1 is again valid.
Column (2) demonstrates that when economic growth is taken as the threshold variable, there is a negative correlation between DSS and CP when economic growth is <6.5937, with a coefficient of −0.073. When economic growth is at [6.5937, 10.8619], DSS was significantly and positively correlated with CP at 5%. When economic growth ≥ 10.8619, DSS has a positive correlation with CP, but its promoting effect is not significant. Therefore, with the economic growth of manufacturing, DSS has a positive “U” relationship with CP. Economic growth has a threshold effect on the impact of DSS on CP, and H3 is valid.

5. Discussion

This paper empirically analyzes the influence of manufacturing DSS on carbon productivity in 30 provinces of China from 2013 to 2020 and divides manufacturing DSS levels. The conclusion is as follows.
First, the level of DSS in China’s manufacturing is low, and the average level is still far from a high level of cooperation. China’s manufacturing DSS faces the challenge of uneven development, with obvious regional differences [71]. In developed eastern regions like Beijing, Guangdong, and other regions, the level of DSS implementation surpasses that in less developed areas, yet it still has a certain gap from a high level of coordination.
Second, DSS makes a notable positive contribution to carbon productivity, and the two show a strong and then weak non-linear relationship. The reason is that the development of DSS relies on electricity, computing power, high and new technologies, and others [22]. These supporting factors require a large amount of energy consumption to a certain extent, and the technology development cycle is long, which will hinder the contribution of DSS to carbon productivity in the short term. Currently, DSS in most provinces is at a low level; DSS in developed provinces such as Beijing and Guangdong is only at a general level, and it has not reached a high level of cooperation. Therefore, the next inflection point of carbon productivity increase has not yet appeared.
Third, economic growth has a threshold effect between DSS and carbon productivity. With the economic growth of manufacturing, DSS has a positive “U” feature of first inhibiting and then promoting carbon productivity. In the early years of the manufacturing economy, most of its industrial structure was resource-intensive or labor-intensive, which increased energy consumption [27,72]. Thus, DSS had an inhibitory impact on carbon productivity at this stage. With the economic growth of manufacturing, its industrial structure has become technology-intensive, and DSS has entered a stage of rapid development. It has improved energy efficiency and carbon productivity. As the manufacturing economy grows rapidly beyond the upper limit of its own production elasticity, carbon emissions increase, and carbon productivity decreases.
Fourthly, through the mediation effect test, it was found that technological innovation and industrial structure have partial mediation effects between DSS and carbon productivity. Therefore, manufacturing can increase its investment in technological R&D and optimize its industrial structure, thereby increasing the contribution of DSS to carbon productivity.

6. Conclusions and Policy Recommendations

6.1. Conclusions

This paper identifies the relationship between DSS and carbon productivity. In contrast to earlier studies of carbon productivity, this paper is not limited to the effects of single factors of digitalization or servitization. It is based on synergy theory and explores the role of the synergistic effect of both digitalization and servitization factors on carbon productivity. The empirical test concludes that there is a non-linear relationship between DSS and carbon productivity [19,73,74,75]. DSS has a positive “U” relationship with carbon productivity when economic growth is the threshold effect. The conclusion is similar to the research of other scholars [73,76]. Based on the contribution of digitalization and servitization to carbon productivity [8,9] and the development mechanism of digitalization and servitization [77,78], this paper further explores the effect of DSS on carbon productivity. The conclusion contributes to the carbon productivity development pathway. DSS can be used to improve carbon productivity, and it is an implementable path that can promote economic growth and environmental protection together. It provides a strong impetus for the sustainable development of manufacturing and a theoretical basis for global sustainable development.
This paper considers the influence path of DSS to enhance carbon productivity from multiple perspectives. Unlike previous studies considering a single variable, this paper considers both technological innovation and industrial structure to verify their mediating role in DSS on carbon productivity [15,36,37,38]. Based on the environmental Kuznets curve theory, the threshold effect is further explored [73,79]. Therefore, it can provide multiple implementable paths for DSS to enhance carbon productivity by considering various aspects such as technological innovation, industrial structure, and economic growth. It provides feasible solutions for manufacturing to achieve carbon peaking and carbon neutrality.
This paper provides valuable suggestions for the sustainable development of manufacturing. Firstly, manufacturing can develop DSS according to the actual situation of the enterprise. Instead of focusing on the development of one side only, managers use the dynamic development of digitalization and servitization to drive the development of enterprise DSS [80]. Heavily polluting enterprises can complete their transformation and development as quickly as possible through DSS. Enterprises can deepen the use of technology, knowledge, and other resources through digitalization and servitization collaboration platforms to maximize the use of digitalization and servitization and solve the problem of economic and environmental sustainability in manufacturing. Second, the research results verify the threshold effect of economic growth. Managers should always pay attention to the upper limit of production elasticity when carrying out DSS development [73]. It is true that DSS can enhance carbon productivity, but if enterprises pursue economic growth too quickly, it will be difficult for them to achieve sustainable development.

6.2. Policy Recommendations

The above conclusions provide a feasible path for manufacturing to enhance carbon productivity and develop a green economy. This paper examines the implementation path for DSS to enhance carbon productivity. This provides a sustainable development path for manufacturing, including low-carbon development enterprises. It also provides policymakers with a strategy for economically and environmentally sustainable development. The implementation path to boost carbon productivity through the development of DSS is as follows.
First, manufacturing DSS is developed, and the level of DSS is improved. At present, synergies are low in most provinces. Therefore, the government, through policy guidance, increases the support for the development of DSS to attract more enterprises to participate in the development of DSS. At the same time, it strengthens the publicity and promotion of DSS development, enhances the awareness and participation of enterprises, and promotes DSS. Manufacturing actively establishes a flexible organizational structure and accelerates the construction of advanced production factors, such as human resources and technology, through resource integration, information sharing, and technology research and development. DSS development conditions are then constructed to accelerate DSS development in manufacturing.
Second, DSS should be made the most out of, and the carbon productivity of manufacturing should be promoted with DSS. Simultaneously with economic development, manufacturing should rationally develop DSS according to its own economic development level. Along with rapid economic development, manufacturing should be promoted to shift to technology-intensive industries, changing the economic development model. The DSS level of manufacturing should be accelerated, improving energy utilization efficiency and, thus, carbon productivity.
Thirdly, optimizing industrial structure and improving technological innovation are important links for DSS in manufacturing to promote carbon productivity. The government should support the collaborative development of technological innovation capabilities carried out by enterprises and research institutions and promote the development of manufacturing in the direction of low energy consumption and low pollution and high efficiency. Manufacturing should adhere to a combination of market regulation and policy guidance, make full use of the basic role of the market in allocating resources, and achieve the optimal allocation of resources. Policy guidance should be used to promote cooperation and exchanges between all links and the outside world, increase investments in research and development, and promote the sustainable development of manufacturing.
Fourth, the East and the Midwest should carry out overall planning, reasonably guide the inflow of resources, reduce regional differences, and improve the DSS level of China’s manufacturing. The government should exert its role in the regulation and management of resources to prevent a large amount of resources from flowing into developed provinces, which would further aggravate regional differences. The government of the Midwest can increase investment incentives, guide the inflow of resources between regions, and avoid the surplus of resources in developed regions. Cooperation and alliances between enterprises in various regions are encouraged, the maximization of redundant resources should be promoted, and the DSS level of manufacturing in each region should be improved.

6.3. Limitation and Future Research

This study starts from the synergy of digitalization and servitization to derive a feasible path to enhance carbon productivity. However, the synergistic path of digitalization and servitization has not been explored in depth in the synergistic development of digitalization and servitization. The characteristics of digitalization and servitization in the synergistic path with dynamic development can be further explored in subsequent related studies. In addition, the impact of corporate greening on carbon productivity has been studied. We can further explore the synergy between digitalization and greening based on the synergy theory. Hence, these matters warrant further discussion and exploration in future research endeavors.

Author Contributions

Conceptualization, G.L. and Y.C. (Yanan Chen); methodology, Y.C. (Yanan Chen); software, Y.C. (Yanan Chen); validation, G.L. and Y.C. (Yanan Chen); formal analysis, G.L.; investigation, G.L.; resources, G.L.; data curation, Y.C. (Yanan Chen); writing—original draft preparation, G.L., Y.C. (Yanan Chen) and Y.C. (Yan Cheng); writing—review and editing, G.L. and Y.C. (Yanan Chen); visualization, Y.C. (Yanan Chen); supervision, G.L.; project administration, G.L.; funding acquisition, G.L. All authors have read and agreed to the published version of the manuscript.

Funding

This work was supported by the “Shaanxi Social Science Fund” of China, grant number 2023SJ01.

Data Availability Statement

The data presented in this study are available upon request from the corresponding author.

Conflicts of Interest

The authors declare no conflicts of interest.

References

  1. Muhammad, S.; Long, X.; Salman, M.; Dauda, L. Effect of urbanization and international trade on CO2 emissions across 65 belt and road initiative countries. Energy 2020, 196, 117102. [Google Scholar] [CrossRef]
  2. Nie, Y.; Li, Q.; Wang, E.; Zhang, T. Study of the nonlinear relations between economic growth and carbon dioxide emissions in the Eastern, Central and Western regions of China. J. Clean. Prod. 2019, 219, 713–722. [Google Scholar] [CrossRef]
  3. Dong, K.; Dong, X.; Dong, C. Determinants of the global and regional CO2 emissions: What causes what and where? Appl. Econ. 2019, 51, 5031–5044. [Google Scholar] [CrossRef]
  4. Zhao, X.; Ma, X.; Chen, B.; Shang, Y.; Song, M. Challenges toward carbon neutrality in China: Strategies and countermeasures. Resour. Conserv. Recycl. 2022, 176, 105959. [Google Scholar] [CrossRef]
  5. Zhang, M.; Yu, D. Carbon emission reduction paths and industrial choices for “Made in China 2025” in the context of the new industrial revolution. Mod. Econ. Res. 2016, 1, 12–16. [Google Scholar]
  6. Murshed, M.; Apergis, N.; Alam, M.S.; Khan, U.; Mahmud, S. The impacts of renewable energy, financial inclusivity, globalization, economic growth, and urbanization on carbon productivity: Evidence from net moderation and mediation effects of energy efficiency gains. Renew. Energy 2022, 196, 824–838. [Google Scholar] [CrossRef]
  7. Adkisson, R.V. The origin of wealth: Evolution, complexity, and the radical remaking of economics. East. Econ. J. 2009, 35, 133–135. [Google Scholar] [CrossRef]
  8. Bagchi, P.; Sahu, S.K.; Kumar, A.; Tan, K.H. Analysis of carbon productivity for firms in the manufacturing sector of India. Technol. Forecast. Soc. Change 2022, 178, 121606. [Google Scholar] [CrossRef]
  9. Chang, R. Theoretical Modeling and Empirical Testing of the lmpact of Servitizaiton of Intermediate Inputs in Manufacturing on Carbon Productivity-Take the Pearl River Delta as An Example. Econ. Manag. 2013, 27, 81–86. [Google Scholar]
  10. Tian, X.; Bai, F.; Jia, J.; Liu, Y.; Shi, F. Realizing low-carbon development in a developing and industrializing region: Impacts of industrial structure change on CO2 emissions in southwest China. J. Environ. Manag. 2019, 233, 728–738. [Google Scholar] [CrossRef]
  11. Ma, R.; Lin, B. Digitalization and energy-saving and emission reduction in Chinese cities: Synergy between industrialization and digitalization. Appl. Energy 2023, 345, 121308. [Google Scholar] [CrossRef]
  12. Favoretto, C.; Mendes, G.H.S.; Oliveira, M.G.; Cauchick-Miguel, P.A.; Coreynen, W. From servitization to digital servitization: How digitalization transforms companies’ transition towards services. Ind. Mark. Manag. 2022, 102, 104–121. [Google Scholar] [CrossRef]
  13. Luo, J.; Pan, R.; Yang, Z. Servitization of Manufacturing, R&D innovation Input and Enterprise Performance: An Empirical Research Based on Technology-intensive Enterprises. Manag. Rev. 2023, 35, 116–125. [Google Scholar] [CrossRef]
  14. Wu, C.; Gao, Y. Research on the mechanism and effect of digital economy driving the development of low carbon industry. Guizhou Soc. Sci. 2020, 11, 155–161. [Google Scholar] [CrossRef]
  15. Chang, H.; Ding, Q.; Zhao, W.; Hou, N.; Liu, W. The digital economy, industrial structure upgrading, and carbon emission intensity—Empirical evidence from China’s provinces. Energy Strategy Rev. 2023, 50, 101218. [Google Scholar] [CrossRef]
  16. Hu, B. Research on the Influence of Industrial Structure on China’s Service Industry Carbon Productivity-Based on the Mediating Effectof Energy Use Efficiency. Master’s Thesis, Zhongnan University of Economics and Law, Wuhan, China, 2019. [Google Scholar]
  17. Yu, Y. A Nonlinear Threshold Model about GDP Growth and Energy Consumption—An Empirical Study on the Inter-provincial Transfer of Traditional Industries. China Ind. Econ. 2010, 12, 57–65. [Google Scholar] [CrossRef]
  18. Yang, Z.; Gao, W.; Han, Q.; Qi, L.; Cui, Y.; Chen, Y. Digitalization and carbon emissions: How does digital city construction affect China’s carbon emission reduction? Sustain. Cities Soc. 2022, 87, 104201. [Google Scholar] [CrossRef]
  19. Huang, Y.; Zhang, Y.; Xiang, Y.; Dong, X. Has servitization reduced the embodied carbon emissions of manufacturing export trade? Evidence from 38 countries. Environ. Technol. Innov. 2022, 28, 102950. [Google Scholar] [CrossRef]
  20. Li, G.; Liao, F. Input digitalization and green total factor productivity under the constraint of carbon emissions. J. Clean. Prod. 2022, 377, 134403. [Google Scholar] [CrossRef]
  21. Heo, P.S.; Lee, D.H. Evolution of the Linkage Structure of ICT Industry and Its Role in the Economic System: The Case of Korea. Inf. Technol. Dev. 2019, 25, 424–454. [Google Scholar] [CrossRef]
  22. Cho, Y.; Lee, J.; Kim, T.-Y. The impact of ICT investment and energy price on industrial electricity demand: Dynamic growth model approach. Energy Policy 2007, 35, 4730–4738. [Google Scholar] [CrossRef]
  23. Salahuddin, M.; Alam, K. Information and communication technology, electricity consumption and economic growth in OECD countries: A panel data analysis. Int. J. Electr. Power Energy Syst. 2016, 76, 185–193. [Google Scholar] [CrossRef]
  24. Wang, J.Q.; Ma, X.W.; Zhang, J.; Zhao, X. Impacts of digital technology on energy sustainability: China case study. Appl. Energy 2022, 323, 119329. [Google Scholar] [CrossRef]
  25. Zhang, H.Y.; Gao, S.Z.; Zhou, P. Role of digitalization in energy storage technological innovation: Evidence from China. Renew. Sustain. Energy Rev. 2023, 171, 113014. [Google Scholar] [CrossRef]
  26. Kallal, R.; Haddaji, A.; Ftiti, Z. ICT diffusion and economic growth: Evidence from the sectorial analysis of a periphery country. Technol. Forecast. Soc. Chang. 2021, 162, 120403. [Google Scholar] [CrossRef]
  27. Cao, Z. Effects of Manufacturing Serviceization on Carbon Productivity under Global Value Chains. Master’s Thesis, Zhongnan University of Economics and Law, Wuhan, China, 2020. [Google Scholar] [CrossRef]
  28. Yuan, K.; Wang, K.; Fei, R.; Sun, Y.; Bao, S. The impact of manufacturing servitization on consumption-based carbon rebound effect: A global value chain research perspective. Sci. Total Environ. 2023, 896, 165177. [Google Scholar] [CrossRef]
  29. Hao, M.; Tang, Y.; Zhu, S. Effect of input servitization on carbon mitigation: Evidence from China’s manufacturing industry. Environ. Sci. Pollut. Res. 2022, 29, 27819–27831. [Google Scholar] [CrossRef]
  30. Kamal, M.M.; Sivarajah, U.; Bigdeli, A.Z.; Missi, F.; Koliousis, Y. Servitization implementation in the manufacturing organisations: Classification of strategies, definitions, benefits and challenges. Int. J. Inf. Manag. 2020, 55, 102206. [Google Scholar] [CrossRef]
  31. Xu, H.; Liu, W.; Zhang, D. Exploring the role of co-agglomeration of manufacturing and producer services on carbon productivity: An empirical study of 282 cities in China. J. Clean. Prod. 2023, 399, 136674. [Google Scholar] [CrossRef]
  32. Song, W.; Han, X. Heterogeneous two-sided effects of different types of environmental regulations on carbon productivity in China. Sci. Total Environ. 2022, 841, 156769. [Google Scholar] [CrossRef] [PubMed]
  33. Zhang, L. Economic Background and Connotation Analysis of Carbon Productivity. Inq. Into Econ. Issues 2013, 05, 37–41. [Google Scholar] [CrossRef]
  34. Ma, Q.; Tariq, M.; Mahmood, H.; Khan, Z. The nexus between digital economy and carbon dioxide emissions in China: The moderating role of investments in research and development. Technol. Soc. 2022, 68, 101910. [Google Scholar] [CrossRef]
  35. Shen, F. Optimization of carbon productivity improvement path and countermeasures system for service-oriented manufacturing investment in Zhejiang Province. Sci. Technol. Ecnony Mark. 2017, 02, 187–188. [Google Scholar] [CrossRef]
  36. Luo, S.; Yimamu, N.; Li, Y.; Wu, H.; Irfan, M.; Hao, Y. Digitalization and sustainable development: How could digital economy development improve green innovation in China? Bus. Strategy Environ. 2023, 32, 1847–1871. [Google Scholar] [CrossRef]
  37. Xu, R.; Wu, Y.; Huang, Y. Measurement and convergence of carbon productivity across Shanghai’s manufacturing sectors. Int. J. Clim. Change Strateg. Manag. 2020, 12, 369–387. [Google Scholar] [CrossRef]
  38. Doni, F.; Corvino, A.; Martini, S.B. Servitization and Sustainability Actions. Evidence from European Manufacturing Companies. J. Environ. Manag. 2019, 234, 367–378. [Google Scholar] [CrossRef]
  39. Zhu, X. Have carbon emissions been reduced due to the upgrading of industrial structure? Analysis of the mediating effect based on technological innovation. Environ. Sci. Pollut. Res. 2022, 29, 54890–54901. [Google Scholar] [CrossRef]
  40. Liu, W.; Ni, H. Service Input of Manufacturing and Enterprise Technological Progress: Effects and Mechanism. Financ. Trade Econ. 2018, 9, 126–140. [Google Scholar] [CrossRef]
  41. Mujtaba, A.; Jena, P.K.; Mukhopadhyay, D. Determinants of CO2 emissions in upper middle-income group countries: An empirical investigation. Environ. Sci. Pollut. Res. 2020, 27, 37745–37759. [Google Scholar] [CrossRef]
  42. Adjei, M.; Song, H.; Cai, X.; Nketiah, E.; Obuobi, B.; Adu-Gyamfi, G. Globalization and economic complexity in the implementation of carbon neutrality in Africa’s largest economies. Sustain. Energy Technol. Assess. 2022, 52, 102347. [Google Scholar] [CrossRef]
  43. Chen, H.; Zhang, X.; Wu, R.; Cai, T. Revisiting the environmental Kuznets curve for city-level CO2 emissions: Based on corrected NPP-VIIRS nighttime light data in China. J. Clean. Prod. 2020, 268, 121575. [Google Scholar] [CrossRef]
  44. Jiang, L.; He, S.; Zhong, Z.; Zhou, H.; He, L. Revisiting environmental Kuznets curve for carbon dioxide emissions: The role of trade. Struct. Change Econ. Dyn. 2019, 50, 245–257. [Google Scholar] [CrossRef]
  45. Nair, M.; Arvin, M.B.; Pradhan, R.P.; Bahmani, S. Is higher economic growth possible through better institutional quality and a lower carbon footprint? Evidence from developing countries. Renew. Energy 2021, 167, 132–145. [Google Scholar] [CrossRef]
  46. Li, S.; Wang, S. Examining the effects of socioeconomic development on China’s carbon productivity: A panel data analysis. Sci. Total Environ. 2019, 659, 681–690. [Google Scholar] [CrossRef]
  47. Wu, Y.; Yao, L. Carbon productivity and economic growth patterns in China. Econ. Res.-Ekonomska Istraživanja 2023, 36, 1247–1260. [Google Scholar] [CrossRef]
  48. Ma, S.; Li, Z.; Li, L.; Yuan, M. Coupling coordination degree spatiotemporal characteristics and driving factors between new urbanization and construction industry: Evidence from China. Eng. Constr. Archit. Manag. 2022, 30, 5280–5301. [Google Scholar] [CrossRef]
  49. Yang, M.; Feng, L. An Empirical Study on the University Collaborative lnnovation System Based on Coupling Collaborative Model. Theory Pract. Contemp. Educ. 2022, 14, 74–83. [Google Scholar] [CrossRef]
  50. Yang, Z.; Hu, W.; Shao, J.; Shou, Y.; He, Q. How does digitalization alter the paradox of supply base concentration? The effects of digitalization intensity and breadth. Int. J. Oper. Prod. Manag. 2023, 43, 1690–1722. [Google Scholar] [CrossRef]
  51. Zhou, H.; Wang, Q.; Li, L.; Teo, T.S.H.; Yang, S. Supply chain digitalization and performance improvement: A moderated mediation model. Supply Chain Manag. 2023, 28, 993–1008. [Google Scholar] [CrossRef]
  52. Rubino, M.; Maggino, F.; Antonicelli, M. Measuring human IT agility and firms’ digitalization using POSET: Evidence from Italy. Int. J. Qual. Reliab. Manag. 2023, 41, 127–149. [Google Scholar] [CrossRef]
  53. Tang, X.; Miu, Y.; Sun, Y.; Dong, L. Research on digital maturity measurement and influencing factors of advanced equipment manufacturing enterprises. Sci. Res. Manag. 2022, 43, 10–19. [Google Scholar] [CrossRef]
  54. Lee, M.-J.; Roh, T. Digitalization capability and sustainable performance in emerging markets: Mediating roles of in/out-bound open innovation and coopetition strategy. Manag. Decis. 2023; ahead-of-print. [Google Scholar] [CrossRef]
  55. Dey, P.K.; Malesios, C.; De, D.; Budhwar, P.; Chowdhury, S.; Cheffi, W. Circular economy to enhance sustainability of small and medium-sized enterprises. Bus. Strategy Environ. 2020, 29, 2145–2169. [Google Scholar] [CrossRef]
  56. Li, M.; Huang, Y.; Zhu, W.; Zhang, F.; Chang, X. Research on the Carbon Emission Total Factor Productivity of the Transportation Industry in China Based on the Global Malmquist-luenberger Index. Sci. Technol. Manag. Res. 2021, 41, 203–211. [Google Scholar] [CrossRef]
  57. Oh, D.-H. A global Malmquist-Luenberger productivity index. J. Product. Anal. 2010, 34, 183–197. [Google Scholar] [CrossRef]
  58. Visnjic, I.; Ringov, D.; Arts, S. Which Service? How Industry Conditions Shape Firms’ Service-Type Choices. J. Prod. Innov. Manag. 2019, 36, 381–407. [Google Scholar] [CrossRef]
  59. Zhang, J.; Qi, L.; Wang, C.; Lyu, X. The impact of servitization on the environmental and social performance in manufacturing firms. J. Manuf. Technol. Manag. 2021, 33, 425–447. [Google Scholar] [CrossRef]
  60. Suarez, F.F.; Cusumano, M.A.; Kahl, S.J. Services and the business models of product firms: An empirical analysis of the software industry. Manag. Sci. 2013, 59, 420–435. [Google Scholar] [CrossRef]
  61. Xu, F.; Huang, Q.; Yue, H.; He, C.; Wang, C.; Zhang, H. Reexamining the relationship between urbanization and pollutant emissions in China based on the STIRPAT model. J. Environ. Manag. 2020, 273, 111134. [Google Scholar] [CrossRef]
  62. Zheng, G.; Wang, W.; Jiang, C.; Jiang, F. Can Rural Industrial Convergence Improve the Total Factor Productivity of Agricultural Environments: Evidence from China. Sustainability 2023, 15, 16432. [Google Scholar] [CrossRef]
  63. Hansen, B.E. Threshold effects in non-dynamic panels: Estimation, testing, and inference. J. Econom. 1999, 93, 345–368. [Google Scholar] [CrossRef]
  64. Kaya, Y.; Yokobori, K. Environment, Energy, and Economy: Strategies for Sustainability; United Nations University Press: Tokyo, Japan, 1997. Available online: https://www.osti.gov/biblio/650045 (accessed on 22 March 2024).
  65. Chaofan, C.; Lan, Q.; Gao, M.; Sun, Y. Green total factor productivity growth and its determinants in China’s industrial economy. Sustainability 2018, 10, 1052. [Google Scholar] [CrossRef]
  66. Yu, S.; Fan, X.; Jiang, H. Research on the lmpact of Digital Economy Development on Carbon Productivity Improvement. J. Stat. Inf. 2022, 37, 26–35. [Google Scholar] [CrossRef]
  67. Wang, X. Research on the Impact of Agglomeration on Carbon Productivity in China’s Service Industry. Ph.D. Thesis, Wuhan University of Technology, Wuhan, China, 2020. [Google Scholar] [CrossRef]
  68. Zheng, Y.; Yang, R. Research on Carbon Emission Reduction Effect and Spatial Spillover of Manufacturing Service. Soft Sci. 2023, 37, 70–76. Available online: https://kns.cnki.net/kcms/detail/detail.aspx?FileName=XUXI2022122200A&DbName=DKFX2022 (accessed on 22 March 2024).
  69. Xiao, X.; Zhou, C.; Mao, H. What can satisfy customers in servitization? Service or goods innovation. J. Bus. Ind. Mark. 2022, 38, 2030–2046. [Google Scholar] [CrossRef]
  70. Dotzel, T.; Shankar, V.; Berry, L.L. Service Innovativeness and Firm Value. J. Mark. Res. 2013, 50, 259–276. [Google Scholar] [CrossRef]
  71. Xing, Z.; Huang, J.; Wang, J. Unleashing the potential: Exploring the nexus between low-carbon digital economy and regional economic-social development in China. J. Clean. Prod. 2023, 413, 137552. [Google Scholar] [CrossRef]
  72. Zhang, W.; Zhang, T.; Wang, S.; Li, H. CO2 emission spillover effects in the digital transformation of China’s manufacturing industry and its inter-industry differences. Energy Rep. 2023, 10, 520–534. [Google Scholar] [CrossRef]
  73. Zong, Y.; Gu, G. The threshold effect of manufacturing Servitization on carbon emission: An empirical analysis based on multinational panel data. Struct. Change Econ. Dyn. 2022, 60, 353–364. [Google Scholar] [CrossRef]
  74. Zheng, R.; Wu, G.; Cheng, Y.; Liu, H.; Wang, Y.; Wang, X. How does digitalization drive carbon emissions? The inverted U-shaped effect in China. Environ. Impact Assess. Rev. 2023, 102, 107203. [Google Scholar] [CrossRef]
  75. Chen, W.; Yao, L. The impact of digital economy on carbon total factor productivity: A spatial analysis of major urban agglomerations in China. J. Environ. Manag. 2024, 351, 119765. [Google Scholar] [CrossRef] [PubMed]
  76. Saia, A. Digitalization and CO2 emissions: Dynamics under R&D and technology innovation regimes. Technol. Soc. 2023, 74, 102323. [Google Scholar] [CrossRef]
  77. Kohtamäki, M.; Parida, V.; Patel, P.C.; Gebauer, H. The relationship between digitalization and servitization: The role of servitization in capturing the financial potential of digitalization. Technol. Forecast. Soc. Chang. 2020, 151, 119804. [Google Scholar] [CrossRef]
  78. Chen, Y.; Visnjic, I.; Parida, V.; Zhang, Z. On the road to digital servitization—The (dis)continuous interplay between business model and digital technology. Int. J. Oper. Prod. Manag. 2021, 41, 694–722. [Google Scholar] [CrossRef]
  79. Chang, S.-C.; Li, M.-H. Impacts of Foreign Direct Investment and Economic Development on Carbon Dioxide Emissions Across Different Population Regimes. Environ. Resour. Econ. 2019, 72, 583–607. [Google Scholar] [CrossRef]
  80. Wang, J.; Wang, W.; Wu, H.; Liu, Y. Exploring the effects of manufacturing servitization on enterprise energy conservation and emissions reduction moderated by digital transformation. Energy Econ. 2023, 122, 106706. [Google Scholar] [CrossRef]
Figure 1. Manufacturing DSS degree of 30 provinces in China, 2013–2020.
Sustainability 16 02655 g001
Figure 2. Average level of DSS in manufacturing, 2013–2020.
Sustainability 16 02655 g002
Figure 3. Single threshold estimates and 95% confidence intervals for DSS.
Sustainability 16 02655 g003
Figure 4. Dual threshold estimates and 95% confidence intervals for economic growth.
Sustainability 16 02655 g004
Table 1. DSS evaluation criteria.
Range of ValuesGradeLevel IdentificationSynergy State Description
0 ≤ DSS < 0.2IncongruityENo synergy, in a state of irrelevance, with a bias towards disorderly development
0.2 ≤ DSS < 0.4Severe disorderDLower level of synergy, in a haphazard state, entering a slow growth phase
0.4 ≤ DSS < 0.6Primary coordinationCGeneral level synergy, in a state of loose partnership, entering an accelerated growth phase
0.6 ≤ DSS < 0.7Moderate coordinationBMedium–high-level synergy, in a state of healthy cooperation, entering a phase of rapid growth.
0.7 ≤ DSS < 0.8
0.8 ≤ DSS < 0.9Good coordinationAHigh synergy, in a highly cooperative state, entering a period of growth and mutation that will result in a new orderly structure
0.9 ≤ DSS ≤ lHigh-quality coordination
Table 2. Manufacturing digitalization indicator system.
TypeIndicator DescriptionIndicator Description
Digital InputNumber of enterprises with R&D activities [50] Reflects talent investment
Number of enterprises with R&D activities [50]
Percentage of businesses with e-commerce trading activities [51] Reflects infrastructure investment
R&D funding [50]
Computers per 100 people [52]
Number of websites per 100 businesses [52]
Digital OutputRevenue from sales of new products in manufacturing [53]Reflects the output of technical and economic benefits
Number of valid invention patents [53]
Operating income [53]
Unit energy consumption [54]Reflects the output of ecological benefits
Investment completed in industrial pollution control [55]
Table 3. Manufacturing digitalization level composite score.
Year20132014201520162017201820192020
Province
Beijing0.10960.17030.37740.38900.35270.31590.16290.2207
Tianjin0.17290.57850.49910.29290.24180.16050.62120.2814
Hebei0.25830.16820.41760.15290.07630.14380.35270.2435
Shanxi0.16360.20650.07610.03610.09450.17570.02760.0346
Inner Mongol0.01140.01650.01960.02410.02410.02110.02270.0273
Liaoning0.05080.05860.05430.05380.05630.06220.06570.0734
Jilin0.01140.01700.02010.02440.02660.02120.02280.0256
Heilongjiang0.01240.01650.01680.01940.02080.01880.02280.0286
Shanghai0.08870.10530.11270.11810.12410.12820.13980.1495
Jiangsu0.27990.33870.37670.41240.42090.44370.50230.5426
Zhejiang0.20910.23630.26350.28720.29510.31970.36650.4128
Anhui0.05950.08210.09770.11260.12560.13120.14890.1652
Fujian0.05800.07140.08190.09610.10190.11410.13160.1492
Jiangxi0.02050.02830.03790.04670.05610.06880.08530.1002
Shandong0.17520.20570.22910.26440.28450.28580.23650.2869
Henan0.06340.07910.09160.10360.11460.11880.12110.1337
Hubei0.05760.07370.08770.10360.10700.11800.13150.1457
Hunan0.05280.06700.07960.09370.10370.12210.13360.1483
Guangdong0.25720.30030.34680.40540.48100.52940.59990.6575
Guangxi0.01370.01760.01650.02220.02330.02580.02920.0348
Hainan0.01020.01320.01390.01520.01580.01390.01450.0146
Chongqing0.02230.03370.04290.05310.06110.06530.06990.0807
Sichuan0.03970.05520.06550.08190.09020.09190.10520.1212
Guizhou0.00480.00950.01330.02210.02480.02590.02770.0315
Yunnan0.00920.01500.02130.02730.02920.03100.03790.0399
Shanxi0.02320.03210.03640.04500.05050.05280.05870.0672
Gansu0.00380.00770.01070.01210.01070.01060.01340.0148
Qinghai0.00020.00170.00340.00470.00630.00900.01120.0124
Ningxia0.00160.00400.00700.00860.01010.01180.01070.0146
Xinjiang0.00260.00600.00810.00910.00860.01030.01120.0132
Table 4. Manufacturing servitization indicator system.
TypeIndicator DescriptionReferences
Servicing Input IndicatorsSelling costs [58]Reflect capital investment in marketing, after-sales, and others
Management costs [58]
Finance costs [58]
R&D funding [59]Reflect labor input in R&D, design, and others
R&D staff [59]
Servicing Output IndicatorsOperating income [60]Reflect the service output of manufacturing
Number of valid invention patents [59]
Table 5. Manufacturing servitization level composite score.
Year20132014201520162017201820192020
Province
Beijing0.60520.57910.98110.74310.72280.85050.62260.6488
Tianjin0.46880.43400.75470.63860.74170.22350.67630.6284
Hebei0.48480.38030.53700.48480.53560.52250.36720.4891
Shanxi0.54280.56600.76340.39910.36140.65020.59070.5515
Inner Mongol0.38170.54140.46150.42670.95360.22500.63280.5269
Liaoning0.51520.67630.64880.36870.27290.56890.61830.7663
Jilin0.50650.52540.54140.44850.76780.90860.05950.5022
Heilongjiang0.44120.55880.55590.53850.68940.32800.58200.7083
Shanghai0.27720.58490.61100.96370.51670.81710.87660.4136
Jiangsu0.47750.39040.66330.61680.67920.63720.39910.4107
Zhejiang0.49930.39910.63860.48770.56460.51520.58930.6226
Anhui0.68070.63570.74600.68650.59360.60090.37590.5864
Fujian0.46730.44120.75470.65460.58930.55590.63130.6415
Jiangxi0.50800.42090.67340.45140.54280.40200.29460.5588
Shandong0.55300.53990.68650.57910.62260.62260.27140.3309
Henan0.46730.48040.72420.52250.57910.84330.00000.6575
Hubei0.49490.57180.72860.63570.67490.52250.40490.7576
Hunan0.57910.55730.67050.50070.66040.65310.35700.5515
Guangdong0.56170.59650.90860.90860.63430.75040.49060.5646
Guangxi0.61390.59220.88970.64150.60230.79970.24960.3861
Hainan0.62120.74600.67341.00000.50070.23800.77650.5849
Chongqing0.49780.34250.66910.60670.90420.45570.35560.5922
Sichuan0.50220.68800.54860.54570.64440.51670.37740.5573
Guizhou0.73580.70680.68210.54430.71410.41220.29610.5080
Yunnan0.62120.57760.60960.45860.39620.49640.66040.4819
Shanxi0.52540.47750.63280.59940.62260.85340.46590.7184
Gansu0.65890.63280.66040.51090.45570.69520.53270.4369
Qinghai0.76050.53270.99130.24820.56310.71990.31350.7228
Ningxia0.58640.65890.57470.41650.49060.62550.68510.7286
Xinjiang0.55300.53700.65020.41220.60960.88390.76780.6531
Table 6. Degree of DSS and level of coordination in manufacturing.
Year20132014201520162017201820192020
Province
Beijing0.5075 (C)0.5604 (C)0.7801 (B)0.7332 (B)0.7106 (B)0.7199 (B)0.5644 (C)0.6151 (B)
Tianjin0.5336 (C)0.7078 (B)0.7834 (B)0.6577 (B)0.6507 (B)0.4352 (C)0.8051 (A)0.6485 (B)
Hebei0.5949 (C)0.5029 (C)0.6881 (B)0.5218 (C)0.4497 (C)0.5235 (C)0.5999 (C)0.5874 (C)
Shanxi0.5459 (C)0.5847 (C)0.4909 (C)0.3464 (D)0.4298 (C)0.5814 (C)0.3574 (D)0.3716 (D)
Inner Mongol0.2570 (D)0.3072 (D)0.3083 (D)0.3184 (D)0.3894 (D)0.2626 (D)0.3463 (D)0.3465 (D)
Liaoning0.4021 (C)0.4461 (C)0.4332 (C)0.3753 (D)0.3520 (D)0.4337 (C)0.4490 (C)0.4870 (C)
Jilin0.2754 (D)0.3074 (D)0.3230 (D)0.3233 (D)0.3780 (D)0.3726 (D)0.1919 (F)0.3366 (D)
Heilongjiang0.2718 (D)0.3100 (D)0.3109 (D)0.3196 (D)0.3460 (D)0.2804 (D)0.3393 (D)0.3773 (D)
Shanghai0.3960 (D)0.4982 (C)0.5123 (C)0.5809 (C)0.5032 (C)0.5689 (C)0.5917 (C)0.4987 (C)
Jiangsu0.6046 (B)0.6030 (B)0.7070 (B)0.7102 (B)0.7312 (B)0.7292 (B)0.6691 (B)0.6871 (B)
Zhejiang0.5684 (C)0.5542 (C)0.6405 (B)0.6118 (B)0.6389 (B)0.6371 (B)0.6817 (B)0.7120 (B)
Anhui0.4486 (C)0.4780 (C)0.5195 (C)0.5273 (C)0.5226 (C)0.5299 (C)0.4864 (C)0.5579 (C)
Fujian0.4057 (C)0.4213 (C)0.4987 (C)0.5008 (C)0.4951 (C)0.5019 (C)0.5369 (C)0.5562 (C)
Jiangxi0.3193 (D)0.3304 (D)0.3996 (D)0.3811 (D)0.4178 (C)0.4078 (C)0.3981 (D)0.4864 (C)
Shandong0.5579 (C)0.5773 (C)0.6298 (B)0.6256 (B)0.6488 (B)0.6495 (B)0.5034 (C)0.5551 (C)
Henan0.4150 (C)0.4415 (C)0.5075 (C)0.4824 (C)0.5076 (C)0.5626 (C)0.0079 (E)0.5445 (C)
Hubei0.4108 (C)0.4530 (C)0.5028 (C)0.5066 (C)0.5184 (C)0.4983 (C)0.4804 (C)0.5764 (C)
Hunan0.4182 (C)0.4396 (C)0.4807 (C)0.4654 (C)0.5115 (C)0.5314 (C)0.4673 (C)0.5348 (C)
Guangdong0.6165 (B)0.6506 (B)0.7492 (B)0.7790 (B)0.7432 (B)0.7939 (B)0.7365 (B)0.7806 (B)
Guangxi0.3026 (D)0.3197 (D)0.3478 (D)0.3456 (D)0.3440 (D)0.3788 (D)0.2922 (D)0.3404 (D)
Hainan0.2823 (D)0.3149 (D)0.3113 (D)0.3509 (D)0.2984 (D)0.2396 (D)0.3258 (D)0.3038 (D)
Chongqing0.3246 (D)0.3279 (D)0.4115 (C)0.4237 (C)0.4849 (C)0.4153 (C)0.3971 (D)0.4675 (C)
Sichuan0.3757 (D)0.4415 (C)0.4354 (C)0.4597 (C)0.4911 (C)0.4669 (C)0.4464 (C)0.5098 (C)
Guizhou0.2437 (D)0.2863 (D)0.3085 (D)0.3311 (D)0.3648 (D)0.3215 (D)0.3010 (D)0.3558 (D)
Yunnan0.2749 (D)0.3050 (D)0.3374 (D)0.3345 (D)0.3280 (D)0.3522 (D)0.3977 (D)0.3725 (D)
Shanxi0.3323 (D)0.3519 (D)0.3895 (D)0.4054 (C)0.4210 (C)0.4608 (C)0.4067 (C)0.4687 (C)
Gansu0.2240 (D)0.2642 (D)0.2898 (D)0.2805 (D)0.2646 (D)0.2931 (D)0.2908 (D)0.2838 (D)
Qinghai0.1055 (E)0.1745 (E)0.2409 (D)0.1852 (F)0.2441 (D)0.2837 (D)0.2432 (D)0.3079 (D)
Ningxia0.1741 (E)0.225 (D)0.2520 (D)0.2448 (D)0.2656 (D)0.2930 (D)0.2923 (D)0.3213 (D)
Xinjiang0.1956 (E)0.2385 (D)0.2691 (D)0.2472 (D)0.2690 (D)0.3087 (D)0.3046 (D)0.3047 (D)
Table 7. Descriptive statistics.
VariableNMeanStd.Dev.MinMax
CP2400.9760.6710.1633.679
DSS2400.4410.1510.0080.805
Table 8. Correlation analysis.
CPDSSscalidebtprogovtra
CP1
DSS0.506 ***1
scal−0.123 *−0.0631
idebt−0.644 ***−0.375 ***0.0071
pro0.226 ***0.126 *−0.037−0.437 ***1
gov−0.519 ***−0.600 ***0.306 ***0.491 ***−0.246 ***1
tra0.361 ***0.530 ***−0.365 ***−0.304 ***0.142 **−0.701 ***1
Note: *, **, and *** denote significance levels of 10%, 5%, and 1%, respectively.
Table 9. Panel data model selection: test results.
Test MethodsTime EffectIndividual EffectDouble Effectchi2()Prob > chi2()
F-StatisticsProb > FF-StatisticsProb > FF-StatisticsProb > F
Hausman Test 678.420.00
F Test15.690.0015.690.0023.810.00
Table 10. Fundamental regression results.
VariablesFull SampleThe EastThe MidwestU-Shaped InspectionU-Shaped Inspection
(1)(2)(1)(2)(1)(2)(3)(4)
CPCPCPCPCPCPCPCP
DSS2.224 ***0.265 **1.953 ***0.750 *0.992 ***0.116−0.859 **−1.238 ***
(11.64)(2.512)(5.471)(1.861)(3.610)(0.933)(−2.293)(−3.602)
DSS2 1.606 ***1.990 ***
(3.321)(4.575)
scal−0.126 **0.0136−0.1760.0416−0.118−0.0111 0.0136
(−2.093)(0.300)(−1.639)(0.834)(−1.538)(−0.183) (0.316)
idebt−3.411 ***−0.536 *−4.321 ***−0.533−3.182 ***−0.259 −0.634 **
(−8.476)(−1.736)(−5.071)(−0.416)(−6.994)(−0.647) (−2.146)
pro−0.342−0.2433.3946.186 **−1.609 **−0.515 −0.575 *
(−0.466)(−0.778)(1.554)(2.342)(−2.264)(−1.492) (−1.873)
gov0.699 ***−1.401 ***−0.317−6.347 ***0.563 *−1.237 *** −1.491 ***
(2.642)(−6.456)(−0.462)(−4.353)(1.956)(−5.110) (−7.179)
tra−0.434 **−0.973 ***−0.340−1.158 ***−0.05850.674 −0.664 **
(−2.554)(−3.116)(−1.104)(−3.644)(−0.274)(1.286) (−2.178)
Constant2.289 ***3.005 ***2.674 ***9.561 ***1.911 ***−0.3710.715 ***2.745 ***
(5.517)(4.839)(3.084)(5.376)(3.879)(−0.345)(9.834)(4.617)
Observations2402408888152152240240
R-squared0.6430.9790.6460.9590.4450.9660.9730.981
TE YES YES YESYESYES
FE YES YES YESYESYES
Note: *, **, and *** denote significance levels of 10%, 5%, and 1%, respectively; t-values in parentheses.
Table 11. Robustness tests.
VariablesCP (1)CP (2)
L.CP 1.095 ***
(50.11)
L.DSS0.184 *
(1.863)
DSS 0.270 ***
(3.242)
Control VariableYESYES
Constant2.965 ***0.120
(4.107)(0.798)
Observations210210
R-squared0.983
TEYESYES
FEYESYES
AR(1)(p-value) 0.029
AR(2) (p-value) 0.117
Hansen (p-value) 0.078
Note: * and *** denote significance levels of 10% and 1%, respectively; t-values in parentheses.
Table 12. Intermediary effect test.
VariablesCP (1)sit (2)str (3)CP (4)CP (5)
DSS0.334 ***−0.4780.184 **0.268 ***0.281 ***
(3.067)(−1.530)(2.062)(2.658)(2.620)
sit −0.138 ***
(−6.098)
str 0.290 ***
(3.461)
Constant0.510 ***4.231 ***0.564 ***1.093 ***0.347 ***
(12.93)(37.40)(17.46)(10.69)(5.700)
Observations240240240240240
R-squared0.9720.9160.9310.9760.973
TEYESYESYESYESYES
FEYESYESYESYESYES
Note: **, and *** denote significance levels of 5%, and 1%, respectively; t-values in parentheses.
Table 13. Soble test results.
Intermediate VariablesIndirect EffectsDirect EffectsTotal EffectPercentage of Intermediary EffectZ Statistic
sit0.166 ***1.959 ***2.125 ***7.79%3.071 ***
str0.120 **2.005 ***2.125 ***5.63%2.392 **
Note: **, and *** denote significance levels of 5%, and 1%, respectively.
Table 14. Test results of the threshold effect.
Independent VariableThreshold VariableHypothesis TestingRSSMSEF-Statisticsp-ValueThreshold Value95% Confidence Interval
DSSDSSsingle threshold0.57880.002536.86 ***0.00000.2383[0.2350, 0.2433]
double threshold0.54370.002314.960.11330.3471
triple threshold0.52300.00239.200.60330.5011
DSSincomesingle threshold0.60190.002626.53 **0.02676.5937[5.9234, 7.1117]
[10.7945, 11.0311]
double threshold0.55670.002418.86 **0.050010.8619
triple threshold0.54170.00236.420.763311.2032
Note: **, and *** denote significance levels of 5%, and 1%, respectively.
Table 15. Parameter estimation results of the threshold regression model.
Dependent VariableCP (1)CP (2)
Independent VariableDSSDSS
Threshold VariableDSSincome
DSS (DSS < θ1)0.864 ***
(5.741)
DSS (DSS ≥ θ1)0.418 ***
(3.160)
DSS (income < γ1) −0.073
(−0.482)
DSS (γ1 ≤ income < γ2) 0.250 **
(2.251)
DSS (income ≥ γ2) 0.059
(0.452)
Control VariableYESYES
Constant−1.907 ***−1.768 ***
(−4.476)(−4.209)
Observations240240
R-squared0.6770.687
Note: **, and *** denote significance levels of 5%, and 1%, respectively; t-values in parentheses.
Disclaimer/Publisher’s Note: The statements, opinions and data contained in all publications are solely those of the individual author(s) and contributor(s) and not of MDPI and/or the editor(s). MDPI and/or the editor(s) disclaim responsibility for any injury to people or property resulting from any ideas, methods, instructions or products referred to in the content.

