Article

Optimal Design of Grid-Connected Hybrid Renewable Energy System Considering Electric Vehicle Station Using Improved Multi-Objective Optimization: Techno-Economic Perspectives

by
Ameer A. Kareim Al-Sahlawi
1,2,*,
Shahrin Md. Ayob
1,*,
Chee Wei Tan
1,
Hussein Mohammed Ridha
3,4 and
Dhafer Manea Hachim
5
1
Division of Electrical Power Engineering, Faculty of Electrical Engineering, Universiti Teknologi Malaysia, UTM, Skudai 81310, Johor, Malaysia
2
Department of Electrical Engineering, Faculty of Engineering, University of Kufa, Kufa 54001, Iraq
3
Advanced Lightning, Power and Energy Research (ALPER), Department of Electrical and Electronics Engineering, Faculty of Engineering, Universiti Putra Malaysia, Serdang 43400, Selangor, Malaysia
4
Department of Computer Engineering, Mustansiriyah University, Baghdad 14022, Iraq
5
Engineering Technical College/Najaf, Al-Furat Al-Awsat Technical University, Najaf 31001, Iraq
*
Authors to whom correspondence should be addressed.
Sustainability 2024, 16(6), 2491; https://doi.org/10.3390/su16062491
Submission received: 16 January 2024 / Revised: 25 February 2024 / Accepted: 1 March 2024 / Published: 17 March 2024
(This article belongs to the Special Issue Applications and Technologies of Renewable Energy)

Abstract

:
Electric vehicle charging stations (EVCSs) and renewable energy sources (RESs) have been widely integrated into distribution systems. Electric vehicles (EVs) offer advantages for distribution systems, such as increasing reliability and efficiency, reducing pollutant emissions, and decreasing dependence on non-endogenous resources. In addition, vehicle-to-grid (V2G) technology has made EVs a potential form of portable energy storage, alleviating the random fluctuation of renewable energy power. This paper simulates the optimal design of a photovoltaic/wind/battery hybrid energy system as a power system combined with an electric vehicle charging station (EVCS) using V2G technology in a grid-connected system. The rule-based energy management strategy (RB-EMS) is used to control and observe the proposed system power flow. A multi-objective improved arithmetic optimization algorithm (MOIAOA) concept is proposed to analyze the optimal sizing of the proposed system components by calculating the optimal values of the three conflicting objectives: grid contribution factor (GCF), levelled cost of electricity (LCOE), and energy sold to the grid ( E S O L D ). This research uses a collection of meteorological data such as solar radiation, temperature, and wind speed captured every ten minutes for one year for a government building in Al-Najaf Governorate, Iraq. The results indicated that the optimal configuration of the proposed system using the MOIAOA method consists of eight photovoltaic modules, two wind turbines, and thirty-three storage batteries, while the fitness value is equal to 0.1522, the LCOE is equal to 2.66 × 10 2 USD/kWh, the GCF is equal to 7.34 × 10 5 kWh, and the E S O L D is equal to 0.8409 kWh. The integration of RESs with an EV-based grid-connected system is considered the best choice for real applications, owing to their remarkable performance and techno-economic development.

1. Introduction

The energy crisis resulting from the rapid depletion of fossil resources has raised public awareness of the need for environmental conservation. Thanks to the united efforts of scientists, significant progress has been accomplished during the past ten years. Distributed renewable energy sources (RESs) are integrated into the electrical grid to meet the energy demand [1], and these distributed generation (DG) systems have made considerable use of RESs and electric vehicle charging stations (EVCSs) [2]. The idea of multi-objective techno-economic optimization was put forward in [3] as a way to plan when to charge and discharge electric vehicles. For the first time, frequency regulation was provided while simultaneously modeling and optimizing end-user energy costs, battery degradation, grid interactions, and CO2 emissions in the context of home microgrids. However, to increase reliability, optimize renewable energy sources, and lower overall costs, appropriate energy management and operation are necessary, along with an appropriate optimization technique based on techno-economic viewpoints.
In [4], the authors suggested a versatile multi-objective optimization method that considers the technological, financial, and environmental aspects while assessing and implementing V2G and grid-to-vehicle technologies. In addition, plug-in electric vehicle (PEV) users’ driving habits, charging and discharging habits, and battery life cycles are considered. The firefly algorithm is applied inside a stochastic optimization framework to run simulations on a modified IEEE 69-bus radial distribution test system. The goal is to minimize two objective functions: CO2 emissions and operational costs. The framework considers renewable generation, load usage, and the charging/discharging time of PEVs as ambiguous variables. The work in [5] offered hybrid renewable energy systems combined with mobile hydrogen vehicle storage and stationary batteries for a zero-energy community comprising office, residential, and academic buildings based on real-world energy consumption data and simulations. A time-of-use grid penalty cost model was presented to achieve electricity grid economy and flexibility, which evaluates grid export and import during on-peak and off-peak times. In the coupled platform of TRNSYS and jEplus + EA, multi-objective optimizations are carried out to size zero-energy buildings and the community while considering the self-consumption of renewable energy, on-site load coverage, and grid penalty cost. Methods for incorporating hydrogen energy technology into hybrid energy systems, focusing on hydrogen fuel cell power generation, were examined in [6]. Energy storage integration, sizing techniques, energy flow control, and the software implementation and optimization methods that go along with them were covered. Published case studies seldom address issues beyond technical ones. The authors talked about this fact in the context of accessible software packages. To meet the design objectives for the energy system, a four-dimensional multi-objective metaheuristic function was suggested, with weights assigned to environmental, economic, socio-political, and technical aspects.
Researchers in [7] looked into how responsive loads and the stochastic behavior of EVs (including their departure/arrival times and charge levels) could be used as demand-side management tools to improve the efficiency of a grid-connected microgrid that combines power, heating, and cooling systems. They suggested a multi-objective model considering responsive loads and electric cars for feeder reconfiguration, capacitor switching, and economical dispatching. The suggested model considers operating expenses, greenhouse gas emissions, the voltage stability index, and active power losses as objective functions. In addition to thermal and electrical energy storage devices, the microgrid based on a combined cooling, heating, and power system was outfitted with non-dispatchable distributed generators (photovoltaic (PV) cells and wind turbines (WTs)). Electric cars, thermal and electrical needs, and the stochastic behavior of non-dispatchable generators were considered for appropriate modeling. The max-geometric mean operator and fuzzy scaling were used in conjunction with a multi-objective hybrid big bang–big crunch algorithm to obtain the best answers. In [8], the multi-objective sand cat swarm optimization (MSCSO) algorithm was utilized to find a solution for the suggested model. Based on this, the daily stochastic economic scheduling of an electric thermal hydrogen integrated energy system (ETH-IES) was conducted to reduce operational expenses. The main concern of the authors of [9] was the economic and environmental aspects of microgrid (MG) functioning under different conditions. An analysis is conducted on an AC/DC hybrid MG with solar, diesel generator, lithium battery, and electric car charging stations. A constrained multi-objective optimization problem (CMOP) was constructed considering the operating restrictions of MG. The fuel cost, depreciation expenditure, and emission cost of distributed generators are the optimization goals of the proposed CMOP. A method for converting a multi-objective issue into a single-objective issue was introduced: the fuzzy comprehensive evaluation. Then, the solutions of distributed generator outputs are solved using the comprehensive learning particle swarm optimization (CLPSO). The optimization outcomes in grid-connected and islanded modes demonstrate the efficacy of the suggested models, techniques, and algorithm.
A multi-objective optimization approach utilizing the Normalized Normal Constraint (NNC) was utilized to evaluate two competing objectives: minimizing the operating costs of the Active Distribution System (ADS) and minimizing the power losses in the ADS [10]. In the interim, variable wind patterns, solar systems, and electric car arrival and departure timings are considered. The suggested model is a multi-objective problem with two stochastic phases run on a modified IEEE 18-bus test system in a General Algebraic Modeling System (GAMS) environment. In [11], to optimize the environmental and economic performance of an intelligent parking lot (IPL) with electric vehicles (EVs) while utilizing time-of-use (TOU) rates for demand response programs (DRPs), a bi-objective optimization model has been presented. ε-constraint and fuzzy decision-making strategies are applied to tackle this kind of problem, and the outcomes, which show the efficacy and efficiency of the methods used, are displayed for comparison. The IPL linked to the upstream net, renewable and non-renewable resources, and a hydrogen storage system make up the examined example model in that research. The bi-objective issue in question has been modelled using a MIP model, which is then simulated using GAMS. To facilitate the electrification of green transport, the authors in [12] suggested a multi-objective planning framework for electric vehicle (EV) charging stations in developing power networks. The effects of EV integration on financial and environmental criteria are examined in four examples. The suggested model was designed to integrate the planning models of transmission lines, energy storage systems (ESSs), renewable energy systems, and thyristor-controlled series compensators into the EV-based planning problem to make the construction of EVCSs easier. The second objective, on the other hand, was focused on decreasing the carbon dioxide emissions from fossil fuel-based power units to help the environment. The first objective function seeks to maximize the penetration of EVs by increasing the networks’ capacity to provide charging stations continuously throughout the day. Reducing the initial outlay and ongoing expenses for the installed equipment is the third goal, which aims to satisfy the financial needs. The multi-objective variant of the Gazelle optimization algorithm (MGOA) was used to find a solution for the suggested model, which was expressed as a multi-objective optimization problem. The suggested issue and a set of four benchmark test functions were solved to gauge the MGOA’s effectiveness.
A multi-objective optimization model was developed in [13] to reduce the gearbox losses, operational expenses, and carbon emissions of many microgrid systems. First, a brand-new technique based on a back propagation neural network enhanced by long short-term memory deep learning was put forth to anticipate the charging loads of EVs. A double-layer solution algorithm was proposed based on the forecast data. At the multiple-microgrid layer, it comprises an adaptive multi-objective evolutionary algorithm based on decomposition and differential evolution. At the single-microgrid layer, it consists of a modified consistency algorithm for rapid economic scheduling. In the end, a case study consisting of four interconnected IEEE microgrids was used to simulate the model system, and the suggested algorithm’s performance was contrasted with that of traditional multi-objective evolutionary algorithms based on decomposition. A methodology for optimization bound by dependability was introduced in [14] to determine the quantity and dimensions of microgrid (MG) system components. To accomplish this, issue reliability indicators for lost load anticipation and anticipated energy not delivered are introduced. The Monte Carlo sampling technique was used to represent the uncertainties related to load forecasting, modeling of all MG units, and random outage of all units. The suggested paper’s major objective was to determine the ideal MG size that would minimize operating, emission, and MG investment costs. Additionally, under the usage of time-of-use (TOU) rates of demand response programs (DRPs), a bi-objective optimization model has been presented for the best possible environmental performance and economic operation of MGs, including EVs. Fuzzy decision-making techniques and the ε-constraint are applied to alleviate this issue. Long-term planning was tackled as an optimization issue using the Tabu search method.
In [15], the authors compared the output of vehicle-to-home (V2H) and stationary battery (SB). They devised a multi-objective optimization approach for the household of EV owners utilizing energy expenses, comprising investment and CO2 emissions, as indices. As a case study, the authors used an imagined average Japanese detached house to assess the environmental and economic effects of solar electricity self-consumption utilizing SB or V2H. The findings indicated that, by 2030, non-commuting EV owners should consider investing in V2H if the cost of a bidirectional charger is one-third that of an affordable SB. In [16], for regional integrated energy systems (RIESs), a multi-objective optimization that takes electric cars (EVs) and renewable energy uncertainty into account was suggested. The RIES can balance the system’s environmental friendliness and economy. First, an orderly model for charging and discharging EVs with the following driving rules is built. It considers the impact of elements like disorderly access and EV charging/discharging on system functioning. Then, to address the uncertainty of renewable energy generation, a robust optimization model with a polyhedral uncertainty set was built. Additionally, a multi-objective function is constructed to minimize both operation costs and carbon emissions. A carbon emission penalty component is implemented to reduce the multi-objective solution to a single-objective solution. Ultimately, an actual RISE performs the validation.
The authors of [17] examined how a commercial PV charging station with ten electric car chargers should be commissioned. The charging station may purchase and sell power to the grid as it is linked to the main distribution network. A multi-objective optimization technique has been devised that minimizes the expenses associated with power losses in the distribution grid and the operational costs of the charging station. The owner of the charging station and the distribution system operator have their interests taken into account in the suggested solution. The minimal charge when the car exits the charging station, user comfort restrictions, and grid technical limits were also considered. A single day with a fifteen-minute resolution is the analysis period. In [18], the authors employed multi-objective optimization to find the best combination of energy and transportation technologies while maximizing the positive effects on the economy and environment.
In contrast to continuous multi-objective linear programming with average cost intervals, the authors showed the extra benefit of using multi-objective mixed integer linear programming (MOMILP) while considering economies of scale. The authors solved MOMILPs precisely using an enhanced version. The effect of policies on the Pareto frontier is evaluated to distinguish between optimum solutions with and without subsidies. The writers distinguished between the need for investments (bounded rationality) and minimizing economic life cycle costs (full rationality). An electrical and transportation-related Belgian corporation serves as an example of the methodology. Transportation technologies include internal combustion engine cars, grid-powered battery electric vehicles (BEVs), and solar-powered BEVs; electricity technologies include solar photovoltaics and the grid. Grid-powered BEVs have a limited ability to reduce greenhouse gas emissions, but they are less expensive to use than solar panels. It was discovered that current policy initiatives appropriately target rational investors who take life cycle costs into account, but private (possibly constrained rational) investors frequently concentrate primarily on needed investments.
To account for uncertainties arising from wind speed, solar irradiance, the conventional load, and PEV load demand, the authors in [19] proposed a multi-objective optimization methodology for the siting and sizing of solar distributed generations (SDGs), wind distributed generations (WDGs), and capacitor banks (CBs) inside the system of power. The primary goals are the overall cost, greenhouse gas emissions, and the voltage stability index. The associated uncertainties are handled using an unconventional point estimate method (PEM), while a chance-constrained programming technique handles the smooth constraints. Using the greatest entropy approach, the associated probability distribution functions of the output variables are computed. Moreover, Monte Carlo simulation was used for robustness analysis (MCS). The suggested approach was implemented on a standard radial distribution network. The fuzzy satisfactory technique chooses the Pareto front’s optimal trade-off solution.
An interval optimization strategy was suggested by [20] to represent the unpredictability of upstream grid prices. By changing the uncertainty-based profit function to a deterministic multi-objective problem and treating average and deviation profits as competing objective functions—average profit should reach the maximum, while deviation profit should reach the minimum—the authors presented a novel solution to the problem of electric vehicle aggregator uncertainty. The two-dimensional problem was also solved using the ε-constraint approach to obtain optimum Pareto solutions. Finally, the fuzzy satisfactory strategy was used to select a trade-off solution among Pareto solutions as a target to show the examined technique’s capabilities; it was also contrasted with the deterministic strategy and the proposed interval optimization approach.
Reference [21] describes the design of an islanded hybrid system (IHS) that includes a diesel generator, solar system, wind turbine (WT), and energy storage systems (ESSs) that are both mobile (electric cars) and stationary (battery). The suggested approach uses two distinct goal functions in a multi-objective optimization to reduce the overall cost of building, maintaining, and operating the sources and ESSs within the IHS and the system’s emission level. A single-objective optimization problem is created for the suggested design using the Pareto optimization methodology based on the ε-constraint method. In [22], the authors used a multi-objective framework to consider two objectives. A multi-objective mixed binary linear programming was provided to minimize the overall cost of energy consumption and peak load in communal residential structures. This programming considers the scheduling of electric car charging and discharging and battery energy storage systems. Then, the Pareto front solutions of the provided multi-objective model are obtained using the Pascoletti–Serafini scalarization technique. In the end, the suggested model’s performance was examined and documented using model simulations in two distinct scenarios.
Plug-in Electric Vehicles (PEVs) are used as storage units in a multi-objective power dispatching issue that the authors in [23] defined. The authors minimized three objectives, analyzed three criteria, and framed the energy storage planning as a Mixed-Integer Linear Programming (MILP) problem while adhering to PEV constraints. Two cost-to-variability measures based on the Sharpe Ratio are presented to analyze the energy storage schedules' volatility. Energy storage planning was optimized by adding these extra parameters to minimize the difference between two Sharpe Ratio indices, maximum peak load, PEV battery utilization, total Microgrid (MG) expenses, and maximum peak load. Pareto fronts are examined and discussed about various scenarios for energy storage. The most significant outcome of the study would be that schedules that lower the system's total cost could potentially be less dependable since they increase the maximum peak load and its unpredictability under different circumstances. In [24], a multi-objective framework was suggested for the day-to-day management of a smart grid (SG) with a high level of sensitive load penetration. To provide highly dependable power for sensitive loads, the Virtual Power Player (VPP) oversees the day-ahead scheduling of energy resources in the smart grid, considering the extensive usage of Distributed Generation (DG) and V2G. The collection of non-dominated solutions is identified by applying a Pareto front technique. To account for the dependability needs of sensitive and vulnerable loads, the mathematical formulation incorporates the maximization of the minimum available reserve in addition to the cost reduction.
By calculating the available capacity of EV aggregators, a preliminary investigation of the multi-objective optimum dispatch of the smart grid was suggested in [25]. A statistical model was used to determine the maximum possible capacity of EVs by describing their behavior. Subsequently, the multi-objective optimum dispatch was defined together with its constraints. The high-dimensional multi-objective enhancement issue was solved using the multi-objective genetic particle swarm optimizer to find the Pareto front. In [26], a mixed-integer linear programming (MILP) framework is created to measure flexibility in a sizable business park with limited access to historical time series data. The suggested mathematical model considers renewable energy sources, including solar energy, electric vehicle (EV) charging stations, heat pumps, and centralized energy storage systems. The quantification of flexibility was formulated as a bi-objective optimization problem, which was solved by utilizing the epsilon-constraint approach to approximate the set of Pareto-efficient solutions. The authors’ goal [27] was to optimize power loss, voltage deviation, and voltage imbalance factor—three significant objective functions—by concurrently allocating EVCSs and smart photovoltaic inverters in distribution networks. A unique hybrid fuzzy Pareto dominance idea with a differential evolution technique was suggested to address such a multi-objective optimization issue. A scenario-based approach was also employed to incorporate the uncertainties of the model that includes loads, PV generation, and EVCS demand. Next, under various case scenarios, the efficacy of the stochastic multi-objective strategy was investigated and confirmed on an imbalanced 37-bus network.
In [28], a residential microgrid with plug-in hybrid electric cars, PV units, battery energy storage systems, combined cooling, heating and power, and other components was modeled to determine the best scheduling state for each unit while accounting for the uncertainty of distributed energy resources. This was accomplished by modeling the uncertainties of solar irradiance, electrical and heat demand, and electrical market pricing using a scenario-based approach that uses the Normal, Weibull, and Beta probability distribution functions, respectively. Scenario reduction strategies are employed to choose representative situations generated using the scenario tree. The suggested issue was a mixed-integer nonlinear programming problem to minimize emissions and operation costs. The optimal solution on the Pareto front set is identified using a fuzzy approach, and the augmented ε-constraint method was utilized to solve this multi-objective problem. In [29], considering the time-of-use rates of a demand response program, a multi-objective optimization approach was proposed for the cost-effective operation and environmental performance of intelligent parking lots (IPLs). It was advised to address this problem using the multi-objective grasshopper optimization technique, since such a model is related to several practical bounds. The results show how well the compared methods using fuzzy decision-making strategies worked. To improve this approach and advance searching operators, chaos theory was utilized. Furthermore, the suggested multi-objective approach is a model developed utilizing non-dominated sorting theory, variable detection, fuzzy theory, and strategy selection-based memory to choose the best Pareto among a range of reliable options for handling the abovementioned difficulties.
Optimal nature-inspired metaheuristics algorithms tend to experience premature convergence and, in general, swiftly obtain both the local and almost global optimal states. The No Free Lunch (NFL) theorem [30] for finding the best algorithm to tackle all optimization problems states that not all algorithms are suited to address all problems. This is because no method is optimal for solving all optimization problems. On the other hand, each of the previously discussed approaches has its unique way of delivering the optimal solution in terms of performance when it comes to resolving and optimizing power issues.
A metaheuristic approach based on simulation was created [31] to identify the ideal size of a hybrid renewable energy system for residential buildings. The development of a dynamic multi-objective particle swarm optimization method was needed to solve this multi-objective optimization problem. The approach should maximize the buildings’ renewable energy ratio while minimizing the overall net present cost and carbon dioxide emissions for any necessary system modifications. The standard of the Pareto front generated by the proposed technique was assessed using three established performance indicators. A multi-objective optimization model that considers a multi-energy system and minimizes the overall cost and the life cycle emissions of vehicles and buildings was developed [32]. The model chooses the sorts of vehicle powertrains and the storage and conversion technologies the community utilizes to produce heat and electricity. The Pareto solutions that emerge depend on the shift from internal combustion engine cars to battery electric cars, and to a much lesser extent, plug-in hybrid cars. The heating energy is decarbonized by switching from gas boilers to heat pumps. In [33], the authors developed a multi-objective hydro–thermal–wind with EV scheduling (MOHTWES) issue by combining large-scale electric vehicles (EVs) with wind power generation. Furthermore, a better multi-objective particle swarm optimization (IMOPSO) approach was suggested to solve the aforementioned issue under several restrictions. The IMOPSO may provide good and well-distributed Pareto optimum solutions in objective space by providing a novel dual-population evolution mechanism and a hierarchical elitism-preserving method based on crowding entropy.
In [34], the issue of stochastic dynamic pricing and energy management policy for providers of EV charging services was examined. EV charging service providers face numerous uncertainties when energy storage systems and renewable energy integration are present. These include fluctuations in wholesale electricity prices, inherent intermittency in renewable energy generation, and volatility in charging demand. The goal was to provide guidelines to charging service providers to manage electricity and set appropriate charging prices while balancing the competing goals of increasing customer satisfaction, boosting profitability, and lessening their impact on the power grid despite these uncertainties. The authors devised a new metric to assess the impact on the power system without having to solve the full power flow equations. The approach incorporates a safeguard of profit to insulate service providers from extreme financial losses. Two algorithms are used to determine the price and electricity procurement policy: the greedy algorithm (benchmark algorithm) and the stochastic dynamic programming (SDP) algorithm. The multi-objective optimization’s Pareto front was determined. In [2], the authors suggested a multi-objective planning approach for allocating EVCSs and RESs in the best possible way. In particular, voltage variations, energy losses, and EV owners’ discontent are considered three sub-objectives to be minimized in the proposed RES and EVCS planning framework.
Furthermore, considering the various operating constraints of the grid, RESs, and EVCSs, active power curtailment of RESs is not an option. The suggested framework takes into consideration enhanced control systems for linking RES inverters, as well as grid-to-vehicle (G2V) and V2G schemes, to yield additional benefits. To address this holistic framework with conflicting sub-roles and find the Pareto-optimal solutions, a two-level method was proposed.
In this research, the proposed system comprises a PV–Wind–Battery system combined with EVCS using the vehicle-to-grid (V2G) technique. The thrilling Arithmetic Optimization Algorithm (AOA) has been improved to overcome its drawbacks, such as being trapped in a local search (stagnation in local minima), premature convergence, and neither the addition (A) nor the multiplication (M) operators being obtainable for the exploitation or exploration phases. In addition, in the AOA, the rudimentary mathematical models obtained in both the exploration and exploitation phases (There can never be a perfect balance between exploration and exploitation). Furthermore, most of the methods in the previous literature considered only a single objective during the optimization process for the proposed system (either an economic or technical objective). In this study, a Multi-Objective Improved Arithmetic Optimization Algorithm (MOIAOA) based on the Non-Scale multiple-run Pareto Front concept has been proposed to analyze the optimal sizing design of the proposed system components by calculating the optimal values of the three conflicting objectives, Grid Contribution Factor (GCF), Levelized Cost of Electricity (LCOE), and Energy sold to the grid ( E S O L D ). These three constraint objectives are used as renewability, economic, and technical criteria. The RB-EMS is used for controlling and monitoring the power flow of the proposed system. The results are performed to analyze the optimal sizing of the proposed system by using an optimal sizing method based on the MOIAOA Non-Scale multiple-run Pareto Front concept.
The following categories apply to the remaining sections. A description of the proposed system’s modeling components is given in Section 2. The criteria for the renewability, economic, and technical assessments are given in Section 3. Section 4 outlines the suggested methodology for sizing the PV/WT/battery system in conjunction with EVCS utilizing a vehicle-to-grid (V2G) technique in a grid-connected system. In contrast, Section 5 presents the findings and discussion. Section 6 wraps up the analysis and suggests next steps.

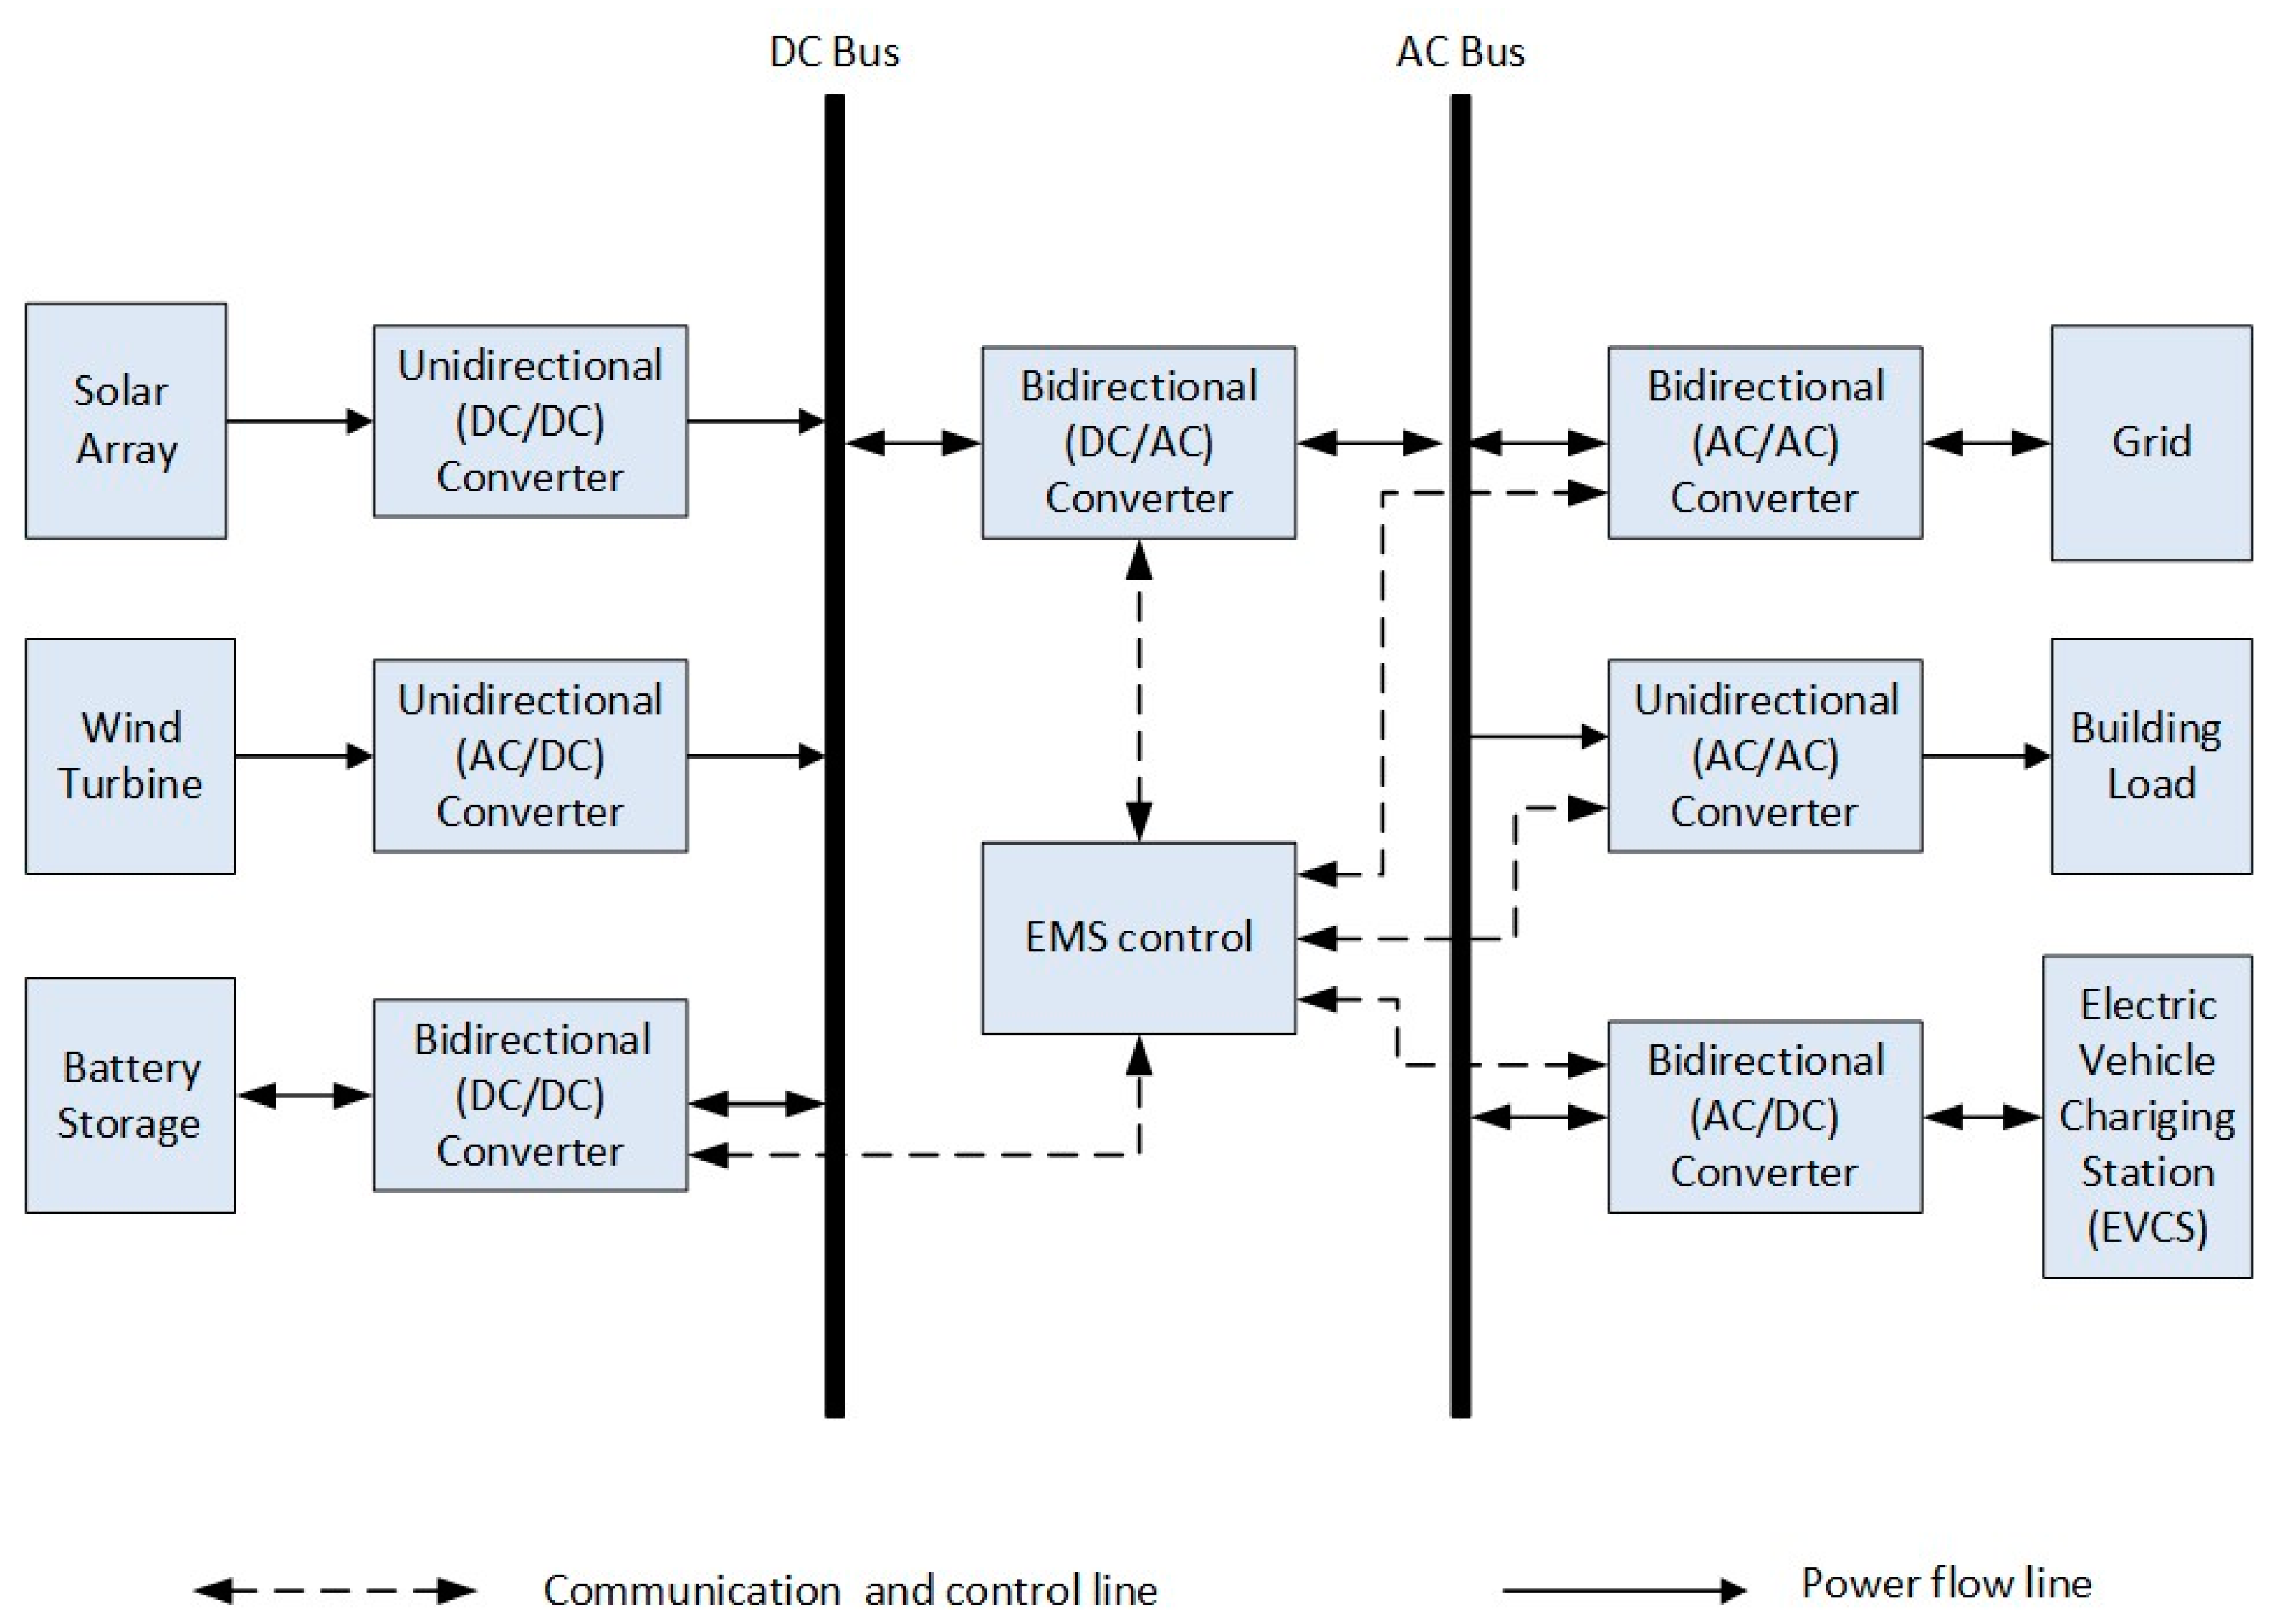
2. Mathematical Modeling of the Grid-Connected PV/WT/Battery System Combined with EVCS Using Vehicle-to-Grid (V2G) Technique

A mathematical equation is used to model the two different RESs stated earlier, namely the PV and WT, with additional components. That leads to determining the output power under different climate data of a government building located in Al-Najaf Governorate in Iraq.
The PV array, WT, EMS control, storage battery, unidirectional converter, bidirectional converter, grid, building load, and EVCS are the main components of the proposed system, as seen in Figure 1. These could differ greatly depending on several factors, including the availability of meteorological data, renewability–economic–technical parameters, and the intended power demand. The technical and economical specifications of the PV module used in the proposed system are given in Table 1.

2.1. Photovoltaic Panel Mathematical Modeling

PV is the most widely used RES for generating. In this research, polycrystalline solar panels (KD325GX-LFB) are taken into consideration. The panel manufacturers’ specifications and solar parameters are reported in [35,36,37]. The panels are inclined with an angle of 30 ° to the direction of the south. The modeled equation for the output power produced from the PV system is given in Equation (1) and reported in [37,38,39].
P p v o u t t = P P V r a t e d × G t 1000 × 1 + α t T a m b + 0.03125 × G t T C S T C  
where P P V r a t e d indicates the rated power for PV (in watts), αt is the temperature coefficient ( 3.7 × 10 3 ) 1/C, T C S T C is the cell temperature (in °C) under standard test condition (STC), and T a m b is the ambient temperature (in °C), respectively. G ( t ) refers to solar irradiance (in W/ m 2 ), 1000 W/ m 2 is the reference irradiance, and P p v o u t t is the PV output power (in watts). Equation (2) can be used to obtain the T C ( S T C ) [40]. NOCT is the nominal operating cell temperature in °C that the manufacturer can model.
T C ( S T C ) = T a m b + G t × N O C T 20   800  
Additionally, the value 0.03125 °C was obtained by subtracting the value of Nominal Operation Cell Temperature (NOCT), which is 45 °C in this study, from air temperature (20 °C) based on the PV module that the manufacturer has specified; the acquired result was divided by the irradiance on the cell surface (800 W/ m 2 ) to obtain 0.03125 °C [35]. The technical and economical specifications of the PV module used in the proposed system are given in Table 1.

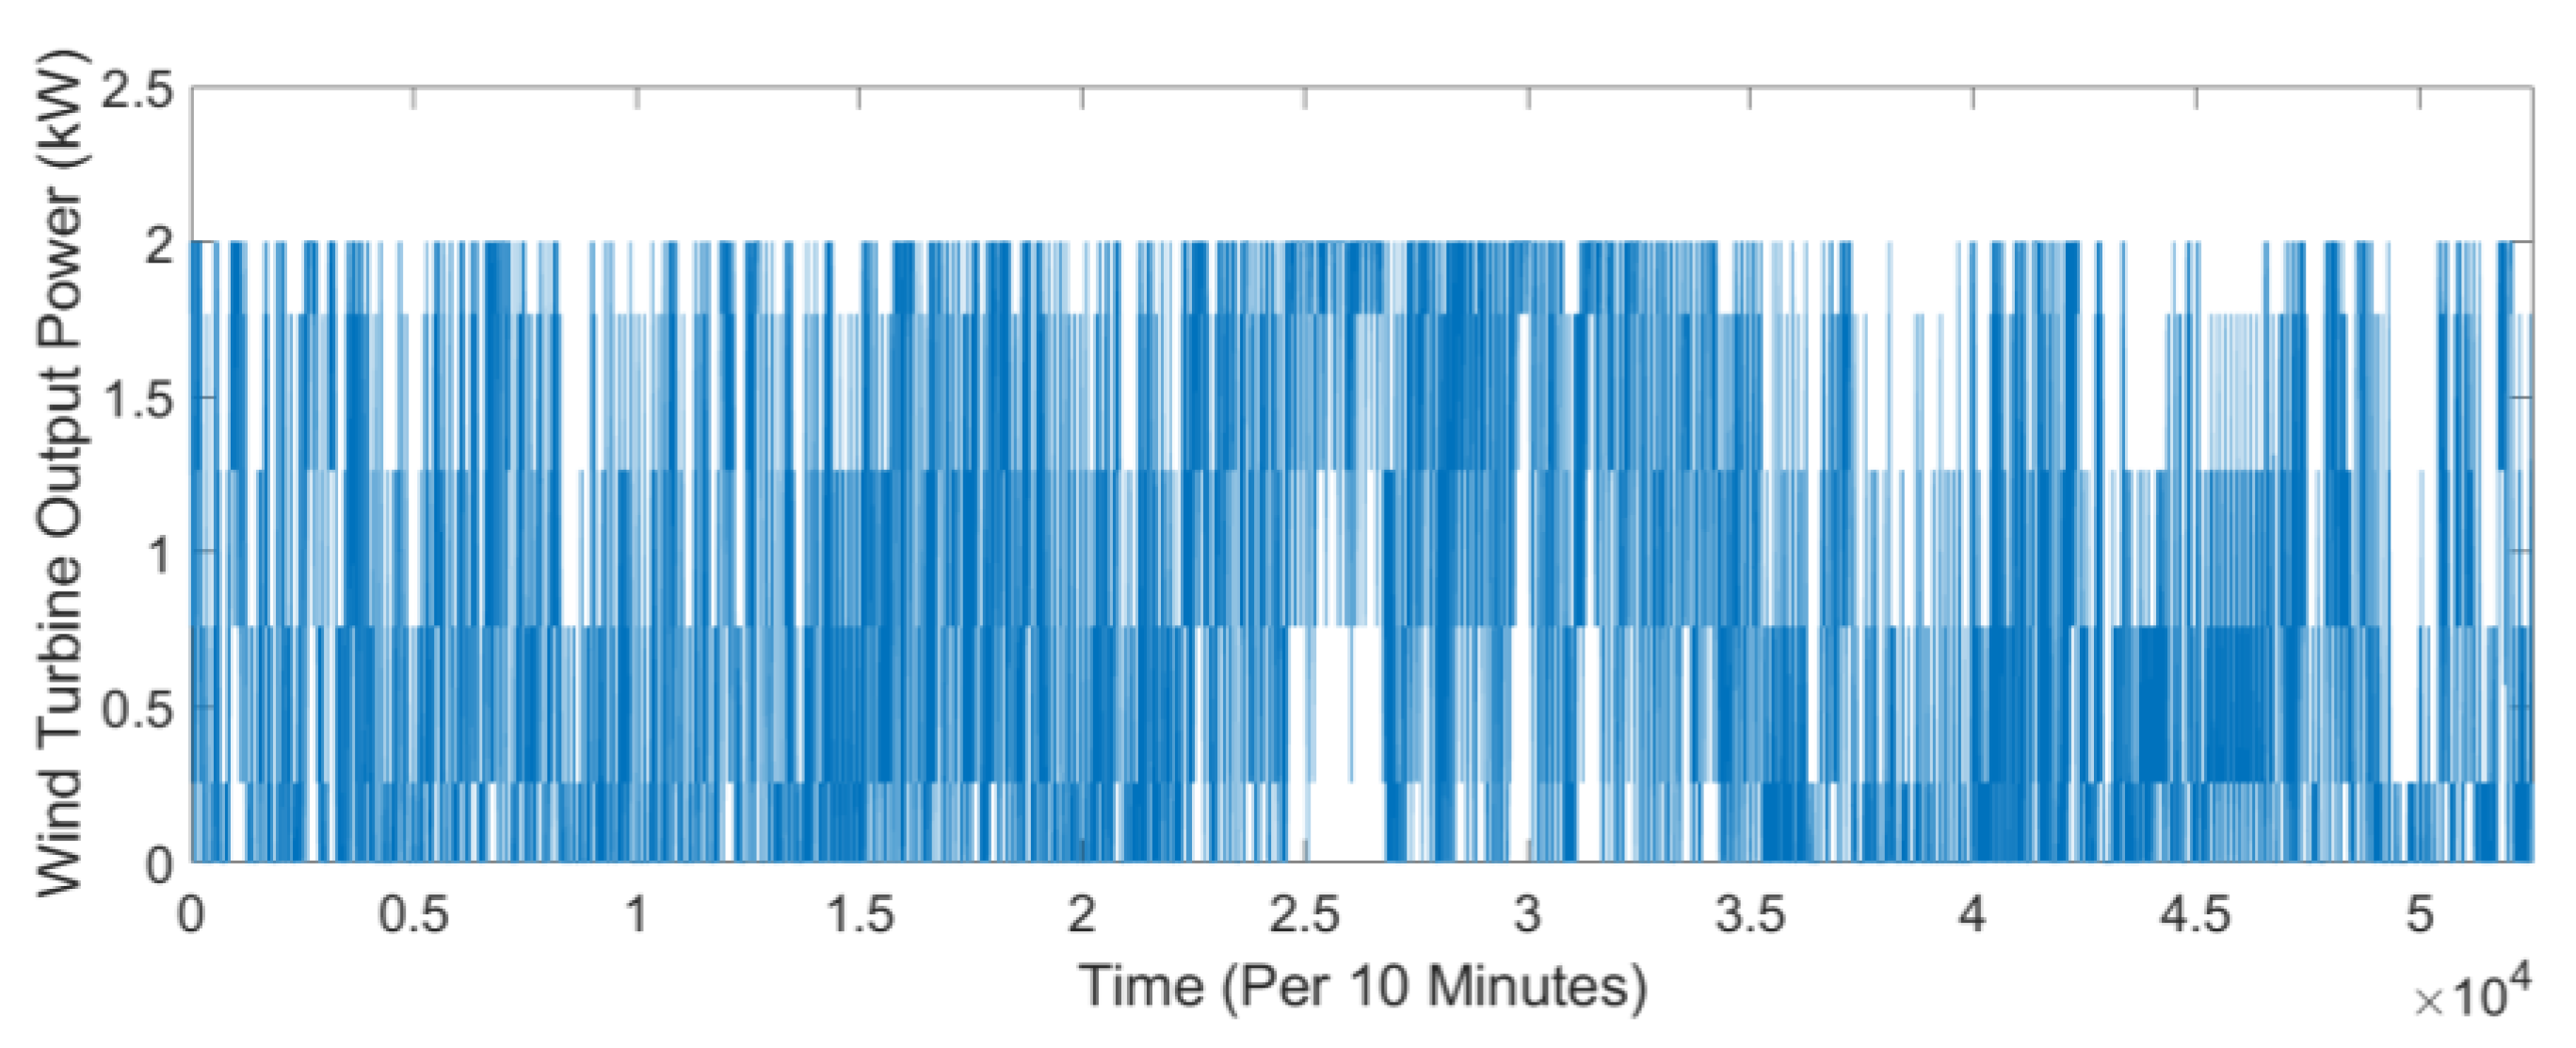
2.2. Wind Turbine Mathematical Modeling

Vertical and horizontal axis wind turbines are the products of axial categorization of wind turbines [41]. The horizontal axis wind turbine is the most widely utilized type of wind turbine for various reasons, including its capacity to capture the most wind energy, adaptability to low-wind conditions, and pitch angle adjustment capability to prevent strong windstorms [40]. Therefore, a wind turbine comprises three basic components: the generator, which has a gearbox and controls, and the rotor, which houses the blade and the frame. Equation (3) [38] presents the model equation for the output power produced by the WT. The economical and technical specifications of the WT used in the proposed system are given in Table 1.
P W T = 0 P r v t v c u t i n v r v c u t o u t P r       v t   v c u t i n   o r   v t v c u t o u t v c u t i n < v   < v r v r < v t < v c u t o u t
The variables v c u t i n and v c u t o u t represent the cut-in speed and cut-out speed, respectively. P r stands for rated power, v r for rated wind speed, and P W T is the produced output power of the WT, as indicated by the manufacturer [40]. Equation (4) illustrates how taking hub height into account can yield output power from WT with improved precision.
V 2 = V 1 h h r e f α
where h is hub height, h r e f is the reference height anemometer, and α is the power-law exponential, known as wind gradient, Hellmann exponent, or friction coefficient, which equals 1/7 [42]. The wind speed (m/s) is represented by V 2 and V 1 . It is evident that the cut-in wind speed v c u t i n , cut-out wind speed v c u t o u t , and rated wind speed v r , in that order, determine the output power generated from WT [43].

2.3. Battery Mathematical Modeling

Systems that store and release energy from renewable energy sources (RESs), such as solar, wind, and hydropower, are known as battery energy storage systems [44]. However, these RESs are known to have high intermittency. Energy is stored in a battery storage system (BSS) that can be used during a grid outage to reduce intermittency and boost system reliability and efficiency. Equation (5) [45] provides the mathematical formula to determine the nominal battery capacity.
C B = E L A D D O D   η i n v   η b
where C B is the battery’s nominal capacity, E L is its daily average load demand, DoD is the suggested depth of drain (80%), and autonomy days (usually 3–5 days) are represented, while the inverter’s efficiency, η i n v , equals 95% and the battery’s efficiency, η b , is 85%. The battery’s energy storage capacity is known as its state of charge (SoC) and its energy consumption is known as its depth of discharge (DoD) [42,43,45,46]. Additionally, the minimum depth of discharge and the value of DOD, which is set at 80%, may be computed using Equation (6) [47]. S o C m i n S o C b a t t S o C m a x represents the SoC’s border. Furthermore, the battery’s power output has a mathematical expression, as shown in Equation (7).
S O C B T _ M I N = 1 D O D × C B
P b t = P p v t + P W T t P l t η i n v
where η i n v is the inverter efficiency (95%) and P b ( t ) is the total power delivered from the battery, P P V ( t ) is the total power produced from PV, P W T ( t ) is the total power produced from WT, and P l ( t ) is the total energy demand [38]. One crucial factor that indicates the battery’s performance is its state of charge (SoC) [48]. Equations (8) and (9) are used to determine the state of charge (SoC) of the battery when charging or discharging. According to the mathematical computation provided by Equation (8), the battery is in a charging condition when the total generated output power from PV and WT exceed the load.
S o C t = S o C t 1 . 1 σ + P p v t + P w t t P l t + P E V d e m η i n v   η b
The output power produced by the PV and WT, respectively, is expressed as P P V ( t ) and P W T ( t ) . The battery’s self-discharge rate, or σ, equals 0.007%/h [49]. The overall energy demand is represented by P P V ( t ) Pl(t), the state of charge of the battery at a time (t) is indicated by SoC (t), the inverter efficiency is represented by η i n v , and the battery efficiency is marked by η b , which is equal to 85% [38]. The EV battery specification is also considered to obtain the SoC, charging decision, and energy demand. If the total generated output power from PV and WT is less than the load demand, as determined by Equation (9), the battery’s state of charge (SoC) will be in a discharging situation.
S o C t = S o C t 1 . 1 σ + P l t + P E V d e m η i n v ( P p v t + P w t t )   η b  
Equation (10), which represents the battery power during discharging when the SoC exceeds the RESs, may be derived from the previously mentioned facts.
P B A T T t = P l t P w t t η i n v P P V ( t )
The technical and economical specifications of the BT used in the proposed system are given in Table 1.

2.4. Converter Mathematical Modeling

Power converters, such as DC/AC and AC/DC, are required when a system consists of both AC and DC components; Table describes the converter. In this analysis, batteries that generate DC output, solar PV panels (DC), and household (AC) demands are taken into consideration. Peak load demand ( P L m ) at a time (t) and inverter efficiency ( η i n v ) are combined to estimate the converter size and Equation (11) [50] is used to determine the inverter rating ( P i n v t ).
P i n v t = P L m t η i n v

2.5. The Grid Mathematical Modeling

The grid can supplement the energy deficit if the RESs and battery bank are unable to meet the load needs [51]. Equation (12) can be used to determine the money received from energy sales to the utility grid.
R g r i d = t = 1 8760 r a t e f e e d i n × E g r i d s e l l i n g  
where E g r i d ( s e l l i n g ) represents the selling energy price (USD 0.015/kWh) and r a t e f e e d i n refers to the feed-in tariff rate, which is USD 0.02/kWh. Moreover, Equation (13) is used to compute the cost of power from the grid [52]. On the other hand, 8760 is the amount of hours in a year. The following is the purchasing price of the grid-purchased power:
C g r i d = C p × t = 1 8760 E g r i d p u r c h a s e d
where t = 1 8760 E g r i d ( p u r c h a s e d ) is the hourly total of yearly grid power purchases for a year [52], and C p is the cost of purchasing electricity in Iraq, which equals USD 0.013/kWh.

2.6. Mathematical Modeling of Electric Vehicle Charging Station

The battery of electric vehicles (EVs) is used to overcome several supply constraints to improve security and financial sustainability. One of the fundamental needs for modeling an electric vehicle charging station is knowing its rated capacity. One can compute the rated capacity using the method shown in Equation (14).
S r a t e d   = k l o a d N s l o t P E V C O S  
where N s l o t is the number of charging slots for each EV, which equals 3, k l o a d is the overload factor for cover overloading in transients, which is 1.1, P E V is the maximum power rate of each EV, which is 90 kW, and S r a t e d , the station’s rated capacity, equals 850.97 VAr [53].

3. Date Collection and Renewability–Economic–Technical Assessments

In this research, real meteorological data have been used to model the proposed system. These meteorological data are recorded every 10 min for an entire year (from 1 January to 31 December of 2018) in a government building (Engineering Technical College) located in Al-Najaf Governorate in Iraq [54], which is located at the coordinates 31° north latitude and 44° east longitude. These meteorological data consist of solar radiation, ambient temperature, and wind speed. The meteorological data were collected for an entire year.

3.1. The Study Site and Load Profile

This study investigates the efficacy and potency of the recommended strategies for the ideal sizing of the suggested system in Al-Najaf Governorate in Iraq.

3.1.1. Al-Najaf Governorate in Iraq
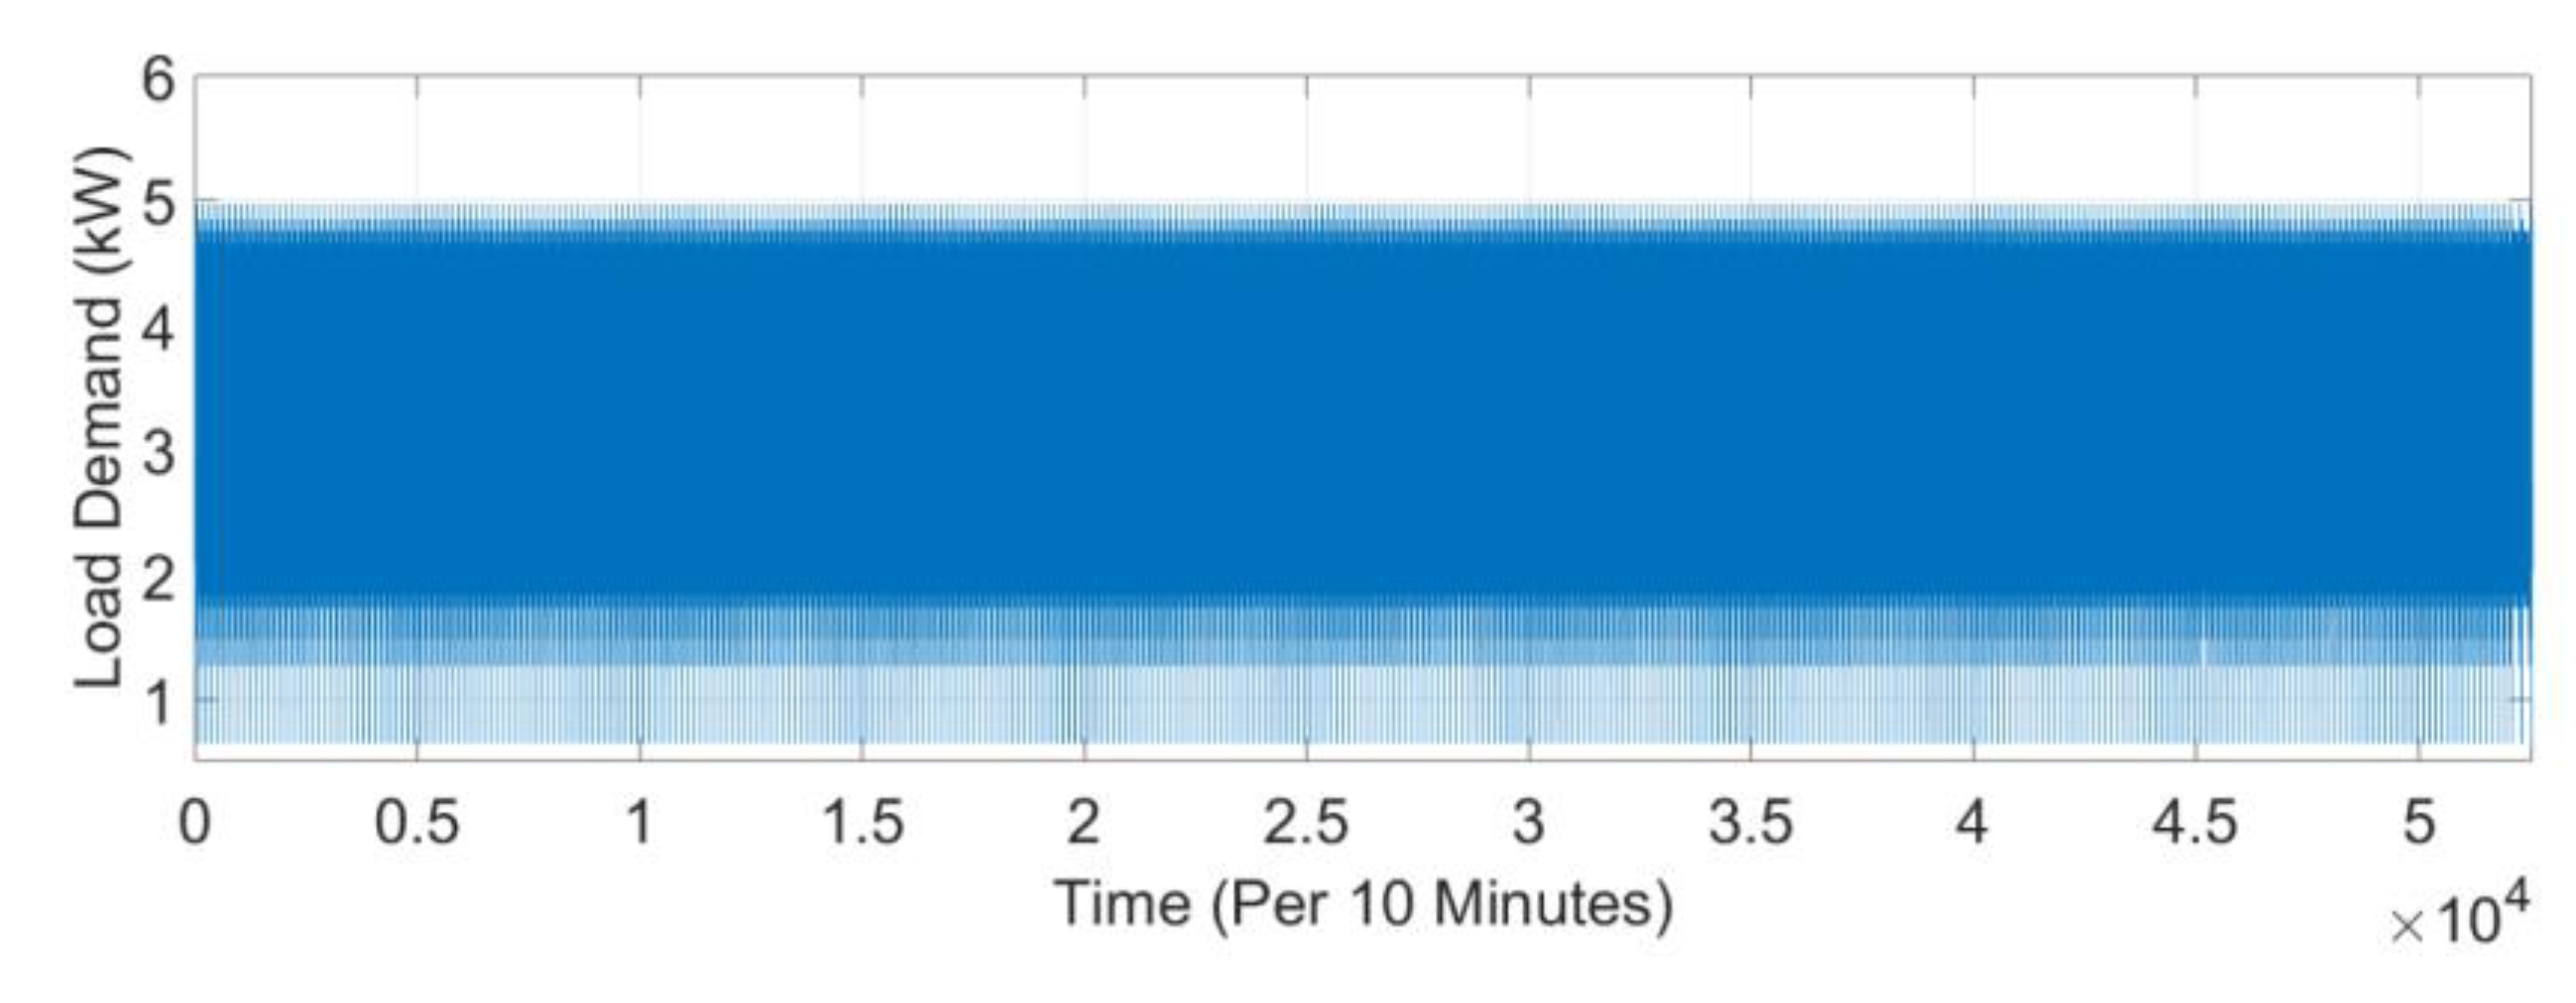
Al-Najaf Governorate is a city in central Iraq about 160 km (99 mi) south of Baghdad; see Figure 2 and Figure 3. This study uses the climatology data and load demand to implement the mathematical equations to calculate the total amount of power generated during an entire year. Real meteorological data have been used in the modeling of the proposed system. These meteorological data are recorded every 10 min for an entire year (from 1 January to 31 December of 2018) of a government building (Engineering Technical College) located in Al-Najaf Governorate in Iraq [54], which is located at coordinates 31° north latitude and 44° east longitude. These data were gathered from a weather station installed ten meters above the ground, as shown in Figure 4. These meteorological data consist of solar radiation, ambient temperature, a wind speed. The energy demand profile data were assumed for an entire year.

3.1.2. Load Profile

The data of the load demand for the entire year of the building where the study was conducted have a maximum value of 4.9687 kW and a minimum value of 0.6417 kW, recorded every 10 min.

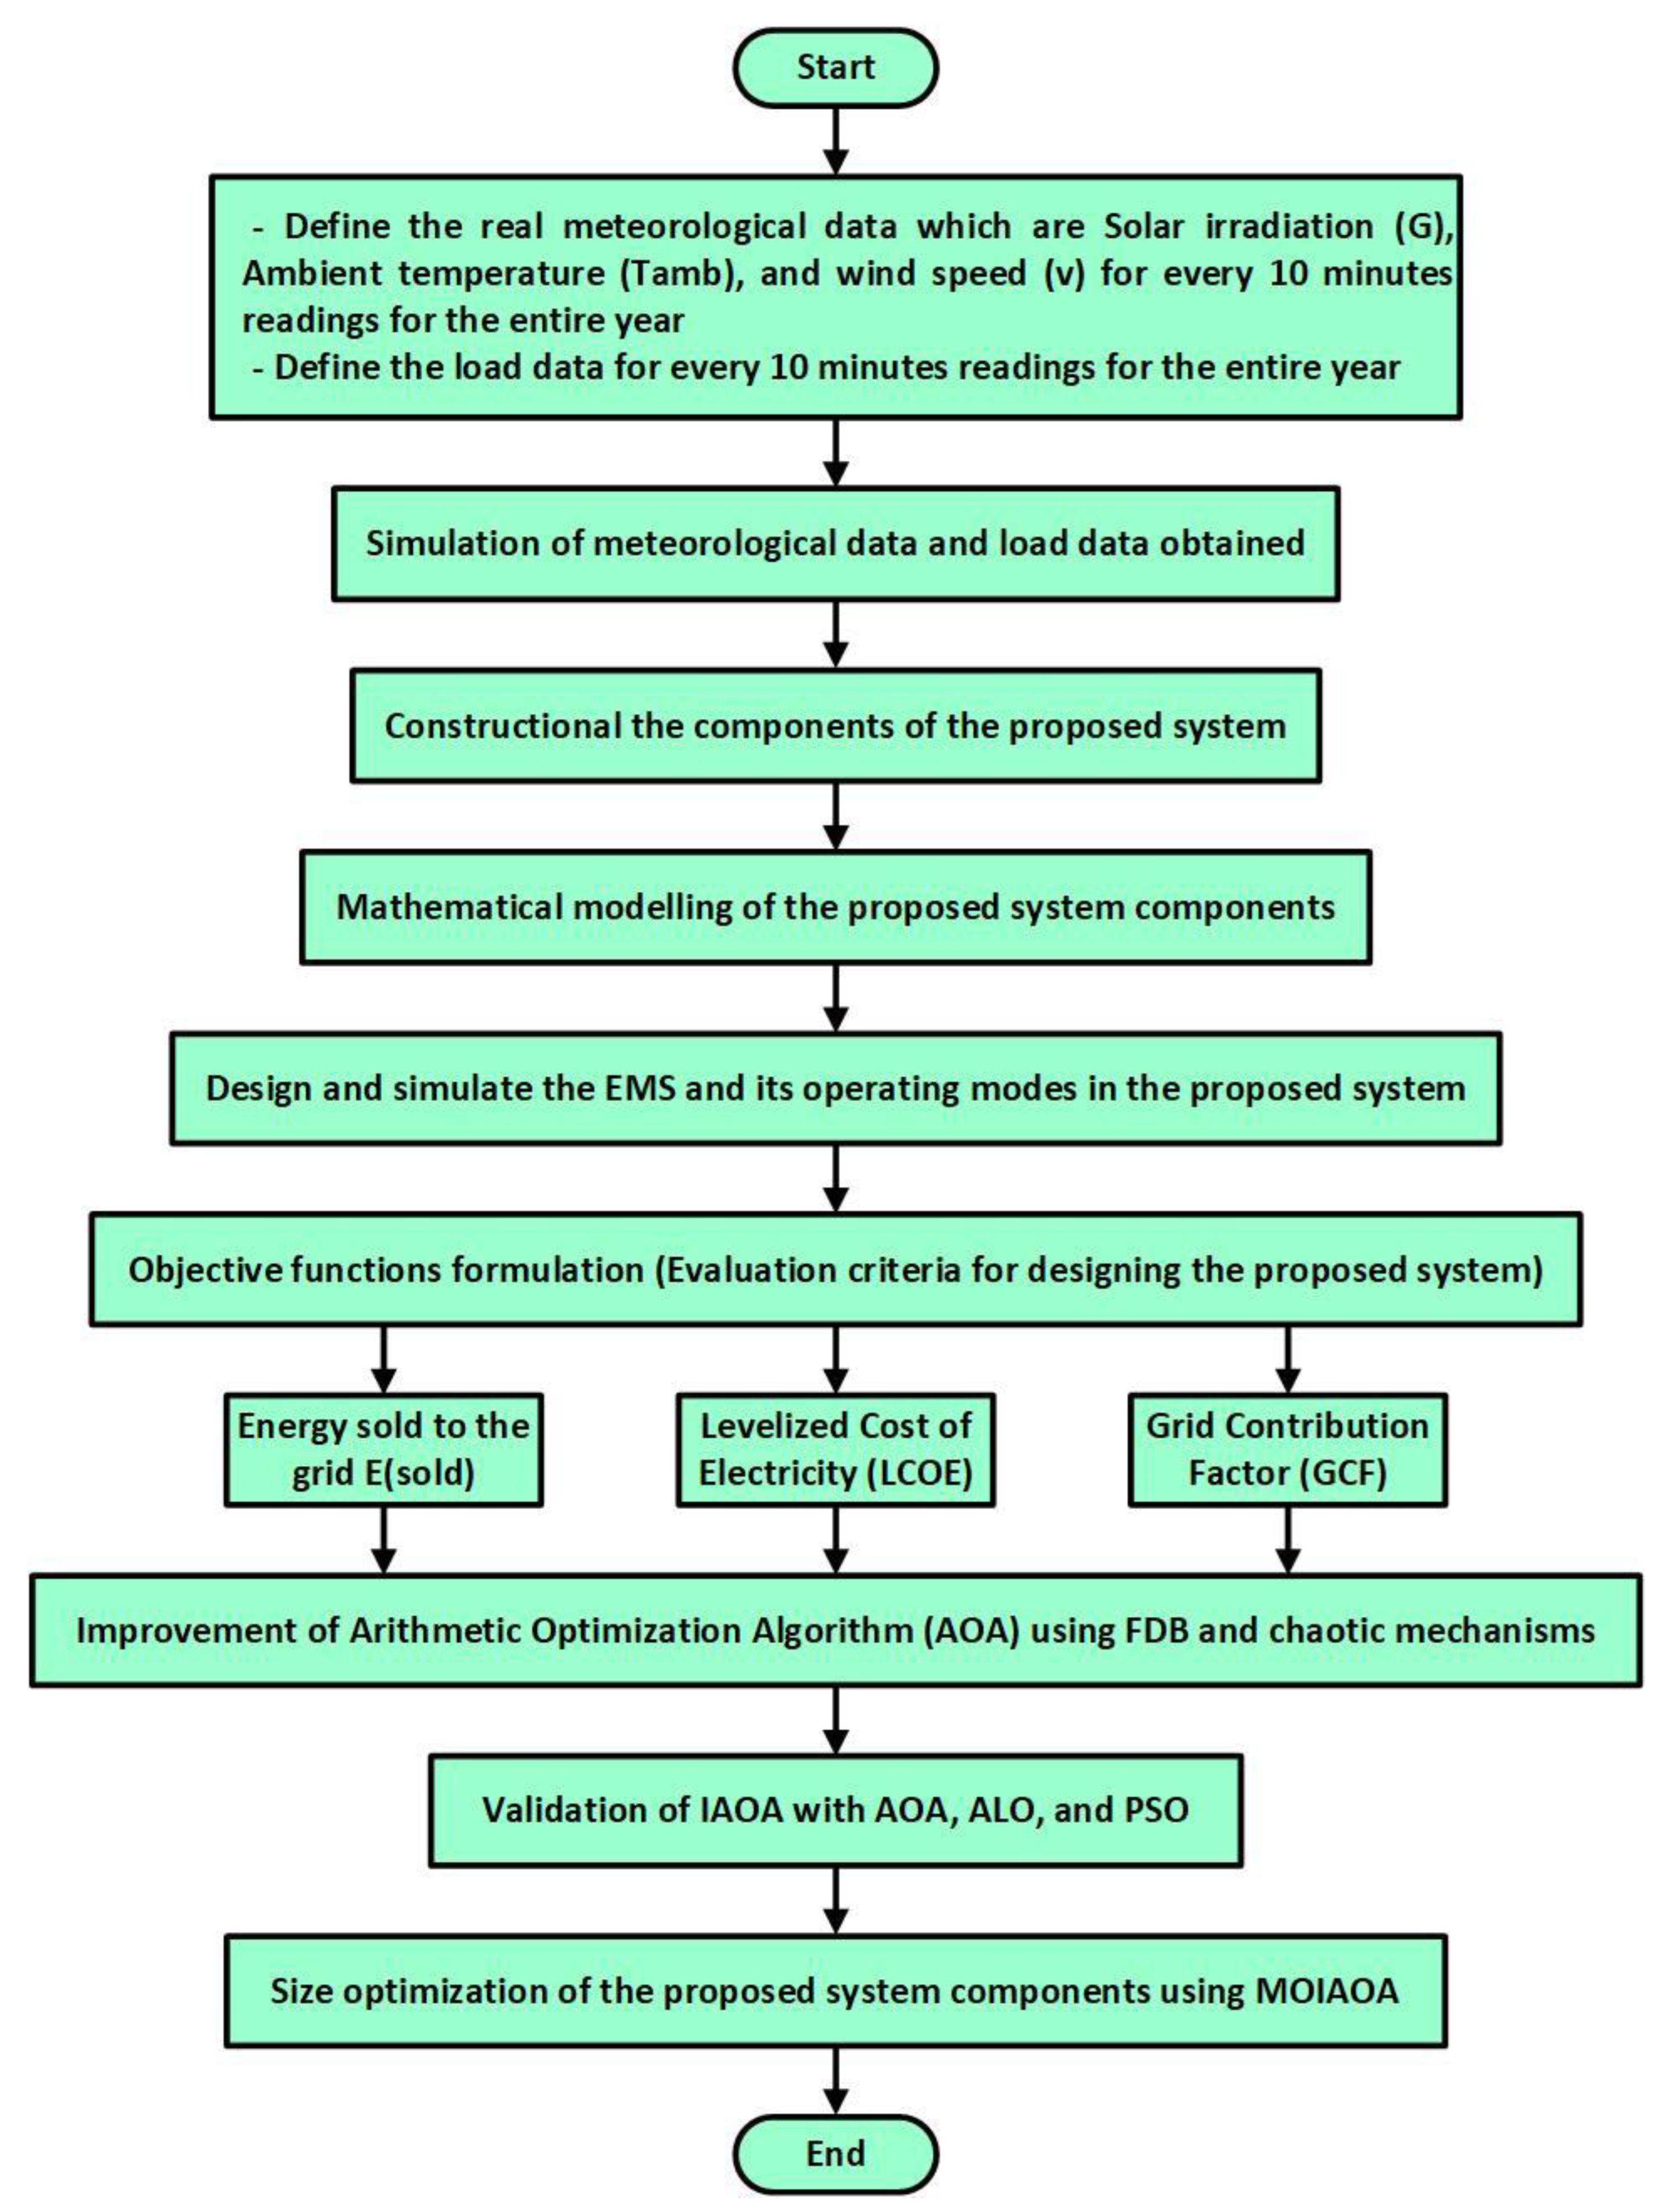
3.2. Objective Function Formulation

3.2.1. Levelized Cost of Electricity (LCOE)

The LCOE for a power system is the ratio between the total costs of the system and its total electricity production over its economic lifetime [55]. It is regarded as the minimum cost at which electricity must be sold to break even over the project's lifetime. LCOE is measured in USD/kWh. The first objective can be presented as shown in Equation (15):
o b j e c t i v e 1 = min   ( L C O E ) = min   T h e   r e a t i o n   b e t w e e n h e   t h e   t o t a l   c o s t s   o f   t h e   s y s t e m   a n d i t s   t o t a l   e l e c t r i c i t y   p r o d u c t i o n   o v e r   i t s   e c o n o m i c   l i f e t i m e

3.2.2. Grid Contribution Factor (GCF)

Grid Contribution Factor (GCF) can minimize the maximized Renewable Energy Fraction (REF). GCF is given in Equation (16) as follows:
G C F = 1 R F E
The GCF is the amount the grid contributes to meeting the necessary energy demand by minimizing REF [52]. The GCF is measured in kWh. The second objective can be presented as shown in Equation (17):
o b j e c t i v e 2 = m i n   G C F = m i n   ( 1 R E F )

3.2.3. Energy Sold to the Grid ( E S O L D )

E S O L D is the annual energy sold to the grid and not self-consumed by the charging station [56]. The E S O L D is defined as the quantity of electricity sold from any part of the system (such as PV and/or wind and/or battery and/or EV battery) into the main grid. One of the objective functions of this research is to maximize the value of E S O L D , which means decreasing the dependency on the grid; this is achieved by increasing the dependency on renewable energy and/or battery and/or EV batteries. The E S O L D is measured in kWh. The third objective can be presented as shown in Equation (18):
o b j e c t i v e 3 = max   ( E S O L D )

4. The Proposed Methodology for Sizing of the Grid-Connected PV/WT/Battery/EVCS System

The proposed system comprises a grid-connected PV/WT/battery combined with EVCS. The proposed system's energy management strategy and scenarios are provided in phase 1 of this part, which is separated into three sections. Phase 2 clarifies the Arithmetic Optimization Algorithm (AOA). Phase 3 presents the proposed Improved Arithmetic Algorithm (IAOA) with benchmark algorithms such as AOA, Ant Lion Optimizer (ALO), and particle swarm optimization (PSO). Finally, the proposed Multi-Objective Improved Arithmetic Optimization Algorithm (MOIAOA) is explained.

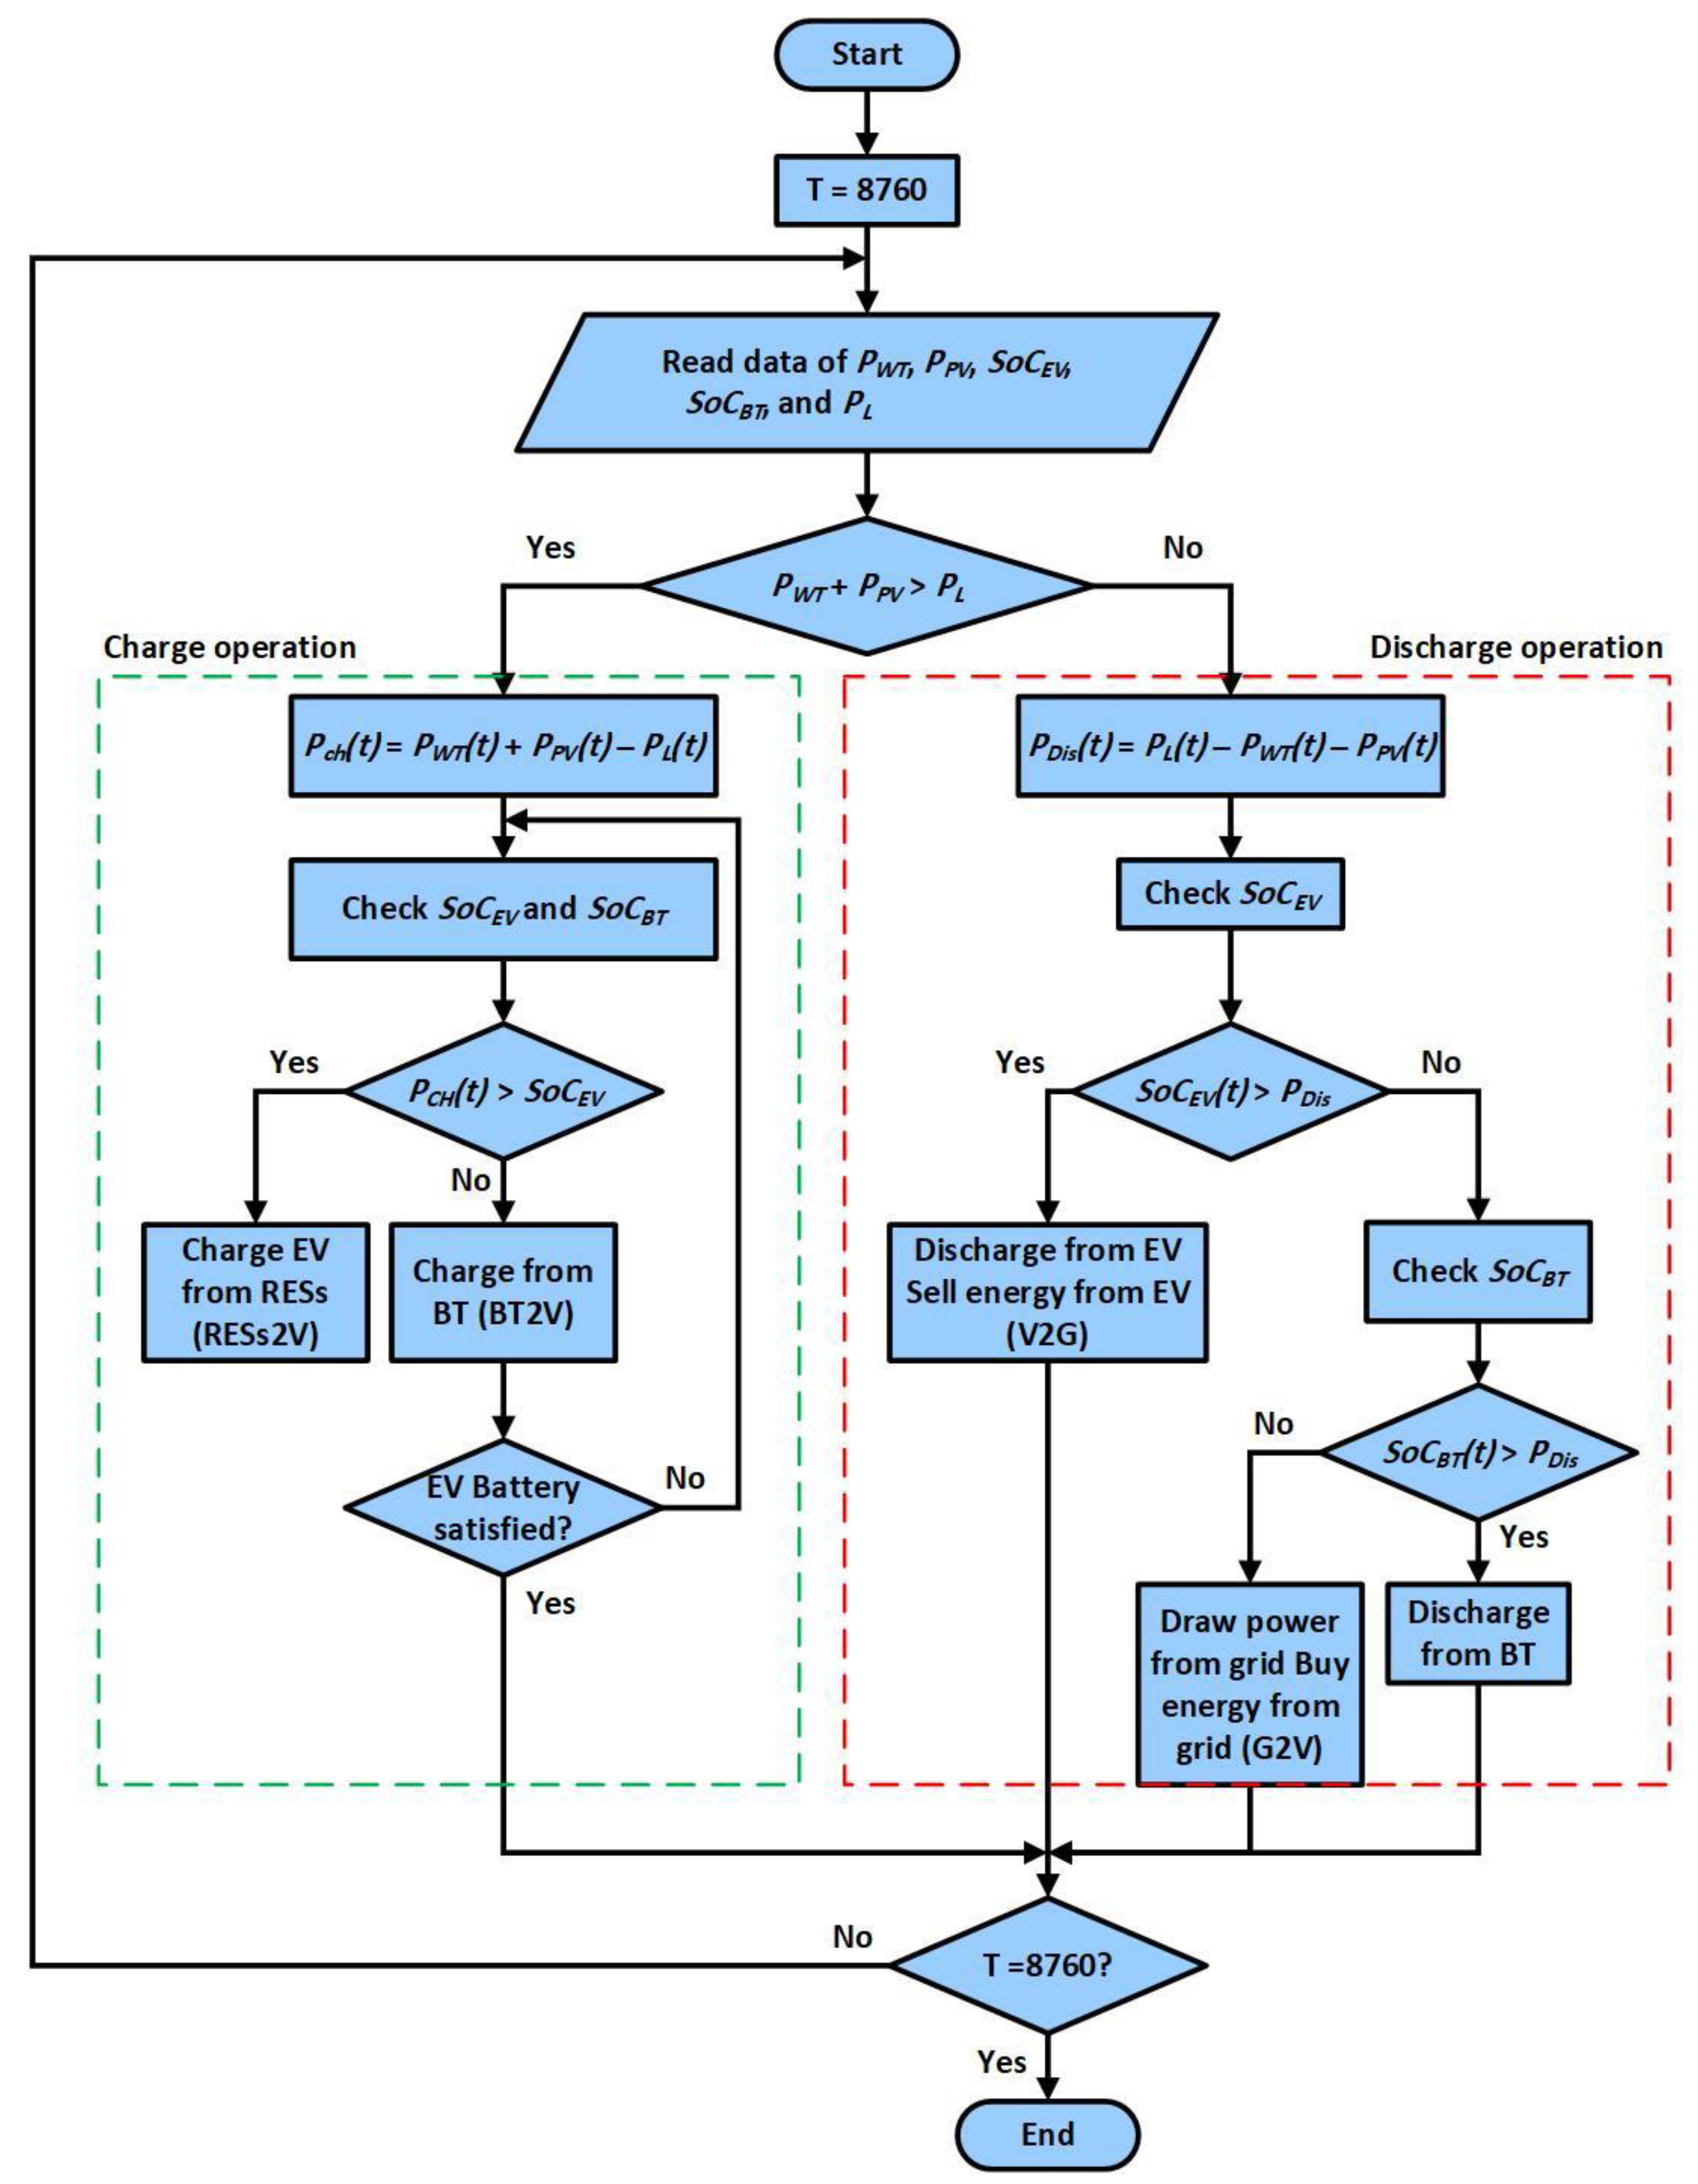
4.1. Energy Management Strategy and Its Scenarios in the Proposed System

Information management included in such a system is known as an energy management system (EMS); it provides the ability to guarantee that energy is supplied through generation, transmission, and distribution at the lowest feasible cost. EMS is believed to use several methods to supply the load needed, as described in [57] and [58]. Additionally, according to the literature, it can categorized into three groups: Rule-Based (RB), Learning-Based (LB), and Optimization-Based (OB), each of which has a subclassification [59]. In addition, it is resource-dependent, balances BT SoC power, and lowers system running costs [60]. There will be difficulties when integrating RESs with the grid, such as overloading [61]. To get around this integration limitation, EMSs can be used to monitor and control the energy systems of RESs in situations where the data obtained from strategies of controlling are inaccurate because the design variable is not taken into account as a crucial feature by taking advantage of sizing algorithms [62]. The optimization algorithms are integrated with EMS to ensure a steady power flow into the suggested system [63]. The system’s energy management is configured to meet load needs while considering the dynamic energy flow among all system components [64].
In this research, the system’s integrated RB-EMS considered the following four operating modes for three EVs. The proposed system's energy management is crucial to manage the power flow during the optimization process. The operating modes of the RB-EMS are used for controlling and observing the power flow of the proposed system. RB-EMS-based operating modes (scenarios) and their working rules can be illustrated as follows:
  • Operating Mode 1: Renewable energy sources (photovoltaic and wind power) supply power for running the system and charging the battery and the electric vehicle.
  • Operating Mode 2: The battery supplies power for load and electric vehicle charging if there is no grid and insufficient RESs.
  • Operating Mode 3: The main grid supplying power for electric vehicle charging (Buying–Charging–G2V) when batteries and RESs are not available and grid demand is required. The power flow will be unidirectional.
  • Operating Mode 4: The electric vehicle supplying power for the grid (V2G–Sell–Discharging) when grid demand is high and batteries and RESs are unavailable. The flow of power will be bidirectional. The proposed operation modes of RB-EMS for the proposed system are listed in Table 2.
RB-EMS is used in this study because of its advantages, which include its ability to precisely solve problems and make quick judgments to fulfill load demand while minimizing operating costs. The flowchart in Figure 5 illustrates how the metaheuristic technique and system configuration sizing (PV-WT-BT) are being considered to meet the study’s objective functions. The (if, otherwise, and then) statement governs the primary mechanism of rule-based strategy [37]. The if-then conditions for the charging and discharging function with the previously mentioned modes are shown in Figure 6. The proposed system’s RB-EMS, as seen in Figure 6, presents the power flow via the system’s components as a flowchart.

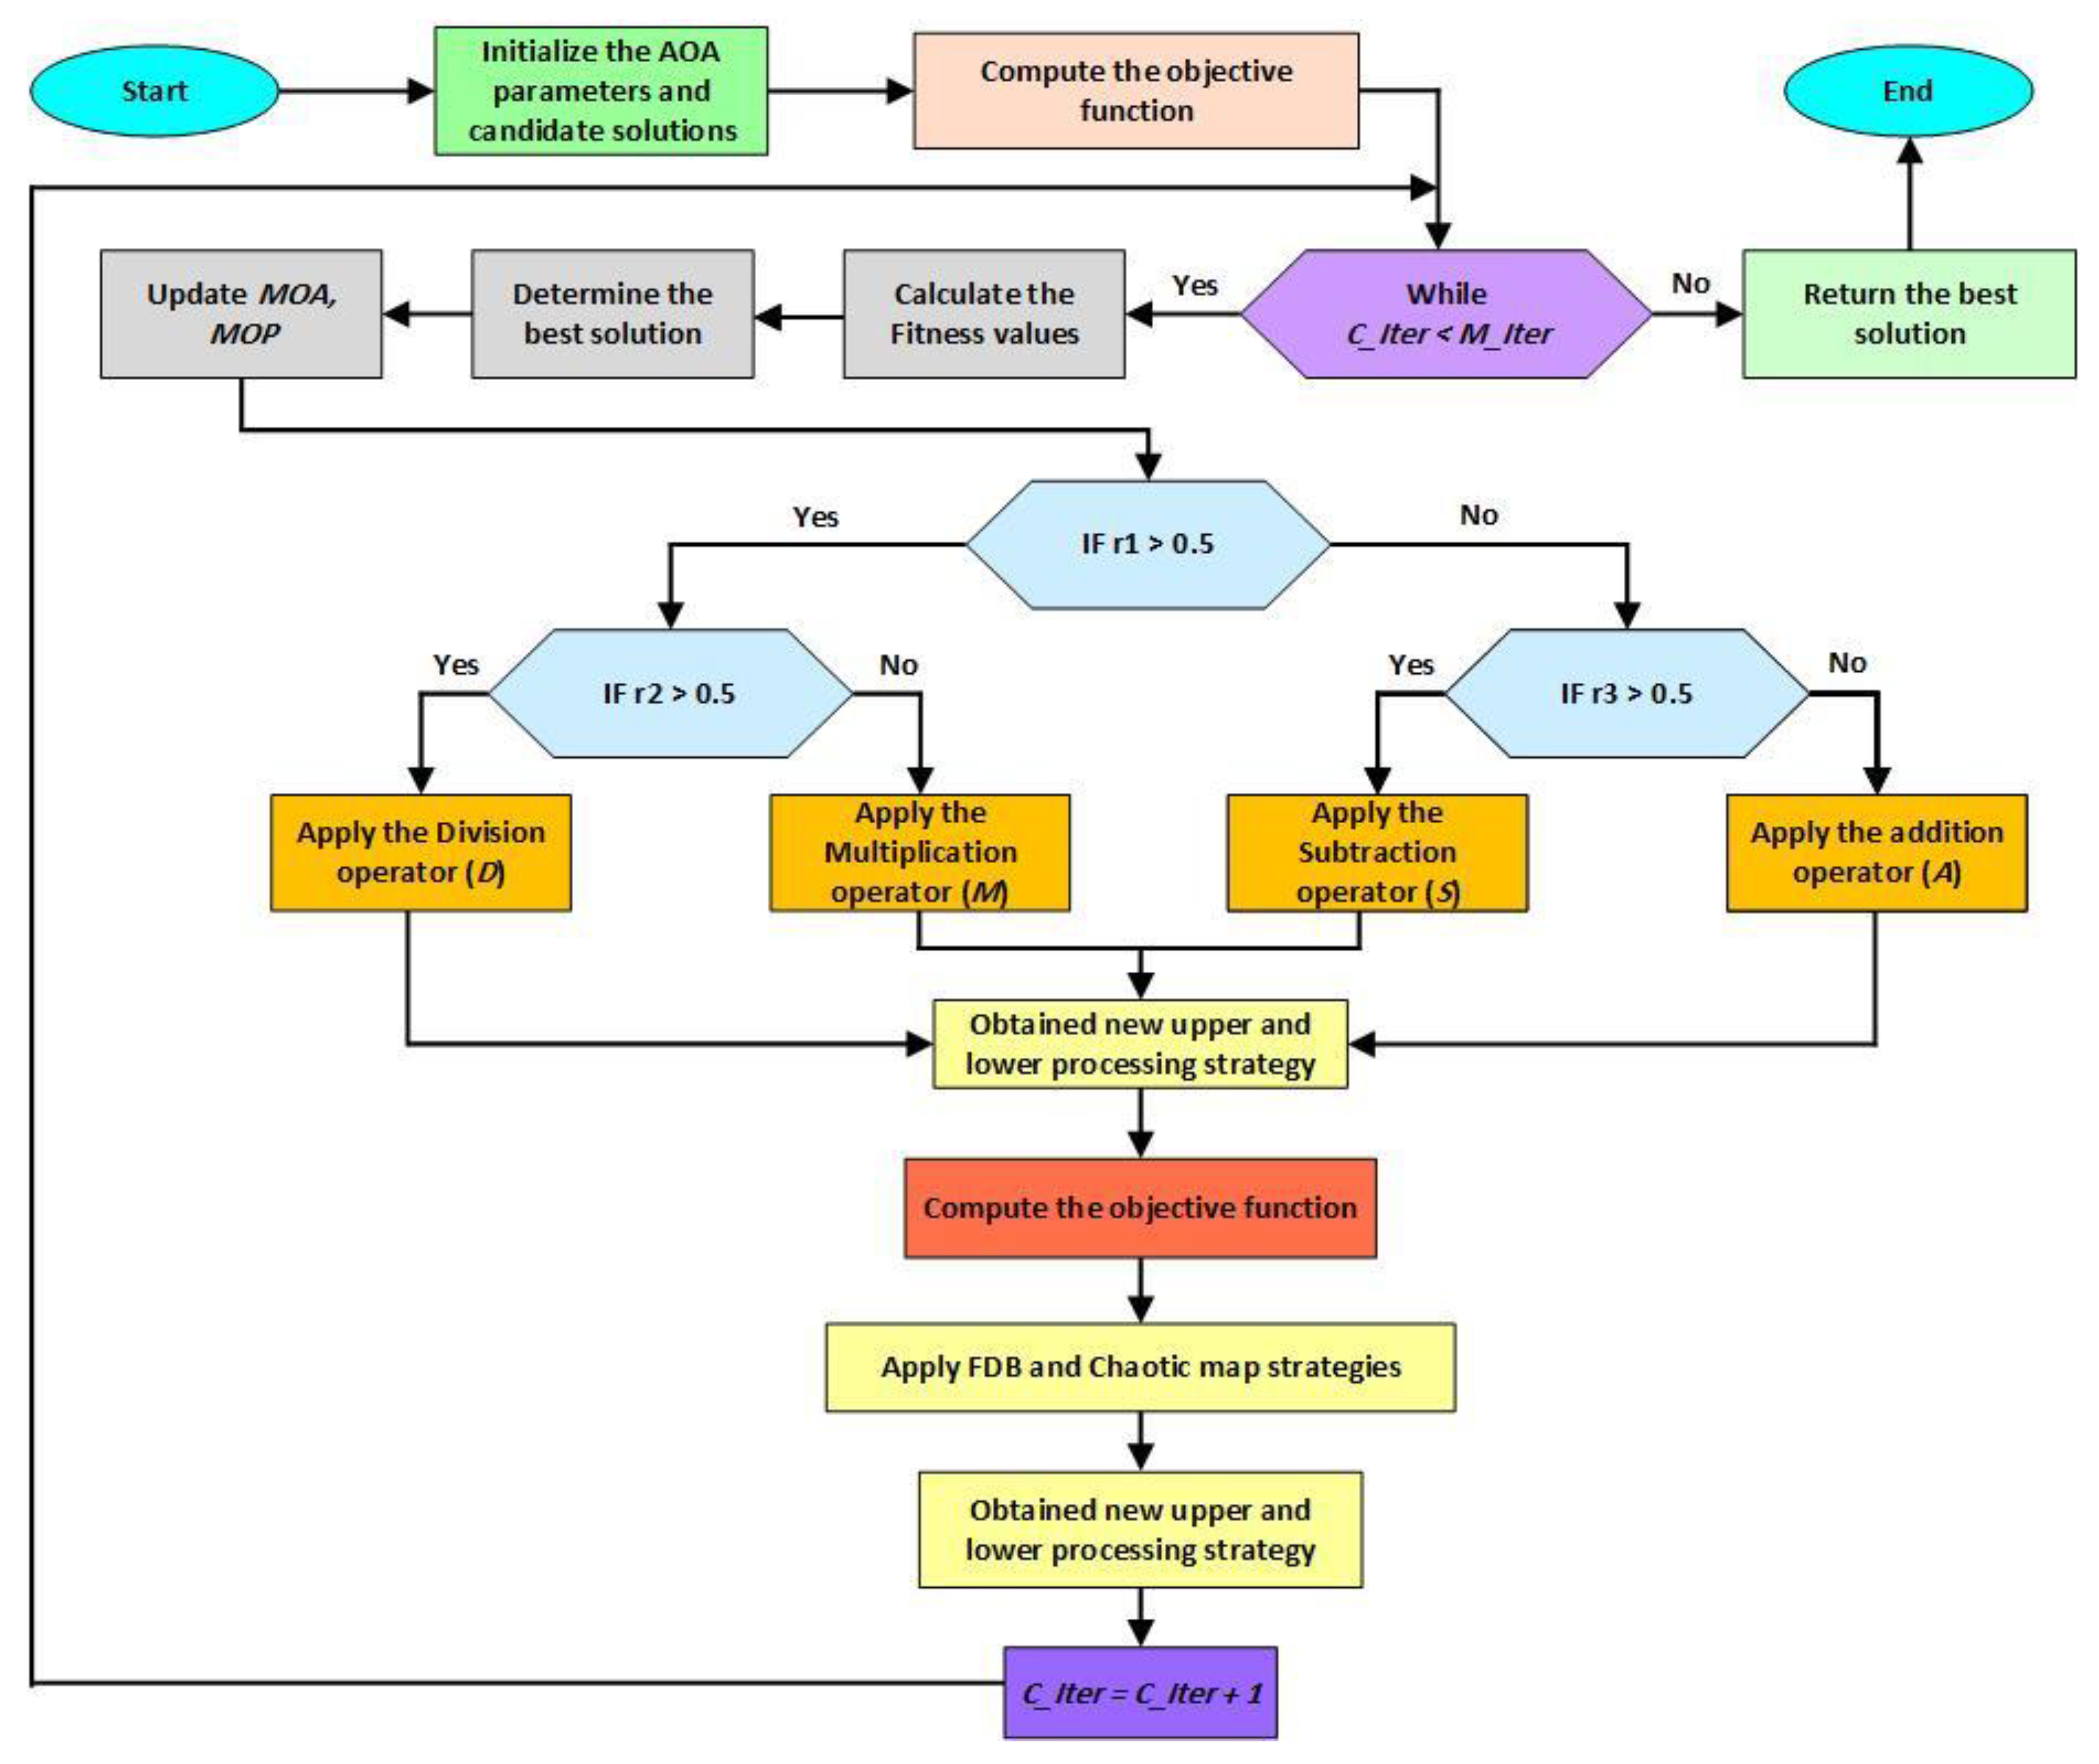
4.2. Arithmetic Optimization Algorithm (AOA)

Comparable to other population-based optimization techniques, the Arithmetic Optimization Algorithm (AOA) was released in 2021 by Abualigah et al. [65]. The variety and exploitative stages in AOA were produced by the mathematical operators addition (A “+“), division (D “÷“), multiplication (M “ד), and subtraction (S “−“).

4.2.1. Inspiration

Arithmetic is a sufficient yet necessary prerequisite for algebra, number theory, analysis, geometry, and modern mathematics. Therefore, these four simple operators might be used to find the best solutions while preserving between the exploitation and exploration periods.

4.2.2. Initialization Phase

A list of potential solutions (X) is established in the first phase. For the most optimal solutions thus far, the best solution from all iterations is kept. As given in Equation (19):
X = X L B + r a n d ( X U B X L B )
X U B and X L B establish the upper and lower boundaries of the problem, where X is a collection of initialized solutions and rand is a random variable in the range [0, 1]. The Math Optimizer Accelerated (MOA) function is employed to discern the exploration and exploitation stages. It is calculated in the manner described in Equation (20) below:
M O A C i t e r = M i n + C i t e r × M a x M i n M i t e r
where C i t e r specifies the current iteration and ranges between 1 and the maximum number of iterations ( M i t e r ), and MOA ( C i t e r ) defines the value at the t th iteration. Max and Min represent the highest and lowest values of the accelerated function. The steps of exploration and exploitation will be covered in detail in the following sections.

4.2.3. Exploration Phase

Since the the D and M operators have widely distributed values in the design space, they are used during the exploratory stage. The MOA function limits the exploration phase; the D and M operators are utilized if r1 > MOA is found; otherwise, the A and S operators are kept in place. The following equations can be used to express the exploring portion:
x i j ( C i t e r + 1 ) = b e s t X j ÷ M O P + ε × U B j L B j × μ + L B j         r 2 > 0.5 b e s t X j × M O P × U B j L B j × μ + L B j                       o t h e r w i s e
where the second integer, r2, is conditioned between the D and M operations and is generated at random. ε is a small integer value, while a control variable called μ is set to 0.5 to change the search process. U B j and L B j stand for the bottom and upper limits, respectively.
M O P C i t e r = 1 C i t e r 1 M i t e r 1
In this work, Math Optimizer Probability is a coefficient represented by the symbol MOP. The sensitivity control parameter indicates the accuracy of the exploitation throughout the iterations ∝, which is set to 5.

4.2.4. Exploitation Phase

Despite the large density of the A and S operators, their small dispersion makes them easily accessible. The following can be used to represent the S and A operators:
x i j ( C i t e r + 1 ) = b e s t X j M O P × U B j L B j × μ + L B j                             r 3 > 0.5 b e s t X j × M O P × U B j L B j × μ + L B j                       o t h e r w i s e
where the third number, r3, is a randomly generated number that represents the A and S operators.

4.3. The Proposed Improved Arithmetic Optimization Algorithm (IAOA)

There are two improvements key to overcoming the limitations of the original AOA by employing the fitness distance balance (FDB) integrated with chaotic map strategies [66,67]. Firstly, the FDB is implemented to ensure the best new solutions are chosen to import high-quality solutions into the new generation. The selection mechanism is determined by computing the fitness function values of all particles and their distance from the best solution position. Secondly, the FDB is integrated with a chaotic map tactic for local minima avoidance. Therefore, the newly developed IAOA can enhance the exploitation by utilizing the selection of the FDB technique. At the same time, the new search areas are discovered by obtaining a chaotic map tactic, where the balance between exploitation and exploration tendencies is achieved. The proposed IAOA is proposed to handle three conflicting objectives: GCF, E S O L D , and LCOE. The correlation between these is an inverse relationship, where their values are varied based on the given weights for each one. PF solutions will be executed after executing all weights’ statuses.
These objectives are transformed into a single objective after performing a normalization operation [68]. The improvements of IAOA are described by the following:
  • FDB Strategy
At first, the distance of particles from the best solution P b e s t is computed using Equation (24) below:
i = 1 n , P i P best   , D P i = x 1 P i x 1 P best   2 + x 2 P i x 2 P best   2 + + x m P i x m P best   2
The distance matrix ( D P ) is generated for particle candidates, as given in Equation (25) below:
D P d 1 d n n × 1
Secondly, the scores of the particles are determined according to the distance and fitness values, as seen in Equation (23). These two variables, n o r m F and n o r m D x , are normalized with a range of [0, 1] to avoid one dominating the other. Then, the scores of particles ( S x i ) are determined with n o r m F and n o r m D x according to the following expression:
i = 1 n P i , S F D B 1 P i =   normF   F P i +   norm   D P i
Finally, the score vector ( S x ) can be presented by the following equation:
S x s x , 1 s x , n n x 1
According to our new strategy, the S x vector is implemented with a chaotic map tactic to boost the convergence and prevent the premature convergence during the optimization process.
  • Chaotic map tactic
It is described as follows:
X n e w = X X n e w S x m c 1
where m c is a vector and it is computed as follows:
m = r a n d ;
m c = 4 m 1 m
The main benefit of chaos is to explore new search areas and information about the candidate particles in the FDB strategy, which can concurrently and perfectly enrich the population with high-quality solutions (exploitation) while exploring new promising zones in the search space.
  • Handling upper and lower boundaries
Because several random techniques were used throughout the optimization process, some newly created particles exceeded the upper and lower bounds of the optimization problem. Most of the optimization methods produce simple upper and lower boundaries, which may delay the convergence speed to optimal solutions. To address this issue, we suggested a new method that makes use of the following mathematical framework to transform particles from predetermined upper and lower boundaries to places that are close to optimal areas:
x i , j = b e s t x j + ϵ × r a n d × U B j L B j × r a n d × L B j
The aforementioned equations improve the diversity of the best optimal solutions discovered thus far. This means that particles are not just moved from locality to optimal regions, but also the quality of the solution is increased by obtaining information from the best particle’s neighborhood. The operation process of the proposed IAOA is demonstrated in Figure 7.

4.4. The Proposed MOIAOA Method

In developing a set of PF solutions, the multi-objective optimization (MOO) methods present several difficulties regarding efficiency, convergence, and diversity. In the case of large goal optimization problems, most MOO methods produce unsatisfactory optimal PF solutions by simultaneously attempting to enhance diversity and convergence. Furthermore, most of the methods in the previous literature considered only a single objective during the optimization process for the proposed system (either an economic or technical objective).
The proposed system in this work is to define the scope of REMS in terms of system size by calculating the minimum (optimal) number of PV modules, wind turbines, and ESU batteries. This will be achieved by calculating the LCOE, GCF, and E S O L D for the proposed system. It will ensure that the REMS operates the charging station without economic losses for a specific number of EVs per day (three EVs). The proposed system, displayed in Figure 1, can be considered a typical grid-connected system for supplying electricity with the assistance of V2G technology and is presented as a test-case system to verify the effectiveness of the devised optimal design method. In this research, an AOA has been proposed and improved to become IAOA. In addition, the optimal design for the proposed system's components has been determined using a multi-objective improved arithmetic optimization algorithm (MOIAOA).
Multi-objective IAOA (MOIAOA) based on the Non-Scale multiple-run Pareto Front concept has been used to calculate the optimal values of the three conflicting objectives, which are Grid Contribution Factor (GCF), Levelized Cost of Electricity (LCOE), and Energy sold to the grid ( E S O L D ). This method is classified as a Non-Scale (NS) multiple-run Pareto Front method and deals with multi-objective optimization problems. In this paper, for the LCOE, GCF, and E S O L D , the aggregation function transforms objectives into a mono-objective problem, where the aggregation function treats the multi-objective optimization problems as a mono-objective problem, as described below:
f i   t = i = 1 k w i × f i   t
where k is an aggregated function that belongs to the individual objective function number and x is the decision variable vector related to the search space. The range of weight coefficients is 0 > wi < 1, denoting the relative importance of the k objective function of the problem, and it is assumed as follows:
i = 1 k w i = 1
On the other hand, the three objective functions are not scalable. Normalizing and implementing the goal function described below is essential [50,51].
f i   t = f i   t f i m i n   t f i m a x   t f i m i n   t
where the upper and lower bounds of the ith individual objective function are denoted as f i m a x t and f i m i n t , respectively.

5. Results and Discussion

In previous sections, the concept and operation of RB-EMS and optimal design have been established for the proposed system. The modeling of the components and power flow control strategy of the proposed system has been presented. This section will present the results obtained from the data collection. The results of the optimal design of the proposed system will be presented.
The proposed system consists of a grid-connected PV-WT battery including EVCS. The EVCS is combined within the proposed system by using V2G technology. In summary, the RB-EMS aims to operate the charging station while keeping the charging cost lower than the average grid electricity price (without economic losses) and reducing the grid burden and system economic losses. In addition, the RB-EMS is embedded in the central controller of the proposed system for real-time decision making without the physical presence of a human operator, so the results of EV charging are derived using the proposed system operated under the control of RB-EMS. The optimal design of the proposed system is provided in this study to show how to meet the load requirement for a government building in the most efficient manner.
The meteorological data of solar insolation (G), temperature (Ta), and wind speed (v) have been used in this research in Al-Najaf Governorate, Iraq. The data obtained are used throughout the simulation process in MATLAB simulations. Data from 1 January 2018 to 31 December 2018 were recorded for one year and collected every ten minutes in a government building. The topographical location of the study region is identified as 31° north latitude and 44° east longitude. Figure 8, Figure 9 and Figure 10 depict the G, Ta, and v plots, respectively.
Data analysis significantly improves our understanding of consumer energy needs from the available Renewable Energy Sources (RESs). This is crucial for handling difficult situations like days without sunlight or wind. The area under study is fortunate to have abundant solar energy and wind throughout the year, with the highest levels observed in July. Most solar radiation, which holds immense potential for generating electricity using photovoltaic (PV) systems, is experienced during summer, followed by spring, autumn and winter. The wind speed is at its maximum in spring, followed by summer, winter, and autumn, offering substantial potential for harnessing wind turbines for electricity generation. Air conditioning units are primarily used during the summer, while consumers predominantly use heaters in winter.
The data of the load demand for the entire year of the building that the study was conducted in show a maximum value of 4.9687 kW and a minimum value of 0.6417 kW every 10 min. A critical stage in optimizing the energy system is accurately estimating the energy demand to be fulfilled to avoid oversizing or under-sizing the system. In this research, the load demand profile for the chosen building is considered for one year with a minimum value of 0.6417 kW and a maximum value of 4.9687 kW. These load data are considered for every ten minutes for the entire year. The load data are graphically presented in Figure 11. Energy demand can be categorized into domestic loads, including appliances in the selected building. Given the case study area’s two distinct seasonal variations (cold and hot), the energy demand profile data reveal that energy consumption is high during the hot season, in contrast to the cold season.
The plots of the annual PV output power P P V and wind turbine output power P W T for the optimal configuration achieved by the proposed system are displayed in Figure 12 and Figure 13, respectively. The proposed system is primarily designed to take advantage of the RESs in the location and interchange power via V2G technology between the EVCS and the utility grid. One of the RESs taken into account in the proposed system is PV. The solar irradiance (G) and ambient temperature T a m are the primary climatological factors that affect the output power produced by the PV. Figure 12 shows the output power produced by PV in the proposed system. The wind turbine is the second RES regarded in the proposed system and the output power generated from the wind turbine in the proposed system is illustrated in Figure 13.

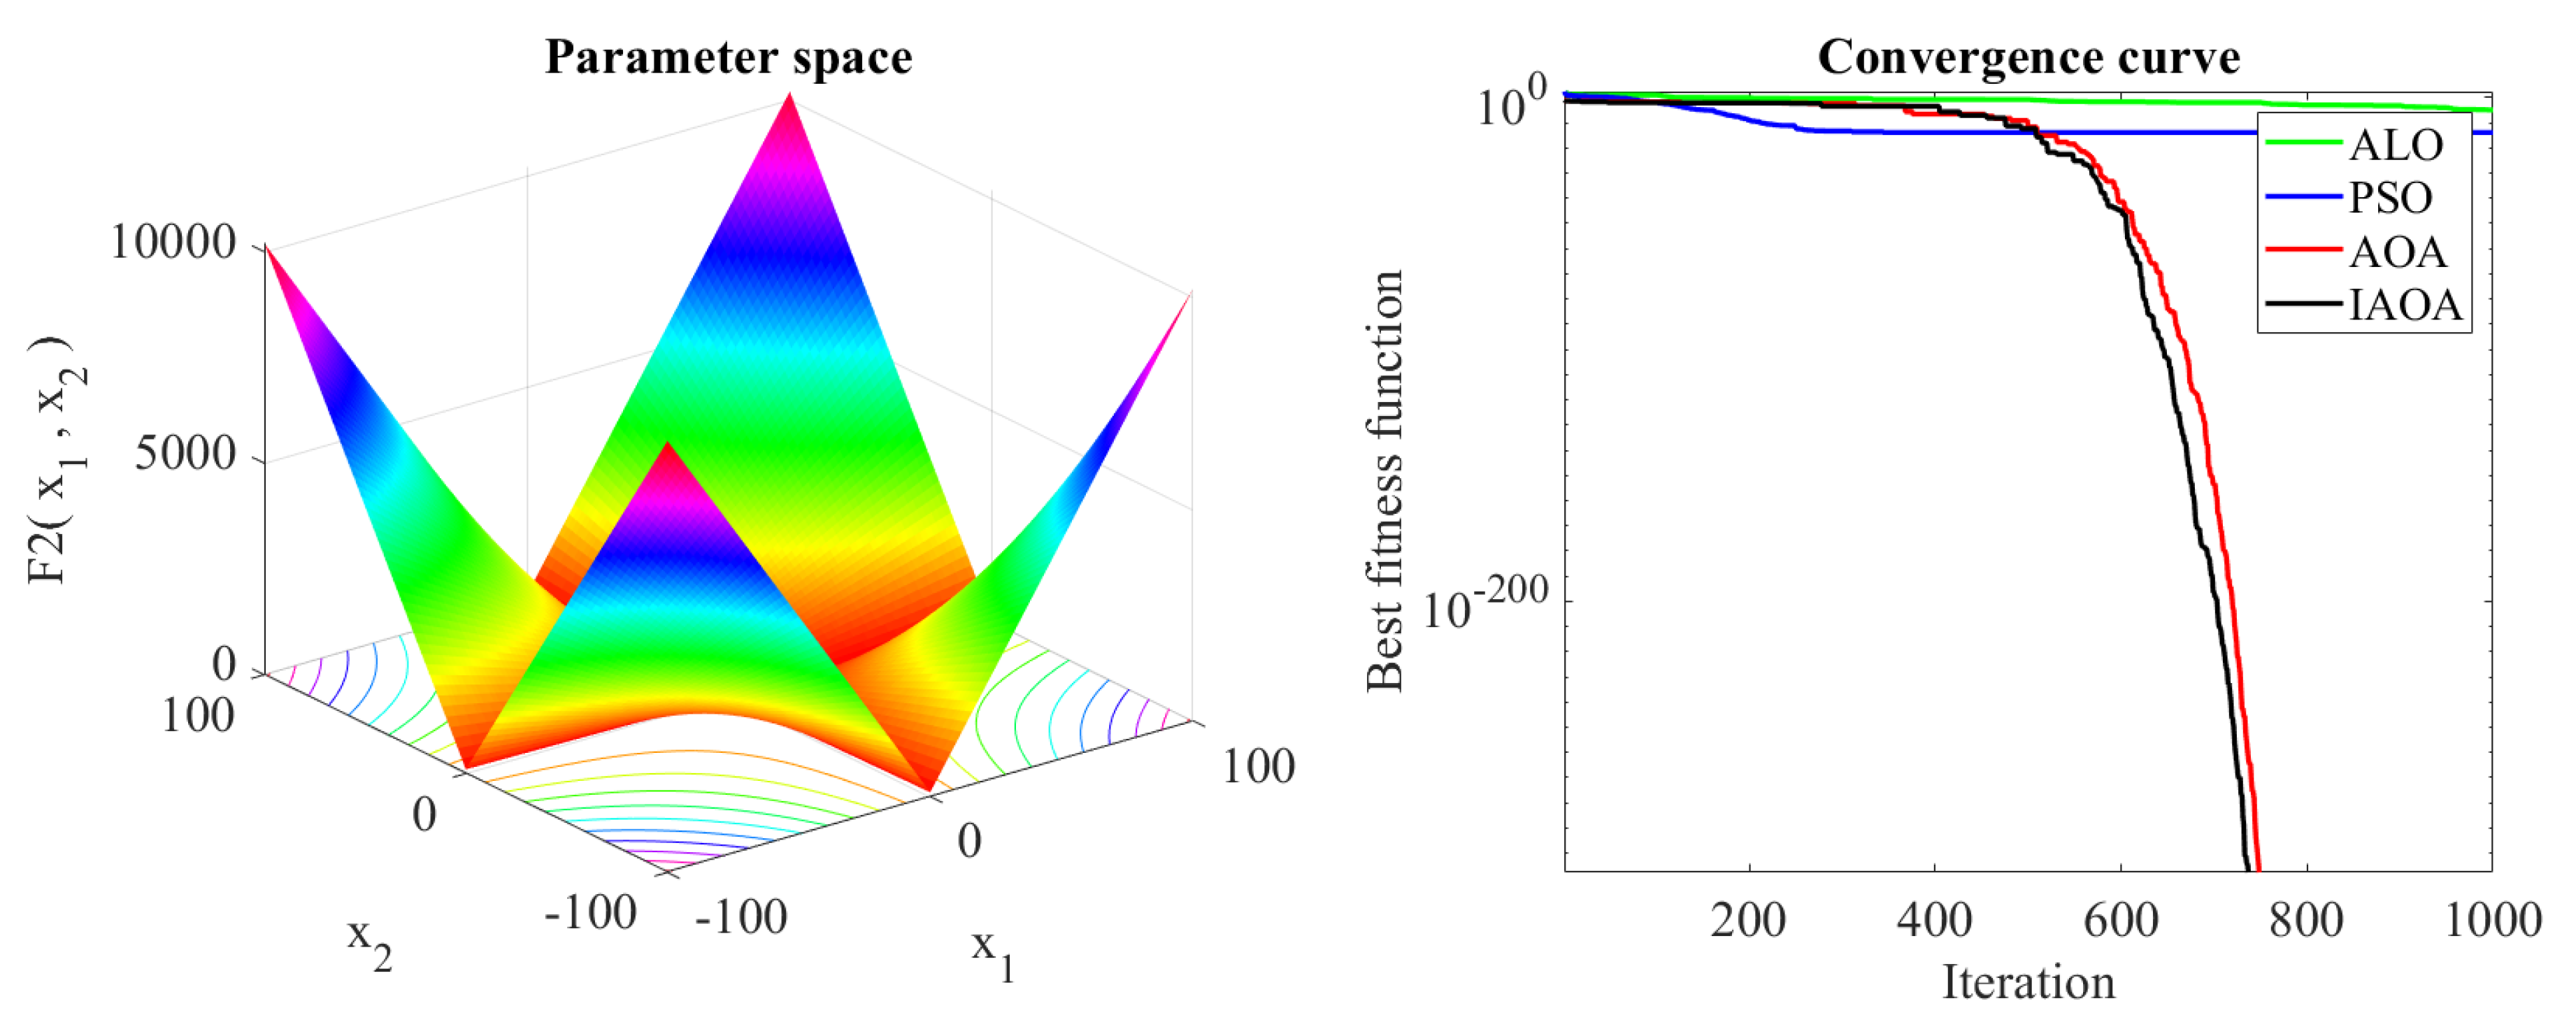
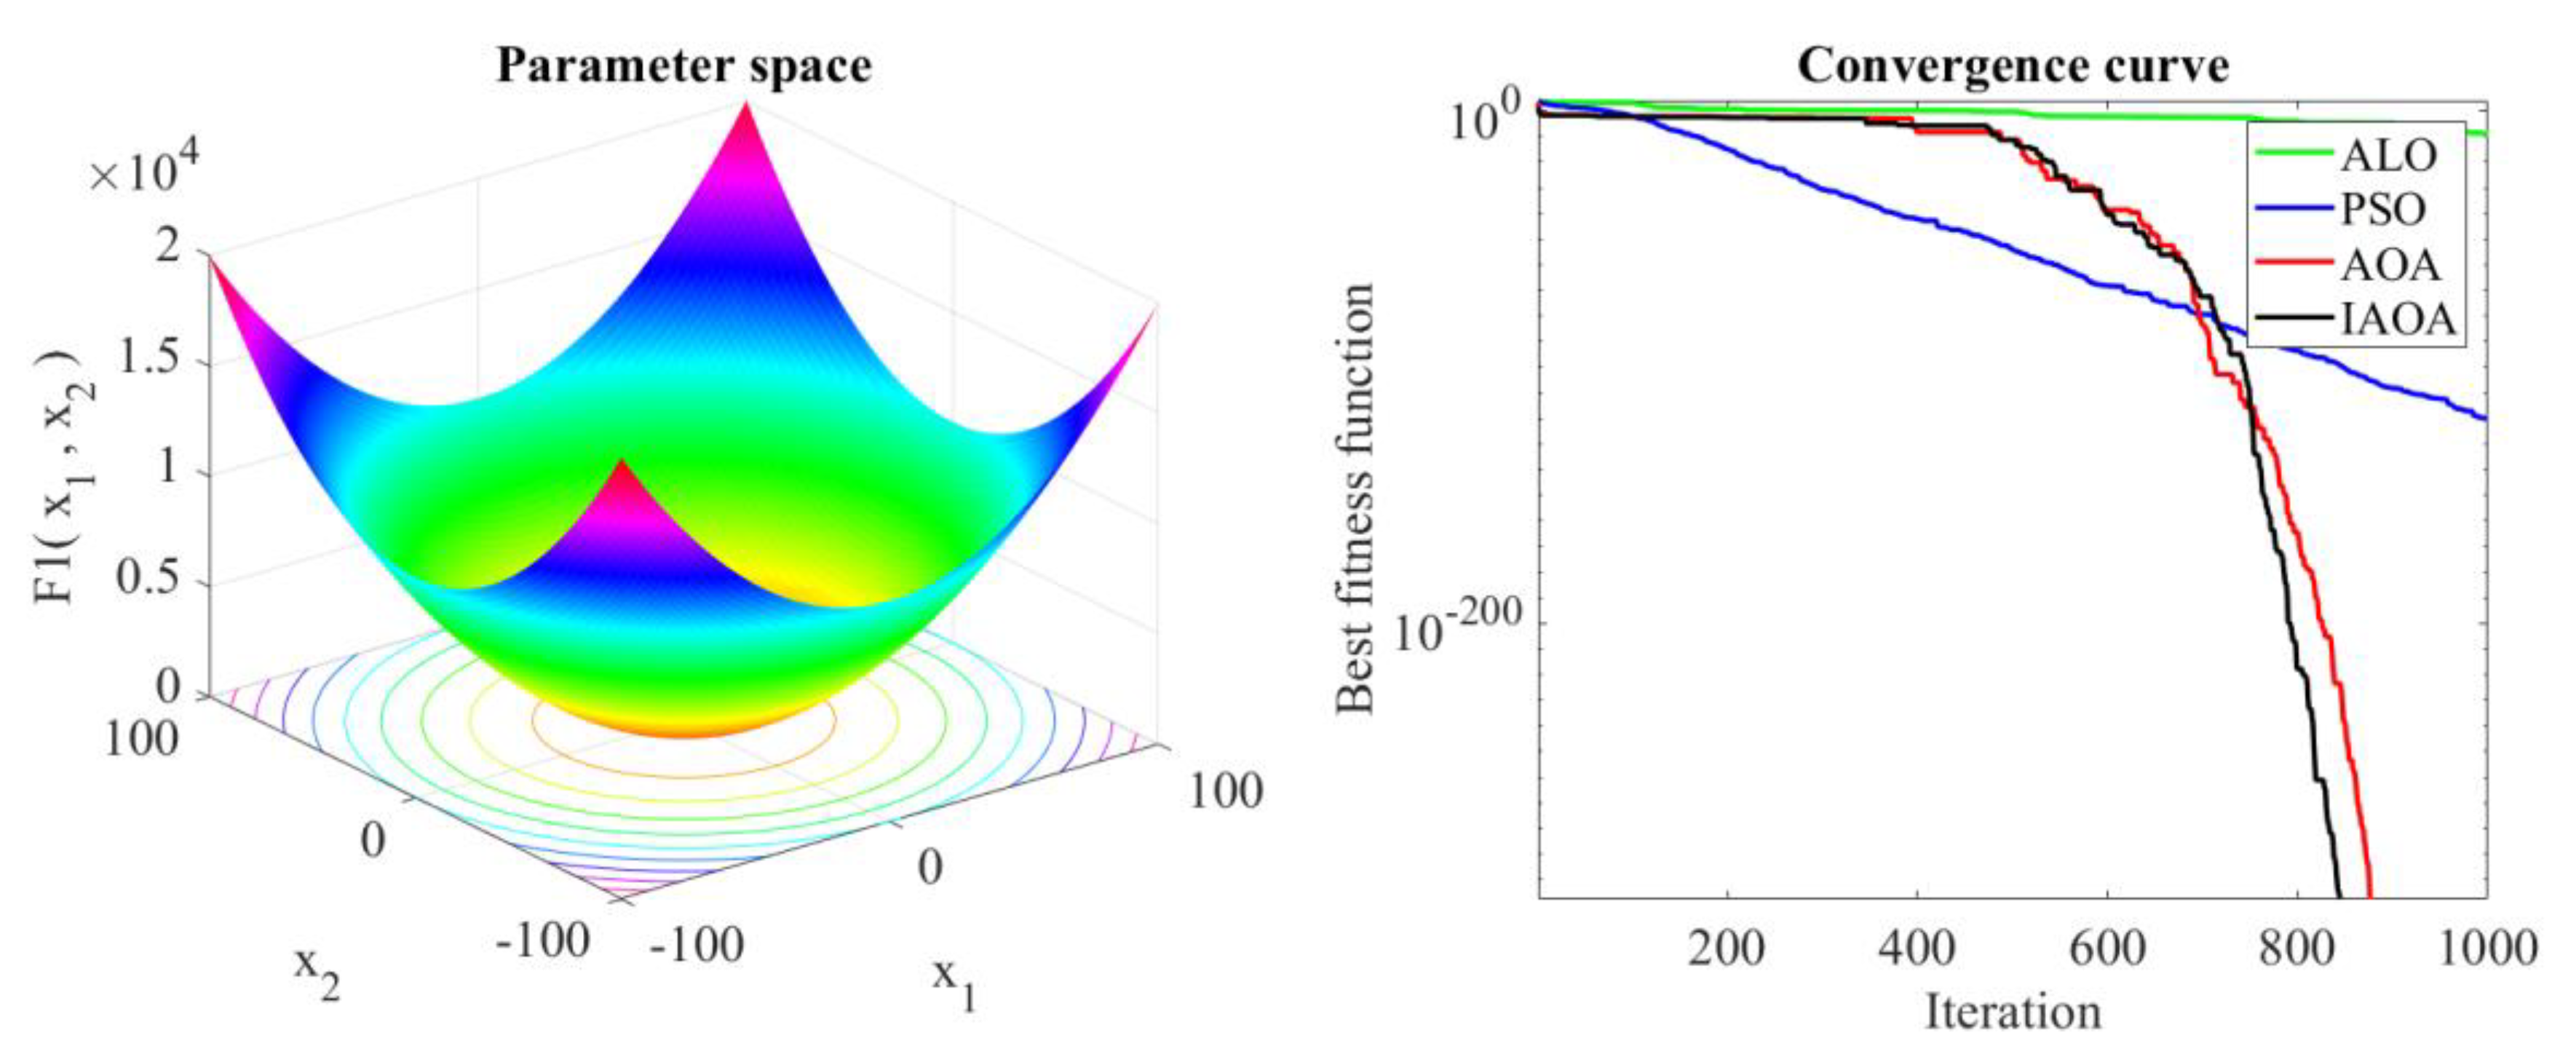
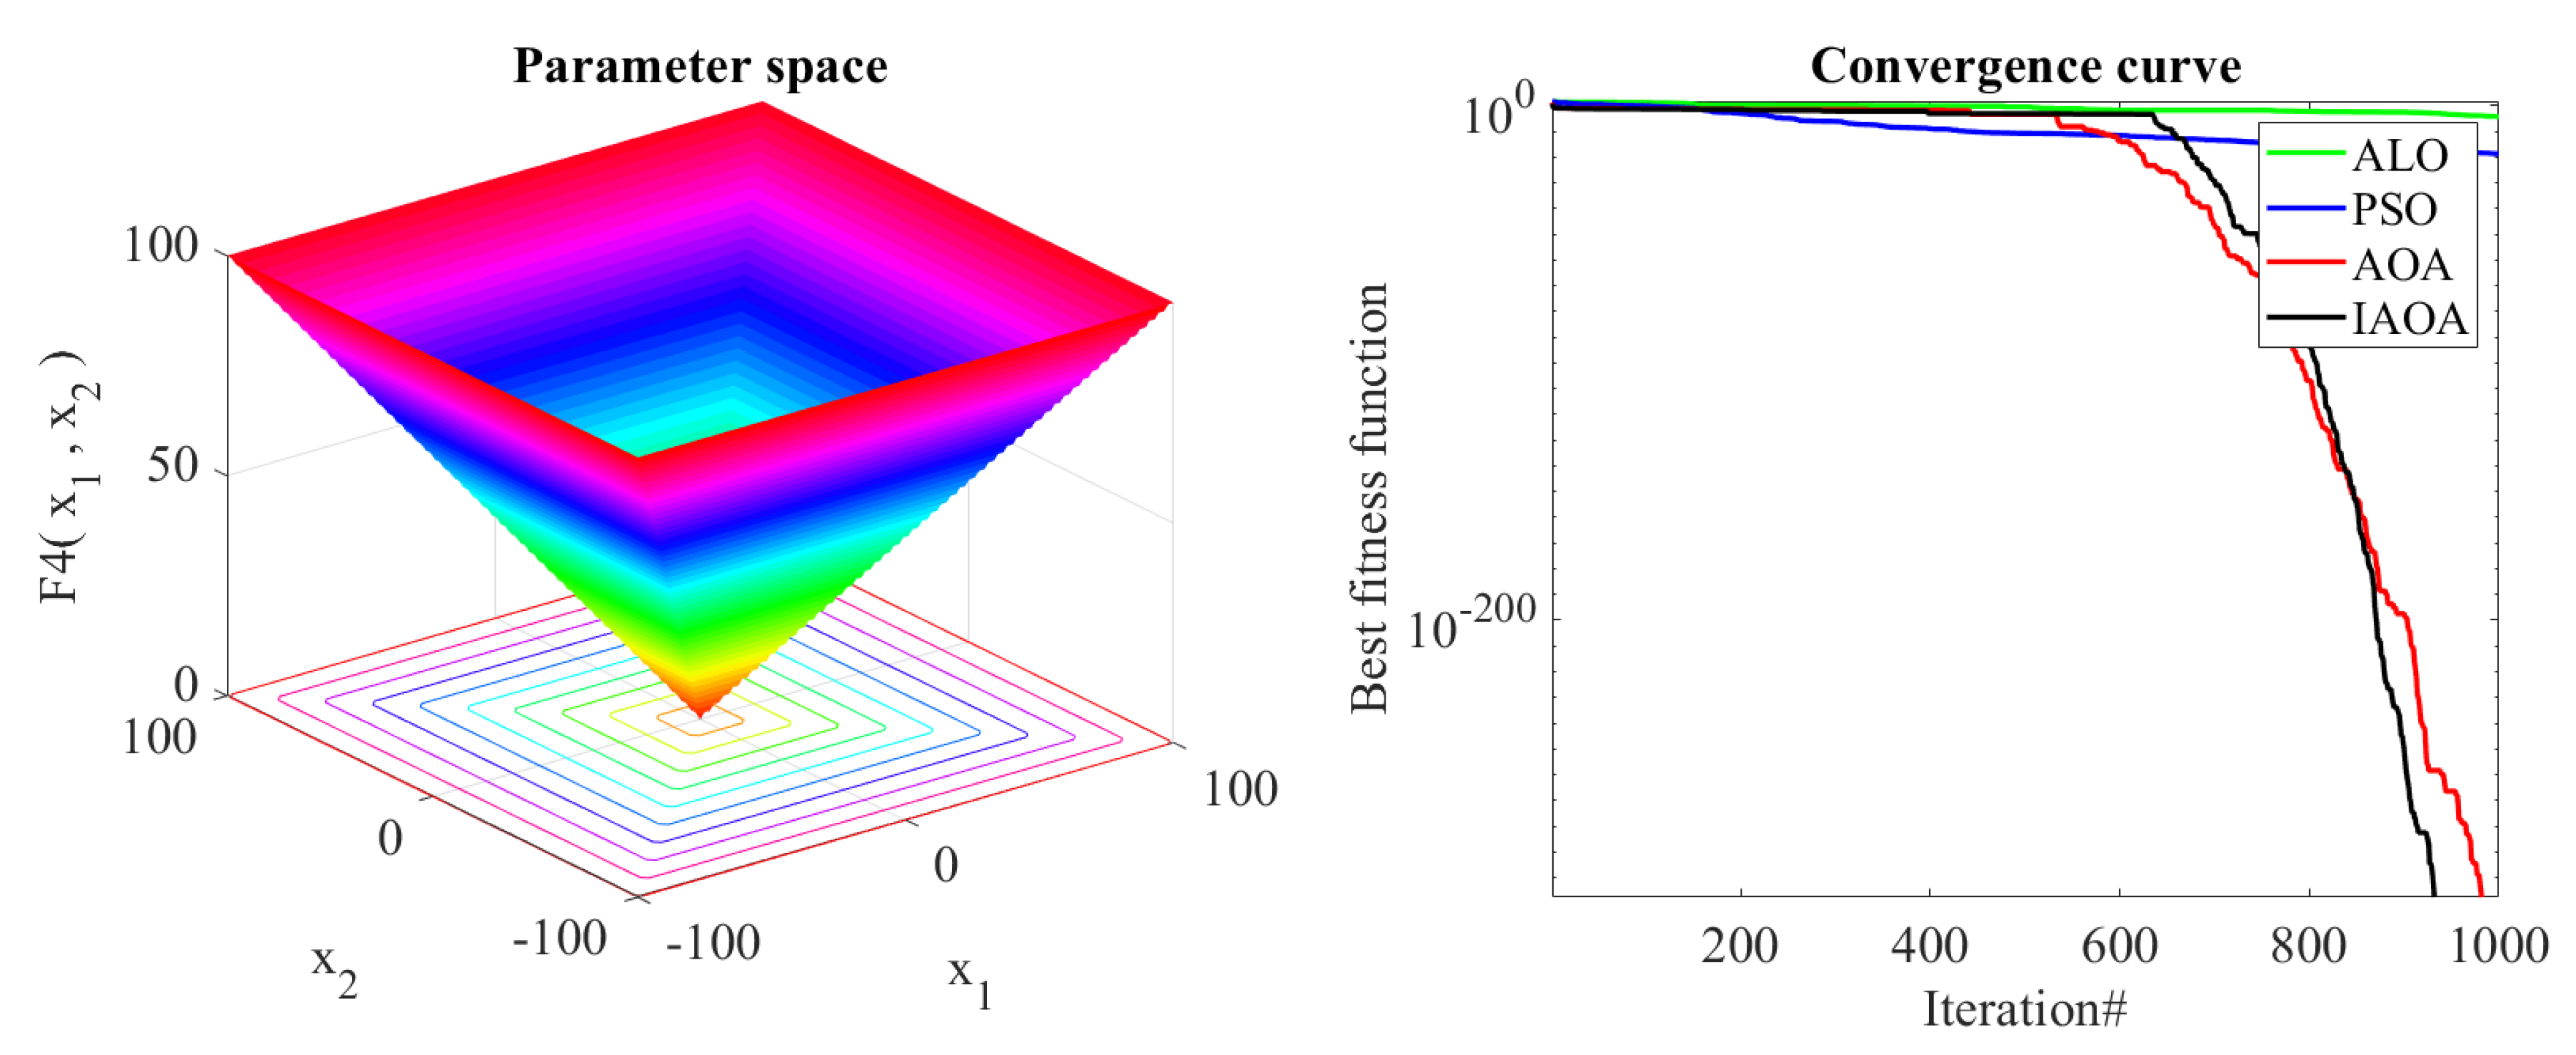
5.1. Performance Comparison between the Proposed IAOA and AOA, PSO, ALO

This study used four standard benchmark cases to confirm and verify the original AOA’s stability [69] and performance. These benchmarks can reasonably approximate the capability of exploitation and exploration, respectively, for the pending algorithm. Numerous experiments were conducted to evaluate the IAOA’s properties, for instance, the differences between IAOA and the original AOA were examined by utilizing several benchmarks, as indicated in Table 3.
The detailed experimental findings produced by AOA, ALO, PSO, and IAOA on these benchmarks are displayed in Table 4 concerning best value, worst value, average value and STD (standard deviation) value. This table shows that the IAOA can retrieve the best values by obtaining the minimum values of best value, worst value, average value and STD value. Hence, IAOA outperforms AOA, ALO, and PSO, indicating that algorithm stability can be guaranteed. Furthermore, to further illustrate descript convergence, the evolution curves of each approach on most of the benchmarks in this work are shown in Figure 14, Figure 15, Figure 16 and Figure 17. These figures show that, on these benchmarks, the proposed IAOA has satisfied quicker convergence than the AOA, PSO, and ALO methods.
Exploiting and exploring individual algorithms are very common in gauging the individual algorithm search capacity for all metaheuristic optimization strategies. The first step in each algorithm is thoroughly exploring the promising areas of the given solution search space. Depending on the optimization technique, optimizers can support this phase by using some stochastic operators to search the given space globally and randomly. The exploitation step, however, is a local search in which the optimizers look near the most promising regions identified thus far in the exploration phase. There is always a challenge in the optimization period to effectively balance these two stages, which can be performed using the controlling parameter. These parameters were carefully selected and tested on the employed standard benchmark test functions in this research.
Fitness–distance balance (FDB) and chaotic map mechanisms have been applied to improve the AOA. The AOA, PSO, and ALO benchmark algorithms are selected to perform the comparative analysis. A comparative analysis between IAOA, AOA, PSO, and ALO has been performed to test the efficiency and reliability of the algorithms, as shown in Figure 14, Figure 15, Figure 16 and Figure 17. Four popular standard mathematical benchmark functions comprising of the Unimodal and Multimodal functions have been used for comparison implementation.
Figure 14, Figure 15, Figure 16 and Figure 17 display the convergence curve for the IAOA, AOA, PSO, and ALO methods. The convergence curve shows how the algorithm converges to the best solution. So, the convergence curve indicates how fast the fitness value converges towards an optimal solution through iterations. The final value of the fitness value shows the best solution, while the nature/slope of this curve shows how fast the algorithm converges to the final solution. AOA has been improved by enhancing the exploration and exploitation phases. Fitness–distance balance (FDB) mechanisms have enhanced the exploitation phase. At the same time, a chaotic map mechanism has been used to enhance the exploration phase.
IAOA has been compared with the AOA, ALO, and PSO on four benchmark cases, as shown in Section 5.1. The experimental results, which are average values and evolution curves, are vividly recorded in Table 4 and Figure 14, Figure 15, Figure 16 and Figure 17, respectively. These records demonstrate that the efficiency of IAOA was observed according to the enhanced evolutionary convergence in competition with other counterparts. The curves in Figure 14, Figure 15, Figure 16 and Figure 17 demonstrate an accelerated drift for the proposed IAOA.

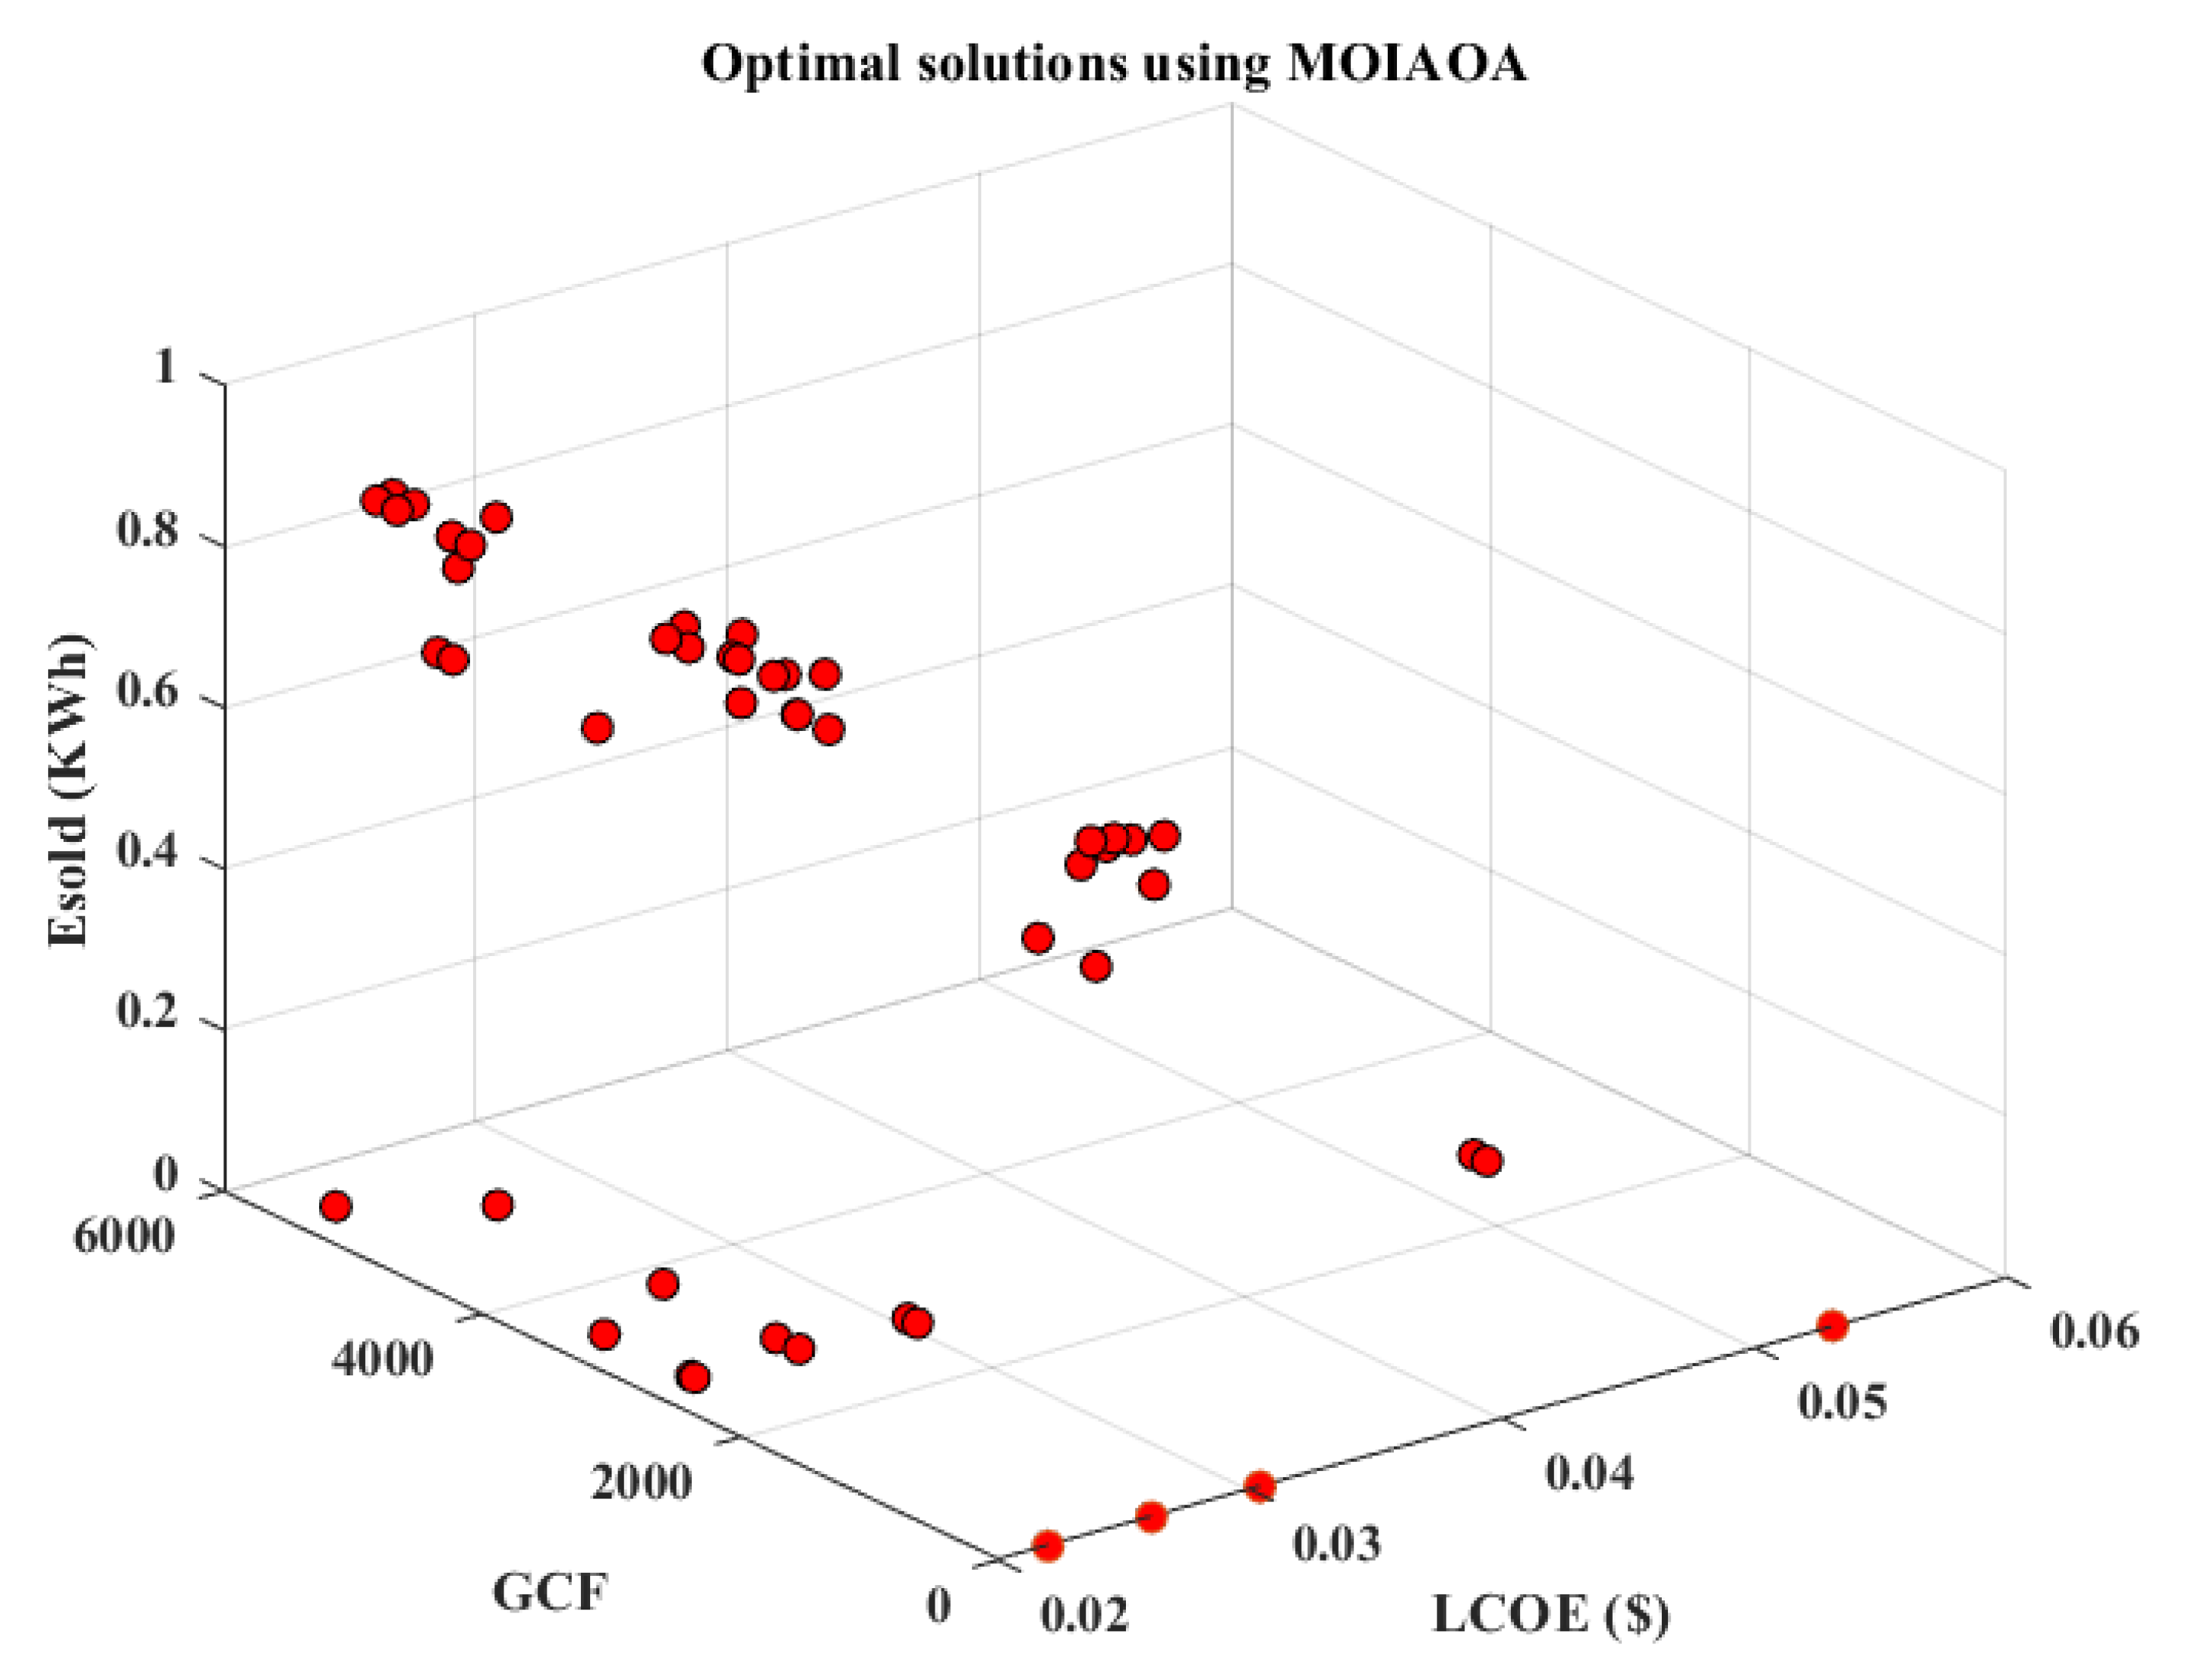
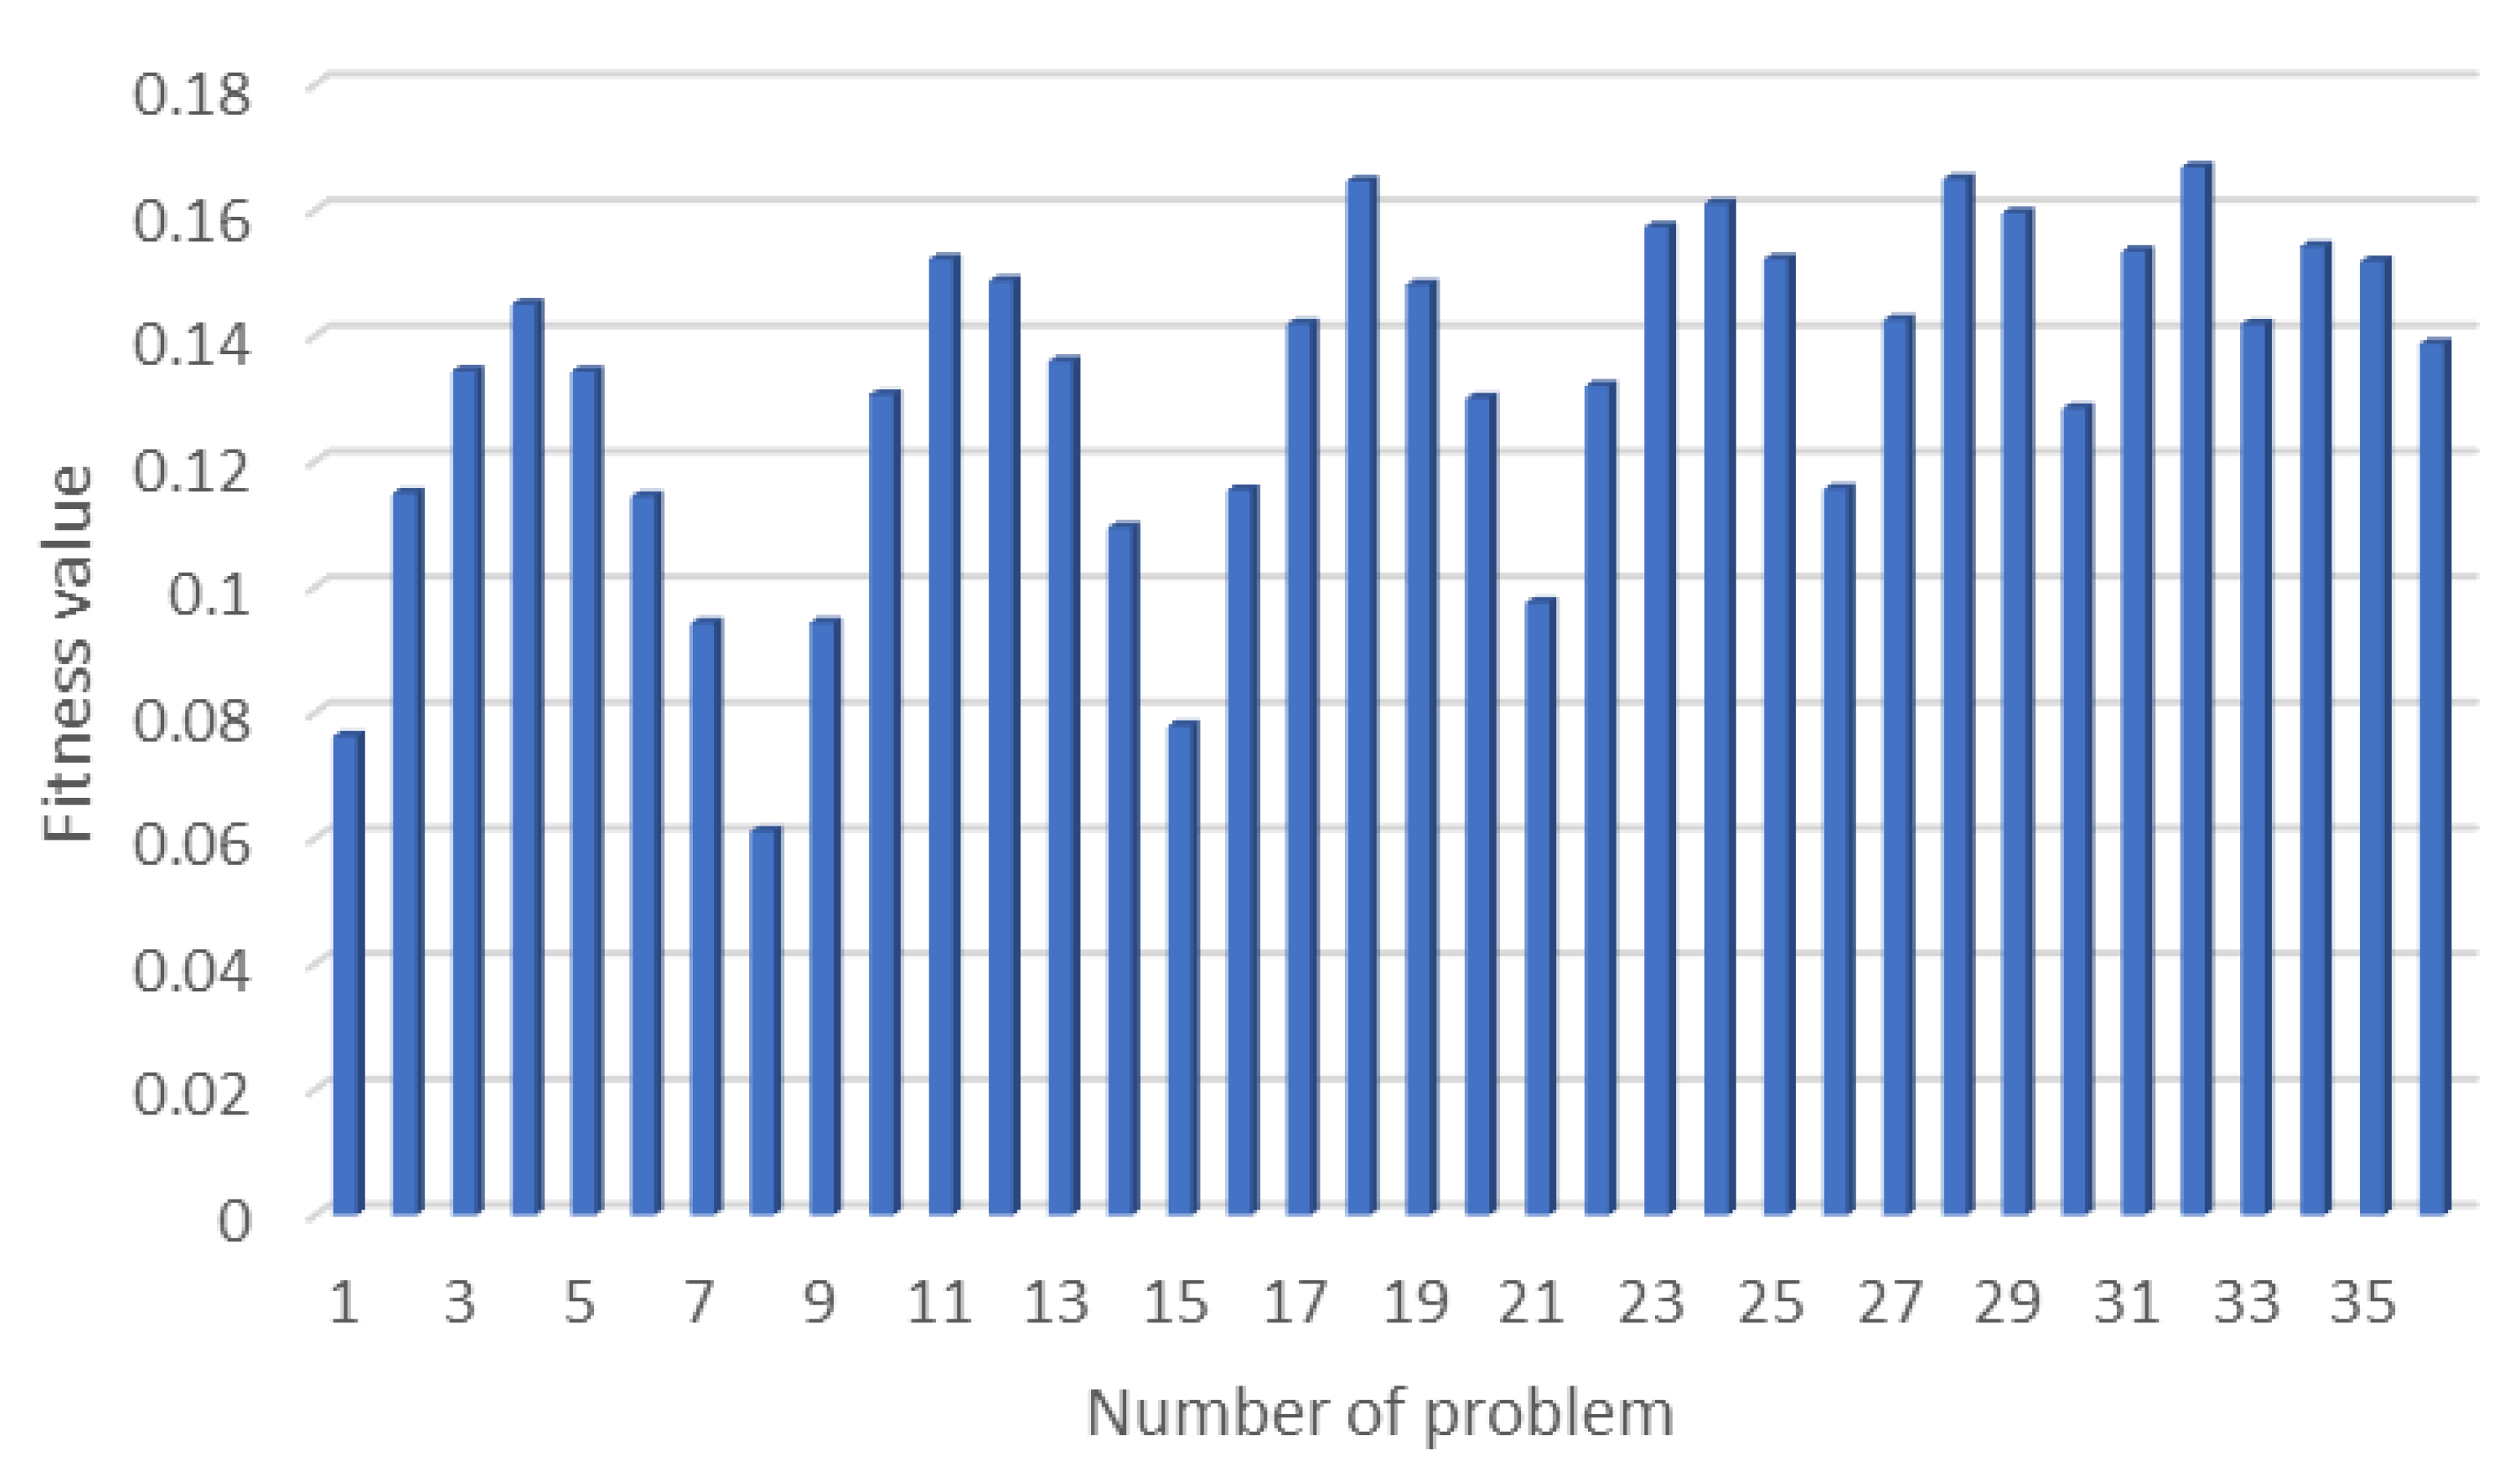
5.2. Results of the MIAOA

In this section, an optimization of the proposed system using a Multi-Objective Improved Arithmetic Optimization Algorithm has been implemented. The outcomes of the optimal design method based on RB-EMS-MOIAOA based on the Non-Scale multiple-run Pareto Front concept are shown in this section. The suggested optimization method aims to identify the best layout for the proposed system that would supply building demand at a desired value of LCOE, GCF, and E S O L D to guarantee that the proposed RB-EMS-MOAOA is reliable and valid when calculating the optimal system size required to meet the required demand of the chosen building.
In this research, the proposed system comprises a grid-connected PV–Wind–Battery system combined with EVCS via using the V2G technique. Multi-Objective Improved Arithmetic Optimization Algorithm (MOIAOA) based on the Non-Scale multiple-run Pareto Front concept has been used to improve the optimal design of the proposed system components. Multi-objective IAOA (MOIAOA) Non-Scale multiple-run Pareto Front concept has been used to calculate the optimal values of the three conflicting objectives, which are Grid Contribution Factor (GCF), Levelized Cost of Electricity (LCOE), and Energy sold to the grid ( E S O L D ). This method is classified as a Non-Scale (NS) multiple-run Pareto Front method, which deals with multi-objective optimization problems. Rule-Based Energy Management Strategy (RB-EMS) controls and monitors the proposed system's power flow. Three constraint objectives are used; the technical, economic, and renewability criteria are all weighted, normalized, and combined using a mono-objective function.
Table 5 shows the optimal configurations of the proposed system with sets of weights using the proposed MOIAOA based on the Non-Scale multiple-run Pareto Front concept. For the proposed system, Table 5 indicates the initializing weights (W1, W2, W3), number of wind turbines, number of PV modules, number of batteries, fitness value, LCOE, GCF, E S O L D , and CPU execution time. The range of weight sets is [1, 36] with a step size of 0.1. In Table 5, the optimal weight set and configurations of the proposed system using the MOIAOA Non-Scale multiple-run Pareto Front concept have been tabulated. The maximum fitness function (f) value recorded is 0.1649 at the set of weights [0.5, 0.3, 0.2]. In contrast, the minimum fitness function (f) value recorded is 0.0611 at the set of weights [0.1, 0.1, 0.8]. The given weight value changes the value of the individual objective. An accurate selection of the effective W1, W2, and W3 weights from the design space is required to find the best trade-off between the technical, economic, and renewability objectives. The trade-off between the defined level of renewability, economic, and technical criteria is required to choose an optimal configuration of the proposed system.
In Table 5, the first range of weights used in the MATLAB simulation of this work are W1 = 0.1, W2 = 0.8, and W3 = 0.1, and that leads to the results of the number of PV modules being equal to 31, the number of wind turbines equal to 1, number of batteries equal to 138, fitness value equal to 0.0762, LCOE equal to 2.37 × 10 2 USD/kWh, GCF equal to 0.0171 kWh, and E S O L D equal to 0.8596 kWh. Figure 18 presents the distribution of the solutions using the NS multiple-run Pareto Front method, where the aggregation of the three objectives is based on a predetermined set of weights.
Based on Table 5, the balance can be achieved when optimal weights W1, W2, and W3 are 0.4, 0.2, and 0.4, respectively. The weights of 0.4, 0.2, and 0.4 are optimal. Therefore, at the optimal weights and by comparison with other optimal weights, it can be observed that the value of LCOE is small, and the value of GCF is small, too. At the same time, the value of E S O L D is high. The results indicated that by employing the proposed MOIAOA Non-Scale multiple-run Pareto Front concept, the optimal configurations of the proposed system are as follows: number of PV modules equal to 8, number of wind turbines equal to 2, number of batteries equal to 33, fitness value equal to 0.1522, LCOE equal to 2.66 2 USD/kWh, GCF equal to 7.34 5 kWh, and E S O L D equal to 0.8409 kWh.
Figure 19 displays the evolution of the mono-objective function (f) (fitness function) based on optimal solutions using MOIAOA based on the Non-Scale multiple-run Pareto Front concept. Figure 19 depicts the aggregation function’s development for the proposed sizing algorithm at the optimal weights. Figure 19 demonstrates the development of the evaluation of the aggregation function with the maximum iteration of the proposed method to obtain the optimal size of the components of the proposed system.
Figure 20 exhibits the optimal weight sets based on three objectives using MOIAOA Non-Scale multiple-run Pareto Front concept; this figure presents the optimal configuration based on MOIAOA Non-Scale multiple-run Pareto Front concept, with the three objectives of E S O L D , LCOE, and GCF.
The results section shows that the control strategy can effectively schedule the generator at all times and meet the load demand. The simulation results demonstrate the superiority and the rapid convergence performance of the proposed improved (MOIAOA) Non-Scale multiple-run Pareto Front concept algorithm.

6. Conclusions and Future Direction

In this work, the IAOA is proposed and compared with AOA, PSO, and ALO methods to prove that the proposed algorithm is superior (to justify the superiority of the proposed algorithm). Then, a new MOIAOA is proposed for finding the optimal design of the proposed system that includes a PV–WT–battery system combined with EVCS using V2G technology in Al-Najaf Governorate in Iraq. The most desirable configurations for the proposed system are defined based on renewability–economic–technical criteria using ten-minute data readings of real meteorological data during the entire year. LCOE, GCF, and E S O L D are utilized as economic, renewability, and technical criteria, respectively. The MOIAOA based on a Non-Scale multiple-run Pareto Front concept was proposed to choose an optimal design for the proposed system. The FDB mechanism was employed to enhance the proposed system’s exploitation phase, and the chaotic map mechanism was employed to enhance the exploration phase of the proposed system. By using Non-Scale multiple-run PF, LCOE, GCF, and E S O L D are used as three constraint objective functions, which are aggregated after normalization and weighting by the mono-objective function. LCOE, GCF, and E S O L D are utilized as economic criteria, renewability criteria, and technical criteria, respectively. LCOE needed to be minimized, GCF needed to be minimized, and E S O L D needed to be minimized. The Rule-Based Energy Management Strategy (RB-EMS) was used to control and observe the power flow in the proposed system. The Pareto Front method was employed to obtain the optimal values of LCOE, GCF, and E S O L D ; these three constraint objectives are utilized as renewability criteria, economic criteria, and technical criteria. MATLAB R2020b is used for simulations in this research. For performance comparison, it is noted that the proposed IAOA is more efficient than AOA, ALO, and PSO because IAOA converges to the optimal solution in fewer iterations. The results indicated that by employing the proposed MOIAOA Non-Scale multiple-run Pareto Front concept, the optimal configurations of the proposed system are as follows: number of PV modules equal to 8, number of wind turbines equal to 2, number of batteries equal to 33, fitness value equal to 0.1522, LCOE equal to 2.66–2 USD/kWh, GCF equal to 7.34–2 kWh, and E S O L D equal to 0.8409 kWh.
This paper also describes integrating EVs with photovoltaics (PV) and wind turbines as Renewable Energy Sources (RESs) to address the problems associated with fossil fuels. Alternative energy sources can be used to handle the situation where fossil fuels have started to dwindle, leading to various power and environmental difficulties. This work is fully satisfied and meets the grid-connected system’s load demand. The constraints in electricity and environmental systems are resolved by integrating RESs with other sources. To handle the complexity of PV–wind hybrid systems, a metaheuristic optimization approach (MOIAOA) was combined with RB-EMS to achieve the objective functions. For the future direction of this work, this work highly recommends using other metaheuristic algorithms to investigate the renewability–economic–technical criteria and additional development of energy management strategies. Additionally, more examinations may be undertaken in the utilization of commercial load needs in the Al-Najaf Governorate in Iraq.

Author Contributions

Conceptualization, A.A.K.A.-S.; data curation, A.A.K.A.-S. and D.M.H.; formal analysis, A.A.K.A.-S., H.M.R. and D.M.H.; investigation, S.M.A., C.W.T., H.M.R. and D.M.H.; methodology, A.A.K.A.-S.; project administration, A.A.K.A.-S.; resources, A.A.K.A.-S.; software, A.A.K.A.-S.; validation, A.A.K.A.-S. and H.M.R.; visualization, A.A.K.A.-S. and S.M.A.; supervision, S.M.A. and C.W.T.; writing—original draft preparation, A.A.K.A.-S.; writing—review and editing, A.A.K.A.-S., S.M.A. and H.M.R.; funding acquisition, A.A.K.A.-S. and S.M.A. All authors have read and agreed to the published version of the manuscript.

Funding

This research was funded by University of Kufa (17348), Universiti Teknologi Malaysia: UTMPGIS[UTM.J.08.02.01/13.14/1/1 JId.2 (47)].

Institutional Review Board Statement

Not applicable.

Informed Consent Statement

Not applicable.

Data Availability Statement

The data presented in this study are available on request from the corresponding author.

Acknowledgments

The first author would like to thank the Iraqi government for supporting this study with a scholarship awarded through the University of Kufa by a vote of 17,348. The authors would like to thank Universiti Teknologi Malaysia (UTM) for the library facility and scholarship awarded through UTMPGIS by the vote of UTM.J.08.02.01/13.14/1/1 JId.2 (47).

Conflicts of Interest

The authors declare no conflicts of interest.

Abbreviations

E S O L D The annual energy sold to the grid
WTWind turbine
EVElectric Vehicle
EVCSelectric vehicle charging station
NSNon-Scale
PSOParticle swarm optimization
ALOAnt Lion Optimizer
EMSEnergy Management Strategy
AOAArithmetic optimization algorithm
HRESHybrid renewable energy system
MOOMulti-objective optimization
STCStandard Test Condition
P p v o u t ( t ) The output power generated from PV
G ( t ) Solar irradiance
P ( P V r a t e d ) Rated power for PV
NOCTThe nominal operating cell temperature
v c u t i n cut-in speed of the WT
v c u t o u t cut-out speed of the WT
P r Rated power of the WT
v r Rated wind speed of the WT
P W T The generated output power of the WT
BSSBattery Storage System
DODThe depth of discharge
S r a t e d The station rated capacity
cos The power factor
N s l o t The amount of charging slots for each EV
k l o a d The overload factor for cover overloading in transients
P E V The maximum power rate of each EV
P i n v ( t ) The inverter rating
P L m ( t ) The peak load demand
BTBattery
Xa collection of initialized solutions
Randa random variable in the range [0, 1]
X U B and X L B the upper and lower limits of the problem
MOA ( C i t e r ) the value at the t th iteration
M i t e r the maximum number of iterations
r 2 randomly generated number that is conditioned between the D and M operations
U B j and L B j the upper and lower limits
ε ε a tiny integer value
r 3 a randomly generated number that serves as a denotation for the A and S operators
FFFitness Function
PVphotovoltaic
RESsRenewable energy sources
LCOELevelized Cost of Energy
V2GVehicle-to-grid
STCStandard Test Conditions
RB-EMSRule-Based Energy Management Strategy
GCFGrid Contribution Factor
REFRenewable Energy Fraction
NPCEconomic criterion of net present cost
IAOAImproved arithmetic optimization algorithm
MOIAOAMulti-objective improved arithmetic optimization algorithm
α t Temperature coefficient
T C S T C The cell temperature as reference temperature
T a m b The ambient temperature
C B Capacity of the battery
E L The daily average load demand
ADthe autonomy days
v1, v2The wind speed
hhub height
h r e f The reference height anemometer
α The power-law exponential known as wind gradient, Hellmann exponent, or friction coefficient
SOCState of Charge
P b ( t ) The battery’s output of electricity
P p v ( t ) The total power generated by PV
P W T ( t ) The total power generated by WT
P l ( t ) The total energy demand
η i n v The inverter efficiency
σ The self-discharge rate of the battery
η b Battery efficiency
r a t e f e e d i n The feed-in tariff rate
E g r i d ( s e l l i n g ) The cost of selling energy
C p The cost of buying electricity from the grid
t = 1 8760 E g r i d ( p u r c h a e d ) The per hour summation of annually buying electricity from the grid for one year
MOAMath Optimizer Accelerated
C i t e r the current iteration
Max & MinThe accelerated function’s maximum and lowest values are denoted by Max and Min (Maximum and minimum values of the MOA function)
μ a control variable set
MOPMath Optimizer Probability
a sensitive control parameter set
FDBFitness–distance balance

References

  1. Ali, S.; Zheng, Z.; Aillerie, M.; Sawicki, J.-P.; Péra, M.-C.; Hissel, D. A Review of DC Microgrid Energy Management Systems Dedicated to Residential Applications. Energies 2021, 14, 4308. [Google Scholar] [CrossRef]
  2. Ali, A.; Shaaban, M.F.; Awad, A.S.A.; Azzouz, M.A.; Lehtonen, M.; Mahmoud, K. Multi-Objective Allocation of EV Charging Stations and RESs in Distribution Systems Considering Advanced Control Schemes. IEEE Trans. Veh. Technol. 2023, 72, 3146–3160. [Google Scholar] [CrossRef]
  3. Das, R.; Wang, Y.; Putrus, G.; Kotter, R.; Marzband, M.; Herteleer, B.; Warmerdam, J. Multi-objective techno-economic-environmental optimization of electric vehicle for energy services. Appl. Energy 2020, 257, 113965. [Google Scholar] [CrossRef]
  4. Ahmadi, S.E.; Kazemi-Razi, S.M.; Marzband, M.; Ikpehai, A.; Abusorrah, A. Multi-objective stochastic techno-economic-environmental optimization of distribution networks with G2V and V2G systems. Electr. Power Syst. Res. 2023, 218, 109195. [Google Scholar] [CrossRef]
  5. Liu, J.; Chen, X.; Yang, H.; Shan, K. Hybrid renewable energy applications in zero-energy buildings and communities integrating battery and hydrogen vehicle storage. Appl. Energy 2021, 290, 116733. [Google Scholar] [CrossRef]
  6. Eriksson, E.; Gray, E.M. Optimization and integration of hybrid renewable energy hydrogen fuel cell energy systems—A critical review. Appl. Energy 2017, 202, 348–364. [Google Scholar] [CrossRef]
  7. Sedighizadeh, M.; Fazlhashemi, S.S.; Javadi, H.; Taghvaei, M. Multi-objective day-ahead energy management of a microgrid considering responsive loads and uncertainty of the electric vehicles. J. Clean. Prod. 2020, 267, 121562. [Google Scholar] [CrossRef]
  8. Jia, S.; Kang, X.; Cui, J.; Tian, B.; Xiao, S. Hierarchical stochastic optimal scheduling of electric thermal hydrogen integrated energy system considering electric vehicles. Energies 2022, 15, 5509. [Google Scholar] [CrossRef]
  9. Zhang, Q.; Ding, J.; Li, G. Optimal operation of PV-diesel-battery MG based on fuzzy comprehensive evaluation. In Proceedings of the 2018 Thirteenth International Conference on Ecological Vehicles and Renewable Energies (EVER), Monte Carlo, Monaco, 10–12 April 2018; pp. 1–5. [Google Scholar]
  10. Saffari, M.; Misaghian, M.S.; Flynn, D.; Kia, M.; Vahidinasab, V.; Lotfi, M.; Catalão, J.P.; Shafie-Khah, M. Multi-objective optimization of an active distribution system using normalised normal constraint method. In Proceedings of the 2019 IEEE Milan PowerTech, Milan, Italy, 23–27 June 2019; pp. 1–6. [Google Scholar]
  11. Jannati, J.; Nazarpour, D. Multi-objective scheduling of electric vehicles intelligent parking lot in the presence of hydrogen storage system under peak load management. Energy 2018, 163, 338–350. [Google Scholar] [CrossRef]
  12. Ahmed, H.Y.; Ali, Z.M.; Refaat, M.M.; Aleem, S.H.A. A Multi-Objective Planning Strategy for Electric Vehicle Charging Stations towards Low Carbon-Oriented Modern Power Systems. Sustainability 2023, 15, 2819. [Google Scholar] [CrossRef]
  13. Tan, B.; Chen, H. Multi-objective energy management of multiple microgrids under random electric vehicle charging. Energy 2020, 208, 118360. [Google Scholar] [CrossRef]
  14. Hosseinnia, H.; Nazarpour, D.; Talavat, V. Multi-objective optimization framework for optimal planning of the microgrid (MG) under employing demand response program (DRP). J. Ambient Intell. Humaniz. Comput. 2019, 10, 2709–2730. [Google Scholar] [CrossRef]
  15. Kataoka, R.; Shichi, A.; Yamada, H.; Iwafune, Y.; Ogimoto, K. Comparison of the economic and environmental performance of V2H and residential stationary battery: Development of a multi-objective optimization method for homes of EV owners. World Electr. Veh. J. 2019, 10, 78. [Google Scholar] [CrossRef]
  16. Wu, G.; Yi, C.; Xiao, H.; Wu, Q.; Zeng, L.; Yan, Q.; Zhang, M. Multi-objective Optimization of Integrated Energy Systems Considering Renewable Energy Uncertainty and Electric Vehicles. IEEE Trans. Smart Grid 2023, 14, 4322–4332. [Google Scholar] [CrossRef]
  17. Stojkovic, J. Multi-objective optimal charging control of electric vehicles in pv charging station. In Proceedings of the 2019 16th International Conference on the European Energy Market (EEM), Ljubljana, Slovenia, 18–20 September 2019; pp. 1–5. [Google Scholar]
  18. De Schepper, E.; Van Passel, S.; Lizin, S.; Vincent, T.; Martin, B.; Gandibleux, X. Economic and environmental multi-objective optimization to evaluate the impact of Belgian policy on solar power and electric vehicles. J. Environ. Econ. Policy 2016, 5, 1–27. [Google Scholar] [CrossRef]
  19. Zeynali, S.; Rostami, N.; Feyzi, M. Multi-objective optimal short-term planning of renewable distributed generations and capacitor banks in power system considering different uncertainties including plug-in electric vehicles. Int. J. Electr. Power Energy Syst. 2020, 119, 105885. [Google Scholar] [CrossRef]
  20. Ahmadi-Nezamabad, H.; Zand, M.; Alizadeh, A.; Vosoogh, M.; Nojavan, S. Multi-objective optimization based robust scheduling of electric vehicles aggregator. Sustain. Cities Soc. 2019, 47, 101494. [Google Scholar] [CrossRef]
  21. Yang, Z.; Ghadamyari, M.; Khorramdel, H.; Alizadeh, S.M.S.; Pirouzi, S.; Milani, M.; Banihashemi, F.; Ghadimi, N. Robust multi-objective optimal design of islanded hybrid system with renewable and diesel sources/stationary and mobile energy storage systems. Renew. Sustain. Energy Rev. 2021, 148, 111295. [Google Scholar] [CrossRef]
  22. Foroozandeh, Z.; Ramos, S.; Soares, J.; Vale, Z. Energy management in smart building by a multi-objective optimization model and pascoletti-serafini scalarization approach. Processes 2021, 9, 257. [Google Scholar] [CrossRef]
  23. Coelho, V.N.; Coelho, I.M.; Coelho, B.N.; Cohen, M.W.; Reis, A.J.; Silva, S.M.; Souza, M.J.; Fleming, P.J.; Guimaraes, F.G. Multi-objective energy storage power dispatching using plug-in vehicles in a smart-microgrid. Renew. Energy 2016, 89, 730–742. [Google Scholar] [CrossRef]
  24. Soares, J.; Ghazvini, M.A.F.; Vale, Z.; de Moura Oliveira, P. A multi-objective model for the day-ahead energy resource scheduling of a smart grid with high penetration of sensitive loads. Appl. Energy 2016, 162, 1074–1088. [Google Scholar] [CrossRef]
  25. Han, W.; Zhang, J.; Chen, L. Multi-Objective Optimal Dispatch of Smart Grid by Estimating Available Capacity of EV Aggregators. In Proceedings of the 2021 IEEE Sustainable Power and Energy Conference (iSPEC), Nanjing, China, 23–25 December 2021; pp. 1299–1303. [Google Scholar]
  26. Panda, N.K.; Paterakis, N.G. A multi-objective optimization model for the quantification of flexibility in a large business park. In Proceedings of the 2021 International Conference on Smart Energy Systems and Technologies (SEST), Vaasa, Finland, 6–8 September 2021; pp. 1–6. [Google Scholar]
  27. Gholami, K.; Karimi, S.; Anvari-Moghaddam, A. Multi-objective stochastic planning of electric vehicle charging stations in unbalanced distribution networks supported by smart photovoltaic inverters. Sustain. Cities Soc. 2022, 84, 104029. [Google Scholar] [CrossRef]
  28. Sedighizadeh, M.; Esmaili, M.; Mohammadkhani, N. Stochastic multi-objective energy management in residential microgrids with combined cooling, heating, and power units considering battery energy storage systems and plug-in hybrid electric vehicles. J. Clean. Prod. 2018, 195, 301–317. [Google Scholar] [CrossRef]
  29. Zhu, J.; Jin, Y.; Zhu, W.; Lee, D.-K.; Bohlooli, N. Multi-objective planning of micro-grid system considering renewable energy and hydrogen storage systems with demand response. Int. J. Hydrog. Energy 2023, 48, 15626–15645. [Google Scholar] [CrossRef]
  30. Sharafi, M.; ElMekkawy, T.Y.; Bibeau, E.L. Optimal design of hybrid renewable energy systems in buildings with low to high renewable energy ratio. Renew. Energy 2015, 83, 1026–1042. [Google Scholar] [CrossRef]
  31. Murray, P.; Carmeliet, J.; Orehounig, K. Multi-objective optimization of power-to-mobility in decentralised multi-energy systems. Energy 2020, 205, 117792. [Google Scholar] [CrossRef]
  32. Zhang, Y.; Le, J.; Liao, X.; Zheng, F.; Liu, K.; An, X. Multi-objective hydro-thermal-wind coordination scheduling integrated with large-scale electric vehicles using IMOPSO. Renew. Energy 2018, 128, 91–107. [Google Scholar] [CrossRef]
  33. Luo, C.; Huang, Y.-F.; Gupta, V. Stochastic dynamic pricing for EV charging stations with renewable integration and energy storage. IEEE Trans. Smart Grid 2017, 9, 1494–1505. [Google Scholar] [CrossRef]
  34. Wolpert, D.H.; Macready, W.G. No free lunch theorems for optimization. IEEE Trans. Evol. Comput. 1997, 1, 67–82. [Google Scholar] [CrossRef]
  35. “Kyocera KD325GX-LFB (325 W) Solar Panel”, SolarDesignTool. Available online: http://www.solardesigntool.com/components/module-panel-solar/Kyocera/2788/KD325GX-LFB/specification-data-sheet.html (accessed on 4 June 2023).
  36. Mouli, G.C.; Bauer, P.; Zeman, M. System design for a solar powered electric vehicle charging station for workplaces. Appl. Energy 2016, 168, 434–443. [Google Scholar] [CrossRef]
  37. Bhatti, A.R.; Salam, Z. A rule-based energy management scheme for uninterrupted electric vehicles charging at constant price using photovoltaic-grid system. Renew. Energy 2018, 125, 384–400. [Google Scholar] [CrossRef]
  38. Bukar, A.L.; Tan, C.W.; Lau, K.Y. Optimal sizing of an autonomous photovoltaic/wind/battery/diesel generator microgrid using grasshopper optimization algorithm. Sol. Energy 2019, 188, 685–696. [Google Scholar] [CrossRef]
  39. Diaf, S.; Diaf, D.; Belhamel, M.; Haddadi, M.; Louche, A. A methodology for optimal sizing of autonomous hybrid PV/wind system. Energy Policy 2007, 35, 5708–5718. [Google Scholar] [CrossRef]
  40. Bhandari, B.; Poudel, S.R.; Lee, K.-T.; Ahn, S.-H. Mathematical modeling of hybrid renewable energy system: A review on small hydro-solar-wind power generation. Int. J. Precis. Eng. Manuf. -Green Technol. 2014, 1, 157–173. [Google Scholar] [CrossRef]
  41. Al-Kharbosy, M.E.H. Enhancement Protection and Operation of the Doubly Fed Induction Generator during Grid Fault. Master’s Thesis, South Valley University-Qena-Egypt, Qena, Egypt, 2012. [Google Scholar]
  42. Borhanazad, H.; Mekhilef, S.; Ganapathy, V.G.; Modiri-Delshad, M.; Mirtaheri, A. Optimization of micro-grid system using MOPSO. Renew. Energy 2014, 71, 295–306. [Google Scholar] [CrossRef]
  43. Poompavai, T.; Kowsalya, M. Control and energy management strategies applied for solar photovoltaic and wind energy fed water pumping system: A review. Renew. Sustain. Energy Rev. 2019, 107, 108–122. [Google Scholar] [CrossRef]
  44. Leone, C.; Longo, M.; Fernández-Ramírez, L.M.; García-Triviño, P. Multi-Objective Optimization of PV and Energy Storage Systems for Ultra-Fast Charging Stations. IEEE Access 2022, 10, 14208–14224. [Google Scholar] [CrossRef]
  45. Bukar, A.L.; Tan, C.W.; Yiew, L.K.; Ayop, R.; Tan, W.-S. A rule-based energy management scheme for long-term optimal capacity planning of grid-independent microgrid optimized by multi-objective grasshopper optimization algorithm. Energy Convers. Manag. 2020, 221, 113161. [Google Scholar] [CrossRef] [PubMed]
  46. Maleki, A.; Khajeh, M.G.; Ameri, M. Optimal sizing of a grid independent hybrid renewable energy system incorporating resource uncertainty, and load uncertainty. Int. J. Electr. Power Energy Syst. 2016, 83, 514–524. [Google Scholar] [CrossRef]
  47. Kaabeche, A.; Ibtiouen, R. Techno-economic optimization of hybrid photovoltaic/wind/diesel/battery generation in a stand-alone power system. Sol. Energy 2014, 103, 171–182. [Google Scholar] [CrossRef]
  48. Chang, W.-Y. The state of charge estimating methods for battery: A review. Int. Sch. Res. Not. 2013, 2013, 953792. [Google Scholar] [CrossRef]
  49. RELiON Batteries, Rechargable Deep Cycle Lithium Batteries Rb75 12.8. 2020. Available online: https://relionbattery.com/products/lithium/application/electric-vehicles (accessed on 14 May 2023).
  50. Singh, S.; Singh, M.; Kaushik, S.C. Feasibility study of an islanded microgrid in rural area consisting of PV, wind, biomass and battery energy storage system. Energy Convers. Manag. 2016, 128, 178–190. [Google Scholar] [CrossRef]
  51. Natesan, C.; Ajithan, S.K.; Chozhavendhan, S.; Devendiran, A. Power management strategies in microgrid: A survey. Int. J. Renew. Energy Res. 2015, 5, 334–340. [Google Scholar]
  52. Barakat, S.; Ibrahim, H.; Elbaset, A.A. Multi-objective optimization of grid-connected PV-wind hybrid system considering reliability, cost, and environmental aspects. Sustain. Cities Soc. 2020, 60, 102178. [Google Scholar] [CrossRef]
  53. Arancibia, A.; Strunz, K. Modeling of an electric vehicle charging station for fast DC charging. In Proceedings of the 2012 IEEE International Electric Vehicle Conference, Greenville, SC, USA, 4–8 March 2012; pp. 1–6. [Google Scholar]
  54. AL-Hasnawi, D.M.H. Experimental Study the Effect of Ambient Temperature on the Performance of Photovoltaic System Work with MPPT Charge Controller in Technical Engineering College of Najaf; Southern Technical University: Basra Governorate, Iraq, 2018. [Google Scholar]
  55. Wirth, H.; Schneider, K. Recent Facts about Photovoltaics in Germany; Fraunhofer Ise: Freiburg im Breisgau, Germany, 2015; p. 92. [Google Scholar]
  56. Bartolucci, L.; Cordiner, S.; Mulone, V.; Santarelli, M.; Ortenzi, F.; Pasquali, M. PV assisted electric vehicle charging station considering the integration of stationary first-or second-life battery storage. J. Clean. Prod. 2023, 383, 135426. [Google Scholar] [CrossRef]
  57. Duman, A.C.; Erden, H.S.; Gönül, Ö.; Güler, Ö. A home energy management system with an integrated smart thermostat for demand response in smart grids. Sustain. Cities Soc. 2021, 65, 102639. [Google Scholar] [CrossRef]
  58. Alsharif, A.; Tan, C.W.; Ayop, R.; Dobi, A.; Lau, K.Y. A comprehensive review of energy management strategy in Vehicle-to-Grid technology integrated with renewable energy sources. Sustain. Energy Technol. Assess. 2021, 47, 101439. [Google Scholar] [CrossRef]
  59. Tran, D.-D.; Vafaeipour, M.; El Baghdadi, M.; Barrero, R.; Van Mierlo, J.; Hegazy, O. Thorough state-of-the-art analysis of electric and hybrid vehicle powertrains: Topologies and integrated energy management strategies. Renew. Sustain. Energy Rev. 2020, 119, 109596. [Google Scholar] [CrossRef]
  60. Wu, X.; Hu, X.; Moura, S.; Yin, X.; Pickert, V. Stochastic control of smart home energy management with plug-in electric vehicle battery energy storage and photovoltaic array. J. Power Sources 2016, 333, 203–212. [Google Scholar] [CrossRef]
  61. Hussain, M.T.; Sulaiman, D.N.B.; Hussain, M.S.; Jabir, M. Optimal Management strategies to solve issues of grid having Electric Vehicles (EV): A review. J. Energy Storage 2021, 33, 102114. [Google Scholar] [CrossRef]
  62. Lorestani, A.; Gharehpetian, G.B.; Nazari, M.H. Optimal sizing and techno-economic analysis of energy- and cost-efficient standalone multi-carrier microgrid. Energy 2019, 178, 751–764. [Google Scholar] [CrossRef]
  63. Bouchekara, H.R.E.-H.; Javaid, M.S.; Shaaban, Y.A.; Shahriar, M.S.; Ramli, M.A.M.; Latreche, Y. Decomposition based multiobjective evolutionary algorithm for PV/Wind/Diesel Hybrid Microgrid System design considering load uncertainty. Energy Rep. 2021, 7, 52–69. [Google Scholar] [CrossRef]
  64. Ridha, H.M.; Hizam, H.; Mirjalili, S.; Othman, M.L.; Ya’acob, M.E.; Ahmadipour, M. Innovative hybridization of the two-archive and PROMETHEE-II triple-objective and multi-criterion decision making for optimum configuration of the hybrid renewable energy system. Appl. Energy 2023, 341, 121117. [Google Scholar] [CrossRef]
  65. Abualigah, L.; Diabat, A.; Mirjalili, S.; Abd Elaziz, M.; Gandomi, A.H. The Arithmetic Optimization Algorithm. Comput. Methods Appl. Mech. Eng. 2021, 376, 113609. [Google Scholar] [CrossRef]
  66. Duman, S.; Kahraman, H.T.; Sonmez, Y.; Guvenc, U.; Kati, M.; Aras, S. A powerful meta-heuristic search algorithm for solving global optimization and real-world solar photovoltaic parameter estimation problems. Eng. Appl. Artif. Intell. 2022, 111, 104763. [Google Scholar] [CrossRef]
  67. Kahraman, H.T.; Aras, S.; Gedikli, E. Fitness-distance balance (FDB): A new selection method for meta-heuristic search algorithms. Knowl. -Based Syst. 2020, 190, 105169. [Google Scholar] [CrossRef]
  68. Ridha, H.M.; Gomes, C.; Hizam, H.; Ahmadipour, M.; Heidari, A.A.; Chen, H. Multi-objective optimization and multi-criteria decision-making methods for optimal design of standalone photovoltaic system: A comprehensive review. Renew. Sustain. Energy Rev. 2021, 135, 110202. [Google Scholar] [CrossRef]
  69. Zeng, H.B.; Liu, X.G.; Wang, W.; Xiao, S.P. New results on stability analysis of systems with time-varying delays using a generalized free-matrix-based inequality. J. Frankl. Inst. 2019, 356, 7312–7321. [Google Scholar] [CrossRef]
Figure 1. The proposed system.
Sustainability 16 02491 g001
Figure 2. Map of Iraq.
Sustainability 16 02491 g002
Figure 3. Map of Al-Najaf Governorate.
Sustainability 16 02491 g003
Figure 4. Weather station: (a) Davis weather station; (b) Vantage Pro2.
Sustainability 16 02491 g004
Figure 5. Research methodology flowchart.
Sustainability 16 02491 g005
Figure 6. If-then condition operations along with the previously described scenarios.
Sustainability 16 02491 g006
Figure 7. Flowchart of the proposed IAOA.
Sustainability 16 02491 g007
Figure 8. Ten minutes of data readings of solar irradiance during the entire year.
Sustainability 16 02491 g008
Figure 9. Ten minutes of data readings of temperature during the entire year.
Sustainability 16 02491 g009
Figure 10. Ten minutes of data readings of wind speed during the entire year.
Sustainability 16 02491 g010
Figure 11. Ten-minute data values of load profile of the studied area during the entire year.
Sustainability 16 02491 g011
Figure 12. PV output power in the proposed system.
Sustainability 16 02491 g012
Figure 13. The wind turbine output power in the proposed system.
Sustainability 16 02491 g013
Figure 14. Parameter space and convergence curve of the IAOA, ALO, AOA, and PSO on the first test function.
Sustainability 16 02491 g014
Figure 15. Parameter space and convergence curve of the IAOA, ALO, AOA, and PSO on the second test function.
Sustainability 16 02491 g015
Figure 16. Parameter space and convergence curve of the IAOA, ALO, AOA, and PSO on the third test function.
Sustainability 16 02491 g016
Figure 17. Parameter space and convergence curve of the IAOA, ALO, AOA, and PSO on the fourth test function.
Sustainability 16 02491 g017
Figure 18. Development of the aggregation function based on the NS multiple-run Pareto Front method.
Sustainability 16 02491 g018
Figure 19. Evaluation of fitness function based on optimal solutions using MOIAOA based on Non-Scale multiple-run Pareto Front concept.
Sustainability 16 02491 g019
Figure 20. Evaluation of E S O L D (kWh), GCF (kWh), and LCOE (USD) values with different weight sets using MOIAOA based on Non-Scale Pareto Front concept.
Sustainability 16 02491 g020
Table 1. Economical and technical data of the proposed system components.
ComponentsParameterValueUnit
Wind Turbine (WT)Rated Power of Wind Turbine ( P r )1kW
Cut-in speed (Vcin)3m/s
Cut-out speed (Vco)20m/s
Rated wind speed (Vrat)11m/s
Capital cost (per kW)2300USD
Replacement cost (per kW)1500USD
O & M cost (per kW) [operation + maintenance]2USD/vr
Hub height50M
Overall efficiency26%
Lifetime20years
Solar (PV)Rated power (Ps r)325W
Derating factor (f loss)88%
Capital cost (per kW)1200USD
Replacement cost (per kW)1200USD
O & M cost (per kW)4USD/yr
Lifetime20years
BatterykVAh or kWh capacity6kWh
Minimum state of charge (SOCmin)30%
Maximum state of charge (SOCmax)100%
Round trip efficiency (gbatt)92%
Capital cost (per unit battery)167USD
Replacement cost (per unit)67%
M & O cost (per unit)1.67USD/yr
Lifetime5years
Nominal battery capacity41Ah
Battery capacity75Ah
Rectifier (grec) and inverter (ginv)Efficiency 97%
Installation and capital cost (per kW)127USD/yr
O & M cost (per kW)1USD/yr
Lifetime20years
General RequirementInterest rate6%
Project life (N)20years
EVs Capacity in kWh20kWh
Utility prices:
Power export price to utility (selling)0.015USD/kWh
Power import price from utility (purchasing)0.013USD/kWh
Optimization of lower and upper boundsSolar12001
Wind100015
Battery10001
Table 2. The rule-based EMS scenarios for the proposed system.
Rule No.ModesIFTHEN
1RESs P p v t + P W T t > P l ( t ) P p v t + P W T t   t o   P l t   a n d   E V ( t )
2BT P b t > P l t P W T t P P V ( t ) η i n v P b t > P l t P W T t P P V t η i n v   t o   P l t   a n d   E V ( t )
3Charge (G2V) E g r i d < E V d e m a n d E g r i d < E V d e m a n d   t o   E V   ( G 2 V )
4Discharge (V2G) E g r i d > E V d e m a n d E g r i d > E V d e m a n d   t o   E V   ( G 2 V )
Table 3. Details of benchmark functions.
Benchmark FunctionDimRangeOptimal Value
f 1 x = i = 1 d x i 2 10[−100, 100]0
f 2 x = i = 1 d x i + i = 1 d x i 10[−100, 100]0
f 3 x = m a x i x i , 1 i t 10[−10, 10]0
f 4 x = i = 1 d x i 2 10 cos 2 π x i + 10 d 10[−5.12, 5.12]0
Table 4. Results of IAOA compared to several peers on benchmark functions.
FunctionAlgorithmBest ValueWorst ValueAverage ValueSTD
f 1 x ALO1.6291   ×   10 9 8.8636   ×   10 9 4.0018   ×   10 9 1.9334   ×   10 9
PSO8.2671   ×   10 121 2.5752   ×   10 48 1.2876   ×   10 49 5.7582   ×   10 49
AOA0000
IAOA0000
f 2 x ALO1.1730   ×   10 5 0.48500.02540.1082
PSO 1.2952   ×   10 14 9.0712   ×   10 6 1.0976   ×   10 6 2.5864   ×   10 6
AOA0000
IAOA0000
f 3 x ALO1.1878   ×   10 6 0.00251.8484   ×   10 4 5.4351   ×   10 4
PSO1.4774   ×   10 25 4.0204   ×   10 13 2.0227   ×   10 14 8.9870   ×   10 14
AOA0000
IAOA0000
f 4 x ALO5.1427   ×   10 5 0.00274.3189   ×   10 4 5.8547   ×   10 4
PSO 2.0618   ×   10 19 2.5902   ×   10 13 2.3924   ×   10 14 6.2083   ×   10 14
AOA01.1591 × 10−1865.7954 × 10−1880
IAOA01.7994 × 10−2508.9970 × 10−2520
Table 5. Optimal weight sets and configurations of the proposed system using MOIAOA based on Non-Scale multiple-run Pareto Front concept.
W1W2W3WTPVBatfLCOEGCF E S O L D Elapsed Time (Seconds)
0.10.80.11311380.07622.37 × 10−20.01710.85964956.680489
0.10.70.21321080.11492.37 × 10−20.01710.85965536.762598
0.10.60.34181000.13442.33 × 10−20.02740.83374827.420494
0.10.50.4118930.1450.0220.837703438.61148
0.10.40.5114730.13430.02610.837602909.015921
0.10.30.6113630.11440.03040.837502731.221521
0.10.20.7111490.09420.05310.837102678.625856
0.10.10.81121060.06110.0220.837705521.751529
0.20.70.1627700.09430.0220.837702740.512867
0.20.60.24221470.13060.02370.01710.85964810.072815
0.20.50.3120910.15220.02370.01710.85963293.332732
0.20.40.4215630.14870.02530.00120.84753465.500523
0.20.30.5115830.13590.05310.837102780.494461
0.20.20.6114630.10950.0220.837702766.968238
0.20.10.7112560.07790.02610.837603786.031941
0.30.60.1531590.11540.02160.11360.75793414.903356
0.30.50.2324680.14190.02330.02740.83372633.810036
0.30.40.31191030.16460.02370.01710.85965378.376291
0.30.30.4115560.14810.02460.00350.85542637.907928
0.30.20.5112630.130.03040.837502654.862484
0.30.10.6112560.09750.02610.837605068.761916
0.40.50.1531590.1320.02430.00690.84753235.824878
0.40.40.2412560.15730.02390.07380.70264983.926465
0.40.30.3116630.1610.02530.00120.84752682.447224
0.40.20.428330.15222.66 × 10−27.34 × 10−50.84093272.623188
0.40.10.53120.11560.02610.837602731.882521
0.50.40.1324680.14250.02620.01190.78382762.613745
0.50.30.2119680.16490.02390.07380.70265103.018621
0.50.20.3115520.15950.02460.00350.85545587.216803
0.50.10.43110.12840.02460.00350.85542951.953591
0.60.30.1517420.15340.02620.01190.78382522.240268
0.60.20.257250.16680.02667.34 × 10−50.84092629.085911
0.60.10.33120.14182.46 × 10−23.50 × 10−30.85542904.915789
0.70.20.186170.15420.02620.01190.78382771.440828
0.70.10.243110.15180.02667.34 × 10−50.84095176.083577
0.80.10.151040.13870.02463.50 × 10−30.85545424.871393
Disclaimer/Publisher’s Note: The statements, opinions and data contained in all publications are solely those of the individual author(s) and contributor(s) and not of MDPI and/or the editor(s). MDPI and/or the editor(s) disclaim responsibility for any injury to people or property resulting from any ideas, methods, instructions or products referred to in the content.

