Article

The Economic Potential of Agrivoltaic Systems in Apple Cultivation—A Hungarian Case Study

1
Institute of Applied Economics, Faculty of Economics and Business, University of Debrecen, H-4032 Debrecen, Hungary
2
Institute of Statistics and Methodology, Faculty of Economics and Business, University of Debrecen, H-4032 Debrecen, Hungary
3
HUN-REN-DE High-Tech Technologies for Sustainable Management Research Group, University of Debrecen, Boszormenyi Street 138, H-4032 Debrecen, Hungary
4
Institute of Economics, Faculty of Economics and Business, University of Debrecen, H-4032 Debrecen, Hungary
5
Institute of Horticulture, Faculty of Agricultural and Food Sciences and Environmental Management, University of Debrecen, H-4032 Debrecen, Hungary
*
Authors to whom correspondence should be addressed.
Sustainability 2024, 16(6), 2325; https://doi.org/10.3390/su16062325
Submission received: 29 January 2024 / Revised: 2 March 2024 / Accepted: 3 March 2024 / Published: 12 March 2024
(This article belongs to the Section Energy Sustainability)

Abstract

:
Agrivoltaic systems (AVS) allow the simultaneous use of land—as a limited resource—for crop production and electricity generation. This paper introduces the development prospects of AVS in Hungary with insights into international trends. The most important part is a complex economic analysis and a unit cost analysis of a 38 MWp capacity AVS, considering the most typical basic data in electricity and apple production. The applied risk analysis is based on a Monte Carlo simulation, the distribution function, and probabilities. To introduce the economic facet of the competitiveness of AVS, a comparative analysis was carried out between AVS, ground-mounted photovoltaic (GM-PV) systems, and conventional apple production systems (ConAPS). In the most probable scenario, the AVS was financially attractive (NPV = 70 million EUR under 30 years). Our correlation analysis shows that feed-in tariff (FIT) price and the role of financing are considered the dominant economic factors. A favorable FIT price enhances the profitability of AVS; however, it makes GM-PV systems more profitable compared to AVS, so it negatively affects the competitiveness of AVS systems. AVS operations result in a more balanced unit cost of apples and of electricity compared to the independent operation of GM-PV systems and of ConAPS; in addition, it allows for land saving and more intensive land use.

1. Introduction

Photovoltaic (PV) energy is one of the most promising renewable energy sources worldwide, and 2022 was a historic year for newly installed PV capacities globally; it was a 35% growth compared to 2021, which corresponds to 239 GW of new PV capacity. The global trend is expected to increase and reach 8500 GWp capacities by 2050 [1]. Hungary faces challenges in upgrading its electricity networks to accommodate decentralized generation and variable capacity. To meet these challenges, significant investment in grid infrastructure, balancing mechanisms, and energy storage is crucial. Despite government plans to boost energy storage to 1000 MW by 2026 and add 100 MW of demand-side response by 2030, existing energy storage regulations lack the capacity to encourage substantial market-based commercial investments [2]. Tumiwa et al. [3] investigated the effect of integrating Industry 4.0 on fostering smart agriculture and the involvement of micro, small, and medium enterprises (MSMEs) in rural farming. This integration leads to a novel smart village concept, where rural MSMEs leverage technology to improve public services and economic activities. By strategically deploying agrivoltaic solutions, Hungary could alleviate pressure on grid infrastructure while promoting renewable energy generation in a manner that harmonizes with agricultural needs. However, the successful implementation of agrivoltaic systems demands the careful consideration of various factors, including land availability, technological advancements, policy frameworks, and stakeholder collaboration. Moreover, robust research and pilot projects are imperative to assess the feasibility, scalability, and long-term viability of agrivoltaic systems within the Hungarian context.
A more complete understanding of sustainability goes beyond simple economic considerations and must cover additional fundamentals beyond the economic aspect [4]. The distribution of land resources for food and feed production is generally shaped by global dietary preferences and improvements in agricultural yield. A pivotal element in fostering food security lies in implementing measures to reduce the extent of crop losses experienced by farmers [5,6]. The global significance of assessing agrivoltaic systems lies in their potential to address multiple interconnected challenges, including energy and food security, climate change mitigation, rural development, and social equity. Varied opportunities and regulatory landscapes exist across countries worldwide. Consequently, evaluating distinct projects in diverse regions and countries is essential to broaden international knowledge, thereby promoting the implementation of such systems in alignment with overarching sustainability objectives on a global scale. Moreover, it is important to recognize the diverse socio-economic contexts that influence the adoption of agrivoltaic systems in different regions.
Strengths identified by Maity et al. [7] include the potential for renewable energy generation, enhanced crop yield, and economic benefits for farmers. However, weaknesses and threats are also revealed, such as high initial investment costs, land use conflicts, and potential environmental impacts [7]. Agrivoltaics can, on one hand, enhance land use efficiency, while protecting apple orchards from climate change [8,9,10]. There have been both synergies and critical points observed in the recent studies, and the recent pilot projects aim to integrate the agricultural production process in an optimized way into the production of energy so that the focal point would be not yield maximization but an optimal and sustainable balance between the outputs [11]. Among others, land protection against desertification, reduced water consumption and more balanced water use efficiency, improved microclimate for crop growth, heat stress tolerance, and protection against excessively high solar radiation are listed in the literature as the main benefits [12,13,14]. In addition to these, farmers’ incomes can be based on diverse sources, the rural land electricity supply can be generated locally, and land productivity can be increased by up to 70% [8,14,15,16]. Still, the most common contrary arguments are the high investment costs, lack of information on long-term effects, and possible decrease in plant and yield development.
The choice of apple farming in Hungary stems from the country’s significant apple production industry and growing interest in sustainable agricultural practices. Another reason why apples look very promising in agrivoltaics is the large revenues and gross margin per hectare, which makes covering the significant fixed costs (depreciation costs) more possible compared to arable crops, or grazing, which can also be considered as related branches in AVS. According to our hypothesis, the future competitiveness of the production of apples for consumption relies primarily on apple orchards employing intensive and super-intensive cultivation systems, since APV needs very substantial extra investment cost compared to other elements of improving apple production; therefore, APV should be preferred by farmers with extensive apple technology.
Nevertheless, economic challenges hinder the complete harnessing of AVS in apple cultivation. The changing economic landscape of integrating these systems into apple farming, driven by technological advancements and the pursuit of efficient land use and renewable energy, forms the backdrop for this study.
Therefore, this study aims to contribute scholarly insights by examining market dynamics and presenting a comprehensive analysis based on a Hungarian case study. It also analyses the economic facet of the competitiveness of solar energy generation with apple cultivation, emphasizing optimal space utilization and sustainable land use practices. This study focuses on conducting a comparative economic analysis based on a Hungarian case study, forecasting the potential outcomes of an agrivoltaic project set in Hungary and comparing them to the economic results of GM-PV and apple production. The main research questions are as follows: (1) Is it worth it for an investor to finance an AVS system compared to other investment options? (2) How do the unit cost and competitiveness of the final products produced by an AVS system evolve, and which economic factors have the greatest impact on these economic indicators?

2. Literature Review

Agrivoltaic systems (AVS) are the integration of solar power production and agriculture, and they have been gaining traction in numerous countries, not limited to arid regions but also including Germany, the Netherlands, France, China, and Japan [13].

2.1. Exploring Global Agrivoltaics: Case Studies and Research Perspectives

Government-supported programs worldwide have significantly contributed to the growth of agrivoltaics. Since Japan introduced the first scheme in 2012, countries like China, South Korea, France, the United States, and Germany have followed. More nations are expected to support agrivoltaics in the future [17]. This section of the manuscript provides a detailed analysis of global agrovoltaics. It seeks to explore new trends and practices aimed at advancing this field. Furthermore, a detailed description of the current situation and various case studies from different countries and regions can be seen in Appendix A.
The development of agrovoltaics in Japan began after the introduction of the feed-in tariff (FIT) in 2012. The FIT has proven to be significantly effective in terms of policy impact, increasing Japan’s renewable energy supply by 76% from 2012 to 2019. The degree of shading cast by agrivoltaic systems ranges from 10 to 55%, and its median ranges from 30 to 40% [18].
The degree of coupling between China’s PV industry and agriculture was examined in the period from 2007 to 2016 using data from sources such as the China Agricultural Yearbook, China Statistical Yearbook, and various industry reports. The integration of agriculture and photovoltaic (PV) industries in China was explored by assessing the comprehensive development levels from 2007 to 2016. A study measured development levels, analyzed resource impacts, and used traditional and optimized weighting methods to study coupling coordination. The authors assessed the degree of coordination and analyzed the development mode of the PV–agriculture system [19].
Campana et al. [20] validated the efficacy of a developed model by comparing it with the industry standard PVsyst® software, achieving an R2 greater than 90%. The sensitivity analysis reveals a strong correlation between mutual row distance (5–20 m) and crop yield, demonstrating a doubling of yield within this range. The maximum oats and potato yield without shading effects were 5.0 t/ha and 6.9 t/ha, respectively.
A 50 MWp agrivoltaic project in Maharashtra conducted by Fraunhofer ISE in 2018/2019 appears economically feasible, with an expected levelized cost of electricity (LCOE) of INR 2.02 (EUR 0.0243), inclusive of water-related costs. The social impact depends on the institutional arrangement, ranging from high benefits to potential severe poverty among affected farmers. Such land losses were estimated to be 6% for cotton, 4% for tomato, 9% for soybean, and 3% for banana. The agricultural yield assessments suggest a yield increase of 33% for cotton and 11% for tomatoes. Yield reductions can be expected for soybean (17%) and banana (20%). The analysis combines economic and institutional perspectives [21].
An agrivoltaic system was constructed in Bierbeek, Belgium, featuring 7-year-old pear trees with specific planting and inter-row distances. Equipped with a MODBUS RTU-based data acquisition system since July 2021, the system utilizes weather input data from PVGIS for irradiance calculations. In the economic assessment for 2021, a projected pear yield reduction of 10 t/ha would result in a 6000 EUR/ha loss. With an annual energy generation of 600 MWh/ha, the calculated LCOE of 200 EUR/MWh, based on a CAPEX cost of 2.05 EUR/Wp, is higher than the off-take price, indicating the financial nonviability of the project [22].

2.2. The European and Hungarian Electricity Market

Prices in the European electricity market began to rise slightly in 2020 then skyrocketed (up to tenfold) due to the Ukrainian–Russian war. Although there will be a significant decrease in 2023, prices are still higher than in 2020 in most European countries. The only exception to this tendency is Sweden, where fluctuations have been much smaller, and the rate of price decreases is larger [23], probably supported by the large share of energy from biomass in continuous production [24,25]. In the first half of 2023, the average price of electricity in the EU was 289 EUR/MWh (ranging between 114–475 EUR/MWh), while in Hungary it was 116 EUR/MWh [26].
At the same time, renewable electricity generation is becoming increasingly important for the EU from an environmental and energy policy perspective. The revised Renewable Energy Directive sets a binding target of 32% at the EU level but does not set binding national targets. In principle, this could be made operational on a market basis through the Tradable Green Certificates (TGCs) scheme. Research conducted before the implementation of the aforementioned directive [27,28] predicted that this system could reduce the overall cost of switching to renewables in the EU by up to 70% and make a major contribution to reducing CO2 emissions [29]. However, as there is currently not a sufficient incentive to reach the EU target due to different externalities between countries, Karakosta-Petropoulou (2022) [30] suggests that a re-introduction of mandatory national targets should be considered. Yi et al. [31] proposed a technical conversion coefficient system for each renewable energy source in China; for example, the technical conversion coefficients for hydropower, wind, and PV could be 1, 1.2, and 1.5, respectively.
LCOE (levelized cost of electricity) has long been used as an indicator for calculating the total cost of electricity generated, but it excludes the additional costs related to storing and integrating periodic generation into the system. By taking these into account, the system LCOE indicator proposed by Ueckerdt et al. [32] allows for a more accurate assessment of variable renewable energy sources compared to continuously generating technologies. This would have a significant cost-increasing effect in countries with a high share of wind and solar energy.
According to Bhattacharya et al. [33], energy price regulation could also be achieved through a renewable energy portfolio (REP) system, which would consider the higher value of renewable or continuously generated electricity compared to non-renewable or periodic electricity. Their calculations show that the introduction of the system would significantly increase the price of normal electricity but would have a case-specific effect on the amount of electricity produced, the welfare of consumers, and the profits of electricity producers in the case of green electricity. The direction and extent of this would depend on competition between suppliers, the historical costs of electricity generation, and consumer preferences.
Overall, we believe that there is considerable uncertainty regarding the future economics of solar electricity; technological development and smart systems could allow for cost reductions, and consumer preferences can result in higher prices, but the additional costs of storage could imply an increase in costs.

2.3. Key Facts of the European and Hungarian Apple Production

It is known that the main trend in the advancement of contemporary global horticulture is the establishment of intensive and super-intensive apple orchards, with the level of intensity escalating proportionally to the augmentation of tree density per unit area [34]. The characteristic features of apple orchards under an intensive cultivation system include: weakly growing rootstock, high planting density, a high number of trees per hectare (usually >1000 trees/ha, typically 2000–3000 trees/ha), support structures, and irrigation equipment (possibly including frost protection measures such as hail nets) [35]. Apple growing requires high capital investment and the choice of production system has a direct impact on apple orchard productivity [36]. An increase in planting density results in better economic results [37]. A study conducted in Romania [36] suggests that the super-intensive technological system stands out as the most efficient. This system demonstrates superior productivity and boasts the highest ratio of extra-class apples. Furthermore, the super-intensive approach in apple production yields better returns on investment. The study recommends that future investments in apple orchards should be grounded in the adoption of super-intensive technological systems.
The most common fruit orchard in Europe is the apple [36], with about 500 thousand hectares of apple orchard area [38]. In 2022, the EU-27 produced around 12 million tonnes of apples. The leading apple producer in EU-27 was Poland, with 4.5 million tonnes, followed by Italy (2.1 million tonnes) and France (1.5 million tonnes). Hungary had an annual production of 350 thousand tonnes of apples in 2022 [38].
Historically, Hungary was an important apple producer and exporter, but its share has declined [39]. Despite this, fruit production has an outstanding role in Hungarian agriculture [40]. Apples dominate the Hungarian fruit sector, as according to the Hungarian Central Statistical Office [41], about 31% (24 thousand ha) of the fruit production area was covered by apple trees in 2022. In an average year, Hungary’s apple production is about 530 thousand tonnes, fluctuating between 350 and 780 thousand tonnes over the past 10 years [42]. The distribution of Hungarian apple utilization indicates that two-thirds are industrial apples (of which 80–85% are intended for concentrate production), while one-third is designated for consumption, a rather unfavorable proportion compared to the EU average [43]. Nationally, the weak quality yield and variable production are attributed to the absence of frost protection on 90–95% of apple orchards and only approximately 25–30% being irrigated. Hail nets cover around 2000–2500 hectares, highlighting that a significant proportion of apple orchards are practicing outdated or extensively cultivated and, in many cases, neglected cultivation systems [44]. Of the 41 thousand hectares of apple orchards present in 2002, nearly 24 thousand hectares remain today, signifying a loss of 40% of orchard surface area [41]. The decline predominantly affected apple orchards employing outdated cultivation systems, possessing obsolete varietal structures, and lacking post-harvest and market infrastructure [45]. This trend may persist in the future. Within the domestic 24-thousand-hectare apple orchard surface, approximately 5 thousand hectares are devoted to intensive or semi-intensive cultivation systems for consumption purposes, contributing two-thirds of the total fresh consumption apple amount, while the rest are harvested by the selective harvesting of industrial or old extensive apples. Only about 20% of orchards are considered modern, high-quality, and competitive, providing a solid foundation for Hungary’s apple production. The use of agrivoltaic systems may be a good tool to safeguard flowers from frost damage, particularly in the Hungarian context [44].

2.4. Effect of AV System on Apple Production

Different models of panels not only result in the varying efficiency of electricity production but also change the amount of light and the rate at which plants can utilize light. This can be evaluated as positive, neutral, or even risky, depending on the crop [14,46,47,48]. Weselek et al. [16] found that in the case of species with high demand for light, an agrivoltaic system can lead to crop yield reduction as solar radiation is expected to be reduced by about one-third—the extent of a black hail net—underneath the panels. This extent is used as the standard for construction planning and is considered acceptable in most cases under German and other Western European conditions [14]. In the case of some further species, like strawberries or other berries with lower light demand, even higher shading would be acceptable, while for apples, reduced light availability would result in lower bud and flower numbers and reduced function, lower amount of fruits, about one week later harvest, and complications in fruit coloring [11,14,15,16,49]. In a previous study, the crop yields in agrivoltaic systems were 3.98% to 91.30% lower than the control due to shading. Shading affects the amount of direct solar irradiation received by crops, consequently influencing yield outcomes, particularly in terms of crop weight [50]. In the cheapest APV technology related to grass, Elkadeem et al. [51] showed that despite the fact that photosynthetically active radiation under PV panels was 25% lower in Sweden conditions, it resulted in no reduction in grass yield and 30 times higher NPV compared to typical crop rotation in Sweden. Marrou et al. [46,47] and Miller et al. [49] stated that constant or even partial shading during the day results in reduced trunk and branch diameter, a decrease in the length of the shoots by 7–14%, and a loss in the yield, which is affected by several other factors as well.
Soil and plant temperature can be reduced through partial shading by the panels during the day [12,48,52]. This can be especially beneficial in production areas with high summer temperatures in the middle of the day, which might cause a decrease in photosynthetic activity through heat stress. Agrivoltaic systems are based on the concept that crops can tolerate partial shading, and they might reduce water consumption by evapotranspiration during the summer and under drought conditions [53,54]. Apple varieties that are sensitively reacting toward excessively high solar radiation can be protected against sunburn by shading during the most intensive midday hours [55].
A well-constructed agrivoltaic system can—to some extent—serve as a protective factor against environmental risk factors, like heavy rainfall, hail, or wind. The panels cannot totally replace the hail protection nets, and without additional netting, hail damage of 60% or even higher has been observed. Still, the structure itself is suited for the application of additional hail nets, through which the costs of protection and production risks can be reduced. Furthermore, the risk of foils and plastic waste reaching and polluting the soil can be reduced to a significant extent [10,15,16,52,55]. The shelter may be beneficial as it results in a delayed flowering period, which is a passive way to protect the orchard against frosts. The above-ground coverage can be protective against radiation frosts in the springtime. Still, its efficiency definitely needs further research [14,55].
The wetter microclimate and reduced evapotranspiration produced by AVS may save up to 3–30% of irrigation water [10,14,15,16]. Trommsdorff et al. [52] stated that air circulation gradients may change under the panels, causing lower evaporation and transpiration, as well as wind speed. Still, the tunnel effect—similar to hail nets—shall also be considered. However, there is not yet sufficient information regarding microclimatic heterogeneities and their impact on apple yields.
Changed air circulation through coverage by photovoltaic panels changes apple trees’ susceptibility toward fungal diseases and pests, like woolly apple aphids [56]. Results show that additional tests are required, but so far, apple trees might show higher or even lower susceptibility towards scab and post-harvest diseases, and mildew may occur due to the wetter microclimate. By reducing the leaf wetness duration, a reduction in the required use of fungicides, mainly copper, can be expected [55]. Based on the analysis by Trommsdorff et al. [52] and Trommsdorff [14], even 50% of the amount of applied fungicides, and up to 10% of the labor costs related to pesticide application, can be saved.
Hilbers [56] calculates increased labor to some undefined extent for the maintenance and clearing of the panels from any possible dust and pollution, which might reduce the efficiency of electricity production. However, this shall not exceed the saved cost of opening and closing the hail nets.
The utility of hail-protecting nets, incurring an additional investment of 6537–10,459 EUR/ha for occasional hail damages [35], is superseded by agrivoltaic system benefits. Comparing the costs of farming and energy systems, setting up solar panels (PV components) is almost ten times more expensive than growing apples. However, regarding day-to-day expenses, running the farm is 75% more costly than maintaining the solar panels. Moreover, when factoring in the costs of the PV system in the calculation of the levelized cost of apples (LCOA), resulting in a value of 3.38 EUR/kg, the production cost of apples is projected to be almost three times higher than that in scenario HN [14].

2.5. Economic Background

The economic assessment of AVS schemes is strongly influenced by the ratio of agricultural and electricity market prices and their changes. In the EU and in Hungary, generation by periodically available renewable energy sources (PV and wind energy) is growing rapidly and already accounts for a significant share of the total. Due to the uncertainty of the time of production of these energy sources and the limited storage capacity, electricity prices are more and more volatile on the spot market (0–500 EUR/MWh). The prognosticated occurrence of extreme electricity prices is expected to increase sharply from 2026 [57], making the revenues from solar electricity generation unpredictable and requiring long-term regulation or storage.
According to Trommsdorff et al. [14], a 20% increase in FIT prices led to a 17% rise in PV revenues; aligning tariffs with electricity market prices resulted in a 53% reduction; and keeping FIT prices constant resulted in a 20% rise in electricity market prices increased PV sector revenues by 3%. Comparatively, PV revenues were over three times higher than farming, and the net present value of investments increased significantly.
References [10,14] highlight the range of costs associated with hail protection systems, providing valuable insights into the financial considerations for apple orchard management. Trommsdorff et al. [14] emphasize the influence of factors like the type and size of the hail net, contributing to the observed variations in costs. This aligns with the understanding that the choice of a hail protection system is a nuanced decision, impacted by multiple variables.
Investment costs for agrivoltaic production may vary depending on the capacity, size, technology, and type of the applied modules, as well as the crop. In the case of permanent crops like fruit trees, which are designed for more than one decade of production, there is a need for special technology for higher-mounted design [54]. Thus, the structure costs of AVS are about the same as for the well-known hail protection systems, but they can replace hail protection systems and reduce costs by about 60%. In the case of high-mounted apple orchards, the construction (243–500 EUR per kWp) and soil preparation (190–266 EUR), just like the maintenance, may increase the costs by up to 10%, which may vary to a higher extent depending on the height and distance between posts. In the past couple of years, there has been a high risk of change in steel prices. Module price depends on the light transmission ability and the design. Trommsdorff et al. [52] calculated a price between 240 and 440 EUR for semi-transparent and 326 Euro per kWp for double glass modules. The extra cost can be compensated for by the higher electricity production per installed capacity. The costs of the planting material and the irrigation system can be calculated as unchanged. There is also a lack of building, nature, and landscape conservation legislation, which may result in increased costs for any possible authorization processes depending on the given country [13,14,52,56].
Considering operational costs, Trommsdorff et al. [52] and Trommsdorff [14] calculated a production cost of 8.15 EUR cents per kWh for high-mounted systems, which is 2.12 EUR cents higher than in the case of ground-mounted design.
The results of Trommsdorff et al. [14] show that the average investment cost of the modelled AV system could be reduced by 26%, which can be attributed to the partial replacement of hail protection equipment. Annual operating costs are reduced by up to 9% through lower costs for land and maintenance work. On the other hand, revenues per year in the model also decrease by about 9% due to the high-quality apple yield reduction. Overall, the cost of apple production under AVS decreases by about 5%, while the electricity cost is only less than 1%.
The results of the aforementioned research also underscore the necessity for additional studies to assess the competitiveness of AVS in comparison to the GM-PV system and ConAPS. Simultaneously, it is crucial to emphasize that competitiveness is a complex concept, and its measurement and interpretation depend on the specific questions for which we seek answers [58]. This study concentrates on the economic aspect of competitiveness, solely comparing the farm-level economics of AVS, GM-PV systems, and ConAPS.

3. Materials and Methods

This study utilizes data regarding a GM-PV system and a hypothetical apple plantation. The calculations are based on an agrivoltaic project set in Mezőcsát (Borsod-Abaúj-Zemplén county, Hungary) and literature data as well as expert interviews.

3.1. Project Description and Objectives

Table 1 provides a detailed snapshot of the APV shed dimensions, apple tree design parameters, and the specifications of the integrated PV system, including reference and estimated values to improve the reliability of the data, providing a more reliable basis for forecasting, and the assumptions of the agrivoltaic project in Mezőcsát, Hungary. Envisioned to cover 42 hectares, the overall capacity of the virtual AVS is 38,269 kWp (calculating with a 911.16 kWp/ha specific peak capacity). The AVS shed is designed to integrate solar PV panels within apple orchards, with a notable capacity of 251.12 kWp. It includes details about shed specifications, investment estimates, apple tree design, and the expected distribution of solar power capacity within the allocated area.
Figure 1 illustrates a basic layout of a single solar PV shed to be erected on an agrivoltaic farm. The solar PV shed stands at a height of 5 m and utilizes classic PV modules. The lengths of the sheds are precisely 3.19 m, supported by heightened structures arranged in two parallel swaths, each consisting of 11 supporting structures. The data are derived from studies by [60], with a focus on the influence of tree spacing on solar energy capture and overall system performance.
In Figure 2, the visual representation captures the extensive deployment of solar PV sheds on an apple farm, emphasizing the scalability and adaptability of agrivoltaic solutions. The multitude of sheds demonstrates the potential for large-scale energy production while maintaining the productivity of the agricultural land.
Table 2 presents basic data for the proposed PV system, which refers to the year 2023. The key components of the economic snapshot include an initial investment (CAPEX) of EUR 23,386,364. This includes costs associated with solar panels, inverters, installation, and other infrastructure necessary for the functioning of the system. The FIT price is EUR 0.087/kWh, indicating the revenue per unit of electricity generated. The feed-in tariff is EUR 0.087/kWh, indicating the revenue per unit of electricity generated, influencing energy output estimates. The system demonstrates a 99% efficiency improvement compared to the previous year. Furthermore, annual costs per kilowatt are delineated, encompassing EUR 2.1 for maintenance, EUR 1.8 for insurance and video-surveillance, and EUR 0.8 for internet fees. These figures represent the expected costs associated with keeping the PV system in optimal working condition, ensuring security, and maintaining internet connectivity for monitoring and remote management.
Table 3 summarizes key basic data about apple production in Hungary for the year 2023. The model assumes a super-intensive orchard characterized by high yields, good product quality, and significant inputs [40]. The investment cost for a super-intensive orchard in Hungary is approximately 42 million EUR, inclusive of 2800 trees (Knipp tree) per hectare, a support system with concrete columns and wires suitable for holding hail netting, hail netting itself, and drip irrigation. Following the planting and initial growth year of the orchard, two additional growth years are considered. By the fourth year, the orchard is expected to reach maturity, with an average yield of 57.5 t/ha assumed for the period from the fourth to the fifteenth year, based on expert opinions and several years of Hungarian professional data.
Given that yield is a crucial variable in the economic performance of apple production, the application of different risk mitigation strategies is essential in practice [43]. The hail net and drip irrigation system within the super-intensive apple orchard play a vital role in reducing weather-related risks. Frost protection is an additional tool to mitigate weather risks, but it is not considered in the presented model, which might lead to an increase in the CAPEX. In a super-intensive orchard, as assumed in our model, the cultivation technology and plant protection are of a high standard, contributing to yield safety.
We decided to focus on the year 2024 for our in-depth analysis. However, we kept in mind that the apple trees are anticipated to start yielding fruit after just two years of growth. Our calculations cover this time frame, considering the period between planting the apple trees and when they start producing commercially. This intentional decision allows us to closely examine how well the solar power system performs in its first operational year, aligning with the timeline of the apple plantation. This approach provides a thorough analysis of both the solar system and the apple plantation during their crucial initial stages.
It is important to note that, at this stage, the entire system is considered as an assumption, and its implementation has not yet been realized. The predictions and assumptions presented in this study serve as an anticipatory framework, offering insights into the potential dynamics of agrivoltaic projects, particularly those utilizing GM-PV systems.

3.2. Economic Indicators for Implementing Agrivoltaic Systems in Hungary

Economic analysis delves into investment evaluations, forecasting expected outcomes under baseline scenarios and exploring sensitivity across varying future assumptions. In addition to assessing the economic viability through NPV (net present value), IRR (internal rate of return), and DPP (discounted payback period) [63,64], this study incorporates an evaluation of unit cost, OPEX (operating expenses), and CAPEX (capital expenditures). These metrics are pivotal in gauging the financial feasibility and sustainability of agrivoltaic systems in apple cultivation. Diverse simulation methodologies are employed to scrutinize the interplay between inputs and outputs.
In the area of risk analysis, this study uses Monte Carlo simulation techniques to account for stochastic changes and deterministic system processes [65]. It was also used in the article by Elkadeem et al. [51] to identify the most important parameters for profitability. These simulations include probability distributions assigned to uncertain factors, generating a range of random values to explore potential outcomes across multiple studies. Using specialized modelling based on specific distributions, this study attempts to integrate the values of variables into various outcomes, offering a detailed understanding of the risks associated with them. The ranges we used are presented in Table 4, and the most likely values were taken to be the mean values of the indicators. In our study, the evaluation of results was conducted using @RISK 7.6, a simulation software distributed by Palisade Corporation. We configured the simulations with carefully chosen input data and utilized appropriate probability distributions to represent uncertainties. The simulations were run with 5000 iterations. Sensitivity tests were performed on the results of the output variables. The standardized regression coefficient and Spearman’s rank correlation coefficient were calculated. The standardized regression coefficient is a standardized measure of the effect of the magnitude of the input variables on the different outputs, which was used to rank the inputs in order of importance. For a positive sign, increasing input moves with increasing output, similar to the methodology of Bai et al. [66].
The time period of the project is assumed to be from 2023 to 2053. Following the year of investment (2023), a 30-year operation can be planned for a PV system. In terms of apple production, the useful duration of an apple orchard is 15 years. Therefore, the analysis timeframe encompasses two apple orchard cycles. The outputs of the analysis are the following: net present value (NPV), profitability index (PI), internal rate of return (IRR) and the unit cost of electricity and apple production. The NPV and IRR are two fundamental approaches within the discounted cash flow (DCF) techniques used in financial analysis.
The NPV is determined using the following formula:
NPV = C 0 + i = 1 t DCF i
where C0 represents the cost of the initial investment (CAPEX), DCFi is the discounted cash flow in the ith year, and t is the time period of the analysis.
The discounted cash flow is calculated as follows:
DCF i = CF i DF i
where CFi is the annual cash flow in the ith year, and DFi is the discount factor in the ith year.
The annual cash flow is determined by the following formula:
CFi = Revi − OPEXi − Taxi
where Revi represents the total annual revenue from the PV system and apple production in the ith year, OPEXi is the total annual OPEX of the PV system and apple production in the ith year, and Taxi is the annual corporate tax.
The annual revenue from apple production (Reva) is calculated as follows:
Rev a = ( Y c × P c + Y i × P i + S ) × A
where Yc is the annual yield of apples for consumption purposes (class I and II) per hectare, Pc is the price of apples for consumption purposes, Yi is the annual yield of industrial (juice) apples per hectare, Pi is the price of industrial (juice) apples, S is the annual subsidy per hectare, and A is the area of apple orchard.
The annual revenue from electricity (Reve) is determined by the following:
Rev e = Pc × Sh × Ep × FIT
where Pc is the plant capacity for electricity generation, Sh is the annual sunshine hours affecting electricity generation, Ep is the efficiency compared to the previous year, and FIT is the feed-in tariff, the price paid for electricity fed back into the grid.
When calculating the series of annual revenue and OPEX for the given timeframe, an average of 4% inflation rate is considered, ensuring that cash flows are in current value (nominal value). So, the nominal value of a cash item (revenue or OPEX) in a given year is calculated by the following formulas:
Rev i = Rev i 1 × 1 + IR
OPEX i = OPEX i 1 × 1 + IR
where Revi and OPEXi are the nominal value of the annual revenue and the nominal value of the OPEX in the ith year, Revi−1 and OPEXi−1 are the nominal value of the annual revenue and the nominal value of the OPEX in the previous year, and IR is the inflation rate of the given year.
The calculation of the base for annual corporate tax includes not only the total annual revenue and total annual OPEX but also the annual depreciation of the PV system and apple orchard. In Hungary, the corporate tax rate is 9%.
The discount factor is computed using the following formula:
DFi = (1 + r)i
where r denotes the discount rate, and i is the specific year within the analysis timeframe.
In evaluating the economic performance of agrivoltaic systems, determining an appropriate interest rate is crucial for conducting dynamic financial analyses. The chosen approach in this study is to employ the weighted average cost of capital (WACC), denoted as w in the analysis [70].
The WACC is calculated using the following formula [66]:
w = C × E + D × (1 − t) × S
where C is the cost of equity, E is the proportion of equity in the overall capital structure, D is the cost of debt or liabilities, t is the corporate tax rate, and S is the share of debt (total capitalization).
Given that the calculations exclude debt and borrowing, the discount rate (r) is derived solely from the cost of equity using the following formula:
r = R + β × E
where R is the risk-free rate, often based on government bond yields, β is the beta coefficient, and E is the equity risk premium.
Therefore, the expected nominal return on equity is calculated as follows:
r = 3 + 0.88 × 2.95 = 6.83%
Here, the risk-free rate of return (R) is set at 3% based on the Statista database [71]. The industry beta (β) for the “Green and Renewable Energy” sector is obtained from [72] as 0.88. The equity risk premium (E) is determined from [73], and the expected equity risk premium is set at 2.95%.
The NPV can be calculated for each year within the given timeframe as the cumulative discounted cash flow (CDCF). The year in which the CDFC changes from a negative value to a positive value signifies the project’s return. The NPV of the project is represented by the CDCF for the year 2053.
The profitability index (PI) is determined using the following formula:
PI = i = 1 t DCF i C 0
The internal rate of return (IRR) is the discount rate at which NPV equals zero. The IRR is obtained from the series of annual cash flows using the IRR function in the MS Excel program.
The analysis provides a comprehensive overview of electricity and apple production unit costs, excluding PV systems.
The unit cost of electricity (UCe) is calculated using the following formula:
UCe i = TC i × RevSe i Ye i
where TCi is the total cost of PV system and apple production in the ith year, RevSei is the share of electricity in total revenues (%) in the ith year, and Yei is the annual yield of electricity in the ith year. The annual total cost is the sum of OPEX and the annual depreciation of the PV system and apple orchard.
The unit cost of apples (UCa) is calculated using the following formula:
UCa i = TC i × RevSa i Ya i
where RevSai is the share of apple production in total revenues (%) in the ith year, and Yai is the annual yield of apples in the ith year.

4. Results and Discussion

4.1. Investment Analysis

Conventional agriculture is characterized by lower investment costs, no electricity production, susceptibility to weather conditions, and revenue primarily derived from crop sales. On the other hand, agrivoltaic systems offer the potential for additional revenue through electricity generation and can provide some degree of weather protection for crops through the shading effect of solar panels. While GM-PV systems primarily focus on maximizing electricity generation per area, agrivoltaic systems seek to combine agriculture and solar energy generation in the same area. The challenge is finding an optimal design that balances the goals of both aspects. AVS are around 80% more expensive per installed capacity than GM-PV. The PV modules, the substructure, and their installation and surface preparation are responsible for most of the investment costs. These cost shares are also those for which AVS have the largest proportional cost increases compared to the classic GM-PV systems. The reasons for this are that special modules are used, the substructure is more complex and higher, and the installation must be carried out in a way that protects the floor. Such a system’s project planning and development is currently more costly than with conventional GM-PV systems—certain savings result from the elimination of a required fence in the case of AVS. The choice between AVS and conventional PV in the apple horticulture sector in Hungary depends on stakeholders’ specific goals, constraints, and priorities, emphasizing the need for a tailored approach that considers both agricultural and energy generation objectives.
This comparative analysis scrutinizes the capital expenditure (CAPEX) and operational expenditure (OPEX) differentials between AV and GM-PV systems, each covering 42 ha of land area. The AV system demonstrates higher total CAPEX and OPEX compared to the GM-PV system [13]; the reason is the extra capital needed during both investment and operation in apple plantations. The CAPEX and OPEX ratios are similar to the values collected in ref. [13]. A comparison of revenue within the AVS, broken down into agriculture and PV, reveals a strong dominance of PV income [53]. While revenues from agriculture are in the thousands, revenues from PV are in the millions [74]. In some cases, only between 4% and 6% of revenue in the APV system is attributable to agriculture [75].
Table 5 details a comprehensive financial analysis of the proposed agrivoltaic project, and the selected years hold specific significance. In 2024, the project starts PV operations (electricity production) and plant operations. By 2026, the focus will shift to the commencement of apple commercialization, following three years of apple orchard growth. The year 2038 signifies the conclusion of the initial apple orchard, while 2039 marks the beginning of a new apple orchard, ensuring continuity in the agricultural cycle. The year 2046 has been arbitrarily selected for assessment within the project’s overall duration. Finally, 2053 serves as the project’s conclusive year, marking the financial evaluation’s endpoint.
The CAPEX of the AVS project for the total area of 42 hectares amounts to 25,146 thousand EUR, with a notable share of 93% attributed to the PV system. In the first year (2026) when the apple orchard is in a mature state and the PV system is operational, the shares of annual revenue are distributed as 90% for the PV system and 10% for apple production. This share of the PV system decreases to 85% by the end of the analyzed time period due to a 1% annual decrease in its efficiency. In terms of OPEX, apple production commands a higher share, ranging from 60% to 64%.
As a result, the positive NPV (net present value) of +70,157 thousand EUR and PI (profitability index) of 3.79 indicate that the project is considered financially attractive; these metrics are higher than the typical data of apples [39,40] and lower than data from GM-PV projects. The IRR (internal rate of return) of 25% further supports the feasibility and attractiveness of the agrivoltaic project in apple farming in Hungary. Comparing our findings with a German case study on an agrivoltaic project in apple farming [14], the NPV was significantly higher in Germany than in Hungary. The difference could be attributed to various factors, including the different agricultural practices in Germany, the higher FIT price, and the legal background, despite the climatic conditions. It is crucial to consider each technology’s unique characteristics and adaptability to the specific conditions of the respective regions. On one hand, this ratio shows how insensitive AVS are to agricultural revenue; therefore, the risk involved in AVS is that the incentive to continue farming within the system is low [76], but also, farmers can gain substantially from this revenue. Malu et al. [75], for example, show that revenue from PV can increase more than fifteen-fold for farmers growing grapes in India, but there is still a need for research into how strong this effect is. Furthermore, the interaction between external factors, such as market dynamics and environmental aspects, may also contribute to variations in economic performance. The positive NPV, high PI, and favorable IRR suggest that agrivoltaic projects in apple plantations are economically viable and have the potential for significant financial returns, especially when considering land savings and government subsidies. However, it can be stated that the growth of investment indicators is more moderate compared to AVS systems related to grass production, due to the differential economic characteristics of the plants in question.
The descriptive statistics of the output variables applied in the simulations are shown in Table 6.
The tpider diagram in Figure 3 intricately illustrates the nuanced influence of input variations on the net present value (NPV) within agrivoltaic systems integrated into apple orchards. Electricity prices exhibit significant growth in 40% of cases when measured by investment indicators; however, higher discount factors (more expensive financing) result in a continuous decrease in electricity prices. The influence of additional economic indicators on the phenomenon under study seems to be insignificant. Simulations use stochastic processes to calculate inputs and outputs, characteristics which are inherent to each simulation run. Unlike deterministic simulations, where inputs lead to linear changes in outputs, stochastic simulations introduce nonlinearity, showcasing trends influenced by the respective input distributions. This underscores the intricate and probabilistic nature of the relationship between input variations and NPV outcomes in agrivoltaic systems.
The tornado diagram, as illustrated in Figure 4, shows the magnitude of the impact of various factors on the net present value. The FIT price emerges as the most influential determinant, showing a strong positive correlation with NPV (correlation coefficient: 0.87). Accordingly, the discount rate (−0.26) and net investment costs (−0.11) show a weaker negative correlation. These observations highlight the importance of FIT price, financing, and state subsidization in explaining changes in the net present value of agrivoltaic systems.
As illustrated in the tornado diagram in Figure 5, changes in input and output prices per unit exhibit varying impacts on NPV, quantified as +0.91, −0.31, and +0.09, respectively. These coefficients signify the direction and magnitude of influence, highlighting the intricate relationship between price fluctuations and NPV in agrivoltaic systems.
The statistical results highlight the significant risk at the entrepreneurial level, as shown in Figure 6. A low probability suggests that the economic viability of the enterprise, as measured by NPV, is relatively stable under different simulated conditions. The 25% probability of a scenario resulting in zero or less NPV highlights the stability of the conditions being assessed, thereby providing valuable information for decisionmakers and stakeholders. It is understood that, within the framework of a Monte Carlo simulation, the estimated parameters demonstrate resistance to adverse changes that could jeopardize the economic viability of the business activity in question.
In summary, securing financing, particularly through channels like public or low-cost equity and state-subsidized credit facilities, is indispensable for the entrepreneurial implementation of agrivoltaic systems. Additionally, a reduction in the risk premium or industry beta has the potential to enhance predictability, thereby positively impacting the economic perception of agrivoltaic investments. This underscores the intricate connection between financial variables and the overall economic feasibility of agrivoltaic ventures, highlighting the potential for strategic financial modulation to mitigate challenges and optimize economic outcomes.

4.2. Unit Cost of Electricity and Apple Production

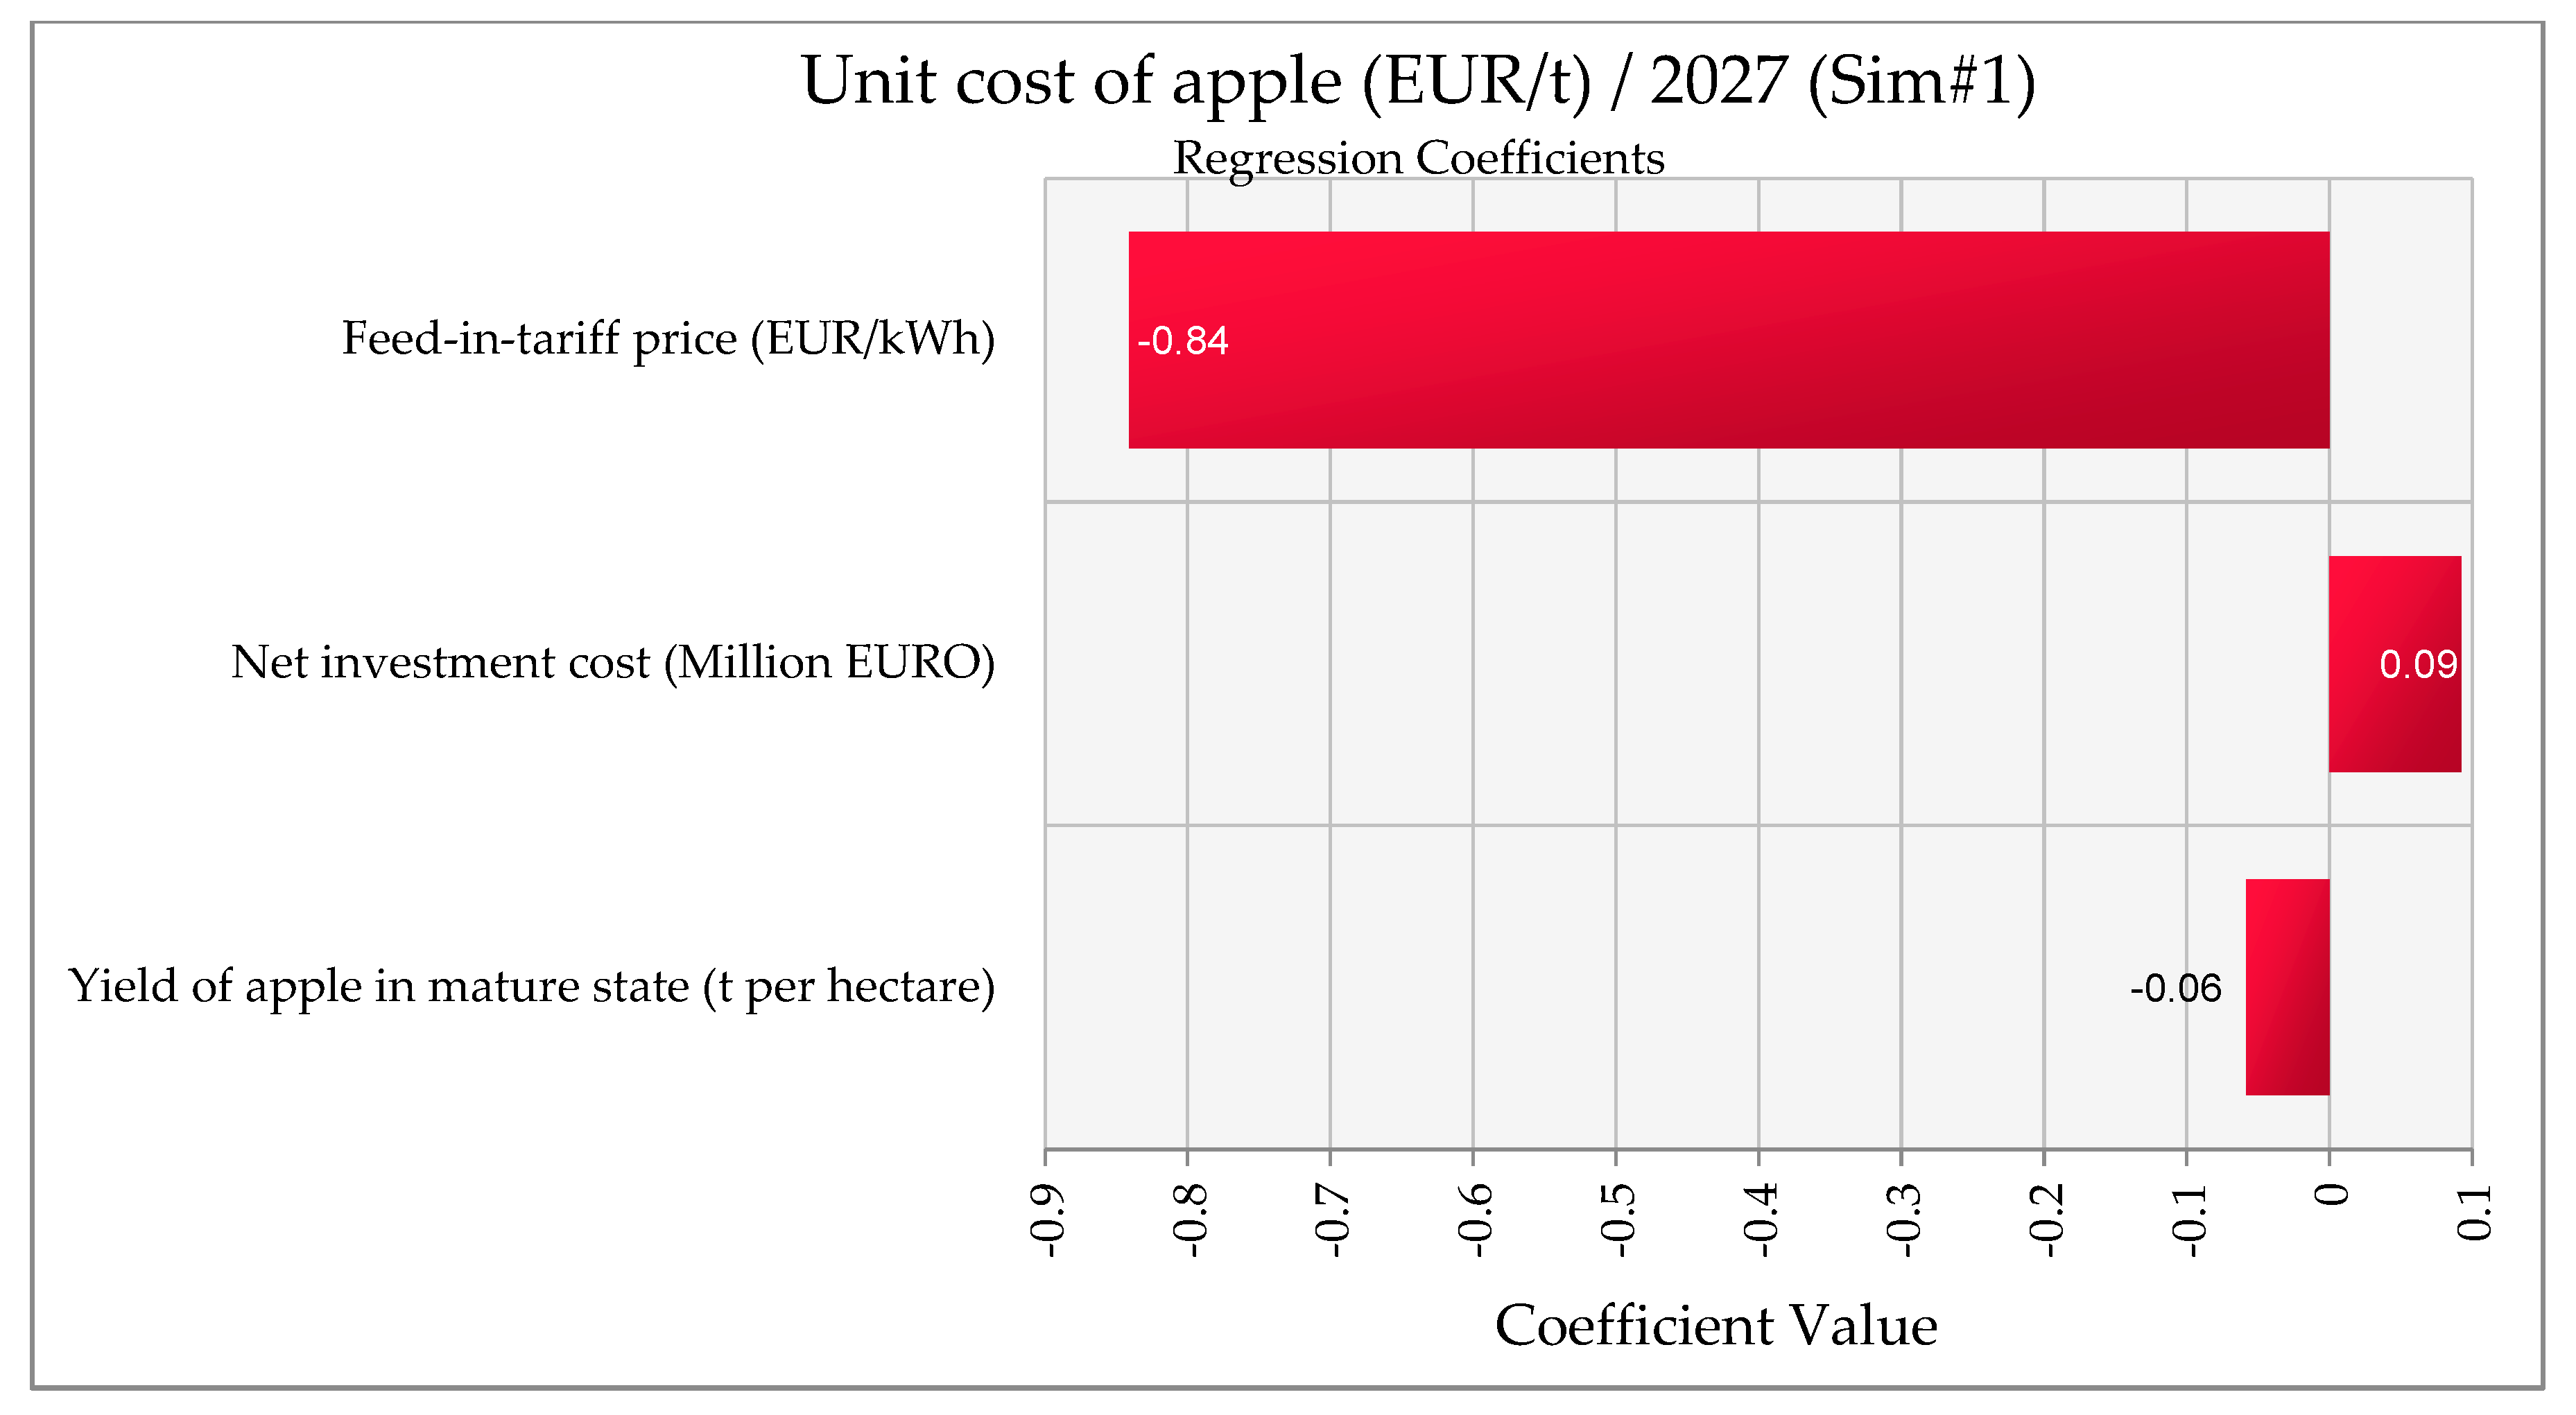
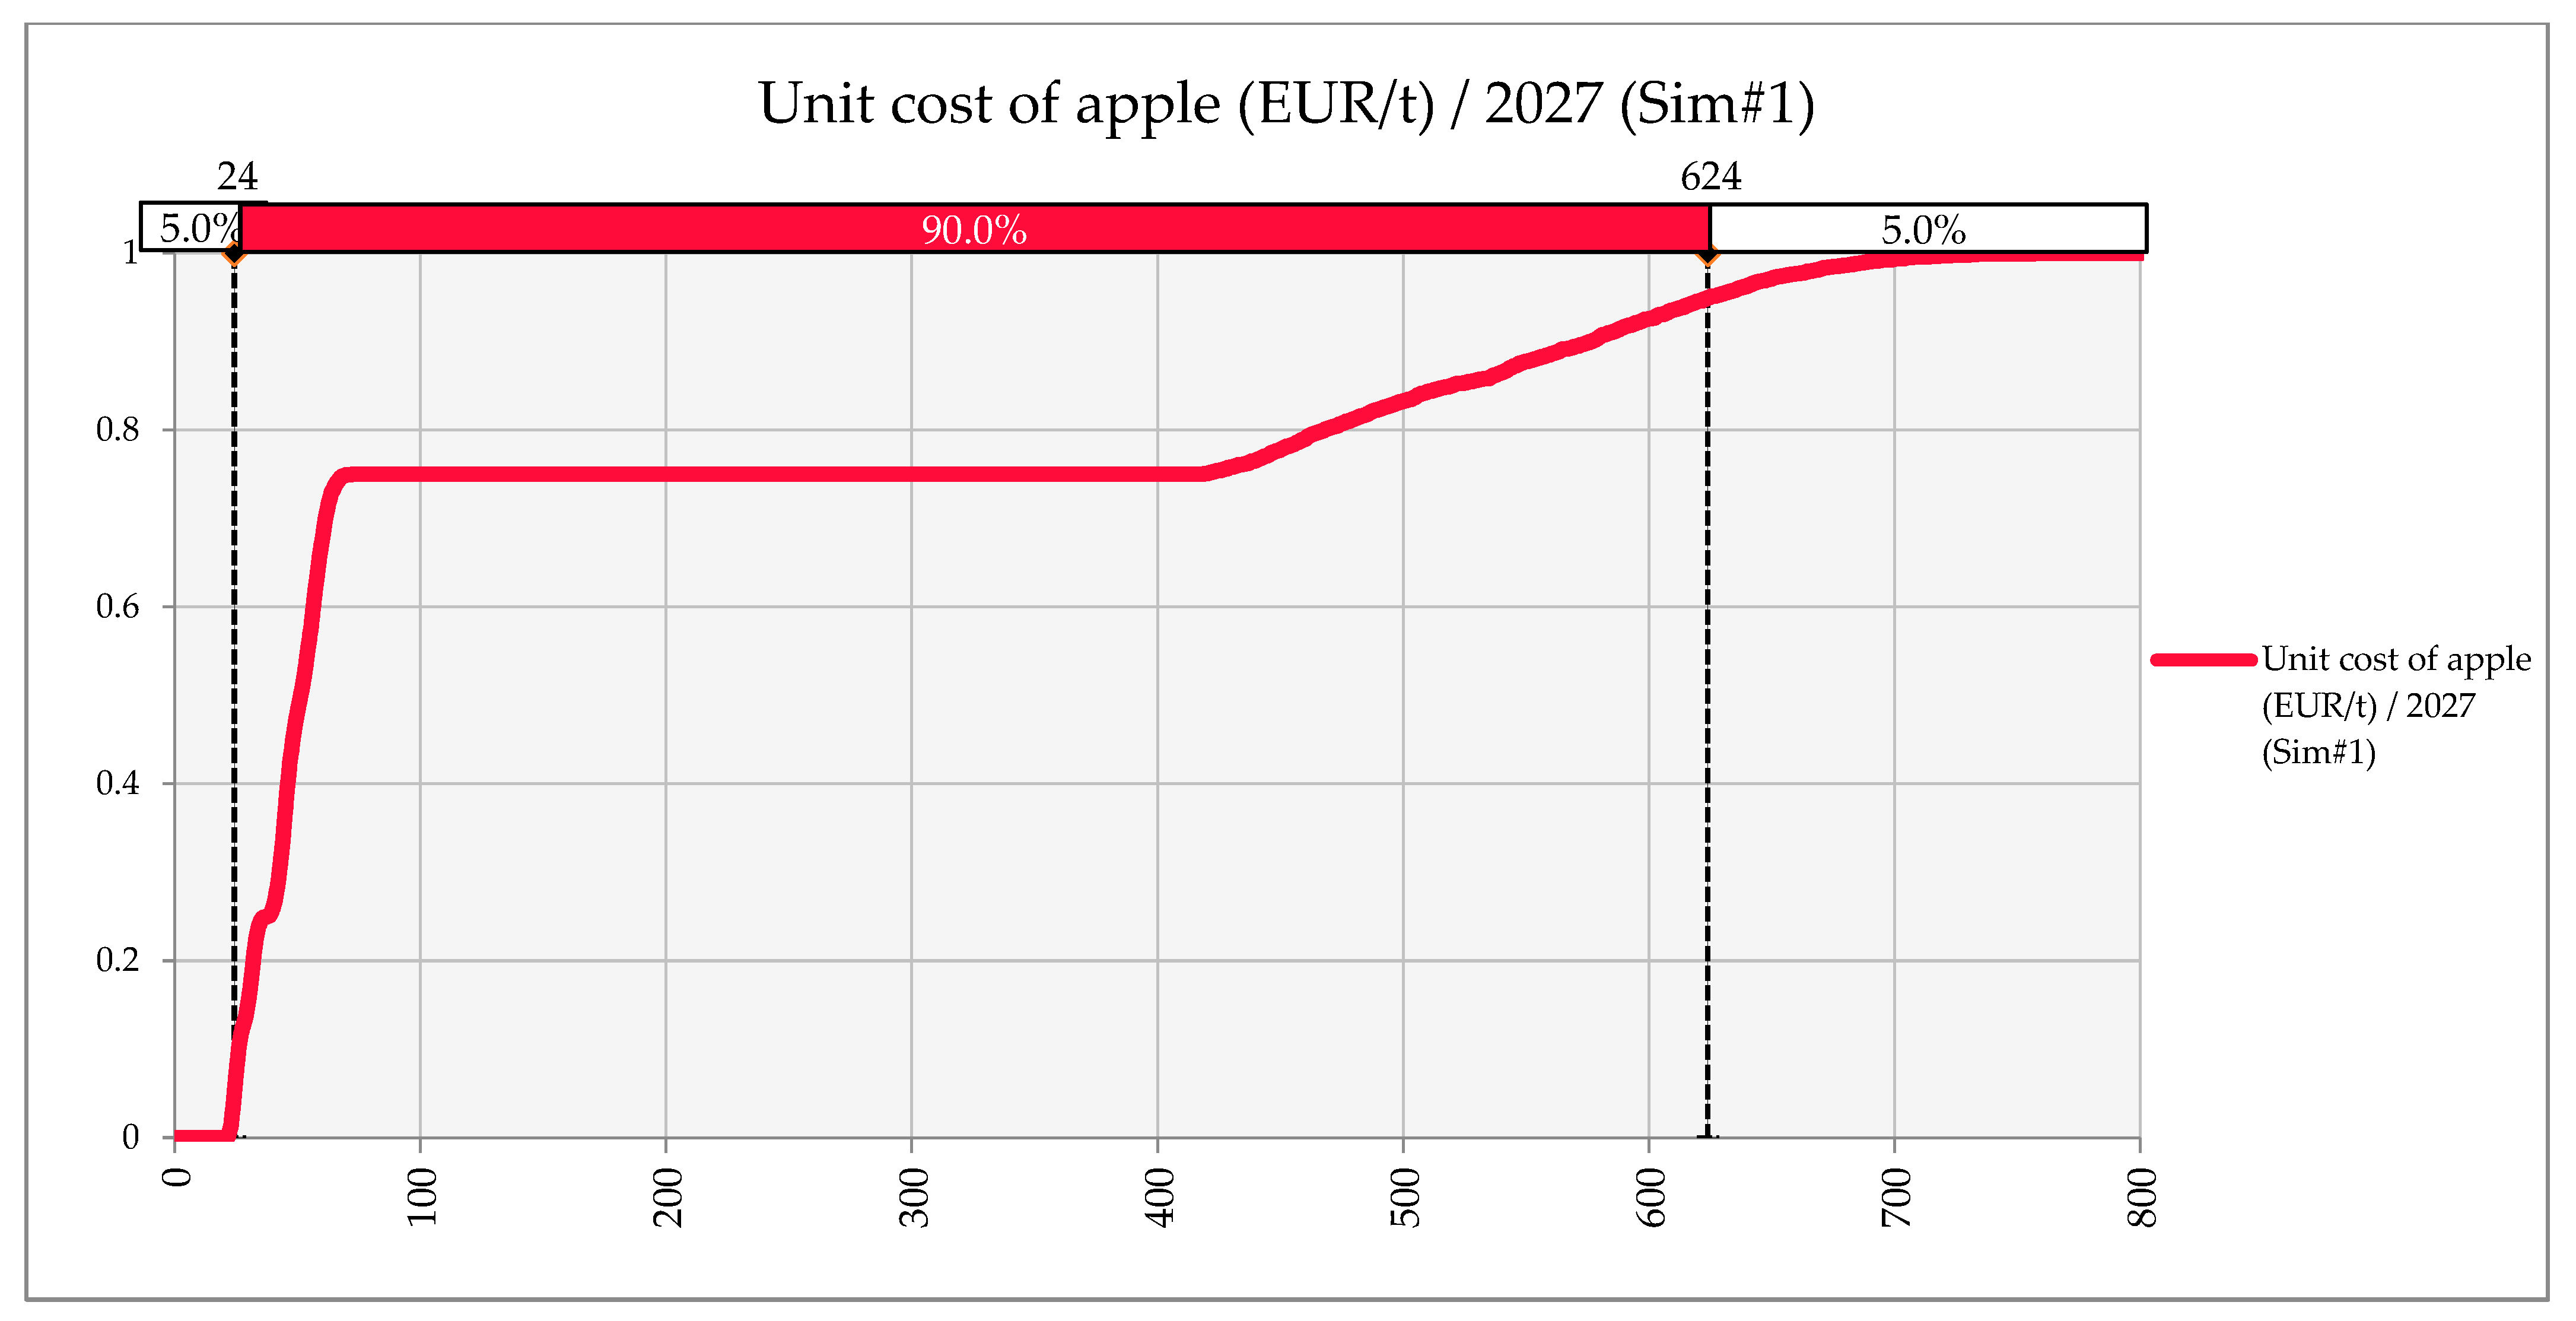
4.2.1. Unit Cost of Apple Production

In our paper, sensitivity analyses were conducted on FIT and electricity prices, revealing significant impacts on PV revenues.
Taking into account both Hungarian [35,39] and German [14] case studies, our results reveal that in the mature phase (4th to 15th year), apple yields are 51.75 t/ha for Class I and II apples along with 5.75 t/ha for industrial or juice apples. Pricing dynamics indicate unit prices of 0.29 EUR/kg for Class I and II apples and 0.10 EUR/kg for industrial apples. Financially, revenues without subsidy reach 15,488 EUR/ha, rising to 15,671 EUR /ha with subsidies.
Table 7 provides a comparative analysis of the unit costs of AVS, GM-PV (without apple), and apple (without PV) in the six selected years of operation, with the same reasons as described regarding Table 4. The unit costs are presented for both electricity production and apple cultivation. The data calculated were the total production cost, the share of electricity and apples in revenues to calculate the shared production costs of electricity and apples (in the case of AVS), and the unit costs for both components. All models show lower unit costs compared to expected prices; however, there is a very important difference between the three competitive technologies, namely that AVS significantly reduce the fluctuations in unit costs, resulting in higher values in electricity and lower values in apple, compared to the unit costs of GM-PV and apples only. These findings are in agreement with the statements and results of refs. [14,54].
Our results show that unit costs strongly fluctuated over the years due to the growing production costs, the differential price ratios between apples and electricity, and the years without apple yields (and operation costs) after plantings in the 1st, 2nd, 16th, and 17th years. The method used to calculate unit costs was based on the proportion of revenues and the 15-year-long lifetime of the apple plantation, taking into account the expected inflation, too. The growth in the 2026 and 2038 electricity unit costs is mainly due to the additional operational costs incurred in apple plantations compared to the previous years (without any apple yield). The share of electricity revenue is 100% in the years without harvested apples, but it is also near 90% in most other years, whereas the share of apple revenues varies from 9% to 15%. This indicates a significant dependence on electricity as a revenue generator. The share of apples in income also depends on the change in the price hike of apples and electricity. Unit costs show an intriguing pattern: in 2039, the cost of electricity will temporarily increase significantly. Then, the unit cost of apples will fluctuate, peaking in 2053, possibly reflecting growing costs associated with both sides of AVS. However, higher output prices are expected in the future, so the increase in unit cost probably will not result in a profit reduction. The unit cost of electricity in the years without apple harvest is significantly lower, thanks to the saved apple operation costs. Another important output is that unit cost of apples without electricity production would range between 196–399 EUR/t, while the unit cost of electricity without apple production would be between 0.013–0.029 EURc/kWh; however, both unit costs are substantially nearer to each other and more balanced in the APV systems (56–161 EUR/t and 0.015–0.040 EURc/kWh). This is more favorable for apple producers, which might make APV systems more attractive for the farmers with apple plantations. An important uncertainty in the unit cost is the weather, which strongly affects both electricity and apple yields and the shadow effect, which might be different in different apple species. Other case-sensitive factors are location and the applied technology. In the optimal case, a hillside with a 30–35% inclination would be optimal for PV (since all the surfaces could be covered by solar cells); however, the shadow effect is disadvantageous for AVS projects. Under Hungarian conditions, a 35–40% inclination can be regarded as the best for electricity production, and the number of possible panels per hectare, but the risk of wind damage in AVS (and PV) equipment is also higher in this case. These dynamics require strategic considerations to ensure sustainable financial viability and highlight the complex interaction between technological, operational, and market factors in agrivoltaic projects.
The spider diagram in Figure 7 illustrates that the unit cost of apple production is predominantly influenced by the FIT prices, with a significant correlation observed in 20% of cases. However, in the absolute majority of cases, the FIT price results in just a slight effect on unit price (around 50 EUR/t). Conversely, the yield of apples in a mature state, net investment cost, consumption purpose ratio, and sunshine hours per year have minimal impact, registering negligible influence on unit cost. This emphasizes the FIT price’s primary role in driving variations in the cost structure of apple production across the analyzed input values.
In Figure 8 and Figure 9, correlation coefficients (Spearman rank) and regression coefficients elucidate the relationships affecting the unit cost of apple production. Figure 8 underscores a significant inverse correlation (−0.90) between the FIT price and unit cost (because of revenue-based cost sharing with apples, which was calculated based on the distribution of revenues of electricity and of apple production), with the net investment cost showing a moderate positive correlation (+0.33) and other factors exhibiting weaker associations. Meanwhile, Figure 9 quantifies the same trends in key variables, including the following: a substantial negative coefficient for the FIT price (−0.84), a modest positive coefficient for net investment cost (+0.09), and a marginal negative coefficient for the yield of apples in a mature state (−0.06). Together, these findings provide concise insights into the economic factors influencing the unit cost of apple production.
The Monte Carlo simulations visualized in Figure 10 show a significant standard deviation in unit cost values, ranging across the 90% confidence interval. Product prices exert a greater influence on unit cost than the cost of investment, constituting 25% of the variation. However, the regression coefficient for the relationship between individual prices and unit cost is relatively low, indicating difficulty in pinpointing specific years that significantly impact unit cost predictions.

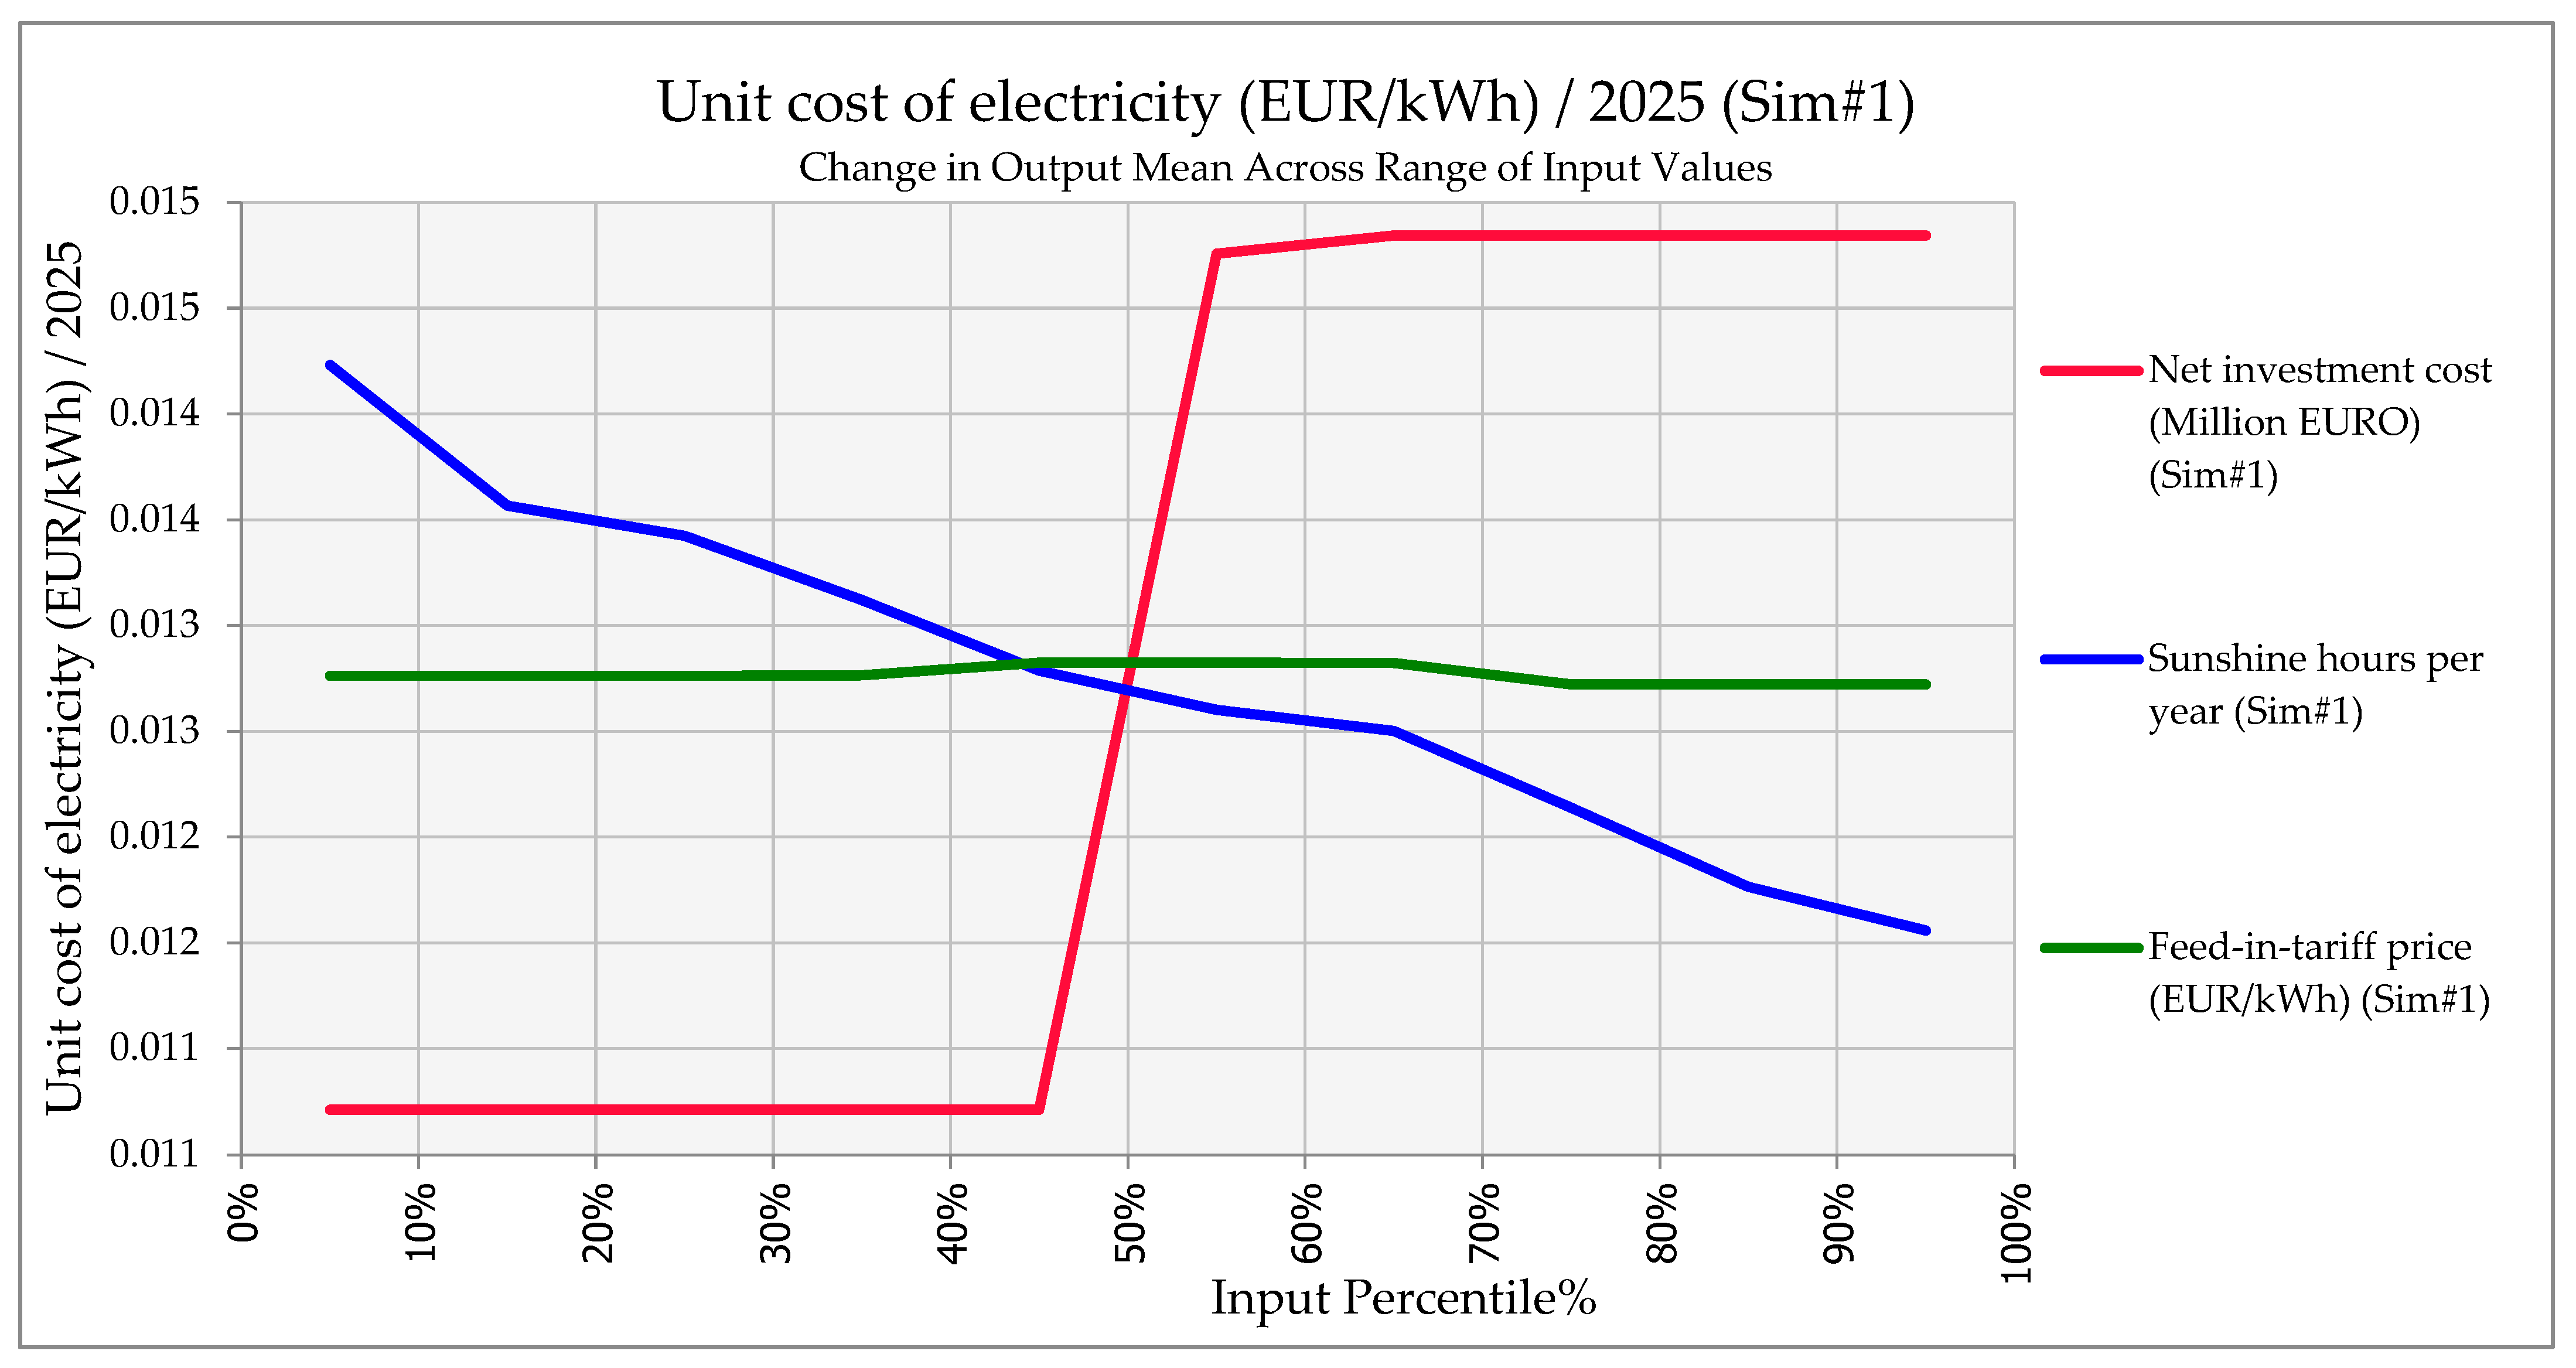
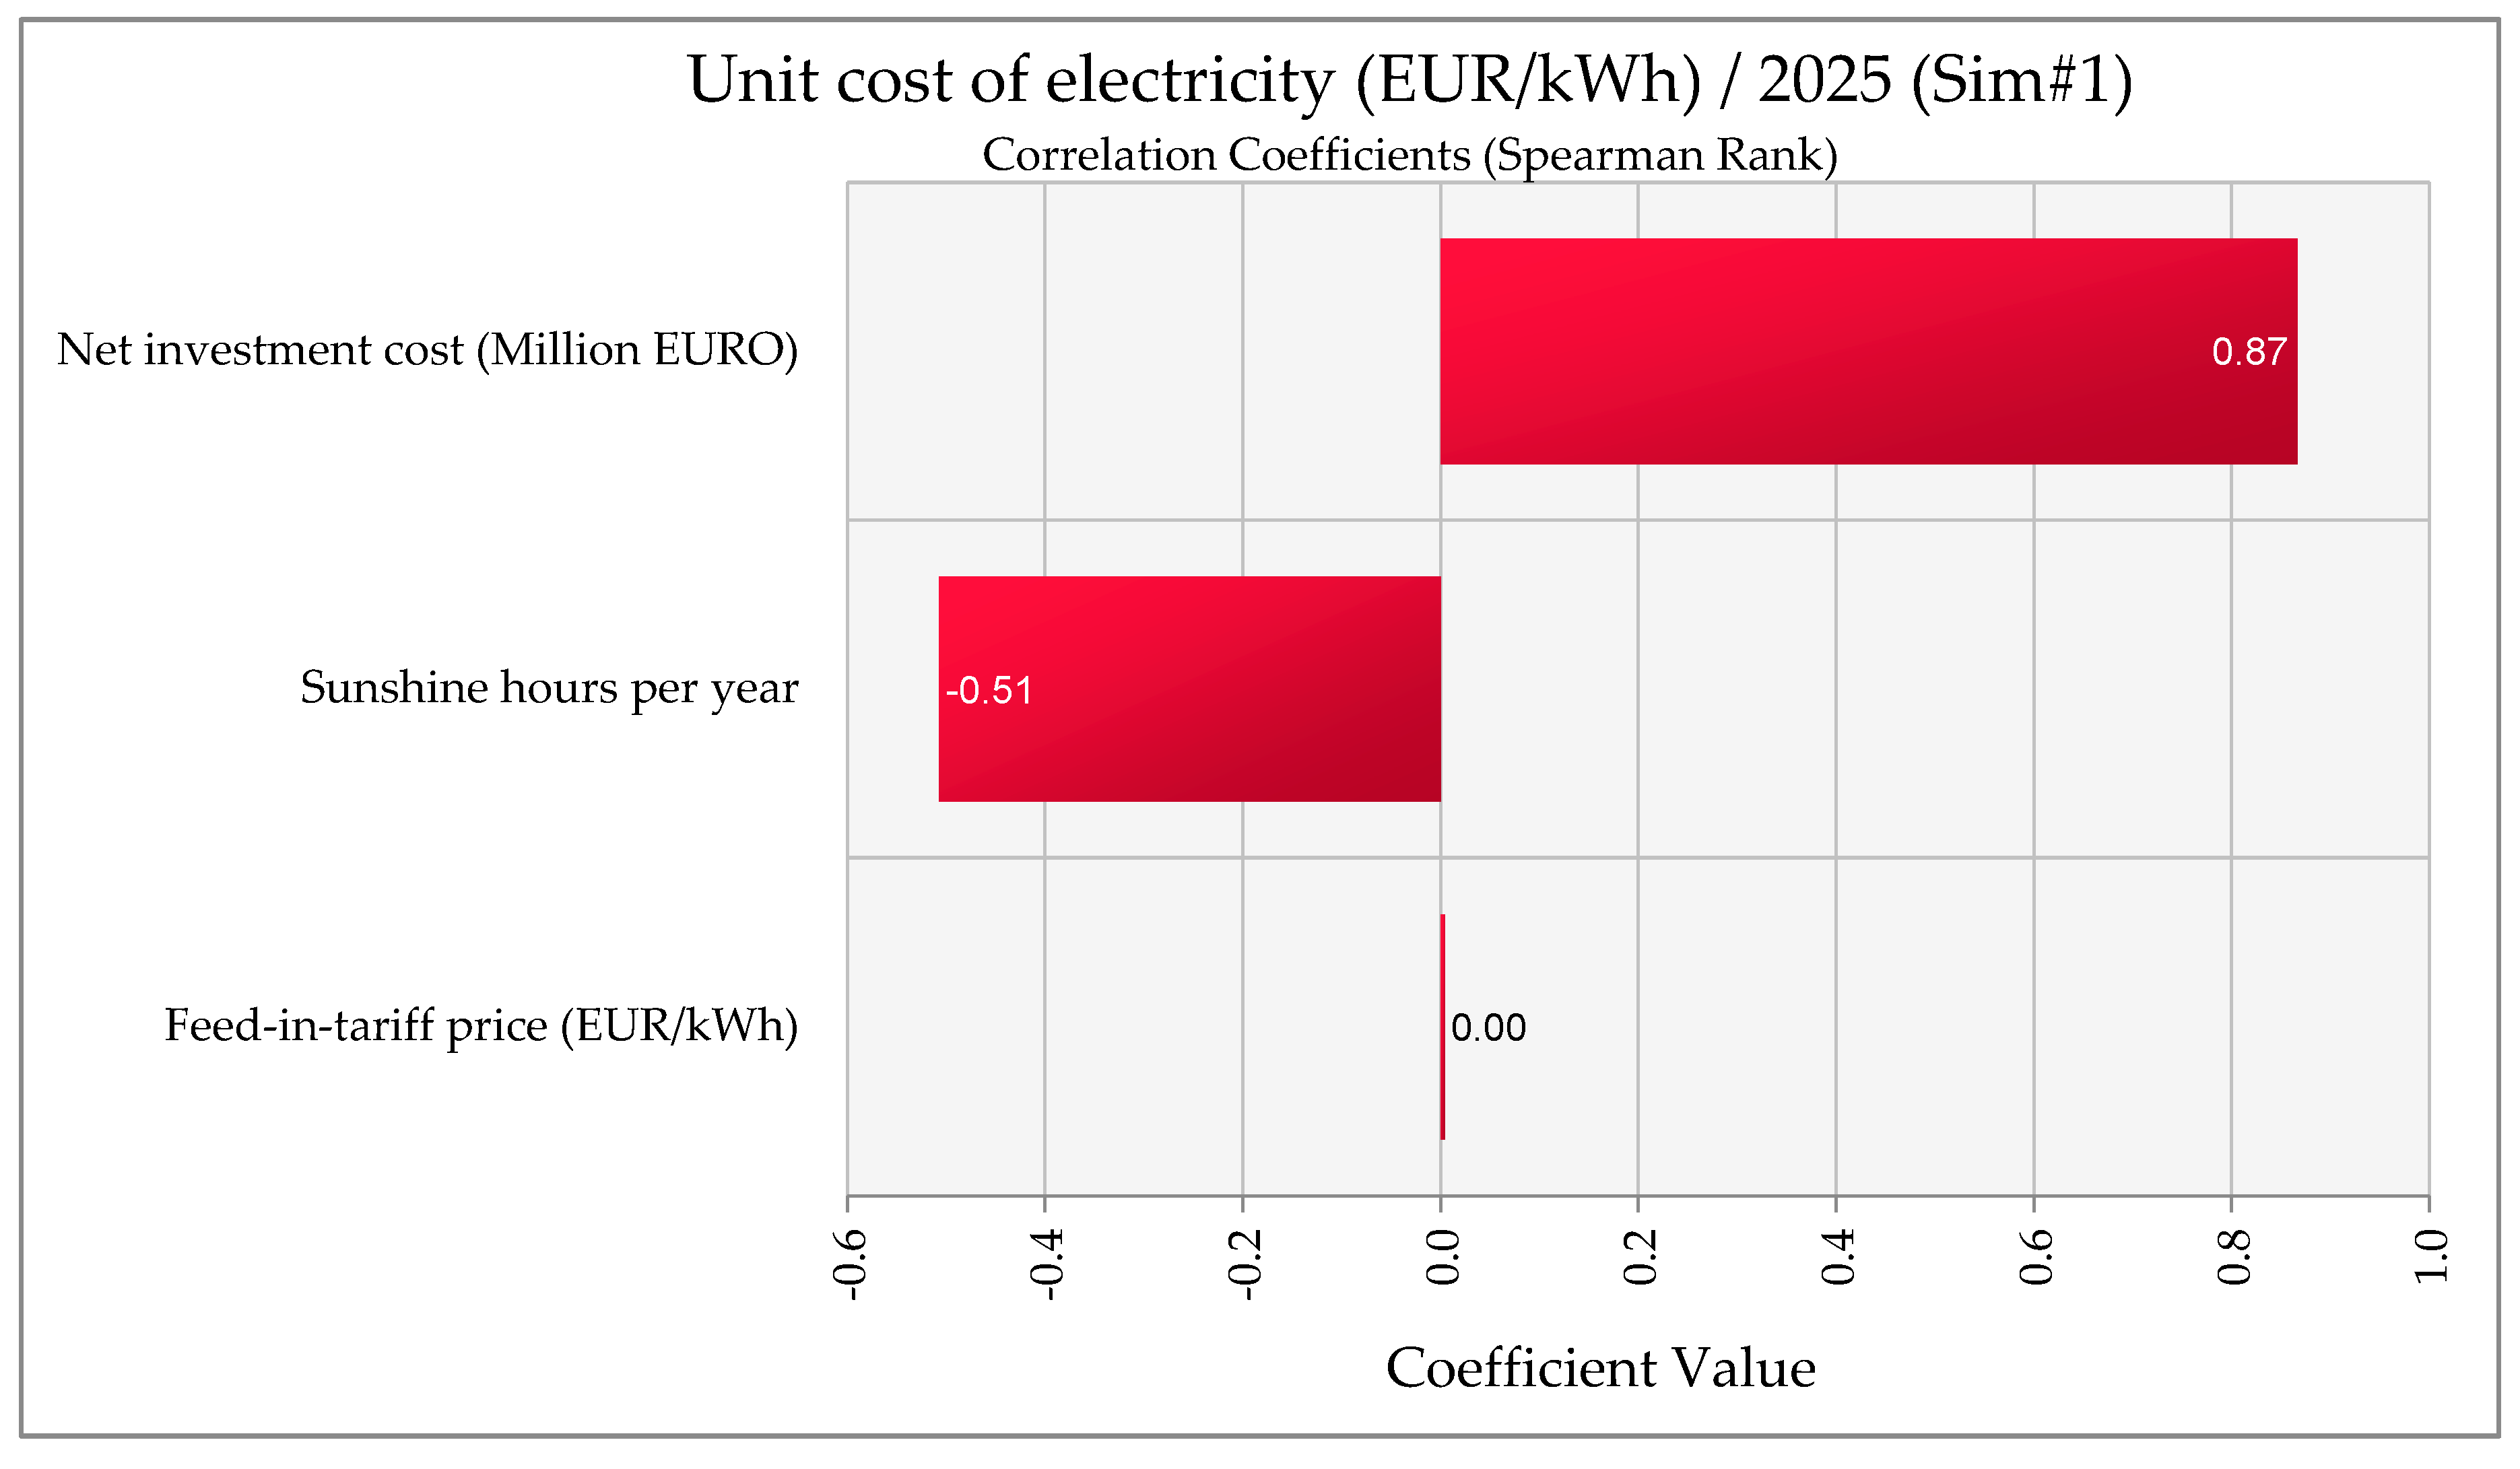
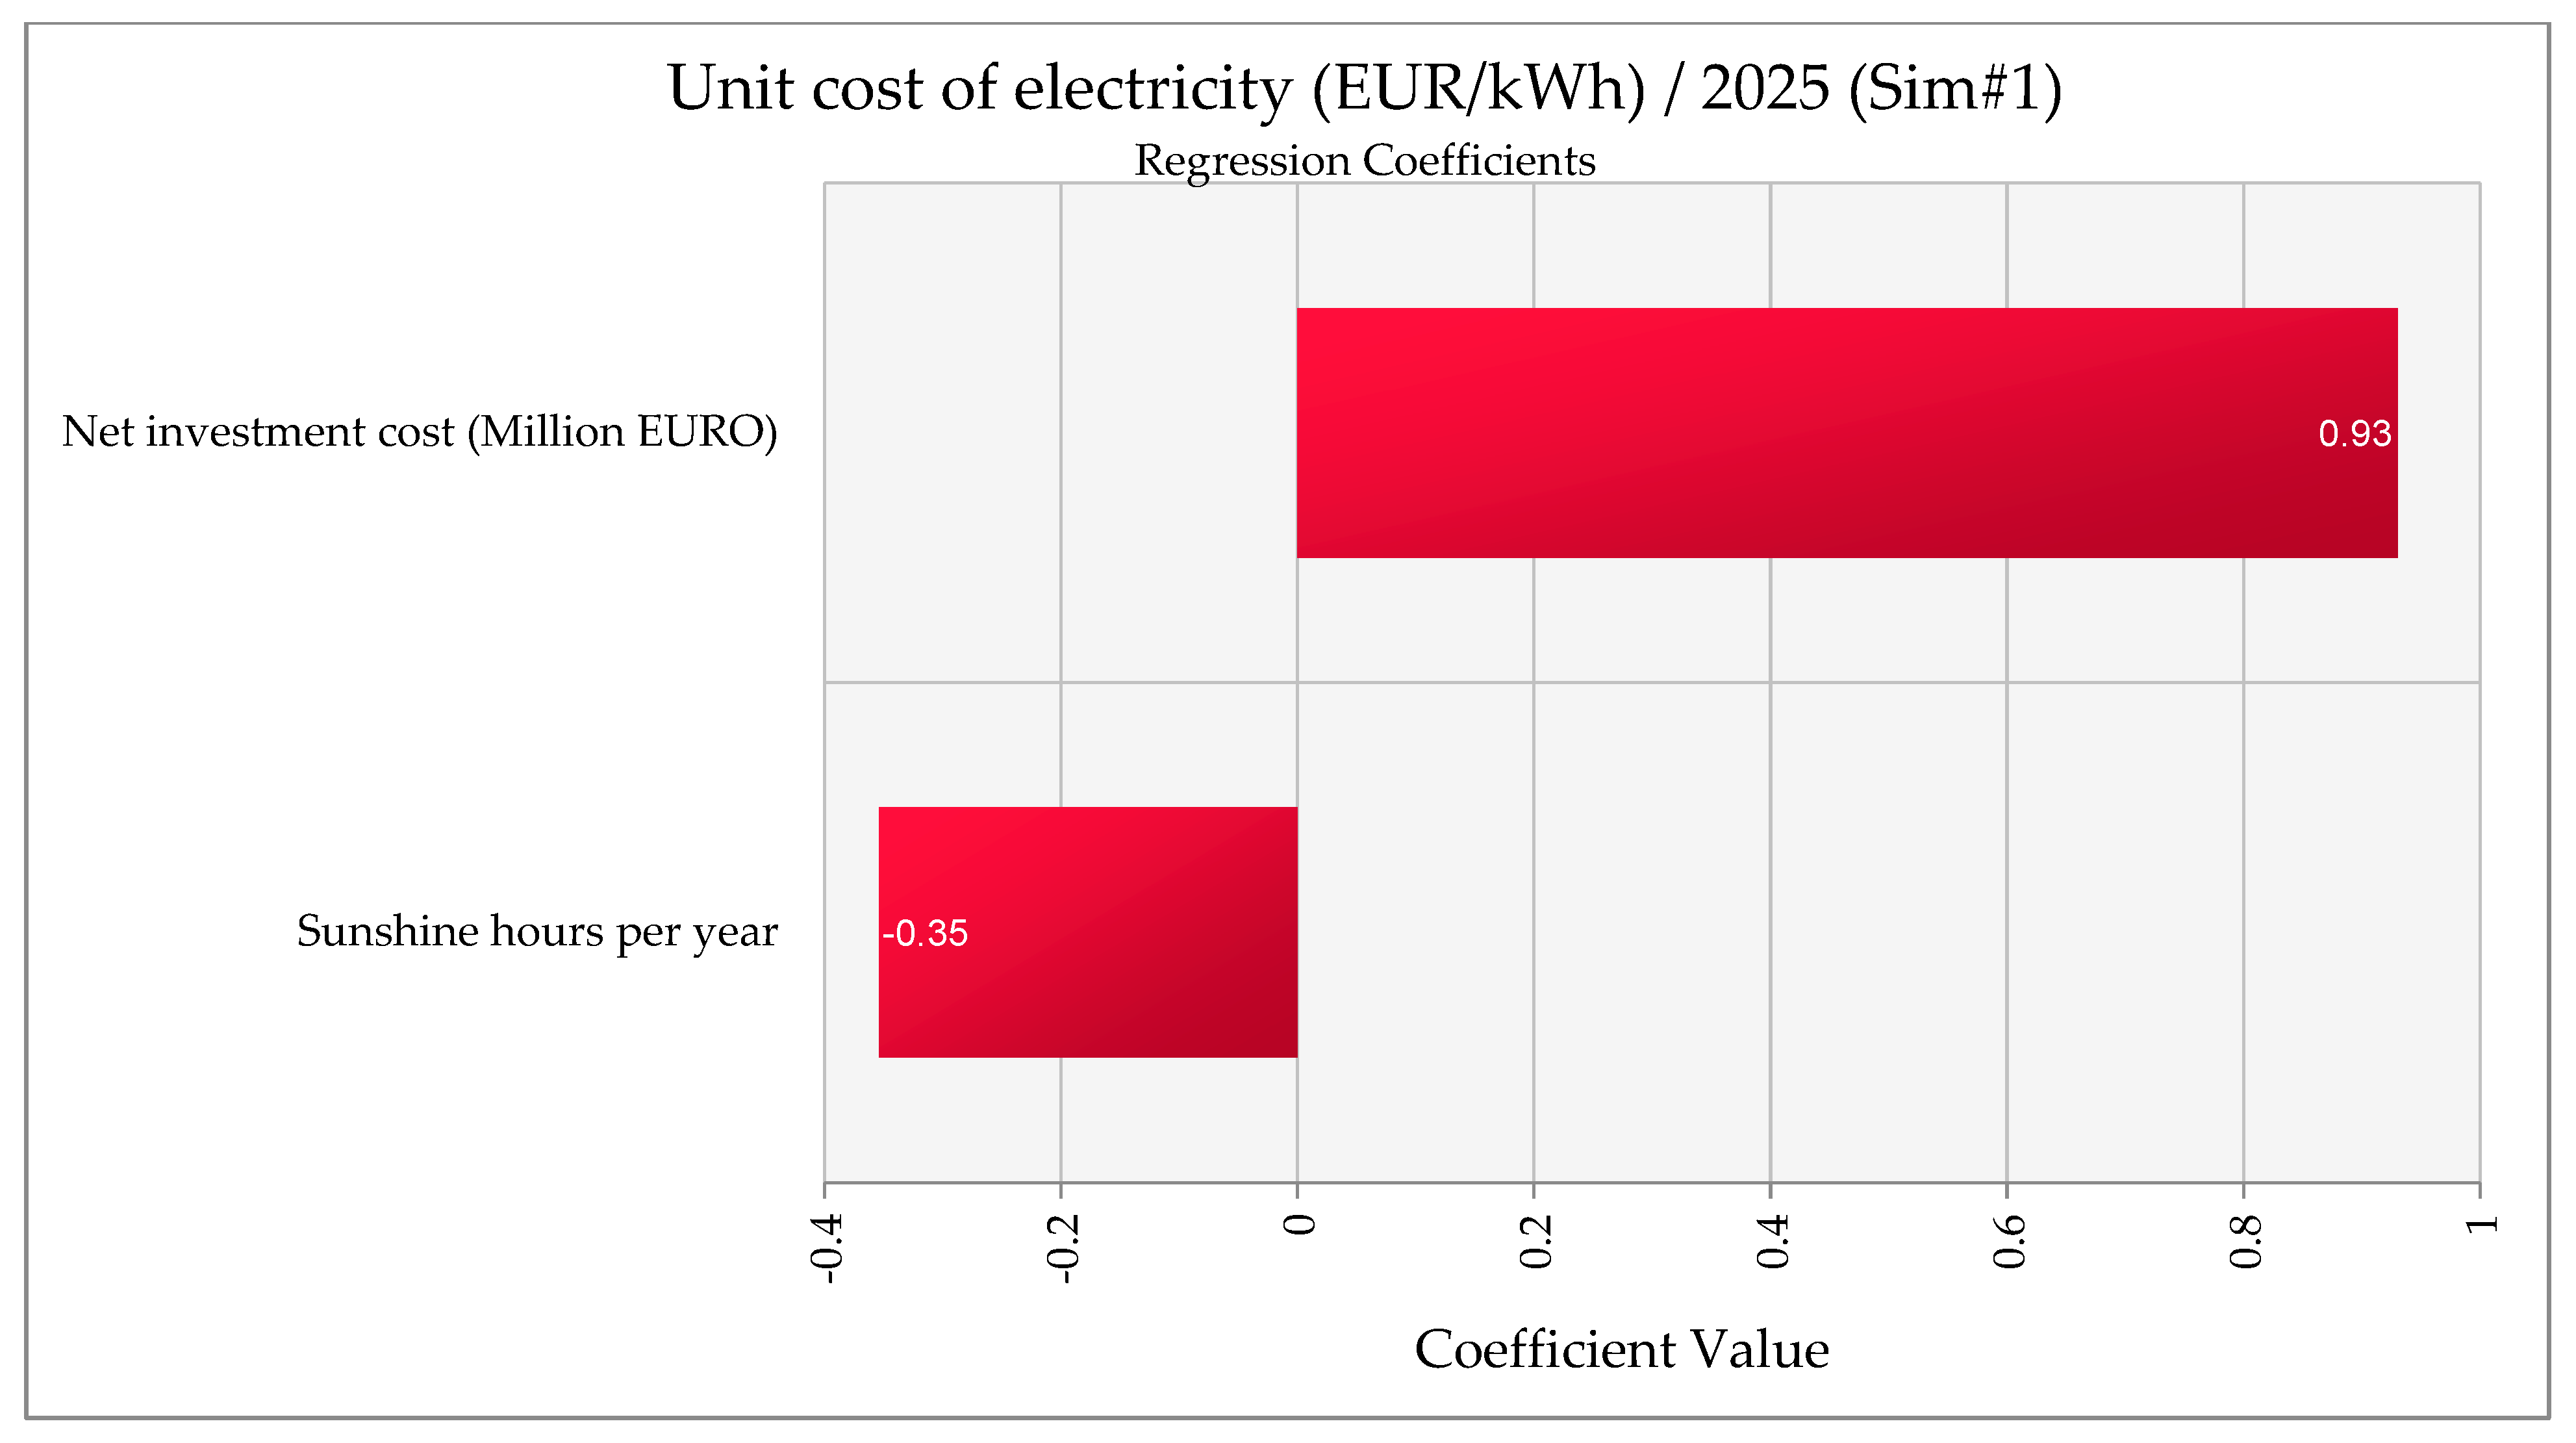
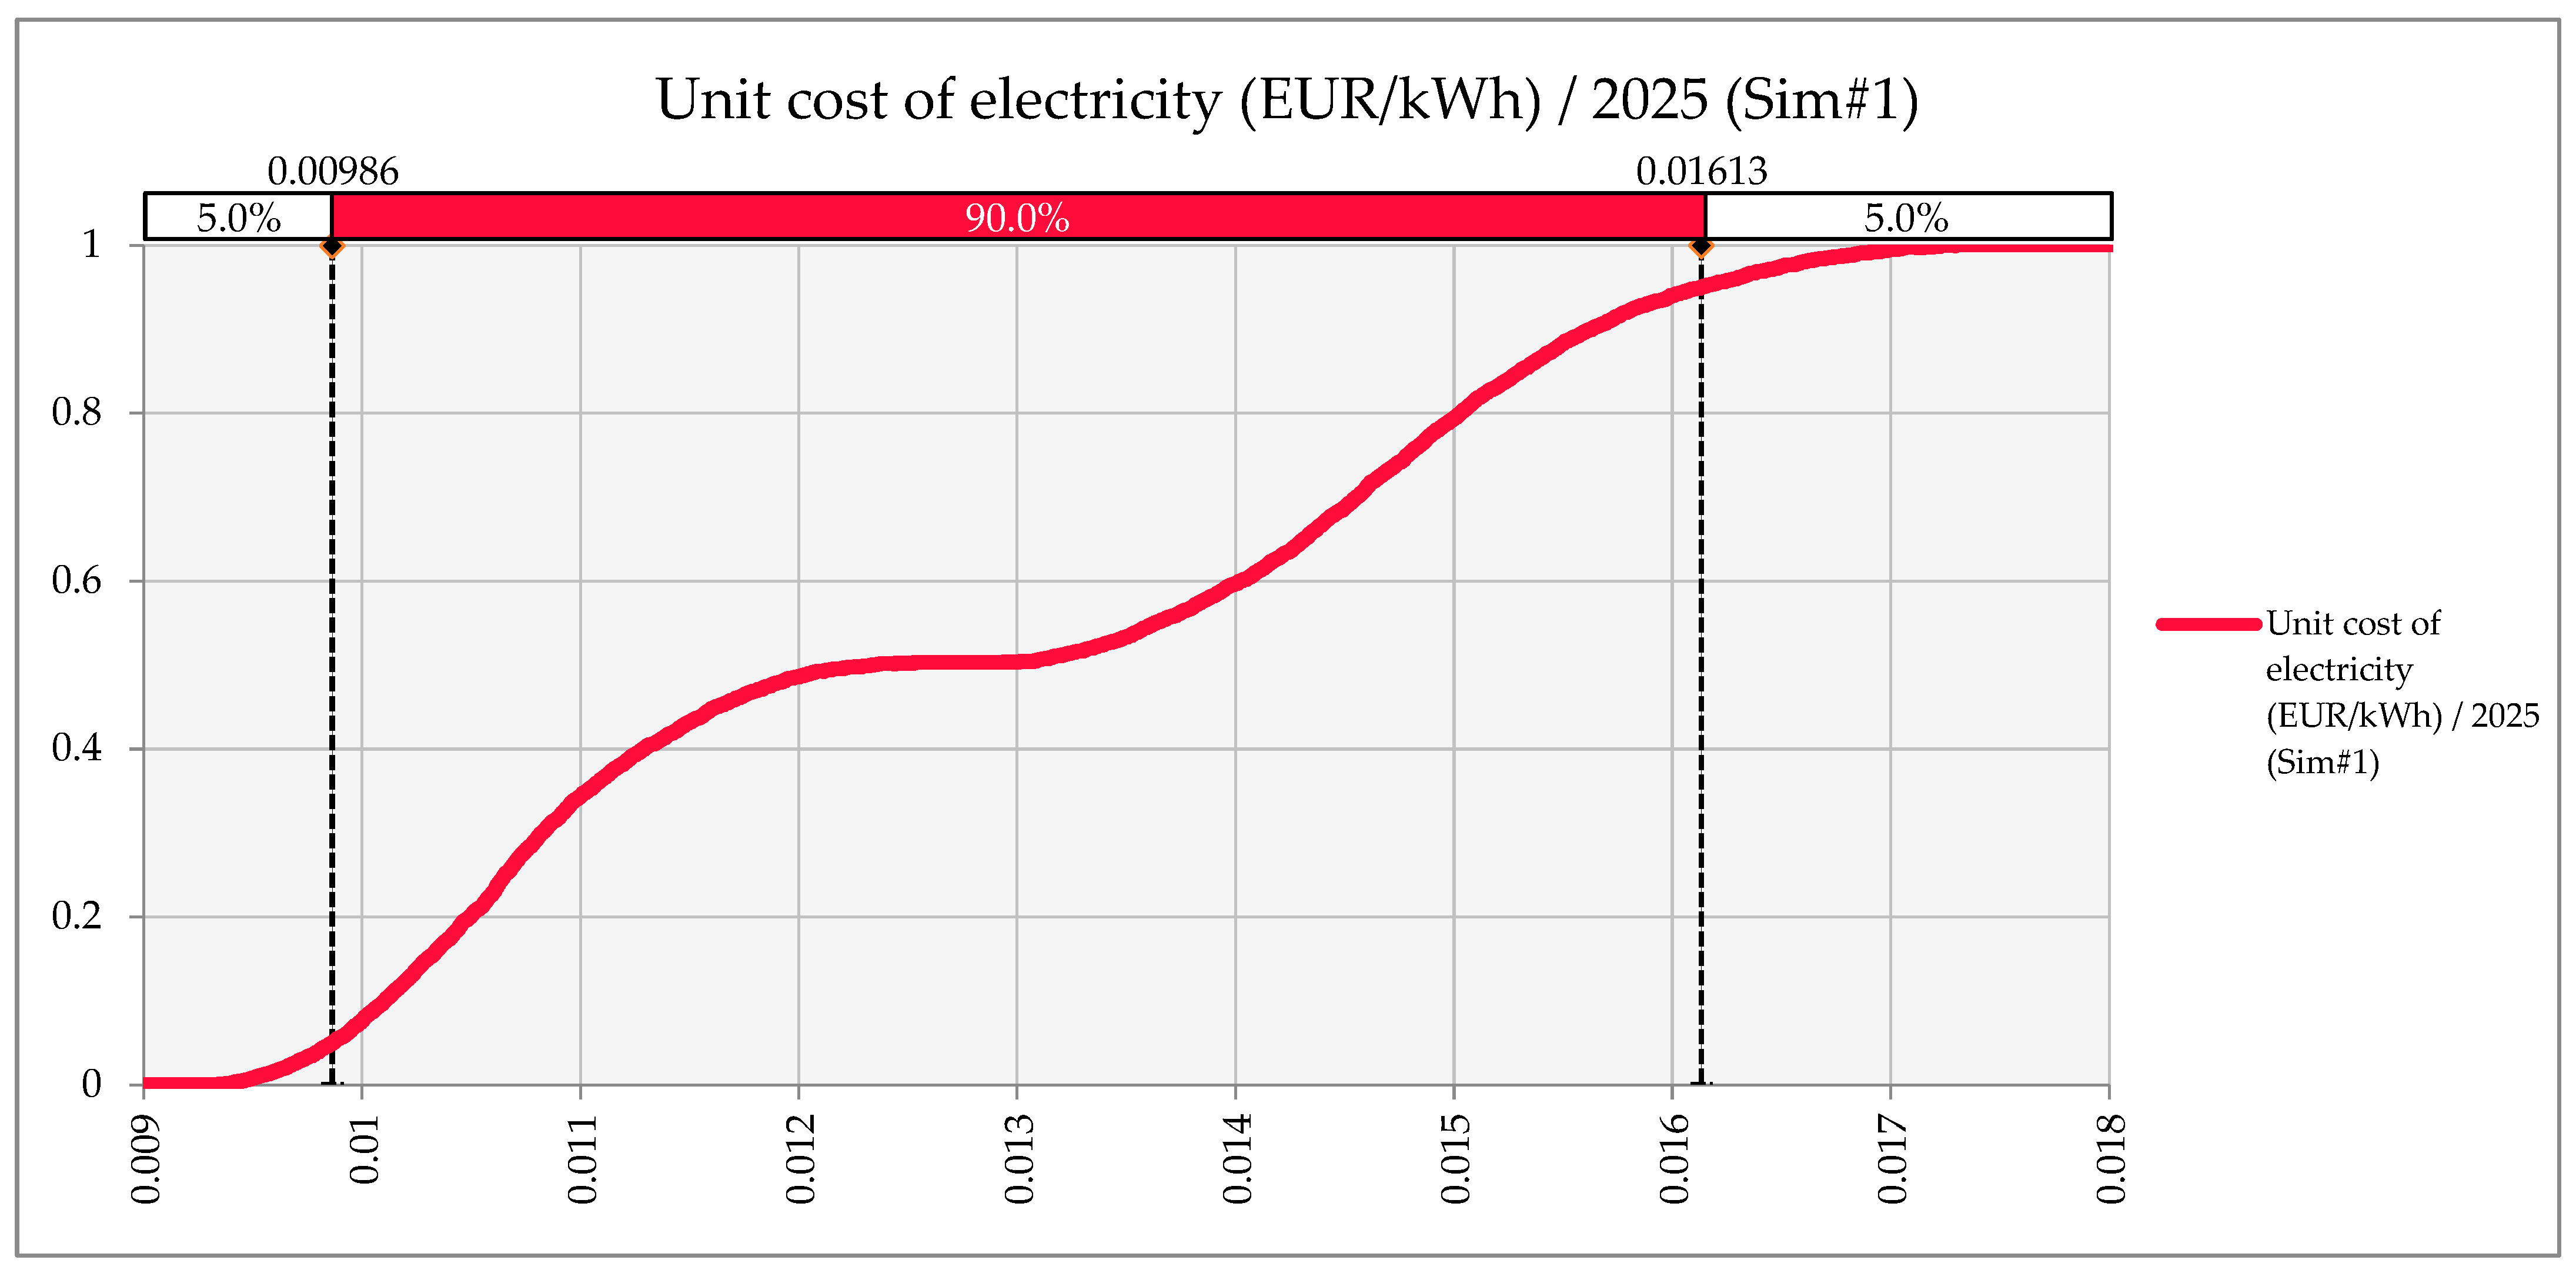
4.2.2. Unit Cost of Electricity

The spider diagram in Figure 11 shows that the unit cost was influenced mainly by two items (in opposite directions)—the net investment cost and the sunshine hours per year—while the impact of the FIT price of electricity was practically zero.
The findings indicate a predominant influence of the net investment cost, supported by correlation and regression coefficients of +0.87 and +0.93, respectively. Additionally, sunshine hours emerged as the second most influential factor, with a correlation coefficient of −0.51 and a regression coefficient of −0.35, significantly impacting the unit cost (Figure 12 and Figure 13).
The most probable unit cost of electricity ranges in the 0.011–0.016 EUR/kWh interval, and the chance for other values was near zero (Figure 14). Considering [14] predictions regarding FIT prices, this interval is sufficient to achieve profit.
The varying unit costs of electricity production in the agrivoltaic project are significantly influenced by the FIT structure. As observed by refs. [77,78], the unit cost of electricity ranges from EUR 0.015 to EUR 0.068 per kWh; the lower estimation is similar to our results. The competitive edge of the agrivoltaic project in apple orchards becomes more pronounced, especially when the FIT price is set at a higher rate. Higher FIT prices enhance the economic attractiveness of the project, potentially making it more competitive than traditional GM-PV systems.
Regarding the competitiveness of AVS, not only is the size of profit relevant but also its relative importance. For instance, it is important whether the economic outcome of AVS is superior to that of alternative activities. If better economic results can be achieved with PV systems without apple production or with apple production without PV systems, then investors will choose these systems instead of AVS. AVS entail an additional investment compared to both alternatives. According to one of our studies [79], in plain conditions, PV has a comparative advantage with higher profits and slightly lower investment costs; meanwhile, apples have a lower profit capacity, which goes hand in hand with significantly lower investment cost and uncertain repayment.
Another issue in the competitiveness of agrivoltaics projects in apple orchards is inextricably linked to FIT prices. Higher FIT prices increase the attractiveness of the APV project, but result in even higher profit in PV systems, which might reduce the competitiveness of AVS. Another problem might be that agricultural integration mitigates land-related challenges, especially for smallholder farmers. With FIT prices playing a critical role, policymakers and stakeholders might consider tariff structures to encourage the widespread adoption of agrivoltaics in apple farming. The possible reason for the special subsidization of AVS systems could be the more efficient use of land (higher profit per hectare compared to conventional agricultural activities), improving the livelihood of small farmers, and land savings in agriculture (compared to the PV systems).
Combining apple production with the solar–agriculture–water (SAW) nexus represents a holistic approach to sustainable land use practices. This approach aligns with multiple 2030 Sustainable Development Goals (SDGs) for apple production; AVS directly contributes to generating eco-friendly electricity (SDG 7) and producing food (SDG 2). It also supports SDGs 5 and 8 by engaging women in social development, aligns with SDG 15 (Life on Land), and promotes responsible consumption (SDG 12) [74,80,81,82].

5. Conclusions

This study underscores the significance of mitigating critical component costs while emphasizing the positive impacts of improved electricity pricing and reduced discount rates on the overall economic performance of the proposed agrivoltaic system.
This study undertakes a thorough economic analysis of agrivoltaic systems in apple cultivation, extending its examination beyond conventional metrics to encompass unit costs, operating expenses (OPEX), and capital expenditures (CAPEX). The application of advanced Monte Carlo simulations in this research effectively addresses uncertainties and yields valuable insights into risk management. With a specific focus on a hypothetical agrivoltaic project in Mezőcsát, Hungary, with a 38,269 kWp solar PV capacity, the study’s findings underscore the importance of optimal space utilization and sustainable land use practices in enhancing the economic viability of such initiatives.
The investment analysis outlined in Section 4.1 shows that under the most probable scenario, the project can be considered financially attractive; 75% of the iterations in the Monte Carlo simulation resulted in a positive NPV. According to the correlation and regression analysis, the FIT price is considered the dominant economic factor, the role of financing (discount rate) is the second most dominant, and the others (inflation rate, sunshine hours, and net investment cost) can be regarded as negligible.
In Section 4.2, the unit cost of electricity and apples produced in AVS and their competitiveness were analyzed. Another very important advantage of AVS is that it significantly reduces the differences in unit costs of the twin products (higher values in electricity and lower values in apple), compared to their independent production. In this way, it moderates the financial risk of production. The last part of our economic analysis highlights a critical dependence on the FIT price and state subsidies for the competitiveness of the analyzed system. While subsidies may currently contribute to the competitiveness of the agrivoltaic system in apple farming, a careful evaluation of the long-term economic feasibility is necessary. Without external support, both the return on investment and the cost-effectiveness of apple and electricity production fall short of industry standards. Since the profitability of GM-PV systems seems to be higher and the related agricultural branch capital needs are lower than the respective values in AV systems, state support is essential for the future growth of AVS. However, this subsidization can be justified if the effective use of land has great importance. The GM-PV system cannot be used for agricultural purposes, which might cause food supply problems and the long-term use of high-quality land.
The results indicated both in Section 4.1 and Section 4.2 highlight the primary importance of agricultural yield in determining the economic viability of an agrivoltaic system. Even marginal improvements in agricultural yield can substantiate higher costs within the PV sector. Adapting these modules to the unique needs of the agrivoltaic market, characterized by a higher willingness to pay, could contribute to the overall economic viability of agrivoltaic initiatives.
In the context of Hungary’s vigorous development of renewable energy, the country should combine good policy and market factors, increase energy infrastructure investment, promote the coordinated development of centralized energy supply and distributed energy according to local conditions, and develop and utilize lower-cost renewable energy.
The novelty of this work stems from its focus on innovative apple orchard management strategies designed to meet the unique needs of agrivoltaic stakeholders. This study aims to help promote sustainable and economically viable practices in the agrivoltaic sector by addressing the specific needs of facility managers, investors, and farmers.
Economic studies on agrivoltaic systems face limitations due to a lack of reliable data encompassing both agricultural (shadow effects on crops) and financial aspects of agrivoltaics projects. The scarcity of data arises from the low number and short-term operation of agrivoltaics projects. Future challenges include ensuring economic viability and informing potential investors. Calculations are based on literature, expert interviews, and specialist exchanges, with validation planned through real data collection in a Hungarian agrivoltaics project. However, the dataset’s limitations and geographic differences with other European countries restrict generalizability. Uncertainties arise from the observation period and impact, producer prices, electricity rates, weather conditions, and apple productivity. The complex integration of AVS adds another layer of complexity requiring further investigation. Future research should address these limitations to enhance the understanding of apple cultivation dynamics and costs within agrivoltaics practices. It would make sense to collect the yields of several apple orchards at different locations and compare them with the wholesale prices of the respective years.
Considering the broader concept of sustainability, future studies could analyze the long-term environmental and social benefits of APS projects alongside their economic feasibility. One area for improvement in our study is the absence of environmental and social impact variables. Integrating these factors could provide a more holistic perspective on evaluating APS projects, aligning with sustainability goals. Future research should consider incorporating these variables for a comprehensive assessment of economic, environmental, and social dimensions in this field.

Author Contributions

Conceptualization, A.C., L.S., Z.G. and A.B.; data curation, A.C., L.S. and A.B.; formal analysis, A.C., L.S. and A.B.; funding acquisition, L.S. and A.B.; investigation, A.C., L.S. and A.B.; methodology, A.C., P.B., L.S. and A.B.; project administration, Z.G.; resources, A.C., P.B., L.S., Z.G., F.A., M.S. and A.B.; software, P.B.; supervision, A.C., L.S. and A.B.; validation, A.C., P.B., L.S. and A.B.; visualization, A.C., L.S. and A.B.; writing—original draft, A.C., P.B., L.S., F.A., M.S. and A.B.; writing—review and editing, A.C., L.S., Z.G. and A.B. All authors have read and agreed to the published version of the manuscript.

Funding

This research was funded by the National Research, Development, and Innovation Fund of Hungary, project no. TKP2021-NKTA-32, financed under the TKP2021-NKTA funding scheme, and by the bilateral scientific collaboration agreement 2019–2.1.13-TÉT_IN-2020-00061 “Waste algae to biogas for clean energy and environment: techno-environmental-economic prospects”. This publication was also supported by the University of Debrecen Program for Scientific Publication.

Institutional Review Board Statement

Not applicable.

Informed Consent Statement

Not applicable.

Data Availability Statement

The data that support the findings of this study are available on reasonable request from the corresponding author.

Acknowledgments

The authors acknowledge the contributions made by Rittick Maity, Faculty of Electrical and Electronics Engineering Technology, Universiti Malaysia Pahang Al-Sultan Abdullah, and Korlepara Aditya Naga Lakshmi Venkat, Department of Mechanical Engineering, Sathyabama Institute of Science and Technology.

Conflicts of Interest

The authors declare no conflicts of interest.

Abbreviations

AVSAgrivoltaic systems
CAPEXCapital expenditure
CDCFCumulative discounted cash flow (DCF)
ConAPSConventional apple production system
DFDiscount factor
FITFeed-in-tariff price
GCRGround–coverage ratio
GM-PVGround-mounted photovoltaic system
GWpGigawatt-peak
HNHail net
IRRInternal rate of return
JPYJapanese Yen
KRWSouth Korean Won
kWKilowatt
kWacKilowatt alternating current
kWhKilowatt-hour
kWh/aKilowatt-hours per annum (per year)
kWh/hakilowatt-hours per hectare per year
kWpKilowatt-peak
LCOELevelized cost of electricity
MWMegawatt
MWpMegawatt peak
NPVNet present value
OPEXOperating Expenses
PIProfitability index
PVPhotovoltaic
SPVSolar photovoltaic
UCa2027Unit cost of apples in 2027 (first harvest year)
UCe2025Unit cost of electricity in 2025 (first year of operation)

Appendix A

Appendix A.1. Agrivoltaics in Asia

Appendix A.1.1. Japan

The advent of open field agrivoltaics in Japan began in 2004 with Akira Nagashima’s demountable structures, facilitating crop rotations and adaptability. As of March 2019, the Ministry of Agriculture, Forestry, and Fisheries recorded 1992 registered agrivoltaic farms, covering 560 hectares across 46 prefectures nationwide, except for Toyama. These farms have successfully cultivated over 120 diverse crop varieties, with myoga ginger, Sakaki, paddy rice, shiitake mushroom, and blueberry ranking among the top ten most popular crops [18,83,84]. This widespread implementation and economic potential underscores the viability and agricultural diversity achieved through the adoption of agrivoltaics in Japan.
The development of agrivoltaics in Japan began after the introduction of the feed-in tariff (FIT) in 2012. The FIT has proven to be significantly effective in terms of policy impact, increasing Japan’s renewable energy supply by 76% from 2012 to 2019. The degree of shade cast by agrivoltaic units ranges from 10 to 100%, and its median is from 30 to 40% [18,83].

Appendix A.1.2. China

China’s PV agriculture sector has seen significant growth in power station construction in recent years. Starting from an installed capacity of less than 0.001 GW in 2009, the number of agricultural PV power plants in China has expanded considerably, reaching 1.18 GW in 2014 [19]. These innovative structures facilitate the concurrent cultivation of tea, grapes, assorted vegetables, and diverse mushroom varieties [85]. This growth demonstrates the rapid development and scaling of photovoltaic projects integrated into the agricultural sector within China.
The study performed by Jiang et al. [86] assessed the effects of different PV shading levels on kiwifruit growth and yield in agrivoltaic systems. The experiment was conducted in the experimental kiwifruit base in Fuxing township, Pujiang County, located in Chengdu Plain, China. Shading levels of 19.0% (T1), 30.4% (T2), and 38.0% (T3) were compared to a full sun control treatment. Results showed reduced solar radiation by 43.8%, 50.5%, and 55.0%, respectively, compared to the control. Shading improved leaf light use efficiency and crop water productivity, with T1 being optimal, causing minimal impact on kiwifruit growth (−7.3% to 5.5%) and yield (−6.5% to −2.6%). Water productivity increased by 8.2% (T1) and 5.8% (T2) but significantly dropped by 9.8% in T3. This suggests that 19% PV coverage (T1) is favorable for maintaining crop yield and enhancing water productivity in agrivoltaic systems [86]. The trade-offs between shading and crop yield, particularly evident at the highest shading level (T3), warrant further investigation into the optimal balance between maximizing energy production and maintaining crop productivity in such systems.

Appendix A.1.3. South Korea

South Korea requires an estimated 80–180 km2 for efficient photovoltaic systems at 33° latitude, representing 18.3% efficiency. However, AVS implementation only commenced in 2017 for research purposes, with plans to scale up [87]. Policymakers in South Korea envision 100,000 AVS projects, each with 100 kWp, by 2030, targeting a market size of 10 GWp [13].

Appendix A.1.4. India

This reference highlights a comprehensive report by the Indo-German Energy Forum Support Office (IGEF-SO) and the National Solar Energy Federation of India (NSEFI), summarizing multiple major pilot projects across India. Currently, the report identifies a total of 22 operational and 3 upcoming plants, all primarily dedicated to experimental purposes [88].
Agrivoltaic farms demonstrate cost efficiency compared to conventional solar farms, with lower per-unit area costs (e.g., cost per acre) due to reduced spacing between rows. Capital costs for a one-acre agrivoltaic farm vary based on the installation costs per unit of power, analyzed through a sensitivity analysis, ranging from 2 USD/W (∼INR 132) to 0.25 USD/W (∼INR 16.5) [75]. Economic indicators for turmeric farming, such as a benefit–cost ratio of 1.71 and a price–performance ratio of 0.79, suggest project viability and feasibility. The land equivalent ratio and payback period for the agrivoltaic project with turmeric cultivation stands at 1.73 and 9.49 years, implying good production capacity and a quick return on investment for AVS [89].

Appendix A.2. Agrivoltaics in Europe

Numerous upcoming agrivoltaics projects focused on cultivating pears, apples, and various fruits are slated to reach a combined capacity of 35 MW in Europe by 2022 [90]. A study found that across Europe, 16.2% of the total land area (equivalent to 1.7 million km2) is eligible for AVS installation. The distribution of eligible land varies significantly, with most countries in Europe having between 12% and 29% of their land suitable for AVS, while some countries have as low as from 1% to 9%. However, Hungary (58.6%), Denmark (53.9%), and Ireland (63.9%) have larger percentages of eligible agrivoltaics areas [91]. Moreover, the disparities in land eligibility emphasize the need for strategic planning and policy frameworks to optimize agrivoltaic systems deployment across diverse European landscapes.

Appendix A.2.1. Germany

In Germany, eight agrophotovoltaic (APV) power plants have been operational since 2004, with three specifically constructed for research purposes [13]. In Germany, agrivoltaics crop trials by the Fraunhofer Institute for Solar Energy Systems ISE have been ongoing since 2014, involving winter wheat, celery, potatoes, and grass clover. A recent initiative started in 2021, led by BayWa r.e. and the Fraunhofer Institute for Solar Energy Systems ISE in Gelsdorf, Rhineland-Palatinate, aims to research agrivoltaics using eight different apple varieties over a five-year period. This project will compare apple production under four crop protection systems: foil roofing, hail protection nets, AVS with light-permeable PV modules, and tracking PV modules [92].

Appendix A.2.2. Italy

The agrivoltaic solar tracking system, Agrovoltaico®, was developed by REM Tec in collaboration with the University of Piacenza. It assesses its integration with maize crop production and evaluates its economic and environmental performance. Installed in Castelvetro Piacentino and Monticelli d’Ongina in 2012, these systems cover 7 ha and 20 ha, respectively, showcasing their scalability in the northern region of Italy [93].

Appendix A.2.3. France

France has a strong focus on agrivoltaics, with several key companies and their initiatives being supported by the national government.
Partnering with Agrosolutions, Total Quadran is implementing various PV solutions over 200 hectares of agricultural land. They are setting up an R&D unit to define economic models and overcome challenges [94].
EDF Renewables and Cero Generation acquired Green Lighthouse Development, possessing 2.4 GW of the agrivoltaic systems capacity in France. Cero Generation has sizable agrivoltaics projects in Italy as well, totaling over 1.5 GW [95].
The French Energy Regulatory Commission (CRE) allocated a total of 104 MW of generation capacity spread across 39 projects by Sun’Agri, with approximately 40 MW designated for agrivoltaic projects. These initiatives are expected to sell power at an average rate of 0.0828 EUR/kWh [96]. They aim to assist farmers in enhancing yield and tackling climate change challenges.

Appendix A.3. Agrivoltaics in the United States

Within the United States, the advancement of agrivoltaics is gradually unfolding through extensive research conducted at prominent national laboratories, esteemed academic institutions, private enterprises, and agricultural practitioners. The following outlines instances of these projects.
University of Massachusetts Amherst researchers are analyzing how combining solar panels with farming impacts economics and society. They are conducting on-site trials with various crops like pumpkins, strawberries, greens, squash, cranberries, hay, and more. This study aims to guide farmers and communities in making informed choices about solar integration in agriculture [97].
Jack’s Solar Garden, the largest commercial agrivoltaics research site in the United States, spans 24 acres in Boulder County, Colorado. This research, in collaboration with the National Renewable Energy Laboratory (NREL), Colorado State University, and the University of Arizona, aims to understand how the microclimates created by solar panels impact vegetation growth. Under the solar arrays, they are cultivating around forty plant types, including blackberries, herbs, and tomatoes, while planting 3000 trees, shrubs, and pollinator-friendly plants around the arrays [98,99].
The pioneering solar grazing initiative at ReVision’s Skowhegan solar farm in Maine involves integrating sheep grazing beneath solar panels. The project, led by ReVision Energy in collaboration with Michael Dennett of the Crescent Run Farm, features 39 ewes, 1 ram, and 42 lambs grazing under 10,500 solar panels spanning a 24-acre plot. This innovative approach not only minimizes fossil fuel use for grass maintenance but also benefits sheep farming profitability [100].
Sun Raised Farms leads North Carolina’s sustainability movement by offering solar farms a livestock-based ground maintenance solution using locally sourced sheep. This practice promotes pasture-raised lamb locally, reducing import dependency [101].
Dual-use systems integrate agriculture and solar PV panels on the same land, such as the Massachusetts SMART program, established in 2018. Requirements of the program mandate that land is designated as land for agricultural use or as important agricultural farmland. System parameters include a maximum capacity of 2 MW AC, specific panel height, and shading limitations of up to 50%. Financial compensation ranges from $0.14 to $0.26 per kWh for solar PV systems, with an additional $0.06 per kWh for qualifying dual-use systems. Annual reporting obligations encompass crop productivity, management details, and potential future changes for system optimization throughout the 20-year SMART program period [102].
Table A1 shows the main characteristics of APV systems using different plant species.
Table A1. Global case studies of agrivoltaic systems in diverse crop cultures.
CropShading Rate RangeInfluence on Crop YieldElectricity ProductionLocationCapacity of AVSInvestment CostRef.
Rice27% to 39%Sustains at least 80% of yield28% density: 284 million MWh/yr. (29% of Japanese electricity demand, 2018)Japan231 million kWNA[83]
CornNAControl: 3.35 kg/m2
Low Density: 3.54 kg/m2
High Density: 3.23 kg/m2
HD: 2974 kWh/a
LD: 1487 kWh/a
Ichihara City, Chiba Prefecture, Japan4.5 kWNA[103]
SoybeansNACrop production decreased by less than 20%.LAOR: 35% generate 17.8 GWh/yearKyoto Prefecture,
Japan
50 kWac320,000 JPY/kWac[104]
Lettuce70%
50%
No significant effect on crop yield
Significant effect on crop yield
6.5 to18 kWh/m2Montpellier,
France
NANA[46,105,106]
Lettuces and cucumbers Lettuce: 32% in FD and 48% in HD
Cucumber: 37% in FD and 62% in HD
NAMontpellier,
France
NANA[46]
Potatoes50%Potato plants beneath the PV modules had more leaves than those in the reference area.2447 kWhBelgiumNANA[107]
Winter wheat, potatoes, celeriacNAWinter wheat yields increased by 3%.
Potato yields increased by 11%.
Celeriac yields increased by 12%.
246 MWhGermany194.4 kWNA[108]
AppleNANA996 kWh/kWp/aGermany700 kWp1387 k EUR/ha[14]
Tomato transplants (Solanum lycopersicum var. Legend)NAControl Fully Irrigated (a): 88.42 (kg/row)
Control Fully Irrigated (b): 68.13 (kg/row)
Row Full Irrigated (a): 53.59 (kg/row)
Row Full Irrigated (b): 32.76 (kg/row)
Panel Full Irrigated (a): 33.61(kg/row)
Panel Full Irrigated (b): 21.64 (kg/row)
NAOregon State University Vegetable Farm (Corvallis, OR, USA)482 kWNA[109]
SoybeanAV1 = 27%, AV2 = 16%, AV3 = 9%,
AV4 = 18%
Total pod number decreased by 13% on average in all AV conditions compared to open field conditions.NAMonticelli d’Ongina, ItalyNANA[110]
Turmeric (Curcuma longa)70–75% shading of SPVCrop production decreased by approximately 15% due to underneath cultivation.1120 kWhJatni campus, Odisha, India0.675 kWp742.92 USD[89]
Apple50–55%Reductions in yield by 32% and 27% in 2019 and 2020.NALa Pugère, FranceNANA[10]
Maize (Zea mays L.) 29.5% and 13.4% for double-density and single-density, respectively.NAPo Valley, Northern ItalyNANA[15]

References

  1. IRENA. Global Energy Transformation: A Roadmap to 2050; International Renewable Energy Agency: Abu Dhabi, United Arab Emirates, 2019. [Google Scholar]
  2. Executive Summary—Hungary 2022—Analysis. Available online: https://www.iea.org/reports/hungary-2022/executive-summary (accessed on 7 December 2023).
  3. Tumiwa, J.R.; Tuegeh, O.; Bittner, B.; Nagy, A. The Challenges to Developing Smart Agricultural Village in the Industrial Revolution 4.0. Tor. Int. Stud. 2022, 1, 25–45. [Google Scholar] [CrossRef]
  4. Mizik, T.; Gyarmati, G. Economic and Sustainability of Biodiesel Production—A Systematic Literature Review. Clean Technol. 2021, 3, 19–36. [Google Scholar] [CrossRef]
  5. Popp, J.; Harangi-Rákos, M.; Pető, K.; Nagy, A. Bioenergy: Risks to Food-, Energy- and Environmental Security. Appl. Stud. Agribus. Commer. 2013, 7, 121–130. [Google Scholar] [CrossRef]
  6. Vida, V.; Szűcs, I. Pork Production and Consumption Issues from the Perspective of the Religion and the World’s Growing Population. Appl. Stud. Agribus. Commer. 2020, 14, 121–128. [Google Scholar] [CrossRef]
  7. Maity, R.; Sudhakar, K.; Abdul Razak, A.; Karthick, A.; Barbulescu, D. Agrivoltaic: A Strategic Assessment Using SWOT and TOWS Matrix. Energies 2023, 16, 3313. [Google Scholar] [CrossRef]
  8. Dupraz, C.; Marrou, H.; Talbot, G.; Dufour, L.; Nogier, A.; Ferard, Y. Combining Solar Photovoltaic Panels and Food Crops for Optimising Land Use: Towards New Agrivoltaic Schemes. Renew. Energy 2011, 36, 2725–2732. [Google Scholar] [CrossRef]
  9. Büchele, M. Lucas’ Anleitung zum Obstbau, 33rd ed.; Verlag Eugen Ulmer: Stuttgart, Germany, 2018; ISBN 9783818618681. [Google Scholar]
  10. Juillion, P.; Lopez, G.; Fumey, D.; Lesniak, V.; Génard, M.; Vercambre, G. Shading Apple Trees with an Agrivoltaic System: Impact on Water Relations, Leaf Morphophysiological Characteristics and Yield Determinants. Sci. Hortic. 2022, 306, 111434. [Google Scholar] [CrossRef]
  11. Trommsdorff, M. An Economic Analysis of Agrophotovoltaics: Opportunities, Risks and Strategies towards a More Efficient Land Use. Available online: https://www.wipo.uni-freiburg.de/CENworkpapers-en/files/cen-paper-03-2016trommsdorff.pdf (accessed on 11 November 2022).
  12. Barron-Gafford, G.A.; Pavao-Zuckerman, M.A.; Minor, R.L.; Sutter, L.F.; Barnett-Moreno, I.; Blackett, D.T.; Thompson, M.; Dimond, K.; Gerlak, A.K.; Nabhan, G.P.; et al. Agrivoltaics Provide Mutual Benefits across the Food–Energy–Water Nexus in Drylands. Nat. Sustain. 2019, 2, 848–855. [Google Scholar] [CrossRef]
  13. Schindele, S.; Trommsdorff, M.; Schlaak, A.; Obergfell, T.; Bopp, G.; Reise, C.; Braun, C.; Weselek, A.; Bauerle, A.; Högy, P.; et al. Implementation of Agrophotovoltaics: Techno-Economic Analysis of the Price-Performance Ratio and Its Policy Implications. Appl. Energy 2020, 265, 16. [Google Scholar] [CrossRef]
  14. Trommsdorff, M.; Hopf, M.; Hörnle, O.; Berwind, M.; Schindele, S.; Wydra, K. Can Synergies in Agriculture through an Integration of Solar Energy Reduce the Cost of Agrivoltaics? An Economic Analysis in Apple Farming. Appl. Energy 2023, 350, 121619. [Google Scholar] [CrossRef]
  15. Amaducci, S.; Yin, X.; Colauzzi, M. Agrivoltaic Systems to Optimise Land Use for Electric Energy Production. Appl. Energy 2018, 220, 545–561. [Google Scholar] [CrossRef]
  16. Weselek, A.; Ehmann, A.; Zikeli, S.; Lewandowski, I.; Schindele, S.; Högy, P. Agrophotovoltaic Systems: Applications, Challenges, and Opportunities. A Review. Agron. Sustain. Dev. 2019, 39, 35. [Google Scholar] [CrossRef]
  17. pv Magazine Agrivoltaics: Where Are We Heading? Available online: https://www.pv-magazine.com/magazine-archive/agrivoltaics-where-are-we-heading/ (accessed on 26 November 2023).
  18. Tajima, M.; Iida, T. Evolution of Agrivoltaic Farms in Japan. AIP Conf. Proc. 2021, 2361, 030002. [Google Scholar]
  19. Chen, J.; Liu, Y.; Wang, L. Research on Coupling Coordination Development for Photovoltaic Agriculture System in China. Sustainability 2019, 11, 1065. [Google Scholar] [CrossRef]
  20. Campana, P.E.; Stridh, B.; Amaducci, S.; Colauzzi, M. Optimisation of Vertically Mounted Agrivoltaic Systems. J. Clean. Prod. 2021, 325, 129091. [Google Scholar] [CrossRef]
  21. Trommsdorff, M.; Vorast, M.; Durga, N.; Padwardhan, S.M. Potential of Agrivoltaics to Contribute to Socio-Economic Sustainability: A Case Study in Maharashtra/India. AIP Conf. Proc. 2021, 2361, 040001. [Google Scholar]
  22. Willockx, B.; Reher, T.; Lavaert, C.; Herteleer, B.; Van de Poel, B.; Cappelle, J. Design and Evaluation of an Agrivoltaic System for a Pear Orchard. Appl. Energy 2024, 353, 122166. [Google Scholar] [CrossRef]
  23. Ember Average Monthly Electricity Wholesale Prices in Selected Countries in the European Union (EU) from January 2020 to October 2023 (in Euros per Megawatt-Hour) [Graph]. Available online: https://www.statista.com/statistics/1267500/eu-monthly-wholesale-electricity-price-country/ (accessed on 21 November 2023).
  24. Sertolli, A.; Gabnai, Z.; Lengyel, P.; Bai, A. Biomass Potential and Utilization in Worldwide Research Trends—A Bibliometric Analysis. Sustainability 2022, 14, 5515. [Google Scholar] [CrossRef]
  25. Igbeghe, C.B.; Nagy, A.; Gabnai, Z.; Bai, A. Exploring Biomass Linkages in the Food and Energy Market—A Systematic Review. Energies 2024, 17, 563. [Google Scholar] [CrossRef]
  26. Electricity Price Statistics. Available online: https://ec.europa.eu/eurostat/statistics-explained/index.php?title=Electricity_price_statistics (accessed on 22 November 2023).
  27. Böhringer, C.; Rosendahl, K.E. Green Promotes the Dirtiest: On the Interaction between Black and Green Quotas in Energy Markets. J. Regul. Econ. 2010, 37, 316–325. [Google Scholar] [CrossRef]
  28. Aune, F.R.; Dalen, H.M.; Hagem, C. Implementing the EU Renewable Target through Green Certificate Markets. Energy Econ. 2012, 34, 992–1000. [Google Scholar] [CrossRef]
  29. Chen, C.; Zhu, Y.; Zeng, X.; Huang, G.; Li, Y. Analyzing the Carbon Mitigation Potential of Tradable Green Certificates Based on a TGC-FFSRO Model: A Case Study in the Beijing-Tianjin-Hebei Region, China. Sci. Total Environ. 2018, 630, 469–486. [Google Scholar] [CrossRef] [PubMed]
  30. Karakosta, O.; Petropoulou, D. The EU Electricity Market: Renewables Targets, Tradable Green Certificates and Electricity Trade. Energy Econ. 2022, 111, 106034. [Google Scholar] [CrossRef]
  31. Yi, Z.; Xin-gang, Z.; Xin, M.; Yu-zhuo, Z. Research on Tradable Green Certificate Benchmark Price and Technical Conversion Coefficient: Bargaining-Based Cooperative Trading. Energy 2020, 208, 118376. [Google Scholar] [CrossRef]
  32. Ueckerdt, F.; Hirth, L.; Luderer, G.; Edenhofer, O. System LCOE: What Are the Costs of Variable Renewables? Energy 2013, 63, 61–75. [Google Scholar] [CrossRef]
  33. Bhattacharya, S.; Giannakas, K.; Schoengold, K. Market and Welfare Effects of Renewable Portfolio Standards in United States Electricity Markets. Energy Econ. 2017, 64, 384–401. [Google Scholar] [CrossRef]
  34. Trunov, Y.V.; Solovyev, A.V.; Zavrazhnov, A.A.; Tarova, Z.N. Modeling the Productivity of Intensive and Super-Intensive Apple Orchards in the Midland of Russia. IOP Conf. Ser. Earth Environ. Sci. 2021, 845, 012043. [Google Scholar] [CrossRef]
  35. Apáti, F.; Soltész, M. Economic Aspects of Applying Hail Protection Nets in Apple Plantations. Int. J. Hortic. Sci. 2011, 17, 99–101. [Google Scholar] [CrossRef]
  36. Badiu, D.; Arion, F.; Muresan, I.; Lile, R.; Mitre, V. Evaluation of Economic Efficiency of Apple Orchard Investments. Sustainability 2015, 7, 10521–10533. [Google Scholar] [CrossRef]
  37. Goedegebure, J. Economic Aspects of Super-Intensive Apple Orchards. Acta Hortic. 1993, 349, 285–294. [Google Scholar] [CrossRef]
  38. European Commission. Production, Areas and Yields. In The Apple Market in the EU; European Commission: Brussels, Belgium, 2022; Volume 1. [Google Scholar]
  39. Apáti, F.; Lakner, Z. Investment Analysis of Hungarian Apple-Orchard and Fruit Storage Projects. Int. J. Hortic. Sci. 2016, 18, 157–162. [Google Scholar] [CrossRef]
  40. Szabó, V. Comparative Economic Analysis of Superintensive and Intensive Apple Orchards. Int. J. Hortic. Sci. 2014, 20, 45–48. [Google Scholar] [CrossRef]
  41. HCSO Fontosabb Gyümölcsfélék és a Szőlő Betakarított Területe. Available online: http://www.ksh.hu/stadat_files/mez/hu/mez0014.html (accessed on 7 January 2024).
  42. HCSO Gyümölcstermelés Megye és Régió Szerint. Available online: https://www.ksh.hu/stadat_files/mez/hu/mez0086.html (accessed on 7 January 2024).
  43. Muder, A.; Thünen-Institute of Farm Economics, Braunschweig, Germany; Garming, H.; Dreisiebner-Lanz, S.; Kerngast, K.; Rosner, F.; Kličková, K.; Kurthy, G.; Cimer, K.; Bertazzoli, A.; et al. Apple Production and Apple Value Chains in Europe. Eur. J. Hortic. Sci. 2022, 87, 1–22. [Google Scholar] [CrossRef] [PubMed]
  44. László, K. Almapiaci kilátások. Available online: https://fruitveb.hu/almapiaci-kilatasok/ (accessed on 7 January 2024).
  45. Felföldi, J.; Apáti, F. Operation Efficiency in the Fruit Production Chain—A Study Based on Real Cases. In Annals of the Polish Association of Agricultural and Agribusiness Economists; 2014; Volume 16, pp. 85–90. Available online: https://rnseria.com/resources/html/article/details?id=172798&language=en (accessed on 28 January 2024).
  46. Marrou, H.; Guilioni, L.; Dufour, L.; Dupraz, C.; Wery, J. Microclimate under Agrivoltaic Systems: Is Crop Growth Rate Affected in the Partial Shade of Solar Panels? Agric. For. Meteorol. 2013, 177, 117–132. [Google Scholar] [CrossRef]
  47. Marrou, H.; Dufour, L.; Wery, J. How Does a Shelter of Solar Panels Influence Water Flows in a Soil–Crop System? Eur. J. Agron. 2013, 50, 38–51. [Google Scholar] [CrossRef]
  48. Elamri, Y.; Cheviron, B.; Lopez, J.-M.; Dejean, C.; Belaud, G. Water Budget and Crop Modelling for Agrivoltaic Systems: Application to Irrigated Lettuces. Agric. Water Manag. 2018, 208, 440–453. [Google Scholar] [CrossRef]
  49. Miller, S.S.; Hott, C.; Tworkoski, T. Shade Effects on Growth, Flowering and Fruit of Apple. J. Appl. Hortic. 2015, 17, 101–105. [Google Scholar] [CrossRef]
  50. Kumpanalaisatit, M.; Setthapun, W.; Sintuya, H.; Pattiya, A.; Jansri, S.N. Current Status of Agrivoltaic Systems and Their Benefits to Energy, Food, Environment, Economy, and Society. Sustain. Prod. Consum. 2022, 33, 952–963. [Google Scholar] [CrossRef]
  51. Elkadeem, M.R.; Zainali, S.; Lu, S.M.; Younes, A.; Abido, M.A.; Amaducci, S.; Croci, M.; Zhang, J.; Landelius, T.; Stridh, B.; et al. Agrivoltaic Systems Potentials in Sweden: A Geospatial-Assisted Multi-Criteria Analysis. Appl. Energy 2024, 356, 122108. [Google Scholar] [CrossRef]
  52. Trommsdorff, M.; Gruber, S.; Keinath, T.; Hopf, M.; Hermann, C.; Schönberger, F.; Gudat, C.; Boggio, A.T.; Gajewski, M.; Högy, P.; et al. Agri-Photovoltaik: Chance Für Landwirtschaft Und Energiewende; Fraunhofer Institute for Solar Energy Systems ISE: Freiburg im Breisgau, Germany, 2024. [Google Scholar]
  53. Dinesh, H.; Pearce, J.M. The Potential of Agrivoltaic Systems. Renew. Sustain. Energy Rev. 2016, 54, 299–308. [Google Scholar] [CrossRef]
  54. Toyoda, T.; Yajima, D.; Araki, K.; Nishioka, K. Design Optimization of Agri-photovoltaic Systems in Different Climate Regions. IEEJ Trans. Electr. Electron. Eng. 2023, 19, 208–214. [Google Scholar] [CrossRef]
  55. Hilbers, J. Agri-PV-Projekt Obstbau am DLR Rheinpfalz—Obstbau.org. Available online: https://www.obstbau.org/rubriken/kernobst/agri-pv-projekt-obstbau-am-dlr-rheinpfalz.html (accessed on 15 January 2024).
  56. Hilbers, J. Agri-PV in Aller Munde—Obstbau.org. Available online: https://www.obstbau.org/rubriken/technik/agri-pv-in-aller-munde.html (accessed on 15 January 2024).
  57. Csedő, Z.; Sinóros-Szabó, B.; Zavarkó, M. Seasonal Energy Storage Potential Assessment of WWTPs with Power-to-Methane Technology. Energies 2020, 13, 4973. [Google Scholar] [CrossRef]
  58. Constantin, M.; Sapena, J.; Apetrei, A.; Pătărlăgeanu, S.R. Deliver Smart, Not More! Building Economically Sustainable Competitiveness on the Ground of High Agri-Food Trade Specialization in the EU. Foods 2023, 12, 232. [Google Scholar] [CrossRef]
  59. Szőke, E. Hungary Launches Its Largest Solar Power Plant to Date. Ceenergy News, 12 June 2023. [Google Scholar]
  60. Moreda, G.P.; Muñoz-García, M.A.; Alonso-García, M.C.; Hernández-Callejo, L. Techno-Economic Viability of Agro-Photovoltaic Irrigated Arable Lands in the EU-Med Region: A Case-Study in Southwestern Spain. Agronomy 2021, 11, 593. [Google Scholar] [CrossRef]
  61. Csigai, K.; Hrotkó, K. Effect of Rootstocks and Spacing on Growth and Yield in Early Bearing “Jonica” and “Gala Must” Apple Trees. Acta Hortic. 2007, 732, 475–479. [Google Scholar] [CrossRef]
  62. Ezzat, A.; El-Sherif, A.R.; Elgear, D.; Szabó, S.; Holb, I.J. A Comparison of Fruit and Leaf Parameters of Apple in Three Orchard Training Systems. Zemdirbyste 2020, 107, 373–382. [Google Scholar] [CrossRef]
  63. Nábrádi, A.; Szőllősi, L. Key Aspects of Investment Analysis. Appl. Stud. Agribus. Commer. 2007, 1, 53–56. [Google Scholar] [CrossRef]
  64. Szűcs, I.; Szőllősi, L. A Beruházások Ökonómiai Megítélése; András, N., Tibor, P., Katalin, T.G., Ház, S.K., Eds.; ÜZEMTAN I.: Budapest, Hungary, 2008; pp. 46–59. ISBN 9789639732704. [Google Scholar]
  65. Metropolis, N.; Ulam, S. The Monte Carlo Method. J. Am. Stat. Assoc. 1949, 44, 335–341. [Google Scholar] [CrossRef]
  66. Bai, A.; Balogh, P.; Nagy, A.; Csedő, Z.; Sinóros-Szabó, B.; Pintér, G.; Prajapati, S.K.; Singh, A.; Gabnai, Z. Economic Evaluation of a 1 MWel Capacity Power-to-Biomethane System. Energies 2023, 16, 8009. [Google Scholar] [CrossRef]
  67. MTAKFI. Climate. Available online: https://www.mtafki.hu/inmaps/pdf/Hungary-in-Maps_45.pdf (accessed on 20 November 2023).
  68. Solar Energy—Hungary. Available online: https://www.statista.com/outlook/io/energy/renewable-energy/solar-energy/hungary (accessed on 18 January 2024).
  69. Inflation Report. Hungarian National Bank. Available online: https://www.mnb.hu/en/publications/reports/inflation-report (accessed on 29 February 2024).
  70. Hargrave, M. Weighted Average Cost of Capital (WACC): Definition and Formula. Available online: https://www.investopedia.com/terms/w/wacc.asp (accessed on 15 January 2024).
  71. Average Risk Free Investment Rate in Hungary 2015–2022. Available online: https://www.statista.com/statistics/885881/average-risk-free-rate-hungary/ (accessed on 15 January 2024).
  72. Damodaran, A. Country Risk: Determinants, Measures and Implications—The 2022 Edition. SSRN Electron. J. 2022. [Google Scholar] [CrossRef]
  73. Damodaran, A. Equity Risk Premiums (ERP): Determinants, Estimation and Implications—The 2023 Edition. SSRN Electron. J. 2023. [Google Scholar] [CrossRef]
  74. Agostini, A.; Colauzzi, M.; Amaducci, S. Innovative Agrivoltaic Systems to Produce Sustainable Energy: An Economic and Environmental Assessment. Appl. Energy 2021, 281, 116102. [Google Scholar] [CrossRef]
  75. Malu, P.R.; Sharma, U.S.; Pearce, J.M. Agrivoltaic Potential on Grape Farms in India. Sustain. Energy Technol. Assess. 2017, 23, 104–110. [Google Scholar] [CrossRef]
  76. Pascaris, A.S.; Schelly, C.; Burnham, L.; Pearce, J.M. Integrating Solar Energy with Agriculture: Industry Perspectives on the Market, Community, and Socio-Political Dimensions of Agrivoltaics. Energy Res. Soc. Sci. 2021, 75, 102023. [Google Scholar] [CrossRef]
  77. Baji Gál Imréné Szarvas, N.; Gyura, G.; Jókuthy, L.; Papp, D. Financing the Hungarian Renewable Energy Sector: Challenges and Opportunities. Available online: https://mnb.hu/letoltes/20210121-financing-the-hungarian-renewable-energy-sector.pdf (accessed on 10 January 2024).
  78. OECD OECD Statistics. Available online: https://stats.oecd.org/Index.aspx?DataSetCode=RE (accessed on 23 January 2024).
  79. Chalgynbayeva, A.; Mizik, T.; Bai, A. Cost–Benefit Analysis of Kaposvár Solar Photovoltaic Park Considering Agrivoltaic Systems. Clean Technol. 2022, 4, 1054–1070. [Google Scholar] [CrossRef]
  80. Walston, L.J.; Barley, T.; Bhandari, I.; Campbell, B.; McCall, J.; Hartmann, H.M.; Dolezal, A.G. Opportunities for Agrivoltaic Systems to Achieve Synergistic Food-Energy-Environmental Needs and Address Sustainability Goals. Front. Sustain. Food Syst. 2022, 6, 932018. [Google Scholar] [CrossRef]
  81. Ghosh, A. Nexus between Agriculture and Photovoltaics (Agrivoltaics, Agriphotovoltaics) for Sustainable Development Goal: A Review. Sol. Energy 2023, 266, 112146. [Google Scholar] [CrossRef]
  82. Jing, R.; Liu, J.; Zhang, H.; Zhong, F.; Liu, Y.; Lin, J. Unlock the Hidden Potential of Urban Rooftop Agrivoltaics Energy-Food-Nexus. Energy 2022, 256, 124626. [Google Scholar] [CrossRef]
  83. Gonocruz, R.A.; Nakamura, R.; Yoshino, K.; Homma, M.; Doi, T.; Yoshida, Y.; Tani, A. Analysis of the Rice Yield under an Agrivoltaic System: A Case Study in Japan. Environments 2021, 8, 65. [Google Scholar] [CrossRef]
  84. Irie, N.; Kawahara, N.; Esteves, A.M. Sector-Wide Social Impact Scoping of Agrivoltaic Systems: A Case Study in Japan. Renew. Energy 2019, 139, 1463–1476. [Google Scholar] [CrossRef]
  85. Bellini, E. Giant Agrivoltaic Project in China. Available online: https://www.pv-magazine.com/2020/09/03/giant-agrivoltaic-project-in-china/ (accessed on 26 November 2023).
  86. Jiang, S.; Tang, D.; Zhao, L.; Liang, C.; Cui, N.; Gong, D.; Wang, Y.; Feng, Y.; Hu, X.; Peng, Y. Effects of Different Photovoltaic Shading Levels on Kiwifruit Growth, Yield and Water Productivity under “Agrivoltaic” System in Southwest China. Agric. Water Manag. 2022, 269, 107675. [Google Scholar] [CrossRef]
  87. Kim, S.; Kim, S. Optimization of the Design of an Agrophotovoltaic System in Future Climate Conditions in South Korea. Renew. Energy 2023, 206, 928–938. [Google Scholar] [CrossRef]
  88. Pulipaka, S.; Peparthy, M.; Vorast, M.; Y.V.K., R. Agrivoltaics in India; Indo-German Energy Forum Support Office (IGEF-SO). National Solar Energy Federation of India (NSEFI): New Delhi, India, 2023. [Google Scholar]
  89. Giri, N.C.; Mohanty, R.C. Agrivoltaic System: Experimental Analysis for Enhancing Land Productivity and Revenue of Farmers. Energy Sustain. Dev. 2022, 70, 54–61. [Google Scholar] [CrossRef]
  90. Bhambhani, A. BayWa Completes Agrivoltaic Facility in the Netherlands. Available online: https://taiyangnews.info/baywa-completes-agrivoltaic-facility-in-the-netherlands/ (accessed on 26 November 2023).
  91. Ali Khan Niazi, K.; Victoria, M. Comparative Analysis of Photovoltaic Configurations for Agrivoltaic Systems in Europe. Prog. Photovolt. 2023, 31, 1101–1113. [Google Scholar] [CrossRef]
  92. First Agri-PV Research Facility for Apples in Germany. Available online: https://www.baywa-re.com/en/news/details/first-agri-pv-research-facility-for-apples-in-germany (accessed on 26 November 2023).
  93. Toledo, C.; Scognamiglio, A. Agrivoltaic Systems Design and Assessment: A Critical Review, and a Descriptive Model towards a Sustainable Landscape Vision (Three-Dimensional Agrivoltaic Patterns). Sustainability 2021, 13, 6871. [Google Scholar] [CrossRef]
  94. Bhambhani, A. Total Quadran to Explore Agrivoltaic Segment in France. Available online: https://taiyangnews.info/markets/total-quadran-to-explore-agrivoltaic-segment-in-france/ (accessed on 26 November 2023).
  95. pv magazine Cero Generation Achieves Financial Close for Its 70 MW Agrivoltaic Solar PV Project in Lazio, Italy. Available online: https://www.pv-magazine.com/press-releases/cero-generation-achieves-financial-close-for-its-70-mw-agrivoltaic-solar-pv-project-in-lazio-italy/ (accessed on 26 November 2023).
  96. Spaes, J. Agrivoltaics Prevail in France’s Tender for Innovative PV Technologies. Available online: https://www.pv-magazine.com/2021/01/05/agrivoltaics-prevail-in-frances-tender-for-innovative-pv-technologies/ (accessed on 26 November 2023).
  97. UMass Amherst Study Will Assess Impact of Dual-Use Solar-Agriculture Installations in Massachusetts. Available online: https://www.umass.edu/news/article/umass-amherst-study-will-assess-impact (accessed on 22 November 2023).
  98. Jack’s Solar Garden. Available online: https://www.jackssolargarden.com/the-vision (accessed on 22 November 2023).
  99. Kennedy, R. Jack’s Solar Garden Blends Agriculture, Solar Energy, and Community. Available online: https://pv-magazine-usa.com/2022/08/18/jacks-solar-garden-blends-agriculture-solar-energy-and-community/ (accessed on 22 November 2023).
  100. Sheep Join Forces with the Solar Industry. Available online: https://www.revisionenergy.com/solar-information/stories-inspiration/customer-profiles/solar-grazing-skowhegan (accessed on 26 November 2023).
  101. Fong, X. Sun-Raised Farms Is Changing the Sustainability Movement One Solar Panel and Furry Animal at a Time. Available online: https://qcexclusive.com/sun-raised-farms-is-changing-the-sustainability-movement-one-solar-panel-and-furry-animal-at-a-time/ (accessed on 26 November 2023).
  102. UMassAmherst. Center for Agriculture, Food, and the Environment. Clean Energy Extension. Dual-Use: Agriculture and Solar Photovoltaics. Available online: https://ag.umass.edu/sites/ag.umass.edu/files/fact-sheets/pdf/fs_-_dual-use_-_agriculture_and_solar_pv_012524_0.pdf (accessed on 26 November 2023).
  103. Sekiyama, T.; Nagashima, A. Solar Sharing for Both Food and Clean Energy Production: Performance of Agrivoltaic Systems for Corn, A Typical Shade-Intolerant Crop. Environments 2019, 6, 65. [Google Scholar] [CrossRef]
  104. Nakata, H.; Ogata, S. Integrating Agrivoltaic Systems into Local Industries: A Case Study and Economic Analysis of Rural Japan. Agronomy 2023, 13, 513. [Google Scholar] [CrossRef]
  105. Marrou, H.; Wery, J.; Dufour, L.; Dupraz, C. Productivity and Radiation Use Efficiency of Lettuces Grown in the Partial Shade of Photovoltaic Panels. Eur. J. Agron. 2013, 44, 54–66. [Google Scholar] [CrossRef]
  106. Valle, B.; Simonneau, T.; Sourd, F.; Pechier, P.; Hamard, P.; Frisson, T.; Ryckewaert, M.; Christophe, A. Increasing the Total Productivity of a Land by Combining Mobile Photovoltaic Panels and Food Crops. Appl. Energy 2017, 206, 1495–1507. [Google Scholar] [CrossRef]
  107. Willockx, B.; Research Group Energy and Automation Faculty of Engineering Technology, KU Leuven. Ghent. Belgium; Herteleer, B.; Cappelle, J. Combining Photovoltaic Modules and Food Crops: First Agrivoltaic Prototype in Belgium. Renew. Energy Power Qual. J. 2020, 18, 266–271. [Google Scholar] [CrossRef]
  108. Trommsdorff, M.; Kang, J.; Reise, C.; Schindele, S.; Bopp, G.; Ehmann, A.; Weselek, A.; Högy, P.; Obergfell, T. Combining Food and Energy Production: Design of an Agrivoltaic System Applied in Arable and Vegetable Farming in Germany. Renew. Sustain. Energy Rev. 2021, 140, 110694. [Google Scholar] [CrossRef]
  109. AL-agele, H.A.; Proctor, K.; Murthy, G.; Higgins, C. A Case Study of Tomato (Solanum Lycopersicon Var. Legend) Production and Water Productivity in Agrivoltaic Systems. Sustainability 2021, 13, 2850. [Google Scholar] [CrossRef]
  110. Potenza, E.; Croci, M.; Colauzzi, M.; Amaducci, S. Agrivoltaic System and Modelling Simulation: A Case Study of Soybean (Glycine max L.) in Italy. Horticulturae 2022, 8, 1160. [Google Scholar] [CrossRef]
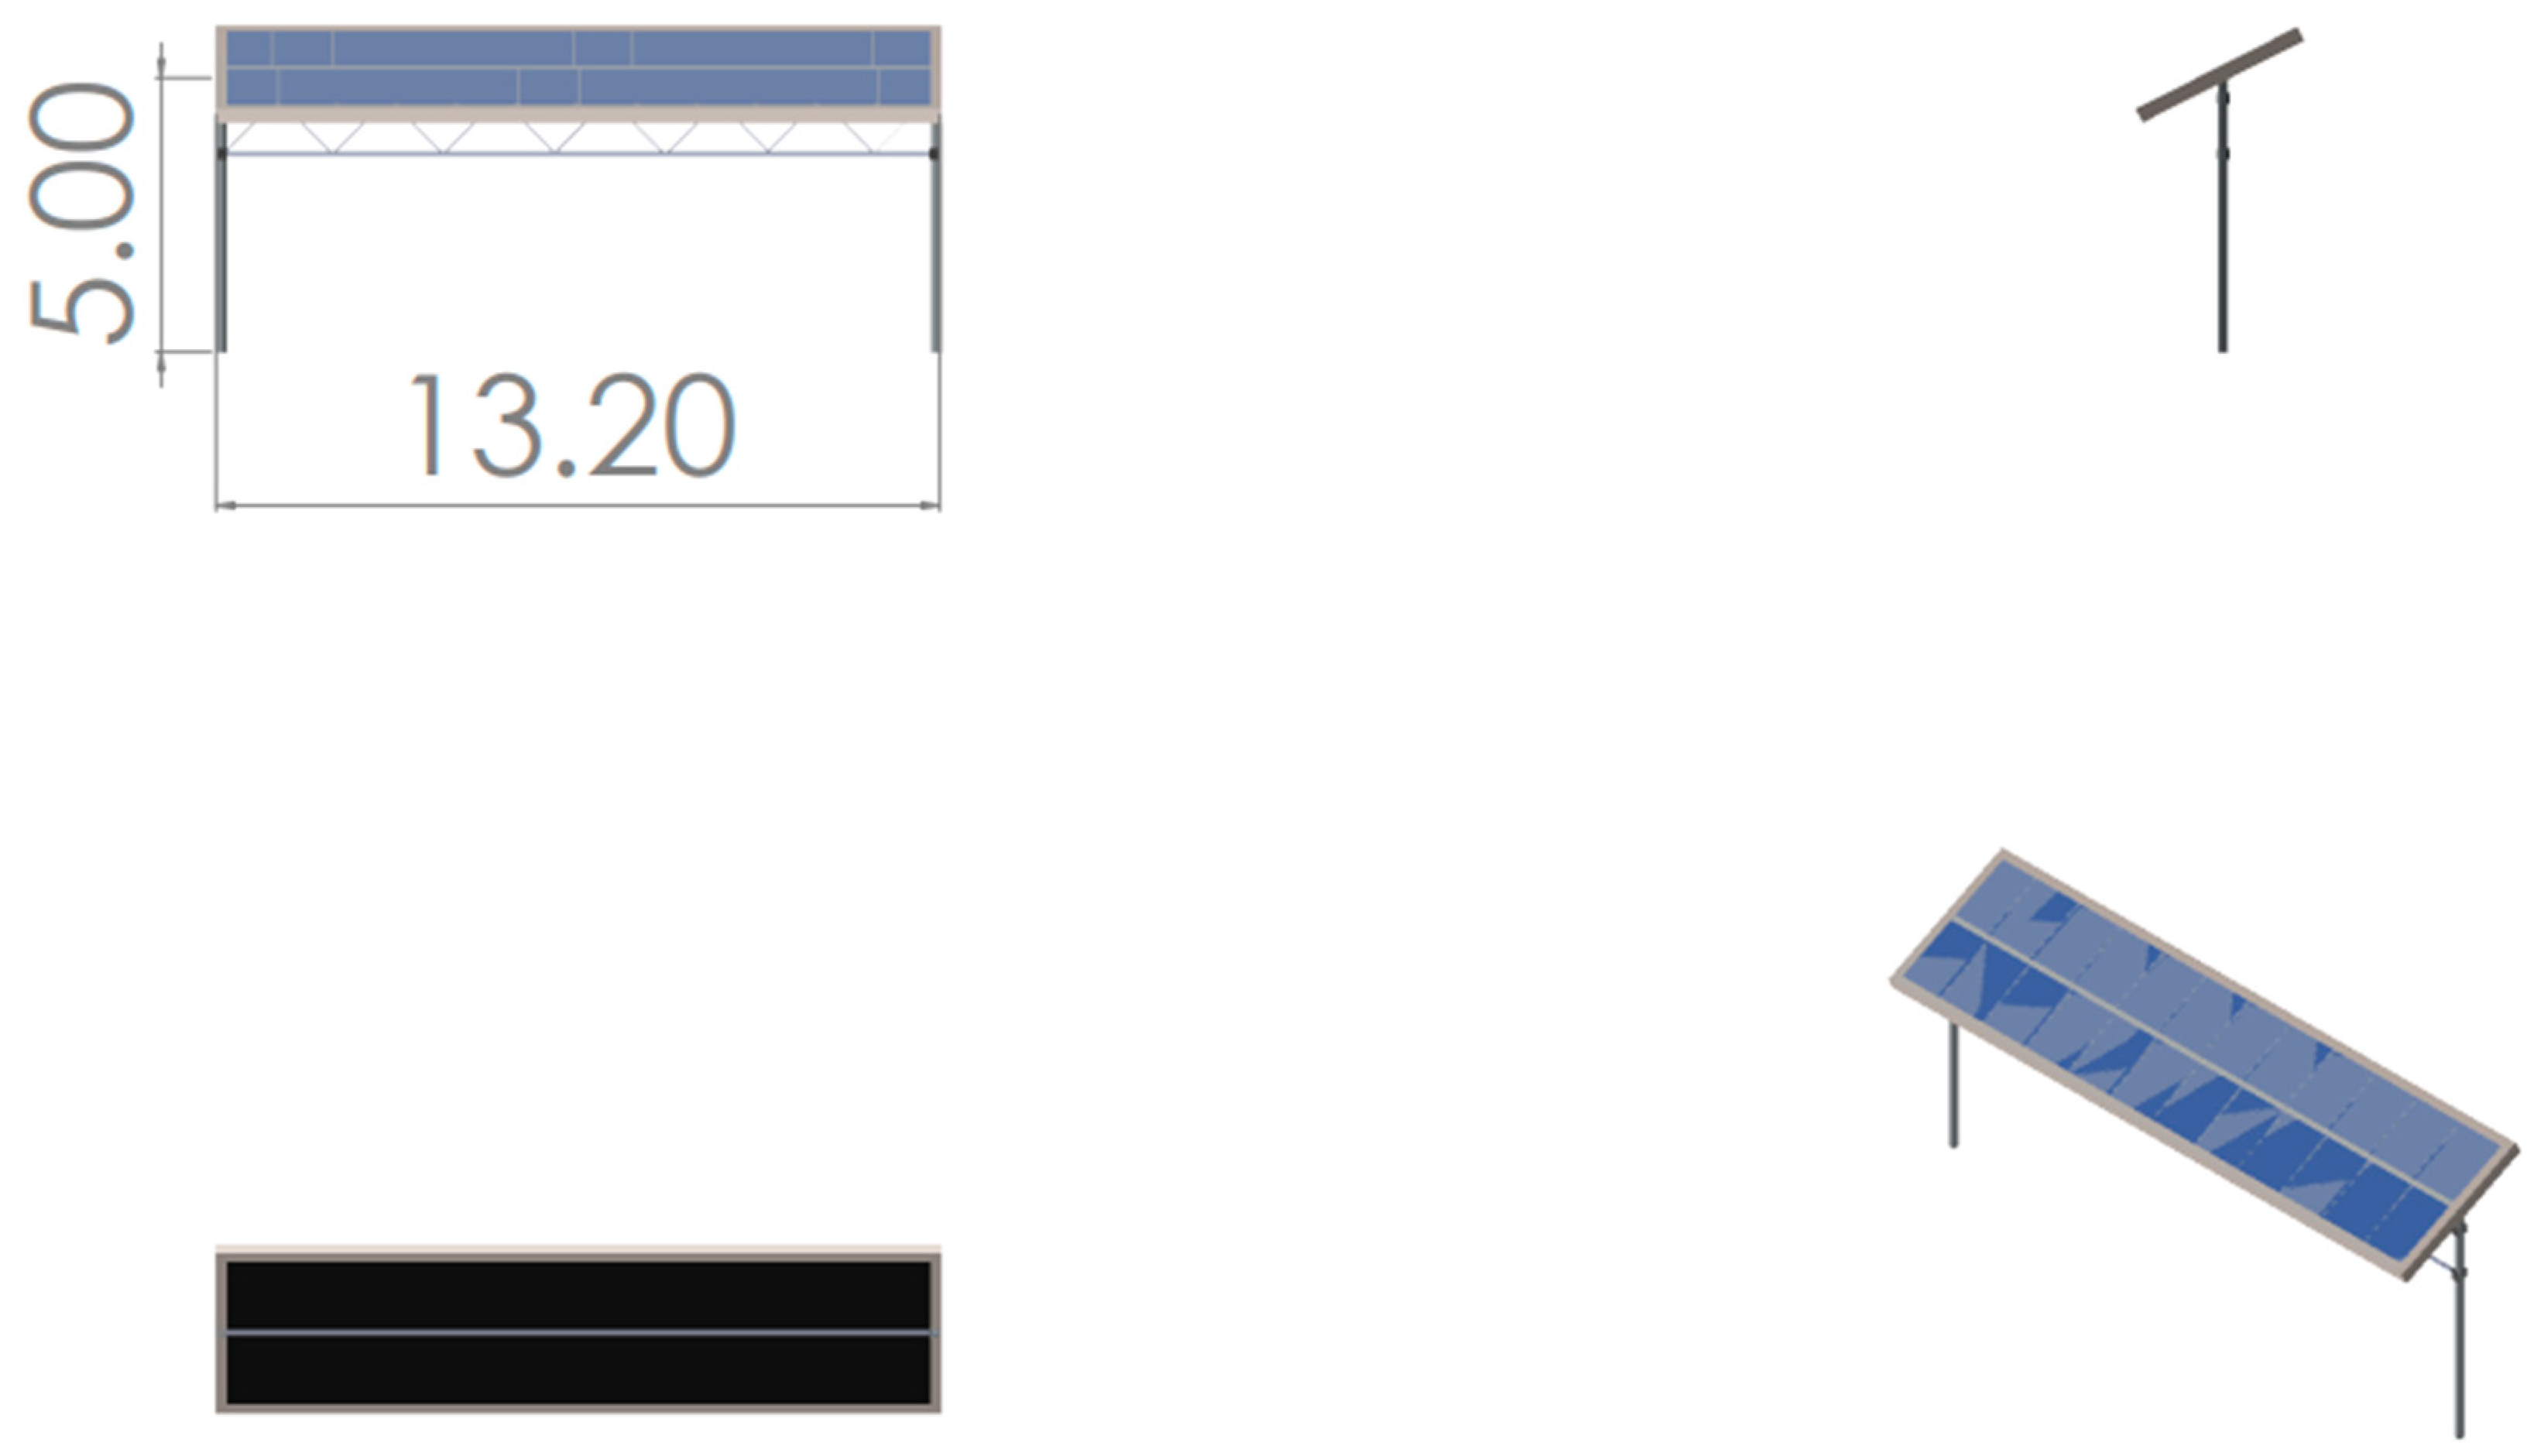
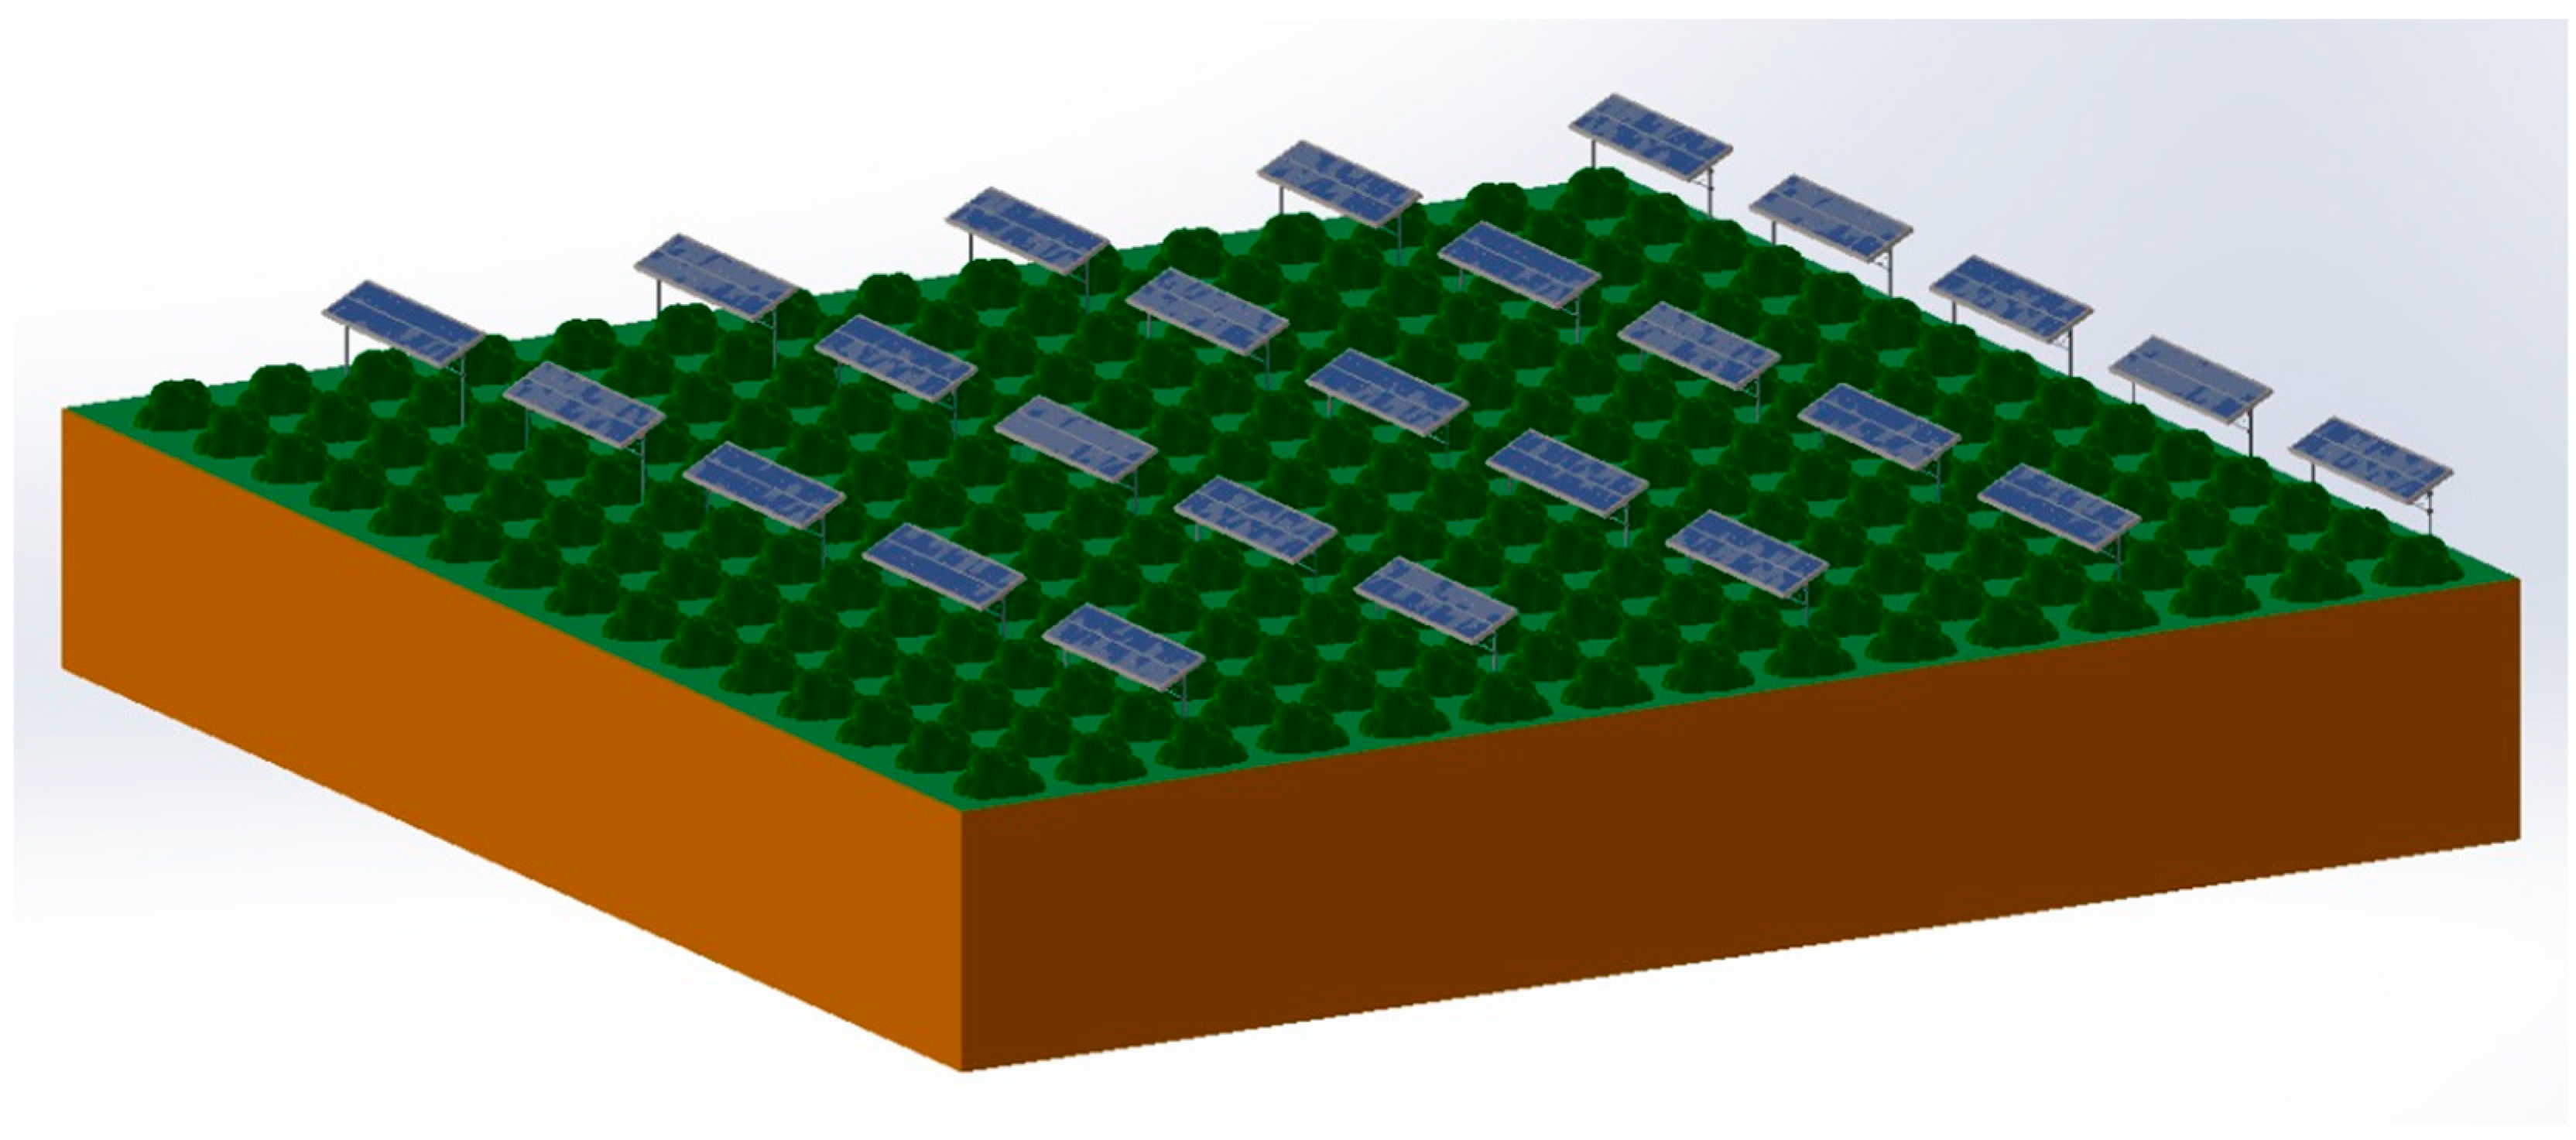
Figure 1. Basic layout of a single solar PV shed on an agrivoltaic farm. Source: The result of the authors’ calculations using SOLIDWORKS® 2022 and Table 1 (2024) data.
Sustainability 16 02325 g001
Figure 2. Solar PV sheds on an agrivoltaic apple farm. Source: The result of the authors’ calculations using SOLIDWORKS® 2022 and Table 1 (2024) data.
Sustainability 16 02325 g002
Figure 3. Change in output means across range of input values, regarding NPV. Source: own calculation (2024).
Sustainability 16 02325 g003
Figure 4. Correlation coefficients (Spearman rank) of the influence of analyzed input and output data on the NPV. Source: own calculation (2024).
Sustainability 16 02325 g004
Figure 5. Regression coefficients of the influence of analyzed input and output data on the NPV. Source: own calculation (2024).
Sustainability 16 02325 g005
Figure 6. The summary of the Monte Carlo simulations regarding the value of NPV. Source: own calculation (2024).
Sustainability 16 02325 g006
Figure 7. Change in outputs means across a range of input values, regarding the unit cost of apple production. Source: own calculation (2024).
Sustainability 16 02325 g007
Figure 8. Correlation coefficients (Spearman rank) of the effects of the analyzed input and output data on the unit cost of apple production. Source: own calculation (2024).
Sustainability 16 02325 g008
Figure 9. Regression coefficients of the effects of the analyzed input and output data on the unit cost of apple production. Source: own calculation (2024).
Sustainability 16 02325 g009
Figure 10. The summary of the Monte Carlo simulations regarding the value of unit cost. Source: own calculation (2024).
Sustainability 16 02325 g010
Figure 11. Mean change in outputs across a range of input values regarding unit cost (EUR/Nm3). Source: own calculations (2024).
Sustainability 16 02325 g011
Figure 12. Correlation coefficients (Spearman rank) of the effects of analyzed input and output data on the unit cost. Source: own calculations (2024).
Sustainability 16 02325 g012
Figure 13. Regression coefficients of the effects of analyzed input and output data on the unit cost. Source: own calculations (2023).
Sustainability 16 02325 g013
Figure 14. The summary of the Monte Carlo simulations regarding the value of unit cost. Source: own calculations (2023).
Sustainability 16 02325 g014
Table 1. Project overview.
APV ShedBasic APV Shed
Area (ha)42 * Basic APV Shed (kWp)251.12 *
Length (m)1.64 * Basic APV Shed (width)26 1
Width (m)1 1 Basic APV Shed (length)106 1
Weight (kg) of PV18.2 1 Basic APV Shed (Area ha)0.2756 *
Area of each panel (m2)1.64 *Total N° APV Shed239 *
Design of apple treekWp/ha 911.16 *
Height of structures (m)5 1 PV capacity installed in each of the seven
6 ha plots (kWp/plots)
5467 *
AVS width over the apple row (m)1.7 1 Number of PV models866 *
Space within rows (m)1 1 The overall module surface area (m2) 866 *
Row to row distance (m)3.6 1 GCR 31% *
Available space for PV system within rows2.6 * kW plant capacity 5467 *
Note: 1 [10,59,60,61,62], * Own calculation.
Table 2. Basic economic data for the proposed PV system in Hungary (2023).
IndicatorsValue
Investment cost (CAPEX) (EUR)23,386,364
FIT price (EUR/kWh)0.087
Sunshine hours per year2000
Efficiency compared to the previous year (%)99
Annual maintenance and repair (EUR/kW/year)2.1
Annual insurance and video surveillance (EUR/kW/year)1.8
Annual internet fee (EUR/kW/year)0.8
Source: [60].
Table 3. Basic data for a super-intensive apple orchard in Hungary (2023).
IndicatorsValue
Investment cost (CAPEX) (EUR/ha)41,885
Cash flow in the 2nd year (revenue − cost) (EUR/ha)−1047
Cash flow in the 3rd year (revenue − cost) (EUR/ha)−262
Average yield in the mature state (from the 4th year) (t/ha/year)57.5
Ratio of apple for consumption purposes (%)90
Yield (class I and II) (t/ha/year)51.75
Yield (industrial, juice apple) (t/ha/year)5.75
Price (class I and II) (EUR/t)288
Price (industrial, juice apple) (EUR/t)105
Subsidy (Single area payment scheme) (EUR/ha/year)183
Direct production cost (EUR/ha/year)11,518
OPEX (direct production cost without depreciation) (EUR/ha/year)7853
Source: own data collection based on expert opinion and [40,44].
Table 4. Intervals and distribution types of indicators and market factors used in the simulation.
IndicatorsIntervals Used in the SimulationA Short Explanation of the ValueType of Distribution
Investment analysis
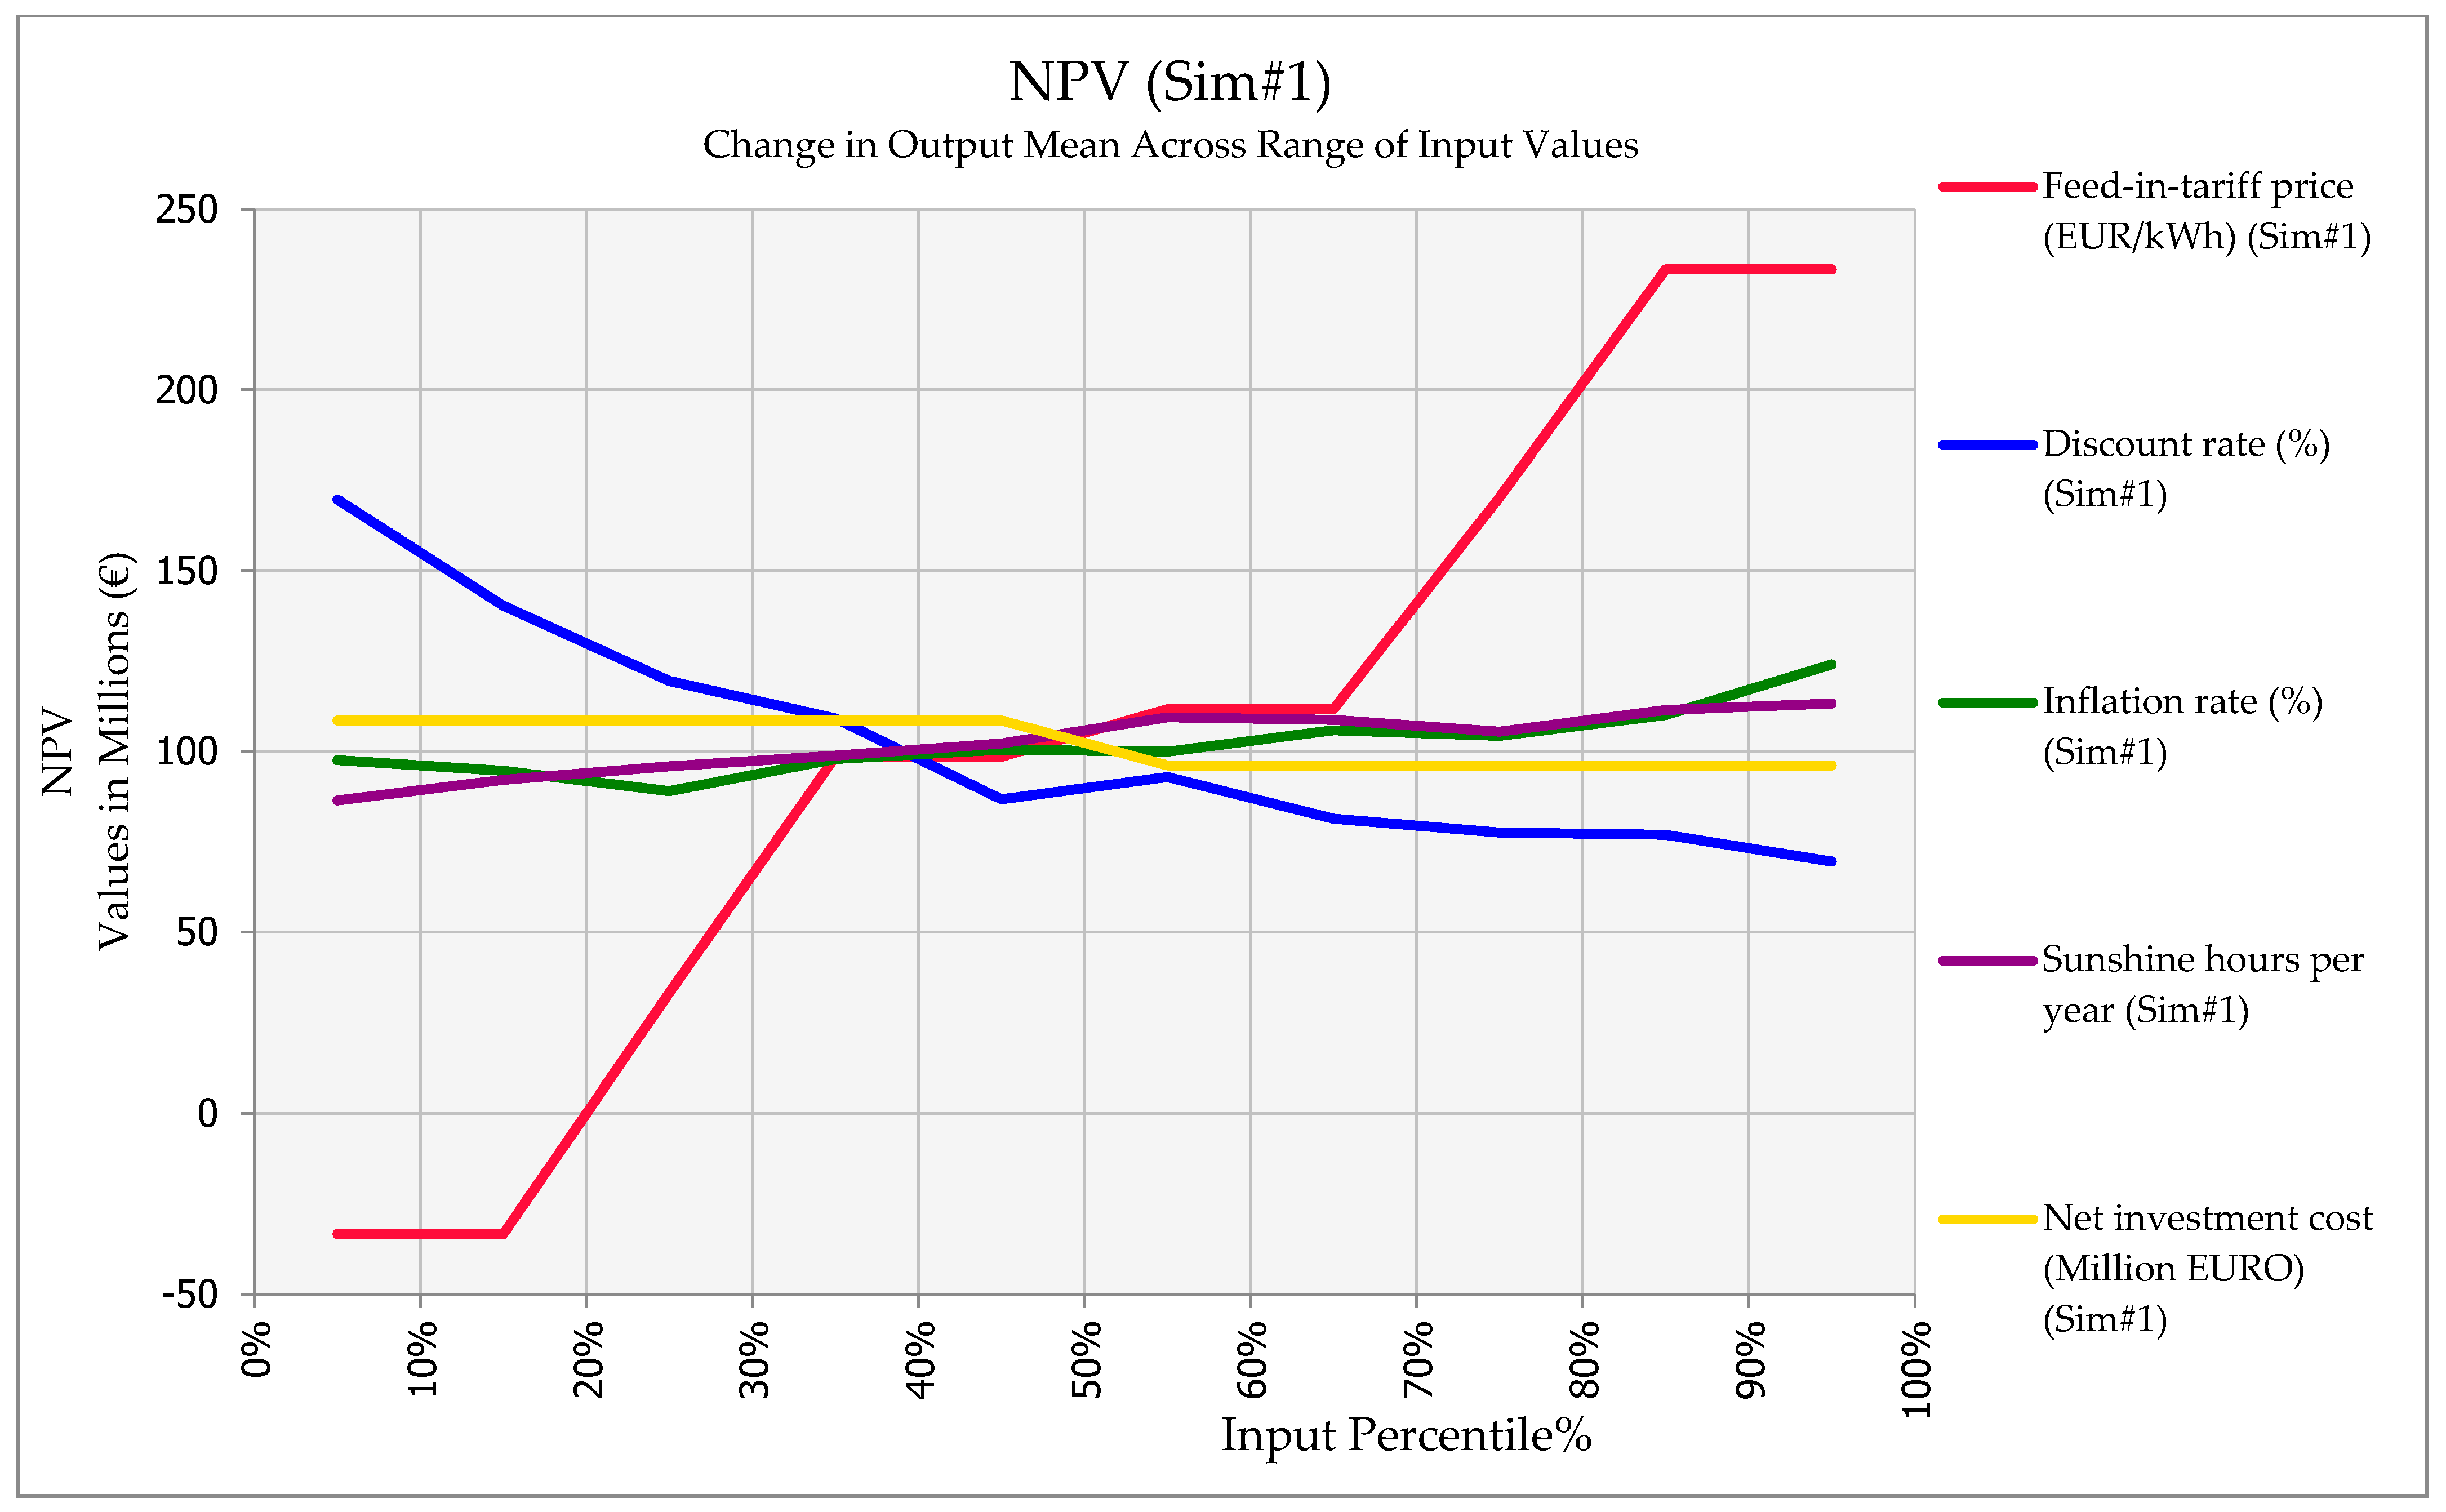
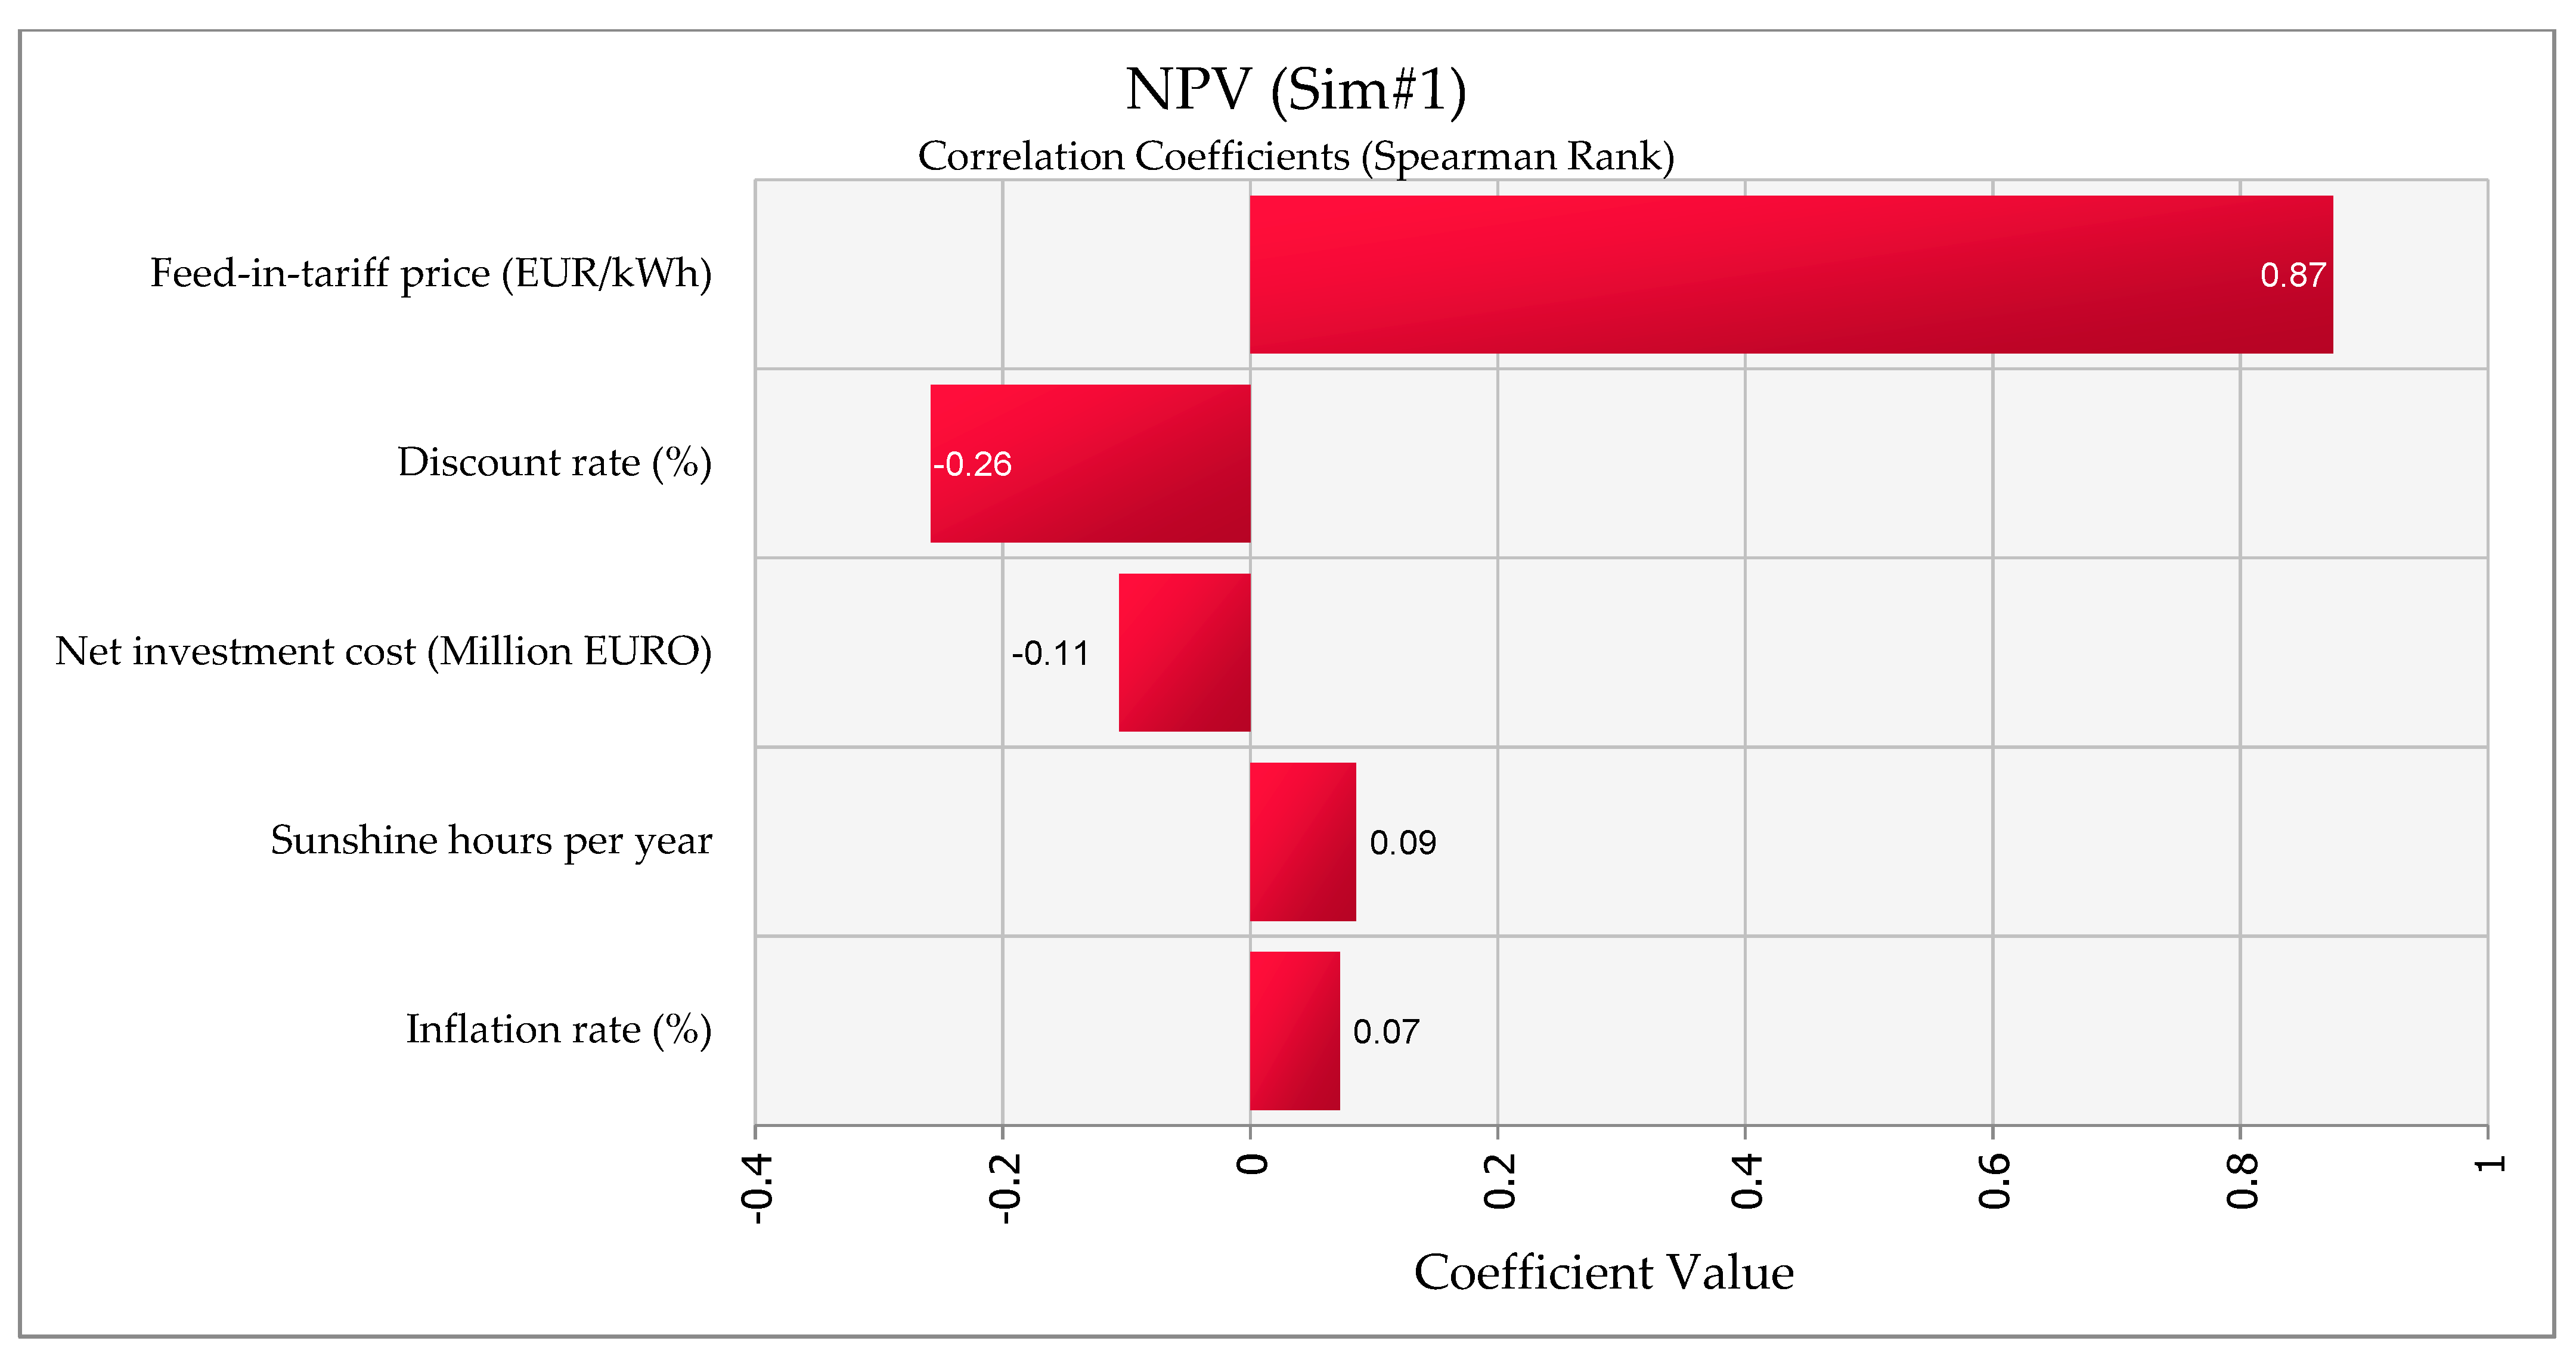
Net investment cost of PV system (million EUR)14–23.4Subsidized (40%): EUR 14 million (by the current Hungarian tender), non-subsidized: EUR 23.4 million.Discrete uniform distribution
FIT prices (EUR/kWh)0–0.08–0.087–0.16Electricity prices may drop to zero or negative due to factors like surplus renewable energy, changing demand or supply conditions, grid constraints, and government policies. Large-scale storage of electricity cannot be economically stored. Discrete uniform distribution
Sunshine hours per year1700–2000–2300Hungarian geographical conditions [67,68] Triangle distribution
Discount rate (%)0–6.8–8Hungary’s discount rate range (0% to 6.8% to 8%) is influenced by the current 6.8% yield on 20-year government debt. The upper limit of 8% is considered as a ceiling.Triangle distribution
Inflation rate (%)3–4–6Current core inflation in Hungary (6%) is expected to decrease significantly to 4% in the short term and around 3% in the long term [69].Triangle distribution
Yield of apple in mature state (t/ha)45–57.5–65sourced from expert opinions and references [40,44]Truncated normal distribution
Ratio of apple for consumption purposes (%)80–90–95sourced from expert opinions and references [40,44]Truncated normal distribution
Table 5. Investment analysis for agrivoltaics project in apple plantation.
Financial Planning: Expenditures and Revenues
(Unit of Measurement: Thousand EUR):
Investment
Year
Operational Years
2023202420262038203920462053
1. Capital Expenditure (CAPEX) for PV System23,386
2. CAPEX for Apple Plantation1759
3. CAPEX after 15 Years for New Apple Plantation- 3168
4. Annual Operating Expenses (OPEX)
Operation and Maintenance costsPV System-180198354375567889
Apple-443575710782845
Total Annual OPEX-22455592537513481735
5. Annual Revenues
Outputs and revenuesPV Energy Generated-65926988991710,21112,52415,361
Apple-07131490023742668
Total Annual Revenues-6592770111,40710,21114,89818,029
Corporate Tax 4924987295199251146
Annual CF (after taxpaying)−25,146587659358263614910,52612,481
(Cumulative) Discount Factors (DF) 1.0681.2192.6942.8784.5707.258
Discounted Cash Flow (DCF)−25,14655004868306721362,2431720
Cumulative Discounted Cash Flow (CDCF)−25,146−19,645−945536,46438,60156,64870,157
Source: authors’ own calculation (2024).
Table 6. Descriptive statistics of the simulated output variables.
Output VariablesMeanVarianceStandard DeviationCoefficient of Variation (%)
NPV102.6 (Million EUR)11,114,267,648.2105.4 (Million EUR)102.77
UCa2027 170.58 (EUR/t)49,927.84223.45 (EUR/t)130.99
UCe20250.0128 (EUR/kWh)0.00030.0161 (EUR/kWh)126.08
Legend: UCa2027—the unit cost of apples in 2027 (first harvest year); UCe2025—the unit cost of electricity in 2025 (first year of operation).
Table 7. Unit costs of electricity and apple production.
Years202420262038203920402053
Total production cost (EUR)1,120,6661,452,0531,822,2061,271,5341,375,8702,631,363
Share of electricity in revenues1.000.910.871.001.000.85
Share of apples in revenues0.000.090.130.000.000.15
Production cost of electricity (EUR)1,120,6661,317,6821,584,2431,271,5341,375,8702,242,002
Production cost of apples (EUR)0134,371237,96200389,361
Unit cost of electricity (EUR/kWh)0.0150.0180.0240.0200.0210.040
Unit cost of apples (EUR/t)0569900161
Unit cost of electricity in PV (without apples, EUR/kWh)0.0130.0130.0170.0180.0180.029
Unit cost of apples (without PV, EUR/t)019628500399
Source: authors’ calculation.
Disclaimer/Publisher’s Note: The statements, opinions and data contained in all publications are solely those of the individual author(s) and contributor(s) and not of MDPI and/or the editor(s). MDPI and/or the editor(s) disclaim responsibility for any injury to people or property resulting from any ideas, methods, instructions or products referred to in the content.

