
Unveiling the Coupling Coordination and Interaction Mechanism between the Local Heat Island Effect and Urban Resilience in China

 ,
, 
Abstract
1. Introduction
2. Materials and Methods
2.1. Study Area
2.2. Methodology
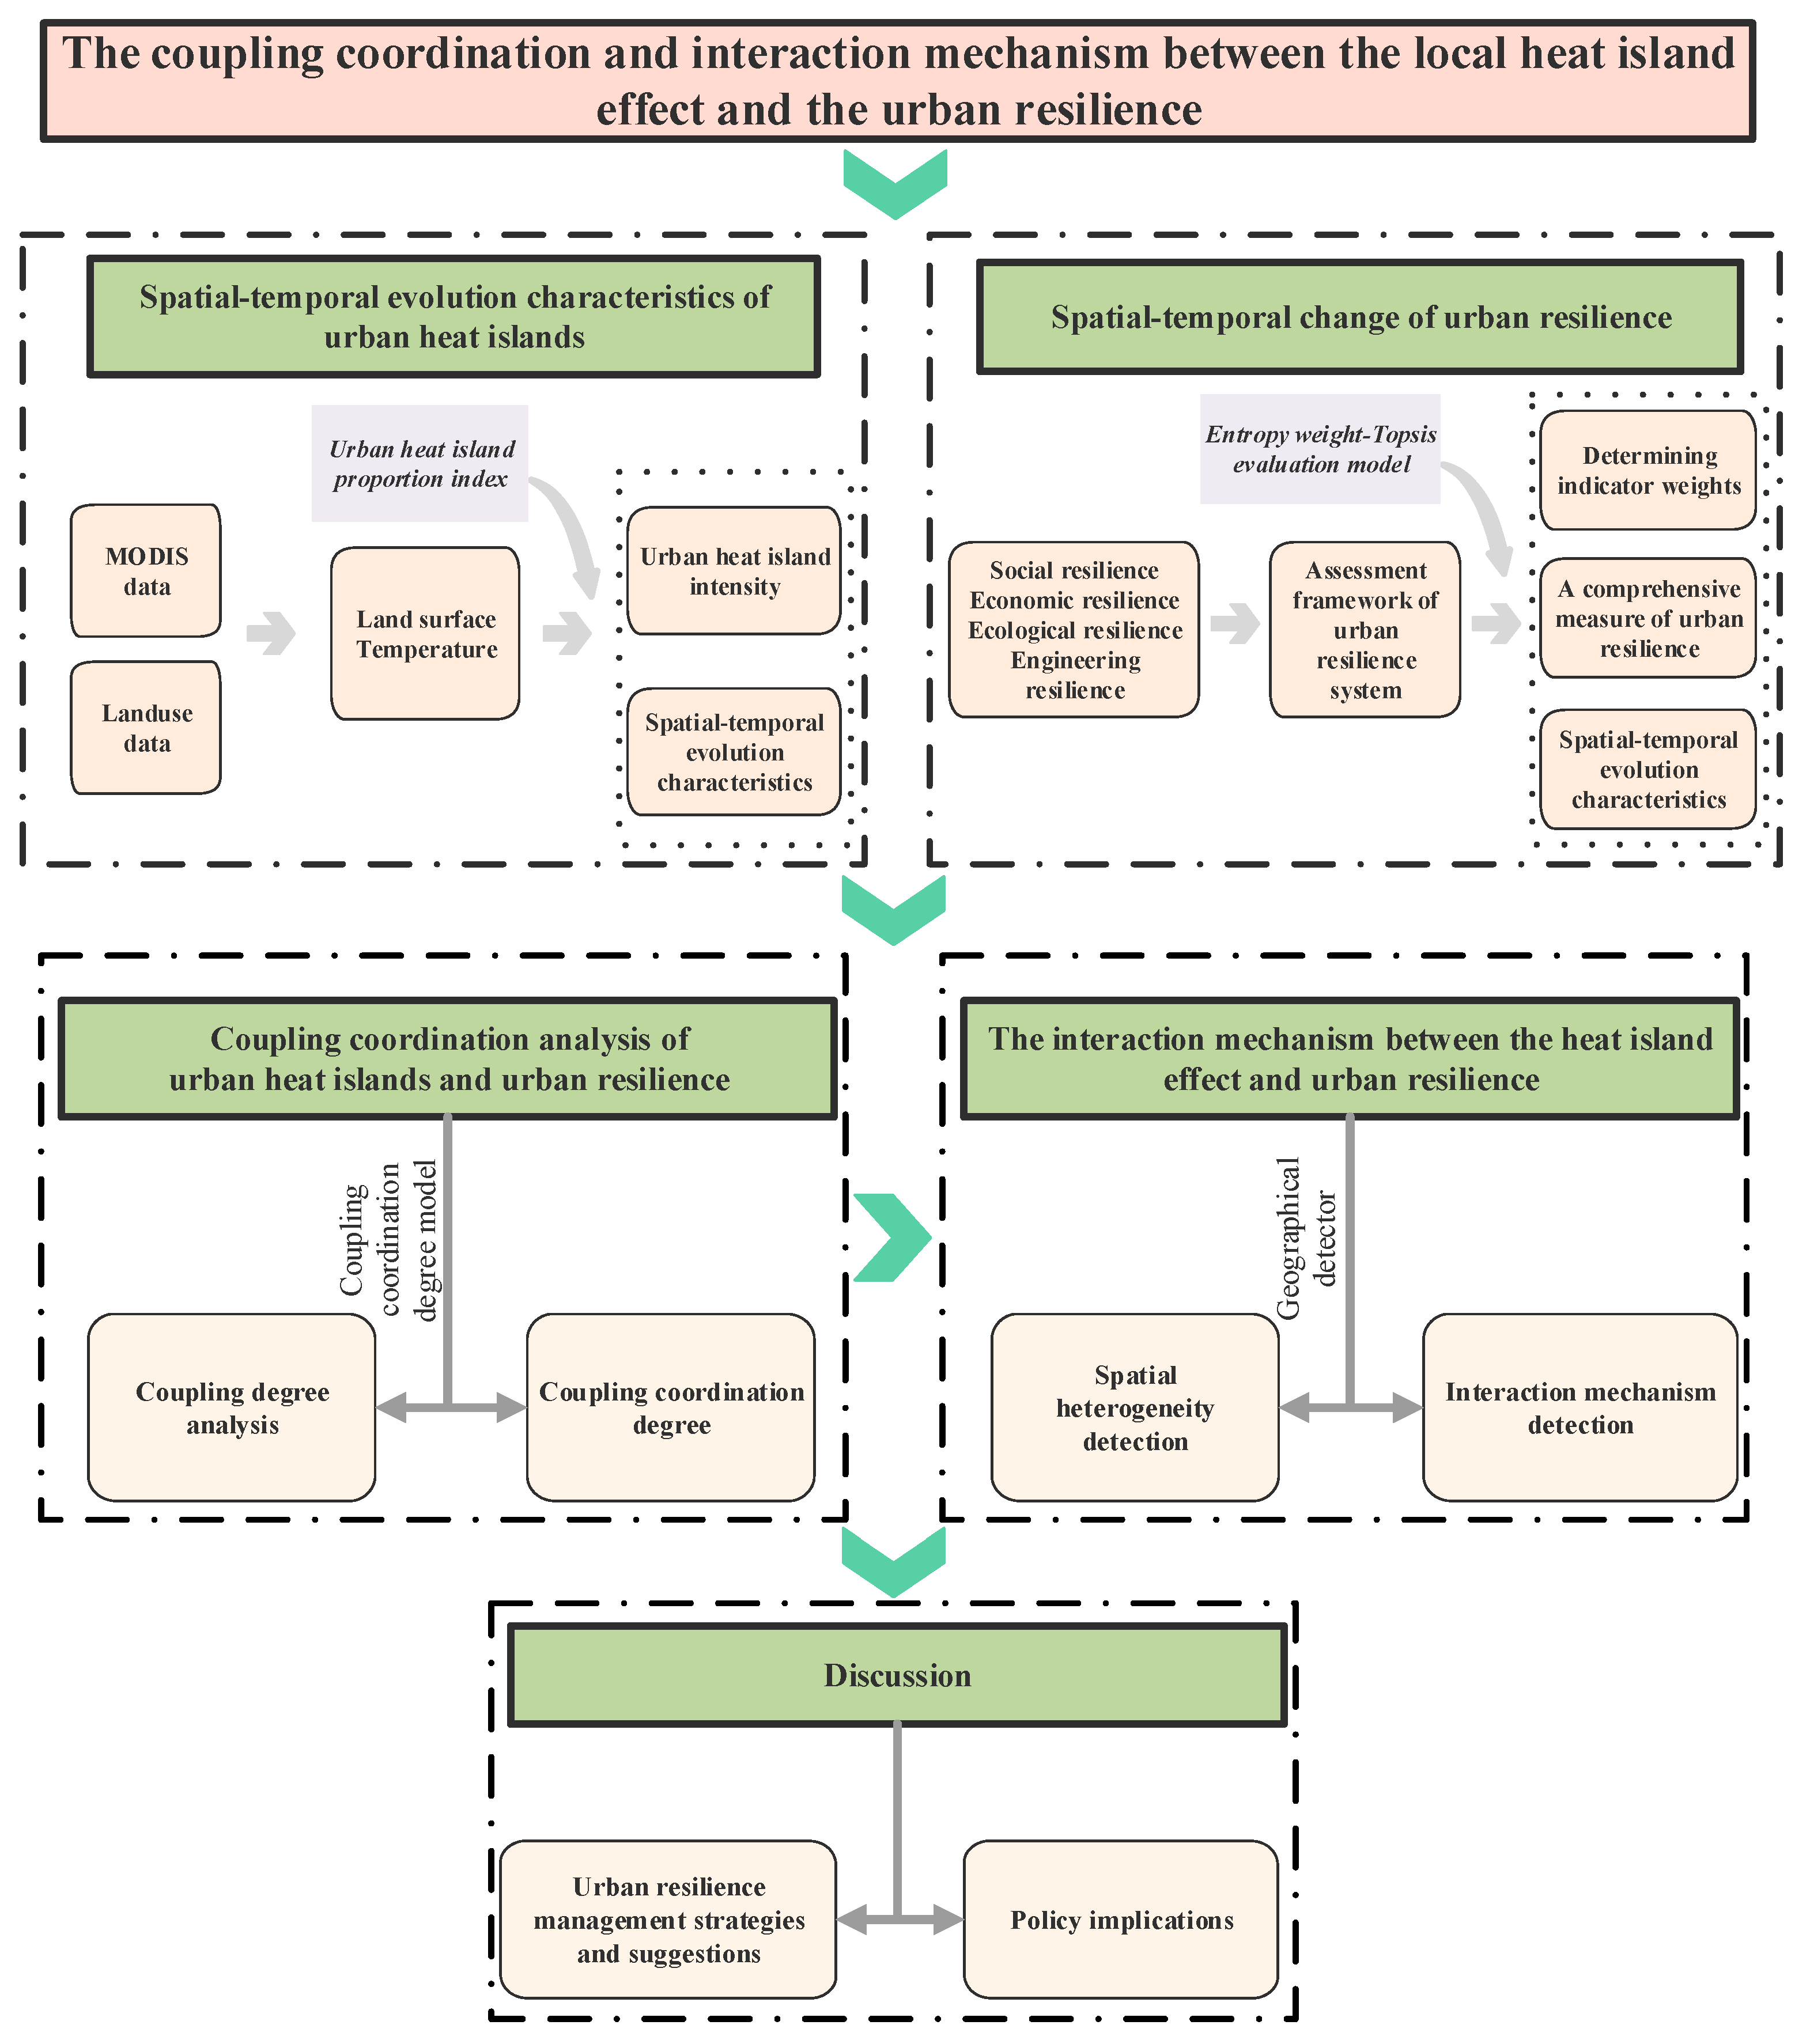
2.2.1. Methodological Framework
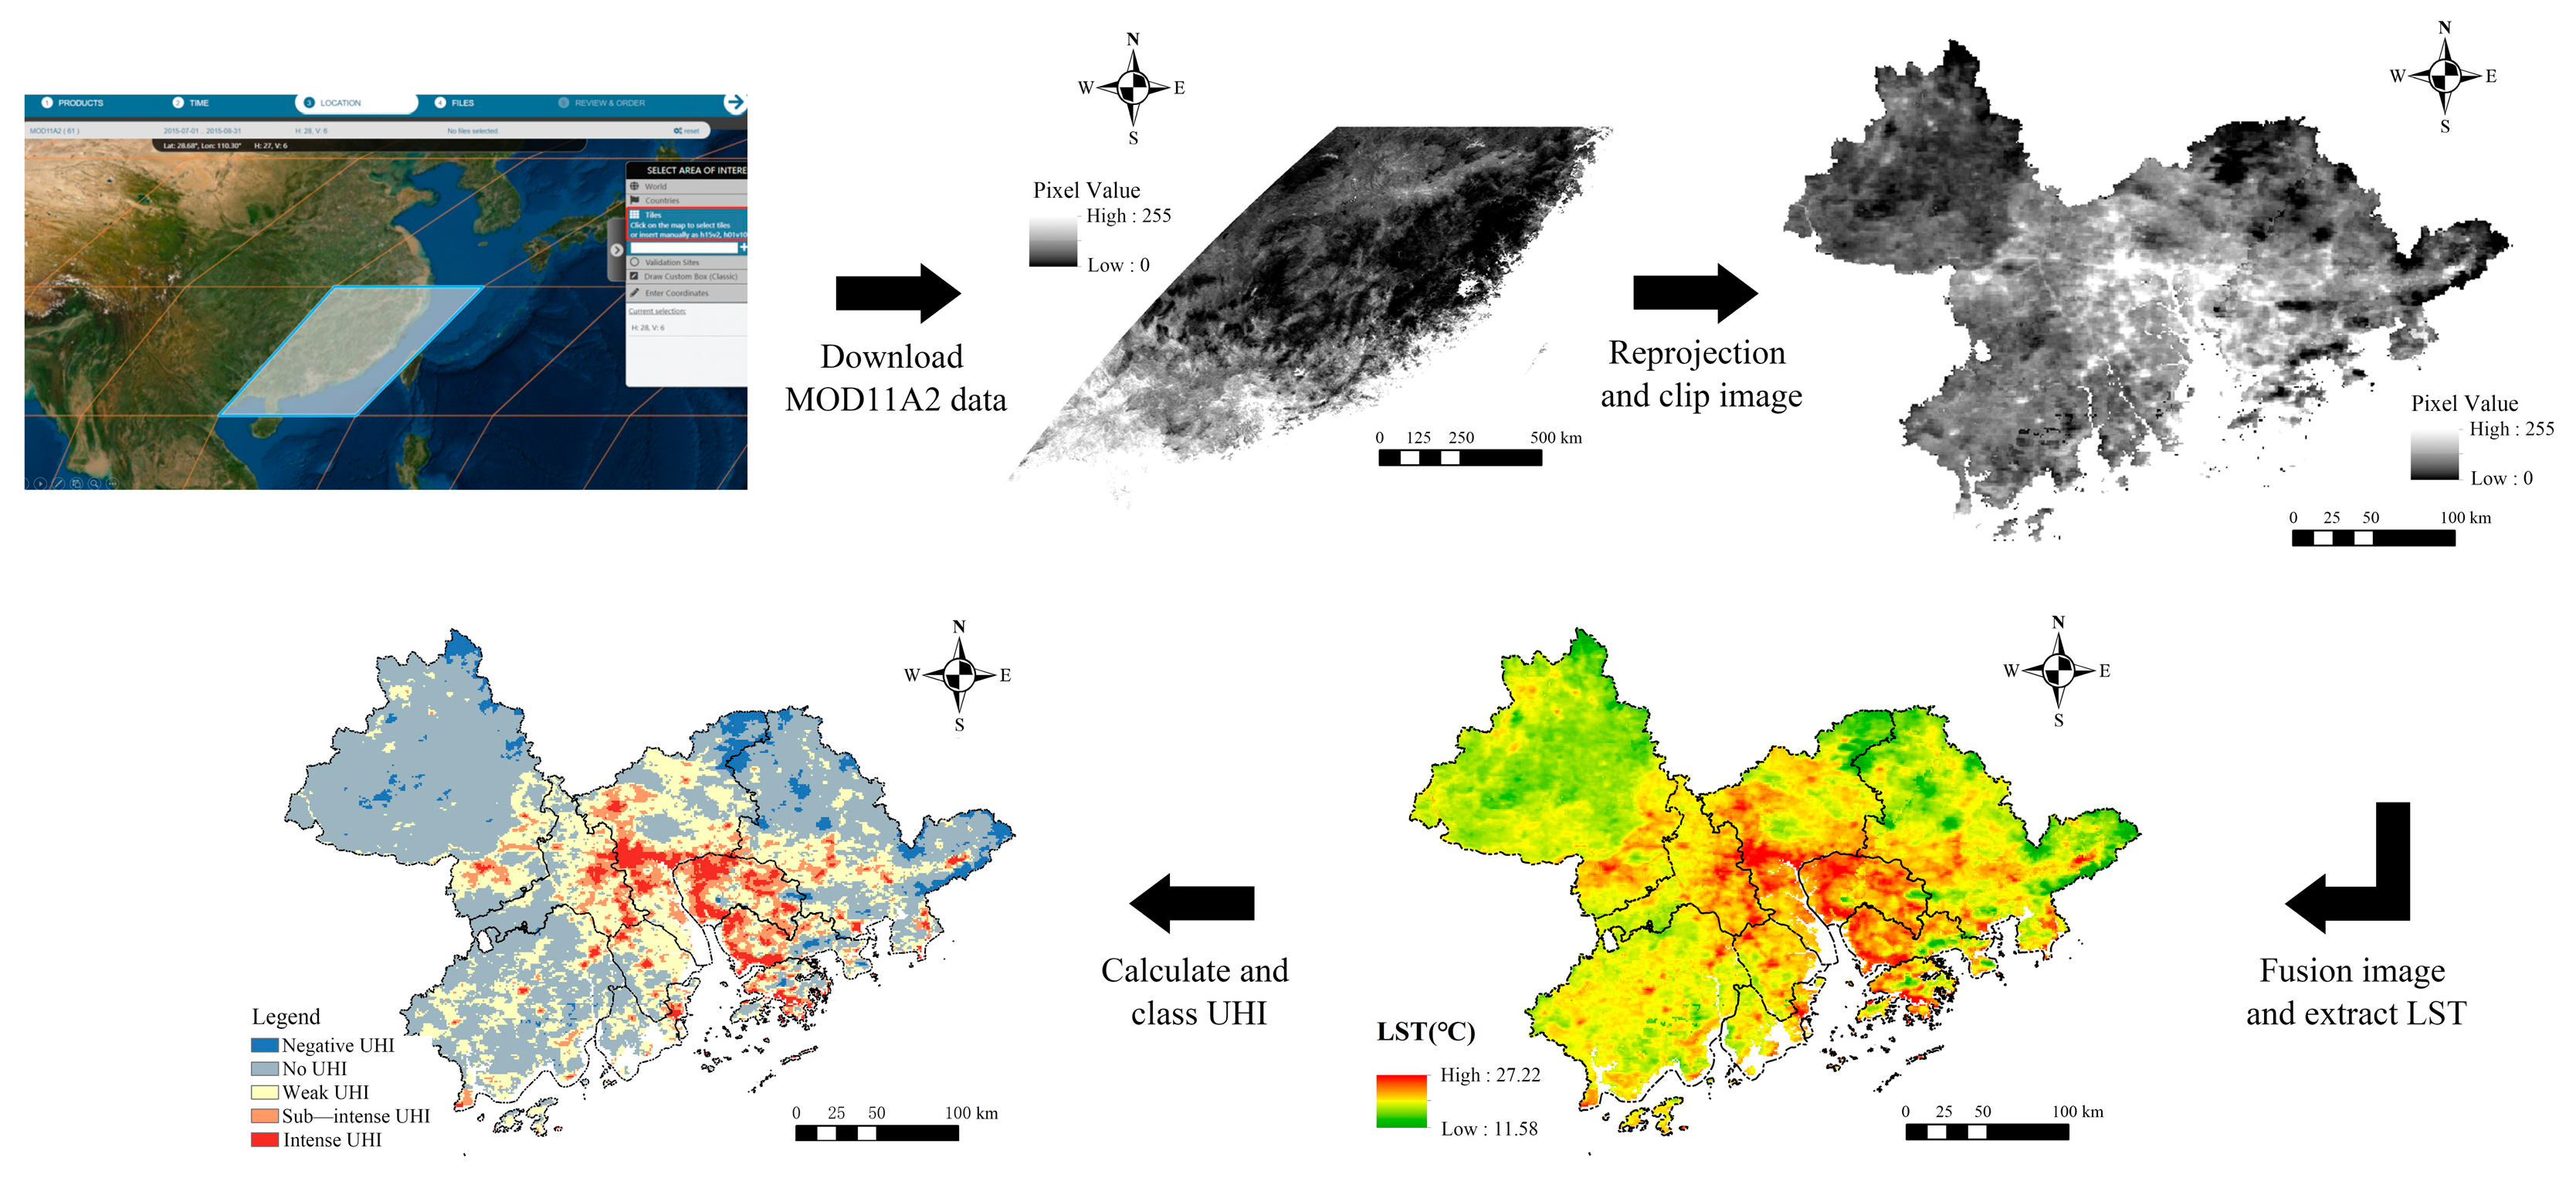
2.2.2. Measuring Urban Heat Islands
2.2.3. Indicator System Construction

| Criteria Layer | Indicator Layer | Indicator Attributes | Contents | References |
|---|---|---|---|---|
| Social Resilience (SR) | X1: Population density | Person/km2 (+) | Population distribution | [60] |
| X2: Number of college students per 1000 people | Person/1000 people (+) | Individuals’ ability to cope with risk | [59] | |
| X3: Number of people employed in the tertiary industry in the city | Person (+) | Social service capacity | [59,61] | |
| X4: Number of patent applications | Items (+) | Future productivity of society | [63] | |
| X5: Year-end urban registered unemployment rate | % (−) | Social stability capacity | [59] | |
| Economic Resilience (ENR) | X6: Gross regional product per capita | CNY (+) | Per capita economic strength | [53,60] |
| X7: Share of tertiary industry in GDP | % (+) | Industrial structure optimization level | [60,64] | |
| X8: Per capita disposable income of urban residents | CNY (+) | Per capita consumption capacity | [64] | |
| X9: Total import and export value | Billion USD (+) | Economic trade capacity | [60] | |
| X10: Local general public budget revenue | Billion CNY (+) | Local government financial strength | [65] | |
| Ecological Resilience (ELR) | X11: Industrial wastewater emissions | 10,000 t (−) | The disturbance power of industrial emissions to the city | [64] |
| X12: Industrial soot emissions | t (−) | [60,64] | ||
| X13: Industrial sulfur dioxide emissions | t (−) | [60] | ||
| X14: Harmless disposal rate of domestic waste | % (+) | The city’s power to deal with industrial waste | [63] | |
| X15: Comprehensive utilization rate of industrial solid waste (%) | % (+) | [60,65] | ||
| X16: Greening coverage rate of the jurisdiction (%) | % (+) | Self-purification capacity of the city | [60,66] | |
| Engineering Resilience (EGR) | X17: Per capita water consumption | t (−) | Energy consumption capacity of residents | [63] |
| X18: Electricity consumption per capita | kwh (−) | [63] | ||
| X19: LPG consumption per capita | t (−) | [60,67,68] | ||
| X20: Road area per capita | m²/person (+) | Degree of infrastructure improvement | [59] | |
| X21: Number of public buses per 10,000 people | Vehicles/10,000 people (+) | [65] |
2.2.4. Entropy-Weight-TOPSIS Evaluation Model
2.2.5. Spatial Autocorrelation Analysis Method
2.2.6. Coupling Coordination Degree Model
2.2.7. Geographic Probe Model
2.3. Data Sources
3. Results
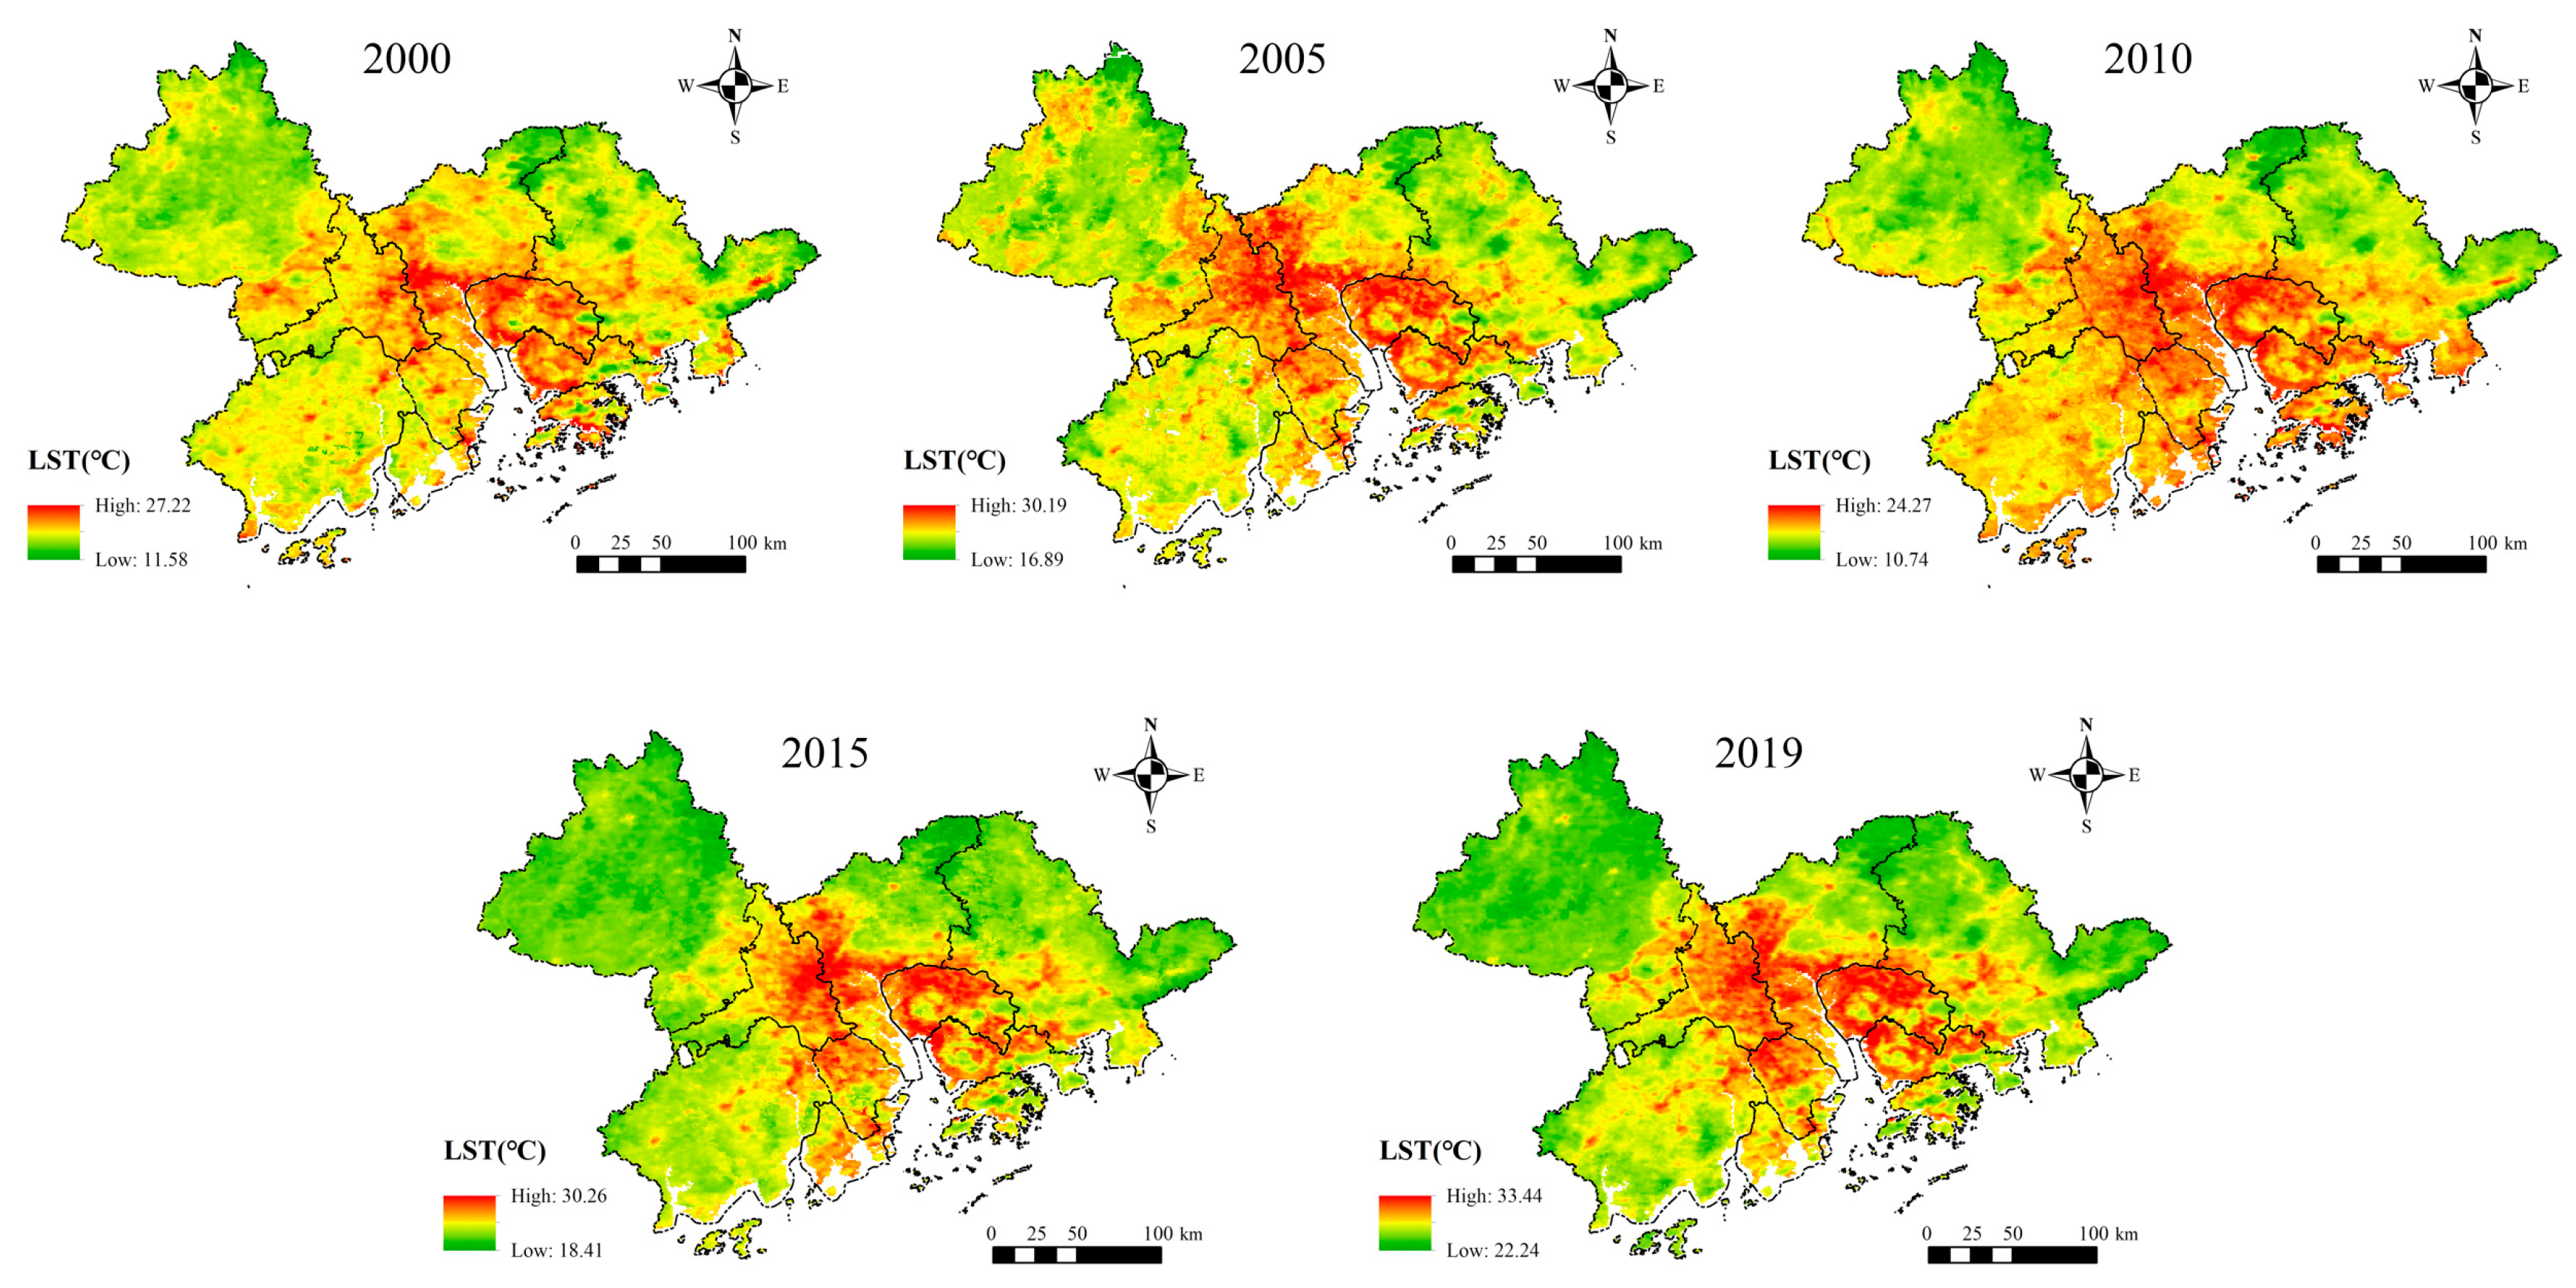
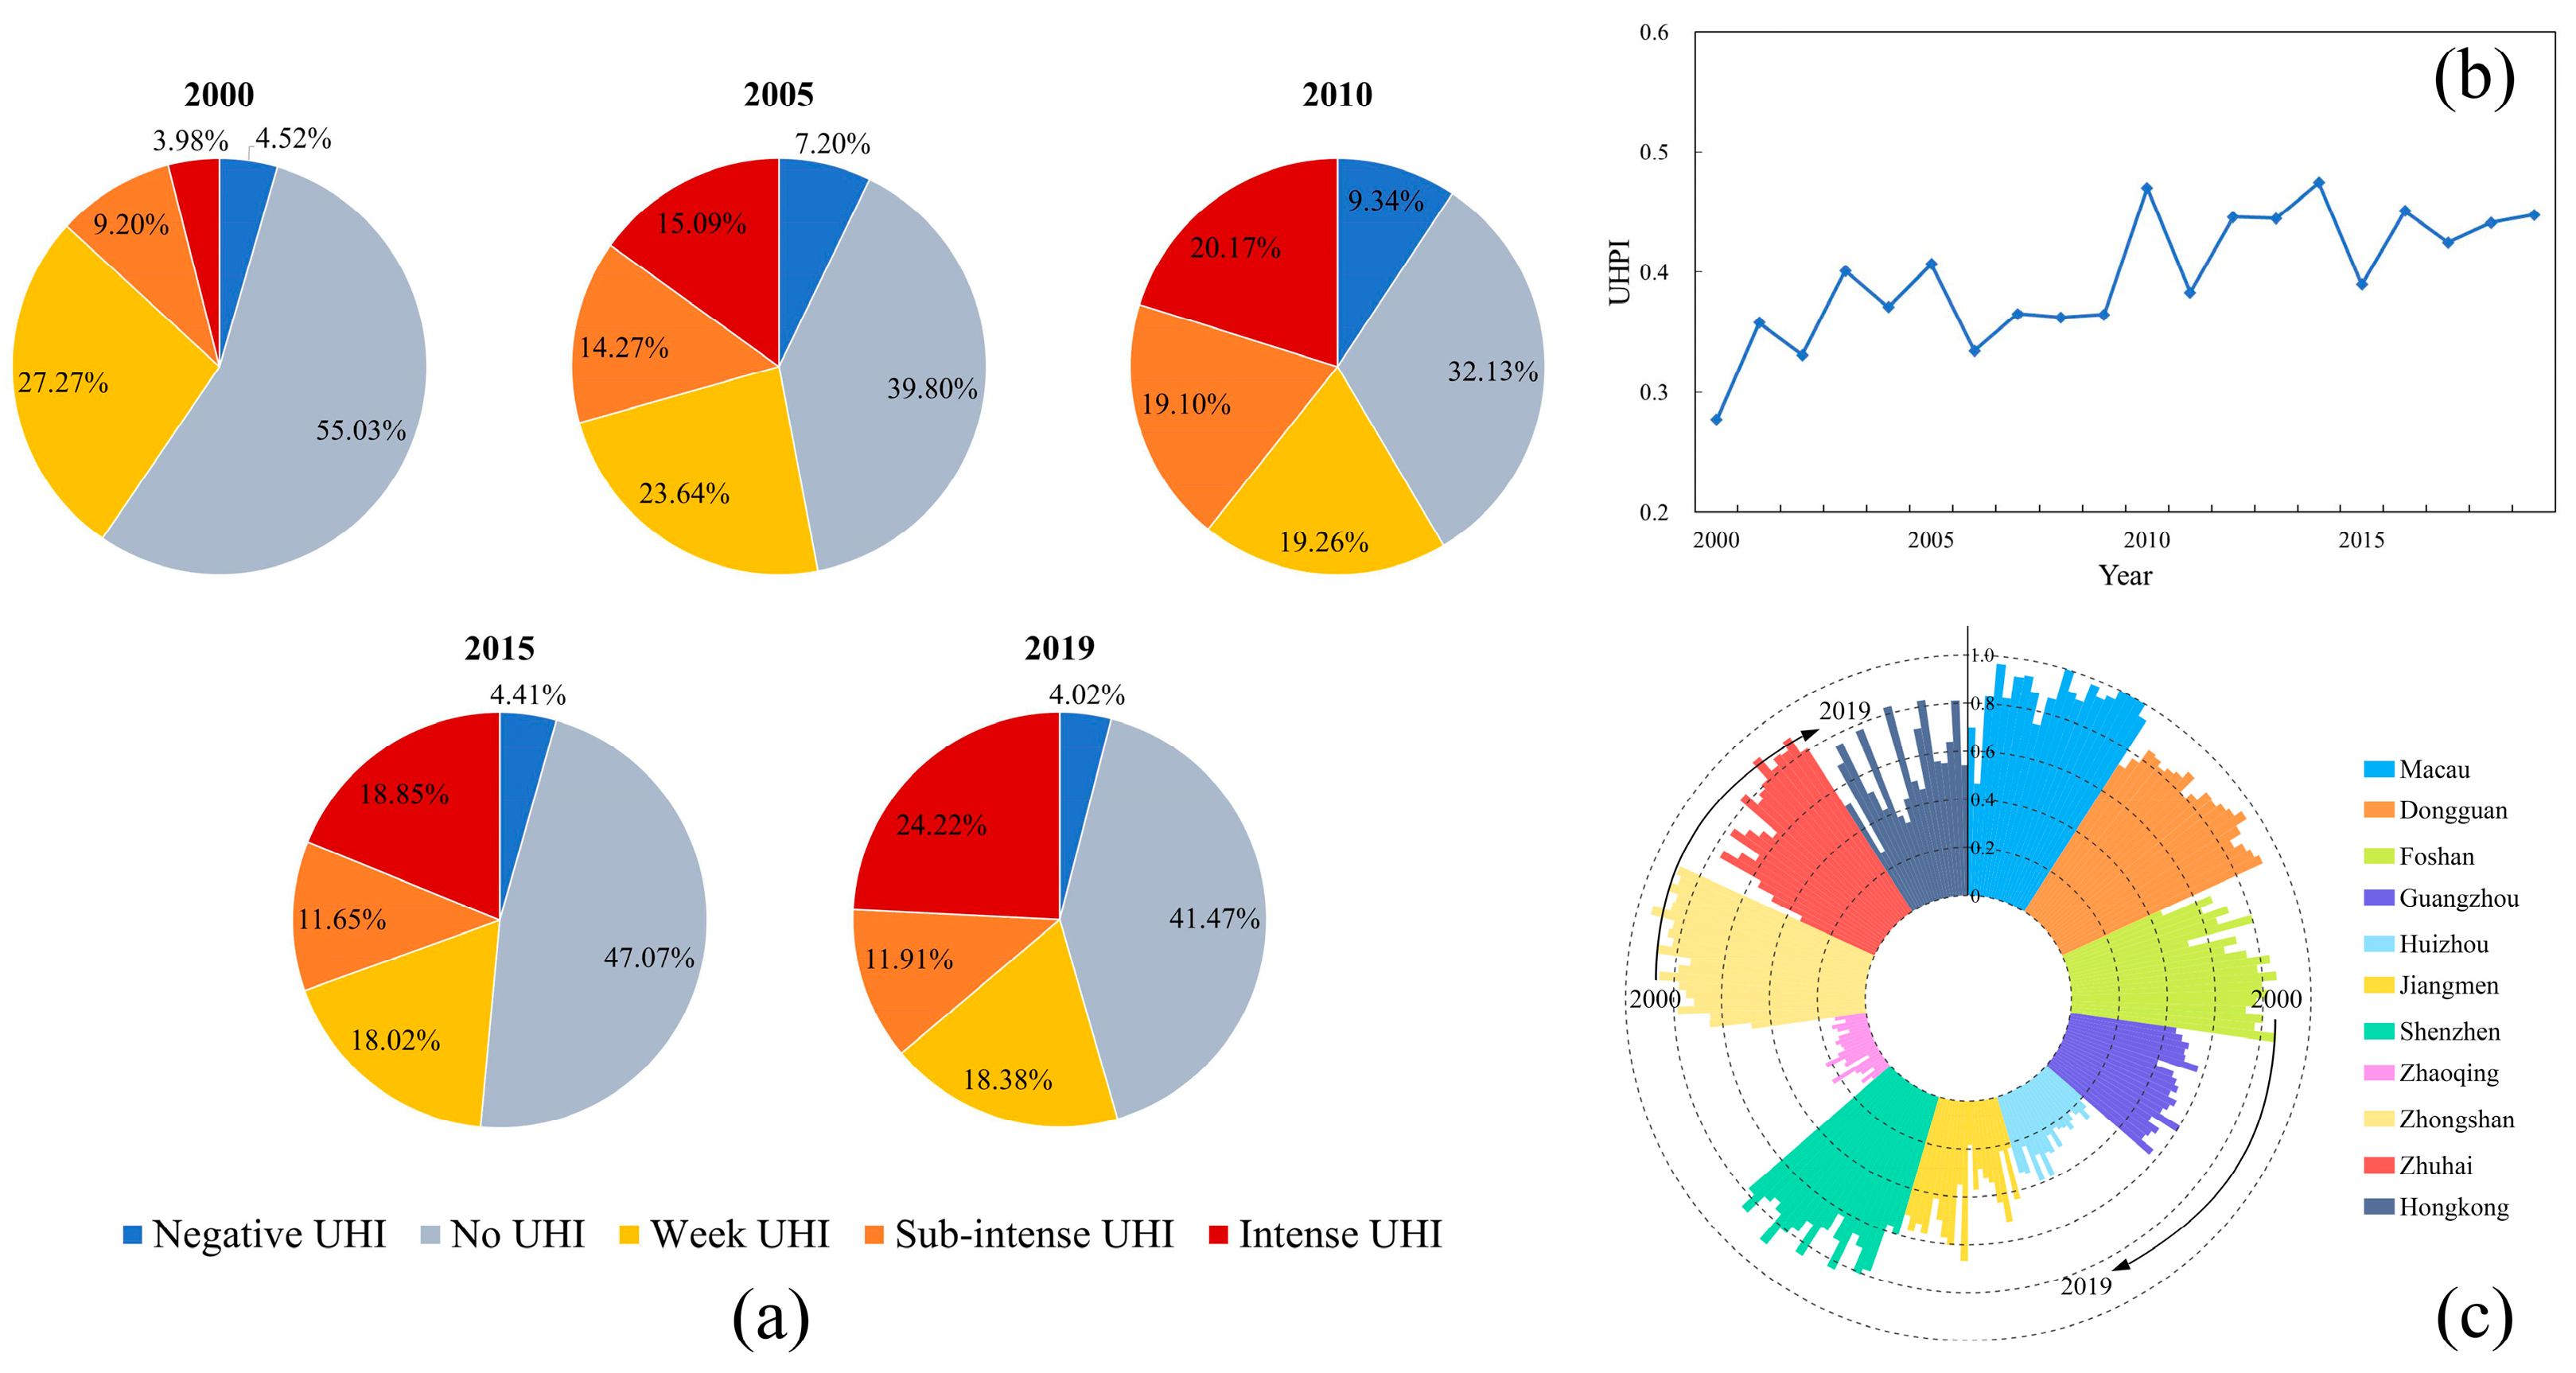
3.1. Spatial and Temporal Evolution Characteristics of the UHIs
3.2. Spatiotemporal Change of UR in the GBA
3.3. Coupling Coordination Analysis
3.4. The Interaction Mechanism between the Heat Island Effect and Urban Resilience
4. Discussion
5. Conclusions
- (1)
- From 2000 to 2019, the UHI region of the GBA formed a ring-shaped belt around the entrance of the Pearl River Delta, with strong UHIs mainly distributed in the major cities, such as Foshan, Guangzhou, Dongguan, Shenzhen, Zhongshan, and Zhuhai. The UHIs in the GBA show a significant trend of expansion and escalation over time, with Jiangmen’s UHI area expanding the most and Macao’s expanding the least; Macao has the highest average UHPI, and Zhaoqing has the lowest average UHPI.
- (2)
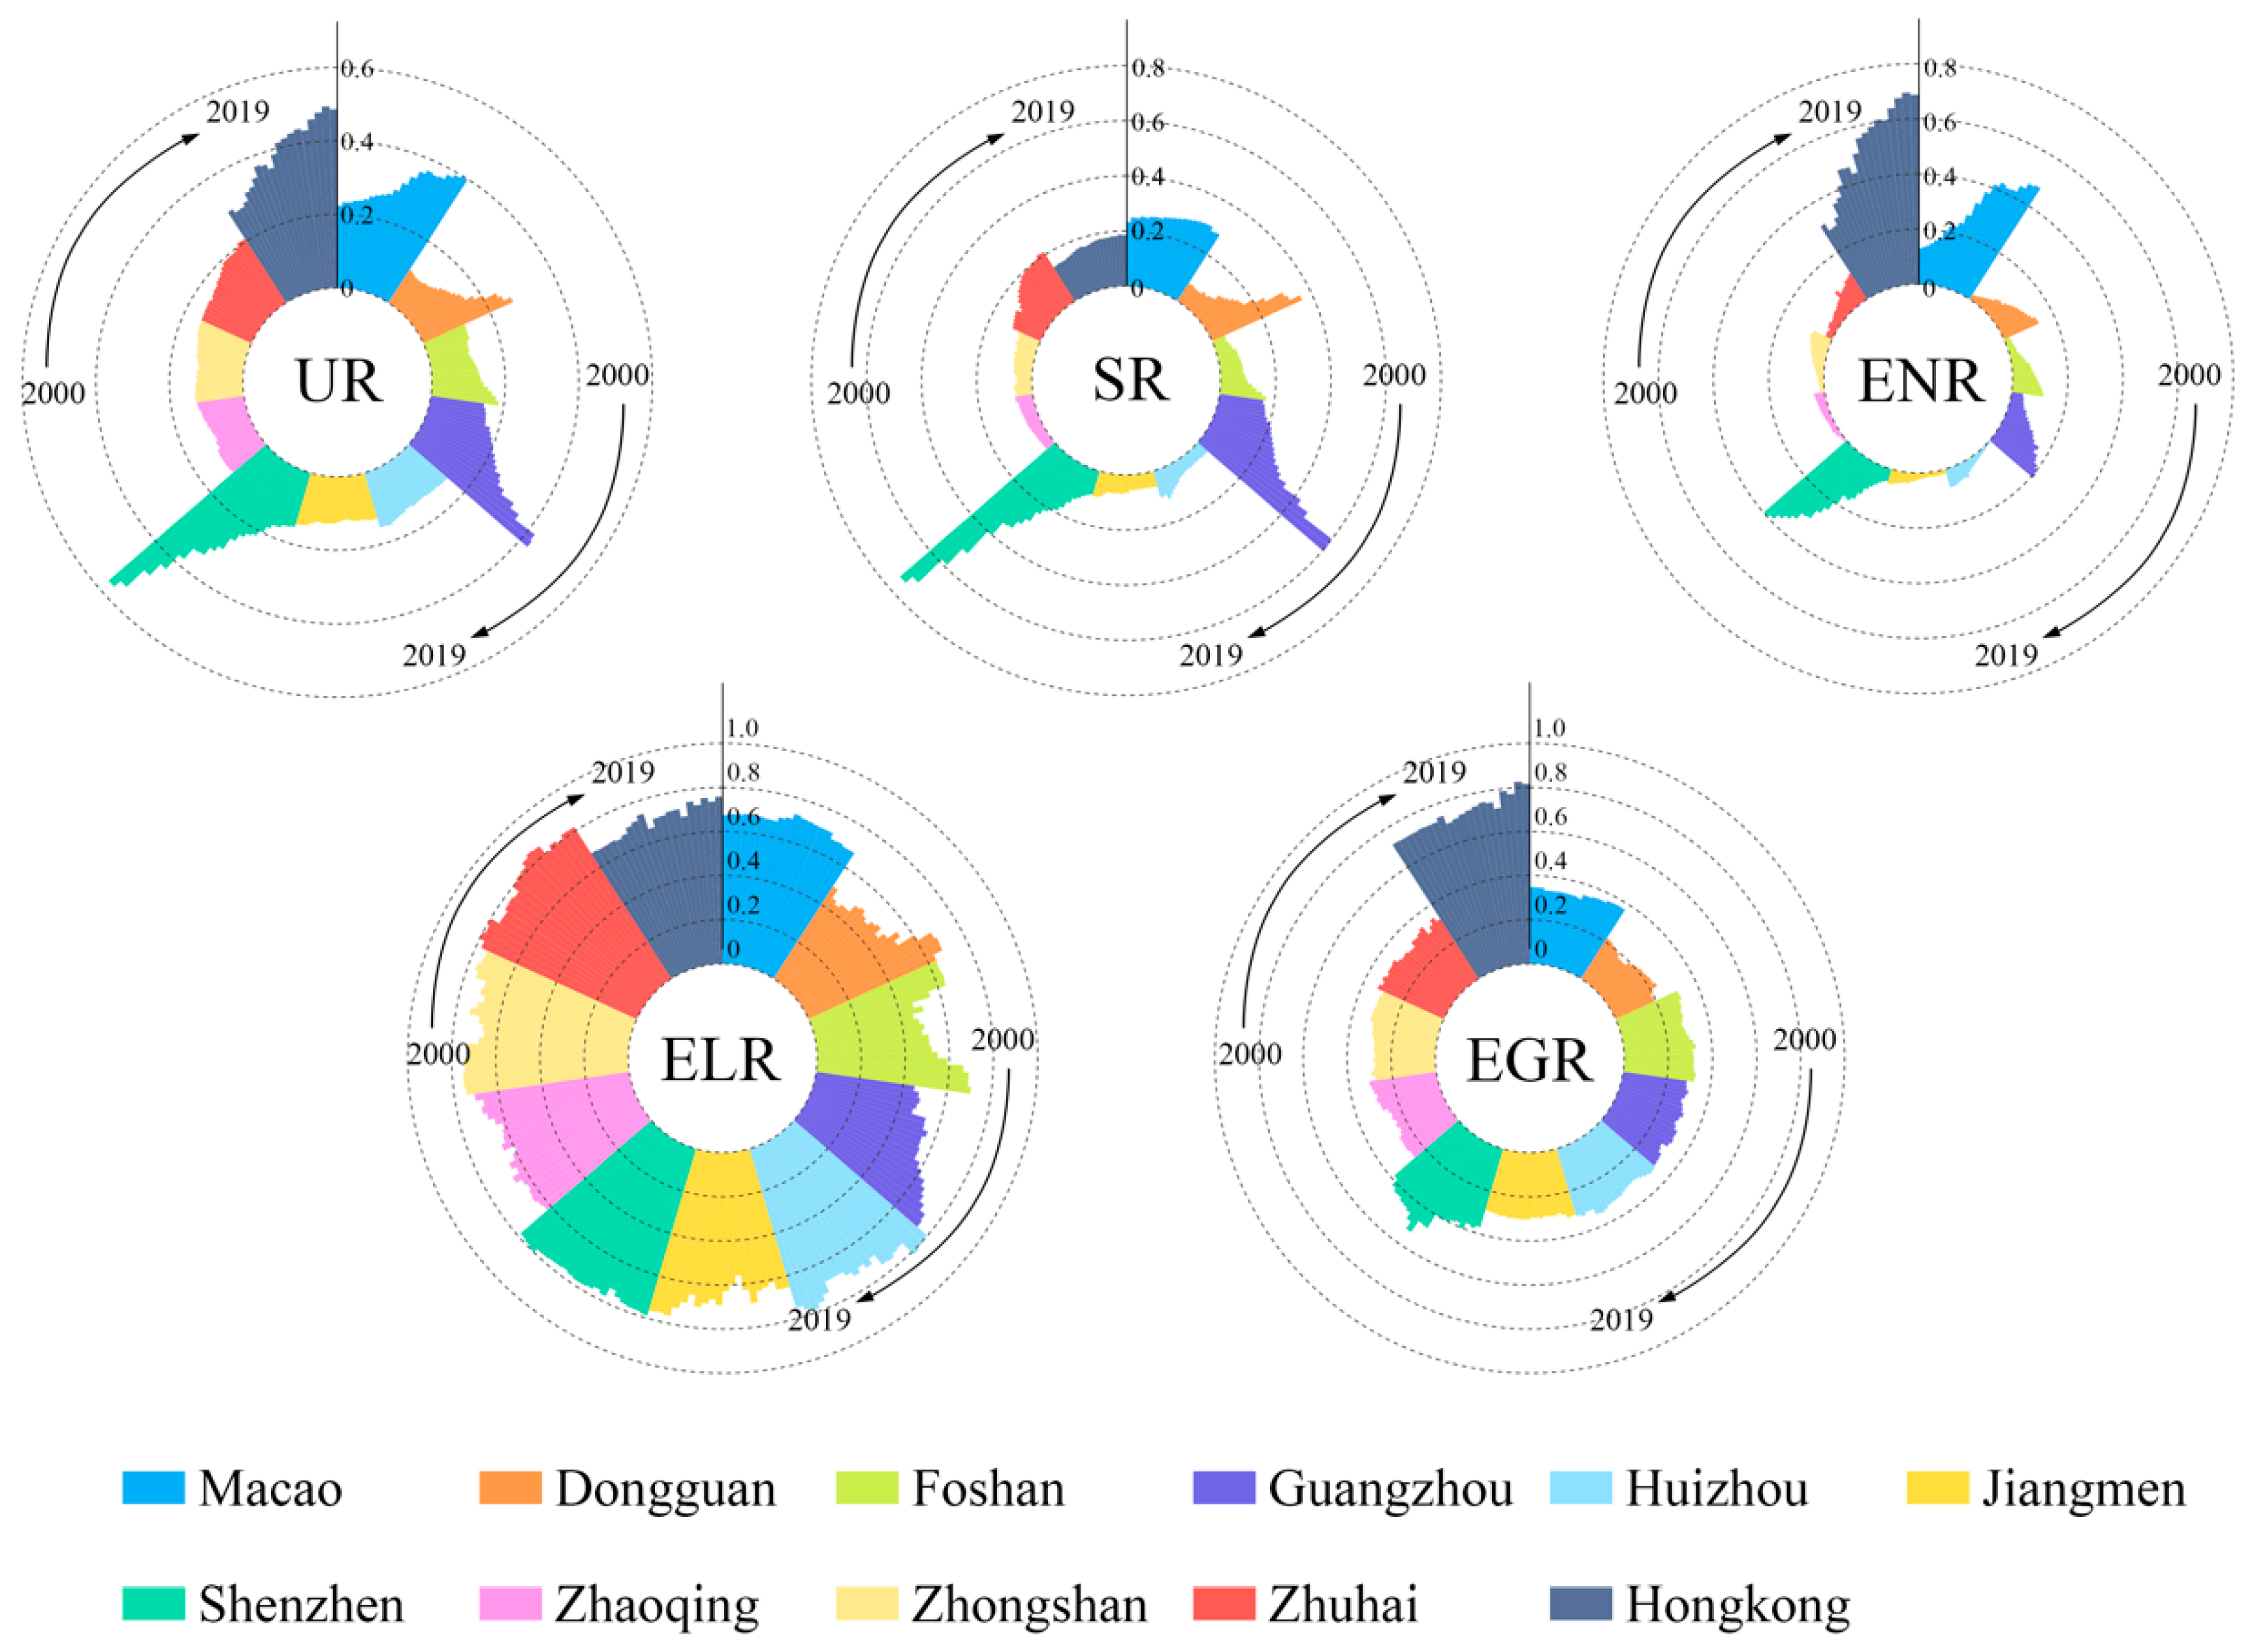
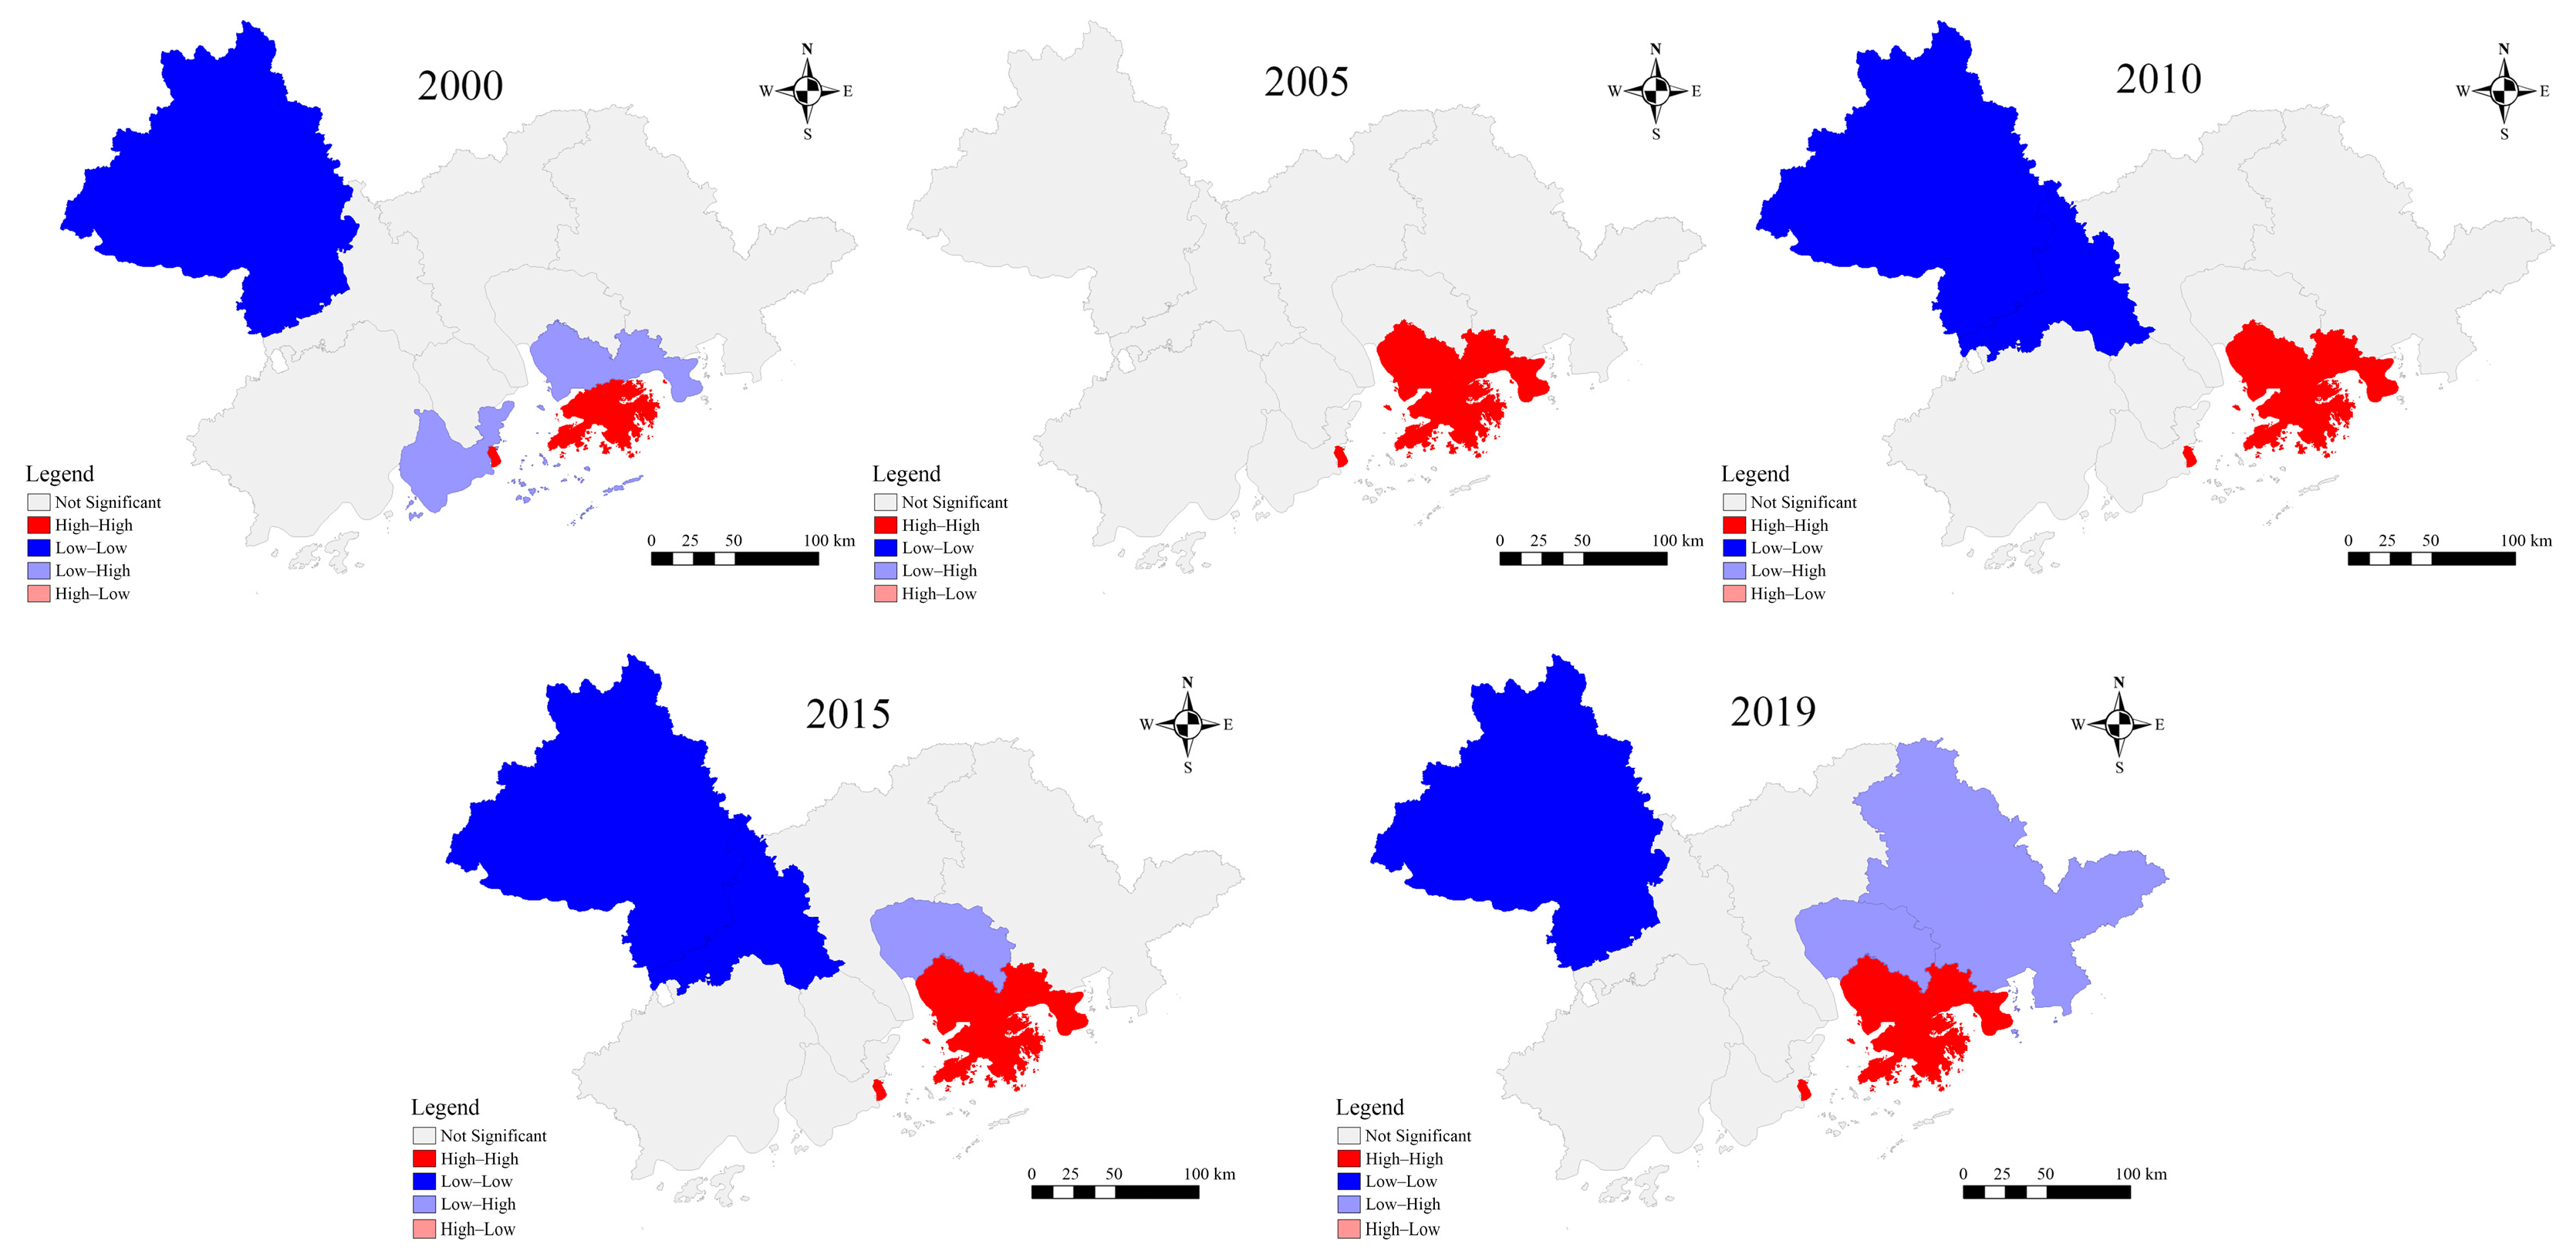
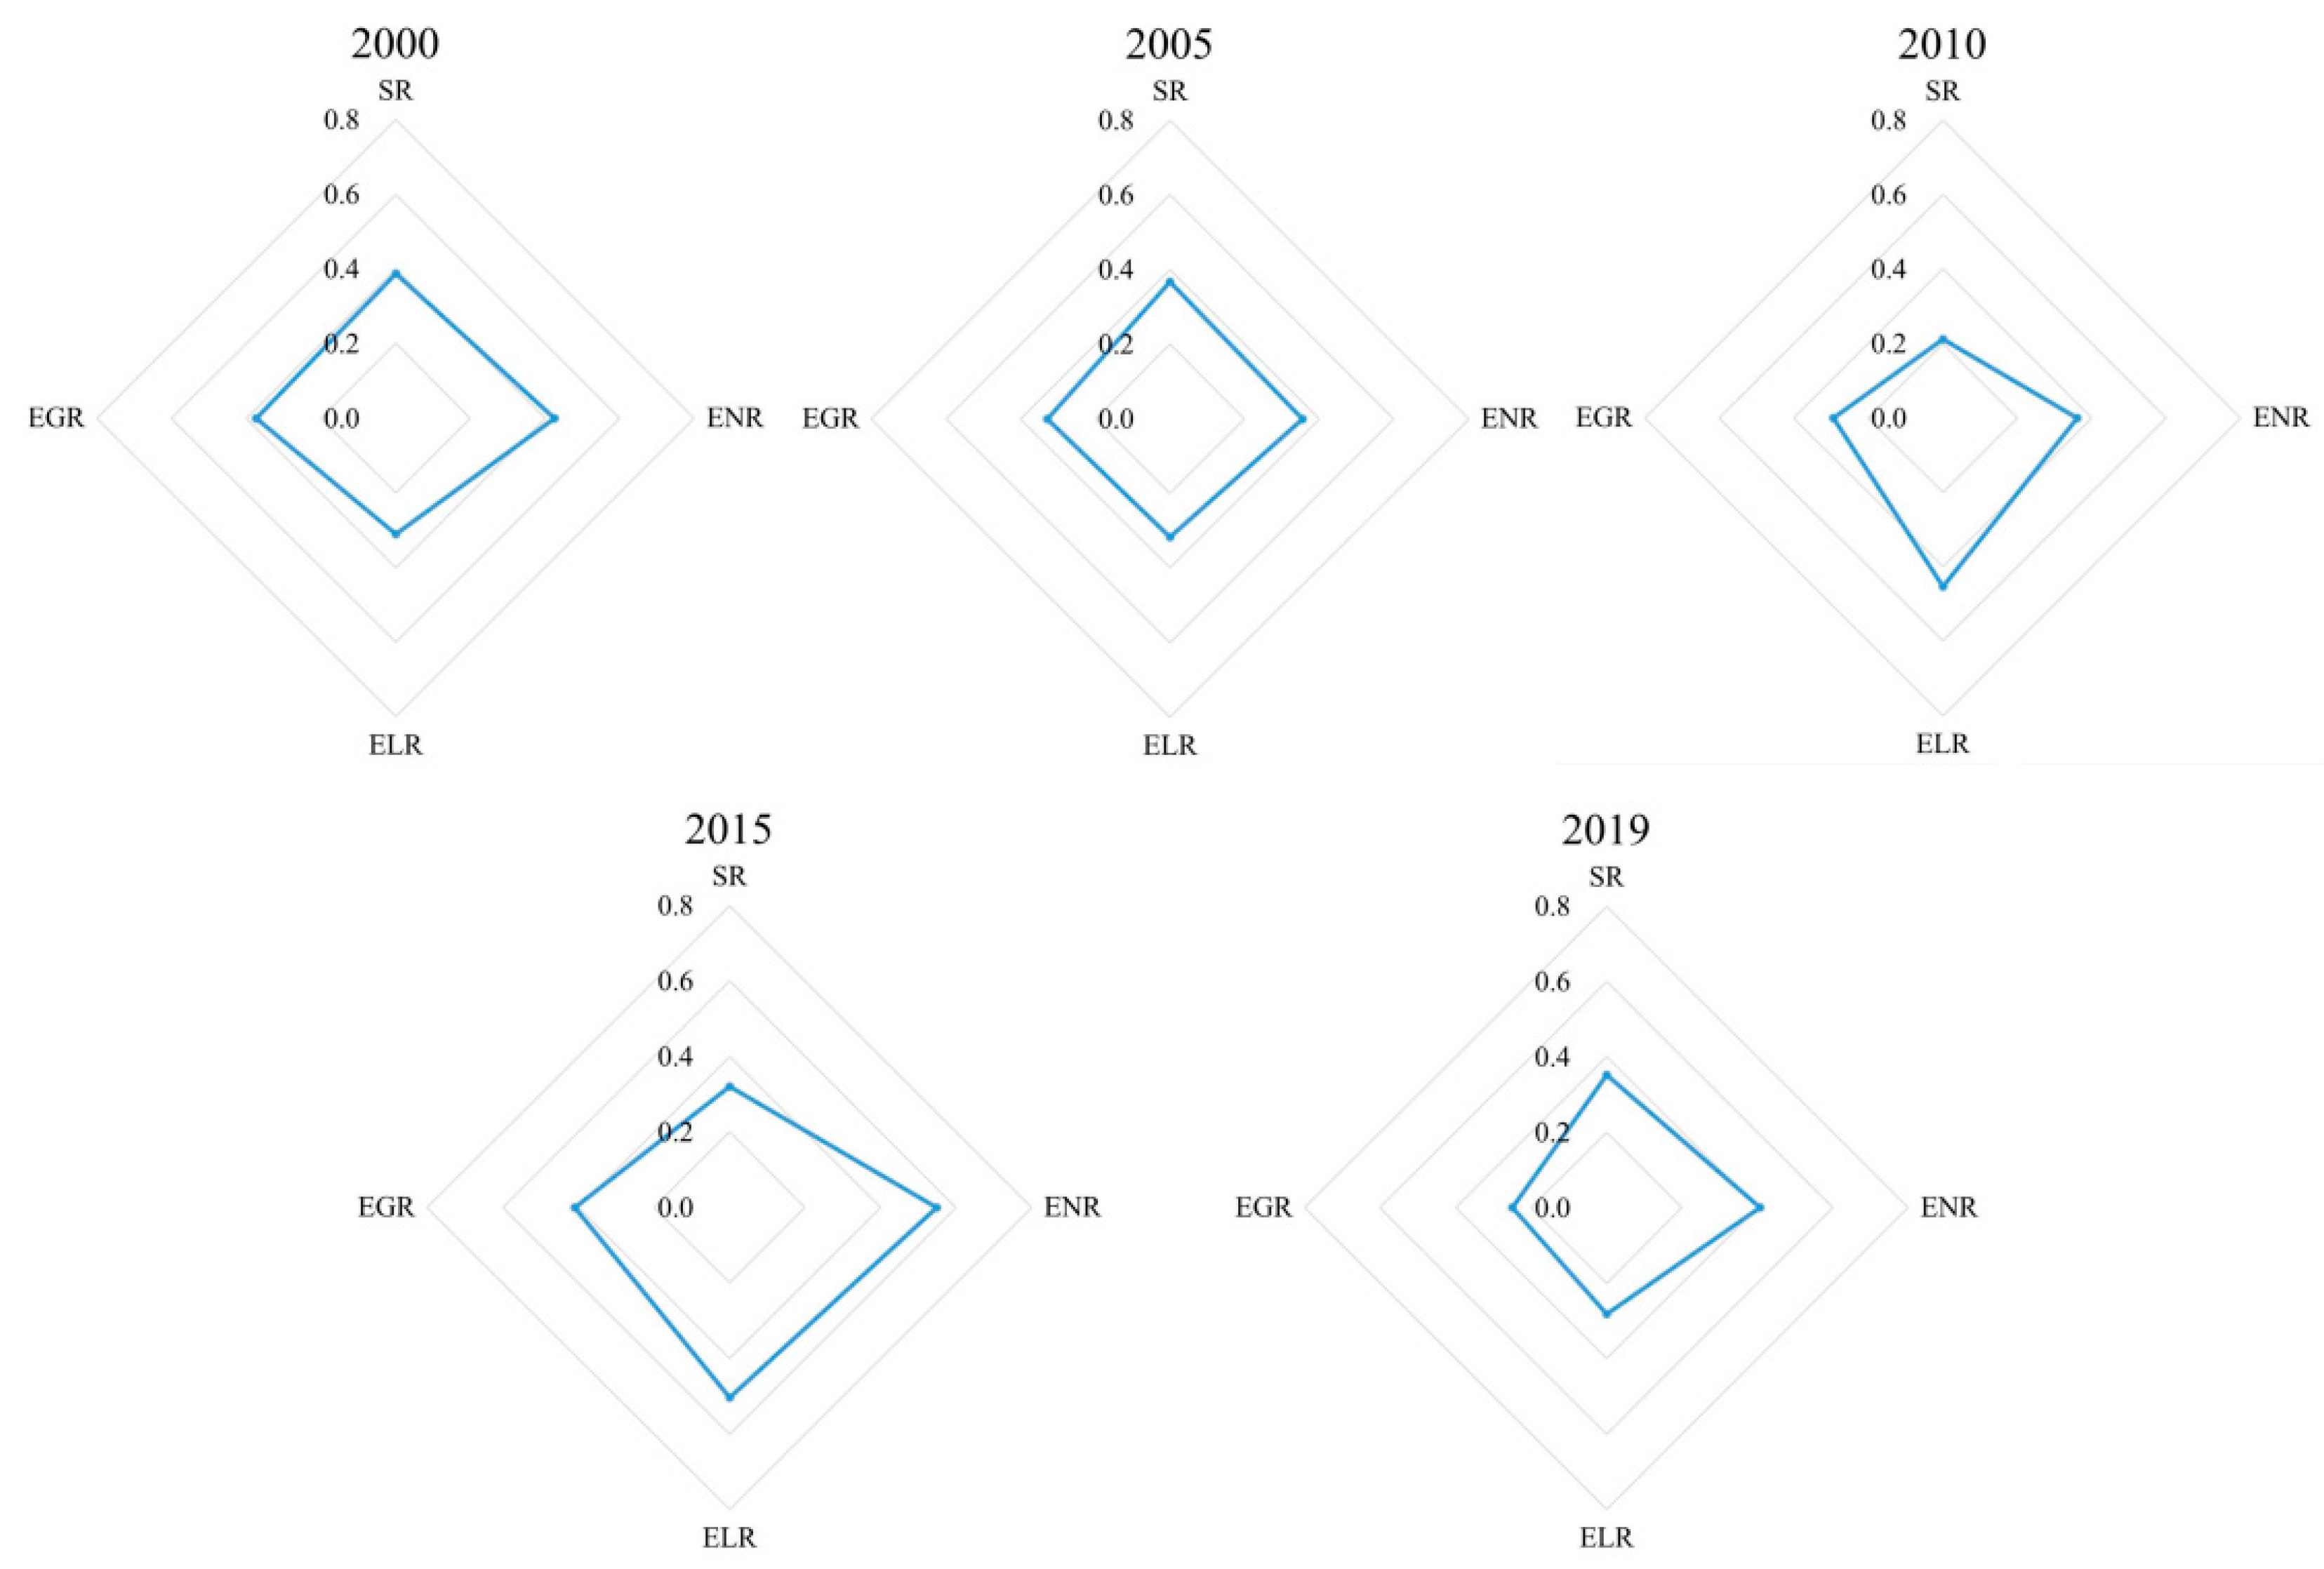
- The cities with rapid development of UR in the GBA were distributed in the ring of the Pearl River Delta inlet, and the cities with slow development were distributed in the vicinity, finally showing the spatial distribution pattern of high resilience of the regional central cities and low resilience of the peripheral cities, and the development of the resilience level of each city shows an uncoordinated trend. High–high aggregation type cities are distributed near the central bay and sea inlet of GBA. Adjacent to the HK-Macao high–high aggregation area, a more and more significant low-high aggregation distribution is gradually developing northward.
- (3)
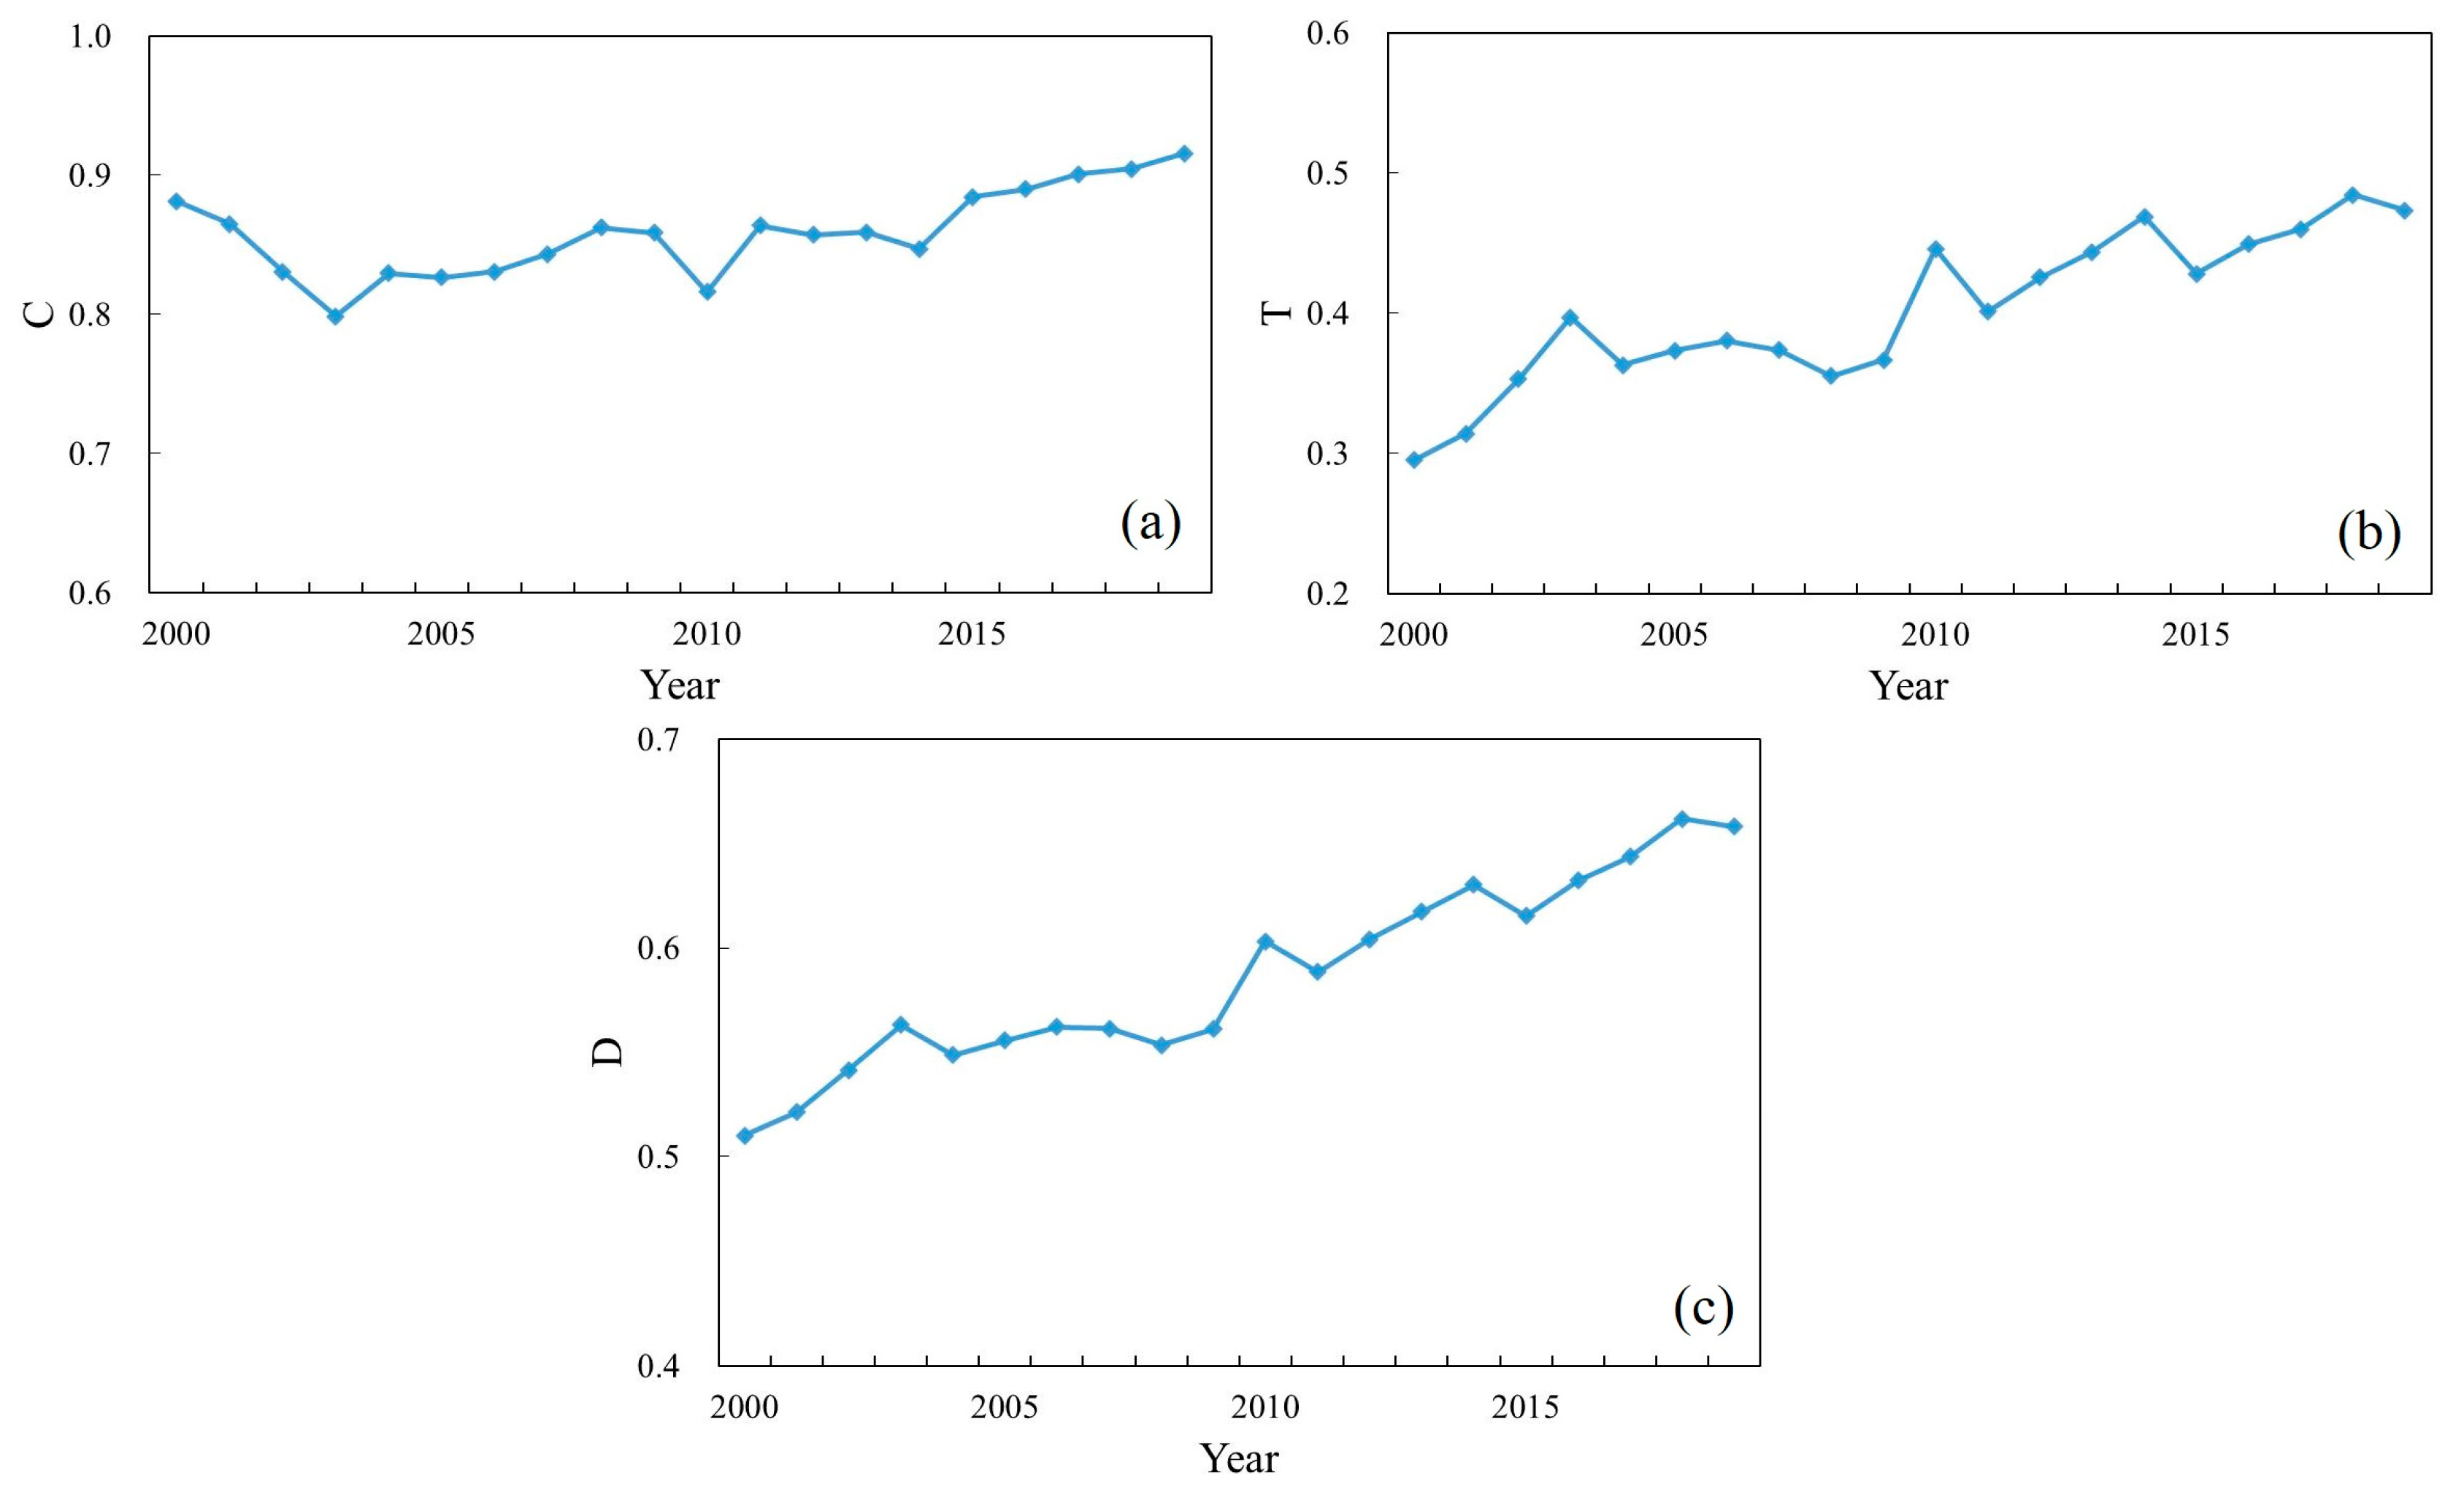
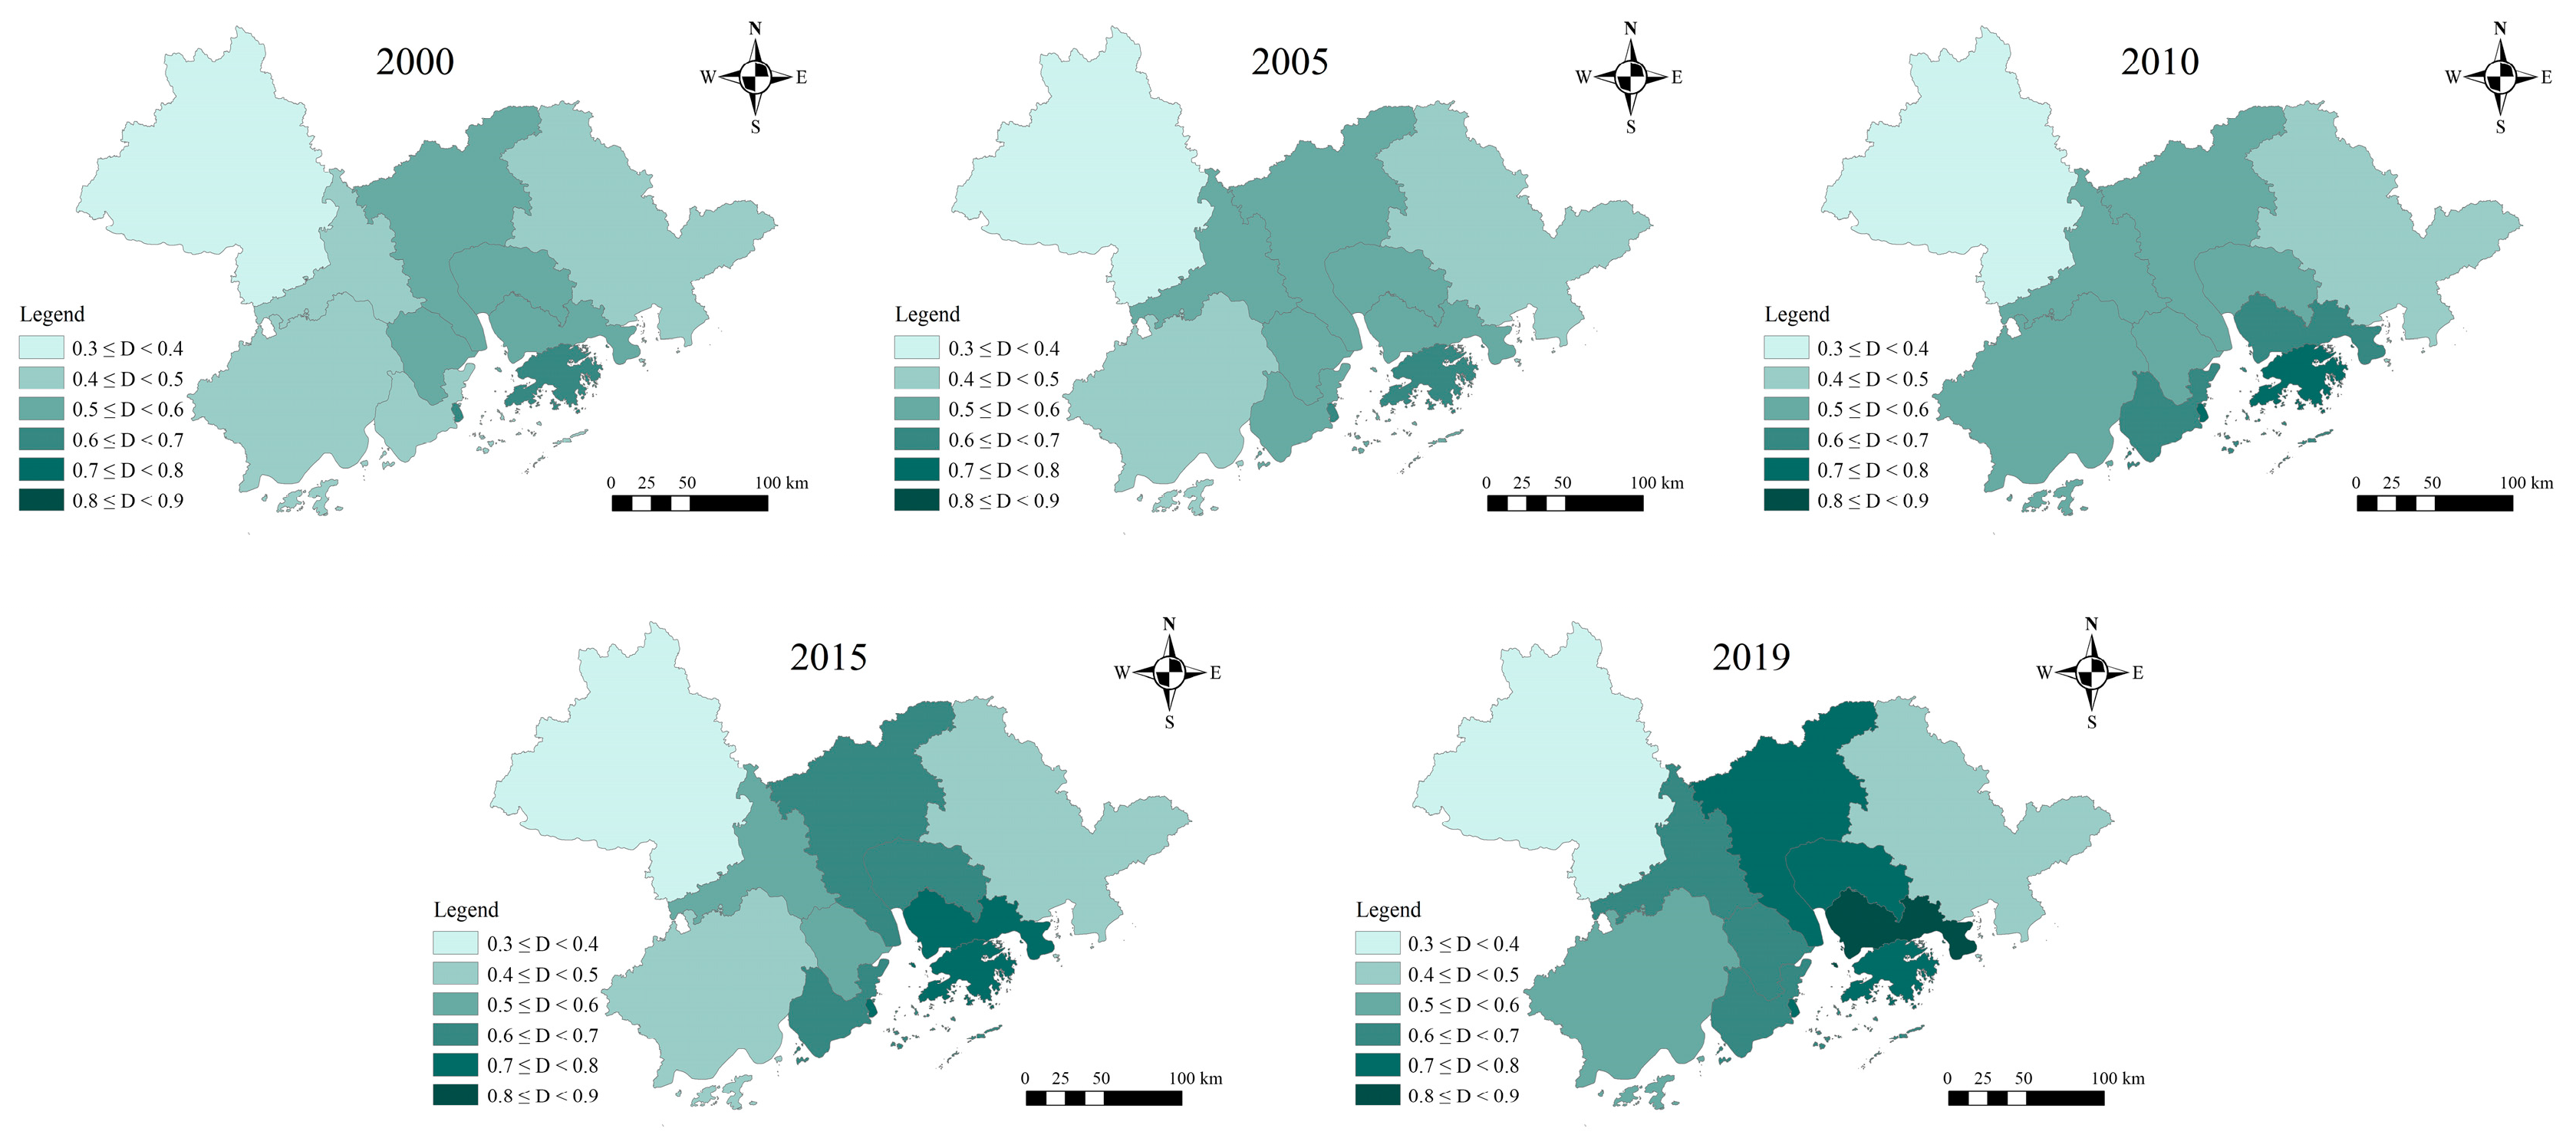
- The coupling degree between UHIs and UR is high in all years, demonstrating the close interaction between UHIs and UR. Before 2010, the coupling coordination degree of the study area was mainly on the verge of disorder and barely coordinated, and the growth rate of each city was slow; in 2010 and after, the primary coordination and intermediate coordination gradually increased, and the growth rate of the coupling coordination degree in most cities increased, indicating that the common effect of UHIs and UR development is becoming increasingly significant. From the viewpoint of city location, the spatial distribution of coastal cities in the center of the GBA shows a high degree of coupling coordination, while the coupling coordination decreases gradually in the north and east–west extension.
- (4)
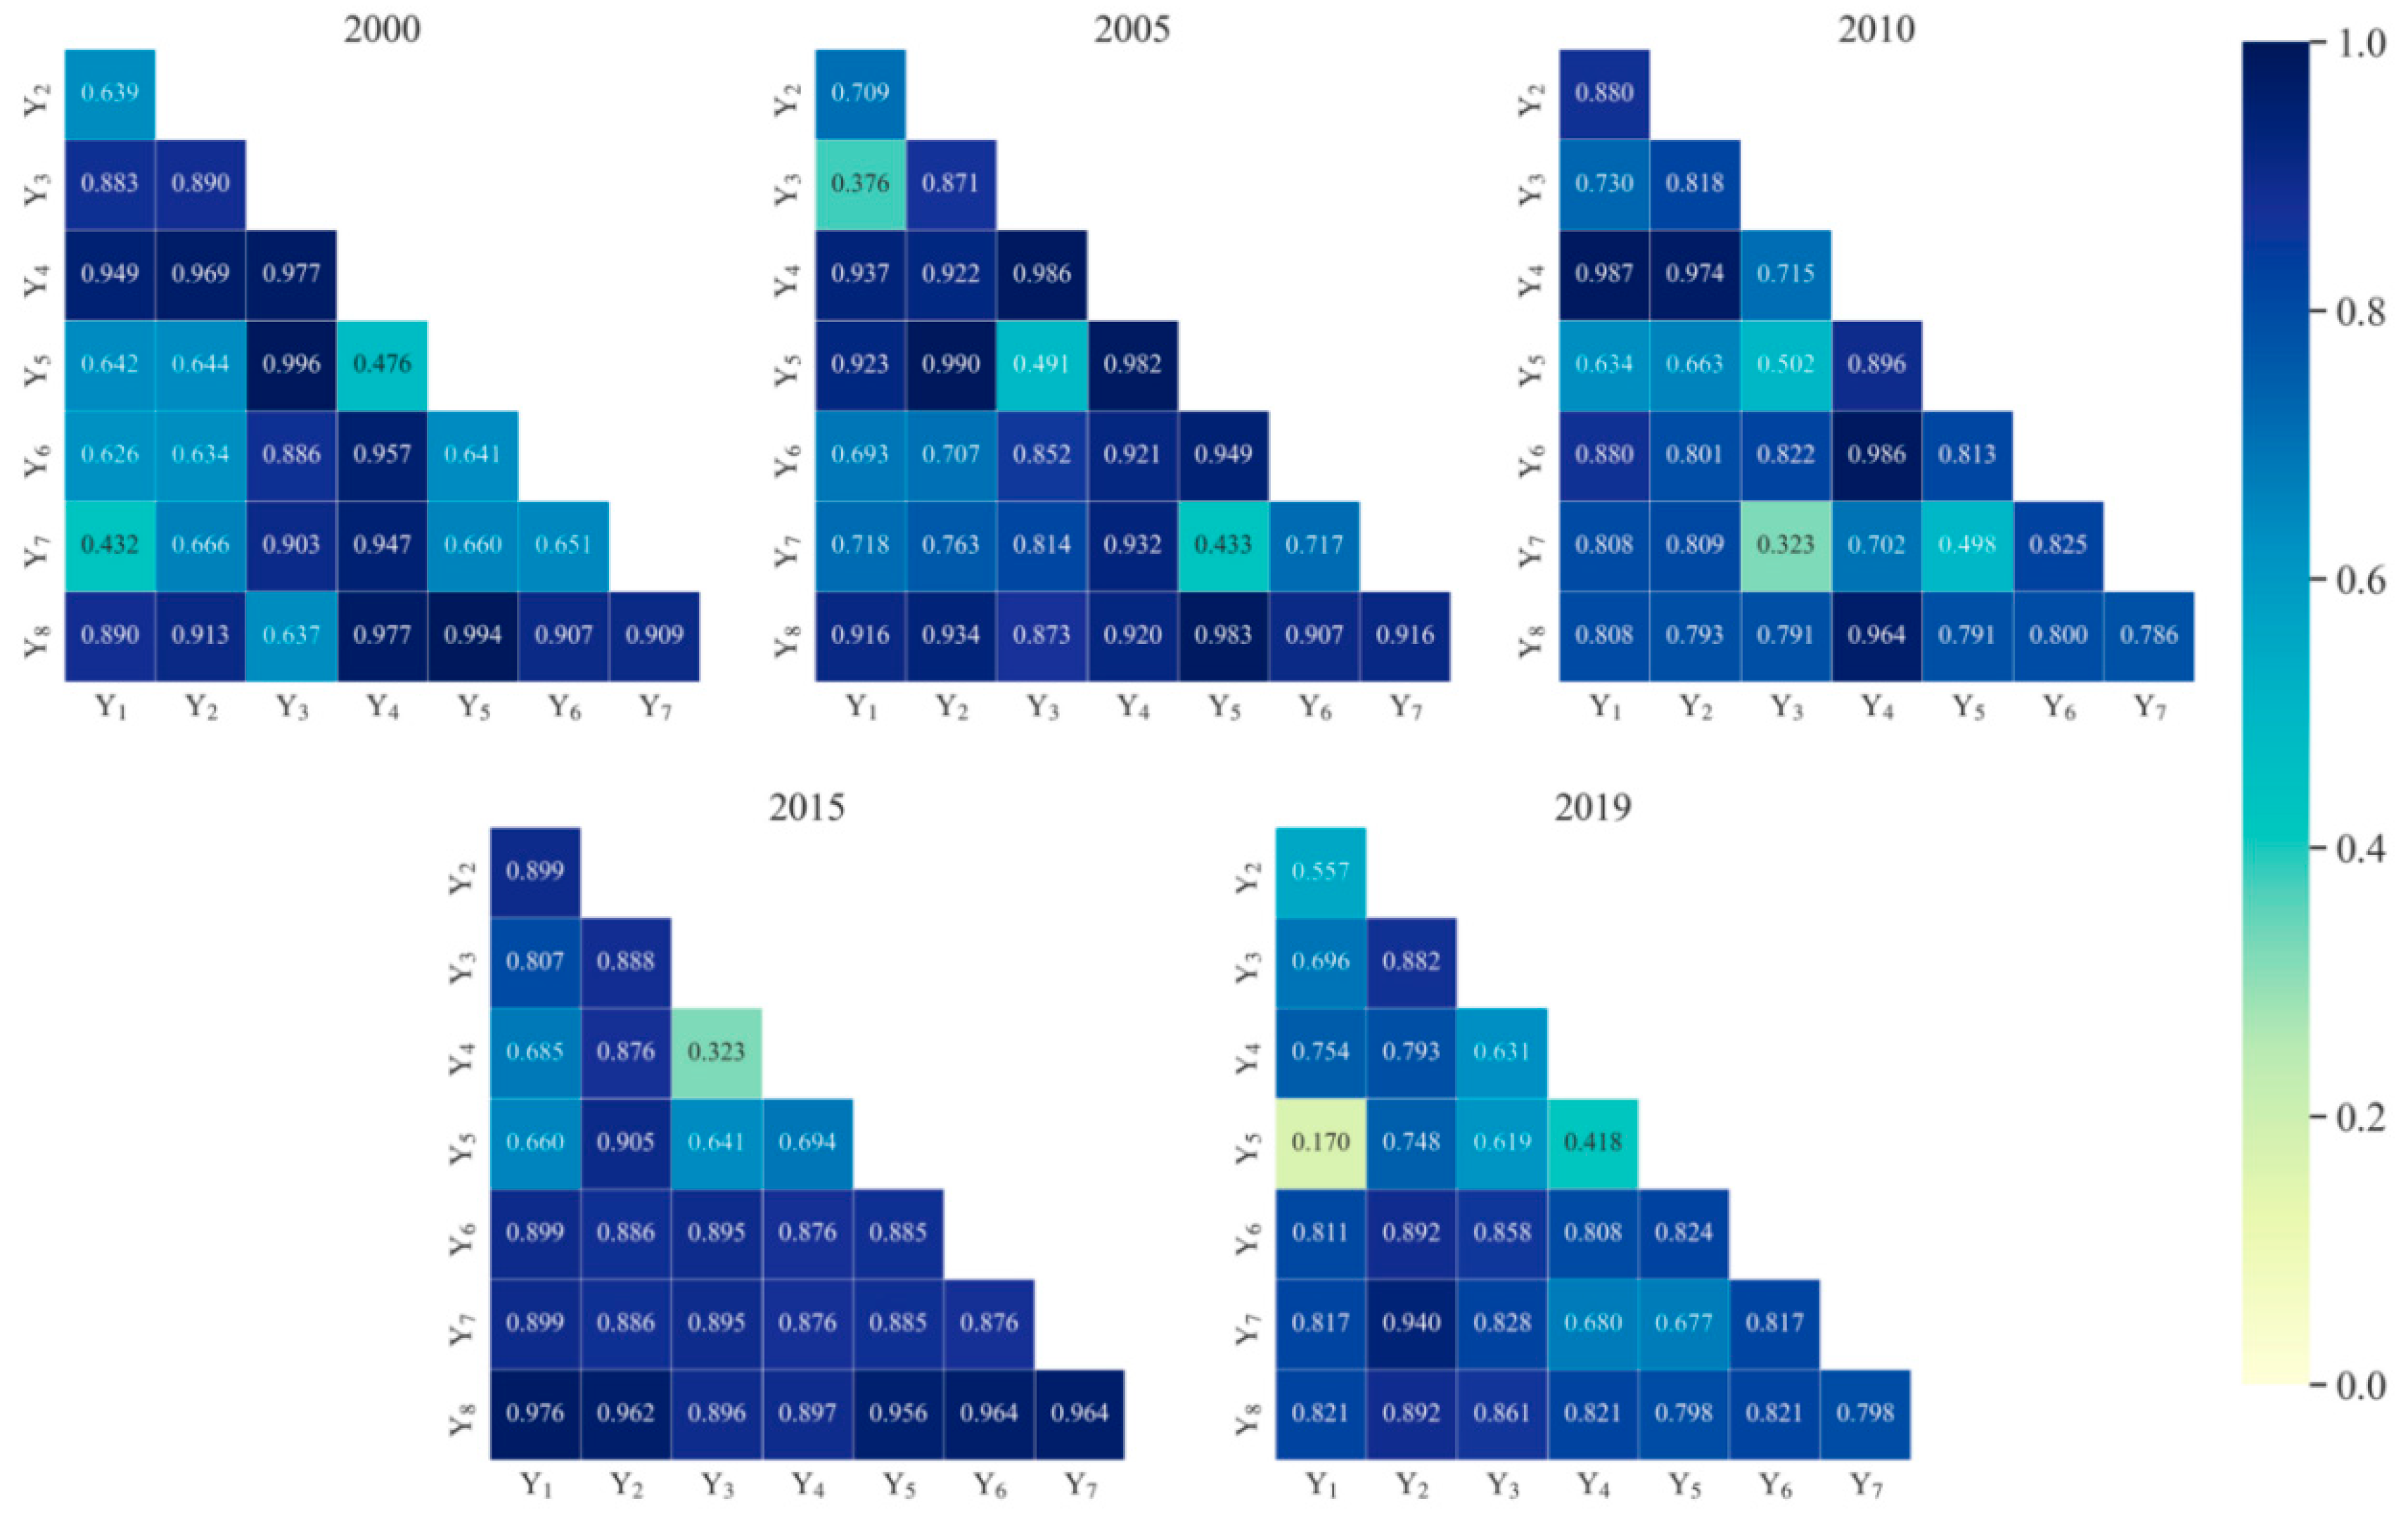
- Among the drivers of UHIs, GDP per capita, population density, land-average CO2 emissions, and average nighttime light brightness have stronger explanatory power for the spatial variation in UR. The spatial differentiation of the four sub-dimensions of UR is related to the driving factors of UHIs to varying degrees. The interaction between two factors has a stronger explanatory power for the spatial distribution of UR than a single factor.
Author Contributions
Funding
Institutional Review Board Statement
Informed Consent Statement
Data Availability Statement
Acknowledgments
Conflicts of Interest
References
- Reia, S.M.; Rao, P.S.C.; Barthelemy, M.; Ukkusuri, S.V. Spatial structure of city population growth. Nat. Commun. 2022, 13, 5931. [Google Scholar] [CrossRef]
- Parham, A.M.; Fariborz, H. Approaches to study Urban Heat Island—Abilities and limitations. Build. Environ. 2010, 45, 2192–2201. [Google Scholar]
- Peter, S. How climate change affects extreme weather events. Science 2016, 352, 1517–1518. [Google Scholar]
- Saahil, S.; Dimitry, G.; Kevin, E.T.; Steven, C. Trends of extreme US weather events in the changing climate. Proc. Natl. Acad. Sci. USA 2022, 119, e2207536119. [Google Scholar]
- Zhang, Y.; Yang, P.; Gao, Y.; Leung, R.L.; Bell, M.L. Health and economic impacts of air pollution induced by weather extremes over the continental U.S. Environ. Int. 2020, 143, 105921. [Google Scholar] [CrossRef]
- Chen, Z.; Gong, Z.; Yang, S.; Ma, Q.; Kan, C. Impact of extreme weather events on urban human flow: A perspective from location-based service data. Comput. Environ. Urban Syst. 2020, 83, 101520. [Google Scholar] [CrossRef]
- Kayaga, S.M.; Amankwaa, E.F.; Gough, K.V.; Wilby, R.L.; Abarike, M.A.; Codjoe, S.N.A.; Kasei, R.; Nabilse, C.K.; Yankson, P.W.K.; Mensah, P.; et al. Cities and extreme weather events: Impacts of flooding and extreme heat on water and electricity services in Ghana. Environ. Urban 2021, 33, 131–150. [Google Scholar] [CrossRef]
- Zou, X.Y.; Peng, X.Y.; Zhao, X.X.; Chang, C.P. The impact of extreme weather events on water quality: International evidence. Nat. Hazards 2023, 115, 1–21. [Google Scholar] [CrossRef]
- Voogt, J.A.; Oke, T.R. Thermal remote sensing of urban climates. Remote Sens. Environ. 2003, 86, 370–384. [Google Scholar] [CrossRef]
- Neha, Y.; Chhemendra, S.; Peshin, S.K.; Renu, M. Study of intra-city urban heat island intensity and its influence on atmospheric chemistry and energy consumption in Delhi. Sustain. Cities Soc. 2017, 32, 202–211. [Google Scholar]
- Haider, T. Meteorological, air-quality, and emission-equivalence impacts of urban heat island control in California. Sustain. Cities Soc. 2015, 19, 207–221. [Google Scholar]
- Peter, K.; Sarah, L.; Angela, H. Evidence of urban heat island impacts on the vegetation growing season length in a tropical city. Landsc. Urban Plan. 2021, 206, 103989. [Google Scholar]
- Arsad, F.S.; Hod, R.; Ahmad, N.; Ismail, R.; Mohamed, N.; Baharom, M.; Osman, Y.; Radi, M.F.M.; Tangang, F. The impact of heatwaves on mortality and morbidity and the associated vulnerability factors: A systematic review. Int. J. Environ. Res. Public Health 2022, 19, 16356. [Google Scholar] [CrossRef]
- Gallo, K.P.; Mcnab, A.L.; Karl, T.R.; Brown, J.F.; Tarpley, J.D. The use of NOAA AVHRR data for assessment of the urban heat island effect. J. Appl. Meteorol. 1993, 32, 899–908. [Google Scholar] [CrossRef]
- Li, Y.M.; Zhang, J.H.; Gu, R.Z. Study on the relationship between urban greening and heat island effect in Beijing. China Gard. 2004, 2004, 77–80. [Google Scholar]
- Tong, H.; Liu, H.Z.; Li, Y.M.; Sang, J.G.; Hu, F. Current status of urban heat island in Beijing in summer and the role of wedge-shaped green space planning for urban heat island mitigation. J. Appl. Meteorol. 2005, 2005, 357–366. [Google Scholar]
- Zhou, D.; Zhang, L.; Li, D.; Huang, D.; Zhu, C. Climate–vegetation control on the diurnal and seasonal variations of surface urban heat islands in china. Environ. Res. Lett. 2016, 11, 074009. [Google Scholar] [CrossRef]
- Hu, F.; Liu, X.M.; Li, L.; Wang, Y. Summer urban climate trends and environmental effect in the Beijing area. Chin. J. Geophys. 2006, 49, 617–626. [Google Scholar] [CrossRef]
- Peng, S.; Piao, S.; Ciais, P.; Friedlingstein, P.; Ottle, C.; Nan, H.; Zhou, L.; Myneni, R.B. Surface urban heat island across 419 global big cities. Environ. Sci. Technol. 2012, 46, 696–703. [Google Scholar] [CrossRef]
- Wang, J.; Huang, B.; Fu, D.; Atkinson, P.M. Spatiotemporal variation in surface urban heat island intensity and associated determinants across major Chinese cities. Remote Sens. 2015, 7, 3670–3689. [Google Scholar] [CrossRef]
- Zhou, D.C.; Zhang, L.X.; Hao, L.; Sun, G.; Liu, Y.Q.; Zhu, C. Spatiotemporal trends of urban heat island effect along the urban development intensity gradient in China. Sci. Total Environ. 2016, 544, 617–626. [Google Scholar] [CrossRef]
- Foley, J.A.; Defries, R.; Asner, G.P.; Barford, C.; Bonan, G.; Carpenter, S.R.; Stuart Chapin, F.; Coe, M.T.; Daily, G.C.; Gibbs, H.K.; et al. Global consequences of land use. Science 2005, 309, 570–574. [Google Scholar] [CrossRef] [PubMed]
- Zhao, L.; Lee, X.; Smith, R.B.; Oleson, K. Strong contributions of local background climate to urban heat islands. Nature 2014, 511, 216–219. [Google Scholar] [CrossRef] [PubMed]
- Estrada, F.; Botzen, W.J.W.; Tol, R.S.J. A global economic assessment of city policies to reduce climate change impacts. Nat. Clim. Chang. 2017, 7, 403–406. [Google Scholar] [CrossRef]
- Li, D.; Liao, W.; Rigden, A.J.; Liu, X.; Wang, D.; Malyshev, S.; Shevliakova, E. Urban heat island: Aerodynamics or imperviousness? Sci. Adv. 2019, 5, eaau4299. [Google Scholar] [CrossRef]
- Cheng, H.; Yang, G.L.; Ji, X.J. A study on decoupling relationship between urban toughness and environmental pressure in China’s top ten city agglomerations. Stat. Decis. Mak. 2019, 35, 79–83. (In Chinese) [Google Scholar]
- Ahem, J. From fail-safe to safe-to-fail: Sustainability and resilience in the new urban world. Landsc. Urban Plan. 2011, 100, 341–343. [Google Scholar]
- Foster, H.D. The Ozymandias Principles: Thirty-One Strategies for Surviving Change; UBC Press: Victoria, BC, Canada, 1997. [Google Scholar]
- Etkin, D. Risk Transference and Related Trends: Driving Forces Towards More Mega-disasters. Environ. Hazards 1999, 1, 69–75. [Google Scholar]
- Mileti, D.S. Disasters by Design: A Reassessment of Natural Hazards in the United States; Joseph Henry Press: Washington, DC, USA, 1999. [Google Scholar]
- Holling, C.S. Resilience and stability of ecological systems. Annu. Rev. Ecol. Syst. 1973, 4, 1–23. [Google Scholar] [CrossRef]
- Perrings, C. Resilience in the dynamics of economy-environment systems. Environ. Resour. Econ. 1998, 11, 503–520. [Google Scholar] [CrossRef]
- Walker, B.; Hollin, C.S.; Carpenter, S.R.; Kinzig, A. Resilience, adaptability and transformability in social-ecological systems. Ecol. Soc. 2004, 9, 5. [Google Scholar] [CrossRef]
- Martin, R.; Sunley, P.; Gardiner, B.; Tyler, P. How regions react to recessions: Resilience and the role of economic structure. Reg. Stud. 2016, 50, 561–585. [Google Scholar] [CrossRef]
- Daniel, F.G. Mental resilience: Progress and prospects. Curr. Opin. Psychol. 2017, 16, 17–23. [Google Scholar]
- Masten, A.S.; Obradović, J. Disaster preparation and recovery: Lessons from research on resilience in human development. Ecol. Soc. 2008, 13, 9. [Google Scholar] [CrossRef]
- Crowe, P.R.; Foley, K.; Collier, M.J. Operationalizing urban resilience through a framework for adaptive co-management and design: Five experiments in urban planning practice and policy. Environ. Sci. Policy 2016, 62, 112–119. [Google Scholar] [CrossRef]
- Shao, Y.W.; Xu, J. Understanding urban resilience: A conceptual analysis based on integrated international literature review. Int. Urban Plan. 2015, 30, 48–54. (In Chinese) [Google Scholar]
- O’Malley, C. Urban Heat Island (UHI) mitigating strategies: A case-based comparative analysis. Sustain. Cities Soc. 2015, 19, 222–235. [Google Scholar] [CrossRef]
- Carvalho, D.; Martins, H.; Marta-Almeida, M.; Rocha, A.; Borrego, C.J.U.C. Urban resilience to future urban heat waves under a climate change scenario: A case study for Porto urban area (Portugal). Urban Clim. 2017, 19, 1–27. [Google Scholar] [CrossRef]
- Qiao, Z.; Lu, Y.; He, T.; Wu, F.; Xu, X.; Liu, L.; Wang, F.; Sun, Z.; Han, D. Spatial expansion paths of urban heat islands in Chinese cities: Analysis from a dynamic topological perspective for the improvement of climate resilience. Resour. Conserv. Recycl. 2023, 188, 106680. [Google Scholar] [CrossRef]
- Patz, J.A.; Campbell-Lendrum, D.; Holloway, T.; Foley, J.A. Impact of regional climate change on human health. Nature 2005, 438, 310–317. [Google Scholar] [CrossRef]
- Yardley, J.; Sigal, R.J.; Kenny, G.P. Heat health planning: The importance of social and community factors. Glob. Environ. Chang. 2011, 21, 670–679. [Google Scholar] [CrossRef]
- Manoli, G.; Fatichi, S.; Schläpfer, M.; Yu, K.; Crowther, T.W.; Meili, N.; Burlando, P.; Katul, G.G.; Bou-Zeid, E. Magnitude of urban heat islands largely explained by climate and population. Nature 2019, 573, 55–60. [Google Scholar] [CrossRef]
- Anderson, G.B.; Bell, M.L. Heat waves in the United States: Mortality risk during heat waves and effect modification by heat wave characteristics in 43 US communities. Environ. Health Perspect. 2011, 119, 210–218. [Google Scholar] [CrossRef]
- Li, D.; Bou-Zeid, E. Synergistic interactions between urban heat islands and heat waves: The impact in cities is larger than the sum of its parts. J. Appl. Meteorol. Clim. 2013, 52, 2051–2064. [Google Scholar] [CrossRef]
- Grimm, N.B.; Faeth, S.H.; Golubiewski, N.E.; Redman, C.L.; Wu, J.; Bai, X.; Briggs, J.M. Global change and the ecology of cities. Science 2008, 319, 756. [Google Scholar] [CrossRef]
- Liu, H.; Huang, B.; Yang, C. Assessing the coordination between economic growth and urban climate change in China from 2000 to 2015. Sci. Total Environ. 2020, 732, 139283. [Google Scholar] [CrossRef] [PubMed]
- Monteiro, F.F.; Gonalves, W.A.; Melo, L.D.; Villavicencio, L.M.M.; Cássia, M. Assessment of urban heat islands in brazil based on modis remote sensing data. Urban Clim. 2021, 35, 100726. [Google Scholar] [CrossRef]
- Shirani-Bidabadi, N.; Nasrabadi, T.; Faryadi, S.; Larijani, A.; Shadman Roudposhti, M. Evaluating the spatial distribution and the intensity of urban heat island using remote sensing, case study of isfahan city in iran. Sustain. Cities Soc. 2019, 45, 686–692. [Google Scholar] [CrossRef]
- Zhang, M.D.; Feng, X.Q. Comprehensive evaluation of urban resilience in China. Urban Issues 2018, 279, 27–36. [Google Scholar]
- Zhang, P.; Yu, W.; Zhang, Y.W. Spatial and temporal divergence of urban resilience in Shandong Province and its influencing factors. Urban Issues 2018, 278, 27–34. [Google Scholar]
- Liu, L.; Lei, Y.; Zhuang, M.; Ding, S. The impact of climate change on urban resilience in the Beijing-Tianjin-Hebei region. Sci. Total Environ. 2022, 827, 154157. [Google Scholar] [CrossRef] [PubMed]
- Duan, W.Q.; Joseph, D.M.; Adnan, K.; Ma, D. Industrial structure conditions economic resilience. Technol. Forecast. Soc. Change 2022, 183, 121944. [Google Scholar] [CrossRef]
- Yang, C.; Liu, H.; Li, Q.; Cui, A.; Xia, R.; Shi, T.; Zhang, J.; Gao, W.; Zhou, X. Rapid Urbanization Induced Extensive Forest Loss to Urban Land in the Guangdong-Hong Kong-Macao Greater Bay Area, China. Ecol. Indic. 2021, 115, 106373. [Google Scholar] [CrossRef]
- Chu, X.J. Research on the Influence of Winter Climate Factors on the Snail Situation in Poyang Lake; Chinese Center for Disease Control and Prevention: Beijing, China, 2010. (In Chinese) [Google Scholar]
- Song, C.; Yang, J.; Wu, F.; Xiao, X.; Xia, J.; Li, X. Response characteristics and influencing factors of carbon emissions and land surface temperature in Guangdong Province, China. Urban Clim. 2022, 46, 101330. [Google Scholar] [CrossRef]
- Wang, H.; Xue, H.; He, W.; Han, Q.; Xu, T.; Gao, X.; Liu, S.; Jiang, R.; Huang, M. Spatial-temporal evolution mechanism and dynamic simulation of the urban resilience system of the Guangdong-Hong Kong-Macao Greater Bay Area in China. Environ. Impact Assess. Rev. 2023, 104, 107333. [Google Scholar] [CrossRef]
- Liu, L.; Lei, Y.; Fath, B.D.; Hubacek, K.; Yao, H.; Liu, W. The spatio-temporal dynamics of urban resilience in China’s capital cities. J. Clean. Prod. 2022, 379, 134400. [Google Scholar] [CrossRef]
- Chen, X.L.; Yu, L.X.; Lin, W.D.; Yang, F.Q.; Li, Y.P.; Tao, J.; Cheng, S. Urban resilience assessment from the multidimensional perspective using dynamic Bayesian network: A Case Study of Fujian Province, China. Reliab. Eng. Syst. Saf. 2023, 238, 109469. [Google Scholar] [CrossRef]
- Han, S.; Wang, B.; Ao, Y.B.; Homa, B.; Chai, B.B. The coupling and coordination degree of urban resilience system: A case study of the Chengdu-Chongqing urban agglomeration. Environ. Impact Assess. Rev. 2023, 101, 107145. [Google Scholar] [CrossRef]
- Shi, C.; Guo, N.; Gao, X.; Wu, F. How carbon emission reduction is going to affect urban resilience. J. Clean. Prod. 2022, 372, 133737. [Google Scholar] [CrossRef]
- Liu, L.N.; Zhang, Z.C.; Ding, S.H.; Yang, F.; Fu, T.R. Combined effects of climate change on urban resilience in the Tibetan Plateau. Environ. Impact Assess. Rev. 2023, 102, 107186. [Google Scholar] [CrossRef]
- Zhao, R.; Fang, C.; Liu, H.; Liu, X. Evaluating urban ecosystem resilience using the DPSIR framework and the ENA model: A case study of 35 cities in China. Sustain. Cities Soc. 2021, 72, 102997. [Google Scholar] [CrossRef]
- Tang, D.C.; Li, J.N.; Zhao, Z.Q.; Valentina, B.; David, D.L. The influence of industrial structure transformation on urban resilience based on 110 prefecture-level cities in the Yangtze River. Sustain. Cities Soc. 2023, 96, 104621. [Google Scholar] [CrossRef]
- Hu, X.; Su, Y.; Kefeng, R.; Song, F.; Xue, R. Measurement and influencing factors of urban traffic ecological resilience in developing countries: A case study of 31 Chinese cities. Reg. Sustain. 2021, 2, 211–223. [Google Scholar] [CrossRef]
- Wang, H.; Liu, Z.; Zhou, Y. Assessing urban resilience in China from the perspective of socioeconomic and ecological sustainability. Environ. Impact Assess. Rev. 2023, 102, 107163. [Google Scholar] [CrossRef]
- Jiao, L.D.; Wang, L.W.; Lu, H.; Fan, Y.W.; Zhang, Y.; Wu, Y. An assessment model for urban resilience based on the pressure-state-response framework and BP-GA neural network. Urban Clim. 2023, 49, 101543. [Google Scholar] [CrossRef]
- Hwang, C.L.; Yoon, K.P. Multiple Attribute Decision Making: Methods and Applications. A State-of-the-Art Survey; Springer: Berlin/Heidelberg, Germany, 1981. [Google Scholar]
- Hsu, P.F.; Hsu, M.G. Optimizing the information outsourcing practices of primary care medical organizations using entropy and TOPSIS. Qual. Quant. 2008, 42, 181–201. [Google Scholar] [CrossRef]
- Jozi, S.A.; Shafiee, M.; MoradiMajd, N.; Saffarian, S. An integrated Shannon’s Entropy–TOPSIS methodology for environmental risk assessment of Helleh protected area in Iran. Environ. Monit. Assess. 2012, 184, 6913–6922. [Google Scholar] [CrossRef]
- Kingir, S.; Karakas, A.; Öztel, A. Evaluation of university employees’ work behaviours performance via entropy based TOPSIS methods. Elektron. Sos. Bilim. Derg. 2016, 15, 1046–1058. [Google Scholar] [CrossRef]
- Zhu, Y.; Zhang, C.; Fang, J.M.; Miao, Y.J. Paths and strategies for a resilient megacity based on the water-energy-food nexus. Sustain. Cities Soc. 2022, 82, 103892. [Google Scholar] [CrossRef]
- Li, X.; Meng, X.; Ji, X.; Zhou, J.; Pan, C.; Gao, N. Zoning technology for the management of ecological and clean small-watersheds via k-means clustering and entropy-weighted TOPSIS: A case study in Beijing. J. Clean. Prod. 2023, 397, 136449. [Google Scholar] [CrossRef]
- Wang, H.; Du, S.; Zhong, Y.; Liu, S.; Xu, T.; Zhao, Y.; He, W.; Xue, H.; He, Y.; Gao, X.; et al. Unveiling the impact mechanism of urban resilience on carbon dioxide emissions of the Pearl River Delta urban agglomeration in China. Environ. Impact Assess. Rev. 2024, 105, 107422. [Google Scholar] [CrossRef]
- Wang, S.J.; Cui, Z.T.; Lin, J.J.; Xie, J.Y.; Su, K. The coupling relationship between urbanization and ecological resilience in the Pearl River Delta. J. Geogr. Sci. 2022, 32, 44–64. [Google Scholar] [CrossRef]
- Song, Q.J.; Zhou, N.; Liu, T.L.; Siehr, S.A.; Qi, Y. Investigation of a “coupling model” of coordination between low-carbon development and urbanization in China. Energy Policy 2018, 121, 346–354. [Google Scholar] [CrossRef]
- Hong, T.; Wang, B.; Li, L.L. The coupling relationship between urban resilience level and urbanization level in Hefei. Math. Probl. Eng. 2022, 2022, 7339005. [Google Scholar] [CrossRef]
- Luo, X.; Cheng, C.; Pan, Y.; Yang, T.T. Coupling coordination and influencing factors of land development intensity and urban resilience of the Yangtze River Delta urban agglomeration. Water 2022, 14, 1083. [Google Scholar] [CrossRef]
- Li, Y.F.; Li, Y.; Zhou, Y.; Shi, Y.L.; Zhu, X.D. Investigation of a coupling model of coordination between urbanization and the environment. J. Environ. Manag. 2012, 98, 127–133. [Google Scholar] [CrossRef] [PubMed]
- Tomal, M. Evaluation of coupling coordination degree and convergence behaviour of local development: A spatiotemporal analysis of all polish municipalities over the period 2003–2019. Sustain. Cities Soc. 2021, 71, 102992. [Google Scholar] [CrossRef]
- Tian, Y.; Huang, P.; Zhao, X. Spatial analysis, coupling coordination, and efficiency evaluation of green innovation: A case study of the Yangtze River Economic Belt. PLoS ONE 2020, 15, e0243459. [Google Scholar] [CrossRef] [PubMed]
- Liu, N.; Liu, C.; Xia, Y.; Da, B. Examining the coordination between urbanization and eco-environment using coupling and spatial analyses: A case study in China. Ecol. Indic. 2018, 93, 1163–1175. [Google Scholar] [CrossRef]
- Gencer. How to Make Cities More Resilient: A Handbook for Local Government Leaders. United Nations Office for Disaster Risk Reduction Making Cities Resilient 2030 (MCR2030). 2017. Available online: https://www.undrr.org/publication/how-make-cities-more-resilient-handbook-local-government-leaders-2017 (accessed on 10 March 2022).
- Mahmood, R.; Pielke, R.A., Sr.; Hubbard, K.G.; Niyogi, D.; Dirmeyer, P.A.; McAlpine, C.; Bonan, G. Land cover changes and their biogeophysical effects on climate. Int. J. Clim. 2014, 34, 929–953. [Google Scholar] [CrossRef]
- Li, X.; Zhou, Y.; Asrar, G.R.; Imhoff, M.; Li, X. The surface urban heat island response to urban expansion: A panel analysis for the conterminous United States. Sci. Total Environ. 2017, 605, 426–435. [Google Scholar] [CrossRef]
- Song, Q.; Zhong, S.; Chen, J.; Yang, C.; Zhu, Y. Spatio-temporal evolution of city resilience in the Yangtze River Delta, China, from the perspective of statistics. Sustainability 2023, 15, 1538. [Google Scholar] [CrossRef]
- Xi, Z.J.; Li, C.S.; Zhou, L.; Yang, H.J.; Burghardt, R. Built environment influences on urban climate resilience: Evidence from extreme heat events in Macau. Sci. Total Environ. 2023, 859, 160270. [Google Scholar] [CrossRef] [PubMed]
- Nuruzzaman, M. Urban heat island: Causes, effects and mitigation measures-a review. Int. J. Environ. Monit. Anal. 2015, 3, 67–73. [Google Scholar] [CrossRef]
- Giridharan, R.; Ganesan, S.; Lau, S.S.Y. Daytime urban heat island effect in high-rise and high-density residential developments in Hong Kong. Energy Build. 2004, 36, 525–534. [Google Scholar] [CrossRef]
- Tran, D.X.; Pla, F.; Latorre-Carmona, P.; Myint, S.W.; Caetano, M.; Kieu, H.V. Characterizing the relationship between land use land cover change and land surface temperature. ISPRS J. Photogramm. Remote Sens. 2017, 124, 119–132. [Google Scholar] [CrossRef]
- Chun, B.; Guldmann, J.M. Spatial statistical analysis and simulation of the urban heat island in high-density central cities. Landsc. Urban Plan. 2014, 125, 76–88. [Google Scholar] [CrossRef]


| Grade | UHI Intensity Range | UHI Rating |
|---|---|---|
| 1 | <−1 | Negative UHI |
| 2 | −1~1 | No UHI |
| 3 | 1~2 | Weak UHI |
| 4 | 2~3 | Sub-intense UHI |
| 5 | >3 | Intense UHI |
| D | D’s Grade | D | D’s Grade |
|---|---|---|---|
| 0.0 ≤ D < 0.1 | Extreme disorder | 0.5 ≤ D < 0.6 | Barely disorder |
| 0.1 ≤ D < 0.2 | Severe disorder | 0.6 ≤ D < 0.7 | Primary coordination |
| 0.2 ≤ D < 0.3 | Moderate disorder | 0.7 ≤ D < 0.8 | Moderate Coordination |
| 0.3 ≤ D < 0.4 | Mild disorder | 0.8 ≤ D < 0.9 | Good Coordination |
| 0.4 ≤ D < 0.5 | Nearly disorder | 0.9 ≤ D ≤ 1.0 | High Coordination |
| Guideline Level | Indicator Level | Unit |
|---|---|---|
| Meteorological conditions | Y1: Average temperature | °C |
| Y2: Precipitation | mm | |
| Y3: Average wind speed | m/s | |
| Greenhouse gas emissions | Y4: Average CO2 emissions | kg/m2/s |
| Green space | Y5: Green coverage of the district | % |
| Population distribution | Y6: Population density | person/km2 |
| City size | Y7: Average nighttime light intensity | / |
| Economic development | Y8: Per capita gross regional product | CNY |
| Year | Macao | Dongguan | Foshan | Guangzhou | Huizhou | Jiangmen |
| 2000 | 0.224 | 0.107 | 0.123 | 0.146 | 0.140 | 0.129 |
| 2005 | 0.248 | 0.103 | 0.112 | 0.176 | 0.136 | 0.123 |
| 2010 | 0.290 | 0.130 | 0.121 | 0.215 | 0.138 | 0.127 |
| 2015 | 0.365 | 0.180 | 0.141 | 0.283 | 0.147 | 0.128 |
| 2019 | 0.398 | 0.269 | 0.185 | 0.427 | 0.155 | 0.144 |
| Year | Shenzhen | Zhaoqing | Zhongshan | Zhuhai | Hongkong | Average |
| 2000 | 0.153 | 0.118 | 0.130 | 0.150 | 0.293 | 0.156 |
| 2005 | 0.180 | 0.119 | 0.125 | 0.151 | 0.323 | 0.163 |
| 2010 | 0.257 | 0.106 | 0.127 | 0.172 | 0.387 | 0.188 |
| 2015 | 0.380 | 0.120 | 0.140 | 0.193 | 0.434 | 0.228 |
| 2019 | 0.567 | 0.129 | 0.148 | 0.207 | 0.486 | 0.283 |
| Year | Moran’s I | Year | Moran’s I |
|---|---|---|---|
| 2000 | 0.245 | 2010 | 0.303 * |
| 2001 | 0.249 | 2011 | 0.315 * |
| 2002 | 0.245 | 2012 | 0.326 * |
| 2003 | 0.249 | 2013 | 0.333 * |
| 2004 | 0.250 | 2014 | 0.331 * |
| 2005 | 0.246 | 2015 | 0.343 * |
| 2006 | 0.260 | 2016 | 0.334 * |
| 2007 | 0.275 * | 2017 | 0.345 * |
| 2008 | 0.279 * | 2018 | 0.311 * |
| 2009 | 0.304 * | 2019 | 0.320 * |
| Year | D | D’s Grade | Year | D | D’s Grade |
|---|---|---|---|---|---|
| 2000 | 0.510 | Barely coordinated | 2010 | 0.603 | Primary Coordination |
| 2001 | 0.521 | Barely coordinated | 2011 | 0.589 | Barely coordinated |
| 2002 | 0.541 | Barely coordinated | 2012 | 0.604 | Primary Coordination |
| 2003 | 0.563 | Barely coordinated | 2013 | 0.617 | Primary Coordination |
| 2004 | 0.549 | Barely coordinated | 2014 | 0.630 | Primary Coordination |
| 2005 | 0.556 | Barely coordinated | 2015 | 0.615 | Primary Coordination |
| 2006 | 0.562 | Barely coordinated | 2016 | 0.632 | Primary Coordination |
| 2007 | 0.561 | Barely coordinated | 2017 | 0.644 | Primary Coordination |
| 2008 | 0.553 | Barely coordinated | 2018 | 0.662 | Primary Coordination |
| 2009 | 0.561 | Barely coordinated | 2019 | 0.658 | Primary Coordination |
| Cities | 2000 | 2005 | 2010 | 2015 | 2019 |
|---|---|---|---|---|---|
| Macao | 0.629 | 0.692 | 0.734 | 0.769 | 0.783 |
| Dongguan | 0.528 | 0.542 | 0.582 | 0.634 | 0.706 |
| Foshan | 0.486 | 0.547 | 0.565 | 0.574 | 0.632 |
| Guangzhou | 0.506 | 0.563 | 0.572 | 0.607 | 0.702 |
| Huizhou | 0.407 | 0.424 | 0.450 | 0.452 | 0.475 |
| Jiangmen | 0.409 | 0.455 | 0.540 | 0.481 | 0.520 |
| Shenzhen | 0.550 | 0.588 | 0.683 | 0.734 | 0.816 |
| Zhaoqing | 0.322 | 0.409 | 0.362 | 0.318 | 0.362 |
| Zhongshan | 0.501 | 0.553 | 0.579 | 0.590 | 0.603 |
| Zhuhai | 0.476 | 0.555 | 0.615 | 0.632 | 0.640 |
| Hongkong | 0.625 | 0.610 | 0.753 | 0.704 | 0.716 |
| Variables | 2000 | 2005 | 2010 | 2015 | 2019 |
|---|---|---|---|---|---|
| Y1 | 0.235 | 0.358 | 0.626 | 0.348 | 0.093 |
| Y2 | 0.634 | 0.707 | 0.256 | 0.876 | 0.498 |
| Y3 | 0.614 | 0.190 | 0.279 | 0.261 | 0.495 |
| Y4 | 0.371 | 0.514 | 0.455 | 0.307 | 0.402 |
| Y5 | 0.387 | 0.069 | 0.281 | 0.355 | 0.047 |
| Y6 | 0.626 | 0.689 | 0.800 | 0.876 | 0.808 |
| Y7 | 0.314 | 0.358 | 0.286 | 0.876 | 0.613 |
| Y8 | 0.614 | 0.190 | 0.279 | 0.261 | 0.495 |
Disclaimer/Publisher’s Note: The statements, opinions and data contained in all publications are solely those of the individual author(s) and contributor(s) and not of MDPI and/or the editor(s). MDPI and/or the editor(s) disclaim responsibility for any injury to people or property resulting from any ideas, methods, instructions or products referred to in the content. |
© 2024 by the authors. Licensee MDPI, Basel, Switzerland. This article is an open access article distributed under the terms and conditions of the Creative Commons Attribution (CC BY) license (https://creativecommons.org/licenses/by/4.0/).
Share and Cite
Wang, H.; Yang, Y.; Liu, S.; Xue, H.; Xu, T.; He, W.; Gao, X.; Jiang, R. Unveiling the Coupling Coordination and Interaction Mechanism between the Local Heat Island Effect and Urban Resilience in China. Sustainability 2024, 16, 2306. https://doi.org/10.3390/su16062306
Wang H, Yang Y, Liu S, Xue H, Xu T, He W, Gao X, Jiang R. Unveiling the Coupling Coordination and Interaction Mechanism between the Local Heat Island Effect and Urban Resilience in China. Sustainability. 2024; 16(6):2306. https://doi.org/10.3390/su16062306
Chicago/Turabian StyleWang, Huihui, Yunsong Yang, Suru Liu, Hanyu Xue, Tingting Xu, Wanlin He, Xiaoyong Gao, and Ruifeng Jiang. 2024. "Unveiling the Coupling Coordination and Interaction Mechanism between the Local Heat Island Effect and Urban Resilience in China" Sustainability 16, no. 6: 2306. https://doi.org/10.3390/su16062306
APA StyleWang, H., Yang, Y., Liu, S., Xue, H., Xu, T., He, W., Gao, X., & Jiang, R. (2024). Unveiling the Coupling Coordination and Interaction Mechanism between the Local Heat Island Effect and Urban Resilience in China. Sustainability, 16(6), 2306. https://doi.org/10.3390/su16062306