Article

Leveraging Remotely Sensed and Climatic Data for Improved Crop Yield Prediction in the Chi Basin, Thailand

1
Department of Civil Engineering, Faculty of Engineering, Maha Sarakham University, Kantharawichai District, Maha Sarakham 44150, Thailand
2
Department of Civil Engineering, School of Engineering and Industrial Technology, Mahanakorn University of Technology, Bangkok 10530, Thailand
3
Faculty of Engineering, Northeastern University, Muang District, Khon Kaen 40000, Thailand
4
Faculty of Engineering, Rajamangala University of Technology Isan, Khon Kaen Campus, Khon Kaen 40000, Thailand
5
Faculty of Technology and Environment, Phuket Campus, Prince of Songkla University, Phuket 83120, Thailand
6
School of Life Sciences, University of Technology Sydney, Sydney, NSW 2007, Australia
*
Author to whom correspondence should be addressed.
Sustainability 2024, 16(6), 2260; https://doi.org/10.3390/su16062260
Submission received: 1 February 2024 / Revised: 24 February 2024 / Accepted: 5 March 2024 / Published: 8 March 2024
(This article belongs to the Topic Big Data and Artificial Intelligence, 2nd Volume)

Abstract

:
Predictions of crop production in the Chi basin are of major importance for decision support tools in countries such as Thailand, which aims to increase domestic income and global food security by implementing the appropriate policies. This research aims to establish a predictive model for predicting crop production for an internal crop growth season prior to harvest at the province scale for fourteen provinces in Thailand’s Chi basin between 2011 and 2019. We provide approaches for reducing redundant variables and multicollinearity in remotely sensed (RS) and meteorological data to avoid overfitting models using correlation analysis (CA) and the variance inflation factor (VIF). The temperature condition index (TCI), the normalized difference vegetation index (NDVI), land surface temperature (LSTnighttime), and mean temperature (Tmean) were the resulting variables in the prediction model with a p-value < 0.05 and a VIF < 5. The baseline data (2011–2017: June to November) were used to train four regression models, which revealed that eXtreme Gradient Boosting (XGBoost), random forest (RF), and XGBoost achieved R2 values of 0.95, 0.94, and 0.93, respectively. In addition, the testing dataset (2018–2019) displayed a minimum root-mean-square error (RMSE) of 0.18 ton/ha for the optimal solution by integrating variables and applying the XGBoost model. Accordingly, it is estimated that between 2020 and 2022, the total crop production in the Chi basin region will be 7.88, 7.64, and 7.72 million tons, respectively. The results demonstrated that the proposed model is proficient at greatly improving crop yield prediction accuracy when compared to a conventional regression method and that it may be deployed in different regions to assist farmers and policymakers in making more informed decisions about agricultural practices and resource allocation.

1. Introduction

Rice is a major agricultural commodity in Thailand and an important contributor to the country’s economy. According to data from the United Nations Food and Agriculture Organization (FAO), Thailand was the world’s second-largest exporter of rice in 2018, with exports valued at around $7.4 billion [1]. Thailand is the world’s biggest producer of milled rice, producing approximately 20.3 million metric tons in 2018, equivalent to approximately 17.6 million metric tons of paddy rice [1]. The main rice-producing regions in Thailand are the central, northeastern, and northern regions, with the central region accounting for the largest share of production [2]. The rice sector is a significant contributor to Thailand’s GDP, accounting for approximately 3.3% in 2018 [3]. Rice farming is also a vital source of business and income for many smallholder farmers in Thailand, with the sector employing around 10 million people, or approximately 20% of the country’s total workforce [2], and it can also account for a significant portion of the income of smallholder farmers, with some estimates suggesting that rice can make up to 60% of their income [3]. As a result, rice yield has become an important variable for maximizing the efficiency of rice production and fulfilling the increasing demand for rice, especially as the world’s population grows. Yet, many factors can affect rice productivity, including environmental factors, physical factors, and farmer quantities. Thailand has faced the previously stated factors for many decades. Currently, land use change and climate change are the major concern to every sector, particularly developing countries. Land use change and climate change are major drivers of crop yield variations, with both expected to have significant impacts on agricultural productivity [4]. Climate change, through warming temperatures, extreme weather events, and altered precipitation patterns, can lead to yield reductions. Land use transformation, including the conversion of agricultural to urban or industrial use, can also influence crop yields by altering the availability of land and resources for agriculture [5].
Moreover, natural disasters, such as droughts and floods, can significantly affect rice yield and production by causing damage to crops, disrupting the growing season, and reducing overall yield. These hazards may result in complete crop failures or have a more limited impact, depending on the severity of the incident and the vulnerability of the disturbed region. Rice production is concentrated in some parts of the world, such as Thailand, which may be more vulnerable to natural disasters due to its position and environment. For example, seven typhoons in 2021 caused flooding in Thailand, which may wreak havoc on rice crop production in 0.85 million hectares of agricultural areas and result in farmers losing around USD 220 million or 30% of productivity [6].
Additionally, drought is a common occurrence in Thailand, which has a tropical climate and is prone to dry spells and water shortages. According to the report, Thailand suffered from long-term drought conditions that affected approximately 3.8 million hectares of the whole country in 2021, and it is expected to increase and become more severe every year [7]. Nevertheless, every factor that impacts rice production can directly affect rice growth phases, for example, reducing the leaf area index (LAI), deformation of the leaf, little growth, green to pale-colored leaves, dwarf, and lesions on the leaves.
Crop yield measurement in massive agricultural areas is difficult to verify under current circumstances, such as time, budgetary, and surveyor constraints. Recently, a data-driven remote sensing approach has become efficient in measuring crop conditions and predicting crop yield production from a distance without being physically present in the study area. This can be performed using various sensors and platforms, including satellites, which can collect data on various aspects of the surface of the Earth, including land usage, vegetation, and weather patterns. There are many studies that utilize remote sensing data to forecast agricultural crop production [8,9,10,11,12]. The weather factors have long been used to explain crop yield fluctuations. For instance, [13] applied machine learning (ML) with land surface temperature (LST), the enhanced vegetation index (EVI), and the normalized difference vegetation index (NDVI) from MODIS satellite and weather variables to improve soybean yield forecasts with a mean absolute error of around 0.24 to 0.42 Mg/ha. The study by [14] employed LST and air temperature to foresee corn outcomes across the US with an r-square of 0.56 to 0.65. In addition, [15] indicated that the eXtreme Gradient Boosting (XGBoost) Machine Learning (ML) method exhibited the best metrics, which can reduce the predicting errors of cereal yield by combining remote sensing data and weather data in Morocco. Additionally, several studies used drought and health indices that were obtained from computed indices of remotely sensed data, such as the vegetation health index [16], the temperature condition index (TCI) [17], and the vegetation condition index (VCI) [18,19]. They outperform the use of health and drought indicators to predict crop production when combined with machine learning technologies [15].
Accurate and up-to-date prediction of crop yields is essential for sustainable food security and agriculture because it helps farmers by providing decision support systems about planting and harvesting and enables policymakers to plan for and address potential food shortages. The conventional regression approaches have been overcome by ML and deep learning to provide precise and accurate statistical predictions [20,21]. Several studies have recently observed the statistical metrics of ML algorithms, for instance, support vector regression (SVR) [22], random forest (RF) regression [23], and XGBoost regression [24], to predict crop production at local (i.e., province) scales. The study by [8] investigated eight different ML classifiers and regressors to forecast the outcome of wheat in the winter season in China. The result indicated that SVR, RF, and Gaussian process regression (GPR) denote the top three of the greatest methods for prediction, amongst others, with an r-square > 0.75. ML approaches are popular and outperform results when applied to crop yield prediction in many aspects, but there is evidence that the multivariate ordinary least squares approach can provide a lower error rate of soybean yield prediction than RF and long short-term memory (LSTM) [13]. Then, linear regression and ML regression have been compared [25]. Moreover, hyperparameter tuning of ML models is complicated to adjust, so grid search cross-validation (CV) has been developed [26] to apply to crop yield prediction. However, a number of studies have attempted to forecast agricultural yield at the regional level using remote sensing data without taking meteorological information into account. These are the primary elements that have a significant impact on crop yield. For instance, [27] found that the root-mean-square error (RMSE), which is based on remote sensing data, ranged from 14% to 49%. The study by [28] illustrated how remote sensing data could be used to predict wheat yields in Australia. According to the findings, the RMSE varies depending on the research locations and is between 0.07 and 0.25 t/ha−1. It is unclear if using solely remote sensing data or combining them with climatic data can produce accurate results, especially in tropical areas. As a result, the goal of this work is to demonstrate and offer not just input datasets but also model methods that can minimize crop production forecast errors.
The objective of this study is to test the capability of MLR models and machine learning (RF, XGBoost, and SVR) to predict crop yields. The model uses several variables, including various indices derived from satellite images and climate variables. Before performing the models, the variable selection process will be conducted to identify the most relevant predictors of crop yield in the Chi basin area. Different combinations of predictor variables will be tested. In addition, all models will be used to train and test to validate using metric assessments, such as the coefficient of determination (R2) and RMSE. The comparison of model assessment with the testing dataset will be performed, and the outstanding model among others will be applied to predict crop yields at the provincial scale.
This study makes several significant contributions to crop yield prediction. Firstly, it pioneers the integration of climatic and remote sensing data-driven approaches to analyze and predict crop yield at the provincial scale. By combining climate datasets with crop phenology, this study provides a comprehensive understanding of the climatic drivers influencing crop production, thereby advancing yield management strategies. Secondly, this study introduces a novel combination of multiple aspect indicators derived from remote sensing imagery, enhancing the precision and applicability of climatic analyses for predicting crop yield. Thirdly, this study innovatively uses crop phenological phases as a reference in time for identifying factors that influence yield. Together, these contributions significantly advance our understanding of crop yield prediction and have practical implications for agriculture and public policy. Lastly, this research has the potential to serve as a foundational system to help farmers and government entities make informed decisions and formulate effective intervention policies.

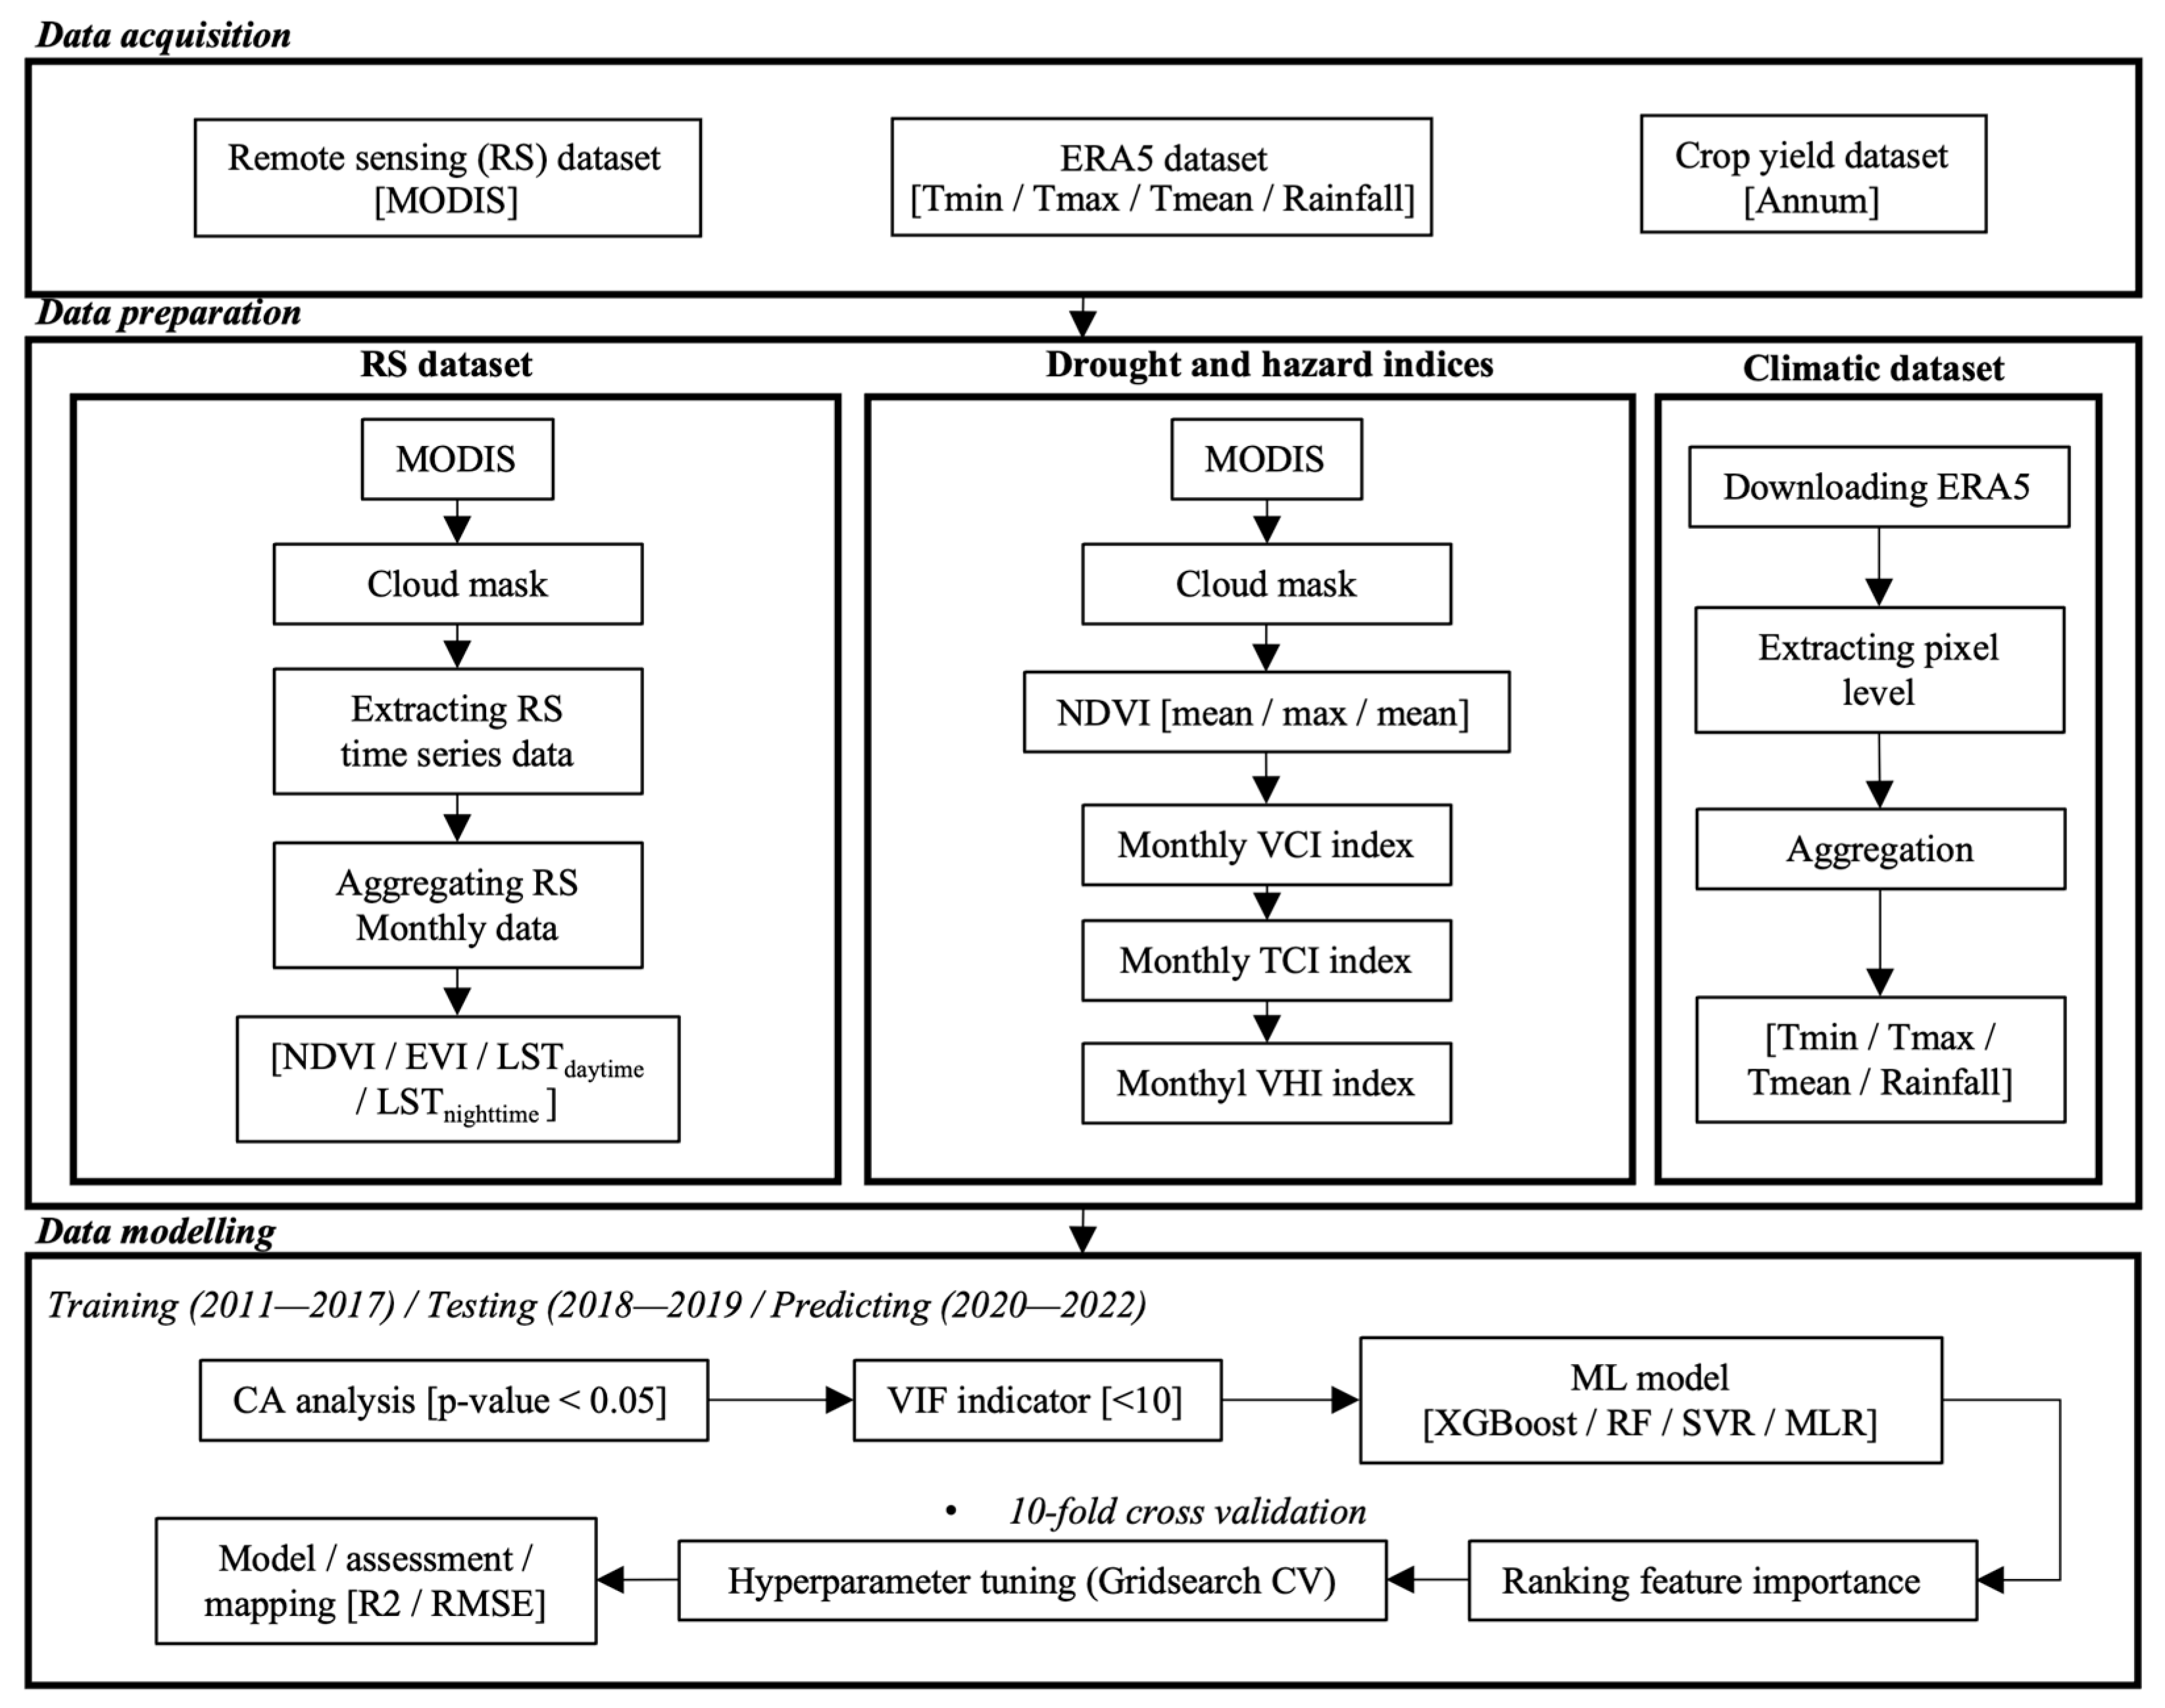
2. Materials and Methods
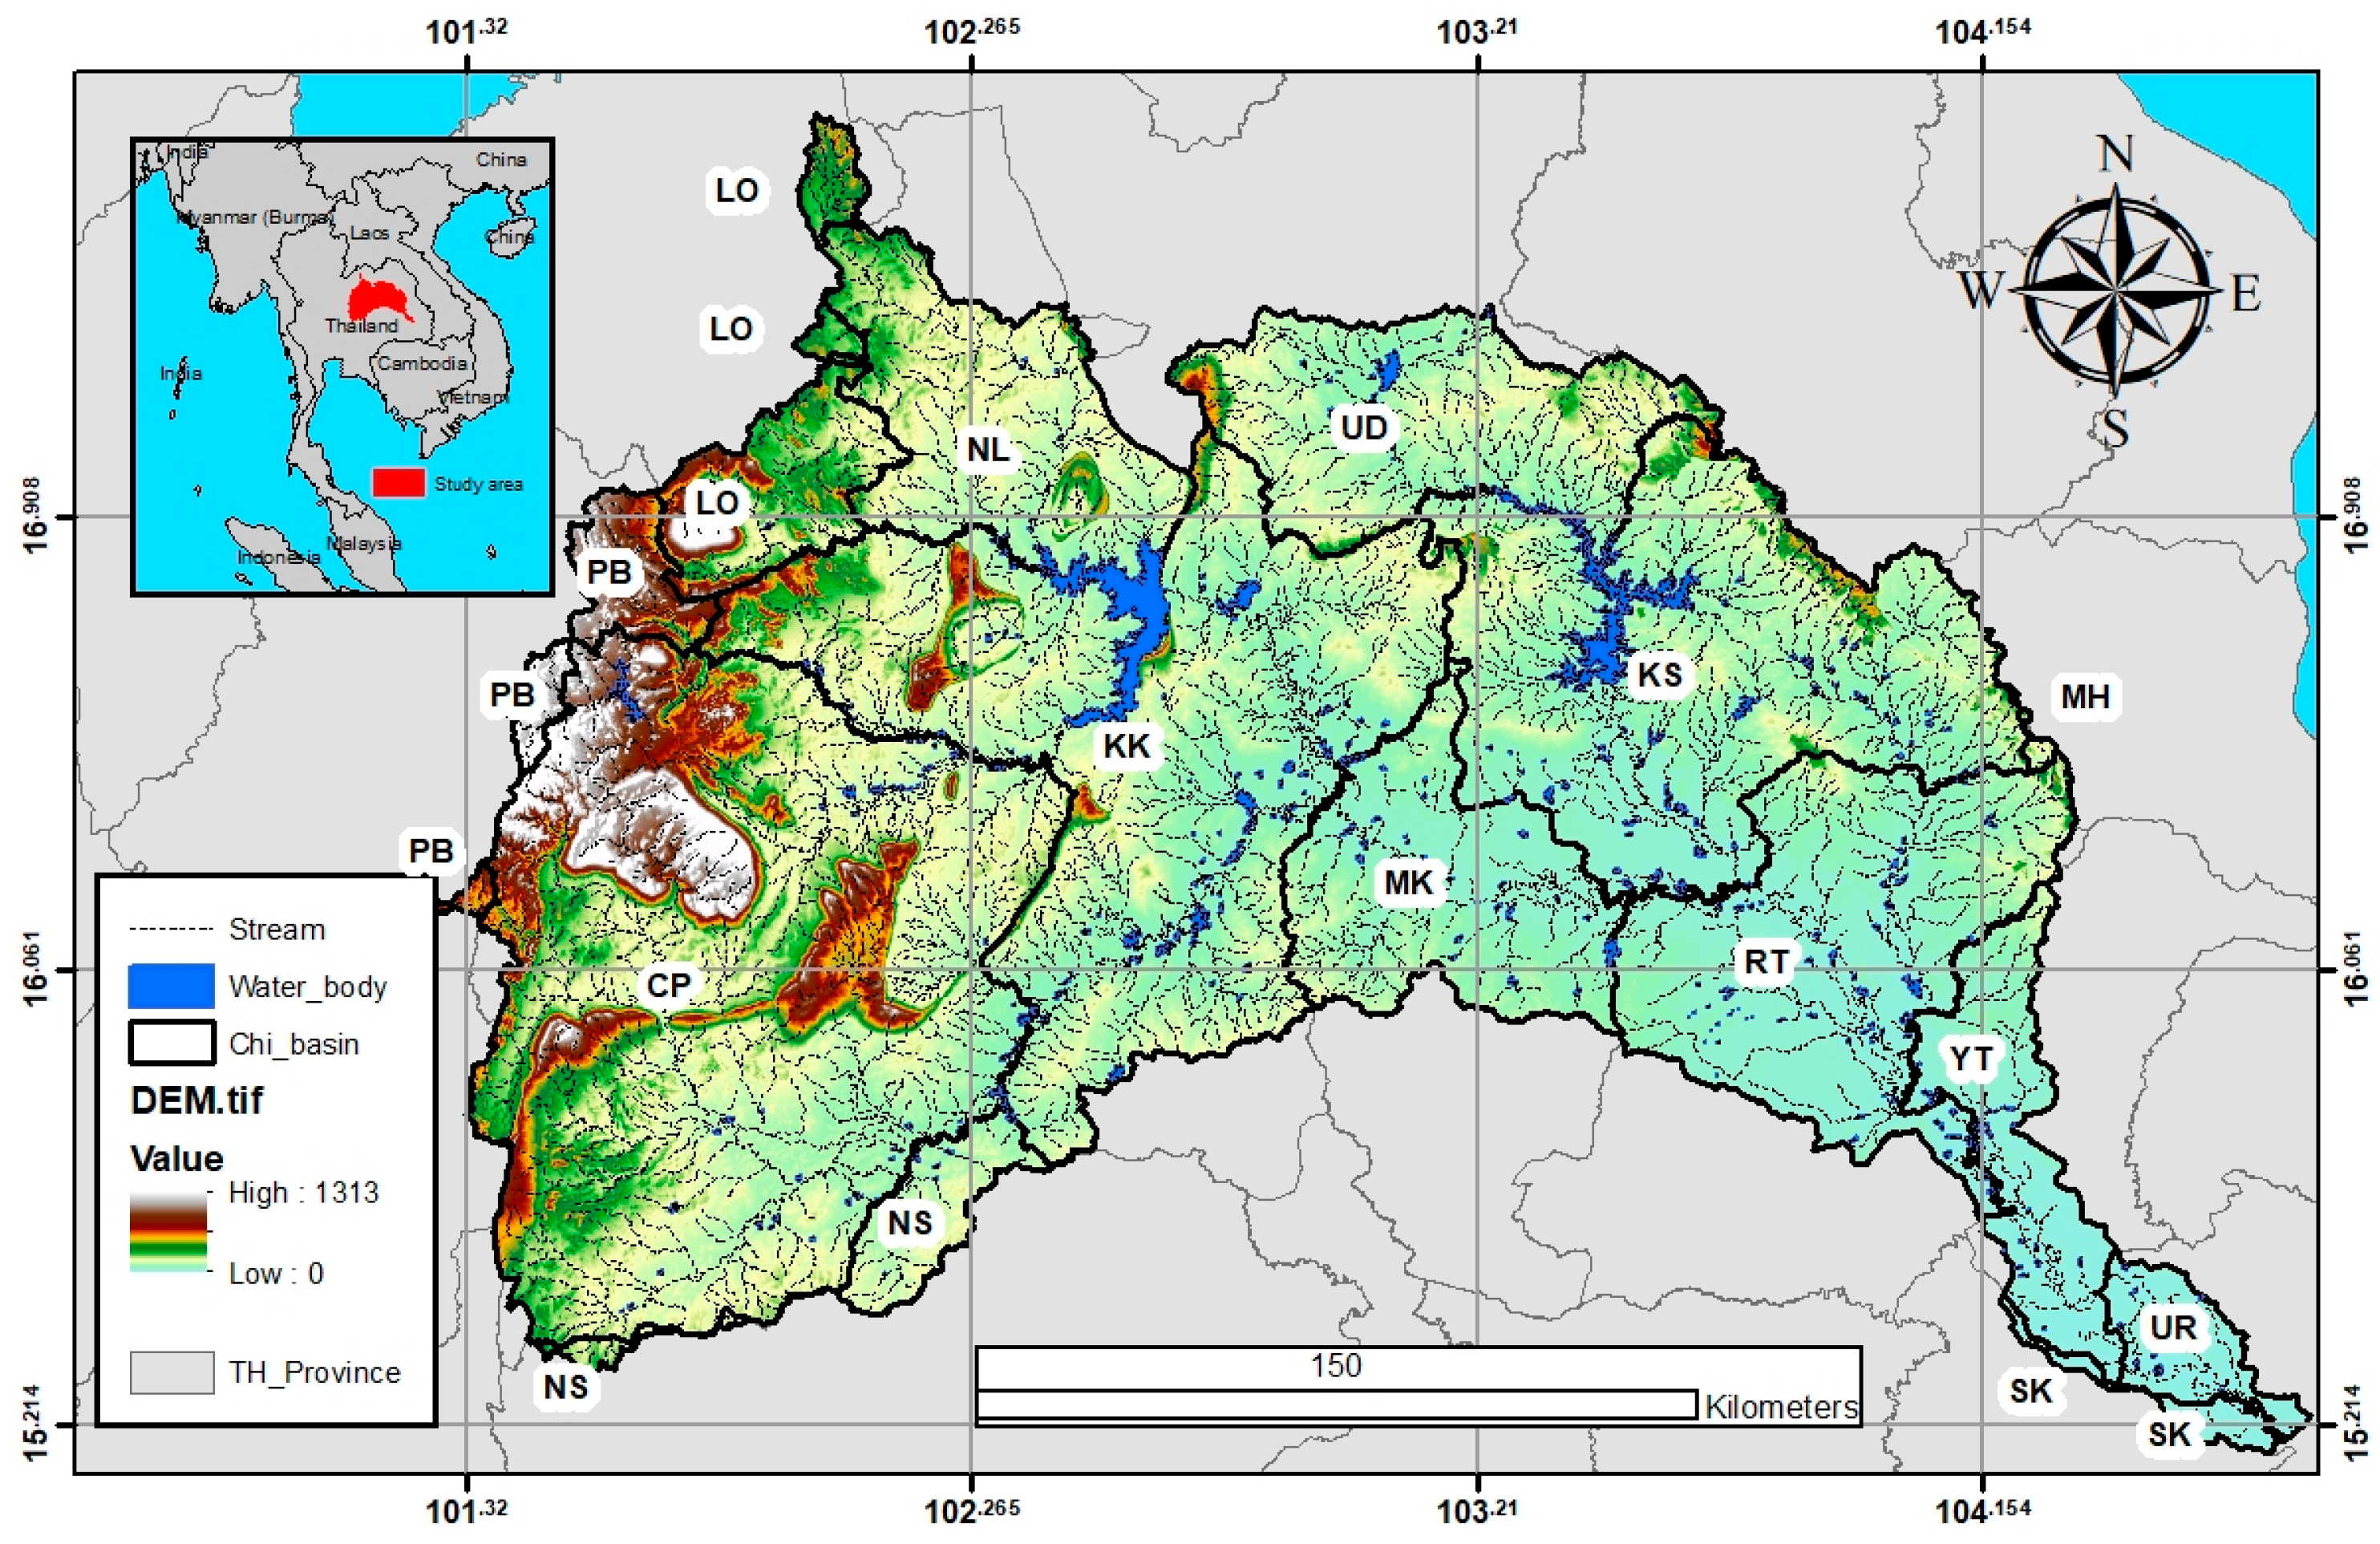
2.1. Study Area

The Chi basin is a region situated in central Thailand, positioned between 15°13′ and 17°40′ N latitude and 101°14′ and 104°46′ E longitude, and ranging in altitude from 104 to 1060 m above mean sea level (Figure 1). The study area covers approximately 4.91 million hectares, with approximately 3.22 million hectares of cropland (https://esa-worldcover.org/en/data-access, accessed on 1 August 2022). The climate of the Chi basin is characterized by humid and hot conditions, with average temperatures ranging from 27 to 32 °C. The region experiences two monsoon seasons: the Southwest Monsoon, which brings wet and rainy conditions from May to October, and the Northeast Monsoon, which brings dry and cool conditions from November to April. The rainy season in the Chi basin typically lasts from May to October, with an average annual rainfall of 1380 mm. Crop cultivation in the region typically occurs from June to November, with harvest occurring in December [29].

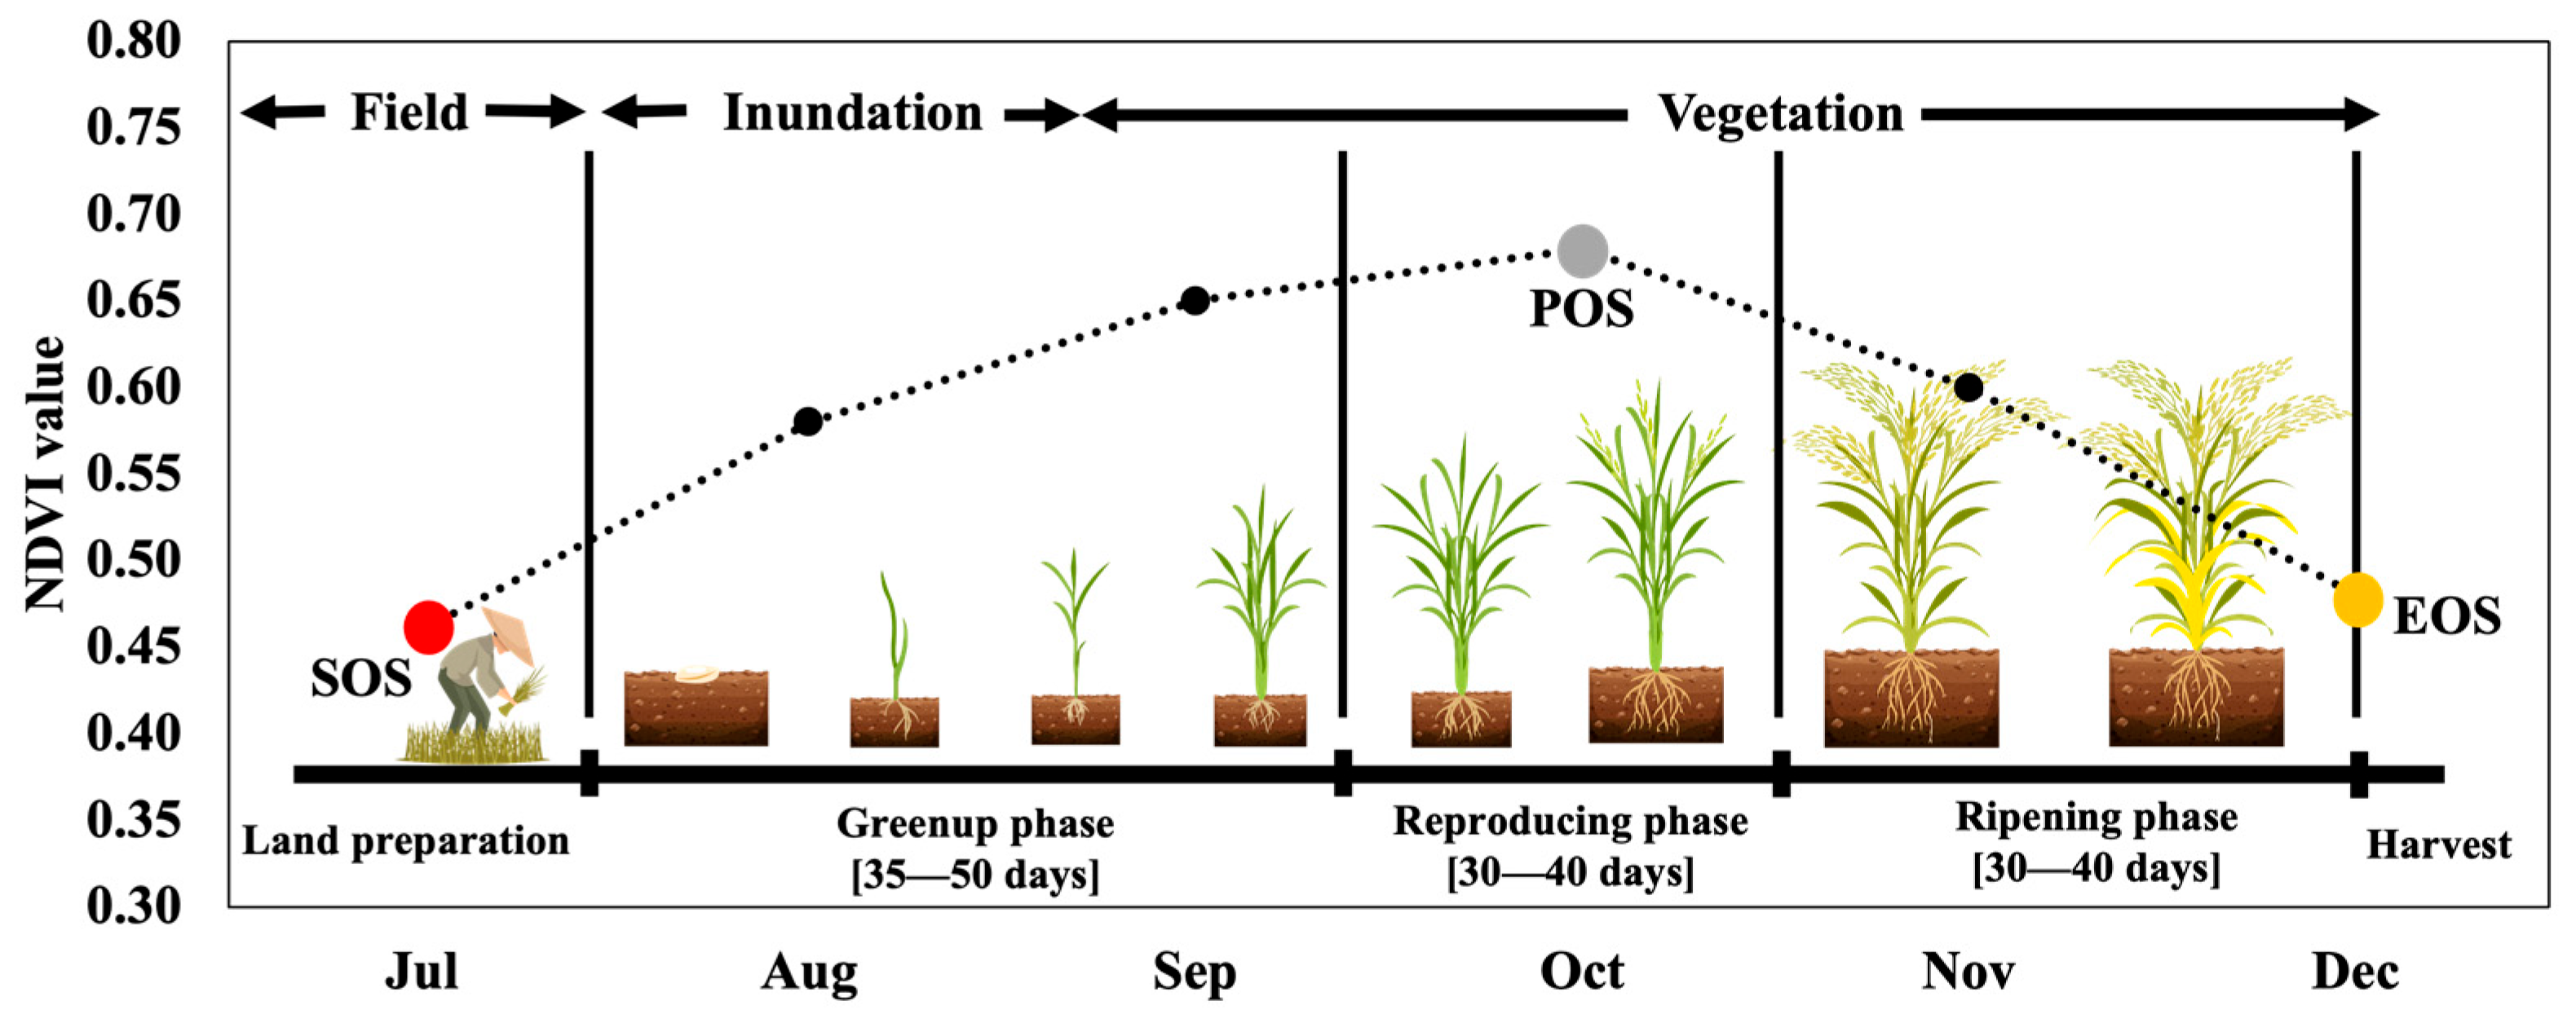
2.2. Crop Yield Data and Their Phenology

In this study, historical crop yield at the administrative provincial scale is derived between 2011 and 2019 from the Office of Agricultural Economics (OAE) for fourteen provinces (https://www.oae.go.th/, accessed on 25 July 2022), which are described in Table 1. Data acquisition involves field observations divided into 24 areas, covering the entire Thailand region. The method includes creating a square box for each sample, followed by rice milling to estimate rice production and convert it into units (ton/ha). Moreover, the annual crop production in this study was calculated as the ratio of total crop production divided by harvested area. The annual crop yield production ranges from 1.97 to 4.4 tons/ha, depending on area.
According to the crop calendar period [30], the crop transplanted in this region is usually planted around June and July, flowers around late October to November, and the harvest is around December. In Thailand, rice grows through several stages, starting with the planting of seedlings and ending with the harvest of mature grains, and the stages are the nursery stage, vegetative growth stage, reproductive growth stage, and maturity stage. These stages take about 5–6 months [31], depending on the environmental condition and variety of crop types (Figure 2). As the rice plant progresses through different stages of growth, its reflectance is impacted at various wavelengths. Studies have revealed that indices used for vegetation, for example, the NDVI, can be used to accurately track rice growth [32,33,34]. During the early vegetative stage, the NDVI is typically low due to the low percentage of vegetation cover. As the plant continues to grow and the chlorophyll content increases, the absorbance of light in the red and blue regions also increases [35]. The reflectance in the near-infrared (NIR) region increases with the development of foliage and tillers. As the plant reaches maturity, the NDVI begins to decrease due to a reduction in biomass, a decrease in chlorophyll content, and an increase in grain filling [36].

2.3. Remotely Sensed Data and Climate Data

The remote sensing (RS) data for the proposed study originated from the Moderate Resolution Imaging Spectroradiometer (MODIS) sensor. The remotely sensed MODIS data are applied to delimit the spatial extent of the crop area in the Chi basin, Thailand. The crop land use masked in this study was derived from the land use data of the Land Development Department (LDD) of Thailand in 2020. The vegetation indices are usually used for vegetation tracking and monitoring. The enhanced vegetation index (EVI), NDVI, and LST daytime and nighttime products of MODIS data were used in this study. As mentioned above, the disaster (drought) and climate were the factors that affected crop productivity. Therefore, drought and healthy conditions, the temperature condition index (TCI), the vegetation condition index (VCI), and and vegetation health index (VHI) were also applied in this study [37,38,39], which can be calculated from the NDVI and temperature [40]. In addition, all remote sensing datasets will be aggregated to monthly mean data. The major climatic factors used in this study were the monthly mean values of rainfall, minimum temperature (Tmin), mean temperature (Tmean), and maximum temperature (Tmax) throughout the crop growth period (June to November). The variables (both predictors and response) used in this study can be summarized as shown in Table 2.

2.4. Feature Selection: Correlation Analysis (CA) and Variance Inflation Factor

There are various factors that can be applied to reduce the overfitting results, such as removing one of the correlated variables, combining correlated variables, and principal component analysis (PCA). In this case, the variable indicators to predict crop yield are limited indicators. However, removing or combining correlated variables is not consistent with this procedure. Likewise, PCA is another approach that can transform multiple correlated variables into one variable to be used as a predictor in the model [41]. However, the limitation of this study is a number of variables. Thus, it is necessary to apply the appropriate approach. On the other hand, the main problem with multiple linear regression is the multicollinear problem, in which some variables are highly correlated together. For the purpose of variable selection, correlation analysis (CA) was used to analyze the correlation between variables. It helps to determine if there is a correlation, or association, between the two variables, along with the intensity and direction of the relationship. Several studies have applied the CA to reduce redundant variables by removing highly co-related variables [42,43,44]. The variance inflation factor (VIF) is a tool used in multiple regression analysis to assess the degree of multicollinearity between independent factors. When two or more predictor variables are extremely related, multicollinearity occurs, which can lead to unstable and unreliable regression coefficient estimates [45,46]. There are studies that attempt to integrate the VIF as an indicator to reduce multicollinearity (VIF < 5–10) [47,48]. The VIF score threshold applied in this study was 5, considerable to moderate correlation. This study applied both statistical methods (i.e., CA and VIF) to analyze the influent factors in crop yield prediction by determining a p-value < 0.05 and a VIF < 5 [49] (Figure 3). The selected variables in this step will be used as the predictor variables for the next step.

2.5. Regression Model

Regression models are statistical methods used to investigate the relationship between one or more independent variables and a dependent variable. Regression models aim to estimate the effect of the independent variables on the dependent variable. These models assume a functional form for this relationship, such as linear or nonlinear. The model parameters are estimated using statistical techniques, and the model’s goodness of fit is assessed using various metrics, such as R2 and RMSE. In addition, the selected variables in the previous step were used as the input variable in the regression model. This study utilized four regression models: multiple linear regression (MLR), random forest (RF) regression, XGBoost regression, and the SVR model. The crop yield dataset (126 samples) was separated into a training dataset (98 samples) (2011–2017) and a testing dataset (28 samples) (2018–2019) (Figure 3). Since machine learning approaches require optimization methods to deal with hyperparameters, grid search cross-validation (GridSearchCV) was utilized to choose the appropriate hyperparameters for each ML model. Since machine learning approaches require optimization methods to deal with hyperparameters, grid search cross-validation (GridSearchCV) from the scikit-learn library in Python was utilized to optimize the hyperparameters of a machine learning model [50]. GridSearchCV exhaustively searches through a specified hyperparameter grid to find the optimal combination of hyperparameters for a given model by training and evaluating the model with different combinations and selecting the combination that performs best according to a chosen evaluation metric [51]. The RMSE and R2 were used to evaluate the performance of a regression model. The regression model was performed in a Python environment using the scikit-learn library. The reliable predictive model will be applied for predicting crop yield at the provincial scale in fourteen provinces and visualized as a map prediction. On the other hand, analyzing trends for future periods is required for farmers and policymakers to make more informed decisions regarding agricultural practices and resource allocation.

3. Results

3.1. Variables Selection

Eliminating redundant variables (keeping the significant variables) is required to reduce misleading and avoid overfitting models. This study applied CA and the VIF as an initial step to remove redundant variables and utilized the remaining crucial variables in the model for predicting crop yields in the Chi basin region. The result indicated that RS data showed six significant variables consisting of the TCI, NDVI, LSTnighttime, VCI, VHI, and EVI, all with p-values of less than 0.05 (Table 3), while climatic data remained only a single variable, that is, Tmean. After applying the VIF, only four variables remain (Table 3). Therefore, the variables selected for the training and testing model that provided a VIF lower than 5 are the TCI, NDVI, LSTnighttime for RS data, and Tmean for climatic data, which range from 1.31 to 2.17 (Table 3).

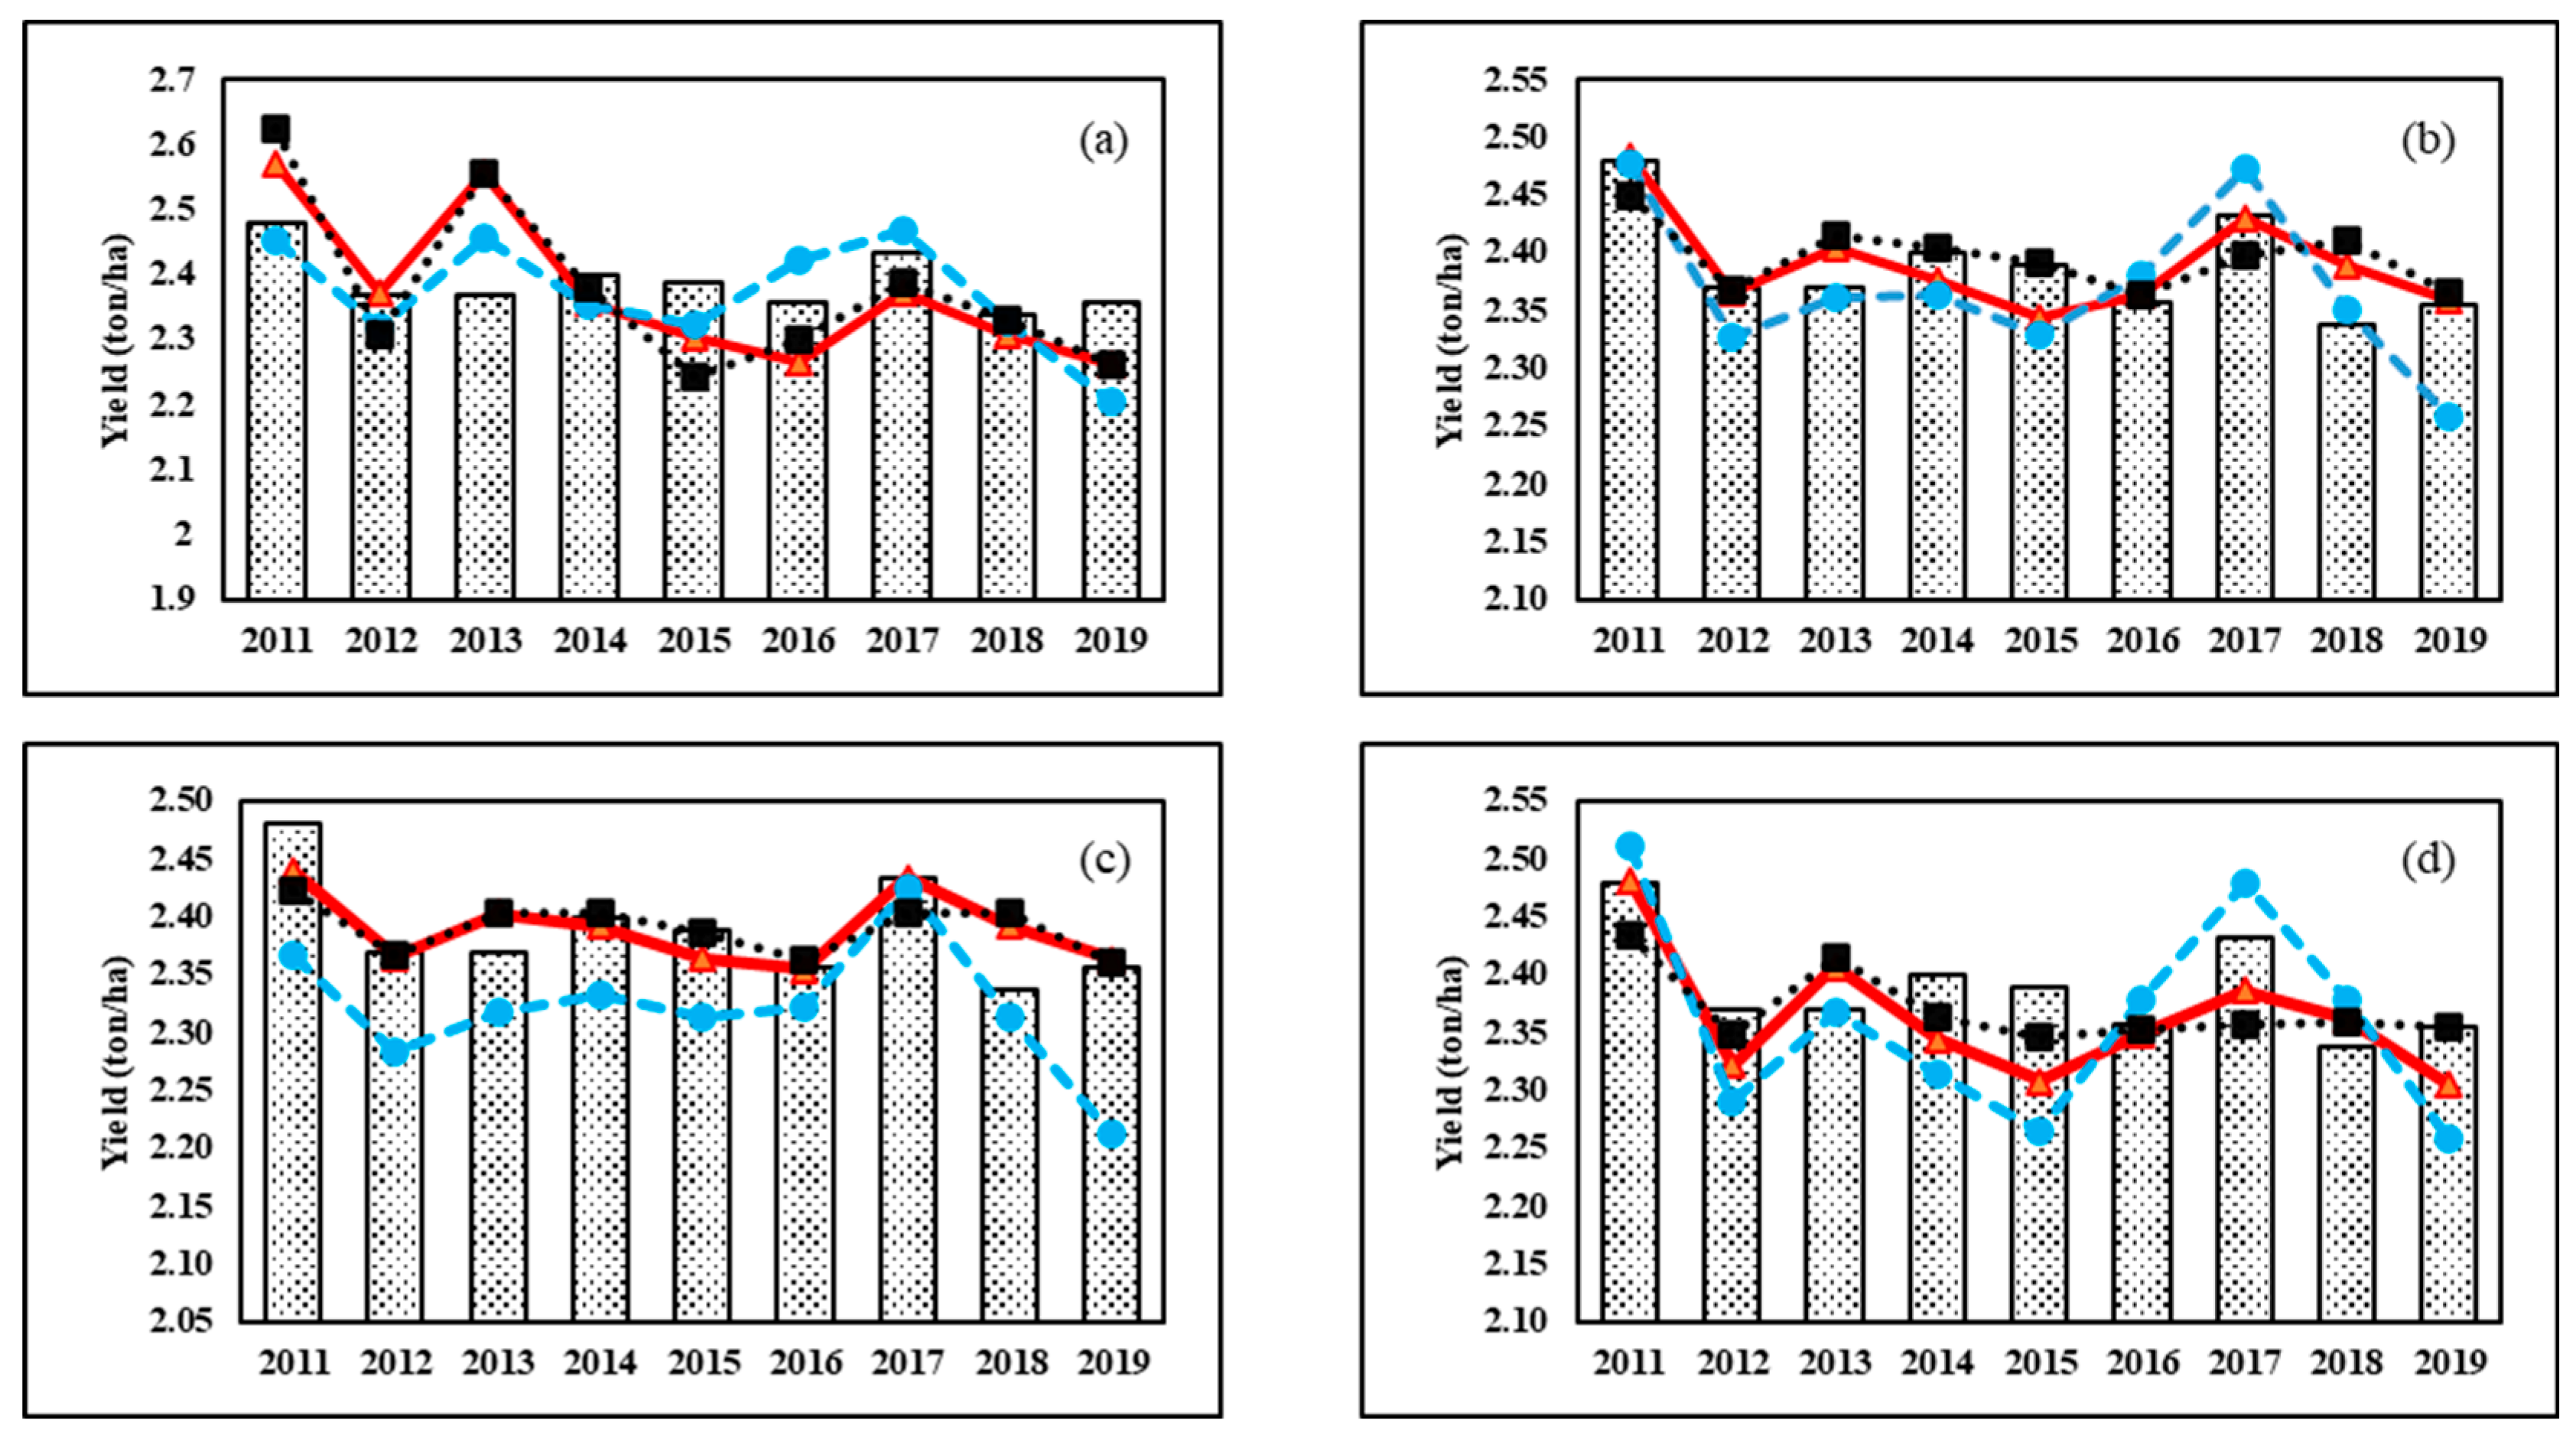
3.2. Regression Model Predictions for Province-Level Crop Yield Prediction in the Chi Basin

In this study, a total of 126 samples were used to examine crop yield production at the provincial scale. These samples were divided into two time periods as training and testing data: 2011–2017 (98 samples) and 2018–2019 (28 samples). Four regression models (MLR and machine learning techniques) were applied to the three categories of data (Table 3): remote sensing (RS), climatic, and a combination of both. The MLR model using RS data provided the lowest R2 value of 0.42 in the training dataset, while the XGBoost model using fusion data possessed the highest R2 value of 0.95 (Table 4). This study is congruent with the report of previous research [15], which stated that a fusion of remote sensing-based drought indicators and climatic and weather indicators can provide high statistical measurement when used with the XGBoost model for cereal yield forecasting. In terms of validation (RMSE), the XGBoost model with combination data provided the lowest RMSE of 0.18 ton/ha, while the support vector regression (SVR) model using climatic data had the second lowest RMSE of 0.18 to 0.3 ton/ha. This error threshold is generally accepted in European agro-statistics [52]. Overall, the XGBoost model was the most reliable for predicting crop yield production (highest R2 and lowest RMSE) (Table 4).

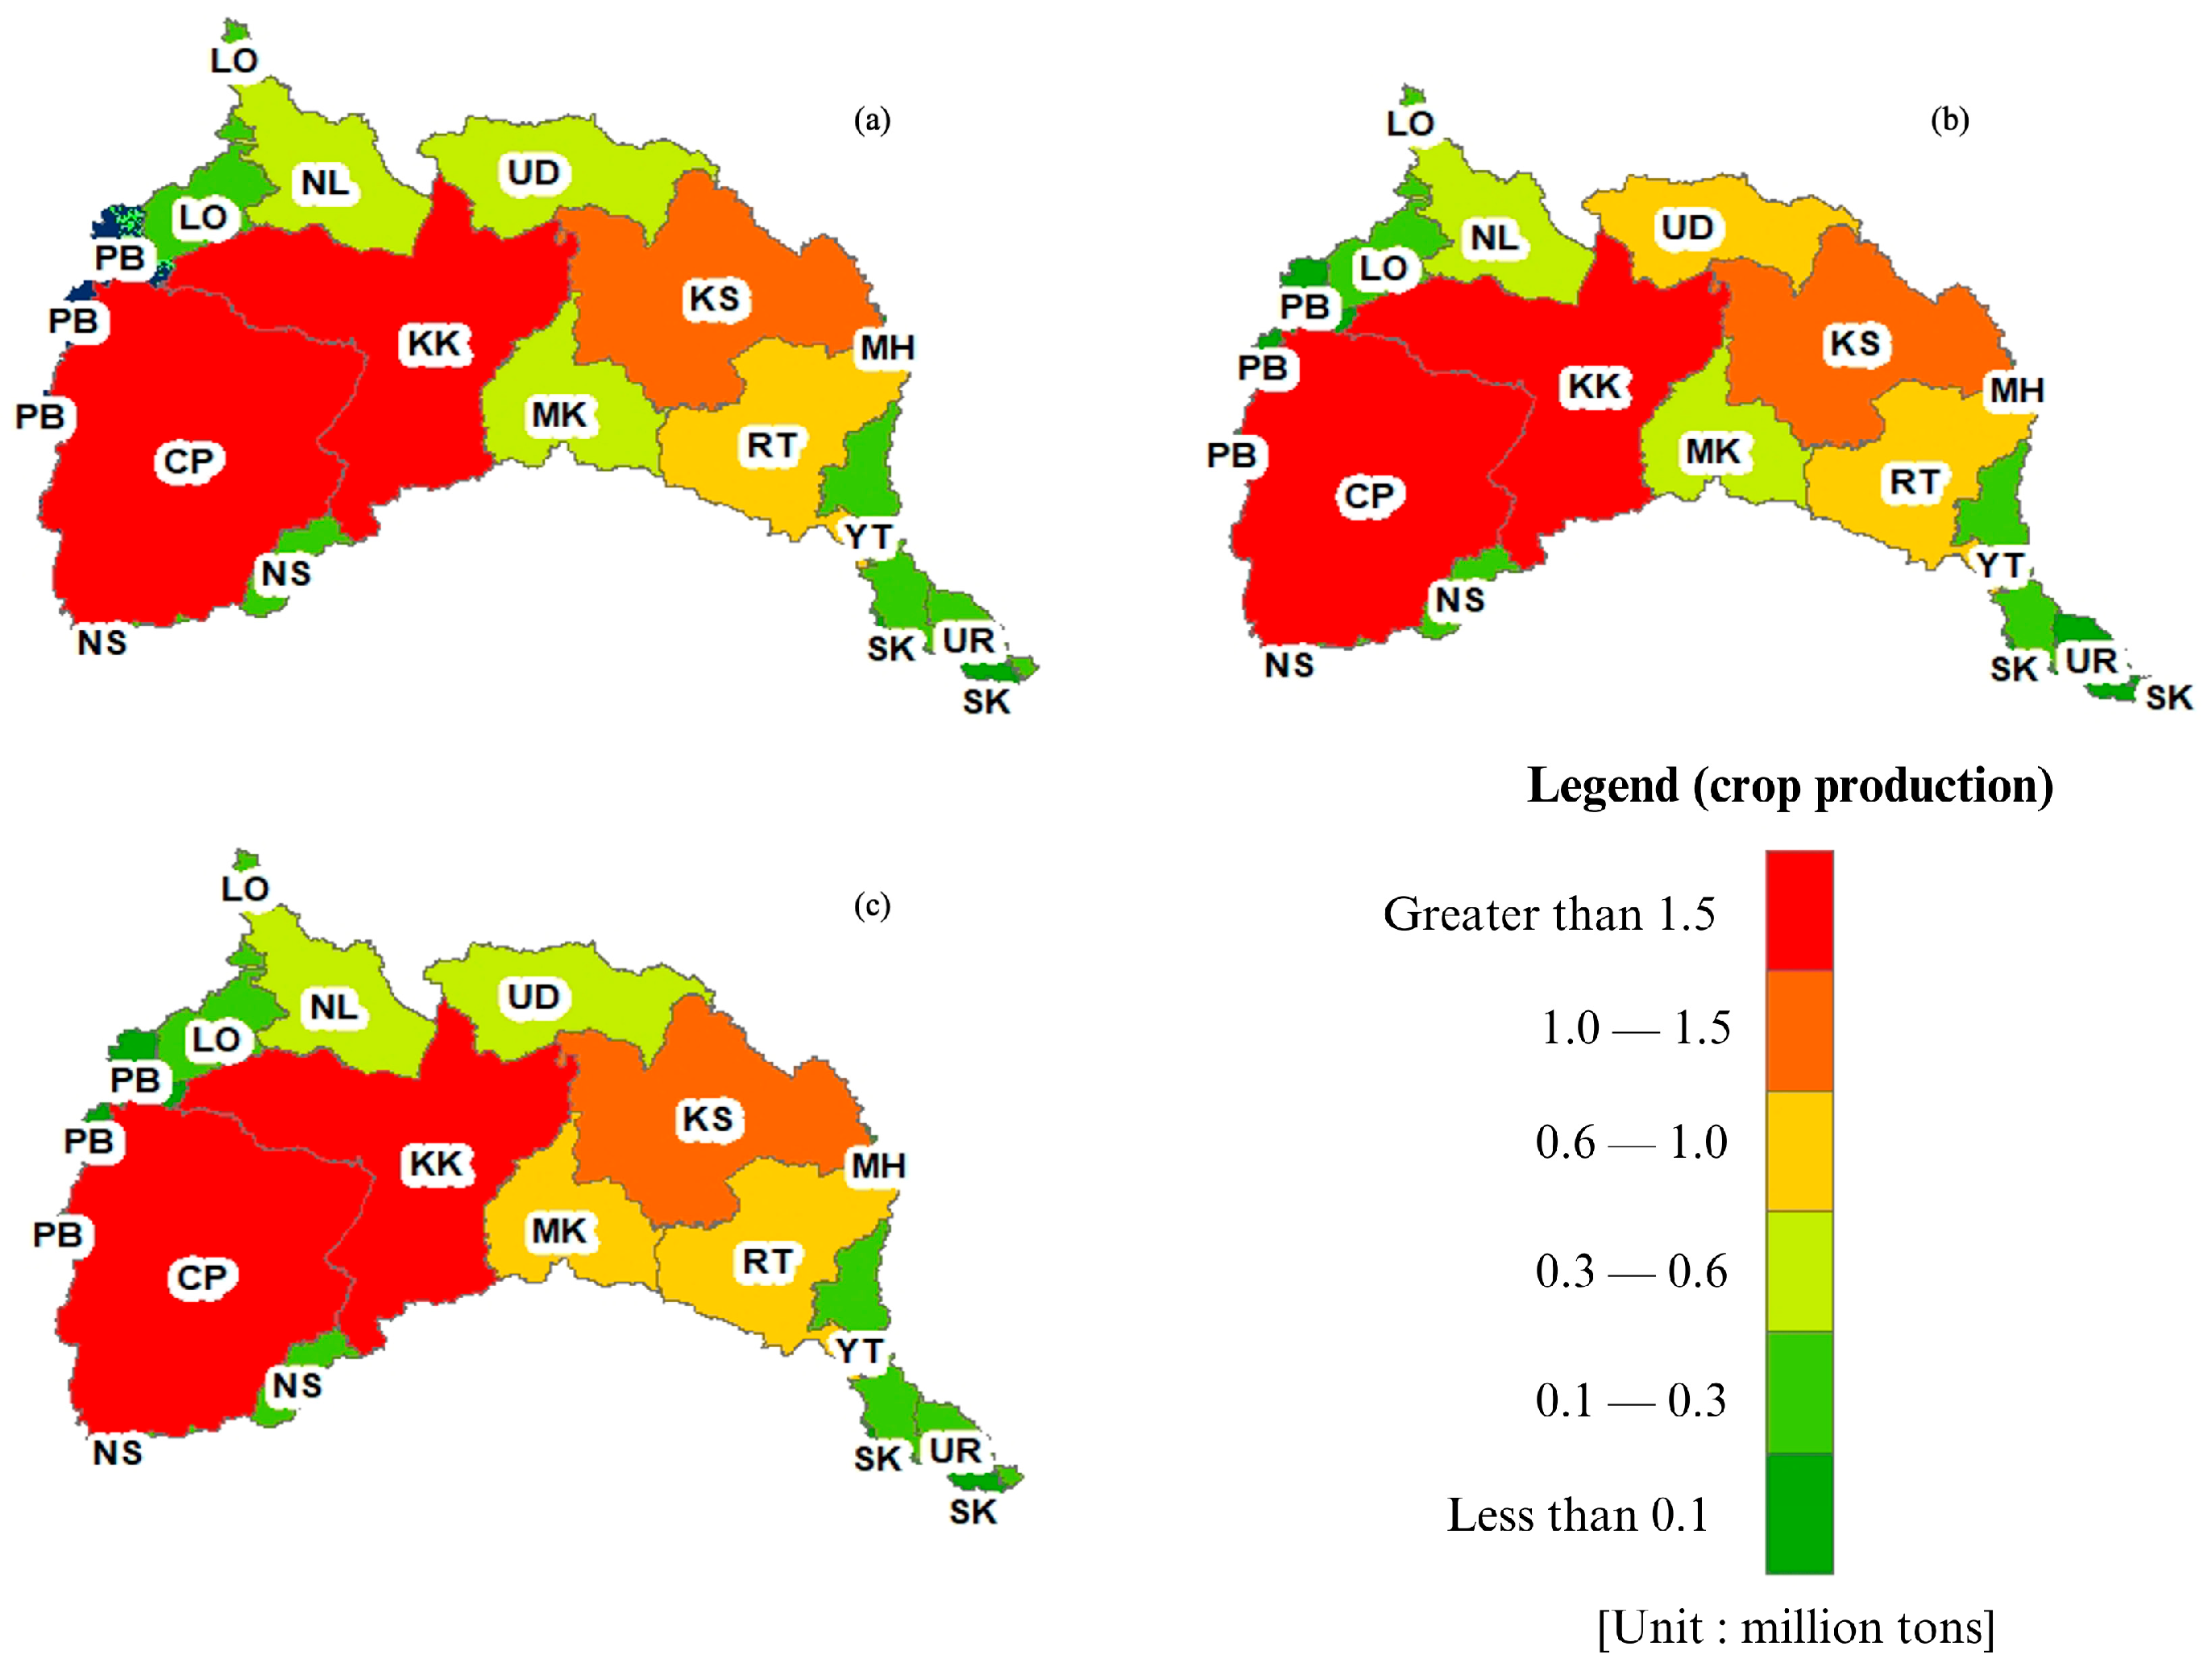
3.3. Temporal Trend of Crop Production Measurement and Changes of Crop Production Validation

To further elaborate on the findings presented in Figure 4, it is crucial that the observed crop yield data and predicted crop yield data are evaluated using four different approaches: three non-parametric approaches (RF, XGBoost, and SVR) and one parametric approach (MLR). These approaches were then used to predict crop yield for a period of one month leading up to the harvest. The results showed that while there were fluctuations in yield among the variables and regression models, these fluctuations were not well reflected in the predicted crop yields. In fact, the peak yields actually observed in 2011 and 2017 (Figure 4) resulted in a reduced yield observed in 2018.
To further assess the accuracy of the prediction models, the changes in crop yield were calculated for the validation periods (testing datasets) of 2018 and 2019 (Table 5). The outcomes showed that the MLR model executed very well for almost all predictor variables, with a difference of 0.03, 0.01, and 0.01 ton/ha for combination, RS, and climatic data, respectively. In 2019, the XGBoost and RF regression models showed insignificant changes in observed and predicted data, with a difference of around −0.01 ton/ha. Overall, these findings suggest that the non-parametric and parametric approaches used in this study can effectively predict crop yield for the period leading up to harvest, with the XGBoost and MLR models performing particularly well. However, it is notable that the linear regression model can perform well with the testing dataset, but it is not fully agreeable to apply for crop yield prediction if we consider the training statistical result, which has a low r-square when compared to other models.
MLR and XGBoost regression are two different techniques that can be utilized to obtain predictions using the input data. MLR is a parametric approach that assumes a linear correlation between the input factors and the output variable. This means that the output variable changes in a directly proportional manner with respect to the input variables. In contrast, XGBoost is a non-parametric technique that uses decision trees as weak learners and unites them through boosting to make predictions. Boosting is an ensemble learning approach that trains weak models sequentially, with each model attempting to correct the errors made by the previous model. While MLR is generally easier to understand and implement, XGBoost is more flexible and can model non-linear relationships. However, it can be more complex to implement and may require more computational resources. Therefore, in this study, XGBoost was selected as the main algorithm used for crop yield prediction at the provincial scale due to its ability to handle the complexity of the observed data and predictor variables and produce accurate and reliable results.

3.4. Crop Yield Prediction between 2018 and 2022

XGBoost is a selected machine learning algorithm that can be utilized to forecast the yield production of crops, as was already mentioned. The crop yield ratio (tons/ha) was calculated over 14 provinces from 2018 to 2022 using the XGBoost model. The results showed that in 2018 and 2019, the highest crop yield ratio was observed in the PB province at 3.77 tons/ha, while the lowest value was observed in the NL province (2.23 tons/ha). In 2020, the PB province still possessed the highest crop yield ratio at 3.60 tons/ha, which is a decrease of 4.5% and 2.9% from 2018 and 2019, respectively. It is worth noting that the CP and KK provinces had the largest areas suitable for crop production, with 0.699 million hectares and 0.683 million hectares, respectively. Finally, in 2022, the crop yield ratio in the PB province decreased by 11.9% from 2021 and 2018. These findings suggest that the XGBoost model can effectively forecast the ratios of crop outcomes at the provincial stage and highlight the importance of considering both yield and production area when making predictions. On the other hand, crop yield prediction was reproduced in CP province with the following number of areas: 1.61, 1.58, 1.90, 1.59, and 1.74 million tons a year between 2018 and 2022. Additionally, the KK province was the second-largest region and produced crop yields ranging from 1.55 to 1.62 million tons a year. The total crop yield production that can reproduce in the Chi basin region ranges from 7.33 to 7.88 million tons a year starting from 2018 to 2022. The total of the predicted crop yield production maps at the provincial scale for 2020–2022 is shown in Figure 5. Therefore, this prediction may help gauge the overall economic performance of a country and is considered a key indicator of the standard of living for Thailand’s citizens.

4. Discussion

Monitoring, mapping, and predicting crop production in large regions can help farmers and policymakers make the best decisions for sustainable management, particularly in the Chi basin region, which is a major producer of crops in Thailand. This is especially important at present, as natural hazards often impact tropical monsoon areas. Additionally, climate change is one of the most important problems for the agricultural sector in the global region. Crop yield is crucial for global food security, so it is important to monitor and provide information about threats to crop production. Exact and well-timed early estimation of crop production has the potential for trade and proper food management. There are various approaches to estimating the crop yield [53,54,55]. Predictive models for crop yield have been developed using remote sensing data and ML methods [56,57]. However, these approaches may not always provide accurate results. The study by [10] applied the NDVI to forecast crop production in the Canadian Prairies, with results indicating R2 values ranging from 0.8 to 0.9. The study by [51] used MODIS EVI and LAI data to examine the prediction of rice crop production in Vietnam’s Mekong Delta and found that the maximum correlation coefficients at the growing stage of crops were 0.70 and 0.74, respectively.
Agricultural production relies on environmental conditions, such as climatic data (rainfall, temperature, humidity, and solar radiation) [58], so climatic and remote sensing data have been integrated for the prediction of crop yield [59], which is consistent with the findings in this study. This study compared and evaluated various approaches and predictor variables for predicting crop yield at the provincial scale in the Chi basin, Thailand, prior to the one- to two-month harvest period. This study found that combining satellite imaging data with climatic data improved the accuracy of predicting crop yield in the Chi basin. The results showed that the LSTnighttime, NDVI, TCI, and Tmean data perform well when used with the XGBoost algorithm and can provide an R2 value of up to 0.95. This combination of data can also improve the RMSE to 0.18 ton/ha. The XGBoost algorithm, which is a non-parametric technique that uses decision trees and joins them through boosting to make predictions, is an excellent method, similar to what was found by [15], which reported that the fusion of remote sensing-based drought, climatic, and weather indicators improved accuracy when used with the XGBoost model for cereal yield forecasting. The temporal trend of crop yield prediction using XGBoost was rather close to the actual crop yield data; however, in 2018, the crop yield ratio differed by about 0.05 tons/ha due to natural hazards.
In 2018, there were 66 provinces or 420 districts affected by floods [60] that destroyed several agricultural areas, especially the rice crop area, which is located in a lowland area. According to [15], rainfed rice production is expected to decrease by around 5% from 2021 to 2029, which is inconsistent with our study, which predicts that yield will decrease by around 0.078 million tons per year starting in 2020 to 2022. In addition, drought impacts are expected to affect crop yield predictions in Thailand by about 5% mean absolute percentage error (MAPE) [61], and this can be tele-connected from El Niño southern oscillation [62]. According to the results of total crop yield predictions for the period from 2020 to 2022 (Table 6), crop yield predictions have fluctuated and are likely to continue to increase in the future due to climate conditions. However, climate change has a considerable influence on the agriculture sector, and it could lead to an increase in temperatures by 1.4 to 5.8 degrees Celsius in 2100 [4]. This will increase crop water requirements due to increased evapotranspiration, which will mainly affect crop production [63]. This study shows acceptable accuracy for crop yield prediction that can be used by policymakers for management at the country and province scales. Since the methodology proposed in this study can accurately forecast the crop yield, it is anticipated that this methodology can be used as a guideline for crop yield prediction in other study areas, as well as for policymaking, to drive the economy at the provincial or country scale, as rice is the main staple crop in Thailand and is an important source of export income for the country.
The rice crop yield in Thailand is important to the overall trade and industry performance of the whole region and contributes to the overall GDP. This can be attributed to a number of aspects, including the adoption of modern agricultural technologies, such as hybrid seeds and precision agriculture, as well as improvements in irrigation and fertilization practices. In addition, Thailand has a well-developed infrastructure for agriculture, including a network of roads, ports, and storage facilities that facilitate the transportation and distribution of crops. However, despite these improvements, crop yield production in Thailand can still be affected by various factors, such as drought and extreme weather events, which can lead to fluctuations in yield from year to year. In addition, market demand and prices for crops can also impact production trends, as farmers may choose to plant crops that are more in demand or more profitable. Finally, a decrease in crop yield may lead to greater usage of pesticides, fertilizers, and other chemical inputs, which can negatively impact the environment, including pollution and degradation of natural resources. Therefore, it is important to apply the proposed approach to early crop yield prediction and take steps to maintain high crop yields and sustainable development policies in order to minimize these negative consequences.

5. Conclusions

Crop yield prediction is crucial information for enabling farmers to quickly decide to increase production by enhancing management techniques for the period of the developing season one to two months prior to the harvest period. In this study, we demonstrated the approaches to predict the crop production of RS and climatic variables. This study aimed to provide a predictive model before harvest for approximating crop outcomes in Thailand’s Chi basin at the province scale between 2011 and 2019. To perform this, we used a variety of remotely sensed and meteorological data and applied correlation analysis and variance inflation factor to identify the most relevant variables. Then, the selected variables were used to train four regression models (MLR, RF, XGBoost, and SVR); the XGBoost model performed the best and had a minimum root-mean-square error of 0.18 ton/ha. To predict total crop production, the XGBoost model was applied in the Chi basin for the years 2020–2022, with the result that total crop production is expected to be approximately 7.88, 7.64, and 7.72 million tons. This research found that using satellite-based drought indicators, the vegetation index, and meteorological data with the assistance of machine learning algorithms is an effective method for predicting agricultural yields in the study area. This method also provided timely data that can be used for decision making during the crop growth season. The discoveries of the proposed study may also be exploited to plot crop yields and their gaps at the provincial level in Thailand and neighboring countries, helping farmers and policymakers make informed decisions. However, land use change is the major concern for crop production prediction. Future studies should consider integrating land use change data to improve crop yield prediction models and reduce prediction errors.

Author Contributions

Conceptualization, A.C., A.H. and S.K.; methodology, A.C., A.H. and S.K.; software, A.C., A.H. and S.K.; validation, R.H. (Rattana Hormwichian), N.S. and H.P.; formal analysis, A.C.; investigation, A.K.; resources, W.K.; data curation, R.H. (Ratchawatch Hanchoowong); writing—original draft preparation, A.C.; writing—review and editing, A.H. and S.K.; visualization, A.C. All authors have read and agreed to the published version of the manuscript.

Funding

This research was financially supported by Mahasarakham University.

Data Availability Statement

The data used in this study are available from the corresponding author upon reasonable request.

Conflicts of Interest

The authors declare no conflicts of interest.

References

  1. Food and Agriculture Organization of the United Nations 2020 Asia Pacific Regional Overview of Food Security and Nutrition: Maternal and Child Diets at the Heart of Improving Nutrition. Available online: https://www.fao.org/documents/card/en/c/cb2895en (accessed on 1 August 2022).
  2. Department of Agricultural Extension Rice Production in Thailand. Available online: https://www.agriculture.gov.au/sites/default/files/documents/annual-report-2019-20-awe-oct-2020_0.pdf (accessed on 30 January 2024).
  3. World Bank Thai Economic Monitor Productivity for Prosperity. Available online: https://documents1.worldbank.org/curated/en/394501579357102381/pdf/Thailand-Economic-Monitor-Productivity-for-Prosperity.pdf (accessed on 30 January 2024).
  4. Intergovernmental Panel on Climate Change. Contribution of Working Groups I, II and III to the Fifth Assessment Report of the Intergovernmental Panel on Climate Change; IPCC: Geneva, Switzerland, 2014. [Google Scholar]
  5. Majumder, A.; Kingra, P.K.; Setia, R.; Singh, S.P.; Pateriya, B. Influence of Land Use/Land Cover Changes on Surface Temperature and Its Effect on Crop Yield in Different Agro-Climatic Regions of Indian Punjab. Geocarto Int. 2020, 35, 663–686. [Google Scholar] [CrossRef]
  6. Office of Agricultural Economics. Agricultural Statistics of Thailand 2016. Available online: https://www.oae.go.th/view/1/Home/EN-US (accessed on 14 December 2022).
  7. Land Development. Department Annual Report. Available online: https://webapp.ldd.go.th/lpd/pdfjs/web/viewer.html?File=../../node_modules/file/Report/Annual%20Report%202021.pdf (accessed on 30 January 2024).
  8. Han, J.; Zhang, Z.; Cao, J.; Luo, Y.; Zhang, L.; Li, Z.; Zhang, J. Prediction of Winter Wheat Yield Based on Multi-Source Data and Machine Learning in China. Remote Sens. 2020, 12, 236. [Google Scholar] [CrossRef]
  9. Gao, Y.; Wang, S.; Guan, K.; Wolanin, A.; You, L.; Ju, W.; Zhang, Y. The Ability of Sun-Induced Chlorophyll Fluorescence from OCO-2 and MODIS-EVI to Monitor Spatial Variations of Soybean and Maize Yields in the Midwestern USA. Remote Sens. 2020, 12, 1111. [Google Scholar] [CrossRef]
  10. Mkhabela, M.S.; Bullock, P.; Raj, S.; Wang, S.; Yang, Y. Crop Yield Forecasting on the Canadian Prairies Using MODIS NDVI Data. Agric. For. Meteorol. 2011, 151, 393. [Google Scholar] [CrossRef]
  11. Stepanov, A.; Dubrovin, K.; Sorokin, A.; Aseeva, T. Predicting Soybean Yield at the Regional Scale Using Remote Sensing and Climatic Data. Remote Sens. 2020, 12, 1936. [Google Scholar] [CrossRef]
  12. Mongkolnithithada, W.; Nontapun, J.; Kaewplang, S. Rice Yield Estimation Based on Machine Learning Approaches Using MODIS 250 m Data. Eng. Access 2023, 9, 75–79. [Google Scholar]
  13. Schwalbert, R.A.; Amado, T.; Corassa, G.; Pott, L.P.; Prasad, P.V.V.; Ciampitti, I.A. Satellite-Based Soybean Yield Forecast: Integrating Machine Learning and Weather Data for Improving Crop Yield Prediction in Southern Brazil. Agric. For. Meteorol. 2020, 284, 107886. [Google Scholar] [CrossRef]
  14. Pede, T.; Mountrakis, G.; Shaw, S.B. Improving Corn Yield Prediction across the US Corn Belt by Replacing Air Temperature with Daily MODIS Land Surface Temperature. Agric. For. Meteorol. 2019, 276–277, 107615. [Google Scholar] [CrossRef]
  15. Bouras, E.H.; Jarlan, L.; Er-Raki, S.; Balaghi, R.; Amazirh, A.; Richard, B.; Khabba, S. Cereal Yield Forecasting with Satellite Drought-Based Indices, Weather Data and Regional Climate Indices Using Machine Learning in Morocco. Remote Sens. 2021, 13, 3101. [Google Scholar] [CrossRef]
  16. Pei, F.; Wu, C.; Liu, X.; Li, X.; Yang, K.; Zhou, Y.; Wang, K.; Xu, L.; Xia, G. Monitoring the Vegetation Activity in China Using Vegetation Health Indices. Agric. For. Meteorol. 2018, 248, 215–227. [Google Scholar] [CrossRef]
  17. Bouras, E.H.; Jarlan, L.; Er-Raki, S.; Albergel, C.; Richard, B.; Balaghi, R.; Khabba, S. Linkages between Rainfed Cereal Production and Agricultural Drought through Remote Sensing Indices and a Land Data Assimilation System: A Case Study in Morocco. Remote Sens. 2020, 12, 4018. [Google Scholar] [CrossRef]
  18. Baniya, B.; Tang, Q.; Xu, X.; Haile, G.G.; Chhipi-Shrestha, G. Spatial and Temporal Variation of Drought Based on Satellite Derived Vegetation Condition Index in Nepal from 1982–2015. Sensors 2019, 19, 430. [Google Scholar] [CrossRef]
  19. Dutta, D.; Kundu, A.; Patel, N.R.; Saha, S.K.; Siddiqui, A.R. Assessment of Agricultural Drought in Rajasthan (India) Using Remote Sensing Derived Vegetation Condition Index (VCI) and Standardized Precipitation Index (SPI). Egypt. J. Remote Sens. Space Sci. 2015, 18, 53–63. [Google Scholar] [CrossRef]
  20. Herrero-Huerta, M.; Rodriguez-Gonzalvez, P.; Rainey, K.M. Yield Prediction by Machine Learning from UAS-Based Mulit-Sensor Data Fusion in Soybean. Plant Methods 2020, 16, 78. [Google Scholar] [CrossRef]
  21. Shahhosseini, M.; Hu, G.; Huber, I.; Archontoulis, S.V. Coupling Machine Learning and Crop Modeling Improves Crop Yield Prediction in the US Corn Belt. Sci. Rep. 2021, 11, 1606. [Google Scholar] [CrossRef]
  22. Khosla, E.; Dharavath, R.; Priya, R. Crop Yield Prediction Using Aggregated Rainfall-Based Modular Artificial Neural Networks and Support Vector Regression. Environ. Dev. Sustain. 2020, 22, 5687–5708. [Google Scholar] [CrossRef]
  23. Zhang, W.; Wu, C.; Li, Y.; Wang, L.; Samui, P. Assessment of Pile Drivability Using Random Forest Regression and Multivariate Adaptive Regression Splines. Georisk 2021, 15, 27–40. [Google Scholar] [CrossRef]
  24. Zhang, Y.; Xia, C.; Zhang, X.; Cheng, X.; Feng, G.; Wang, Y.; Gao, Q. Estimating the Maize Biomass by Crop Height and Narrowband Vegetation Indices Derived from UAV-Based Hyperspectral Images. Ecol. Indic. 2021, 129, 107985. [Google Scholar] [CrossRef]
  25. Kang, Y.; Ozdogan, M.; Zhu, X.; Ye, Z.; Hain, C.; Anderson, M. Comparative Assessment of Environmental Variables and Machine Learning Algorithms for Maize Yield Prediction in the US Midwest. Environ. Res. Lett. 2020, 15, 064005. [Google Scholar] [CrossRef]
  26. Memon, N.; Patel, S.B.; Patel, D.P. Comparative Analysis of Artificial Neural Network and XGBoost Algorithm for PolSAR Image Classification. In Lecture Notes in Computer Science (Including Subseries Lecture Notes in Artificial Intelligence and Lecture Notes in Bioinformatics), Proceedings of the 8th International Conference, PReMI 2019, Tezpur, India, 17–20 December 2019; Springer: Berlin/Heidelberg, Germany, 2019; Volume 11941 LNCS. [Google Scholar]
  27. Jeong, J.H.; Resop, J.P.; Mueller, N.D.; Fleisher, D.H.; Yun, K.; Butler, E.E.; Timlin, D.J.; Shim, K.M.; Gerber, J.S.; Reddy, V.R.; et al. Random Forests for Global and Regional Crop Yield Predictions. PLoS ONE 2016, 11, e0156571. [Google Scholar] [CrossRef]
  28. Pang, A.; Chang, M.W.L.; Chen, Y. Evaluation of Random Forests (RF) for Regional and Local-Scale Wheat Yield Prediction in Southeast Australia. Sensors 2022, 22, 717. [Google Scholar] [CrossRef]
  29. Boonwichai, S.; Shrestha, S.; Babel, M.S.; Weesakul, S.; Datta, A. Climate Change Impacts on Irrigation Water Requirement, Crop Water Productivity and Rice Yield in the Songkhram River Basin, Thailand. J. Clean. Prod. 2018, 198, 1157–1164. [Google Scholar] [CrossRef]
  30. Sujariya, S.; Jongrungklang, N.; Jongdee, B.; Inthavong, T.; Budhaboon, C.; Fukai, S. Rainfall Variability and Its Effects on Growing Period and Grain Yield for Rainfed Lowland Rice under Transplanting System in Northeast Thailand. Plant Prod. Sci. 2020, 23, 48–59. [Google Scholar] [CrossRef]
  31. Ramadhani, F.; Pullanagari, R.; Kereszturi, G.; Procter, J. Mapping a Cloud-Free Rice Growth Stages Using the Integration of Proba-v and Sentinel-1 and Its Temporal Correlation with Sub-District Statistics. Remote Sens. 2021, 13, 1498. [Google Scholar] [CrossRef]
  32. de Castro, A.; Six, J.; Plant, R.; Peña, J. Mapping Crop Calendar Events and Phenology-Related Metrics at the Parcel Level by Object-Based Image Analysis (OBIA) of MODIS-NDVI Time-Series: A Case Study in Central California. Remote Sens. 2018, 10, 1745. [Google Scholar] [CrossRef]
  33. Zhang, X.; Friedl, M.A.; Schaaf, C.B.; Strahler, A.H.; Hodges, J.C.F.; Gao, F.; Reed, B.C.; Huete, A. Monitoring Vegetation Phenology Using MODIS. Remote Sens. Environ. 2003, 84, 471–475. [Google Scholar] [CrossRef]
  34. Guo, Y.; Fu, Y.; Hao, F.; Zhang, X.; Wu, W.; Jin, X.; Robin Bryant, C.; Senthilnath, J. Integrated Phenology and Climate in Rice Yields Prediction Using Machine Learning Methods. Ecol. Indic. 2021, 120, 106935. [Google Scholar] [CrossRef]
  35. Peñuelas, J.; Filella, L. Technical Focus: Visible and near-Infrared Reflectance Techniques for Diagnosing Plant Physiological Status. Trends Plant Sci. 1998, 3, 151–156. [Google Scholar] [CrossRef]
  36. Mosleh, M.K.; Hassan, Q.K.; Chowdhury, E.H. Application of Remote Sensors in Mapping Rice Area and Forecasting Its Production: A Review. Sensors 2015, 15, 769–791. [Google Scholar] [CrossRef] [PubMed]
  37. Alahacoon, N.; Edirisinghe, M.; Ranagalage, M. Satellite-Based Meteorological and Agricultural Drought Monitoring for Agricultural Sustainability in Sri Lanka. Sustainability 2021, 13, 3427. [Google Scholar] [CrossRef]
  38. Zhang, L.; Jiao, W.; Zhang, H.; Huang, C.; Tong, Q. Studying Drought Phenomena in the Continental United States in 2011 and 2012 Using Various Drought Indices. Remote Sens. Environ. 2017, 190, 96–106. [Google Scholar] [CrossRef]
  39. Yu, H.; Li, L.; Liu, Y.; Li, J. Construction of Comprehensive Drought Monitoring Model in Jing-Jin-Ji Region Based on Multisource Remote Sensing Data. Water 2019, 11, 1077. [Google Scholar] [CrossRef]
  40. Tuvdendorj, B.; Wu, B.; Zeng, H.; Batdelger, G.; Nanzad, L. Determination of Appropriate Remote Sensing Indices for Spring Wheat Yield Estimation in Mongolia. Remote Sens. 2019, 11, 2568. [Google Scholar] [CrossRef]
  41. Uddin, M.P.; Al Mamun, M.; Hossain, M.A. PCA-Based Feature Reduction for Hyperspectral Remote Sensing Image Classification. IETE Tech. Rev. 2021, 38, 377–396. [Google Scholar] [CrossRef]
  42. Liao, K.; Xu, S.; Wu, J.; Zhu, Q. Spatial Estimation of Surface Soil Texture Using Remote Sensing Data. Soil Sci. Plant Nutr. 2013, 59, 488–500. [Google Scholar] [CrossRef]
  43. Boori, M.S.; Choudhary, K.; Paringer, R.; Kupriyanov, A. Spatiotemporal Ecological Vulnerability Analysis with Statistical Correlation Based on Satellite Remote Sensing in Samara, Russia. J. Environ. Manag. 2021, 285, 112138. [Google Scholar] [CrossRef] [PubMed]
  44. Guechi, I.; Gherraz, H.; Alkama, D. Correlation Analysis between Biophysical Indices and Land Surface Temperature Using Remote Sensing and GIS in Guelma City (Algeria). Bull. Soc. R. Sci. Liège 2021, 90, 158–180. [Google Scholar] [CrossRef]
  45. Kang, J.; Jin, R.; Li, X.; Zhang, Y.; Zhu, Z. Spatial Upscaling of Sparse Soil Moisture Observations Based on Ridge Regression. Remote Sens. 2018, 10, 192. [Google Scholar] [CrossRef]
  46. Hamzehpour, N.; Shafizadeh-Moghadam, H.; Valavi, R. Exploring the Driving Forces and Digital Mapping of Soil Organic Carbon Using Remote Sensing and Soil Texture. Catena 2019, 182, 104141. [Google Scholar] [CrossRef]
  47. Browning, M.H.E.M.; Kuo, M.; Sachdeva, S.; Lee, K.; Westphal, L. Greenness and School-Wide Test Scores Are Not Always Positively Associated—A Replication of “linking Student Performance in Massachusetts Elementary Schools with the ‘Greenness’ of School Surroundings Using Remote Sensing. Landsc. Urban Plan. 2018, 178, 69–72. [Google Scholar] [CrossRef]
  48. Alsharif, A.A.A.; Pradhan, B. Urban Sprawl Analysis of Tripoli Metropolitan City (Libya) Using Remote Sensing Data and Multivariate Logistic Regression Model. J. Indian Soc. Remote Sens. 2014, 42, 149–163. [Google Scholar] [CrossRef]
  49. Maya Gopal, P.S.; Bhargavi, R. Selection of Important Features for Optimizing Crop Yield Prediction. Int. J. Agric. Environ. Inf. Syst. 2019, 10, 54–71. [Google Scholar] [CrossRef]
  50. Rtayli, N.; Enneya, N. Enhanced Credit Card Fraud Detection Based on SVM-Recursive Feature Elimination and Hyper-Parameters Optimization. J. Inf. Secur. Appl. 2020, 55, 102596. [Google Scholar] [CrossRef]
  51. Dong, W.; Huang, Y.; Lehane, B.; Ma, G. XGBoost Algorithm-Based Prediction of Concrete Electrical Resistivity for Structural Health Monitoring. Autom. Constr. 2020, 114, 103155. [Google Scholar] [CrossRef]
  52. Genovese, C.R.; Roeder, K.; Wasserman, L. False Discovery Control with P-Value Weighting. Biometrika 2006, 93, 509–524. [Google Scholar] [CrossRef]
  53. Sakamoto, T.; Gitelson, A.A.; Arkebauer, T.J. Near Real-Time Prediction of U.S. Corn Yields Based on Time-Series MODIS Data. Remote Sens. Environ. 2014, 147, 219–231. [Google Scholar] [CrossRef]
  54. Zhuo, W.; Fang, S.; Gao, X.; Wang, L.; Wu, D.; Fu, S.; Wu, Q.; Huang, J. Crop Yield Prediction Using MODIS LAI, TIGGE Weather Forecasts and WOFOST Model: A Case Study for Winter Wheat in Hebei, China during 2009–2013. Int. J. Appl. Earth Obs. Geoinf. 2022, 106, 102668. [Google Scholar] [CrossRef]
  55. Ji, Z.; Pan, Y.; Zhu, X.; Wang, J.; Li, Q. Prediction of Crop Yield Using Phenological Information Extracted from Remote Sensing Vegetation Index. Sensors 2021, 21, 1406. [Google Scholar] [CrossRef]
  56. Ban, H.Y.; Ahn, J.B.; Lee, B.W. Assimilating MODIS Data-Derived Minimum Input Data Set and Water Stress Factors into CERES-Maize Model Improves Regional Corn Yield Predictions. PLoS ONE 2019, 14, e0211874. [Google Scholar] [CrossRef]
  57. Sun, J.; Di, L.; Sun, Z.; Shen, Y.; Lai, Z. County-Level Soybean Yield Prediction Using Deep CNN-LSTM Model. Sensors 2019, 19, 4363. [Google Scholar] [CrossRef]
  58. Lin, B.B. Agroforestry Management as an Adaptive Strategy against Potential Microclimate Extremes in Coffee Agriculture. Agric. For. Meteorol. 2007, 144, 85–94. [Google Scholar] [CrossRef]
  59. Ju, S.; Lim, H.; Ma, J.W.; Kim, S.; Lee, K.; Zhao, S.; Heo, J. Optimal County-Level Crop Yield Prediction Using MODIS-Based Variables and Weather Data: A Comparative Study on Machine Learning Models. Agric. For. Meteorol. 2021, 307, 108530. [Google Scholar] [CrossRef]
  60. Water Analysis and Assessment Division. Water Situation Report. Available online: http://mekhala.dwr.go.th/en/situation.php?numpage=value&Page=1875 (accessed on 30 January 2024).
  61. Raksapatcharawong, M.; Veerakachen, W.; Homma, K.; Maki, M.; Oki, K. Satellite-Based Drought Impact Assessment on Rice Yield in Thailand with SIMRIW-RS. Remote Sens. 2020, 12, 99. [Google Scholar] [CrossRef]
  62. Anderson, W.; Seager, R.; Baethgen, W.; Cane, M. Crop Production Variability in North and South America Forced by Life-Cycles of the El Niño Southern Oscillation. Agric. For. Meteorol. 2017, 239, 151–165. [Google Scholar] [CrossRef]
  63. Astuti, I.S.; Wiwoho, B.S.; Purwanto, P.; Wagistina, S.; Deffinika, I.; Sucahyo, H.R.; Herlambang, G.A.; Alfarizi, I.A.G. An Application of Improved MODIS-Based Potential Evapotranspiration Estimates in a Humid Tropic Brantas Watershed—Implications for Agricultural Water Management. ISPRS Int. J. Geoinf. 2022, 11, 182. [Google Scholar] [CrossRef]
Figure 1. Study area.
Sustainability 16 02260 g001
Figure 2. Mean temporal crop NDVI profile over crop growth stages in the Chi basin region between 2011 and 2019; SOS, POS, and EOS refer to starting, peak, and end of season, respectively.
Sustainability 16 02260 g002
Figure 3. Research framework for predicting crop production.
Sustainability 16 02260 g003
Figure 4. Comparison of annual average crop yield prediction (ton/ha) and average historical data for (a) the MLR model, (b) the RF model, (c) the XGBoost model, and (d) the SVR model; the bar chart is the average historical crop yield production; the red, blue, and black dot lines are the combination, RS, and climatic data, respectively.
Sustainability 16 02260 g004
Figure 5. Total of predicted crop yield production at the provincial scale for (a) 2020, (b) 2021, and (c) 2022.
Sustainability 16 02260 g005
Table 1. Names of the fourteen study areas in the Chi basin (ton/ha).
No.ProvinceAcronym201120122013201420152016201720182019
1NAKHON RATCHASIMANS2.592.252.312.242.262.222.262.222.27
2SI SA KETSK2.512.302.452.282.262.272.292.282.17
3UBON RATCHATHANIUR2.162.152.152.062.062.092.182.272.25
4YASOTHONYT2.542.272.282.312.212.232.222.272.25
5CHAIYAPHUMCP2.462.362.392.212.192.252.322.292.32
6NONG BUA LAMPHUNL2.412.331.972.011.982.112.162.072.08
7KHON KAENKK2.162.092.112.122.112.152.142.021.98
8UDON THANIUD2.472.322.242.322.342.372.402.282.23
9LOEILO2.412.422.462.342.312.432.462.332.11
10MAHA SARAKHAMMK2.372.322.332.302.282.302.232.182.25
11ROI ETRT2.372.322.332.342.382.392.372.212.15
12KALASINKS2.322.262.262.292.302.322.302.312.33
13MUKDAHANMH2.402.242.262.402.402.402.382.472.19
14PHETCHABUNPB3.543.543.614.374.363.464.333.534.40
Table 2. The predictors to be applied for modeling and predicting crop production.
Data TypeProductVariableSpatial ResolutionTemporal ResolutionAcquisition DateData Source
Yield recorded Crop yieldProvincial levelAnnual2011–2019https://www.oae.go.th/ (accessed on 20 July 2022).
RS dataMOD13Q1NDVI250 m16-day interval2011–2022https://lpdaac.usgs.gov/products/mod13q1v006/, (accessed on 20 July 2022).
EVI2011–2022
MOD11A2LST daytime1 km8-day interval2011–2022https://lpdaac.usgs.gov/products/mod11a1v006/. (accessed on 20 July 2022).
LST nighttime2011–2022
Climatic dataERA5Rainfall27.83 kmMonthly2011–2022https://www.ecmwf.int/en/forecasts/datasets/reanalysis-datasets/era5, (accessed on 20 July 2022).
Tmean2011–2022
Tmin2011–2022
Tmax2011–2022
All RS and climatic data were averaged into the crop growth season from June to November.
Table 3. The statistical metrics of correlation analysis (CA) and the variance inflation factor (VIF).
Data TypeVariablep-ValueVIF
RS dataTCI0.001 **1.31
NDVI0.023 *1.22
LSTnighttime0.001 **2.17
VCI0.001 **15.49
VHI0.001 **65.2
EVI0.035 *20.67
LSTdaytime0.3711.19
Climate dataTmean0.001 **2.05
Rainfall0.2131.76
Tmax0.2413.44
Tmin0.0515
Note: * and ** refer to the confidence interval for p-values < 0.05 and 0.01, respectively.
Table 4. Training and testing of each model and data type for predicting crop yield production.
CategoryR-Square (Training: 2011–2017)
MLRRFXGBoostSVR
RS data0.420.740.890.64
Climatic data0.550.940.930.88
Combination0.630.920.95 0.81
RMSE (Testing: 2018–2019) (ton/ha)
RS data0.360.420.450.4
Climatic data0.30.230.210.18
Combination0.260.190.180.29
Table 5. Changes of the crop yield validation relative to the historical values of each model.
ModelYearMean Actual Yield (ton/ha)VariableChange
CombinationRSClimateΔCombinationΔRSΔClimate
Mean Predicted Yield (ton/ha)Mean Predicted Yield (ton/ha)Mean Predicted Yield (ton/ha)
Linear20182.342.372.352.340.030.010.01
20192.362.452.512.450.100.150.09
RF20182.342.282.322.26−0.05−0.01−0.07
20192.362.352.452.350.000.10−0.01
XGBoost20182.342.282.362.27−0.060.02−0.07
20192.362.352.502.35−0.010.14−0.01
SVR20182.342.312.302.31−0.02−0.04−0.02
20192.362.412.452.360.050.100.00
Table 6. Estimation of crop yield prediction over crop area in the Chi basin between 2018 and 2022.
Area Crop Yield Area (ha) Crop Yield Ratio (ton/ha) Total Crop Yield (Mton)
Validation PeriodPredicting PeriodValidation PeriodPredicting Period
2018201920202021202220182019202020212022
NS 81,0762.292.262.92.312.360.190.180.230.190.19
SK 16,5622.292.292.362.262.450.040.040.040.040.04
UR 44,1552.272.272.362.262.420.10.10.10.10.11
YT 125,8032.292.262.362.382.360.290.280.30.30.3
CP 699,2642.32.262.722.272.491.611.581.91.591.74
NL 216,0432.232.232.272.662.20.480.480.490.570.48
KK 683,8682.282.262.342.362.361.561.551.61.611.62
UD 256,0242.292.262.32.362.320.590.580.590.60.59
LO 61,1502.312.242.72.62.60.140.140.160.160.16
MK 247,9992.282.282.322.322.450.560.560.580.570.61
RT 366,5142.292.282.362.382.450.840.830.860.870.9
KS 418,7572.292.282.322.362.260.960.950.970.990.95
MH 12542.322.262.362.662.330.010.010.010.010.01
PB 11,1953.773.663.63.773.320.040.040.040.040.04
Sum7.407.347.897.657.73
Disclaimer/Publisher’s Note: The statements, opinions and data contained in all publications are solely those of the individual author(s) and contributor(s) and not of MDPI and/or the editor(s). MDPI and/or the editor(s) disclaim responsibility for any injury to people or property resulting from any ideas, methods, instructions or products referred to in the content.

