
The Impact of Environmental Regulation on Collaborative Innovation Efficiency: Is the Porter Hypothesis Valid in Chengdu–Chongqing Urban Agglomeration?


Abstract
1. Introduction
2. Literature Review
2.1. Research on Collaborative Innovation
2.2. Research on Environmental Regulation
2.3. Research on the Relationship between Environmental Regulation and Collaborative Innovation
3. Method and Data
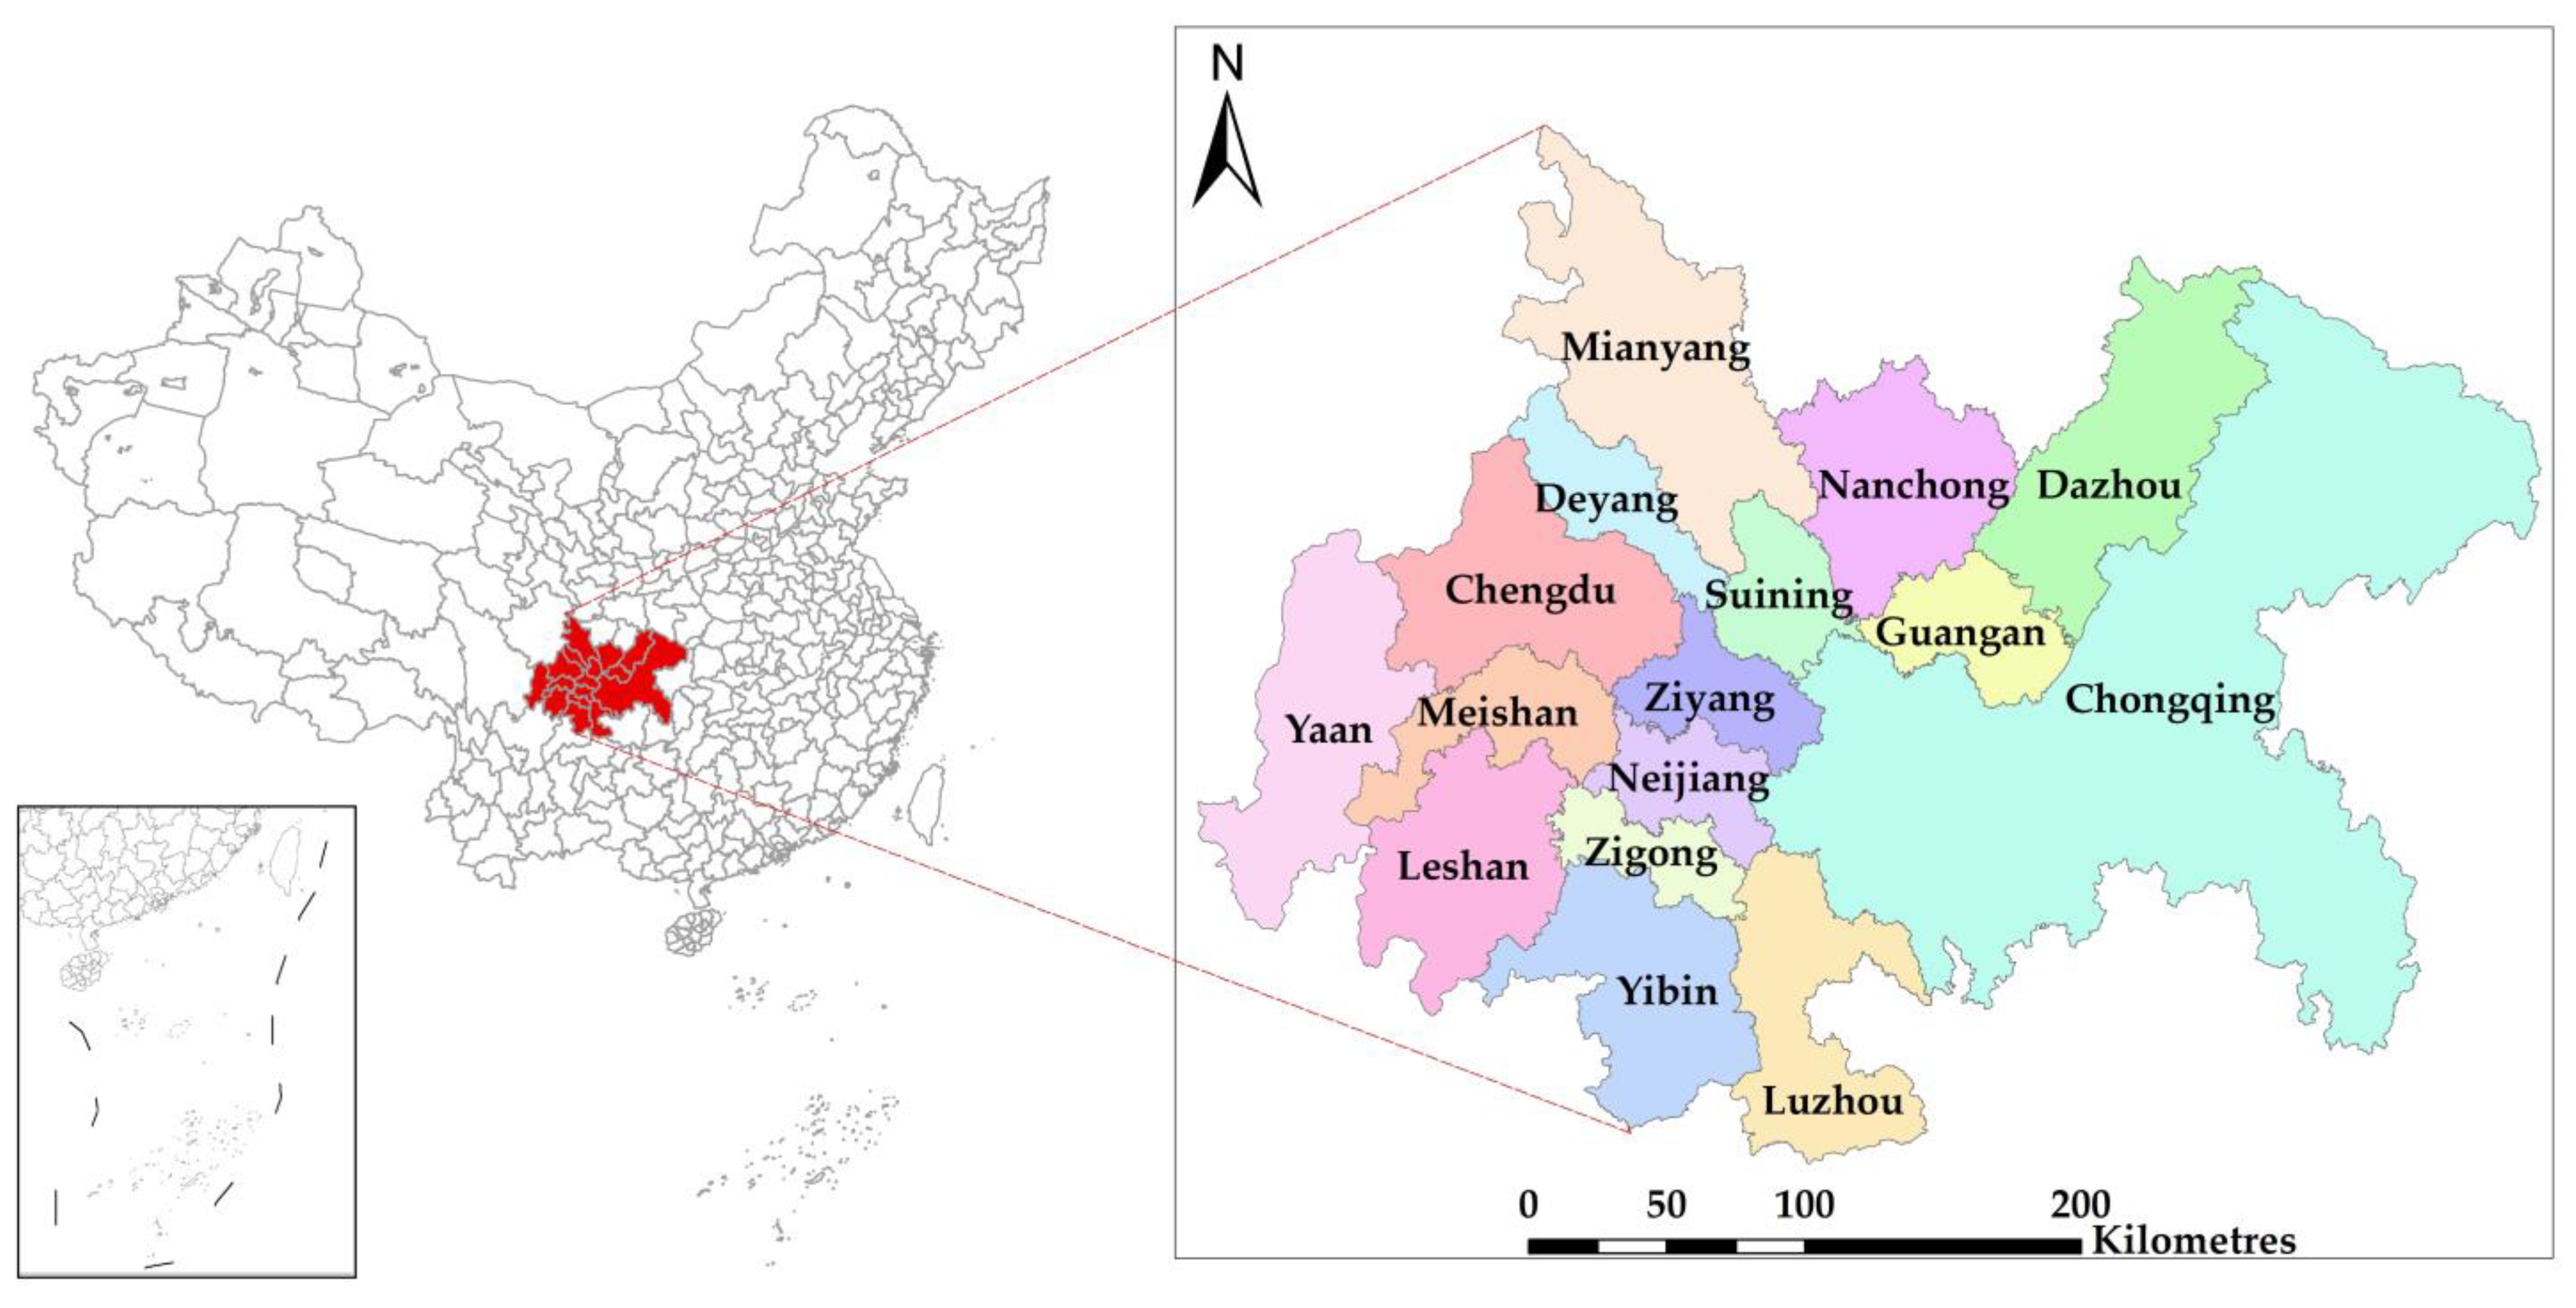
3.1. Study Area and Data Collection
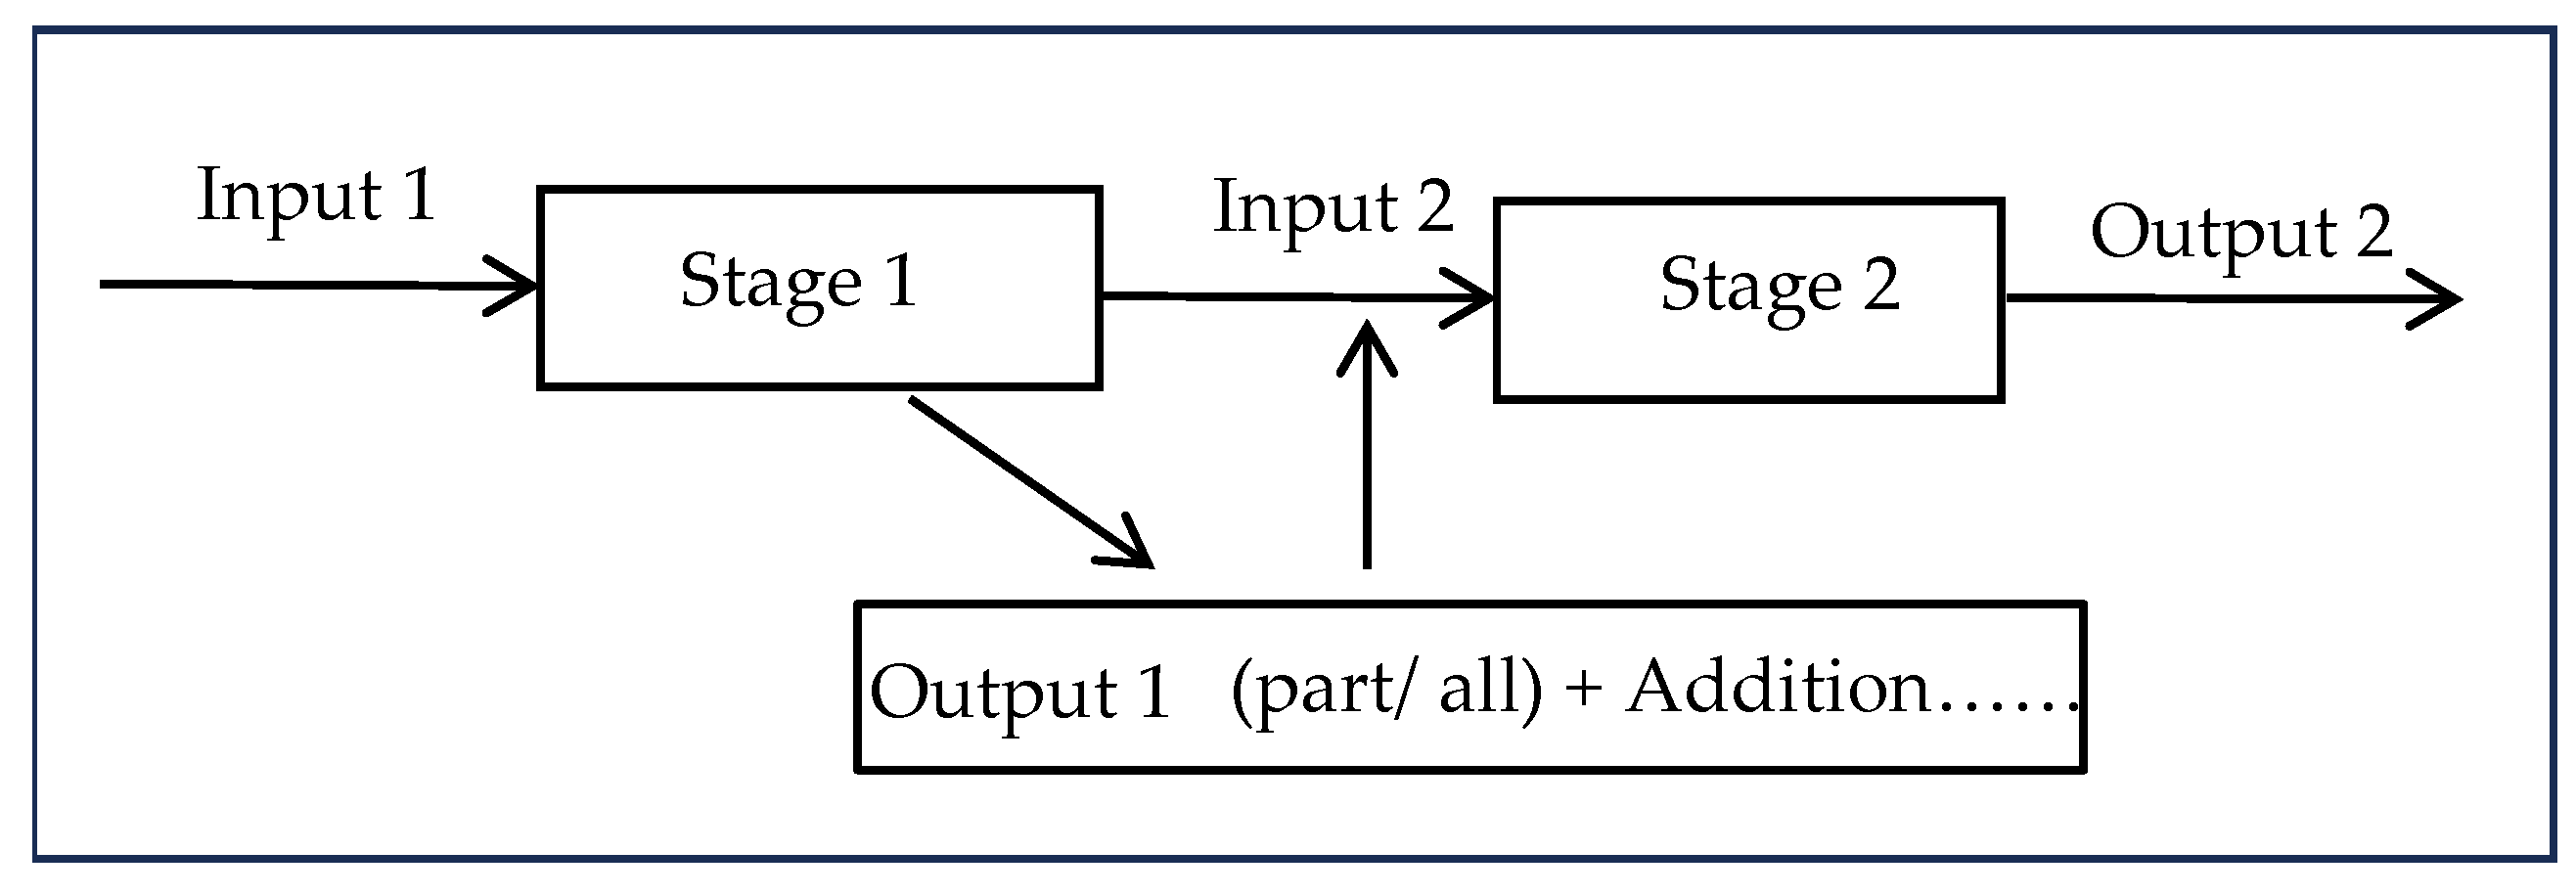
3.2. The Two-Stage DEA Model
3.2.1. Model Construction
3.2.2. Variable Selection
3.3. The Tobit Model
3.3.1. Model Construction
3.3.2. Variable Selection
4. Results and Discussion
4.1. Results of the Two-Stage DEA Model
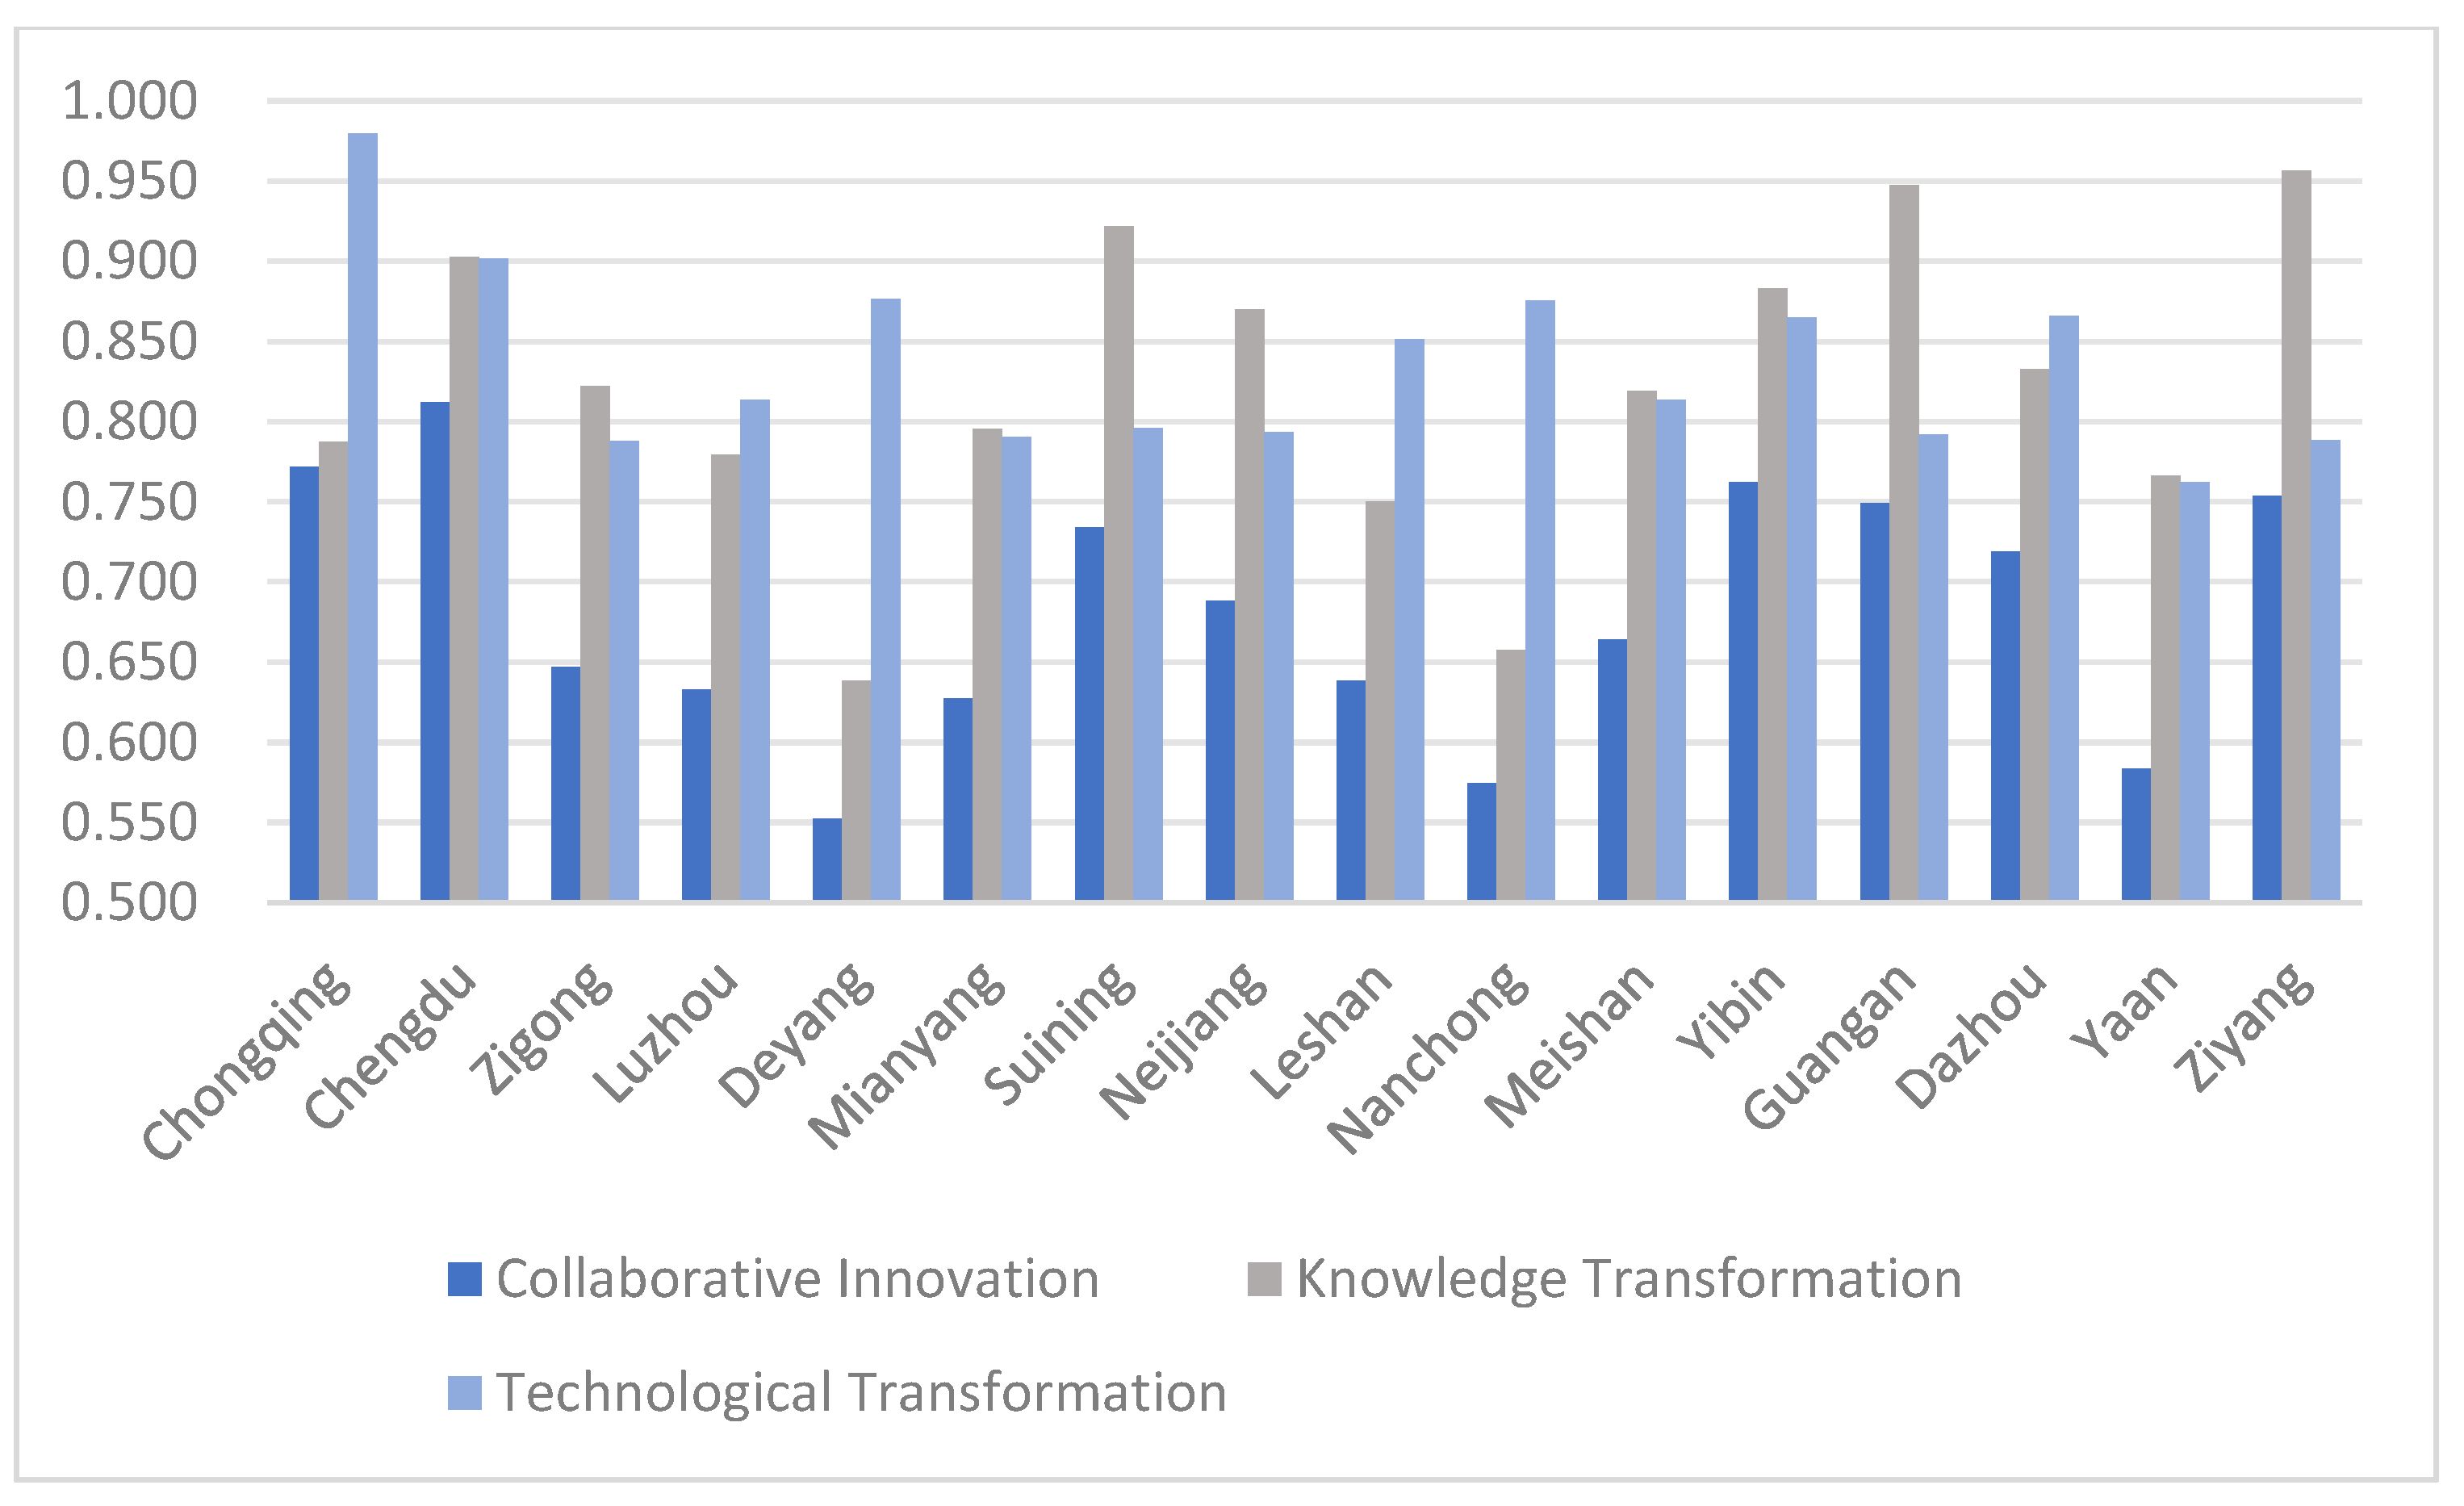
4.1.1. Overall Efficiency Analysis
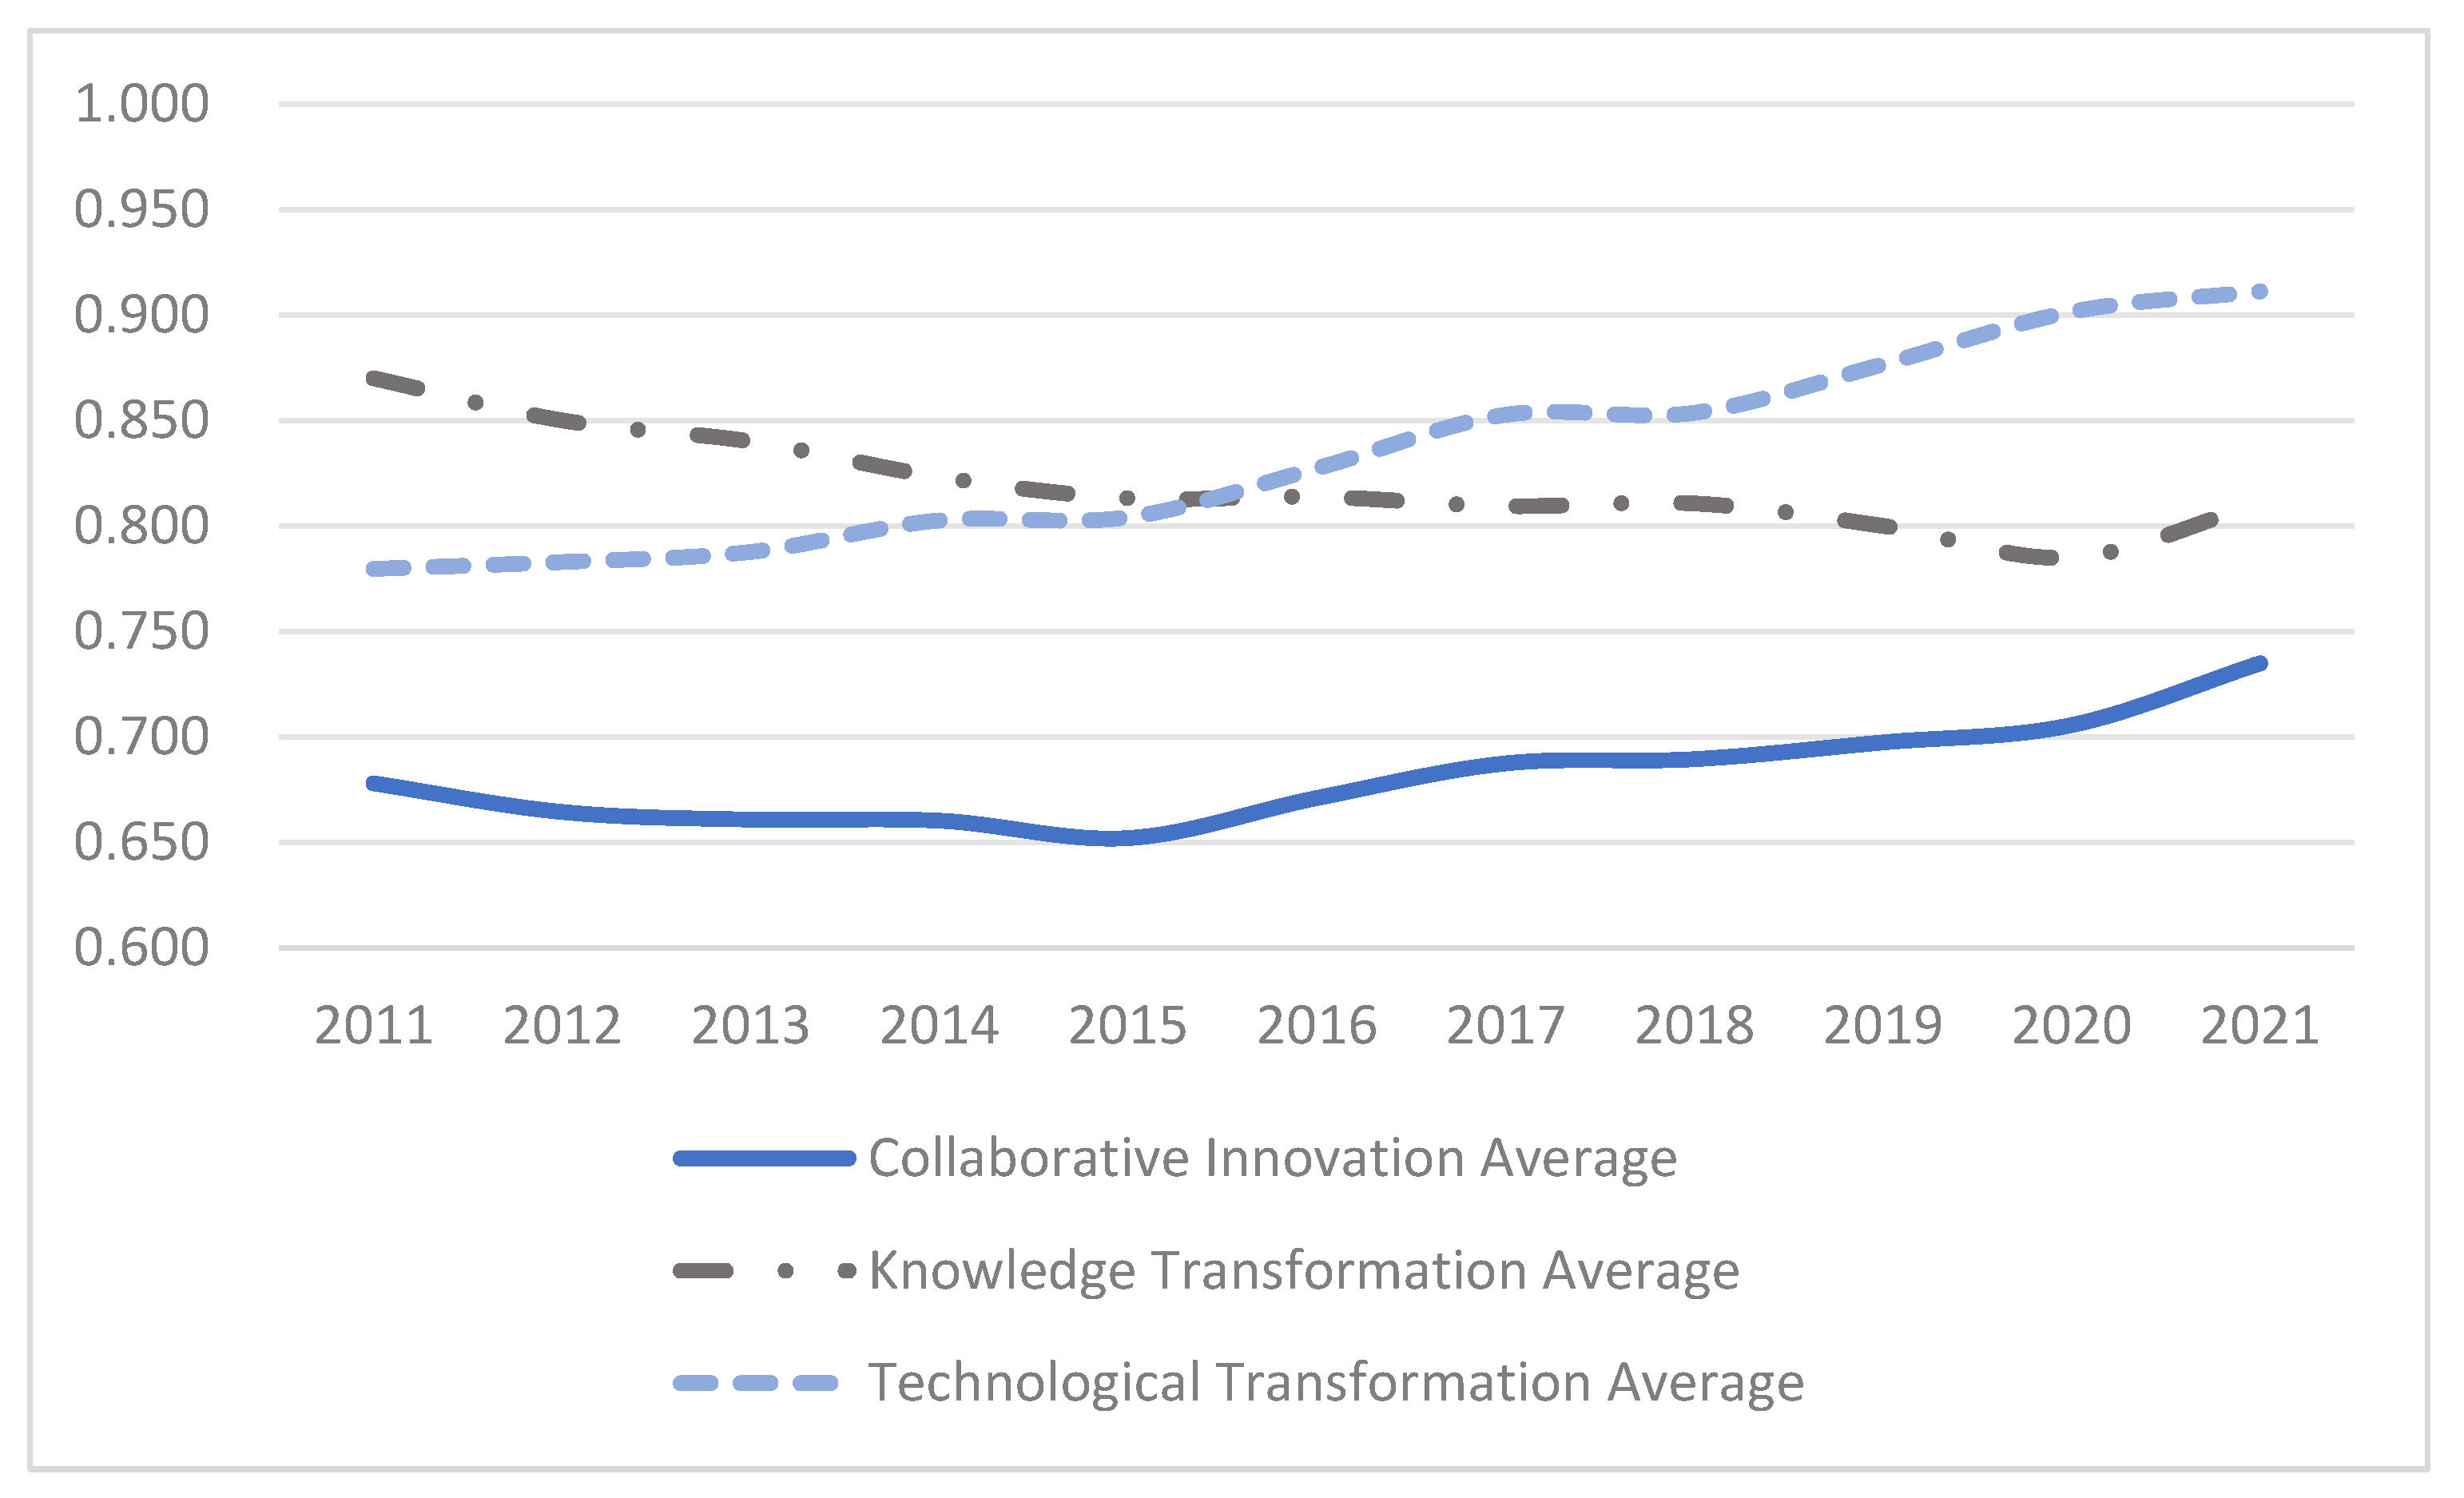
4.1.2. Temporal Dynamics Analysis
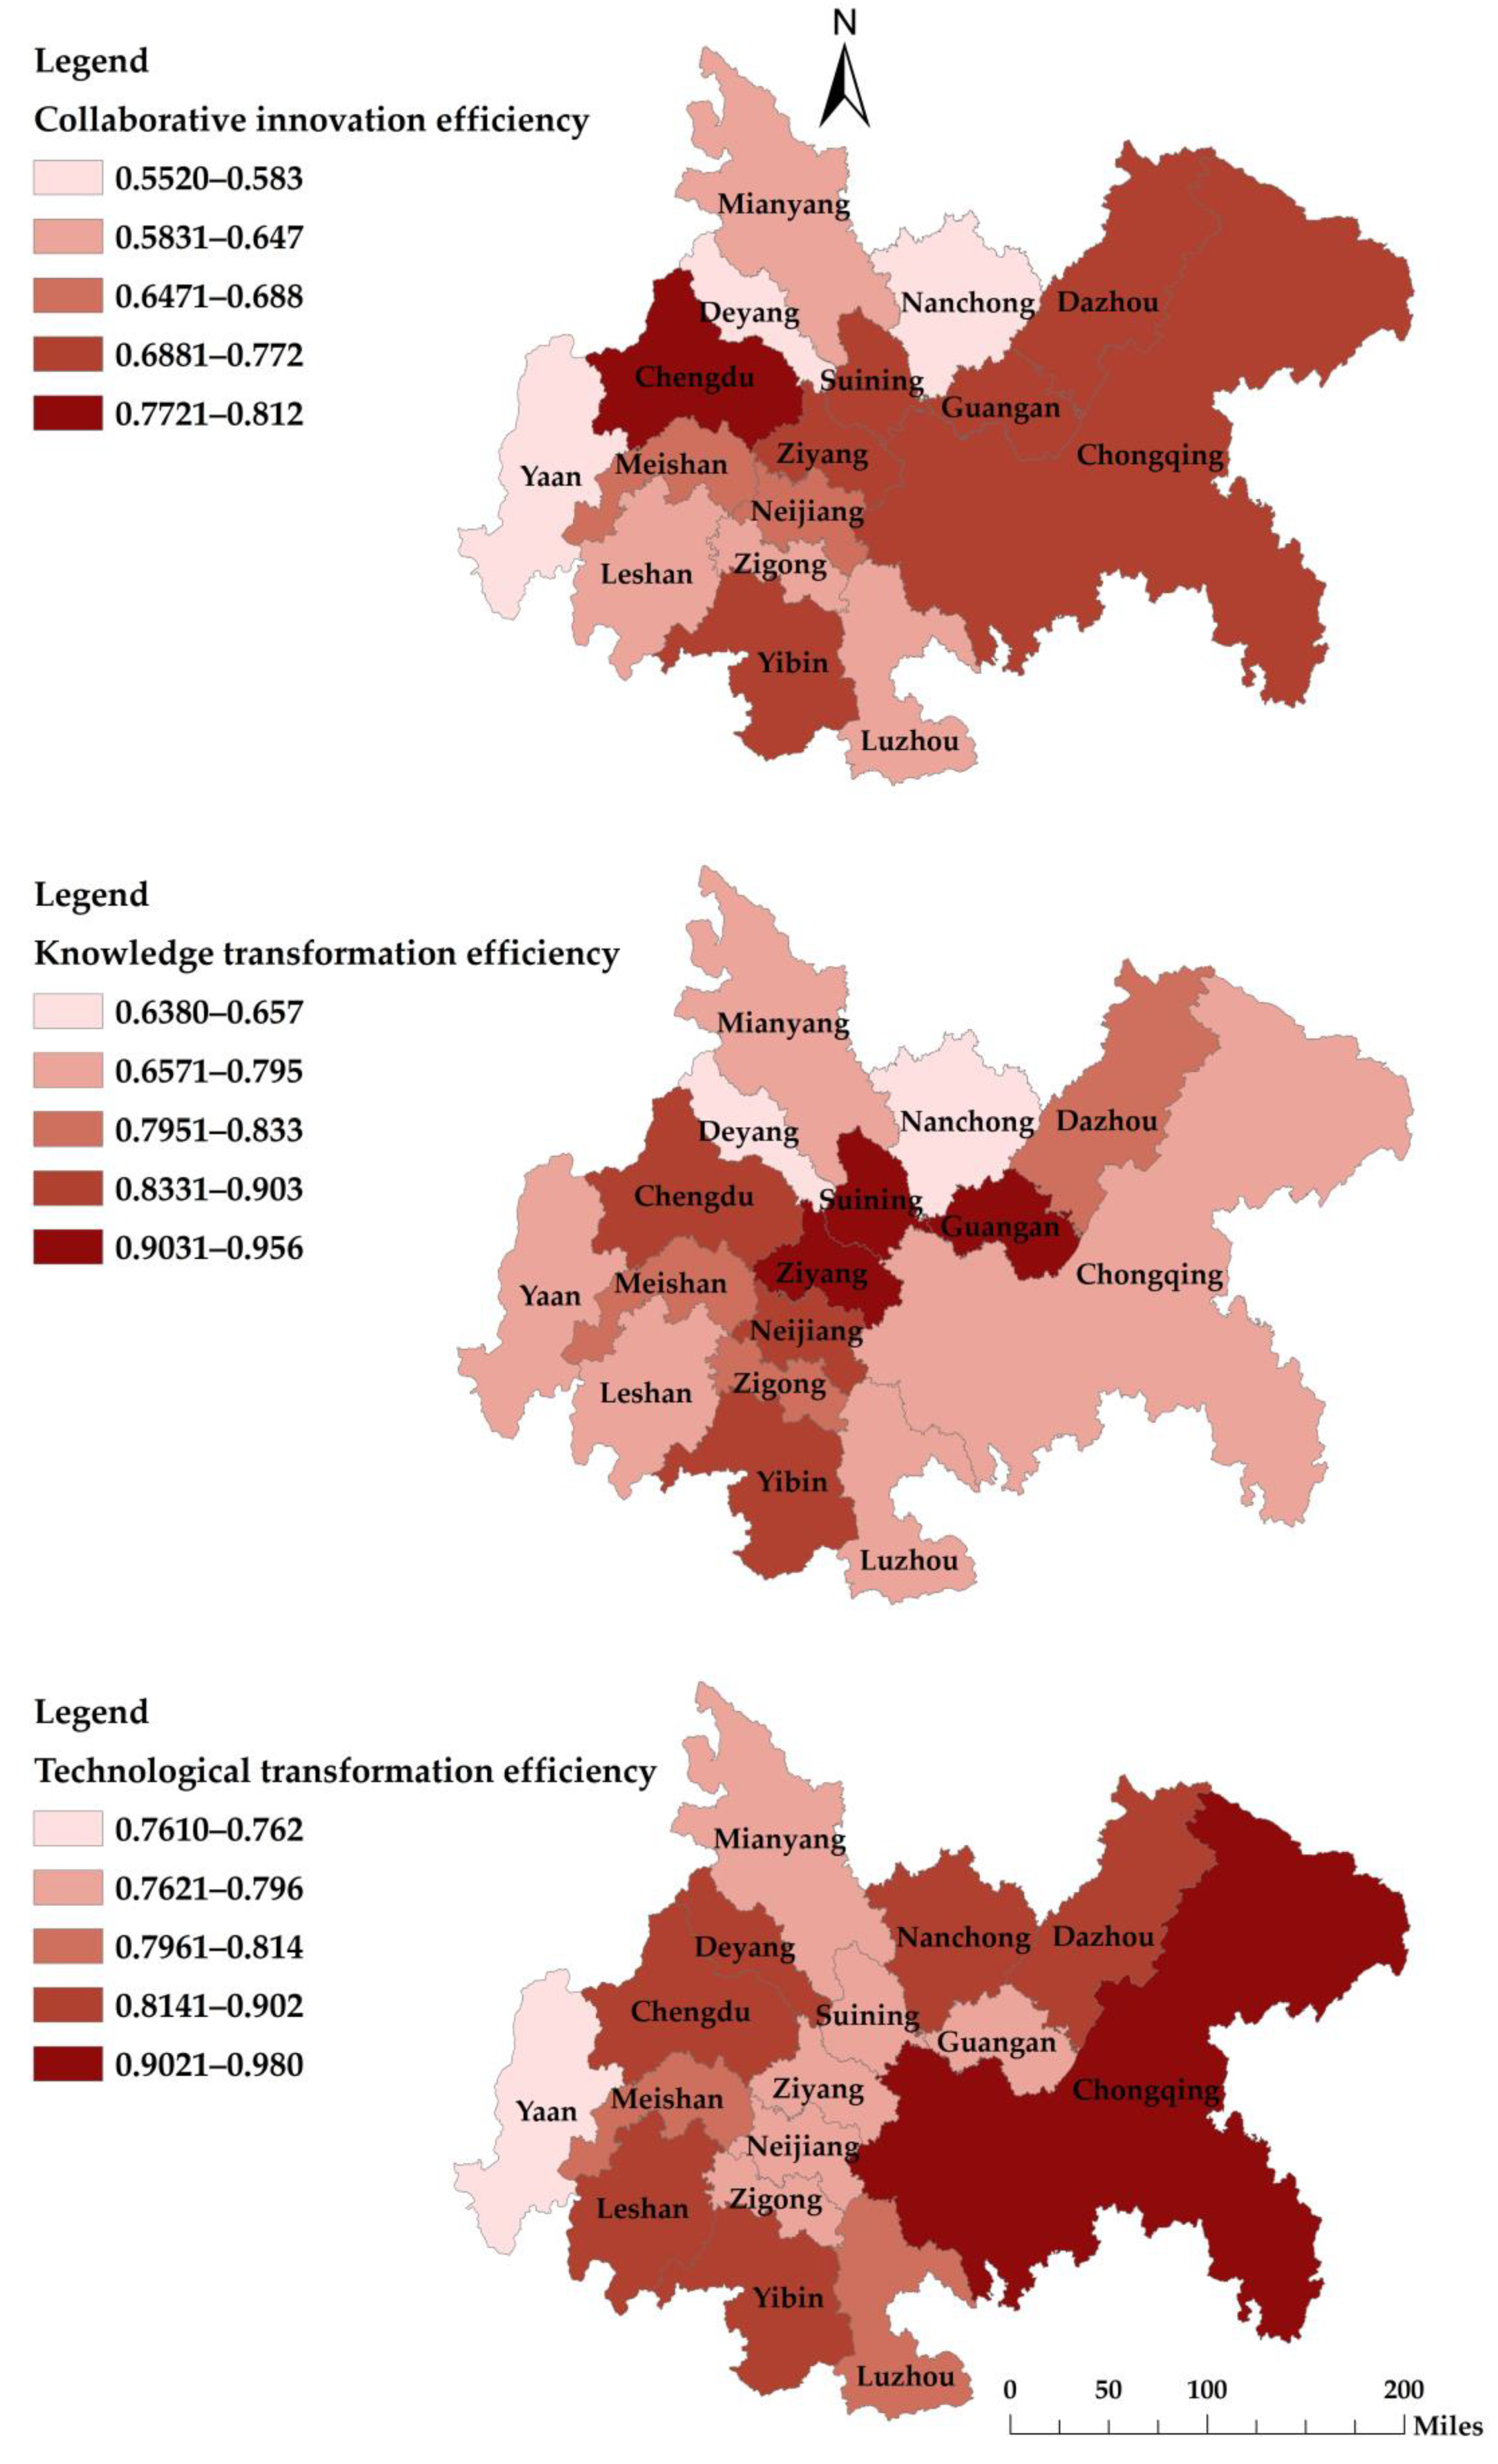
4.1.3. Spatial Distribution Analysis
4.2. Results of the Panel Tobit Model
4.2.1. Model Selection
4.2.2. Regression Results
4.2.3. Robustness Tests
- Replacement of the explanatory variables
- 2.
- Replacement of research models
4.2.4. Endogeneity Test
4.2.5. Heterogeneity Test
- Heterogeneity test for two-stage collaborative innovation
- 2.
- Heterogeneity test of different regions
4.3. Discussion
5. Conclusions and Suggestions
5.1. Conclusions
5.2. Suggestions
Author Contributions
Funding
Institutional Review Board Statement
Informed Consent Statement
Data Availability Statement
Conflicts of Interest
References
- Florida, R.; Adler, P.; Mellander, C. The city as innovation machine. In Transitions in Regional Economic Development; Routledge: Abingdon, UK, 2018; pp. 151–170. [Google Scholar]
- Shuai, S.; Fan, Z. Modeling the role of environmental regulations in regional green economy efficiency of China: Empirical evidence from super efficiency DEA-Tobit model. J. Environ. Manag. 2020, 261, 110227. [Google Scholar] [CrossRef] [PubMed]
- Fang, C.; Wang, Z.; Liu, H. Beautiful China Initiative: Human-nature harmony theory, evaluation index system and application. J. Geogr. Sci. 2020, 30, 691–704. [Google Scholar] [CrossRef]
- Liu, L.; Si, S.; Li, J. Research on the Effect of Regional Talent Allocation on High-Quality Economic Development—Based on the Perspective of Innovation-Driven Growth. Sustainability 2023, 15, 6315. [Google Scholar] [CrossRef]
- Porter, M.; Van der Linde, C. Green and Competitive: Ending the Stalemate. Harv. Bus. Rev. 1995, 33, 120–134. [Google Scholar]
- Huang, H.; Xu, E.; Fan, F. The impact of environmental regulations on the performance of regional collaborative innovation—In case of China’s 30 provinces. Environ. Sci. Pollut. Res. 2023, 30, 47985–48001. [Google Scholar] [CrossRef] [PubMed]
- Fan, F.; Lian, H.; Liu, X.; Wang, X. Can environmental regulation promote urban green innovation Efficiency? An empirical study based on Chinese cities. J. Clean. Prod. 2020, 287, 125060. [Google Scholar] [CrossRef]
- Jaffe, A.B.; Palmer, K. Environmental Regulation and Innovation: A Panel Data Study. Rev. Econ. Stat. 1997, 79, 610–619. [Google Scholar] [CrossRef]
- Lanoie, P.; Patry, M.; Lajeunesse, R. Environmental regulation and productivity: Testing the porter hypothesis. J. Product. Anal. 2008, 30, 121–128. [Google Scholar] [CrossRef]
- Jinping, X. Hold High the Great Banner of Socialism with Chinese Characteristics and Strive in Unity to Build a Modern Socialist Country in All Respects. In Proceedings of the 20th National Congress of the Communist Party, Beijing, China, 16 October 2022. [Google Scholar]
- Zeng, H.; Shao, B.; Bian, G.; Dai, H.; Zhou, F. Analysis of Influencing Factors and Trend Forecast of CO2 Emission in Chengdu-Chongqing Urban Agglomeration. Sustainability 2022, 14, 1167. [Google Scholar] [CrossRef]
- Committee of the Communist Party of China. Outline of the 14th Five-Year Plan (2021–2025) for National Economic and Social Development and Vision 2035 of the People’s Republic of China. 2021. Available online: https://www.gov.cn/xinwen/2021-03/13/content_5592681.htm (accessed on 13 March 2021).
- Committee of the Communist Party of China. Master Plan for the Chengdu-Chongqing Urban Agglomeration. 2021. Available online: https://www.gov.cn/zhengce/2021-10/21/content_5643875.htm (accessed on 21 October 2021).
- Hou, L.; Liu, Y.; He, X. Research on the Mechanism of Regional Innovation Network in Western China Based on ERGM: A Case Study of Chengdu-Chongqing Shuangcheng Economic Circle. Sustainability 2023, 15, 7993. [Google Scholar] [CrossRef]
- Wan, J.; Li, Y.; Ma, C.; Jiang, T.; Su, Y.; Zhang, L.; Song, X.; Sun, H.; Wang, Z.; Zhao, Y.; et al. Measurement of Coupling Coordination Degree and Spatio-Temporal Characteristics of the Social Economy and Ecological Environment in the Chengdu–Chongqing Urban Agglomeration under High-Quality Development. Int. J. Environ. Res. Public Health 2021, 18, 11629. [Google Scholar] [CrossRef] [PubMed]
- Porter, M. America’s green strategy. Bus. Environ. A Read. 1996, 33, 1072. [Google Scholar]
- Gollop, F.M.; Roberts, M.J. Environmental Regulations and Productivity Growth: The Case of Fossil-fueled Electric Power Generation. J. Political Econ. 1983, 91, 654–674. [Google Scholar] [CrossRef]
- Jorgenson, D.W.; Wilcoxen, P.J. Environmental Regulation and U.S. Economic Growth. RAND J. Econ. 1990, 21, 314. [Google Scholar] [CrossRef]
- Haken, H. Synergetics. Phys. Bull. 1977, 28, 412. [Google Scholar] [CrossRef]
- Schumpeter, J.; Backhaus, U. The theory of economic development. In Joseph Alois Schumpeter: Entrepreneurship, Style and Vision; Springer: Berlin/Heidelberg, Germany, 1934; pp. 61–116. [Google Scholar]
- Edler, J.; Georghiou, L. Public procurement and innovation—Resurrecting the demand side. Res. Policy 2007, 36, 949–963. [Google Scholar] [CrossRef]
- Song, Y.; Zhang, J.; Song, Y.; Fan, X.; Zhu, Y.; Zhang, C. Can industry-university-research collaborative innovation efficiency reduce carbon emissions? Technol. Forecast. Soc. Chang. 2020, 157, 120094. [Google Scholar] [CrossRef]
- Fang, S.; Xue, X.; Yin, G.; Fang, H.; Li, J.; Zhang, Y. Evaluation and Improvement of Technological Innovation Efficiency of New Energy Vehicle Enterprises in China Based on DEA-Tobit Model. Sustainability 2020, 12, 7509. [Google Scholar] [CrossRef]
- Chen, Y.; Zhang, D. Multiscale assessment of the coupling coordination between innovation and economic development in resource-based cities: A case study of Northeast China. J. Clean. Prod. 2021, 318, 128597. [Google Scholar] [CrossRef]
- Fan, F.; Lian, H.; Wang, S. Can regional collaborative innovation improve innovation efficiency? An empirical study of Chinese cities. Growth Chang. 2019, 51, 440–463. [Google Scholar] [CrossRef]
- Yajie, W.; Jiaying, Z. Dynamic Evaluation of Urban Agglomeration Collaborative Innovation. Stat. Decis. 2022, 38, 168–173. [Google Scholar]
- Shouhao, L.; Xueliang, W. Measurement and Evaluation of the Collaborative Degree of Collaborative Innovation System in the Pearl River-Xijiang Economic Belt. Coast. Enterp. Sci. Technol. 2023, 2, 31–38. [Google Scholar]
- Antonelli, C.; Crespi, F.; Scellato, G. Internal and external factors in innovation persistence. Econ. Innov. New Technol. 2013, 22, 256–280. [Google Scholar] [CrossRef]
- Cooke, P.; Schienstock, G. Structural Competitiveness and Learning Regions. Enterp. Innov. Manag. Stud. 2000, 1, 265–280. [Google Scholar] [CrossRef]
- Veugelers, R. Which policy instruments to induce clean innovating? Res. Policy 2012, 41, 1770–1778. [Google Scholar] [CrossRef]
- Petruzzelli, A.M.; Ardito, L.; Savino, T. Maturity of knowledge inputs and innovation value: The moderating effect of firm age and size. J. Bus. Res. 2018, 86, 190–201. [Google Scholar] [CrossRef]
- Wang, C.; Hu, Q. Knowledge sharing in supply chain networks: Effects of collaborative innovation activities and capability on innovation performance. Technovation 2017, 94–95, 102010. [Google Scholar] [CrossRef]
- Najafi-Tavani, S.; Najafi-Tavani, Z.; Naudé, P.; Oghazi, P.; Zeynaloo, E. How collaborative innovation networks affect new product performance: Product innovation capability, process innovation capability, and absorptive capacity. Ind. Mark. Manag. 2018, 73, 193–205. [Google Scholar] [CrossRef]
- Coase, R.H. The Problem of Social Cost. J. Law Econ. 1960, 3, 1. [Google Scholar] [CrossRef]
- Tian, Y.; Wan, Q.; Tan, Y. Exploration on Inter-Relation of Environmental Regulation, Economic Structure, and Economic Growth: Provincial Evidence from China. Sustainability 2022, 15, 248. [Google Scholar] [CrossRef]
- Grossman, G.M.; Krueger, A.B. Economic growth and the environment. Q. J. Econ. 1995, 110, 353–377. [Google Scholar] [CrossRef]
- Jia, J.-X.; Luo, L.-X.; Gu, J. Local Environmental Regulation and High-quality Economic Development. China Ind. Econ. 2023, 5, 99–117. [Google Scholar]
- Song, W.; Han, X. Heterogeneous two-sided effects of different types of environmental regulations on carbon productivity in China. Sci. Total Environ. 2022, 841, 156769. [Google Scholar] [CrossRef] [PubMed]
- Coria, J.; Köhlin, G.; Xu, J. On the Use of Market-Based Instruments to Reduce Air Pollution in Asia. Sustainability 2019, 11, 4895. [Google Scholar] [CrossRef]
- Di Ubaldo, M.; McGuire, S.; Shirodkar, V. Voluntary programs and emissions revisited: What is the effect of EU trade agreements with environmental provisions? J. Int. Bus. Policy 2022, 5, 467–489. [Google Scholar] [CrossRef]
- Wu, D.; Memon, H. Public Pressure, Environmental Policy Uncertainty, and Enterprises’ Environmental Information Disclosure. Sustainability 2022, 14, 6948. [Google Scholar] [CrossRef]
- Hao, X.; Li, Y.; Ren, S.; Wu, H.; Hao, Y. The role of digitalization on green economic growth: Does industrial structure optimization and green innovation matter? J. Environ. Manag. 2023, 325, 116504. [Google Scholar] [CrossRef]
- Percival, R.V.; Schroeder, C.H.; Miller, A.S.; Leape, J.P. Environmental Regulation: Law, Science, and Policy; Connected EBook with Study Center; Aspen Publishing: Boston, MA, USA, 2021. [Google Scholar]
- Guo, K.; Cao, Y.; Wang, Z.; Li, Z. Urban and industrial environmental pollution control in China: An analysis of capital input, efficiency and influencing factors. J. Environ. Manag. 2022, 316, 115198. [Google Scholar] [CrossRef]
- Peng, J.; Xie, R.; Ma, C.; Fu, Y. Market-based environmental regulation and total factor productivity: Evidence from Chinese enterprises. Econ. Model. 2021, 95, 394–407. [Google Scholar] [CrossRef]
- Xie, R.; Teo, T.S. Green technology innovation, environmental externality, and the cleaner upgrading of industrial structure in China—Considering the moderating effect of environmental regulation. Technol. Forecast. Soc. Chang. 2022, 184, 122020. [Google Scholar] [CrossRef]
- Hashmi, R.; Alam, K. Dynamic relationship among environmental regulation, innovation, CO2 emissions, population, and economic growth in OECD countries: A panel investigation. J. Clean. Prod. 2019, 231, 1100–1109. [Google Scholar] [CrossRef]
- Lyu, Y.; Zhang, J.; Wang, L.; Yang, F.; Hao, Y. Spatial pattern of knowledge innovation function among Chinese cities and its influencing factors. J. Geogr. Sci. 2023, 33, 1161–1184. [Google Scholar]
- Hasan, M.M.; Du, F. Nexus between green financial development, green technological innovation and environmental regulation in China. Renew. Energy 2023, 204, 218–228. [Google Scholar] [CrossRef]
- Leminen, S.; Rajahonka, M.; Westerlund, M.; Hossain, M. Collaborative innovation for sustainability in Nordic cities. J. Clean. Prod. 2021, 328, 129549. [Google Scholar] [CrossRef]
- Pan, X.; Ai, B.; Li, C.; Pan, X.; Yan, Y. Dynamic relationship among environmental regulation, technological innovation and energy efficiency based on large scale provincial panel data in China. Technol. Forecast. Soc. Chang. 2019, 144, 428–435. [Google Scholar] [CrossRef]
- Wu, F.; Fu, X.; Zhang, T.; Wu, D.; Sindakis, S. Examining Whether Government Environmental Regulation Promotes Green Innovation Efficiency—Evidence from China’s Yangtze River Economic Belt. Sustainability 2022, 14, 1827. [Google Scholar] [CrossRef]
- Albrizio, S.; Kozluk, T.; Zipperer, V. Environmental policies and productivity growth: Evidence across industries and firms. J. Environ. Econ. Manag. 2017, 81, 209–226. [Google Scholar] [CrossRef]
- Lv, C.; Shao, C.; Lee, C.-C. Green technology innovation and financial development: Do environmental regulation and innovation output matter? Energy Econ. 2021, 98, 105237. [Google Scholar] [CrossRef]
- Qi, Y.; Tao, C. Influence of factor agglomeration on regional innovation capability under environmental constraints—An empirical analysis based on GWR model. Sci. Res. Manag. 2014, 35, 17. [Google Scholar]
- Cook, W.D.; Liang, L.; Zhu, J. Measuring performance of two-stage network structures by DEA: A review and future perspective. Omega 2010, 38, 423–430. [Google Scholar] [CrossRef]
- Li, Y.; Chen, Y.; Liang, L.; Xie, J. DEA models for extended two-stage network structures. Omega 2012, 40, 611–618. [Google Scholar] [CrossRef]
- Liang, L.; Cook, W.D.; Zhu, J. DEA models for two-stage processes: Game approach and efficiency decomposition. Nav. Res. Logist. NRL 2008, 55, 643–653. [Google Scholar] [CrossRef]
- Sueyoshi, T.; Yuan, Y.; Goto, M. A literature study for DEA applied to energy and environment. Energy Econ. 2016, 62, 104–124. [Google Scholar] [CrossRef]
- Van Burg, E.; Berends, H.; Van Raaij, E.M. Framing and interorganizational knowledge transfer: A process study of collaborative innovation in the aircraft industry. J. Manag. Stud. 2014, 51, 349–378. [Google Scholar] [CrossRef]
- Ahmad, M.; Jiang, P.; Majeed, A.; Umar, M.; Khan, Z.; Muhammad, S. The dynamic impact of natural resources, technological innovations and economic growth on ecological footprint: An advanced panel data estimation. Resour. Policy 2020, 69, 101817. [Google Scholar] [CrossRef]
- Shi, X.; Wu, Y.; Fu, D. Does University-Industry collaboration improve innovation efficiency? Evidence from Chinese Firms. Econ. Model. 2020, 86, 39–53. [Google Scholar] [CrossRef]
- Li, X.-D.; Rao, M.-X.; Yuan, Y. How to Enhance the Regional Innovation Ecosystem’s Energy-level in the Context of “Data andIntelligence”? Stud. Sci. Sci. 2023, 9, 1–15. [Google Scholar]
- Ma, J.; Hu, Q.; Shen, W.; Wei, X. Does the Low-Carbon City Pilot Policy Promote Green Technology Innovation? Based on Green Patent Data of Chinese A-Share Listed Companies. Int. J. Environ. Res. Public Health 2021, 18, 3695. [Google Scholar] [CrossRef]
- Jenks, G.F.; Caspall, F.C. Error on choroplethic maps: Definition, measurement, reduction. Ann. Assoc. Am. Geogr. 1971, 61, 217–244. [Google Scholar] [CrossRef]
- Zou, H.; Zhang, Y. Does environmental regulatory system drive the green development of China’s pollution-intensive industries? J. Clean. Prod. 2022, 330, 129832. [Google Scholar] [CrossRef]
- Wehrl, A. General properties of entropy. Rev. Mod. Phys. 1978, 50, 221–260. [Google Scholar] [CrossRef]
- Gray, R.M. Entropy and Information Theory; Springer Science & Business Media: Berlin/Heidelberg, Germany, 2011. [Google Scholar]
- Wang, Z.; Wang, X. Research on the impact of green finance on energy efficiency in different regions of China based on the DEA-Tobit model. Resour. Policy 2022, 77, 102695. [Google Scholar] [CrossRef]
- Wooldridge, J.M. Introductory Econometrics: A Modern Approach; Cengage Learning: Singapore, 2015. [Google Scholar]
- Wei, S. Practice and Experience of Chengdu Science & Technology Financial System. Fisc. Sci. 2021, 4, 152–160. [Google Scholar]
- Zhang, J.; He, B.; Peng, D.; Zeng, T. The Construction, Monitor and Evaluation of Regional Innovation Capability Index System—Based on the Research and Evaluation of 21 Areas in Sichuan Province. Soft Sci. 2021, 35, 44–51. [Google Scholar]
- Huang, K.; Wei, X. How does the proximity of firms to the technology frontier affect collaborative innovation? Soc. Sci. J. 2023, 5, 172–180. [Google Scholar]
- Greene, W. Fixed and random effects in stochastic frontier models. J. Product. Anal. 2005, 23, 7–32. [Google Scholar] [CrossRef]
- Lind, J.T.; Mehlum, H. With or Without U? The Appropriate Test for a U-Shaped Relationship. Oxf. Bull. Econ. Stat. 2010, 72, 109–118. [Google Scholar] [CrossRef]
- Segate, R.V. The Distributive Surveillant Contract: Reforming “Surveillance Capitalism through Taxation” into a Legal Teleology of Global Economic Justice; Faculty of Law, University of Macau: Macau, China, 2022; Available online: https://library2.um.edu.mo/etheses/991010238079006306_ft.pdf (accessed on 2 January 2024).
- Xie, J.; Wang, Z. Threshold effect and its Spatial Different of Environmental Regulation on Tourism Eco-efficiency in the Yangtze River Economic Belt. Geogr. Geo-Inf. Sci. 2023, 39, 117–125. [Google Scholar]
- Yang, L.; Zhu, G.-L.; Wei, Q.-F. Research on the Fitting Drive of Financial Innovation, Technological Innovation and Economic Growth—Based on the Data of Double—City Economic Circle in Chengdu and Chongqing. Reform Econ. Syst. 2021, 4, 195–200. [Google Scholar]
- Liao, L.; Zhang, T. Spatio-temporal Evolution, Driving Factors and Dynamic Evolution of Spatial Economic Structure in Cheng-Yu District. Areal Res. Dev. 2023, 42, 14–20. [Google Scholar]
- Sun, H.; Li, H.; Ning, J. Industrial Synergistic Development of Chengdu-Chongqing Economic Circle under the New Pattern of Western Development. Acad. Exch. 2022, 2, 97–107. [Google Scholar]
- Yang, Q.-Q.; Zhao, J. The Impact of Heterogeneous Environmental Regulation on Environmental Total Factor Productivity: An Empirical Analysis Based on China’s Industrial Sector Data. Front. Sci. Technol. Eng. Manag. 2023, 6, 1–11. [Google Scholar]
- Zhao, X.; Sun, B. The influence of Chinese environmental regulation on corporation innovation and competitiveness. J. Clean. Prod. 2016, 112, 1528–1536. [Google Scholar] [CrossRef]
- Segate, R.V. Protecting cultural heritage by recourse to International Environmental Law: Chinese stances on faultless state liability. Hastings Environ. Law J. 2021, 27, 153. [Google Scholar]


| Stage | Vector | Category | Indicator |
|---|---|---|---|
| Knowledge transformation stage | Inputs | Human resources | The number of full-time teachers in colleges and universities (TCUs) |
| The number of students in colleges and universities (SCUs) | |||
| Capital | Education expenditure of finance (EEF) | ||
| Outputs | Science and technology | The number of scientific papers (SPs) | |
| The number of invention patents (IPs) | |||
| Technological transformation stage | Inputs | Science and technology | The number of scientific papers (SPs) |
| The number of invention patents (IPs) | |||
| Human resources | The number of employees in scientific research and technical services (ESTs) | ||
| Capital | Science expenditure of finance (SEF) | ||
| Outputs | GDP | GDP | |
| Innovation | Innovation index (II) |
| Indicator | Weight | |
|---|---|---|
| Environmental Regulation (ER) | Urban domestic sewage treatment ratio (UDSTR) | 0.054130137 |
| Industrial solid waste comprehensive utilization ratio (ISWCUR) | 0.050324387 | |
| Domestic waste harmless treatment ratio (DWHTR) | 0.005603409 | |
| The volume of industrial sulfur dioxide removed (VISDR) | 0.163104783 | |
| Industrial wastewater discharge reaches standard level (IWDRSL) | 0.466230143 | |
| The volume of industrial soot removed (VISR) | 0.260607140 |
| Index Category | Index Name |
|---|---|
| Explained variables | Collaborative innovation efficiency (CIE) |
| Knowledge transformation-stage efficiency (KE) | |
| Technological transformation-stage efficiency (TE) | |
| Explanatory variable | Environmental regulation (ER) |
| Control variables | Fixed asset investment (FAI) |
| Economic level (GDP) | |
| Science and education expenditure of finance (SEEF) |
| Variable | Sample Size | Mean | Median | Standard Deviation | Min | Max |
|---|---|---|---|---|---|---|
| CIE | 176 | 0.6819 | 0.6857 | 0.0913 | 0.4946 | 0.9506 |
| KE | 176 | 0.8205 | 0.8300 | 0.1018 | 0.5300 | 1.0000 |
| TE | 176 | 0.8345 | 0.8083 | 0.0844 | 0.6224 | 1.0000 |
| ER | 176 | 0.1084 | 0.0716 | 0.1487 | 0.0152 | 0.9252 |
| ER2 | 176 | 0.0337 | 0.0052 | 0.1185 | 0.0002 | 0.8561 |
| LNGAI | 176 | 16.4457 | 16.2689 | 0.9769 | 14.8573 | 19.0518 |
| LNGDP | 176 | 16.6619 | 16.4305 | 0.9062 | 15.0686 | 19.4465 |
| LNSEEF | 176 | 13.2642 | 13.0434 | 0.8829 | 11.5469 | 15.9989 |
| ANOVA—Collaborative innovation efficiency | ||||||
| Source of Variation | Sum of Squares | Degrees of Freedom | Mean Square | F-value | p-value | F crit |
| Between Group | 1.013878 | 15 | 0.067592 | 24.30412 | 0.0000 | 1.72930841 |
| Within Group | 0.444974 | 160 | 0.002781 | |||
| Total | 1.458851 | 175 | ||||
| ANOVA—Knowledge transformation efficiency | ||||||
| Source of Variation | Sum of Squares | Degrees of Freedom | Mean Square | F-value | p-value | F crit |
| Between Group | 1.42189 | 15 | 0.094793 | 38.63534 | 0.0000 | 1.72930841 |
| Within Group | 0.392564 | 160 | 0.002454 | |||
| Total | 1.814454 | 175 | ||||
| ANOVA—Technological transformation efficiency | ||||||
| Source of Variation | Sum of Squares | Degrees of Freedom | Mean Square | F-value | p-value | F crit |
| Between Group | 0.534873 | 15 | 0.035658 | 8.020298 | 0.0000 | 1.72930841 |
| Within Group | 0.711359 | 160 | 0.004446 | |||
| Total | 1.246232 | 175 | ||||
| City | Collaborative Innovation Efficiency | Knowledge Transformation Efficiency | Technological Transformation Efficiency |
|---|---|---|---|
| Chongqing | 0.772 | 0.787 | 0.980 |
| Chengdu | 0.812 | 0.903 | 0.902 |
| Zigong | 0.647 | 0.822 | 0.788 |
| Luzhou | 0.633 | 0.779 | 0.814 |
| Deyang | 0.552 | 0.638 | 0.877 |
| Mianyang | 0.627 | 0.795 | 0.790 |
| Suining | 0.734 | 0.922 | 0.796 |
| Neijiang | 0.688 | 0.870 | 0.793 |
| Leshan | 0.638 | 0.750 | 0.851 |
| Nanchong | 0.575 | 0.657 | 0.876 |
| Meishan | 0.664 | 0.819 | 0.813 |
| Yibin | 0.762 | 0.883 | 0.865 |
| Guang’an | 0.749 | 0.947 | 0.792 |
| Dazhou | 0.719 | 0.833 | 0.866 |
| Ya’an | 0.583 | 0.766 | 0.762 |
| Ziyang | 0.754 | 0.956 | 0.788 |
| Category | Number | City |
|---|---|---|
| Category I | 1 | Chengdu |
| Category II | 6 | Chongqing, Guang’an, Ziyang, Suining, Yibin, Dazhou |
| Category III | 2 | Neijiang, Meishan |
| Category IV | 4 | Mianyang, Leshan, Zigong, Luzhou |
| Category V | 3 | Ya’an, Deyang, Nanchong |
| CIE | Coefficient | Std. Err. | z | p > z | [95% Conf. Interval] | |
|---|---|---|---|---|---|---|
| ER | −0.5343932 | 0.2434281 | −2.2 | 0.0280 | −1.011503 | −0.057283 |
| ER2 | 0.5600783 | 0.1961016 | 2.86 | 0.0040 | 0.1757262 | 0.9444305 |
| LNFAI | −0.0291481 | 0.01567 | −1.86 | 0.0630 | −0.0598608 | 0.0015645 |
| LNGDP | 0.2143501 | 0.0356376 | 6.01 | 0.0000 | 0.1445016 | 0.2841986 |
| LNSEEF | −0.1095134 | 0.029577 | −3.7 | 0.0000 | −0.1674832 | −0.0515436 |
| _cons | −0.9186117 | 0.2322074 | −3.96 | 0.0000 | −1.37373 | −0.4634936 |
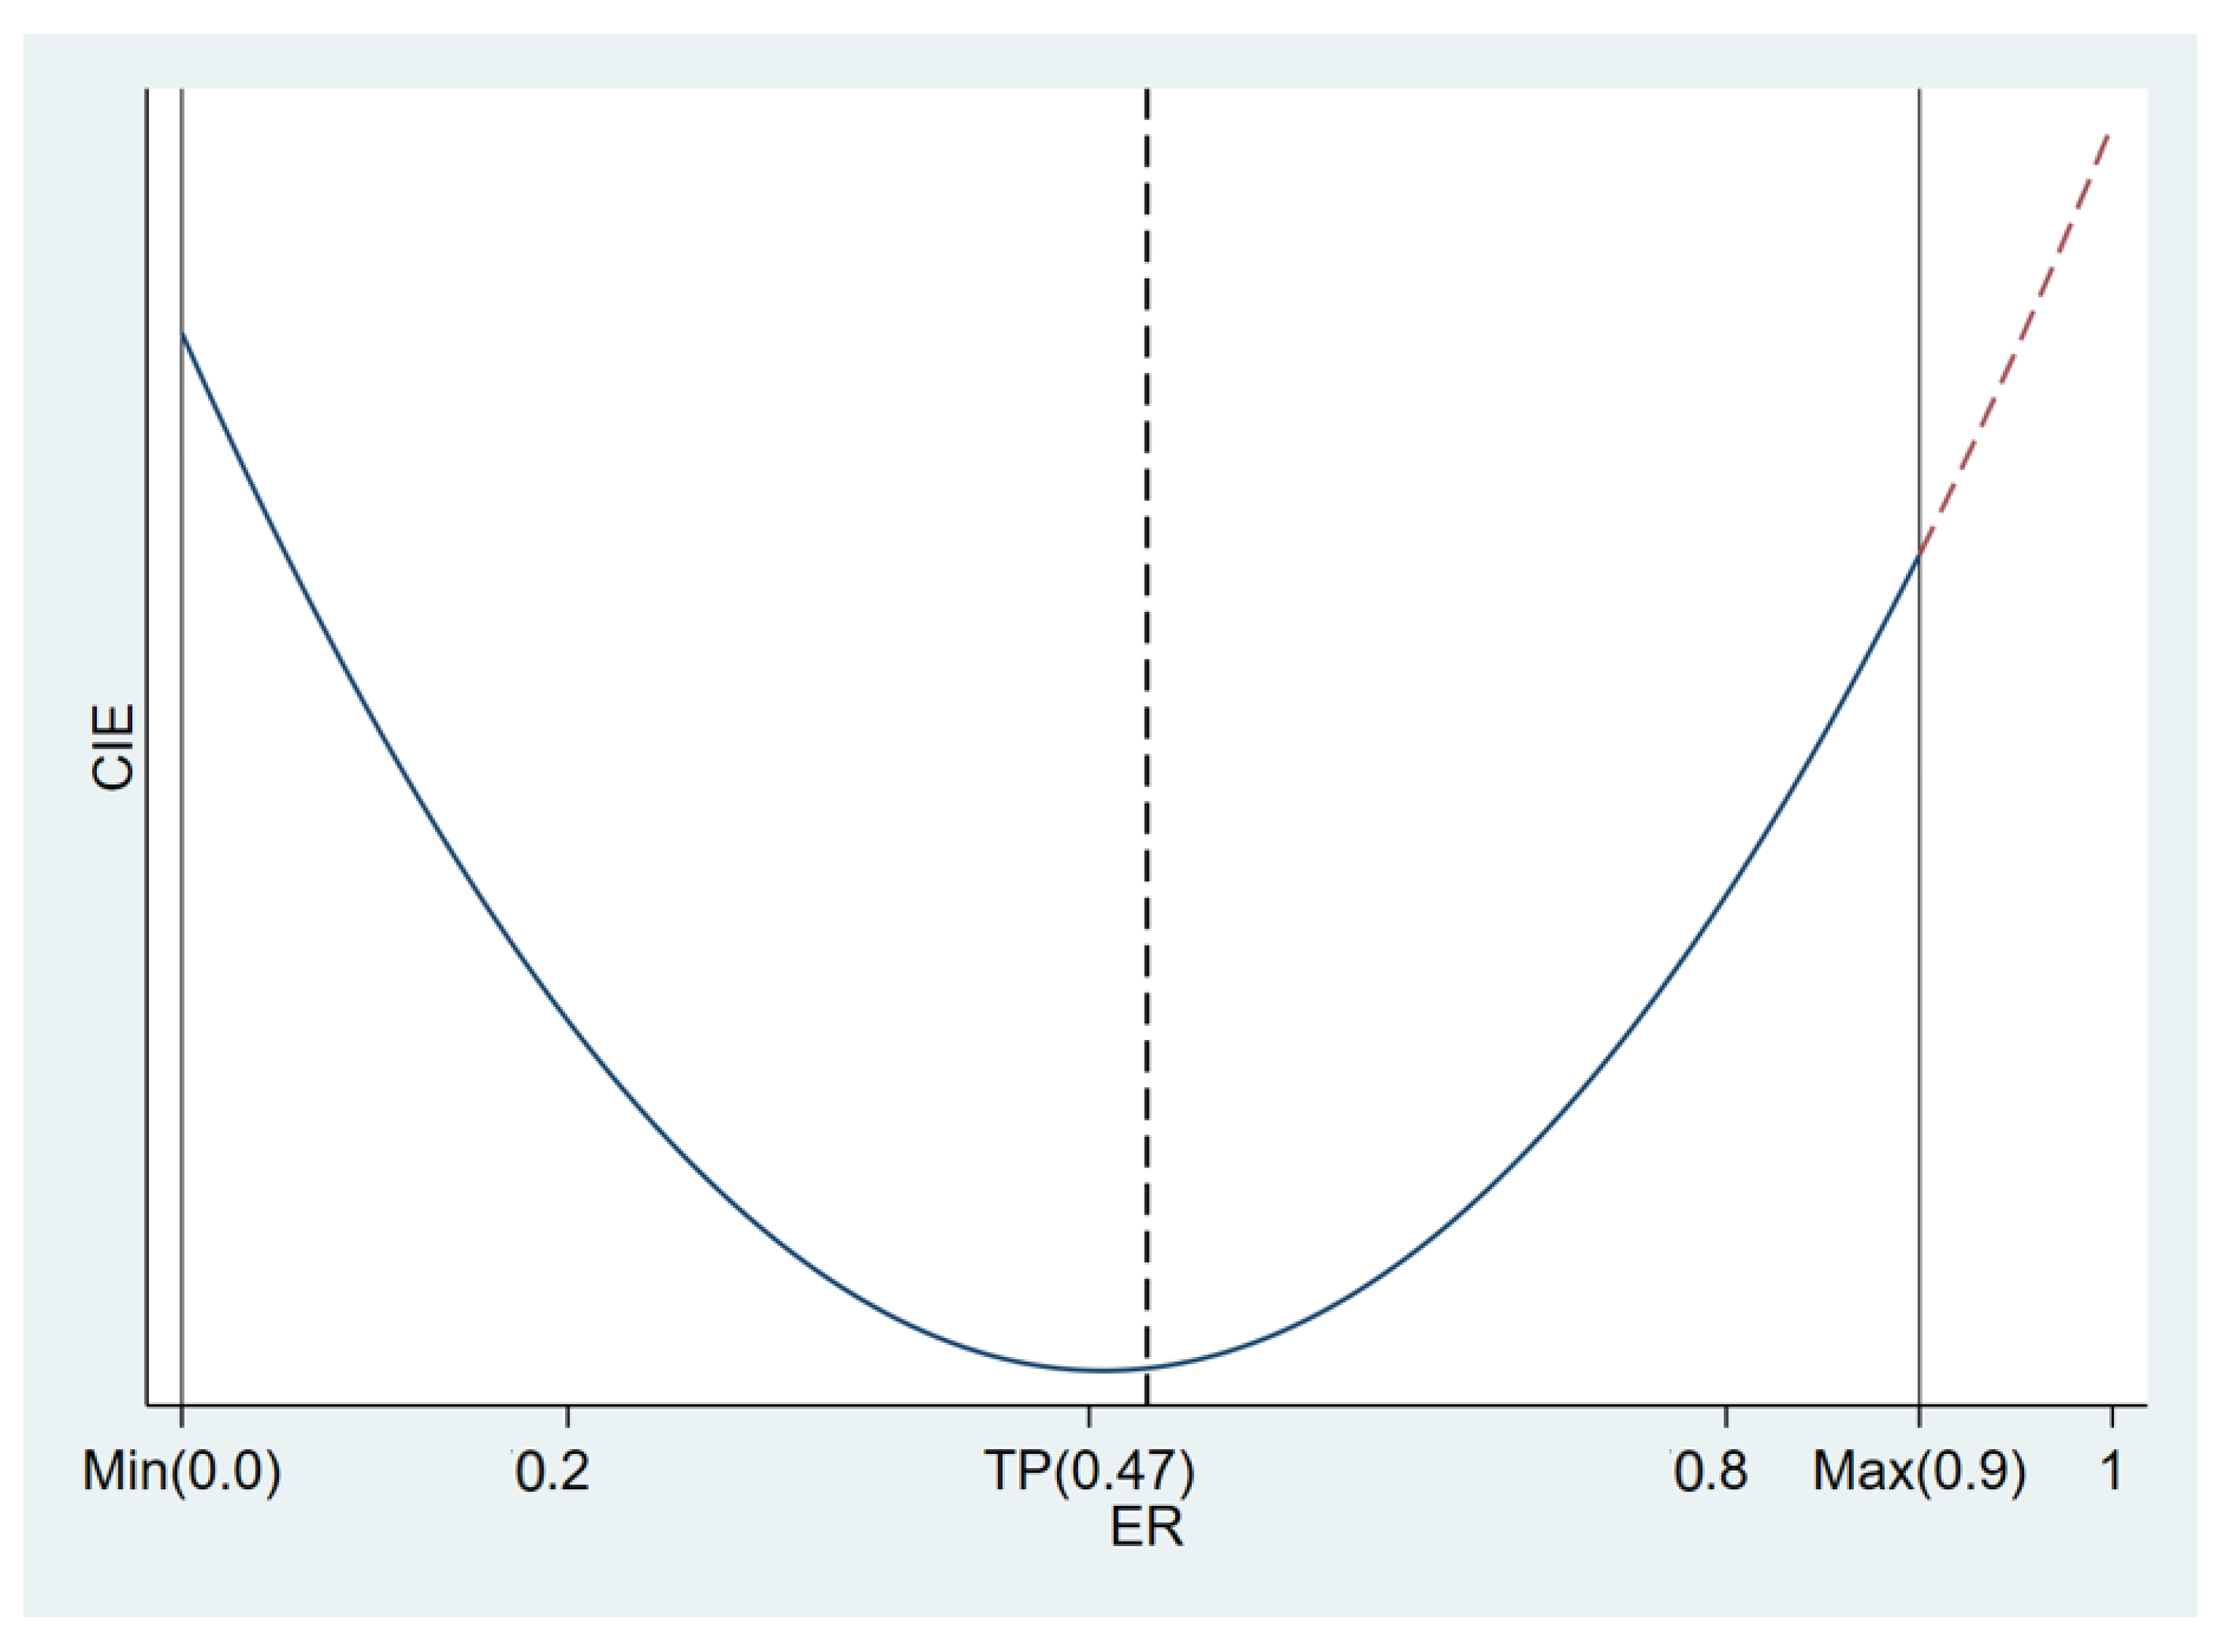
| Lower Bound | Upper Bound | |
|---|---|---|
| Extreme point | 0.47707 | |
| Interval | 0.0152 | 0.9252 |
| Overall test of the presence of a U shape | t-value | 2.18 |
| p > t | 0.0155 | |
| Slope | −0.5173668 | 0.5019757 |
| t-value | −2.175422 | 3.200778 |
| p > |t| | 0.015466 | 0.0008131 |
| Variables | (1) CIE Random_Tobit | (2) CIE Lag1−Random_Tobit | (3) CIE Lag2−Random_Tobit |
|---|---|---|---|
| ER | −0.534 ** | ||
| (0.243) | |||
| ER2 | 0.560 *** | ||
| (0.196) | |||
| LNFAI | −0.0291 * | −0.0404 ** | −0.0431 ** |
| (0.0157) | (0.0160) | (0.0171) | |
| LNGDP | 0.214 *** | 0.225 *** | 0.241 *** |
| (0.0356) | (0.0397) | (0.0426) | |
| LNSEEF | −0.110 *** | −0.0968 ** | −0.0964 ** |
| (0.0296) | (0.0387) | (0.0423) | |
| Lag1.ER | −0.470 * | ||
| (0.263) | |||
| Lag2.ER | −0.528 * | ||
| (0.291) | |||
| Lag1.ER2 | 0.580 ** | ||
| (0.229) | |||
| Lag2.ER2 | 0.694 ** | ||
| (0.272) | |||
| _cons | −0.919 *** | −1.085 *** | −1.313 *** |
| (0.232) | (0.247) | (0.275) | |
| N | 176 | 160 | 144 |
| Models | (4) Fixed_Ols | (5) Random_Gls | (6) Random_Tobit |
|---|---|---|---|
| ER | −0.585 | −0.462 | −0.534 ** |
| (0.343) | (0.302) | (0.243) | |
| ER2 | 0.581 ** | 0.520 *** | 0.560 *** |
| (0.240) | (0.178) | (0.196) | |
| LNFAI | −0.0374 | −0.0204 | −0.0291 * |
| (0.0450) | (0.0385) | (0.0157) | |
| LNGDP | 0.248 ** | 0.177 ** | 0.214 *** |
| (0.0945) | (0.0781) | (0.0356) | |
| LNSEEF | −0.127 ** | −0.0893 | −0.110 *** |
| (0.0545) | (0.0570) | (0.0296) | |
| _cons | −1.106 | −0.721 | −0.919 *** |
| (0.814) | (0.610) | (0.232) | |
| N | 176 | 176 | 176 |
| First-Stage Regression | Tobit with Endogenous Regressors | |
|---|---|---|
| ER | −1.083742 ** (0.4854951) | |
| ER2 | 1.045021 *** (0.0231158) | 1.169474 ** (0.5196073) |
| IV(PWEPM) | 0.018897 *** (0.0026695) |
| Variables | Explained Variables | ||
|---|---|---|---|
| CIE | KE | TE | |
| Explanatory variable | |||
| ER | −0.534 ** | 0.0211 | −0.739 *** |
| (0.243) | (0.251) | (0.242) | |
| ER2 | 0.560 *** | 0.304 | 0.530 ** |
| (0.196) | (0.201) | (0.245) | |
| Control variables | |||
| LNFAI | −0.0291 * | −0.0566 *** | 0.0345 * |
| (0.0157) | (0.0155) | (0.0180) | |
| LNGDP | 0.214 *** | 0.0341 | 0.228 *** |
| (0.0356) | (0.0340) | (0.0454) | |
| LNSEEF | −0.110 *** | −0.0231 | −0.129 *** |
| (0.0296) | (0.0291) | (0.0328) | |
| _cons | −0.919 *** | 1.479 *** | −1.765 *** |
| (0.232) | (0.227) | (0.298) | |
| N | 176 | 176 | 176 |
| Variables | Total UR | Different Regions | ||
|---|---|---|---|---|
| EAST | CENTRAL | WEST | ||
| Explanatory variable | ||||
| ER | −0.534 ** | −0.497 *** | 2.414 | −1.421 |
| (0.243) | (0.162) | (5.690) | (−0.57) | |
| ER2 | 0.560 *** | 0.570 *** | −30.62 | 2.249 |
| (0.196) | (0.130) | (39.45) | (0.17) | |
| Control variables | ||||
| LNFAI | −0.0291 * | −0.0219 | −0.0263 | −0.122 *** |
| (0.0157) | (0.0211) | (0.0180) | (−3.54) | |
| LNGDP | 0.214 *** | 0.139 *** | 0.241 *** | 0.394 *** |
| (0.0356) | (0.0312) | (0.0398) | (5.11) | |
| LNSEEF | −0.110 *** | −0.0543 | −0.0649 * | −0.211 ** |
| (0.0296) | (0.0430) | (0.0343) | (−3.10) | |
| _cons | −0.919 *** | −0.491 * | −1.993 *** | −1.075 ** |
| (0.232) | (0.253) | (0.304) | (−2.64) | |
| N | 176 | 44 | 66 | 66 |
Disclaimer/Publisher’s Note: The statements, opinions and data contained in all publications are solely those of the individual author(s) and contributor(s) and not of MDPI and/or the editor(s). MDPI and/or the editor(s) disclaim responsibility for any injury to people or property resulting from any ideas, methods, instructions or products referred to in the content. |
© 2024 by the authors. Licensee MDPI, Basel, Switzerland. This article is an open access article distributed under the terms and conditions of the Creative Commons Attribution (CC BY) license (https://creativecommons.org/licenses/by/4.0/).
Share and Cite
Wang, Z.; Fu, Y.; Wu, J. The Impact of Environmental Regulation on Collaborative Innovation Efficiency: Is the Porter Hypothesis Valid in Chengdu–Chongqing Urban Agglomeration? Sustainability 2024, 16, 2223. https://doi.org/10.3390/su16052223
Wang Z, Fu Y, Wu J. The Impact of Environmental Regulation on Collaborative Innovation Efficiency: Is the Porter Hypothesis Valid in Chengdu–Chongqing Urban Agglomeration? Sustainability. 2024; 16(5):2223. https://doi.org/10.3390/su16052223
Chicago/Turabian StyleWang, Zhaohan, Ying Fu, and Junqian Wu. 2024. "The Impact of Environmental Regulation on Collaborative Innovation Efficiency: Is the Porter Hypothesis Valid in Chengdu–Chongqing Urban Agglomeration?" Sustainability 16, no. 5: 2223. https://doi.org/10.3390/su16052223
APA StyleWang, Z., Fu, Y., & Wu, J. (2024). The Impact of Environmental Regulation on Collaborative Innovation Efficiency: Is the Porter Hypothesis Valid in Chengdu–Chongqing Urban Agglomeration? Sustainability, 16(5), 2223. https://doi.org/10.3390/su16052223