Abstract
This article investigates the land use and land cover (LULC) mosaic as a function of distance to the city centre. The research area is four Functional Urban Areas (FUAs) of the capitals of Central European countries: Czechia (Prague), Poland (Warsaw), Slovakia (Bratislava), and Hungary (Budapest). The article presents LULC mix changes in these FUAs in the context of transformations in urban cores and commuting zones of capital city metropolises, which have large populations and prominent positions in the country or region. The study makes use of Urban Atlas LULC data for 2006, 2012, and 2018. LULC change was analysed using a hexagonal tessellation with the hexagon as the basic spatial unit. Spatial entropy (ENT) and Simpson’s Diversity Index (SIDI) were employed. The change in ENT and SIDI were determined as a function of distance to urban cores, as well as changes on the first level of Urban Atlas nomenclature for 2006–2012 and 2012–2018, as well as on the third level of nomenclature for 2012–2018. The research shows that changes from 2006 to 2012 were more considerable than from 2012 to 2018. It also revealed that, if LULC classes are considered on the first level of nomenclature, diversity in urban cores grows and then declines in commuting zones. An analysis of diversity on the third level of nomenclature demonstrated its decline with the growing distance to the urban core. It has also been demonstrated that the mean values of ENT and SIDI are approximately twice as high in urban cores as in commuting zones, indicating a plateau of the mean value of ENT and SIDI over the study period in urban cores compared to an increase in commuting zones around them. The conducted research will be helpful to urban planners and decision-makers in directing the further, inevitable development of metropolitan areas in accordance with sustainable environmental management.
1. Introduction
According to data from the United Nations, 55% of the global population live in urbanised areas [1]. This share is growing, which advances the development of these sites [2]. Functional Urban Areas (FUAs) constitute 22.9% of the European Union’s territory and were home to 75% of the European population in 2012 [3]. Another factor is the rapid economic development, which drives land use and land cover (LULC) change and contrasts among land use types [4,5]. It results from an increase in built-up areas in urbanised locations, which significantly hinders other land use and land cover types [6,7]. It is worth noting that the development of urban areas often lags behind the growth in urban population, which frequently leads to shortages of hard infrastructure and recreational areas, overpopulation, or issues with pollution and environmental protection [8,9]. Two types of areas stand out in this regard, industrial areas and capital metropolises, which clearly outrank other metropolises and cities in the country.
In light of the above, the assessment of land use and land cover change (LULCC) in urbanised areas seems particularly important for spatial planning and sustainable development policy implementation. LULCC in urbanised areas is often investigated within Functional Urban Areas (FUAs) [6,7,10]. The notion of FUA concerns the city and its commuting zone. Now, the FUA consists of a densely populated city (urban core, UC) and the commuting zone (CoZ) around it, which is less populated but strictly dependent on the UC for the labour market [11]. Therefore, it is reasonable to consider LULCC in relation to the FUA as a unit characterised by significant urbanisation processes and strong socioeconomic relationships between the UC and CoZ.
Two databases are valuable sources of LULC data in Europe today. The Urban Atlas and CORINE Land Cover are both part of the Copernicus EU programme, and they both come with different spatiotemporal resolutions and applications. The Urban Atlas covers 39 European countries and shows LULC by FUAs. The Urban Atlas has 27 LULC classes, 17 of which are urban classes with a minimal mapping unit of 0.25 ha and 10 rural classes with an minimal mapping unit of 1 ha. In the case of the Urban Atlas data, the positional pixel accuracy is ±5 m, the minimal general accuracy for class 1 (artificial surface) is ≥85%, and the minimal overall accuracy for all classes is ≥80%. In contrast, the CORINE Land Cover offers a spatial accuracy of 25 ha, which is lower than the Urban Atlas. It provides LULC data for 39 European countries, mainly for European Union environmental programmes. Both databases are considered modern data sources as they offer LULC data from 1990 (CORINE Land Cover) and 2006 (Urban Atlas). Spatial patterns over more extended periods or a greater spatial extent can be determined with invaluable LULC data from cadastral records [12,13].
Central European states are considered areas with dynamic and often uncontrolled growth in urban areas of suburban zones [14]. Furthermore, the countries exhibit declining land use and agriculture intensity [15]. Researchers have also identified a relationship between LULCC caused by increased demand for buildable land and the risk of landslides [16]. LULCC studies on Central Europe to date have demonstrated general positive trends in artificial surfaces at the expense of agricultural land in Czechia, Hungary, Poland, and Slovakia [7,17,18]. Given the above, the present article considers LULCC in FUAs of four Central European capitals: Prague (Czechia), Warsaw (Poland), Bratislava (Slovakia), and Budapest (Hungary). They were chosen because their administrative positions are higher than those of other FUAs in their respective countries, and they house significant portions of the countries’ populations. As a result, investigated FUAs of capital metropolises have the largest populations, leading to the occurrence of spatial conflicts driven by the capitals’ impact on their suburban areas.
Research on urban LULC has employed the Land Use Mix (LUM) theory for some time now. Many researchers consider it a method for improving the urban vibrancy and optimising built-up areas [19]. LULC balancing has long been applied in urban planning in line with the belief that LULC diversity significantly improves a city’s vitality. This view was promoted by Jacobs in 1984 in his deliberations on built-up areas in US cities [20]. Jacobs [20] defined the concept of LUM as the harmonious co-existence of adjacent or neighbouring land use and land cover types. Hence, LUM has to exhibit compatibility among individual LULC types while fostering LULC diversity and functionality. Urban growth and intensification of developments, functions and services fuelled interest in LUM and appreciation for its role in the life of cities.
Moreover, past spatial policies focused on separating LULC types and their regionalisation and zoning, in line with the Charter of Athens of 1933, adopted at the International Congress of Modern. This caused numerous ramifications, such as [21]: (1) isolation and low vitality, (2) longer home-work distance and increased travel cost, (3) lack of suitable environment for small investment projects, (4) higher travel cost for facilities and amenities driving expenditure up, (5) safety issues. Today, LUM in urban areas is considered a potential path to sustainable development [22]. Zhuo et al. [23] reviewed definitions of LUM (Song et al. [24], Cervero and Duncan [25], Grant [26], Urban Land Institute [27]) and concluded that LUM should have several essential characteristics: various types of land use, limited spatial extent, interaction between and integration of land- use types, and a specific developmental goal. Zhuo et al. [23] proposed the following adaptation of the LUM definition for urban areas: ‘LUM is a type of land use pattern that blends different land use types, which may be functionally integrated, and provides a sustainable development trend’. Shi et al. [19] noted that areas with a high percentage of LUM can be considered a sophisticated, correct, and sound urban form compared to a regular one. A review of concepts of the role of LUM in spatial policy can be found in Zhuo et al. [23]. The care to promote the right LUM pattern is consistent with the recently popular 15 min or 20 min city concept [28,29,30,31,32]. Still, the spatial extent of the LUM pattern is of importance as well.
In LULC research, including LUM, diversity indices such as spatial entropy or Simpson’s Diversity Index are often used. For example, spatial entropy has been used to study the relationship between LULC diversity and the pattern of urban dispersion [33], or to measure urban sprawl [34,35] and assess LUM in selected urban areas [7]. In turn, the Simpson diversity index has been used, for example, in analyses of landscape structure using LULC data [36], spatial analyses of land fragmentation in a metropolitan area [37] or in the construction of a model of land use diversity in urban areas [38].
LULCC analysis is an important issue in monitoring the development of metropolises, among which state capitals play a special role. The conclusions from such analyses are helpful to urban planners and decision-makers in directing further future development of these areas in accordance with sustainable environmental management. Currently, there are relatively few studies quantitatively describing LULCC for the areas of several state capitals. Against this background, the capitals of countries belonging to the Visegrad group stand out, characterized by a similar socio-economic history that has a significant impact on the LULCC observed in recent decades and the implemented sustainable spatial policy.
Therefore, the article aims to investigate the micro- and macrostructure of LULC in Central European capitals and their commuting zones from 2006 to 2018. The study involves a quantitative and spatial analysis of data from the Urban Atlas in FUAs of Prague, Budapest, Warsaw and Bratislava. These particular cities were selected because of the geographical proximity of the countries, shared historical context and the similar socioeconomic conditions in the region. The FUAs were tessellated with regular hexagons used as basic spatial units for assessing the LULC spatial microstructure and its change. This way, the spatial distribution of LUM over the distance to the city centre could be determined. The study aids with establishing an informed regional spatial policy in areas with large populations and intense use of space, particularly those where old fabric requires the protection of cultural heritage.
2. Materials and Methods
The input data were Urban Atlas LULC status layers for 2006 [39], 2012 [40] and 2018 [41] for four FUAs around European capitals: Prague—CZ001L1 (Czechia), Warsaw—PL001L2 (Poland), Bratislava—SK001L1 (Slovakia) and Budapest—HU001L1 (Hungary). The data are available in the Copernicus Land Monitoring Service (CLMC). Considering that the boundaries of the FUAs shifted over the study period, the analyses are limited to the intersection of the layers available in each investigated year. We delimited the UCs and CoZ in the FUAs using the UCs’ (central cities’) boundaries provided with the Urban Atlas data for 2012 and 2018. CoZs were delineated as differences between intersect polygons and UCs. More about methods for determining the boundaries of FUAs can be found in Dijkstra et al. [42]. Additionally Global Roads Open Access Data Set [43] was used to visualize the roads in the studied area.
Next, the centroids of the UCs as mathematical approximations of the centres of the capitals were determined. The following step was to generate an individual grid of regular hexagons (500 m2) so that the centroid of the UC was aligned with the centroid of a hexagon and all hexagons formed a solid surface over the FUA. We employed the hexagon as the basic spatial unit (BSU) because its shape offers better results than the square, triangle or rhombus, owing to a better approximation of the circle. Hexagonal BSUs are employed in various analyses of natural phenomena and environmental factors [44]. Hexagons of 500 m2 and 1000 km2 are used in a multitude of studies involving spatial analysis, including analyses of land use and land cover [45,46,47,48]. Hexagon tessellation removes the restrictions imposed by administrative limits or boundaries of FUAs, UCs and CoZs. Additionally, to determine the impact of UCs on their surroundings, we determined the reach of UCs’ boundaries by delimiting zones, which are circles the radii of which are equal to the (I) minimum and (II) maximum distance of the UCs boundary to the centroid and the (III) mean distance of the UCs boundary corners to the centroids. Configurations of the FUAs with UCs and CoZs are shown in Figure 1.
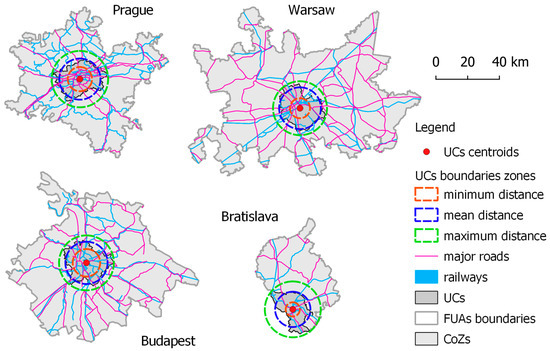
Figure 1.
Configuration of the boundaries of the FUAs, their UCs and CoZs, and the transport network. The dotted lines represent the UC boundary distance to the zone’s centroid. The orange dotted line represents the minimum distance, the green dotted line, the maximum distance, and the blue dotted line, the mean distance. Global Roads Open Access Data Set [43] was used to visualize the roads and UA data for the railways.
The share of LULC classes in each BSU for 2012 and 2018 on the third level of the Urban Atlas nomenclature was determined [49] (Table 1). It should be noted that the use of data at the third level of detail results in more detailed information on LUM in the studied areas. This detail consists primarily in obtaining information about LUM within a given class (for example, in the field of the artificial class), which is important information for the purposes of urban space management. When using data at the first level of detail, information about LUM is obtained, resulting mainly from the observed transformation of biologically active areas into urbanized areas.

Table 1.
Urban Atlas LULC nomenclature.
We employed two measures of diversity, the spatial entropy index (ENT) and Simpson’s Diversity Index (SIDI), to characterise the LUM in the BSUs. Both Shannon’s entropy and the inverse Simpson’s diversity index are Hill numbers with which one can assess diversity in a dataset. These indices are commonly used in biodiversity studies [50,51]. Hill numbers are defined with the following Equation (1) [52]:
where: is the parameter determining the measure’s sensitivity to relevant frequencies, is the number of types (LULC classes in this case) in the dataset, where the th-type has a relative size of (the share of individual LULC classes in the BSU in this case).
The value of determines the diversity index. If , Equation (1) is a measure of type richness. If , Equation (1) is undetermined. When , it is Shannon entropy. Shannon entropy is employed in spatial analyses of LULC and landscape structure, similarly to the Shannon Diversity Index (SHDI) [19,53,54]. In fact, Shannon entropy can be normalised as a ratio of Shannon entropy to , which yields ENT entropy, formalised as Equation (2) [24]:
where specifies the number of LULC classes and is the ratio of class to the BSU’s area. The ENT is a measure of diversity ranging from 0 to 1, where 0 means one type of LULC dominates the BSU, leading to no diversity, and 1 means equal shares of LULC classes in the BSU. Therefore, a low ENT should be considered as reflecting a homogeneous LULC structure, while its high values mean a heterogenic LULC structure. Note that the ENT is a symmetrical measure. This means that when, for example, two LULC classes share a BSU, the ENT has the same value regardless of whether the ratio is 1:2 or 2:1 [24]. More about the application of the ENT in LUM structure analysis can be found in Song et al. [24].
Hill numbers defined as in Equation (1) become the inverse Simpson index for [46]:
where is referred to as the Simpson concentration and
is the Simpson diversity index (SIDI) or the Gini coefficient.
Here, we use the SIDI to determine the diversity of LULC classes in BSUs because the Simpson diversity index focuses more on the frequency of types (LULC classes in this case) that are common and disregards rare types (LULC classes) [51]. Moreover, the SIDI can be interpreted as variance [50]. The SIDI ranges from 0 to 1. High values close to 1 reflect high diversity, while low values (near 0) mean low diversity. SIDI is less sensitive to the presence of rare classes. If there are more than two types of LULC in a given area, this indicator can then be used as a measure of the equality of the LULC structure in the area covered by the analysis. This indicator will therefore be useful in spatial analyses of LULC, the aim of which will be to detect the dominant type of LULC.
With ENT and SIDI values and spatial location for each BSU, we could determine ENT and SIDI changes (∆ENT and ∆SIDI, respectively) for 2006–2012 and 2012–2018 on the first level of LULC classes by calculating the difference between values for the two periods. With these data, we identified the ∆ENT and ∆SIDI patterns over the distance to the UC’s centre. The distance between BSU and the centre of the UC is defined as Euclidean distance using the mathematical description of the locations of all BSUs. Considering that ENT is symmetrical relative to the number of classes, and that Urban Atlas data classification on the third nomenclature level changed after 2006, we consider it methodologically unsound to compare ENT results at this level of nomenclature between 2006 and consecutive UA iterations. As a result, the analysis for the third level of UA nomenclature was conducted only for 2012 and 2018 due to the LULC classes for these years being identical.
In addition, with the minimal mapping unit (MMU) and BSU areas known, we are able to calculate the spatial entropy error () as per Equation (5):
UA data were processed and visualised in QGIS v. 3.22.16. Values of the ENT and SIDI were calculated and visualised in R Project version 4.3.2 [55] with chemodiv [56] and ggplot2 [57] libraries.
3. Results
We first computed the ENT and SIDI in the BSUs for LULC classes on the first nomenclature level of the Urban Atlas database for 2006, 2012 and 2018. The ENT and SIDI results for the years of interest indicate spatial consistency and high correlation because the Pearson correlation coefficient for the values of these measures is approx. 0.99 in each FUA. Hence, the measures can be used interchangeably to determine the LUM characteristics on the first level of Urban Atlas nomenclature. The mean values of the ENT and SIDI in the FUAs’ BSUs divided into UCs and CoZs for 2006, 2012, and 2018 on the first level of Urban Atlas LULC nomenclature are shown in Figure 2.

Figure 2.
The mean ENT and SIDI in the BSUs of FUAs and their UCs and CoZs in 2006, 2012 and 2018.
As shown in Figure 2, values of the ENT and SIDI increased over the study period in the BSUs in the FUAs of Bratislava, Prague and Warsaw. The mean values of the ENT and SIDI declined in the FUAs of Budapest from 2006 to 2012 and then increased from 2012 to 2018. BSUs with CoZs exhibited greater mean increases in the ENT and SIDI than BSUs with UCs. The UCs of Budapest and Warsaw went through a slight decrease in the ENT and SIDI from 2006 to 2012, which continued until 2018 for the former. BSUs in the FUAs of Warsaw and Prague had similar means to the ENT and SIDI at 0.35 and 0.28, respectively. The mean values for BSUs in the FUAs of Budapest and Bratislava were lower. The mean ENT and SIDI values for BSUs of UCs are much higher than for CoZs, reaching 0.8626 and 0.6514, respectively. The above results demonstrate substantial differences in the LUMs between UCs and CoZs, which is beneficial. In 2006, the mean values of the ENT for BSUs in CoZs ranged from 0.343 (Budapest) to 0.395 (Warsaw), and values of the SIDI ranged from 0.280 (Budapest) to 0.719 (Warsaw). Hence, values of the ENT and SIDI for UCs are approximately twice as large as for CoZs. Still, it is in CoZs that we identified the most significant increases in the ENT and SIDI, while UCs exhibited flat or marginally negative trends. This suggests an increase in Class 1 cover (artificial surfaces) in CoZs, leading to increased LULC class diversity through a greater portion of Class 1 in the LUM. Any further growth in Class 1 in cities leads to lower diversity because of a significant percentage of Class 1 in the LUM.
As the ENT and SIDI are spatially compatible, we decided to present only the spatial distribution of ENT values derived from LULC data. The spatial distribution of ENT values in the BSUs for the first period, that is 2006, is shown in Figure 3. Low values of the ENT of 0–0.1 are found in the centre of UCs, demonstrating that UCs have a homogeneous LUM dominated by artificial surfaces. In CoZs, values 0–0.1 of the ENT in clustered BSUs are found in areas dominated by such LULC classes as Class 2 (agricultural areas, semi-natural areas, and wetlands) or dominated by Class 3 (forests). The ENT of 0.5–1 is evident near transport networks in CoZs. In fact, high ENT values (0.8–1) overlay main transport routes.
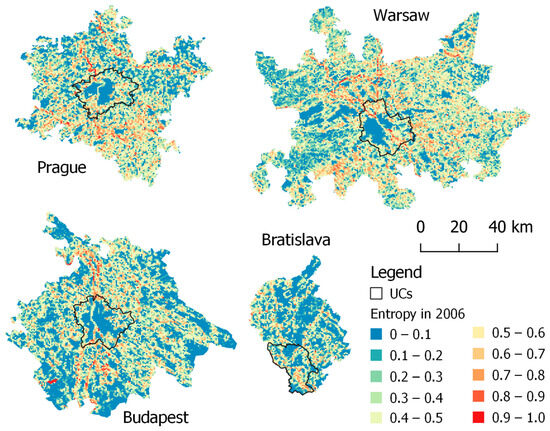
Figure 3.
Entropy (ENT) based on LULC at nomenclature level 1 in 2006 in Bratislava, Budapest, Prague, and Warsaw.
The spatial distribution of BSUs was investigated, where the ENT and SIDI changed to describe changes in LULC and changes in the LUM in BSUs on the first level of Urban Atlas nomenclature. Again, we present only the distribution of changes in the ENT within FUAs and their zones (UCs and CoZs) between 2006 and 2012 and between 2012 and 2018, as the distribution of ENT changes is identical to the distribution of SIDI changes. The spatial arrangement of changes in the ENT within BSUs is shown in Figure 4. Changes in the ENT of ±0.02 are disregarded because 0.02 was the level of accuracy—following Equation (5)—with which the ENT is measured considering the Urban Atlas’s minimal mapping unit and the size of the BSU. Thus, we removed ENT changes of high uncertainty due to the accuracy of the Urban Atlas status layers.

Figure 4.
Entropy changes in 2006–2012 and 2012–2018 in Bratislava, Budapest, Prague, and Warsaw. The dotted lines represent the UC boundary distance to the zone’s centroid. The orange dotted line represents the minimum distance, the green dotted line, the maximum distance, and the blue dotted line, the mean distance.
The ENT declined in 5.4% of BSUs and increased in 12.2% of BSUs from 2006 to 2012, while in 2012–2018, 2.0% of BSUs exhibited a negative trend and 4.6% exhibited a positive one. LUM change was more intense in 2006–2012 than in 2012–2018. From 2006 to 2012, the ENT declined in 10.8% of Bratislava’s BSUs, then increased in 18.2%; in Budapest, the ENT fell in 5.5% of its BSUs, while 26.0% of them experienced an increase; in Prague, the ENT slumped in 5.0% of the BSUs and grew in 15.1%; and in Warsaw, the ENT followed a negative trend in 3.3% of the BSUs and a positive one in 12.8%. In the other period, 2012–2018, the shift in the ENT occurred in fewer BSUs and was more consistent. From 2012 to 2018, the ENT fell in 2.2% of the BSUs of Bratislava and increased in 5.8%; in Prague, the value went down in 2.3% of its BSUs and grew in 4.9%; in Warsaw, we identified a decrease in 2.5% and an increase in 5.8% of BSUs; and in Budapest, the ENT depreciated in 1.1% of its BSUs and climbed in 2.4%.
It can also be seen that high ENT values occur near transport roads (Figure 4). This may be the result of changes in the landscape around these areas, which in turn may be the result of road investments recorded in recent decades, especially in the areas of the main communication routes of large metropolises. New road investments or their modernization cause changes in the surrounding spaces, which in turn causes an increase in spatial entropy. As a consequence, biologically active areas are usually transformed into anthropogenic areas. A similar increase in the value of spatial entropy around main roads has already been noticed in the research of Kudas and Wnęk [48].
We identified the LUM from before 2006 to be the dominant driver of change today. This is because artificial surfaces increase in UCs through development compaction, while CoZs undergo an expansion of forests and wooded areas near existing woodland and abandonment of agricultural land. In most cases, it leads to a decrease in the ENT and SIDI in BSUs owing to a homogeneous LULC structure. Another prominent driver of LUM change, particularly in CoZs, is the construction of new transport routes and an increase in the ENT and SIDI near transport networks, which is evident from the occurrence of BSUs with ENT changes that form specific elongated clusters (Figure 4). No new developments appear in areas of forests and woodland; instead, the ENT and SIDI decline there as forests expand. It is, beyond any doubt, an effect of the European Union spatial policy set to protect the existing forests and compact the urban fabric instead of promoting its sprawl.
Values of the ENT and SIDI computed from Equations (2) and (4) for LULC classes on the first level of UA nomenclature for 2006, 2012 and 2018 were ordered by their distance to the UC centres. We also rejected any outliers following the criterion of the largest difference between the value and the mean for the sample. Then, the ENT and SIDI values for each resultant distance were averaged. We fitted a generalised additive model with integrated smoothness estimation into these averaged values of the ENT and SIDI [58,59]. Save for value ranges, the procedures for generalised additive models with integrated smoothness estimation are comparable. The variability of SIDI values and the models for the first level of UA nomenclature are similar to the results for the ENT. The only noticeable difference between ENT and SIDI results is the interval and concentration of function values. For all cases of the ENT, its values are concentrated from 0 to 0.50. Regarding respective SIDI values, the measure is concentrated from 0 to 0.75. We obtained similar results of estimations of the ENT and the SIDI for LULC classes on the first level of Urban Atlas nomenclature, so Figure 5 shows only the results for the ENT.
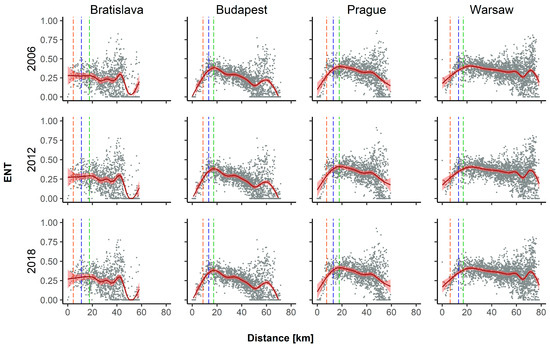
Figure 5.
ENT values for LULC classes on the first Urban Atlas nomenclature level averaged by distance in Bratislava, Budapest, Prague and Warsaw in 2006, 2012 and 2018. The red lines are generalised additive models with integrated estimated smoothness. The transparent red around the solid line is the interval of ±3 standard deviations. The dotted lines represent the UC boundary distance to the zone’s centroid. The orange dotted line represents the minimum distance, the green dotted line, the maximum distance, and the blue dotted line, the mean distance.
Figure 5 demonstrates that the ENT grows in UCs of Budapest and Prague right to the CoZ boundary. Its indicates an increase in the LULC class diversity of this zone with the growing distance to the UC centre. Then, right behind the UC-CoZ boundary, LULC class diversity plunges as the distance to the UC centre grows. Things are slightly different in Bratislava, where the UC exhibits a relatively constant level of the ENT around 0.25 regardless of the distance to the UC centre. Then, behind the boundary, the ENT drops slightly up to about 40 km from the UC centre and plummets around 50 km. This may be due to the irregular shape of the FUA of Bratislava, leading to no CoZ in the west of the city where Bratislava borders the FUA of Vienna at the Austria–Slovakia border. In Warsaw, the ENT grows in the UC, and it declines slightly behind the CoZ boundary. In all the FUAs’ CoZs, we noted local positive or negative trends in entropy, which may be owing to other large localities in the FUAs.
We then fitted the generalised additive model with integrated smoothness estimation into the averaged END and SIDI values calculated from the share of LULC classes on the third Urban Atlas nomenclature level in the BSUs in 2012 and 2018 (Figure 6). ENT values for the classes on the third nomenclature level exhibited a gradual decline in LULC diversity with a growing distance to the UC centre in Budapest, Prague, and Warsaw in 2012 and 2018, respectively (Figure 6). The differences for Budapest and Prague are the most prominent. The decrease in the ENT is not very abrupt in Warsaw, while the dynamics in Bratislava are slightly different. The LULC class diversity evidently declines in the UC. Next, ENT changes undulate until about 40 km from the UC centre, where the ENT plunges to 0. Interestingly, all the FUAs exhibit an initial entropy value of 0.25 to 0.50, which suggests a moderate LULC diversity (probably artificial surfaces) in the BSUs around the UC centre considering the nomenclature level.

Figure 6.
ENT and SIDI values for LULC classes on the third Urban Atlas nomenclature level averaged by distance in Bratislava, Budapest, Prague and Warsaw in 2012 and 2018. The red lines are generalised additive models with integrated estimated smoothness. The transparent red around the solid line is the interval of ±3 standard deviations. The dotted lines represent the UC boundary distance to the zone’s centroid. The orange dotted line represents the minimum distance, the green dotted line, the maximum distance, and the blue dotted line, the mean distance.
We calculated changes in the ENT and SIDI for 2012–2018 as functions of distance to the UC centre using the ENT and SIDI values for LULC classes on the third nomenclature level for 2012 and 2018. Figure 7 shows that values of changes in the ENT and SIDI decline in all the FUAs with distance to the UC centre, with the most significant differences being over the distance in Prague and Warsaw. Moreover, a comparison of the results for the two measures of diversity, the ENT and SIDI, reveals that they are not significantly different, with the only difference being the preferred value range. Changes in the ENT and SIDI tend to focus around ±0.25 and ±0.50, respectively. Therefore, the SIDI exhibits a greater variability than the ENT.

Figure 7.
Changes in the ENT and SIDI between 2012 and 2018 for LULC classes on the third level of UA nomenclature as functions of distance to the UC centre for Bratislava, Budapest, Prague and Warsaw. The dotted lines represent the UC boundary distance to the zone’s centroid. The orange dotted line represents the minimum distance, the green dotted line, the maximum distance, and the blue dotted line, the mean distance.
4. Discussion
State capitals and their commuting zones exhibit characteristic and interesting land cover and land use arrangements and structural changes. They also demonstrate a high level of urban sprawl. Additionally, central parts of cities, usually historic, exhibit homogeneous land cover of artificial surfaces and dominant built-up areas. On the other hand, recent years saw an increase in the focus on implementing sustainable development policies, which must take urban areas into consideration [60]. Therefore, urban sprawl is directly linked to such sustainable development issues as financial, social and environmental problems [61].
As demonstrated by Kudełko and Musiał-Malago [62], the development of municipalities in FUAs is correlated with the growth of the central city and their distance to it. The present results seem to be consistent with their findings. Therefore, one should expect further intensive development in CoZs, leading to the conversion of vegetated areas into artificial surfaces. This poses a challenge to the sustainable spatial policy in such areas, including any policy founded on sustainable urban transformation [60]. The present research identified the directions of LULC changes in FUAs of four Central European capitals from 2006 to 2018. Regarding the LULCC on the first level of UA nomenclature, the diversity in UCs increases with the distance to the centre, while in CoZs, it declines as the distance to the UC grows. Bitner and Fialkowski [63] analysed a mosaic of cadastral plots in 30 cities in Poland, the USA and Australia, and they defined a model for growth in the Shannon entropy and Rényi entropy with a growing distance to the city centre. They proposed that the entropy of cadastral parcel mosaic can be a measure of urbanisation.
Similarly, the spatial entropy and Simpson diversity models for LULC classes on the first and third Urban Atlas nomenclature levels proposed here can be a starting point for investigating urbanisation in FUAs and urban sprawl outside UCs. Research suggests that entropy should increase up to 15–20 km from the city centre depending on its history and development [63]. Still, capitals exhibit an increase of up to about 20 km for LULC analysis on the first level of Urban Atlas nomenclature, as shown here. Conversely, an investigation on the third nomenclature level demonstrated a decline in the ENT and SIDI with growing distance to UC, with local minima around UC boundaries.
As noted in the present study and the previous one by Kudas et al. [7], artificial surfaces expand mainly in CoZs and less in UCs, where developments grow more compact. The development is driven mainly by migration between the zones and residential developments in CoZs [48]. Today, FUAs’ populations grow mainly owing to the positive migration balance rather than a natural increase [62]. Moreover, LUM changes in FUAs resemble LULC transformations, whereby agricultural areas, semi-natural areas and wetlands are converted into artificial surfaces and forests [6,7].
The present study focuses on Central European capitals and covers LULC change after these states joined the European Union in 2004. Therefore, the LULC change trends identified here in the FUAs would stem to some extent from the implementation of the European spatial policy, particularly a policy based on sustainable development. Future studies could focus on changes in the boundaries of cadastral plots, as land division and fragmentation can be driven by urbanisation [63]. Another future focus could be to compare past cadastral boundaries with current ones using archived base maps [13] to extend the study period. Additionally, smaller urban localities can perform poorly when implementing the sustainable development policy, as demonstrated in existing case studies [64]. Hence, the next step could be to investigate FUAs at a lower level than state capitals.
5. Conclusions
The study on the FUAs of Bratislava, Budapest, Prague and Warsaw demonstrated that their UCs exhibit an increase in LULC diversity with distance to the UC centre, followed by a decrease in CoZs because of urbanisation for LULC classes aggregated at the first Urban Atlas nomenclature level. The analysis of LULC classes on the third level of UA nomenclature revealed that the values declined with distance to the UC centre in 2012 and 2018; therefore, the UCs exhibit LULC class diversity within the group of artificial surfaces. Classes in CoZs include mainly agricultural areas, semi-natural areas, wetlands or forest areas.
The FUAs of Central European capitals (Czechia, Poland, Hungary and Slovakia) underwent more intensive LUM changes in 2006–2012 than in 2012–2018. In 2006–2012, the ENT grew in 12.2% of the areas and declined in 5.4%, while in 2012–2018, growth was identified in 4.6% and experienced a decline in 2.0%. Still, we noted a similar ratio of areas with substantial changes in the ENT because spatial entropy increased over twice as large an area as the area with a decline in its value.
The latest values of the ENT and SIDI for UCs of the capitals are over 0.86 and 0.65, respectively, which is twice as much as for CoZs. The period from 2006 to 2018 saw changes in the LUMs of the FUAs focused mainly in CoZs rather than UCs. It is in the commuting zones of the capitals that most LULC changes took place in the investigated period, mostly as conversions of agricultural areas, semi-natural areas, and wetlands into artificial surfaces and forests. The most substantial changes in the ENT and SIDI were identified in CoZs.
In future, the developed models of changes of LULC spatial diversity measures as a function of the distance from the UC center may help in assessing the phenomenon of suburbanization and delimiting the range of the largest LUC changes in the FUA area.
Author Contributions
Conceptualization, D.K. and A.W.; methodology D.K.; software A.W.; validation D.K. and A.W.; investigation D.K., A.W., Ľ.H. and R.F.; data curation, D.K.; writing—original draft preparation, D.K. and A.W.; writing—review and editing, Ľ.H. and R.F.; visualization, D.K. and A.W.; supervision, Ľ.H. and R.F.; project administration, D.K. All authors have read and agreed to the published version of the manuscript.
Funding
The APC was funded by a 2024 subsidy for the University of Agriculture in Krakow from the Ministry of Education and Science of Poland.
Institutional Review Board Statement
Not applicable.
Informed Consent Statement
Not applicable.
Data Availability Statement
The land use and land cover datasets used in these analyses are available at Urban Atlas: https://land.copernicus.eu/en/products/urban-atlas (accessed on 30 September 2023).
Acknowledgments
This article was created as part of the international cooperation between the Department of Geodesy of the University of Agriculture in Cracow (Poland) and the Department of Geodesy, as well as Department of Theoretical Geodesy and Geoinformatics of the Slovak University of Technology in Bratislava (Slovakia). This article is the result of the research internship of Dawid Kudas and Agnieszka Wnęk at the Slovak University of Technology in Bratislava. Robert Fencik’s research was funded by the Slovak Science Grant Agency, Grant No. VEGA 1/0468/20.
Conflicts of Interest
The authors declare no conflicts of interest.
References
- UN World Urbanization Prospects. 2018. Available online: https://esa.un.org/unpd/wup/Download/ (accessed on 31 August 2023).
- Chen, L.; Sun, Y.; Saeed, S. Monitoring and predicting land use and land cover changes using remote sensing and GIS techniques—A case study of a hilly area, Jiangle, China. PLoS ONE 2018, 13, e0200493. [Google Scholar]
- Barbero-Sierra, C.; Marques, M.J.; Ruiz-Pérez, M. The case of urban sprawl in Spain as an active and irreversible driving force for desertification. J. Arid Environ. 2013, 90, 95–102. [Google Scholar] [CrossRef]
- Hyandye, C.; Martz, L.W. A Markovian and cellular automata land-use change predictive model of the Usangu Catchment. Int. J. Remote Sens. 2017, 38, 64–81. [Google Scholar] [CrossRef]
- Yin, J.; Yin, Z.; Zhong, H.; Xu, S.; Hu, X.; Wang, J.; Wu, J. Monitoring urban expansion and land use/land cover changes of Shanghai metropolitan area during the transitional economy (1979–2009) in China. Environ. Monit. Assess. 2011, 177, 609–621. [Google Scholar] [CrossRef] [PubMed]
- Wnęk, A.; Kudas, D.; Stych, P. National Level Land-Use Changes in Functional Urban Areas in Poland, Slovakia, and Czechia. Land 2021, 10, 39. [Google Scholar] [CrossRef]
- Kudas, D.; Wnęk, A.; Tátošová, L. Land Use Mix in Functional Urban Areas of Selected Central European Countries from 2006 to 2012. Int. J. Environ. Res. Public Health 2022, 19, 15233. [Google Scholar] [CrossRef] [PubMed]
- Seto, K.C.; Parnell, S.; Elmqvist, T. A global outlook on urbanization. In Urbanization, Biodiversity and Ecosystem Services: Challenges and Opportunities: A Global Assessment; Elmqvist, T., Fragkias, M., Goodness, J., Güneralp, B., Marcotullio, P.J., McDonald, R.I., Parnell, S., Schewenius, M., Sendstad, M., Seto, K.C., et al., Eds.; Springer: Cham, The Netherlands, 2013. [Google Scholar]
- Noszczyk, T.; Cegielska, K.; Rogatka, K.; Starczewski, T. Exploring green areas in Polish cities in context of anthropogenic land use changes. Anthr. Rev. 2023, 10, 710–731. [Google Scholar] [CrossRef]
- Pazúr, R.; Feranec, J.; Štych, P.; Kopecká, M.; Holman, L. Changes of urbanised landscape identified and assessed by the Urban Atlas data: Case study of Prague and Bratislava. Land Use Policy 2017, 61, 135–146. [Google Scholar] [CrossRef]
- Eurostat. Statistics Explained. Glossary: Functional Urban Area. Available online: https://ec.europa.eu/eurostat/statistics-explained/index.php/Glossary:Functional_urban_area (accessed on 31 August 2023).
- Noszczyk, T. Detecting changes in green and blue spaces: Modeling based on statistical approach. Ecol. Indic. 2023, 154, 110878. [Google Scholar] [CrossRef]
- Noga, K.; Sikora, A.; Siejka, M.; Natividade-Jezus, E.; Moreira, C.; Skrzypczak, I. Identification of land system transformations in the Rzeszów city square. Arch. Civ. Eng. 2023, 69, 607–621. [Google Scholar]
- Taubenböck, H.; Gerten, C.; Rusche, K.; Siedentop, S.; Wurm, M. Patterns of Eastern European urbanisation in the mirror of Western trends—Convergent, unique or hybrid? Environ. Plan. B Urban Anal. City Sci. 2019, 46, 1206–1225. [Google Scholar] [CrossRef]
- Kuemmerle, T.; Levers, C.; Erb, K.; Estel, S.; Jepsen, M.R.; Müller, D.; Plutzar, C.; Stürck, J.; Verkerk, P.J.; Verburg, P.H.; et al. Hotspots of land use change in Europe. Environ. Res. Lett. 2016, 11, 064020. [Google Scholar] [CrossRef]
- Skrzypczak, I.; Kokoszka, W.; Zientek, D.; Tang, Y.; Kogut, J. Landslide Hazard Assessment Map as an Element Supporting Spatial Planning: The Flysch Carpathians Region Study. Remote Sens. 2021, 13, 317. [Google Scholar] [CrossRef]
- Bičík, I.; Kupková, L.; Jeleček, L.; Kabrda, J.; Štych, P.; Janoušek, Z.; Winklerová, J. Land use changes in Czechia 1845–2010. In Land Use Changes in the Czech Republic 1845–2010; Springer: Cham, Switzerland, 2015; pp. 95–170. [Google Scholar]
- Pazúr, R.; Bolliger, J. Land changes in Slovakia: Past processes and future directions. Appl. Geogr. 2017, 85, 163–175. [Google Scholar] [CrossRef]
- Shi, H.; Zhao, M.; Simth, D.A.; Chi, B. Behind the Land Use Mix: Measuring the Functional Compatibility in Urban and Sub-Urban Areas of China. Land 2022, 11, 2. [Google Scholar] [CrossRef]
- Jacobs, J. The Death and Life of Great American Cities; Vintage Books: New York, NY, USA, 1961; pp. 120–156. [Google Scholar]
- Raman, R.; Roy, U.K. Taxonomy of urban mixed land use planning. Land Use Policy 2019, 88, 104102. [Google Scholar] [CrossRef]
- Congress of New Urbanism. Charter for the New Urbanism; Congress for the New Urbanism: Chicago, IL, USA, 2001. [Google Scholar]
- Zhuo, Y.; Jing, X.; Wang, X.; Li, G.; Xu, Z.; Chen, Y.; Wang, X. The Rise and Fall of Land Use Mix: Review and Prospects. Land 2022, 11, 2198. [Google Scholar] [CrossRef]
- Song, Y.; Merlin, L.; Rodriguez, D. Comparing measures of urban land use mix. Comput. Environ. Urban Syst. 2013, 42, 1–13. [Google Scholar] [CrossRef]
- Cervero, R.; Duncan, M. Neighbourhood composition and residential land prices: Does exclusion raise or lower values? Urban Stud. 2004, 41, 299–315. [Google Scholar] [CrossRef]
- Grant, J. Mixed use in theory and practice: Canadian experience with implementing a planning principle. J. Am. Plan. Assoc. 2002, 68, 71–84. [Google Scholar] [CrossRef]
- Urban Land Institute. Mixed-Use Development Handbook; Urban Land Institute: Washington, DC, USA, 1987. [Google Scholar]
- Moreno, C.; Allam, Z.; Chabaud, D.; Gall, C.; Pratlong, F. Introducing the “15-Minute City”: Sustainability, Resilience and Place Identity in Future Post-Pandemic Cities. Smart Cities 2021, 4, 93–111. [Google Scholar] [CrossRef]
- D’Acci, L. Simulating future societies in Isobenefit Cities: Social isobenefit scenarios. Futures 2013, 54, 3–18. [Google Scholar] [CrossRef]
- Weng, M.; Ding, N.; Li, J.; Jin, X.; Xiao, H.; He, Z.; Su, S. The 15-minute walkable neighborhoods: Measurement, social inequalities and implications for building healthy communities in urban China. J. Transp. Health. 2019, 13, 259–273. [Google Scholar] [CrossRef]
- Khavarian-Garmsir, A.R.; Sharifi, A.; Sadeghi, A. The 15-minute city: Urban planning and design efforts toward creating sustainable neighborhoods. Cities 2023, 132, 104101. [Google Scholar] [CrossRef]
- Capasso Da Silva, D.; King, D.A.; Lemar, S. Accessibility in Practice: 20-Minute City as a Sustainability Planning Goal. Sustainability 2020, 12, 129. [Google Scholar] [CrossRef]
- Dewa, D.D.; Buchori, I.; Sejati, A.W. Assessing land use/land cover change diversity and its relation with urban dispersion using Shannon Entropy in the Semarang Metropolitan Region, Indonesia. Geocarto Int. 2022, 37, 11151–11172. [Google Scholar] [CrossRef]
- Rahman, M.T. Land use and land cover changes and urban sprawl in Riyadh, Saudi Arabia: An analysis using multi-temporal Landsat data and Shannon’s entropy index. Int. Arch. Photogramm. Remote Sens. Spat. Inf. Sci.-ISPRS Arch. 2016, 41, 1017–1021. [Google Scholar] [CrossRef]
- Fenta, A.A.; Yasuda, H.; Haregeweyn, N.; Belay, A.S.; Hadush, Z.; Gebremedhin, M.A.; Mekonnen, G. The dynamics of urban expansion and land use/land cover changes using remote sensing and spatial metrics: The case of Mekelle City of northern Ethiopia. Int. J. Remote Sens. 2017, 38, 4107–4129. [Google Scholar] [CrossRef]
- Griffith, J.A.; Martinko, E.A.; Price, K.P. Landscape structure analysis of Kansas at three scales. Landsc. Urban Plan. 2000, 52, 45–61. [Google Scholar] [CrossRef]
- Zhang, S.; York, A.M.; Boone, C.G.; Shrestha, M. Methodological advances in the spatial analysis of land fragmentation. Prof. Geogr. 2013, 65, 512–526. [Google Scholar] [CrossRef]
- Comer, D.; Greene, J.S. The development and application of a land use diversity index for Oklahoma City, OK. Appl. Geogr. 2015, 60, 46–57. [Google Scholar] [CrossRef]
- UA2006. Urban Atlas Land Cover/Land Use 2006 (Vector). Available online: https://doi.org/10.2909/551d6741-84d0-43fb-bda8-1768d51bbb4c (accessed on 14 September 2023).
- UA2012. Urban Atlas Land Cover/Land Use 2012 (Vector). Available online: https://doi.org/10.2909/debc1869-a4a2-4611-ae95-daeefce23490 (accessed on 14 September 2023).
- UA2018. Urban Atlas Land Cover/Land Use 2018 (Vector). Available online: https://doi.org/10.2909/fb4dffa1-6ceb-4cc0-8372-1ed354c285e6 (accessed on 14 September 2023).
- Dijkstra, L.; Poelman, H.; Veneri, P.; OECD. The EU-OECD Definition of a Functional Urban Area; OECD Regional Development Working Papers; OECD: Paris, France, 2019; 19p. [Google Scholar]
- Center for International Earth Science Information Network (CIESIN)/Columbia University, and Information Technology Out-reach Services (ITOS)/University of Georgia. 2013. Global Roads Open Access Data Set, Version 1 (gROADSv1). Palisades, NY: NASA Socioeconomic Data and Applications Center (SEDAC). Available online: http://sedac.ciesin.columbia.edu/data/set/groads-global-roads-open-access-v1 (accessed on 28 September 2023).
- Birch, C.P.D.; Oom, S.P.; Beecham, J.A. Rectangular and hexagonal grids used for observation, Rectangular and hexagonal grids used for observation, experiment and simulation in ecology. Ecol. Model. 2007, 206, 347–359. [Google Scholar] [CrossRef]
- Ellis, E.C.; Wang, H.; Xiao, H.S.; Peng, K.; Liu, X.P.; Li, S.C.; Ouyang, H.; Cheng, X.; Yang, L.Z. Measuring long-term ecological changes in densely populated landscapes using current and historical high resolution imagery. Remote Sens. Environ. 2006, 100, 457–473. [Google Scholar] [CrossRef]
- Starczewski, T.; Rogatka, K.; Kukulska-Kozieł, A.; Noszczyk, T.; Cegielska, K. Urban green resilience: Experience from post-industrial cities in Poland. Geosci. Front. 2023, 14, 101560. [Google Scholar] [CrossRef]
- Cegielska, K.; Salata, T. A multimetric approach to anthropogenic pressure analyses: A tool for measuring and mapping the human impact on the landscape. Land Degrad. Dev. 2023, 34, 5293–5311. [Google Scholar] [CrossRef]
- Kudas, D.; Wnęk, A. Spatial entropy changes for built-up areas in the vicinity of Kraków in the years 2014–2020. Geomat. Landmanag. Landsc. 2021, 4, 103–116. [Google Scholar] [CrossRef]
- UA 2012-2018. Available online: https://land.copernicus.eu/en/technical-library/urban_atlas_2012_2018_mapping_guide (accessed on 28 August 2023).
- Keylock, C. Simpson diversity and the Shannon–Wiener index as special cases of a generalized entropy. Oikos 2015, 109, 203–207. [Google Scholar] [CrossRef]
- Chao, A.; Gotelli, N.J.; Hsieh, T.C.; Sander, E.L.; Ma, K.H.; Colwell, R.K.; Ellison, A.M. Rarefaction and extrapolation with Hill numbers: A framework for sampling and estimation in species diversity studies. Ecol. Monogr. 2014, 84, 45–67. [Google Scholar] [CrossRef]
- Hill, M. Diversity and evenness: A unifying notation and its consequences. Ecology 1973, 54, 427–432. [Google Scholar] [CrossRef]
- Deng, J.S.; Wang, K.; Hong, Y.; Qi, J.G. Spatio-temporal dynamics and evolution of land use Spatio-temporal dynamics and evolution of land use change and landscape pattern in response to rapid change and landscape pattern in response to rapid urbanization. urbanization. Landsc. Urban Plan. 2009, 92, 187–198. [Google Scholar] [CrossRef]
- Cegielska, K.; Piotr, P.; Kukulska-Kozieł, A. Urban Green Spaces: How geospatial information can help identify diversity. A case study from eastern Lesser Poland. Bull. Geogr. 2022, 58, 7–29. [Google Scholar] [CrossRef]
- R Core Team. R: A Language and Environment for Statistical Computing; R Foundation for Statistical Computing: Vienna, Austria, 2023; Available online: https://www.R-project.org/ (accessed on 5 March 2024).
- Petrén, H.; Köllner, T.G.; Junker, R.R. Quantifying chemodiversity considering biochemical and structural properties of compounds with the R package chemodiv. New Phytol. 2023, 237, 2478–2492. [Google Scholar] [CrossRef]
- Wickham, H. ggplot2: Elegant Graphics for Data Analysis; Springer: New York, NY, USA, 2016. [Google Scholar]
- Wood, S.N. Fast stable restricted maximum likelihood and marginal likelihood estimation of semiparametric generalized linear models. J. R. Stat. Soc. B Stat. Methodol. 2011, 73, 3–36. [Google Scholar] [CrossRef]
- Wood, S.N. Stable and efficient multiple smoothing parameter estimation for generalized additive models. J. Am. Stat. Assoc. 2004, 99, 673–686. [Google Scholar] [CrossRef]
- Ernst, L.; de Graaf-Van Dinther, R.E.; Peek, G.J.; Loorbach, D.A. Sustainable urban transformation and sustainability transitions; conceptual framework and case study. J. Clean. Prod. 2016, 112, 2988–2999. [Google Scholar] [CrossRef]
- Bueno-Suárez, C.; Coq-Huelva, D. Sustaining what is unsustainable: A review of urban sprawl and urban socio-environmental policies in North America and Western Europe. Sustainability 2020, 12, 4445. [Google Scholar] [CrossRef]
- Kudełko, J.; Musiał-Malago, M. The diversity of demographic potential and socioeconomic development of urban functional areas–evidence from Poland. Cities 2022, 123, 103516. [Google Scholar] [CrossRef]
- Bitner, A.; Fialkowski, M. Entropy of the Land Parcel Mosaic as a Measure of the Degree of Urbanization. Entropy 2021, 23, 543. [Google Scholar] [CrossRef] [PubMed]
- Martyka, A.; Jopek, D.; Skrzypczak, I. Analysis of the Sustainable Development Index in the Communes of the Podkarpackie Voivodeship: A Polish Case Study. Sustainability 2022, 14, 10237. [Google Scholar] [CrossRef]
Disclaimer/Publisher’s Note: The statements, opinions and data contained in all publications are solely those of the individual author(s) and contributor(s) and not of MDPI and/or the editor(s). MDPI and/or the editor(s) disclaim responsibility for any injury to people or property resulting from any ideas, methods, instructions or products referred to in the content. |
© 2024 by the authors. Licensee MDPI, Basel, Switzerland. This article is an open access article distributed under the terms and conditions of the Creative Commons Attribution (CC BY) license (https://creativecommons.org/licenses/by/4.0/).