Article

Copper-Plated Nanoporous Anodized Aluminum Oxide for Solar Desalination: An Experimental Study

by
Ajay Kumar Kaviti
1,2,
Yerolla Pavan Kumar
1,2 and
Vineet Singh Sikarwar
3,4,*
1
Centre for Solar Energy Materials, Vallurupalli Nageswara Rao Vignana Jyothi Institute of Engineering &Technology (VNRVJIET), Hyderabad 500090, India
2
Department of Mechanical Engineering, Vallurupalli Nageswara Rao Vignana Jyothi Institute of Engineering &Technology (VNRVJIET), Hyderabad 500090, India
3
Institute of Plasma Physics of the Czech Academy of Sciences, Za Slovankou 1782/3, 182 00 Prague, Czech Republic
4
Department of Power Engineering, University of Chemistry and Technology, Technická 5, 166 28 Prague, Czech Republic
*
Author to whom correspondence should be addressed.
Sustainability 2024, 16(5), 2220; https://doi.org/10.3390/su16052220
Submission received: 26 December 2023 / Revised: 1 March 2024 / Accepted: 4 March 2024 / Published: 6 March 2024

Abstract

:
Currently, there is a shortage of potable water in several regions. Various alternative methods exist for producing purified water; however, one particular technology known as solar desalination is gaining prominence as a sustainable and environmentally friendly solution. Solar desalination harnesses solar energy to produce fresh water in regions with abundant sunlight. This study involved the fabrication of a nanostructured porous material composed of copper using anodization, followed by copper electroplating. In order to create three distinct nanoporous structures, we utilized three anodization periods of 40 min, 60 min, and 80 min. Subsequently, these structures underwent a copper deposition process for 30 min using the copper electroplating technique. Scanning electron microscopy (SEM), energy-dispersive X-ray (EDAX), and X-ray diffraction (XRD) techniques were utilized to analyze the characteristics of the copper-plated nanoporous structure. Three distinct samples were utilized in solar desalination experiments, employing solar stills over a span of three consecutive days, with each sample being tested on a separate day. All three samples underwent desalination, unlike the standard solar still, which did not include any sample. Our observation revealed that the sample, which underwent 60 min of anodization followed by copper electroplating, had a significantly greater evaporation rate of 22.22% compared to the conventional still.

1. Introduction

Despite the fact that clean water is necessary for human survival and economic growth, a significant portion of the world’s population, which accounts for 47% of the total population, does not have access to it. Around 57% of the world’s population will be living in areas facing a severe water scarcity problem by 2050, according to predictions [1]. Currently, two prominent global issues of utmost significance are (i) the scarcity of freshwater resources and (ii) the insufficiency of electrical supply. Despite the fact that water constitutes around 75% of the Earth’s surface, a significant portion of it, specifically 97.5%, comprises saline water that is unsuitable for consumption. This includes various types of water such as brackish, effluent, and seawater [2,3,4]. In this context, the pressing need can potentially be addressed through the process of desalination of saline water. Solar-powered desalination presents a viable and sustainable approach to generating potable water, characterized by its absence of reliance on fossil fuels. This method demonstrates a commitment to environmental preservation and offers a promising solution to the global challenge of potable water scarcity. The utilization of floating or submerged absorber evaporator systems for the purpose of generating potable water has subsequently resulted in a multitude of breakthroughs in the field of solar-powered desalination [5,6,7,8,9].
Various ways to improve the efficiency of solar-powered desalination have been explored. These methodologies encompass the application of carbon-coated natural wood [10,11], nanotube aerogel composite material [12], hydrogels including customized surface topography [13], absorbers composed of graphene oxide [14,15,16], polymers [17,18], exfoliated graphite substance [19], and plasmonic surfaces [20,21]. Also, graphene oxide, substances that naturally occur like mushrooms, and biomimetic structures [22,23,24] have been used for demonstrating the capillary-driven flow in solar-powered desalination. The primary objective of these tactics is to optimize the light absorption by utilizing a dark surface.
The scientific community has shown considerable interest in metallic nanostructures because of their distinctive catalytic, electrical, optical, and magnetic properties, which depend on their sizes and shapes [25,26]. The phenomenon of surface plasmon resonance induces a distinct light absorption behavior within the visible region of the electromagnetic spectrum in colloidal suspensions and composite materials consisting of copper, silver, and gold nanoparticles and oxides. When comparing ferromagnetic metal nanowires composed of iron (Fe), nickel (Ni), and cobalt (Co) to thin film or bulk counterparts, it is seen that the former exhibits a hysteresis loop characterized by superior coercivity and squareness [27].
Throughout history, a multitude of techniques have been devised to fabricate nanomaterials, encompassing methodologies such as photo- and scanning beam lithography, as well as molding and imprinting processes. The development of an electrochemical technique known as anodization has been prompted by the exorbitant expenses associated with alternative procedures. Various materials, including aluminum, magnesium, stainless steel, nickel, titanium, tin, and glass, can be utilized for the process of anodization [28]. Aluminum has been widely favored over other materials in numerous applications owing to its exceptional qualities, particularly its high heat conductivity [29]. Porous anodic aluminum oxide (AAO) is widely recognized as a fundamental material for the fabrication of functional nanostructures. This material is valued for its cost-effectiveness and the inherent ability to generate self-organized alumina pores through the process of electrochemical oxidation [30]. Based on a comprehensive analysis of existing scholarly works, it has been observed that AAO templates exhibit significant versatility in relation to parameters such as template thickness (pore length), pore diameter, and interpore distance. The inherent versatility of this process enables the generation of nanomaterials across a wide spectrum of sizes.
Thin layers of coatings are widely utilized on anodized surfaces, and they are also being explored as promising active solar thermal coatings for infrared absorbers [31]. An extraordinary selective solar absorber coating necessitates a high absorption rate within the sun spectrum and a low thermal emittance in the near infrared range. There are various methods for depositing specific coatings onto appropriate substrates, including sol–gel [32], chemical vapor deposition [33], sputtering [34], and electrodeposition [35]. Electrodeposition remains a widely employed method for controlling the morphology of nanostructures, as evidenced by its inclusion in several synthetic procedures documented in the literature [36,37]. The process of electrodeposition is often regarded as a favorable choice owing to its exceptional ability to precisely regulate the thickness and morphology of coatings, in addition to its high level of reproducibility. Furthermore, it exemplifies desirable attributes such as affordability, expeditious deposition, a user-friendly interface, and relatively straightforward scalability [31].
In this study, through the use of an anodization procedure, followed by copper electroplating, we were able to construct a nanoporous structure that was built out of copper. Scanning electron microscopy (SEM), energy-dispersive X-ray (EDAX), and X-ray diffraction (XRD) characterizations were carried out to investigate the characteristics of the nanoporous structure that was plated with copper. For the purpose of solar desalination, three distinct samples were successfully applied, utilizing sun stills for three distinct days, with each sample being applied on each of the three days.
Solar desalination through the utilization of copper-deposited anodic aluminum oxide is a novel approach that possesses a number of potential advantages such as a renewable energy source, enhanced heat absorption and transfer, and environmental sustainability for research and development. The combination of solar desalination with copper-deposited AAO is a viable alternative for the production of freshwater that is both environmentally friendly and economical. This type of freshwater production has the potential to address water scarcity challenges in different places. Both the effectiveness and the applicability of this technology can be further improved by the continuation of research and development.

2. Synthesis of Copper Electrodeposited Nanoporous Structure

2.1. Material

The electrolyte used for anodization was prepared using oxalic acid with a purity of 99.98%, which was obtained from Merck, Burlington, MA, USA. The working electrode (anode) used was commercial aluminum foil (6061 alloy, 97%) measuring 10 mm × 20 mm × 0.32 mm. The counter electrode (cathode) used was platinum foil obtained from Sigma Aldrich, St. Louis, MO, USA with a purity of 99.99%. It has dimensions of 25 mm × 25 mm × 0.5 mm. Acetone, ethanol, isopropyl alcohol, and deionized water obtained from Merck were used for pretreating Al foil. The chemical etching solution was prepared using sodium hydroxide, potassium hydroxide, and sulfuric acid obtained from Merck. In the process of electroplating, the electrolyte was prepared using copper sulfate obtained from Merck, and a copper wire was employed as the anode electrode. The Al6061 alloy material exhibited a high thermal conductivity value of 168 W/mK [38] and was relatively inexpensive in comparison to other lightweight metals.

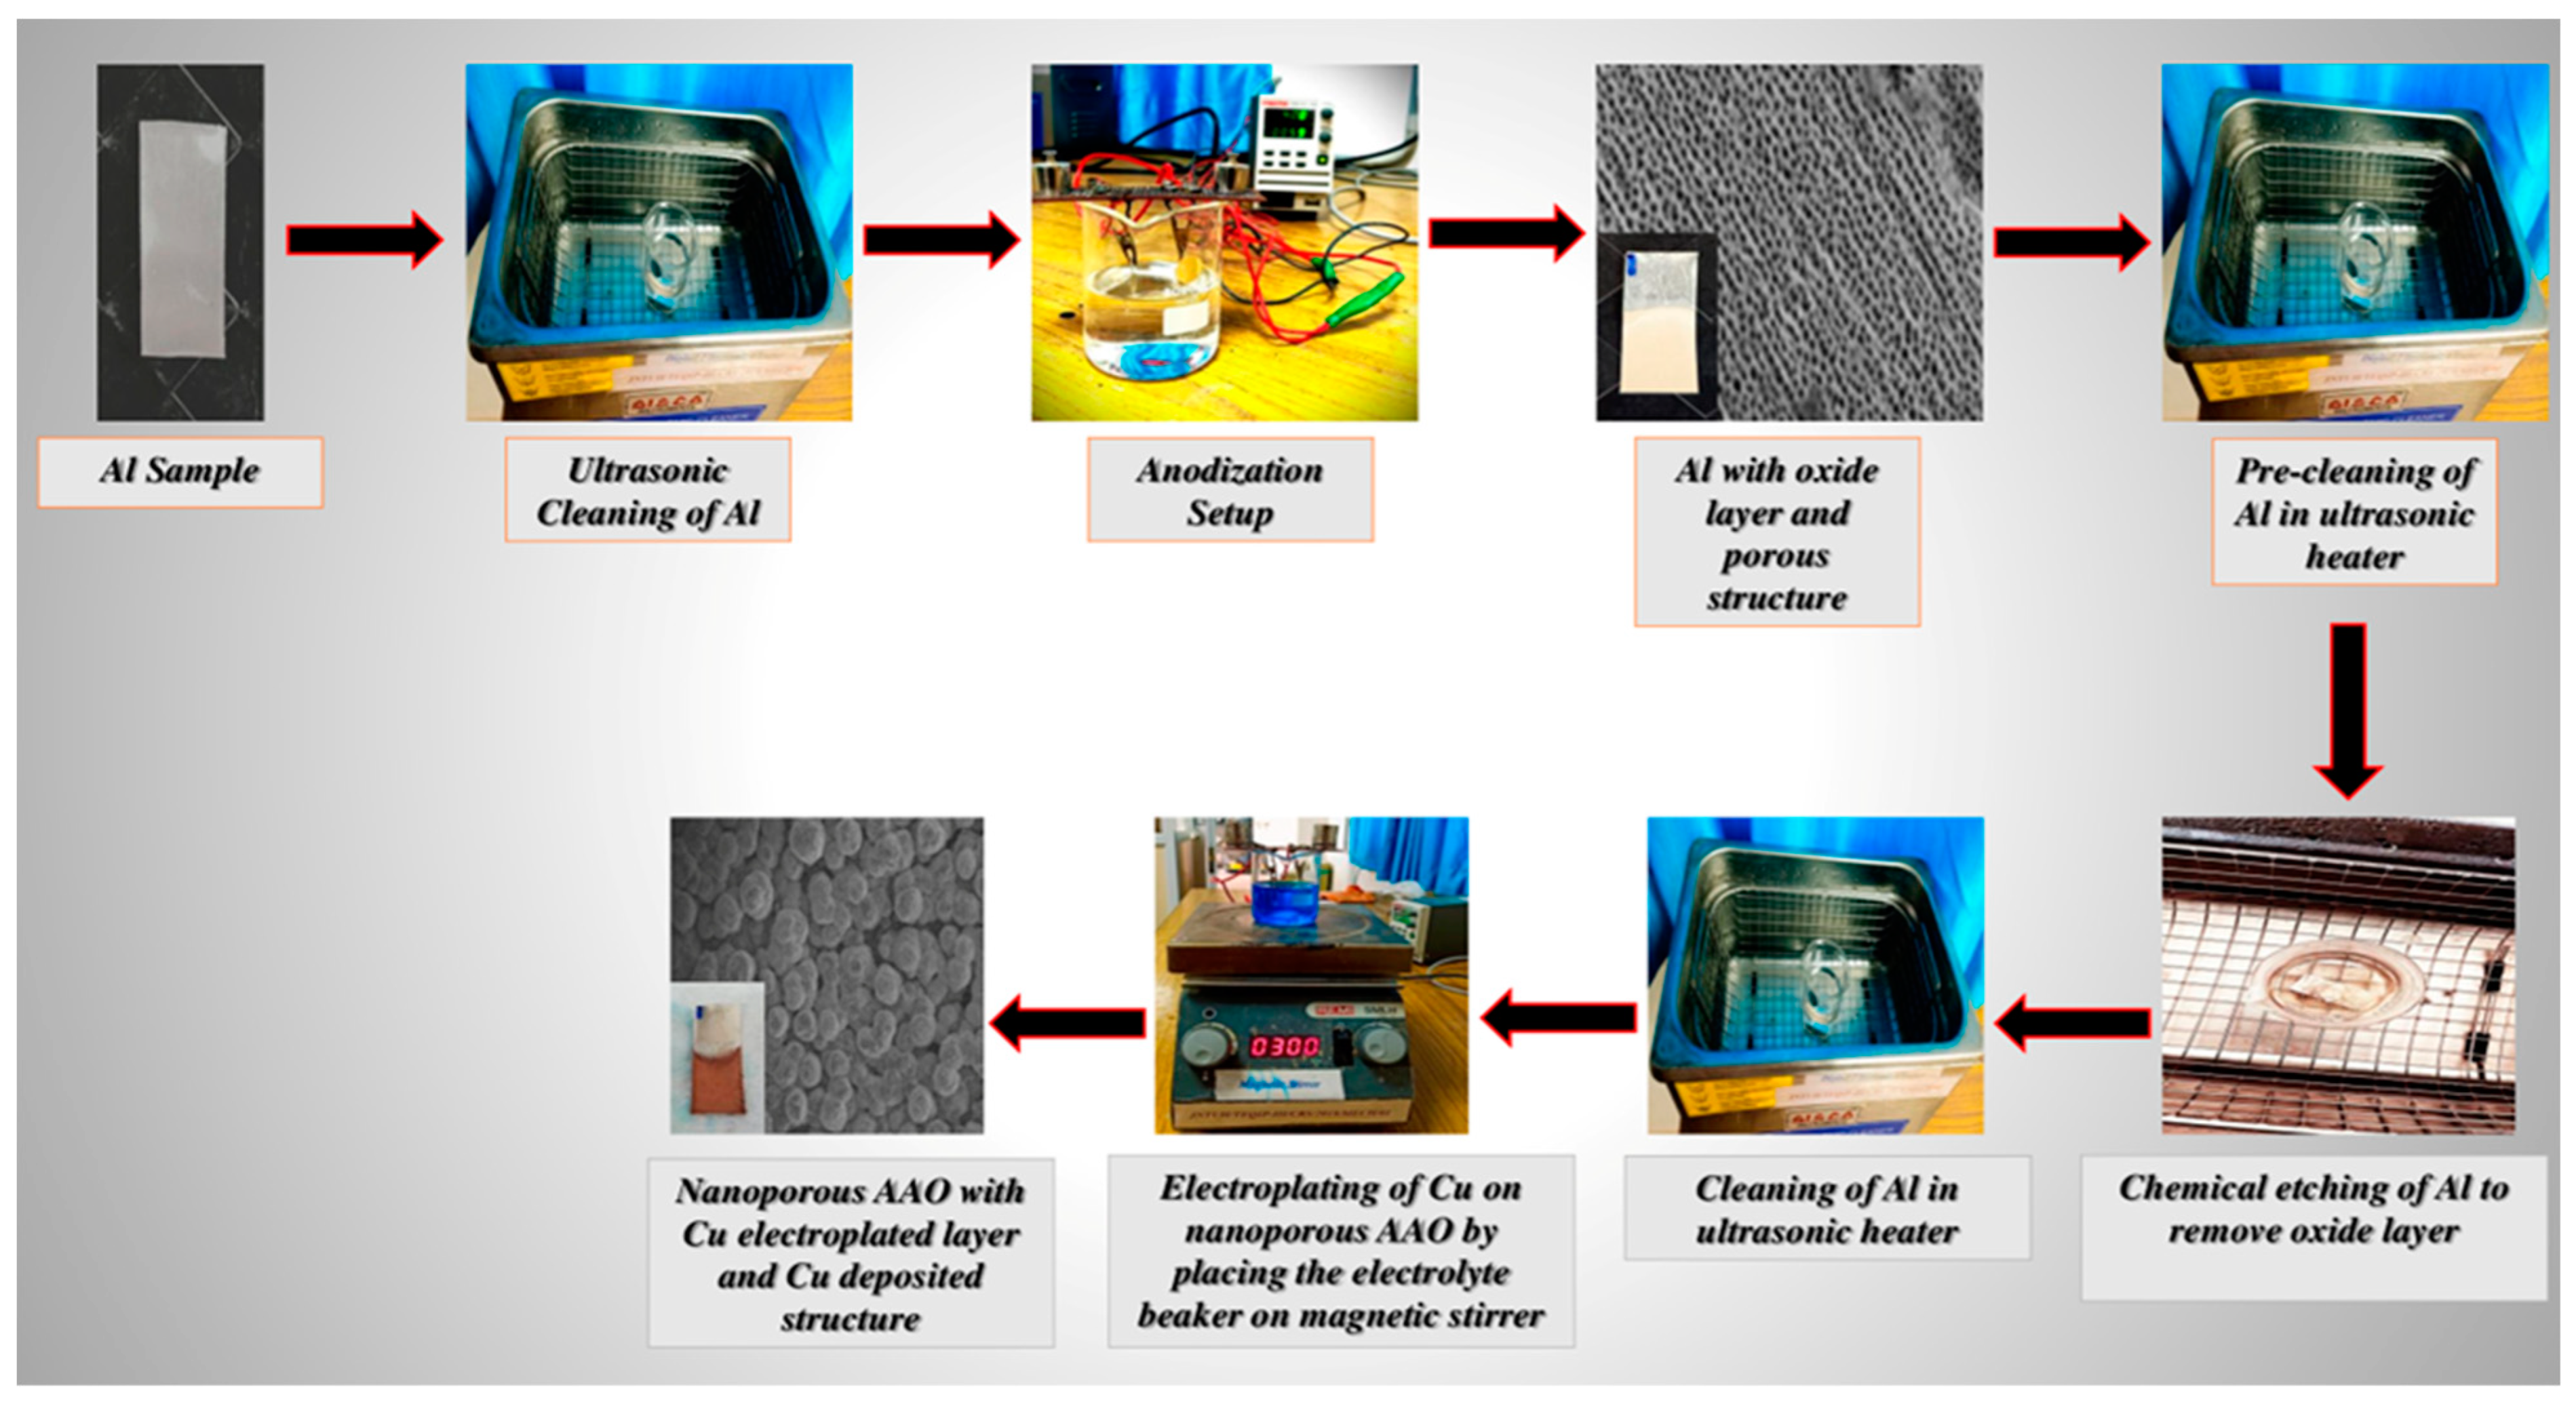
2.2. Development of Nanoporous Structure

Samples of uniform size measuring 3 × 1 cm were acquired by sectioning commercially available aluminum (6061 alloy, 97%) sheets composed of an alloy comprising 97% aluminum [39]. A process known as one-step anodization with constant voltage (CV) mode was employed in order to generate a porous structure. Prior to initiating the anodization process, the aluminum material underwent a thorough ultrasonic cleaning technique. This ultrasonic cleaning procedure involved immersing the aluminum in a certain order of solvents, notably ethanol, ethyl alcohol, acetone, and deionized water. In each solvent, every sample underwent ultrasonic cleaning in ultrasonic cleaner for a period of 15 min. Further, the anodization procedure entailed immersing the element in an electrolyte solution to induce oxidation while simultaneously forming an electrical connection between the element and the anode of current source. The anodization system utilized a platinum grid as the cathode, which was linked to the negative terminal of the direct current power source. Conversely, the anode was composed of aluminum and was employed in this configuration. The two electrodes were positioned at a spacing of 3 centimeters from each other. The anodization process was carried out by utilizing a solution containing oxalic acid with a concentration of 0.3 M, at room temperature, while applying a constant voltage of 40 V. Various durations of anodization were employed, including 40 min, 60 min, and 80 min. Figure 1 illustrates the development of the oxide layer on the aluminum sample after different durations of anodization.

2.3. Electroplating of Nanoporous Structure

In accordance with the anodization technique, each individual sample was subjected to a pre-treatment procedure that involved immersing it in acetone for a period of 15 min. Following this, a chemical etching procedure was carried out for a duration of 20 min at a temperature of 40 degrees Celsius in an etching solution that comprised a combination of potassium hydroxide (KOH) at a concentration of 10%, sodium hydroxide (NaOH) at a concentration of 10%, and sulfuric acid (H2SO4) at a concentration of 5% mixed in distilled water. Hence, the oxide layer was dissolved. After undergoing the chemical etching process, each individual sample was subjected to the following cleaning operations, which involved immersion in acetone and deionized water for a length of 15 min apiece. Following that, every individual sample was subjected to a 30 min copper electroplating procedure. The anode consisted of copper, whereas the cathode was represented by an aluminum sample. The electroplating procedure involved submerging a beaker in a solution of 0.3 M copper sulfate (CuSO4), which was subsequently positioned on a magnetic stirrer and programmed to revolve at a velocity of 300 revolutions per minute (rpm). To ensure the appropriate execution of electroplating, it was imperative to uphold a consistent current (CC) mode inside the direct current (DC) power supply. It was necessary for the operation to have a constant current of 0.5 amperes and an applied voltage of 10 volts, both of which were supplied by the DC power source (KEITHLEY 2260B-250-4 360W, Tektronix, Berkshire, UK). Figure 2 depicts the deposition of copper on the anodized aluminum oxide substrate following the electroplating process of copper.
Figure 3 illustrates the complete sequence of steps involved in the copper electroplating process that starts from the cutting of the sample to the final copper deposition on the sample. A flow diagram illustrating the changes in structure that occur following the specific treatment is shown in Figure 4.

2.4. Characterization
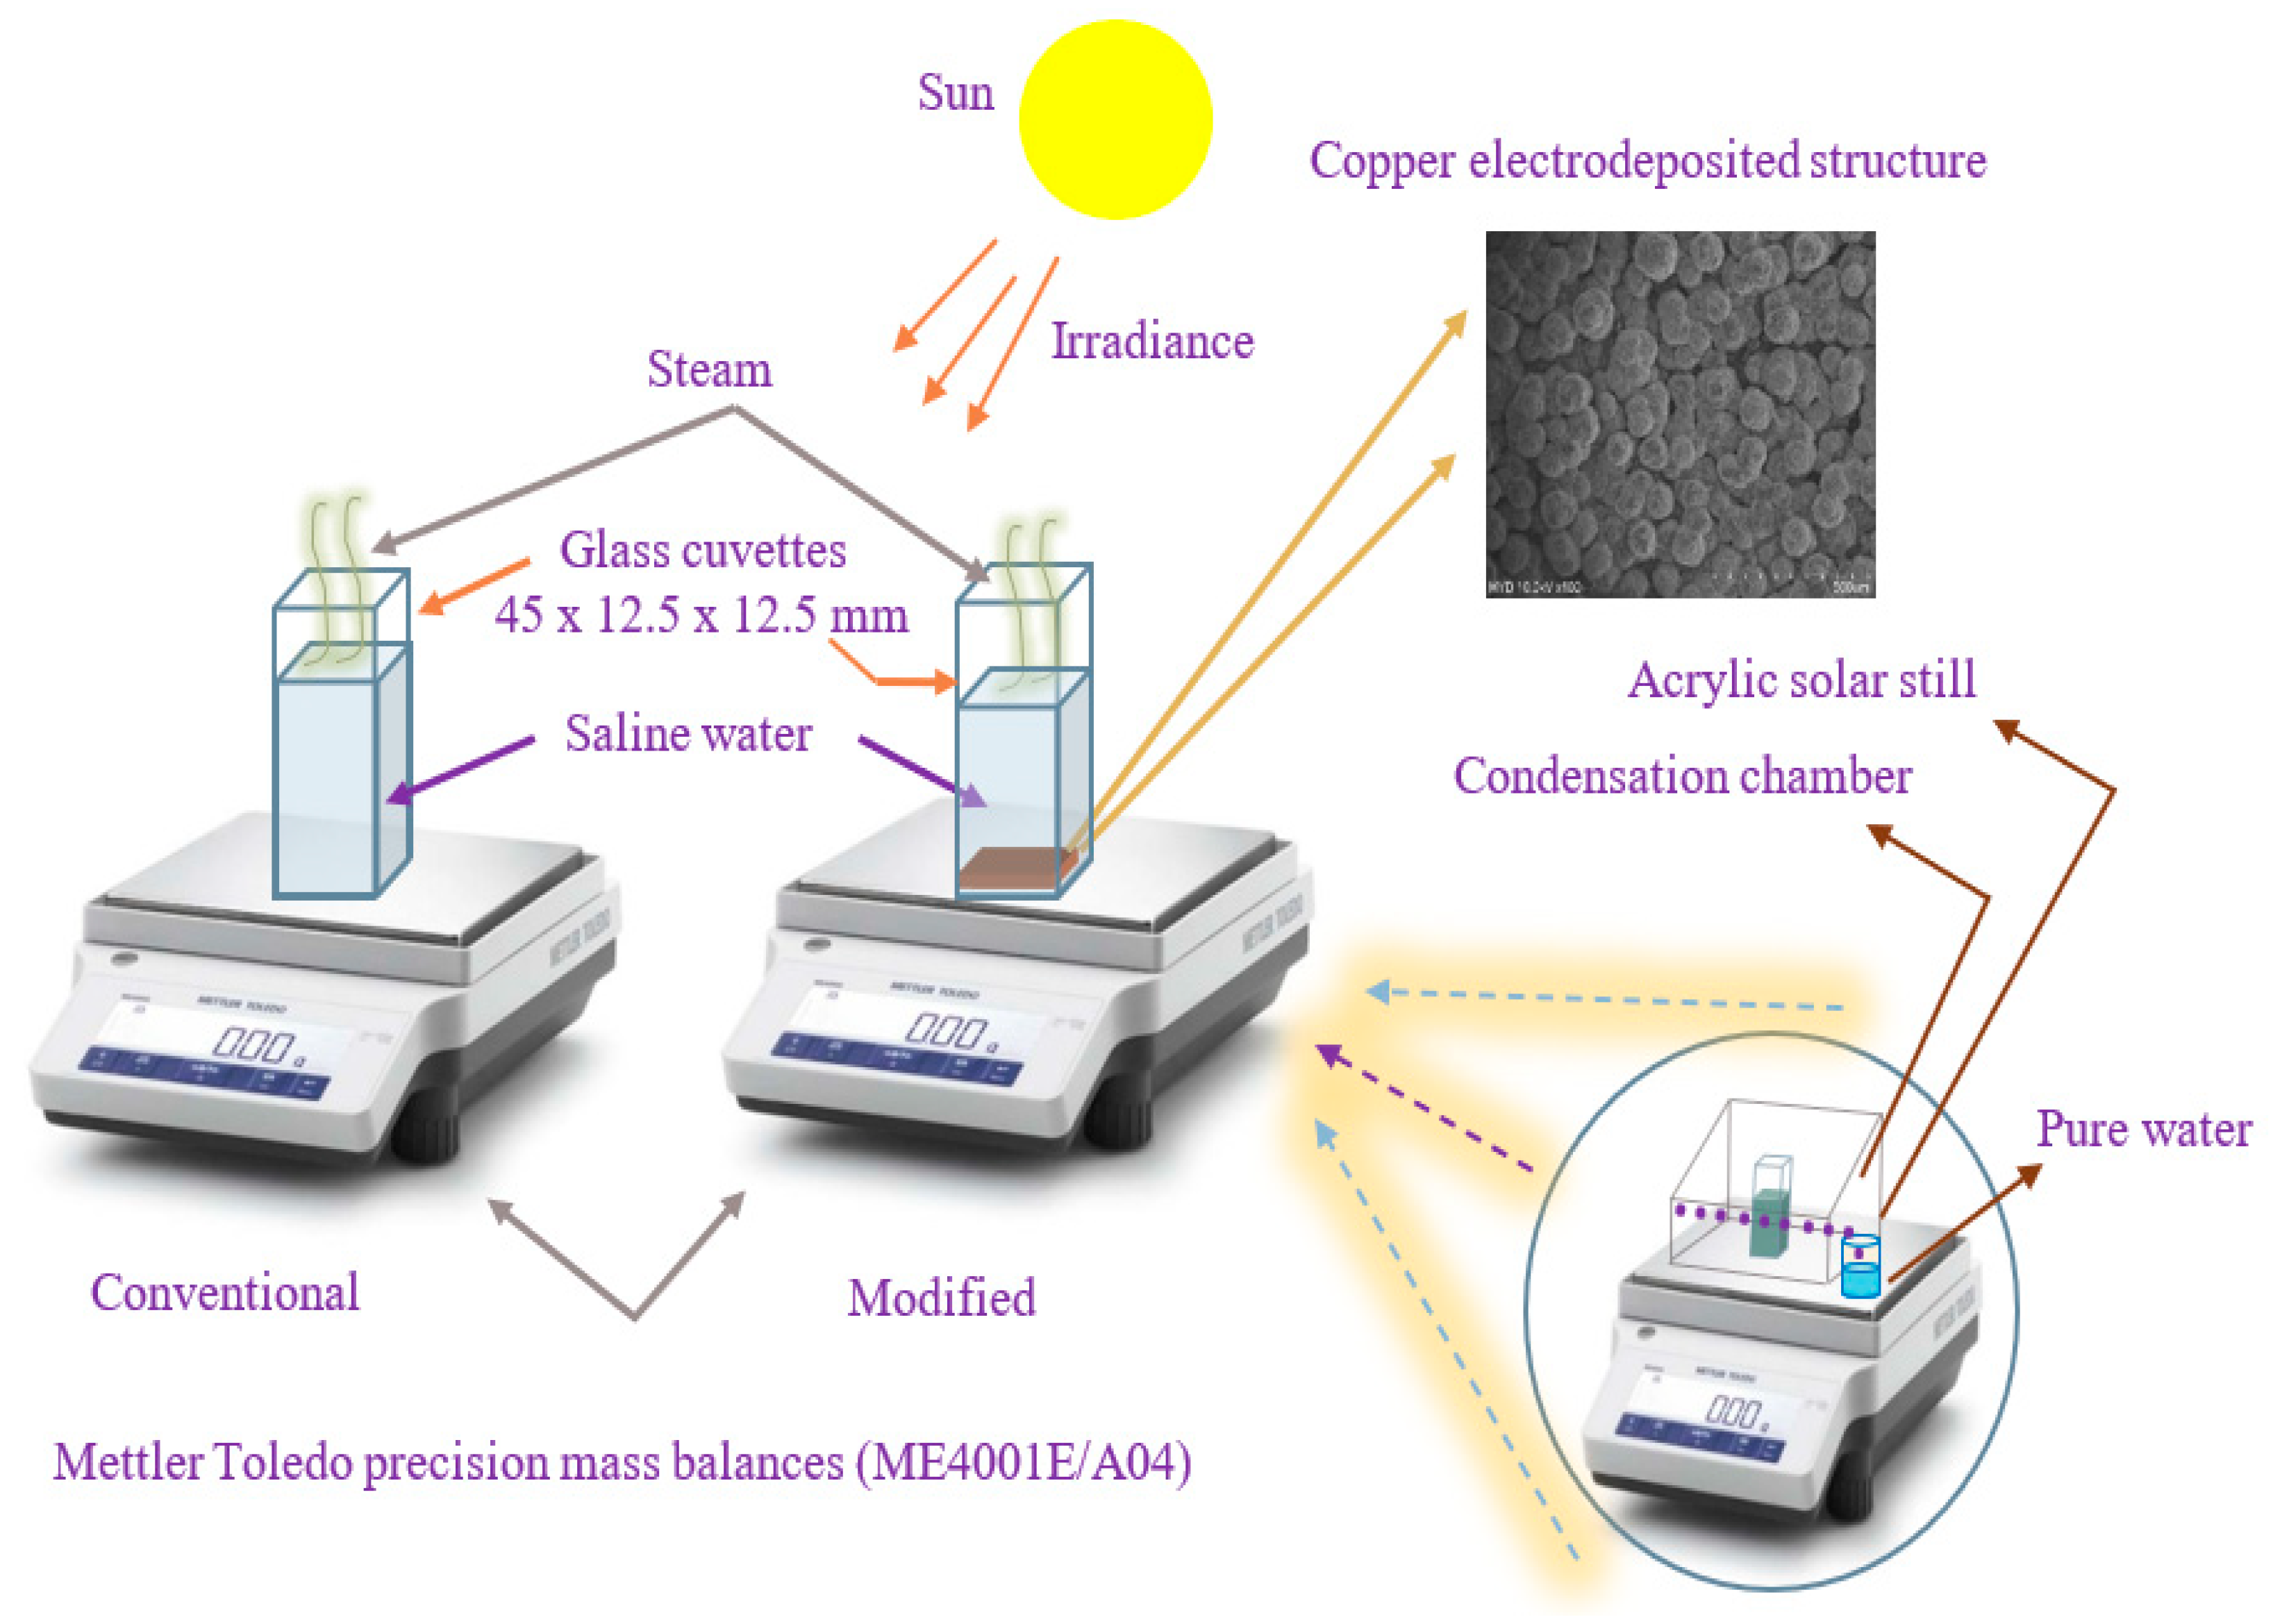
Field emission scanning electron microscopy (ZEISS, 18 Special Edition) was employed to investigate the microstructure of anodic alumina and copper deposit samples. Energy-dispersive X-ray (EDAX, ZEISS-18 Special Edition) was utilized to ascertain the chemical composition of the samples. For the purpose of determining the crystal structure, an X-ray diffractometer (XRD, Rigaku Mini Flex 600) was employed.

3. Experimentation

3.1. Experimental Apparatus

The experimental setup for desalination primarily comprised two types of solar stills: the conventional-type solar still (CSS) and the modified-type sun still (MSS). Both solar stills were composed of an acrylic material with a surface area measuring 40 mm × 40 mm. The thickness of the cross-section measured 4 mm. In both instances, the clear acrylic plates were precisely cut to the specified dimensions. The top transparent acrylic plate was positioned at an angle of 170 degrees relative to the horizontal plane, which corresponded to the latitude of the work location. In the desalination experimental setup, the generated copper-deposited nanoporous anodized alumina structure was evaluated using a pair of 12.5 mm × 12.5 mm × 45 mm glass cuvettes as visible in Figure 5. When it comes to the solar visible radiation, the glass cuvettes have an irradiance transmissivity of 84%. Two METTLER TOLEDO precision mass balances were used to track the hourly water collection rates. The sun intensity and the air temperature were measured using a Hukseflux pyranometer.

3.2. Experimental Procedure

The copper-deposited nanoporous structures, which were produced for 40, 60, and 80 min and had dimensions of 10 mm × 10 mm, were immersed in the cuvettes. The tests were conducted over a period of three consecutive days in order to investigate the impact of nanoporous structures on the production of distillate. The data presented in this study represent the average results obtained from these trials, which were carried out on three sunny days. The cuvettes were filled with a solution of saline water, ensuring that the liquid reached the brim of each cuvette. The experiments were carried out at VNR Vignana Jyothi Institute of Engineering and Technology, located in Hyderabad, India, during the month of May 2022. The experiments were carried out between 9:00 a.m. and 5:00 p.m. on the days characterized by bright weather conditions. Prior to commencing the research, a calibration sheet was developed for the experimental setup in order to analyze the data acquired on an hourly and cumulative basis. This data pertained to the quantity of water that was evaporated and subsequently collected within the experimental setup.

4. Results and Discussion

The present study aims to analyze the impact of different anodization durations on the surface morphology of AAO under a constant potential of 40 V. Additionally, the investigation also examines the influence of copper deposition on the nanoporous AAO and its possible application in solar desalination. The anodization processes were conducted for durations of 40 min, 60 min, and 80 min, respectively. An efficient fabrication process was employed to create a nanoporous AAO on aluminum substrates.
First and foremost, it was crucial to guarantee that the specimens underwent a thorough cleaning procedure and were consistently kept in a moist condition. If the drying process was allowed to occur on the oxide coating, it would lead to a decrease in the electrical conductivity of the oxide layer to an extent that may render the plating process unattainable. On the other hand, if the anodized specimens were subjected to water for a period of time that exceeded roughly 15 min, the process of hydroxide production would begin, leading to the occupation of the pores and causing a negative effect on the adhesion capabilities of the plating. Furthermore, it was crucial to ensure that the specimens or their individual components were electrically coupled and that the power supply was engaged before submerging the specimens in the copper-plating solution. Noncompliance with this methodology has the potential to cause a complete or partial disintegration of the oxide layer due to the plating solution, hence leading to irregular copper deposition [40].
Through a process of chemical etching, the AAO that was produced was removed to guarantee a proper and accurate deposition of copper in the pores. Over the course of this investigation, the chemical etching solution that was employed consisted of sodium hydroxide [41]. This particular solution was utilized since it facilitated the removal of the oxide layer from the external surface as well as the interior pores of aluminum substrates. A decrease in the thickness of aluminum substrates was the result of this procedure. Subsequently, copper deposits that formed were then used in solar desalination applications to determine the quantity of water that was lost through evaporation.

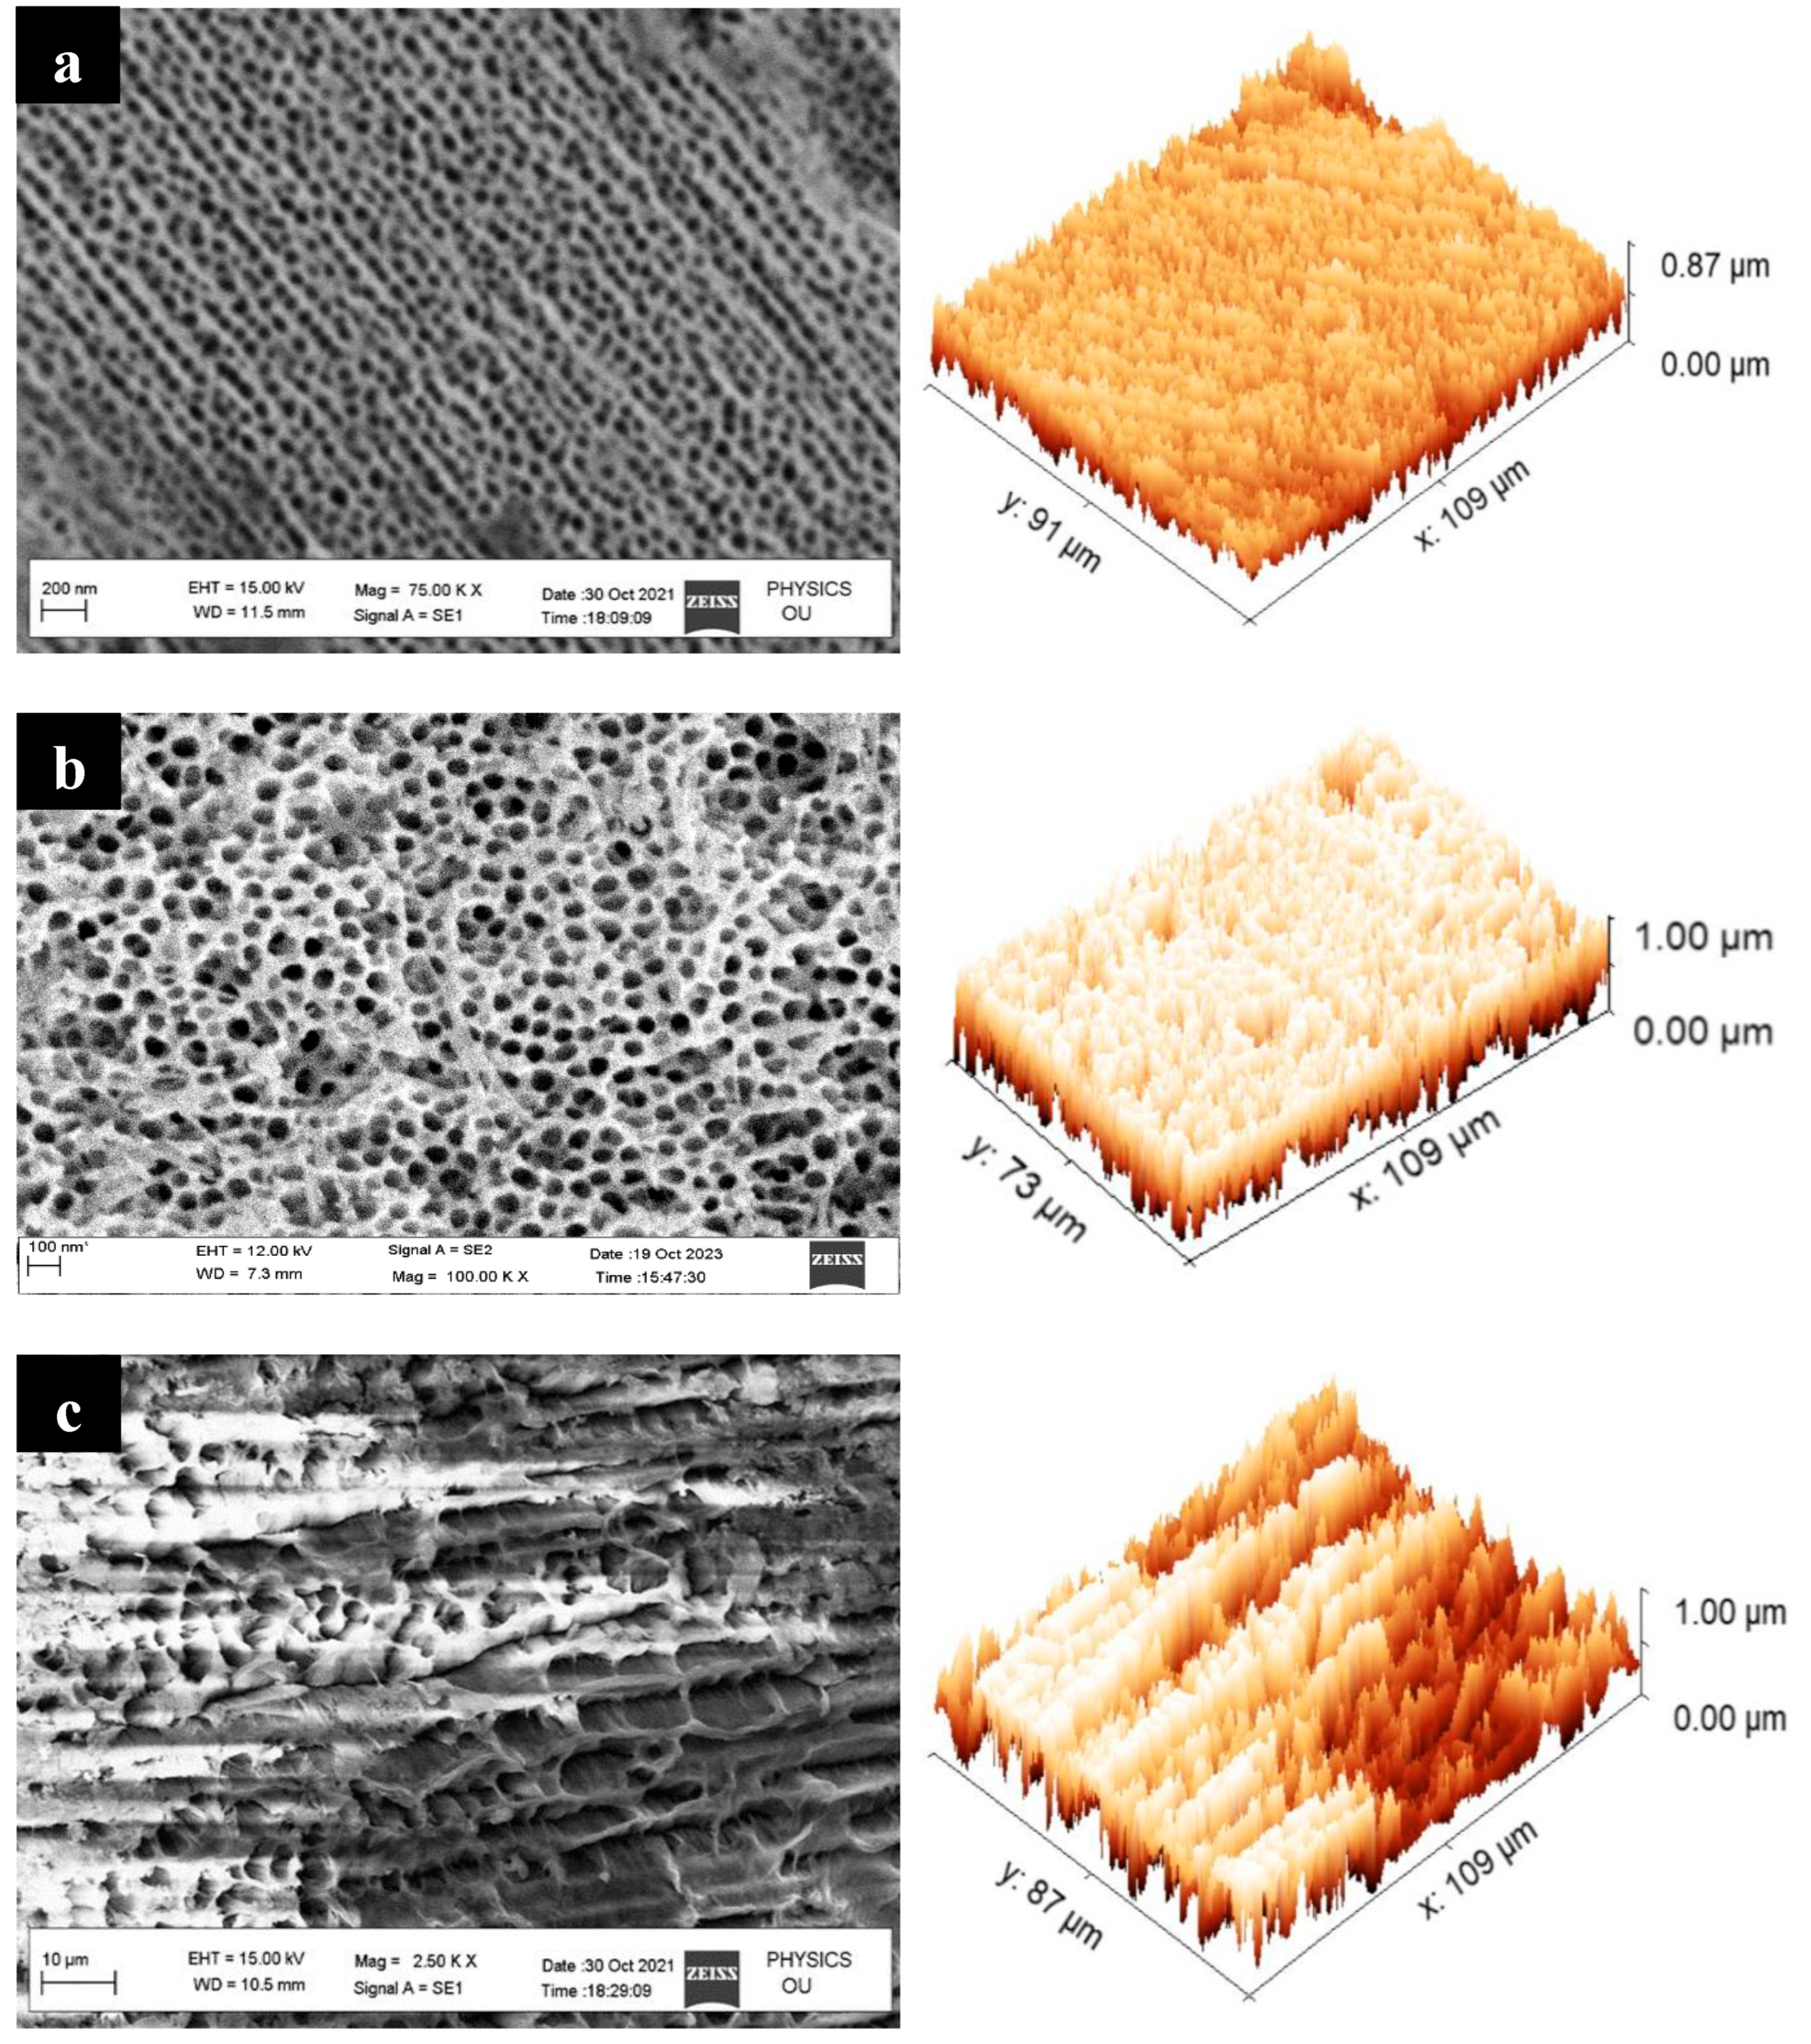
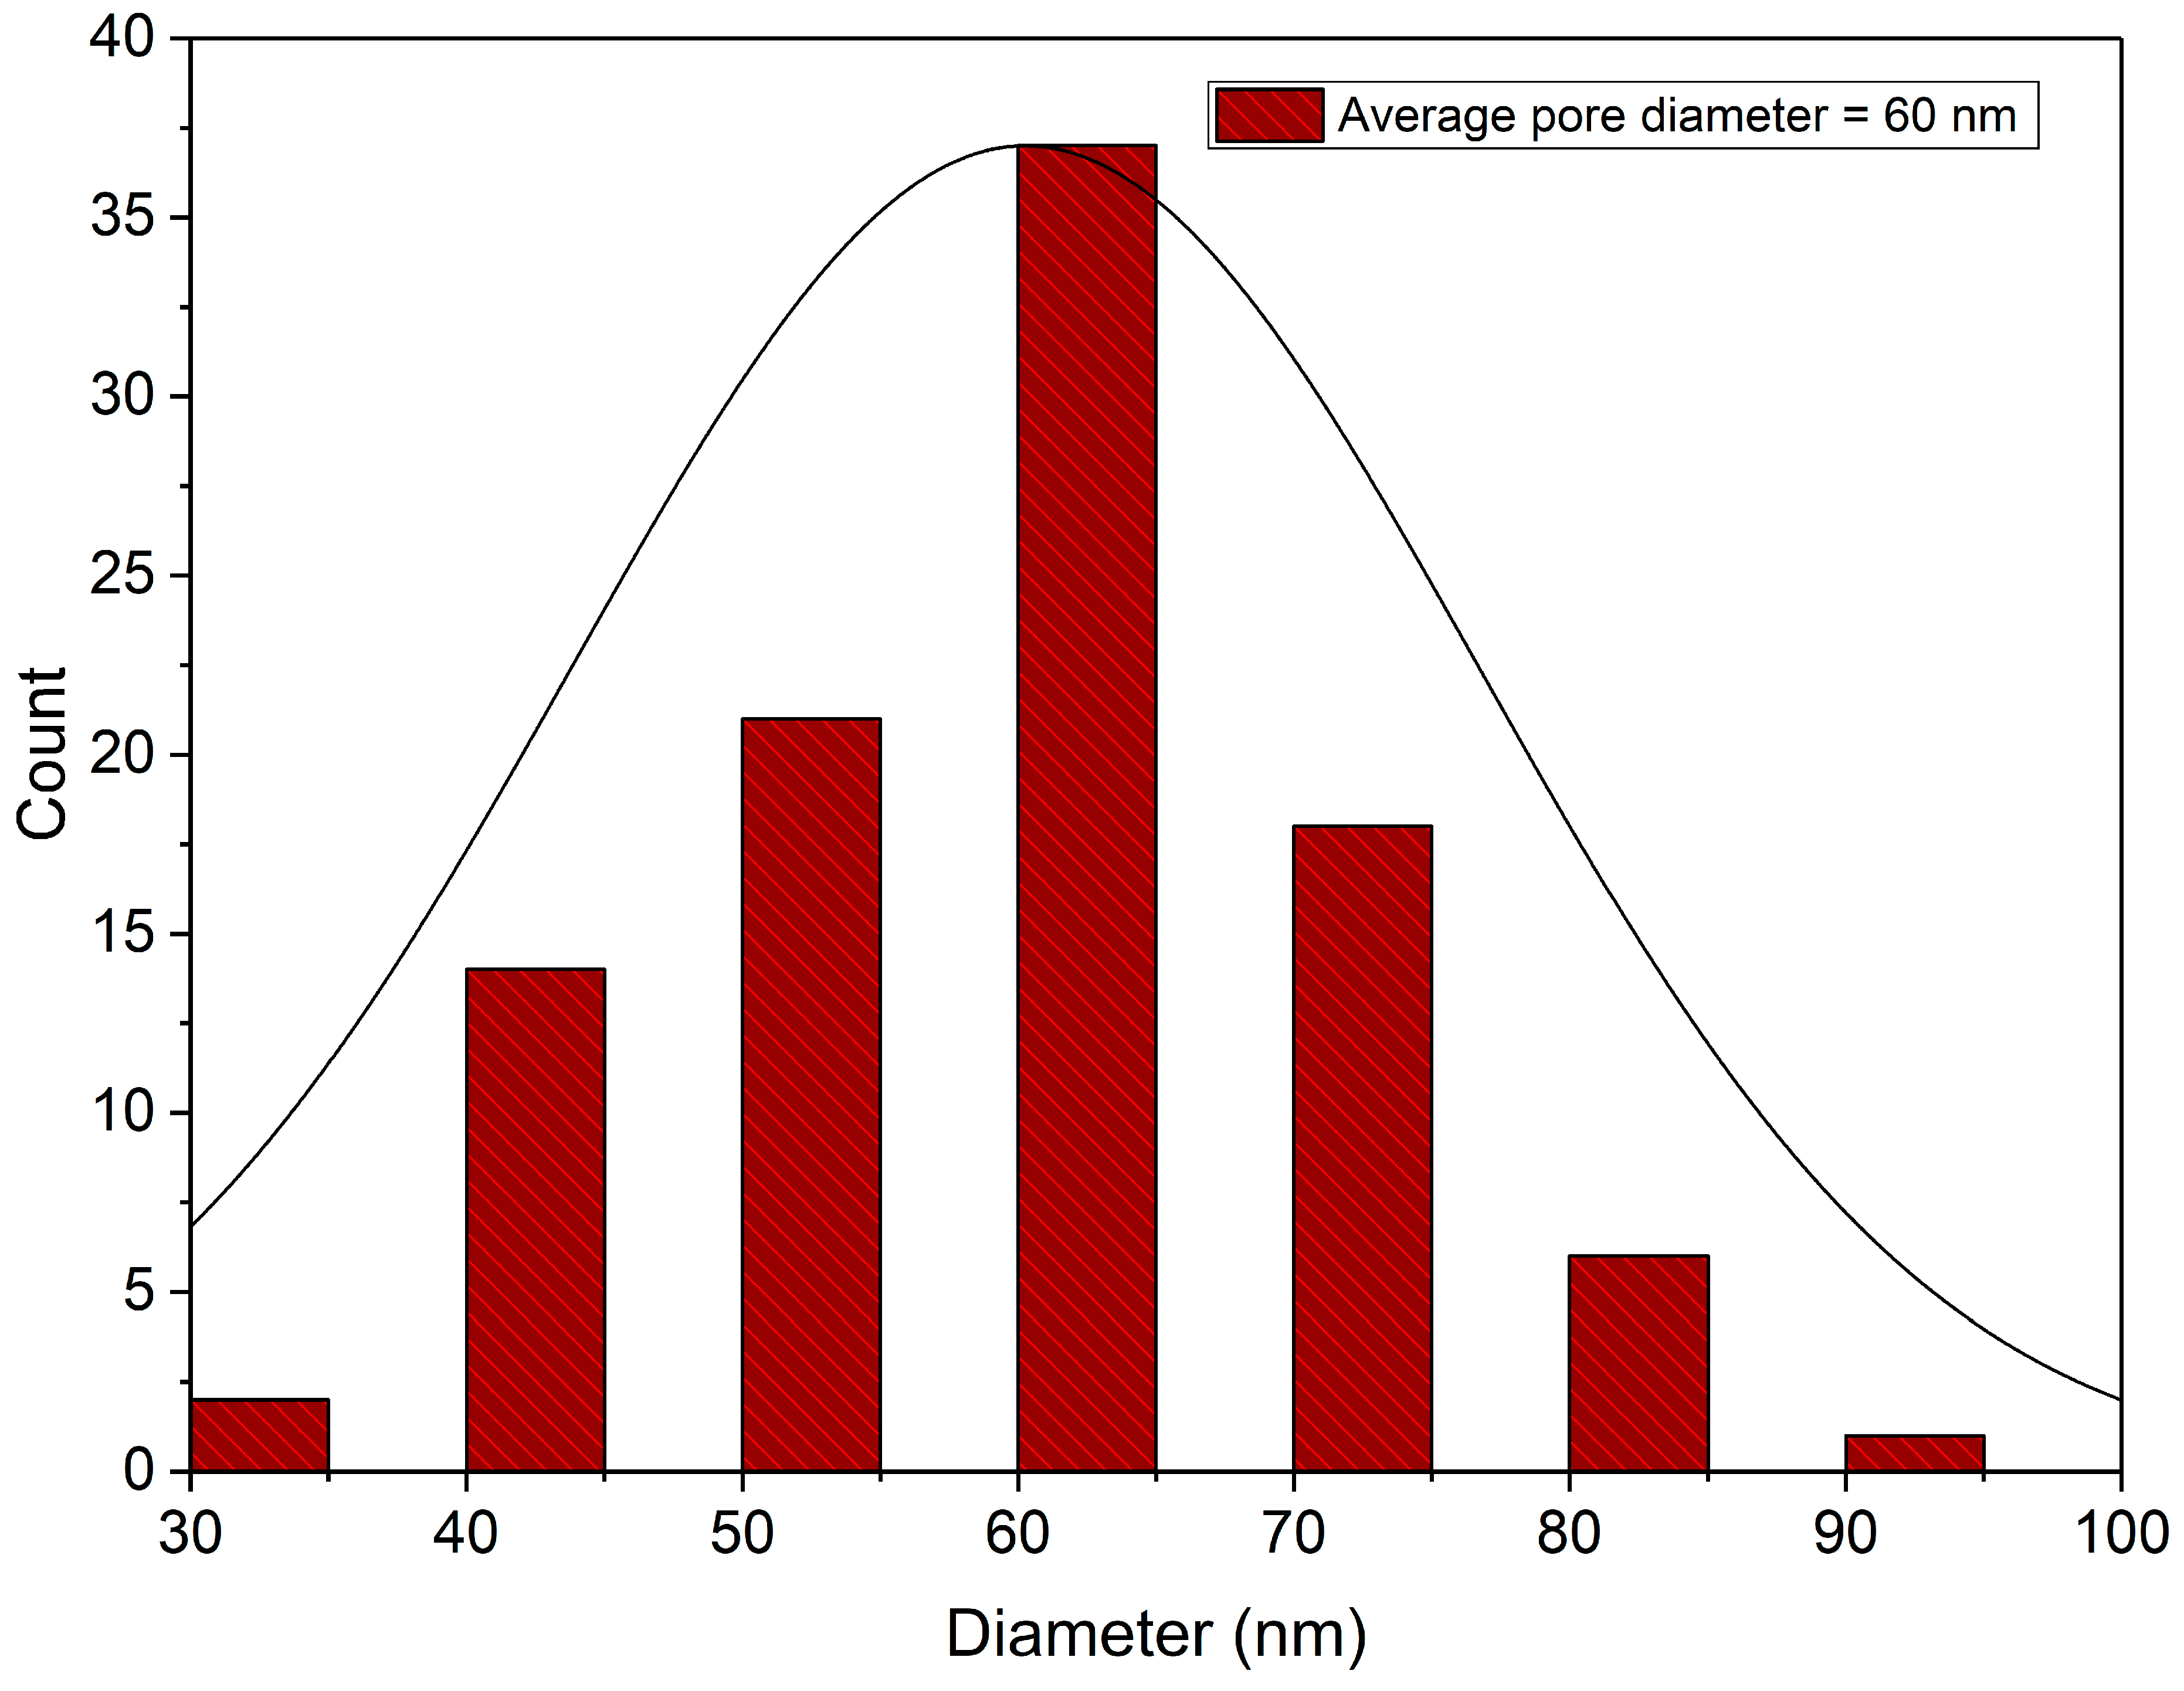
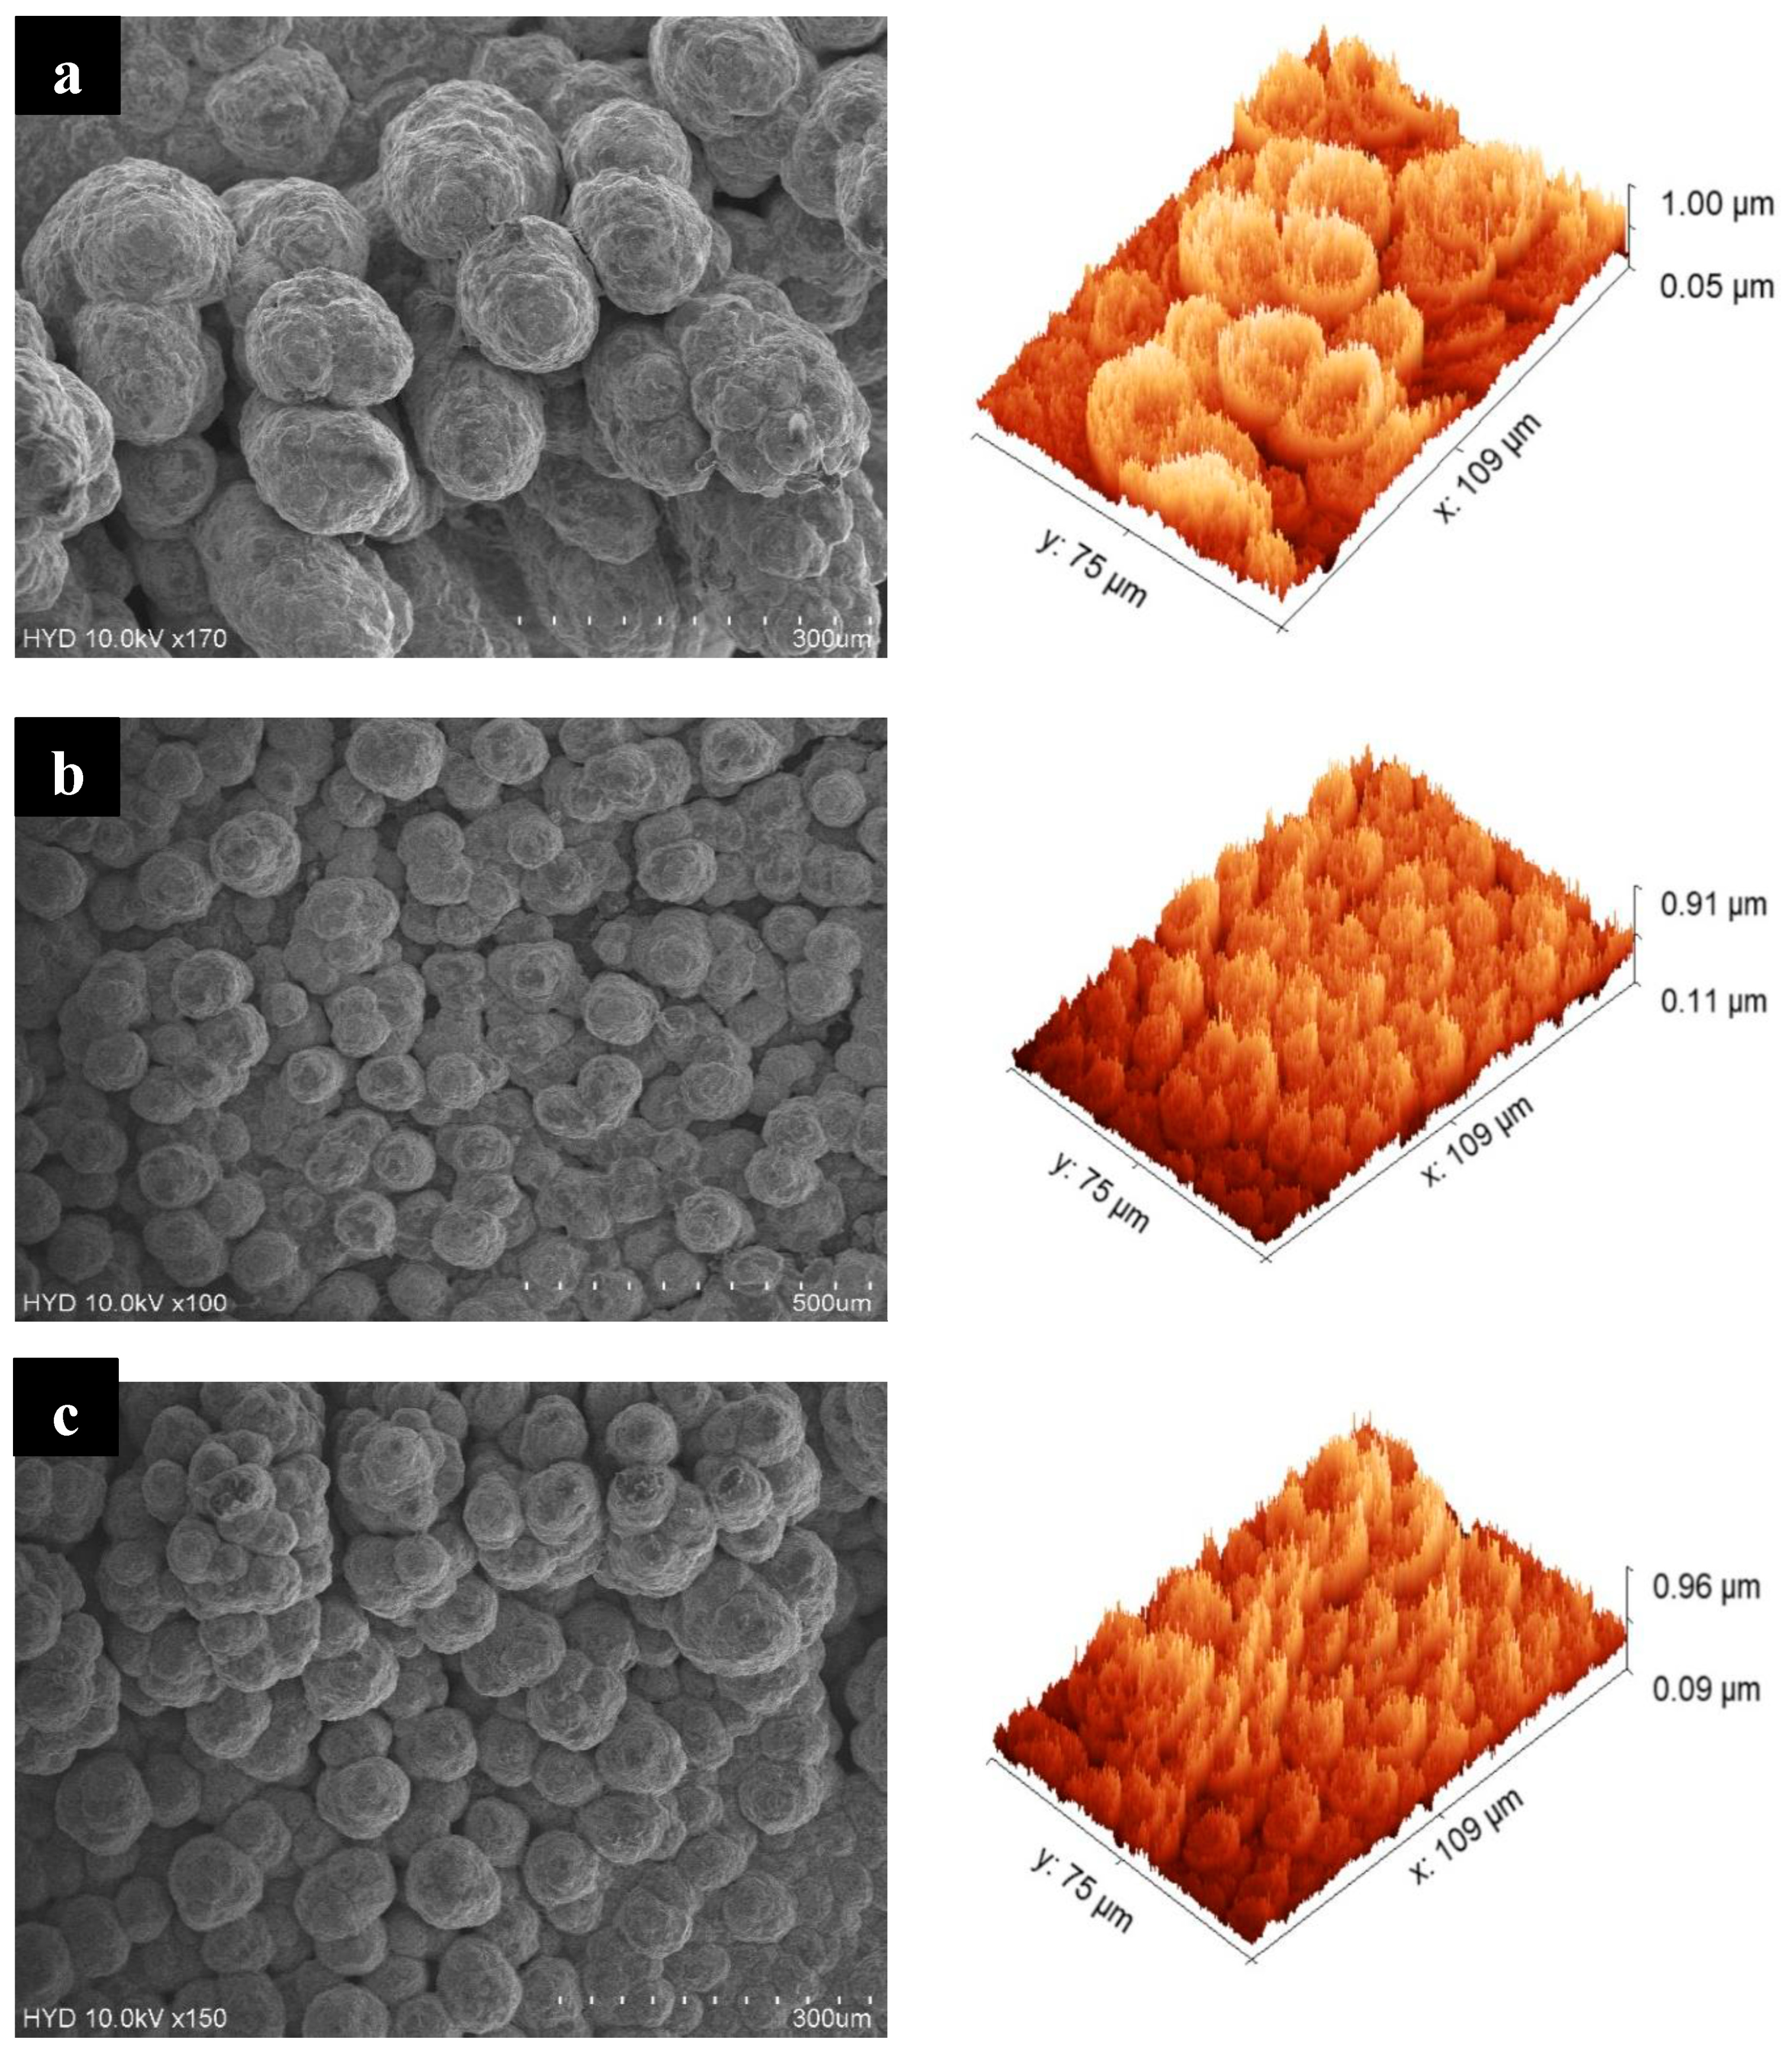
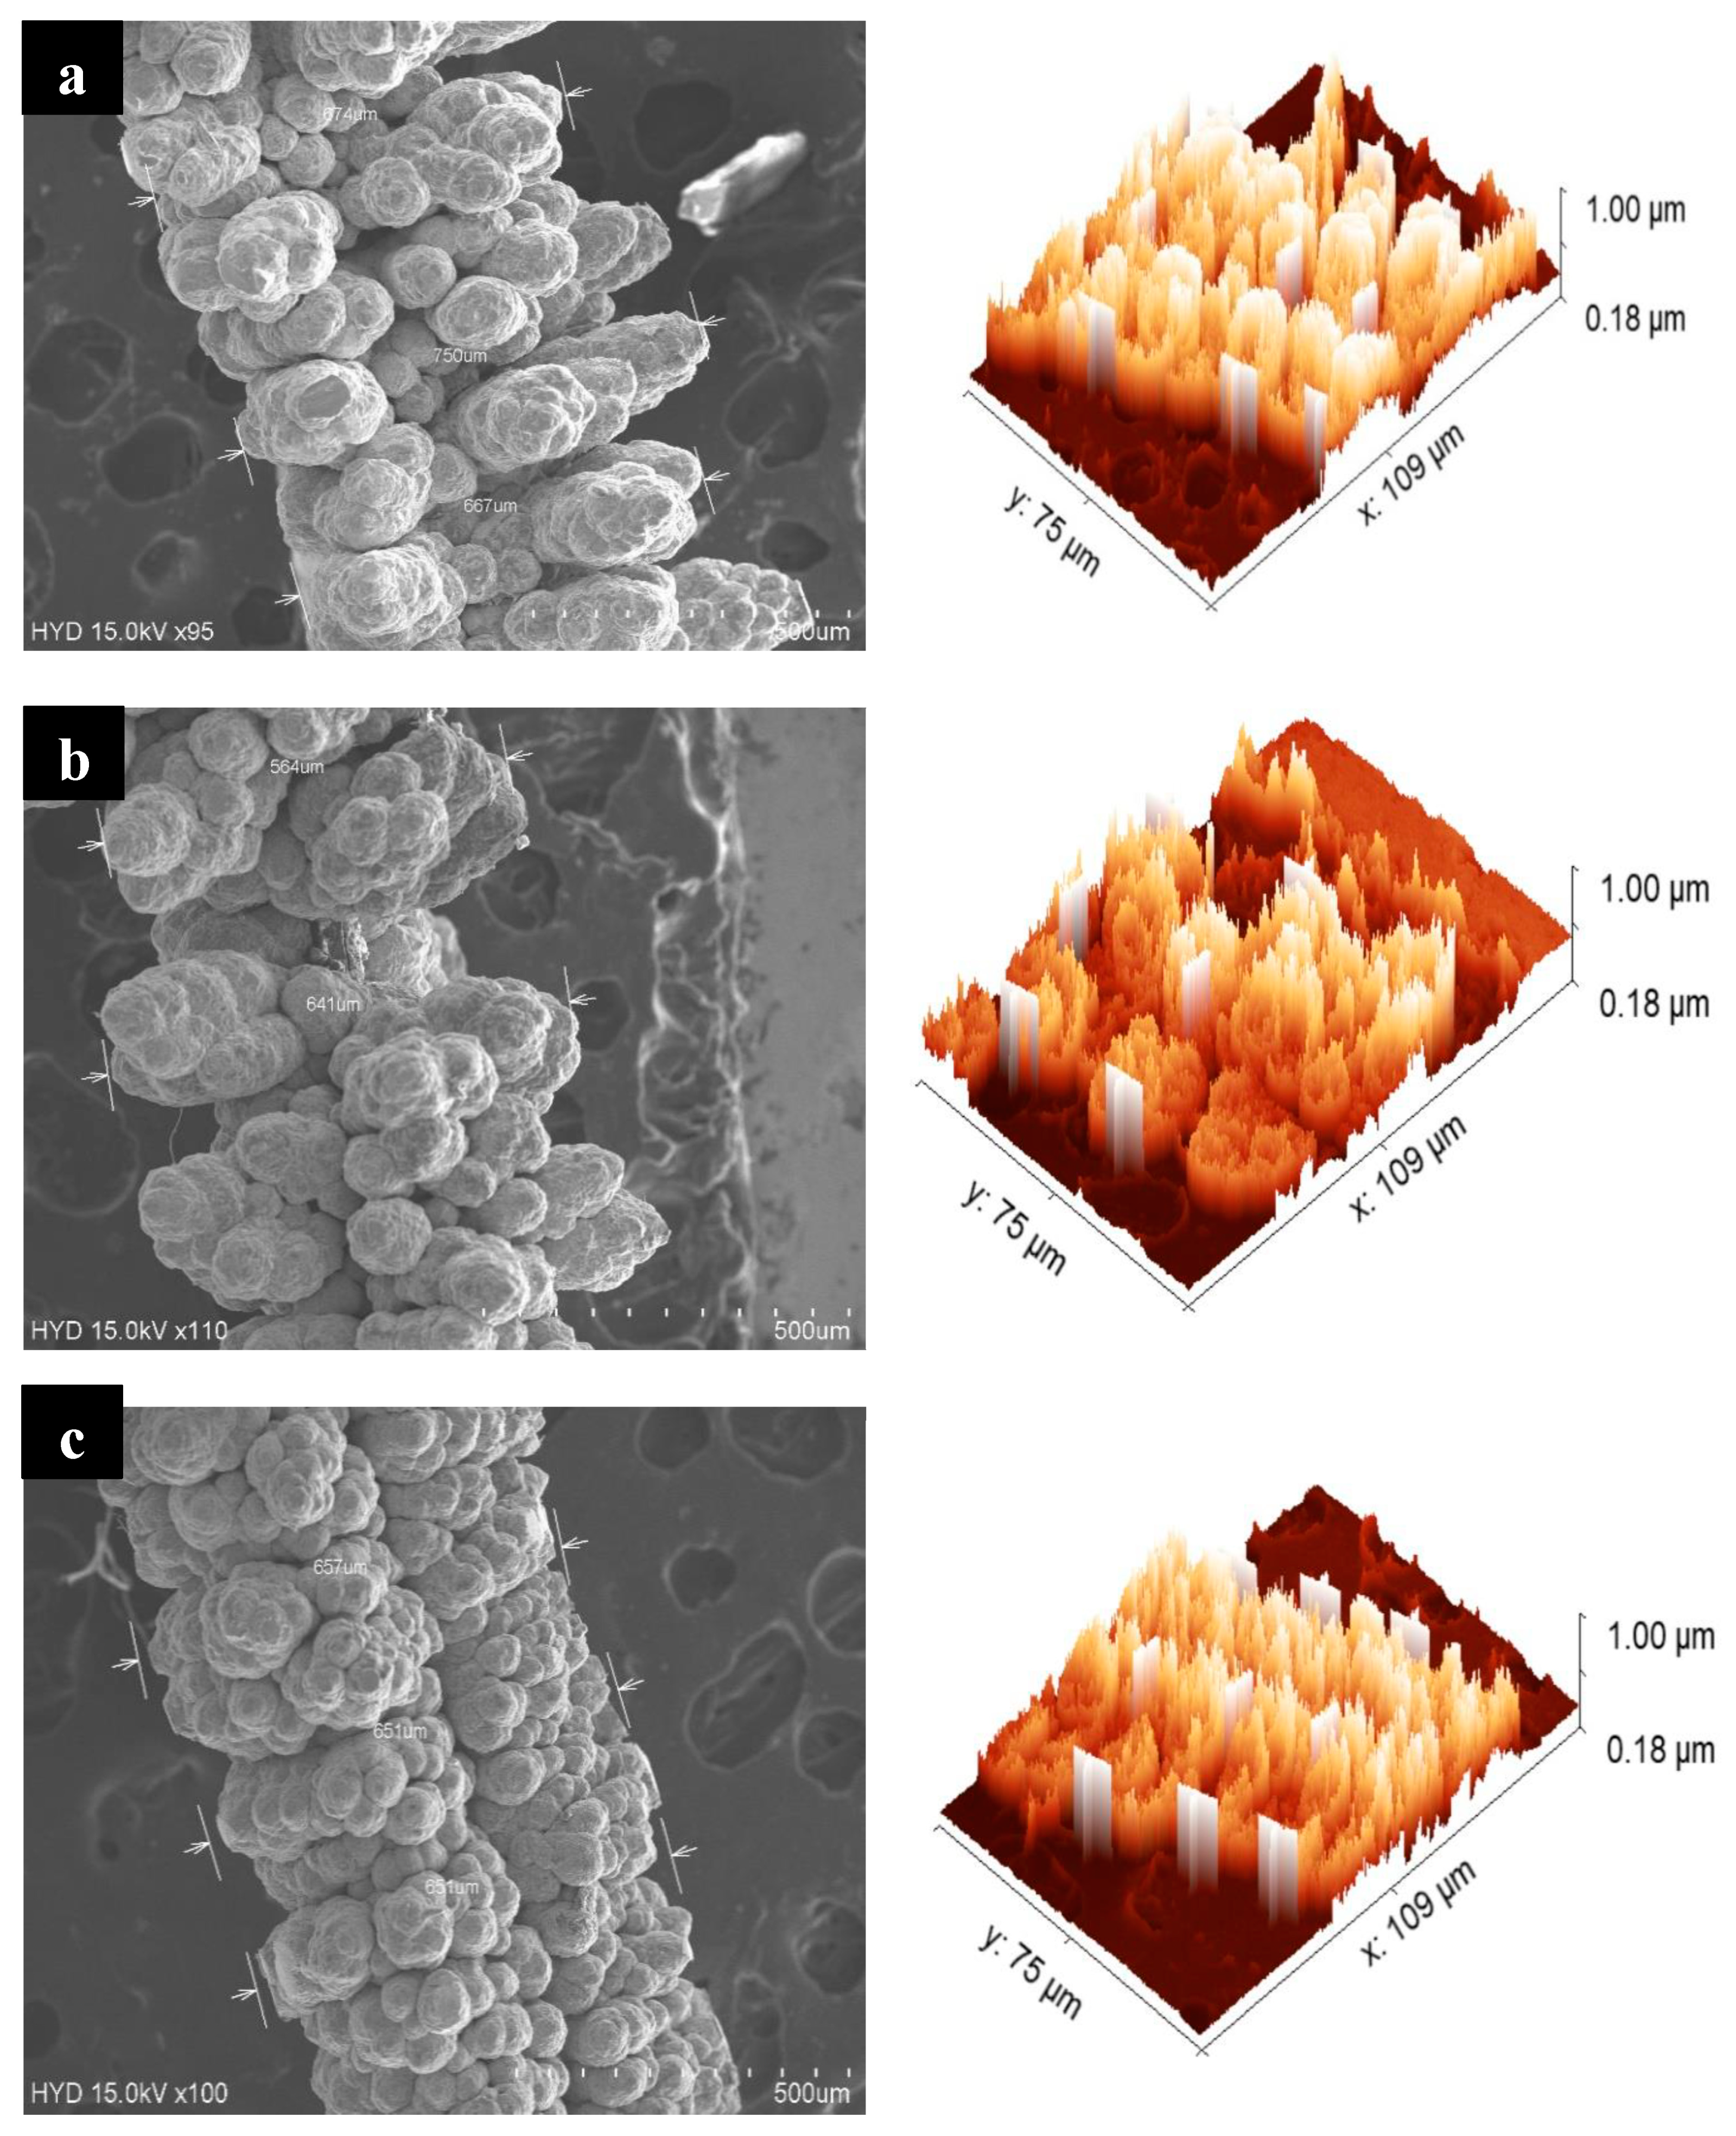
4.1. Morphology Examination

The present study employed qualitative scanning electron microscopy (SEM) analysis to investigate the effects of varying anodization durations on the surface characteristics of AAO nanostructures created in oxalic acid, as well as on the surface of copper electrodeposited AAO nanostructures formed in a copper sulfate solution.
Prior research has demonstrated that utilizing low anodization voltages is detrimental to the development of well-organized pore architectures. The observed phenomenon can be explained by the increase in volume of the aluminum when it undergoes oxidation. This expansion is only significant at high anodization voltages [42] and results in the pores repelling each other due to the repulsive forces between them. To offer a potential rationale for this phenomenon, the following information delves into the voltage dependency of the oxidation kinetics. The creation of porous anodic alumina through potentiostatic circumstances is initiated with the development of a barrier oxide layer, whose thickness is governed by the applied voltage [43]. Once the oxide reaches a certain thickness, it becomes insulating and prevents ionic conduction. Afterwards, pores form and expand with their lower parts coated by a barrier oxide layer.
Ultimately, a state of continuous and consistent pore expansion is achieved. The phenomenon is distinguished by a state of equilibrium when there is a combination of accelerated dissolution of oxide at the interface between the oxide and electrolyte at the bottoms of pores and the creation of oxide at the interface between the metal and oxide due to the movement of O2−/OH ions through the underlying oxide layer. The formation process is characterized by a significant initial current during the formation of the initial barrier oxide, and a sharp decrease in current is noticed when the oxide becomes insulating against ion migration, followed by an increase in current due to the formation of pores and a consistent current during the steady-state pore growth phase. The steady-state conditions were achieved after approximately 10 min when starting from an electropolished aluminum surface, given the parameters utilized in this study.
Evidently, the etching conditions at the pore bottoms are significantly influenced by time when dealing with high voltages and currents. The cause of this behavior is the alteration of the electrolyte composition at the bottoms of the pores as a result of the chemical processes linked to the expansion of pores. Oxalate ions are consumed during oxidation because they are incorporated into the producing alumina, as has been observed with several acids including oxalic acid. In order to achieve the production of organized pore arrays, it is necessary to maintain experimental settings that promote the self-organization process over extended periods of anodization.
Prior to conducting morphology analysis, the specimens were gold-splattered in order to acquire high-quality images as an integral component of the procedure. The SEM image depicts the surface structure of the aluminum foil. The anodization procedures were carried out at varying time intervals of 40 min, 60 min, and 80 min. Figure 6 makes it very clear that samples that were anodized for 40 min and 60 min have a nanoporous structure, and the pores were arranged hexagonally.
The mean diameter of the nanopores was around 60 nm after anodization for a duration of 60 min, as illustrated in Figure 7. It was discovered that the diameter of nanopores progressively expanded from 40 min to 60 min, and, subsequently, the structure became unstable at 80 min. An increase in anodization time led to an augmentation in the density of side walls of nanoporous alumina, ultimately culminating in a desiccated surface. The mean nanopore diameter measured 45 nm and 60 nm after anodization periods of 40 and 60 min, respectively.
As electroplating is carried out in copper sulfate solution, there is a possibility of sulfate dissolving porous oxide [44]. But here, before copper deposition, the oxide layer was removed. After the removal of the oxide layer, the nanoprotrusions are present on the surface of aluminum, which does not have much effect due to sulfate interaction. Hence, the copper is deposited on the protrusions. Based on the data depicted in Figure 8, it is evident that the field emission scanning electron microscopy images of samples 1–3 demonstrate the formation of a nanoporous oxide coating composed of copper following the anodization and copper electroplating procedures. Nonetheless, there was a certain degree of heterogeneity in both the density and distribution of the oxide layer, a phenomenon that was contingent upon the time of anodization and electroplating processes. The findings of the study emphatically indicate that there was no correlation between the thickness of the oxide layer generated in oxalic acid and the coverage of copper deposit on the surface during the electroplating process. Yet, it has been noted that a substantial amount of coverage in these cases indicates the presence of several nucleation sites on the oxide coating, so further plating is enabled. The prevailing belief is that the initial deposition phase is initiated at the location nearest to the pit clusters on the anodic layer [45].
FESEM magnifications clearly revealed the presence of a porous structure in nanometers (nm) after anodization and copper depositions in micrometers (µm) following copper electroplating. The assessment of pore-filling effectiveness, encompassing the proportion of filled pores and the extent to which they were filled, was carried out by analyzing cross sections through the utilization of scanning electron microscopy (SEM). This was judged by observing the cross-section and porous alumina surface. Figure 9 gives a clear picture of the pores’ cross-sectional areas that were produced, which elucidated how pores filled up and the maximum depth of samples. Deposited copper was measured in microns on nanopores. According to Figure 9, the mean thickness of copper deposited on the sample anodized for 40 min is 697 µm, whereas the mean thickness of copper deposited on the sample anodized for 60 min is 602 µm. On the other hand, the mean thickness of copper deposited on the sample anodized over a duration of 80 min is 653 µm.

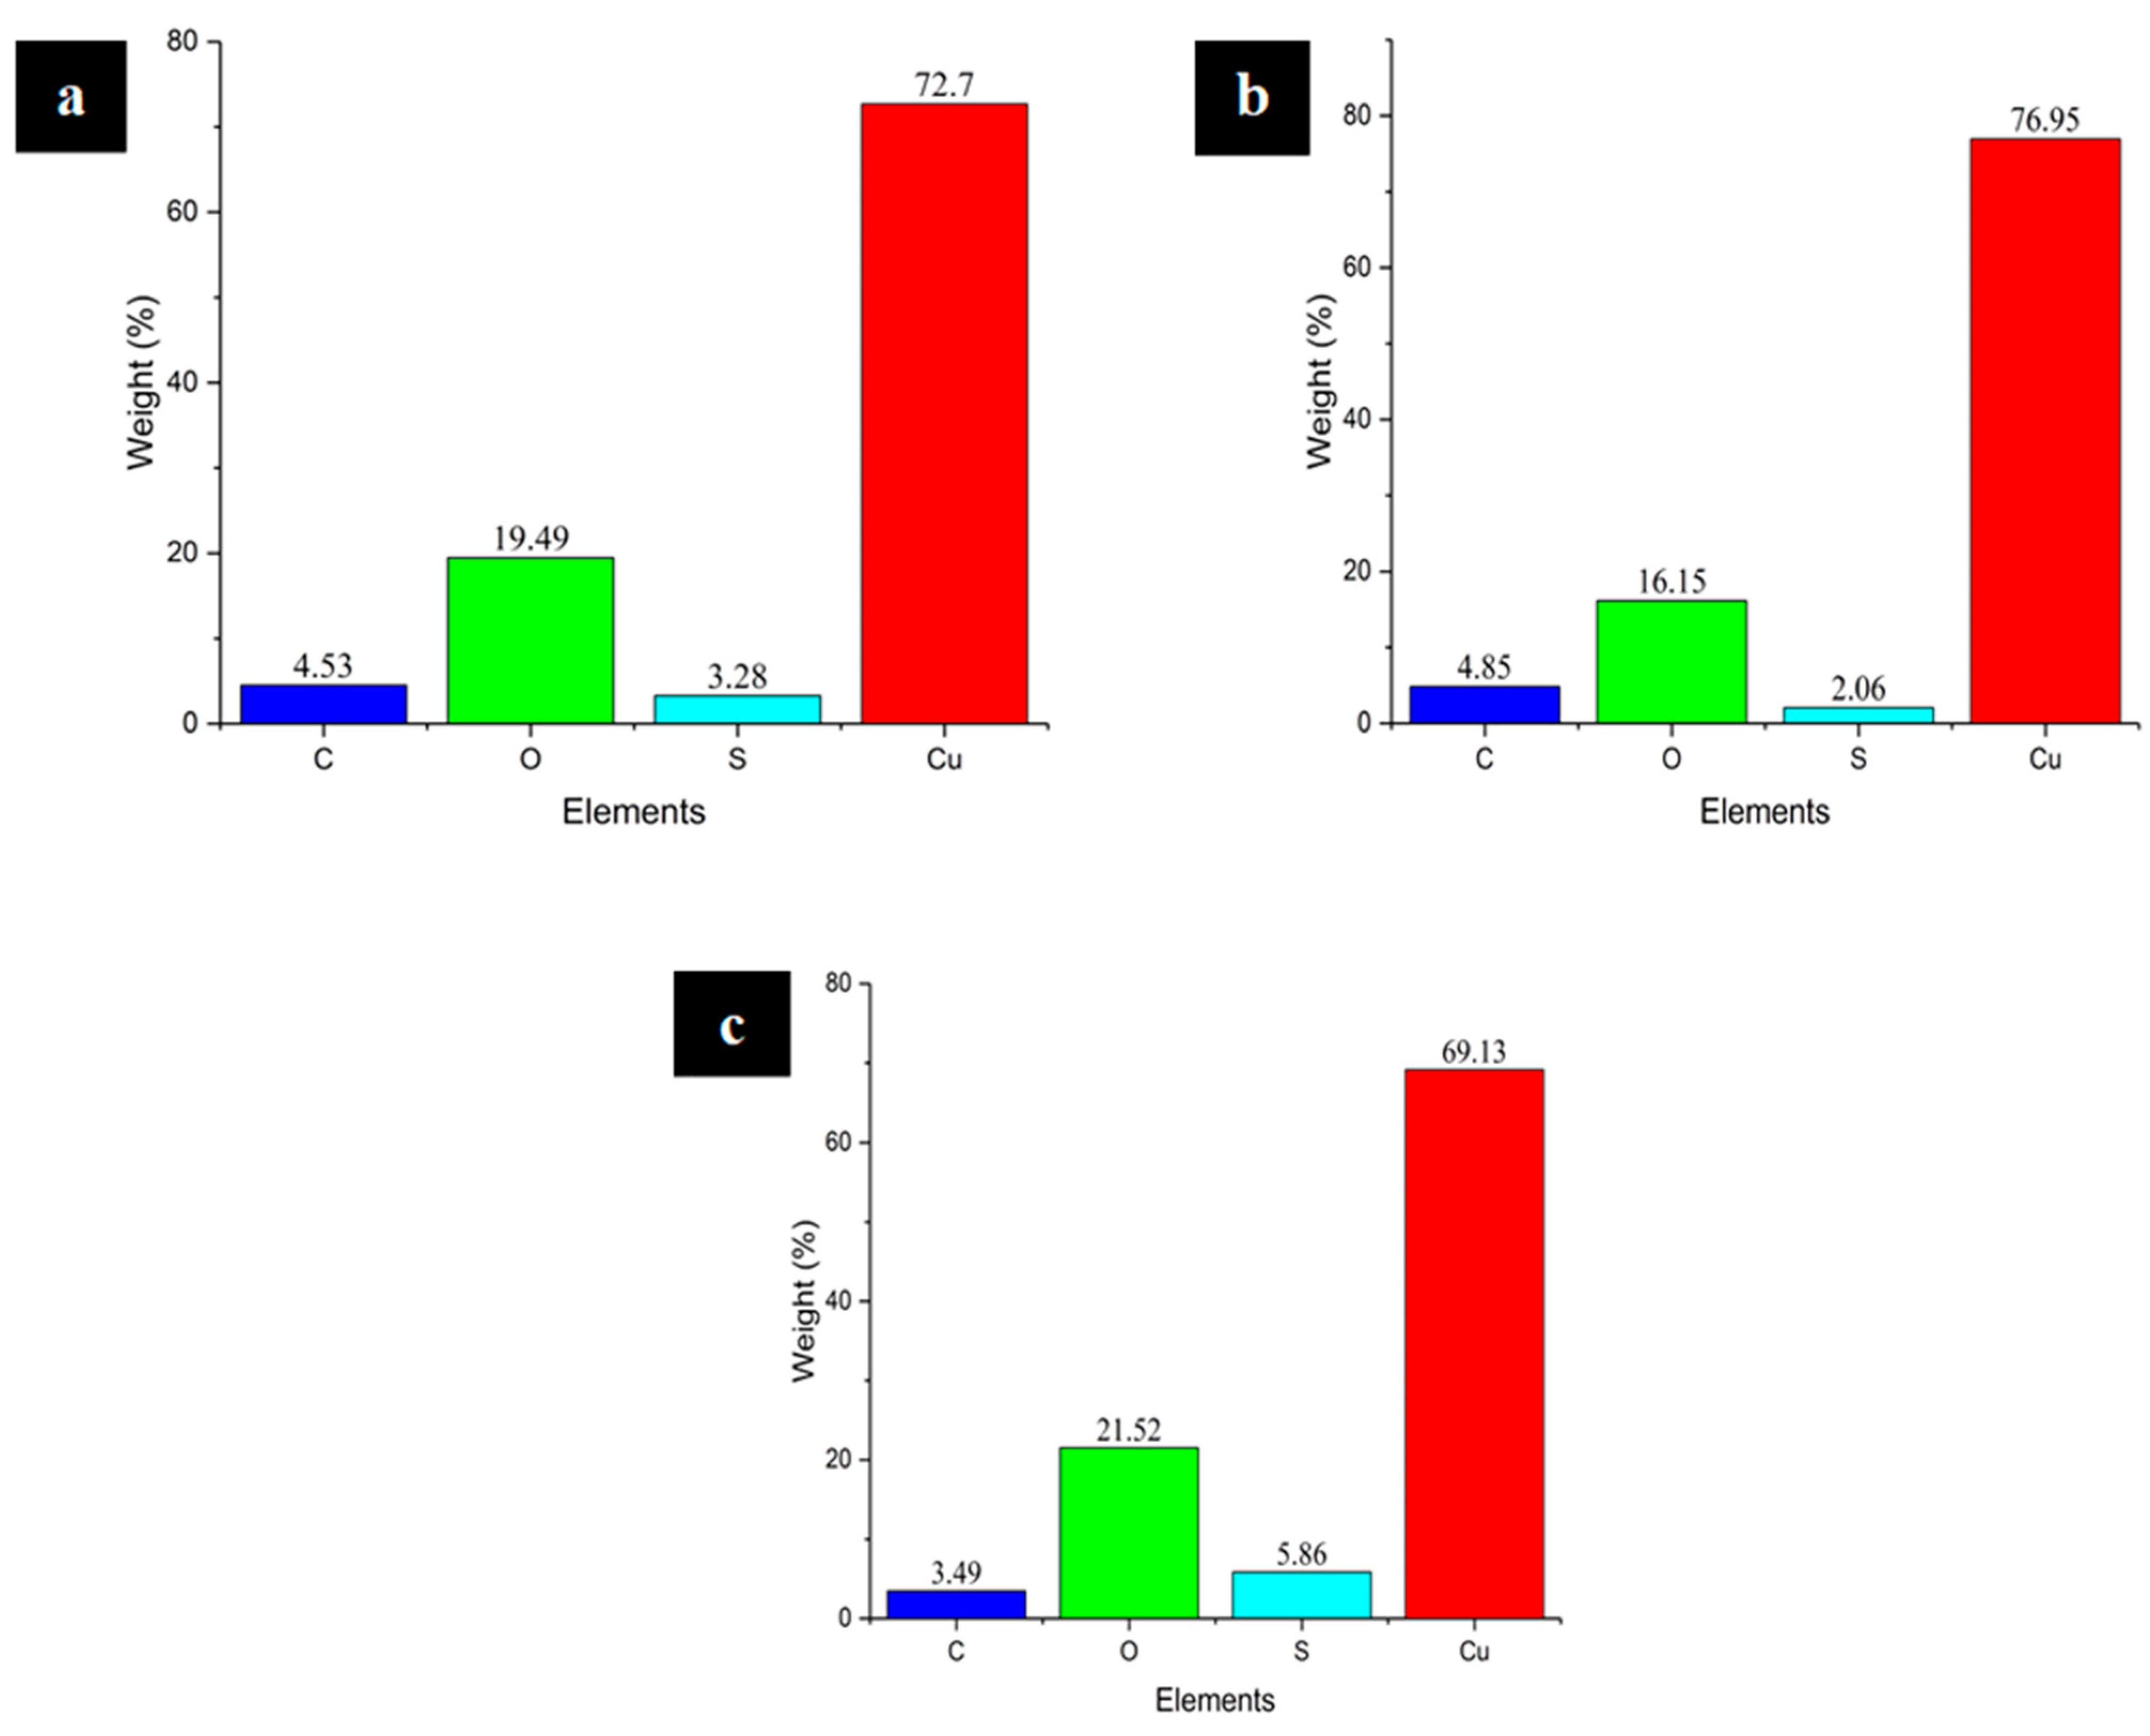
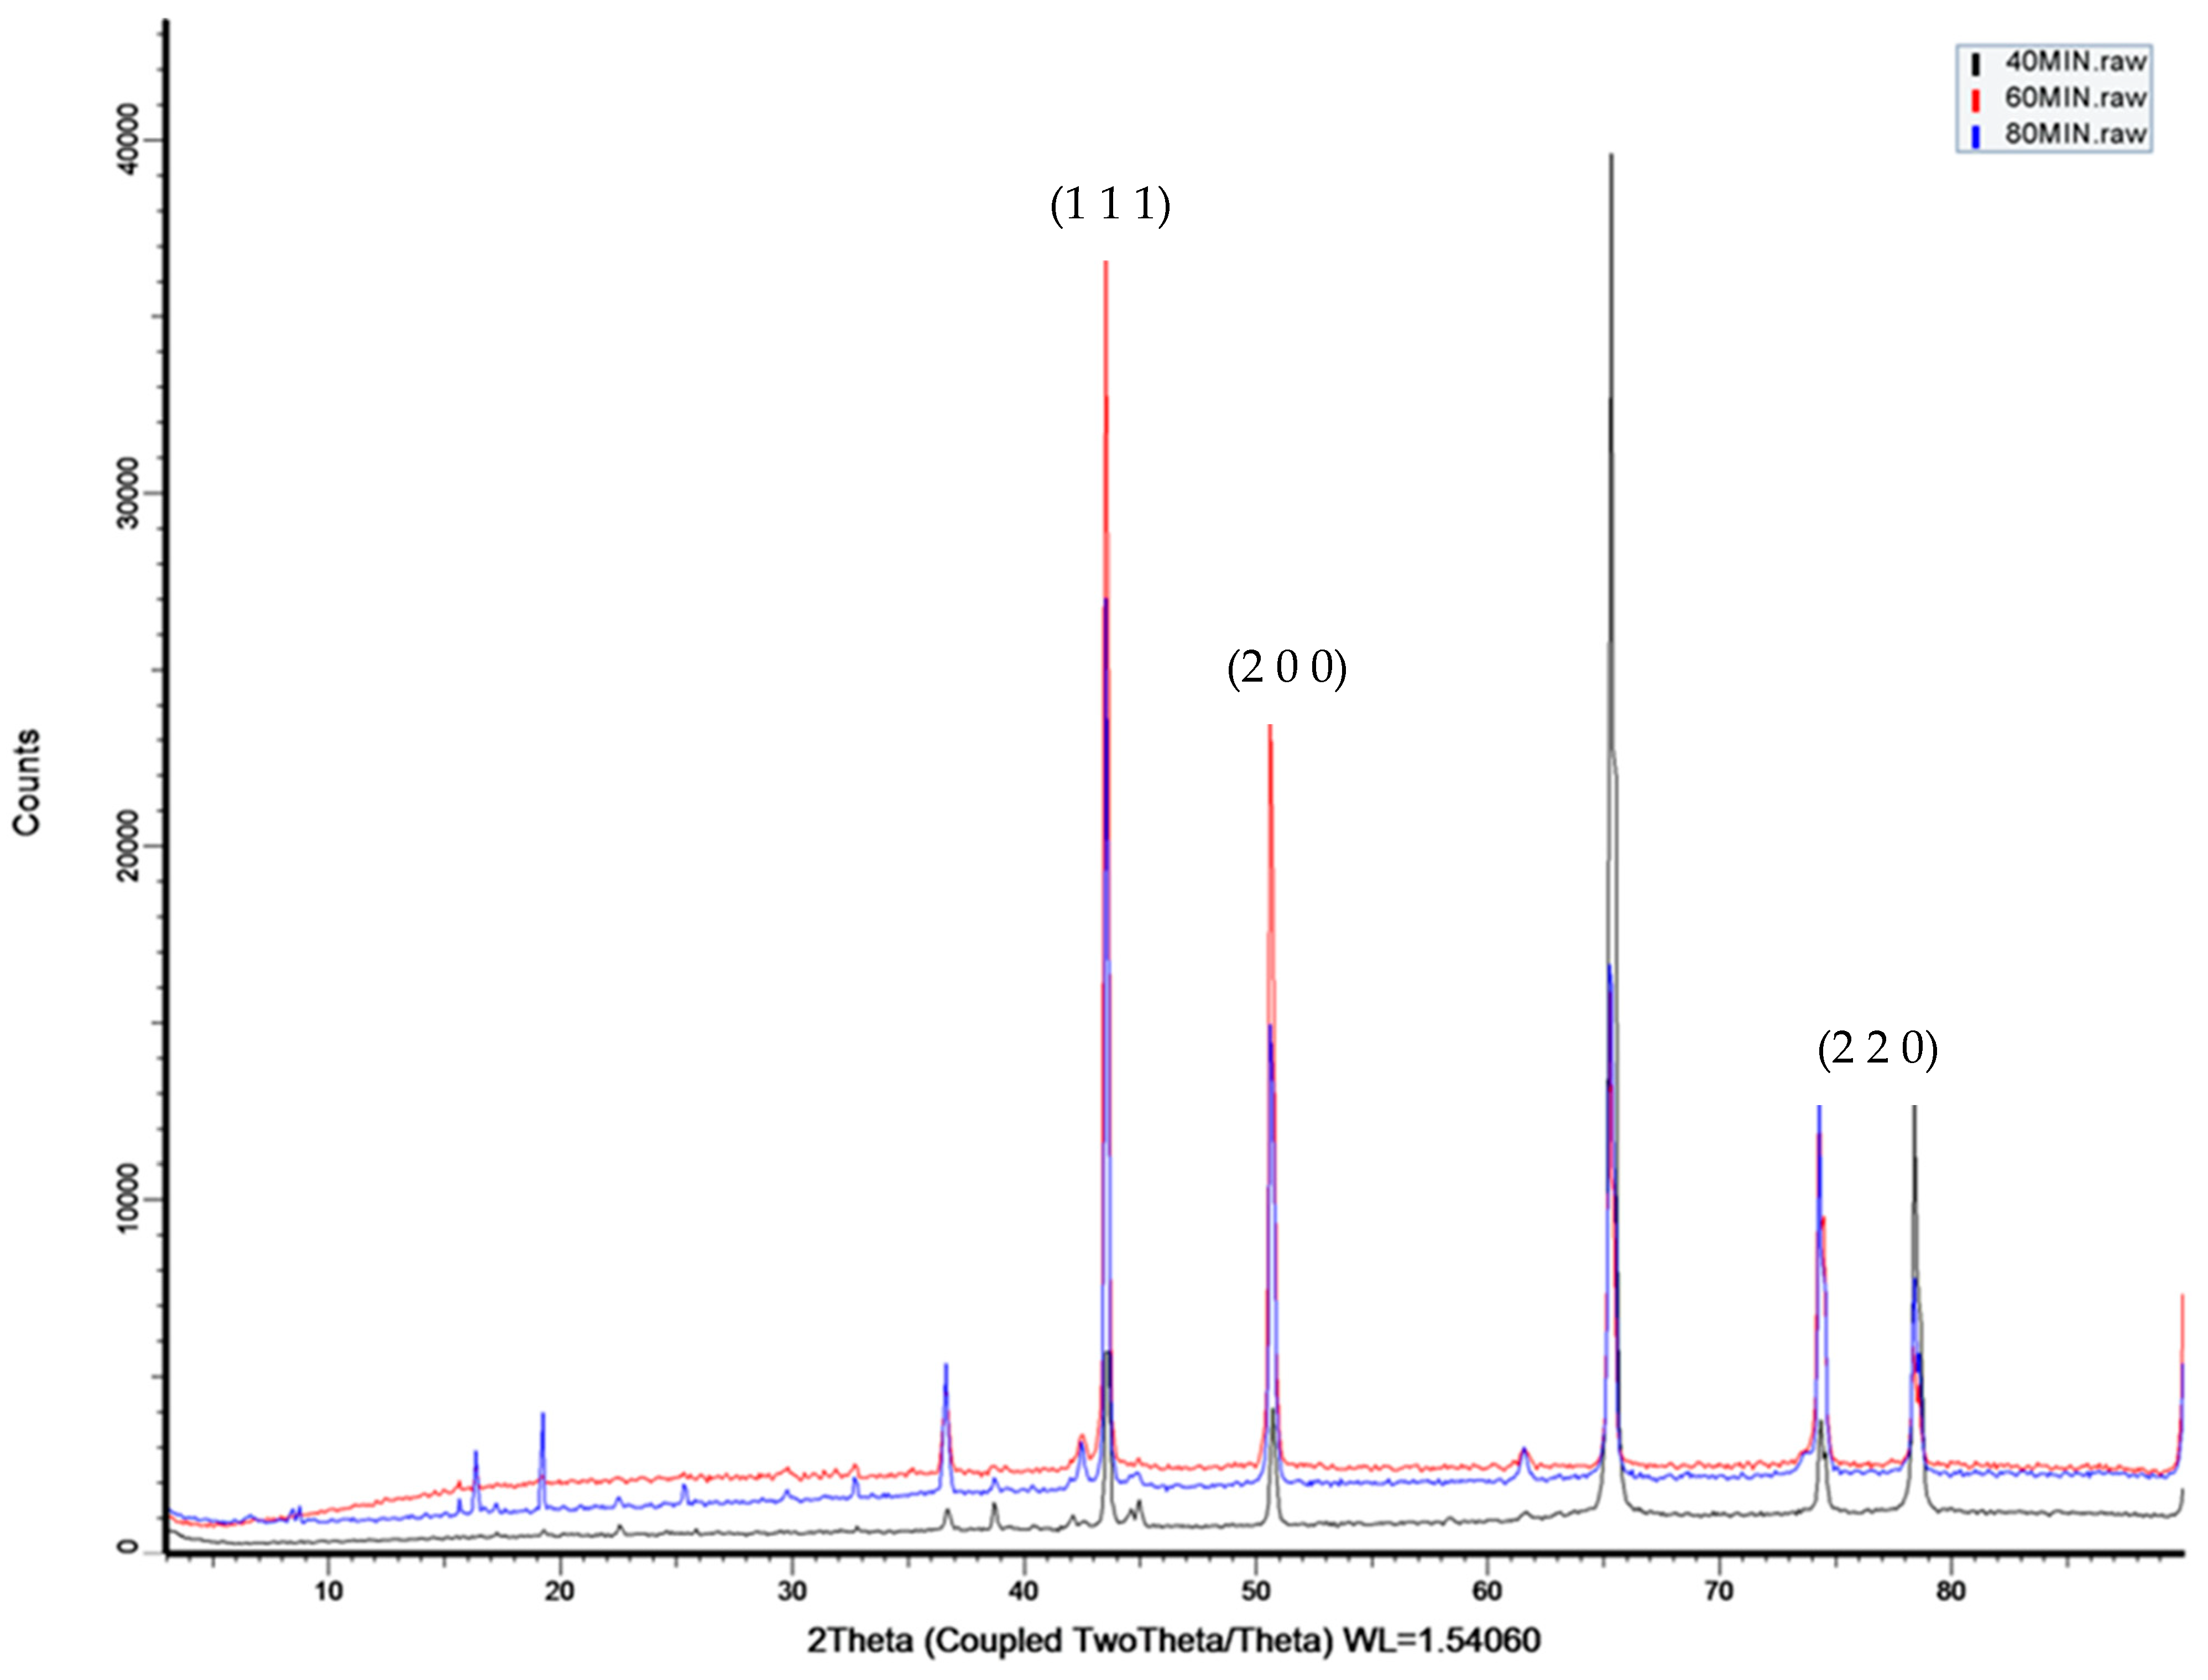
4.2. Evaluation of Integrity of the Phases and the Elemental Mixture

Energy-dispersive X-ray (EDX) is a technology that is utilized to analyze the constituent elements of the oxide layer that is produced. The presence of copper was confirmed by the energy-dispersive X-ray spectroscopy (EDX) analysis performed on the copper-electroplated AAO membrane. According to the findings, there was a larger concentration of copper on the surface, which was in agreement with the notion that the aluminum substate was electroplated with copper. Figure 10 illustrates the appearance of heightened peaks representing Cu L and O K, which are byproducts of the electroplating procedure that deposits copper onto an aluminum substrate. The experimental methodology, which included anodization in oxalic acid (C2H2O4) and chemical etching, which involved a solution combination including a particular concentration of H2SO4, was also responsible for the existence of C K and S K peaks. Hence, these peaks can be deemed insignificant [46] owing to their exceedingly small amount. As determined by energy-dispersive X-ray (EDX) analysis, the weight percentage (wt%) of the identified constituents in the AAO surface layer electroplated with copper is depicted in Figure 11.
Figure 11 shows the numerical data for the element distribution on an aluminum substrate. Our goal was to achieve a higher copper-to-AAO surface proportion once we had successfully electroplated copper onto AAO. The anodized sample that was electroplated for 40 min yielded a weight percentage of 72.70% copper and an atomic percentage of 40.26% copper. The anodized sample that was electroplated for 60 min yielded a weight percentage of 76.95% copper and an atomic percentage of 45.05% copper. By the end of the 80 min electroplating process, the anodized sample had a copper atomic percentage of 37.43% and a weight percentage of 69.13%. There would have been a higher copper accumulation if the structure had more pores. Because the pores were better in the 40 min and the 60 min samples than the 80 min sample, the copper atomic weight ratio was found to be higher.
The importance of X-ray diffraction in solid-state chemistry and materials science is widely acknowledged. X-ray diffraction (XRD) is a simple and accessible method for studying the structure and size of unit cells in different substances. The use of XRD to assess the nanoporous structure of the phase purity is detailed in Figure 12. Structure and phase properties were investigated with the help of an X-ray diffractometer (XRD, Rigaku Mini Flex 600). Using the peak locations as a guide, indexing determines the unit cell’s dimensions. To begin analyzing a diffraction pattern, one must first execute the preliminary step. Assigning Miller indices (h k l) to each peak is crucial for indexing a powder diffraction pattern. Peak location determination using unit cell dimensions and wavelength is unfortunately not a simple reverse operation [47].
The abbreviation JCPDS stands for the Joint Committee on Powder Diffraction Standards. The organization is currently referred to as the International Centre for Diffraction Data (ICDD). Their database has data pertaining to crystal structures, as well as X-ray and neutron powder diffraction patterns, together with associated materials.
The JCPDS database was chosen due to its extensive compilation of powder diffraction data, making it a valuable asset for researchers and scientists investigating the structures of crystalline materials. It offers crucial data for analyzing and identifying different compounds by examining their diffraction patterns.
As can be seen in Figure 12, the X-ray diffraction (XRD) pattern of the copper-deposited AAO material closely matched with the XRD pattern of pure copper, which was recorded in the JCPDS database with the reference number 003-1018. Additionally, there was a direct correlation between the results and the previously published research [48].

4.3. Technical Analysis

Power per unit area, or solar intensity, is the quantity of energy that the Sun radiates at wavelengths that are measured by the measuring device. Watts per square meter (W/m2) is the SI unit of measurement for solar irradiation. Ambient temperature refers to the temperature of the surrounding air at the location of the device. Figure 13 and Figure 14 reflect the visual representations of how the sun intensity and ambient temperature change throughout the day. A pyranometer equipped with a Hukseflux thermal sensor was used to detect the ambient temperature and solar radiation intensity. This sensor provides accurate readings in hours. On the first day of the solar desalination procedure, the sample underwent varying conditions. The solar intensity at 9 a.m. was 460.12 W/m2, and the ambient temperature was 29.55 °C. By 1 p.m., the solar irradiance reached a level of 820.71 W/m2, and the temperature climbed to 36.15 °C. At 5 p.m., the sun intensity was reduced to 240.44 W/m2, and the temperature fell to 32.71 °C. On the second day, the solar desalination process encountered fluctuations in both sunlight intensity and ambient temperature. The sun intensity at 9 a.m. was 490.84 W/m2, while the ambient temperature was 29.84 °C. At 1 p.m., the solar irradiance reached a level of 850.55 W/m2, and the surrounding temperature rose to 37.94 °C. At 5 p.m., the sun intensity was reduced to 290.12 W/m2, and the ambient temperature dropped to 32.77 °C. On the third day, the solar desalination process again encountered fluctuations in solar radiation and ambient temperature. The solar intensity at 9 a.m. was measured as 450.86 W/m2, while the ambient temperature was recorded as 29.36 °C. By 1 p.m., the solar irradiance surged to 810.78 W/m2 as the ambient temperature climbed to 35.55 °C. At 5 p.m., the solar irradiance reduced to 224.34 W/m2, and the surrounding temperature was 31.57 °C.
Solar desalination, which uses the Sun’s rays to evaporate water, lessens our reliance on non-renewable energy sources and their associated emissions of greenhouse gases. Three distinct samples were subjected to copper deposition, namely, samples that were anodized for durations of 40 min, 60 min, and 80 min. The copper electrodeposited samples were utilized in solar desalination, with each sample being used on a daily basis. The water that was converted into vapor was taken from an outlet pipe connected to the distillation apparatus and was then accumulated in a container. Two METTLER TOLEDO precision mass balances were employed to quantify the collected volumes of desalinated water for each plate on an hourly basis. Figure 15 shows the cumulative and hourly yields of the conventional and modified stills following solar desalination with copper electrodeposited samples. From the cumulative and hourly yield graph it can be noted that, on day 1 (D1), the still holding copper sample (modified), i.e., copper which was deposited on the 40 min (40 M) anodized sample, has 14.28% higher evaporation than the conventional still (Conv). On day 2 (D2), still holding copper sample (modified), i.e., copper which was deposited on the 60 min (60 M) anodized sample, has 22.22% higher evaporation than the conventional still (Conv). On day 3 (D3), the still holding copper sample (modified), i.e., copper which was deposited on the 80 min (80M) anodized sample, has 11.11% higher evaporation than the conventional still (Conv). When comparing the modified still to the conventional still over the course of three distinct days, it was observed that the evaporation rate of the modified still reached its highest point at about 1:00 pm, surpassing that of the conventional still. When comparing the three samples, the sample that was anodized for 60 min and then subjected to copper deposition exhibited a larger percentage of evaporation than the other two samples that were anodized for 40 and 80 min, respectively. The increased evaporation was a result of the porous structure achieved during anodization, as well as the effective and widespread deposition of copper within these pores. Throughout the experiments, it was found that the modified still produced more air bubbles. As they rose from the bottom to the top, the air bubbles traveled in a predictable path, eventually producing water vapor.
At the first light, at about 9:00 in the morning, the solar still was completely inefficient. The efficiency rose gradually throughout the day, reaching a maximum at about 1:00 pm. The efficiency started to decline after that. A comparison of the modified solar still’s and the traditional solar still’s efficiency on each of the three days (days 1, 2, and 3) is shown in Figure 16. Solar stills that were enhanced by copper electrodeposition on anodized samples for 40, 60, or 80 min outperformed standard solar stills that did not contain any structures. Anodizing for 60 min followed by copper deposition resulted in a more efficient sample when compared to the other two samples (anodized for 40 and 80 min, respectively). The 60 min anodized sample exhibited a more porous structure compared to the other two samples. As a result, it can be deduced that the copper deposition enhances effectiveness, leading to an improved desalination efficiency.
There are a number of aspects that should be taken into account when choosing between traditional and modified evaporators. These factors include the specific application, the resources that are available, environmental concerns, and financial parameters. Enhanced energy efficiency and reduced environmental impact are typically provided by modified evaporators, in contrast to conventional evaporators, which may offer simplicity and lower initial costs. The selection should be made by a thorough evaluation of the specific requirements and priorities of the given industrial or commercial operation. Furthermore, a continuous progress in technology may further obscure the distinctions between conventional and modified evaporators, as innovators strive to integrate the most favorable characteristics of both.
The daily thermal efficiency of a solar still is determined using the following calculation:
η still = M w × L I × A × 3600
The efficiency can be calculated using the given equation [49].

5. Assessment of Water Quality

The water quality assessment of the CSS and MSS was conducted before and after desalination, taking into account the groundwater. This evaluation aims to ensure that the distillate output water meets the permitted parameters set by the Bureau of Indian Standards (BIS) and the World Health Organization (WHO). The water quality testing was carried out at the Environmental Engineering Laboratory, VNRVJIET, Hyderabad, India, and the data are listed in Table 1.
The initial pH of the groundwater was 8.2 and was subsequently reduced to 7.4 for the CSS and 7.2 for the MSS. The initial concentration of total dissolved solids (TDS) in the groundwater was 450 parts per million (ppm). However, after the process of desalination, the TDS levels significantly decreased to 25 ppm for CSS and 17 ppm for MSS. The TDS levels of MSS showed a significant decrease of 96% compared to the groundwater. The groundwater had a hardness value of 315 mg/L, while the CSS and MSS had hardness values of 165 mg/L and 130 mg/L, respectively. The concentration of fluoride ions in the groundwater was measured to be 0.6 mg/L. After desalination, the concentration of fluoride ions decreased to 0.40 mg/L and 0.34 mg/L for the CSS and MSS, respectively. The water quality criteria for the CSS and MSS samples were all within the permitted limits set by BIS and WHO in India [50,51].

6. Conclusions

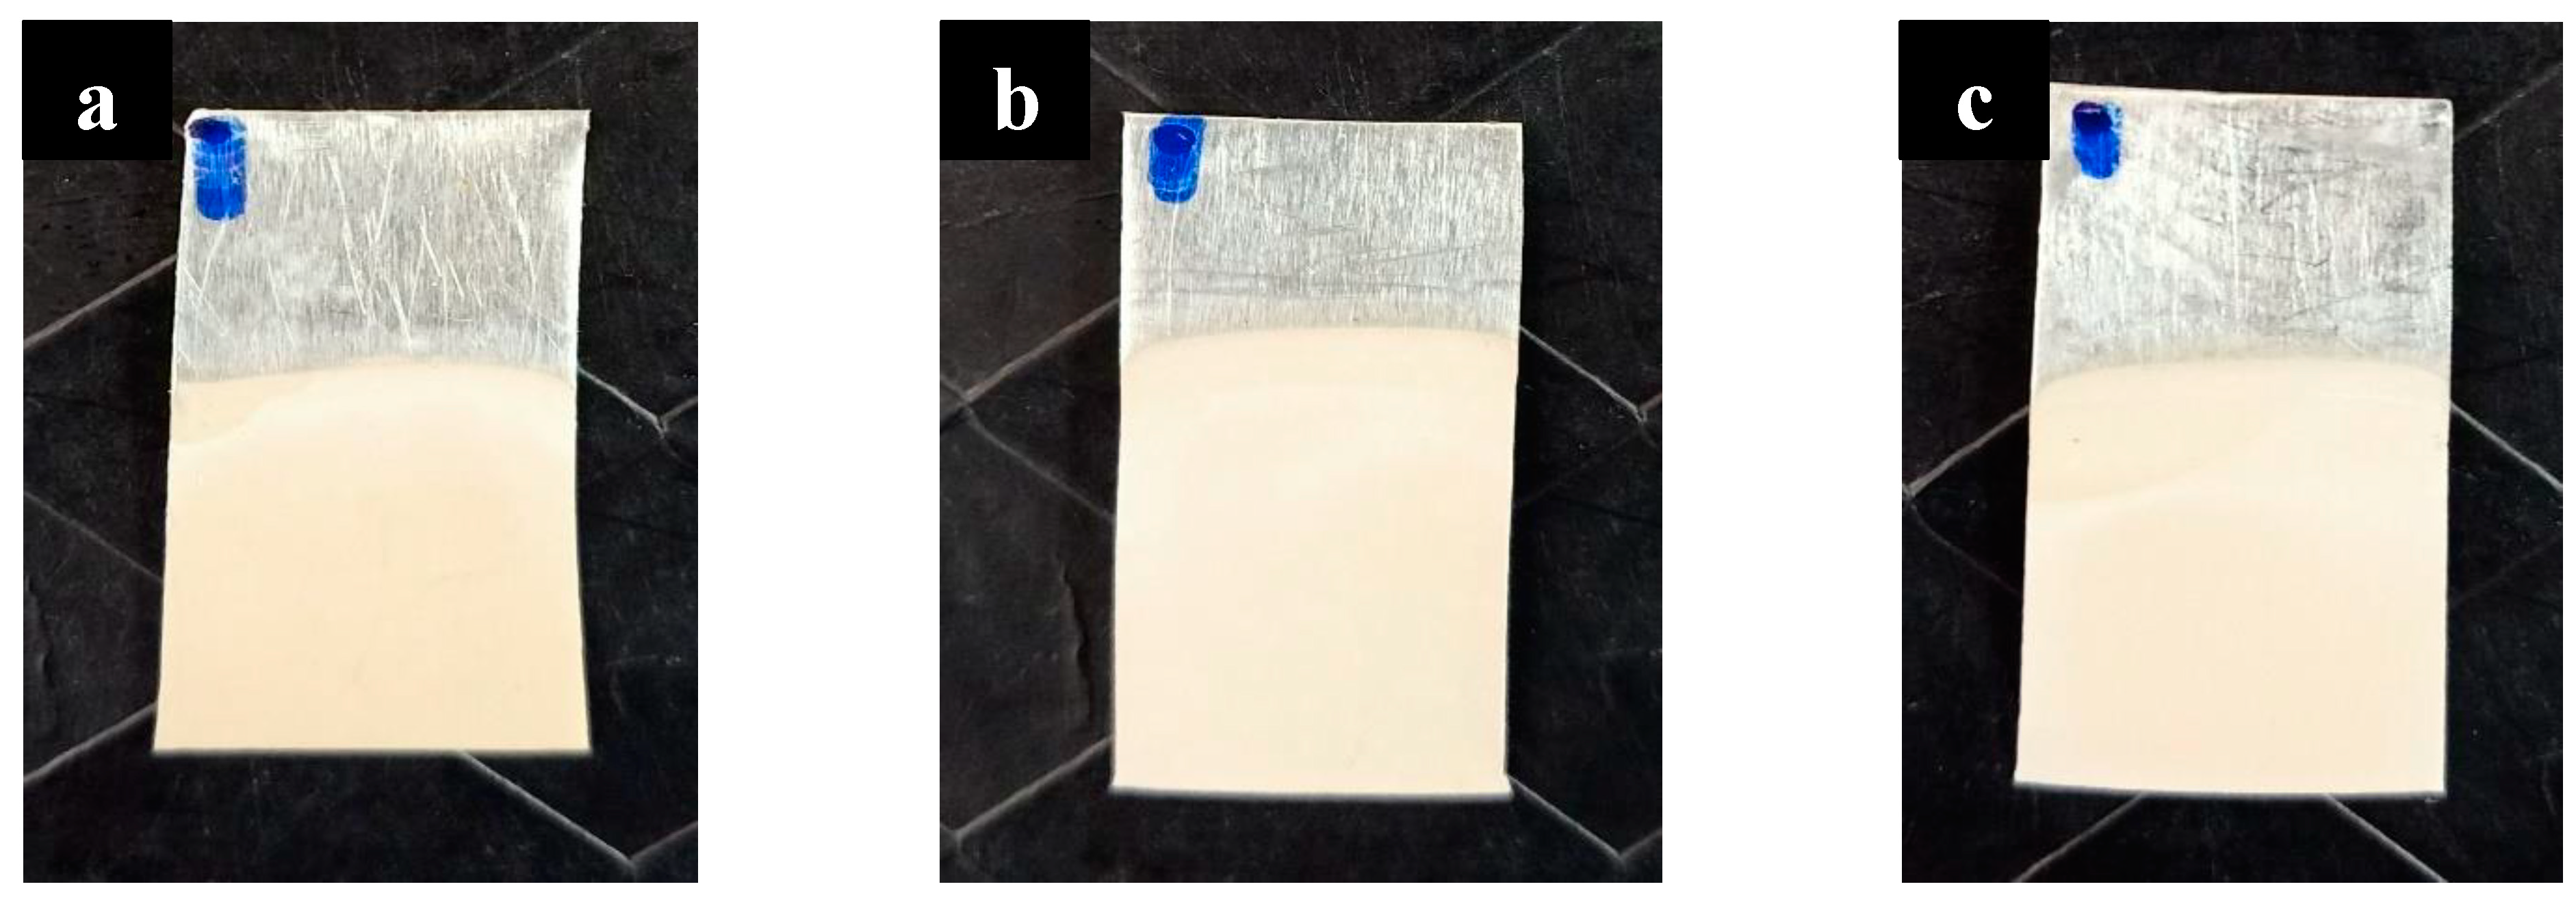
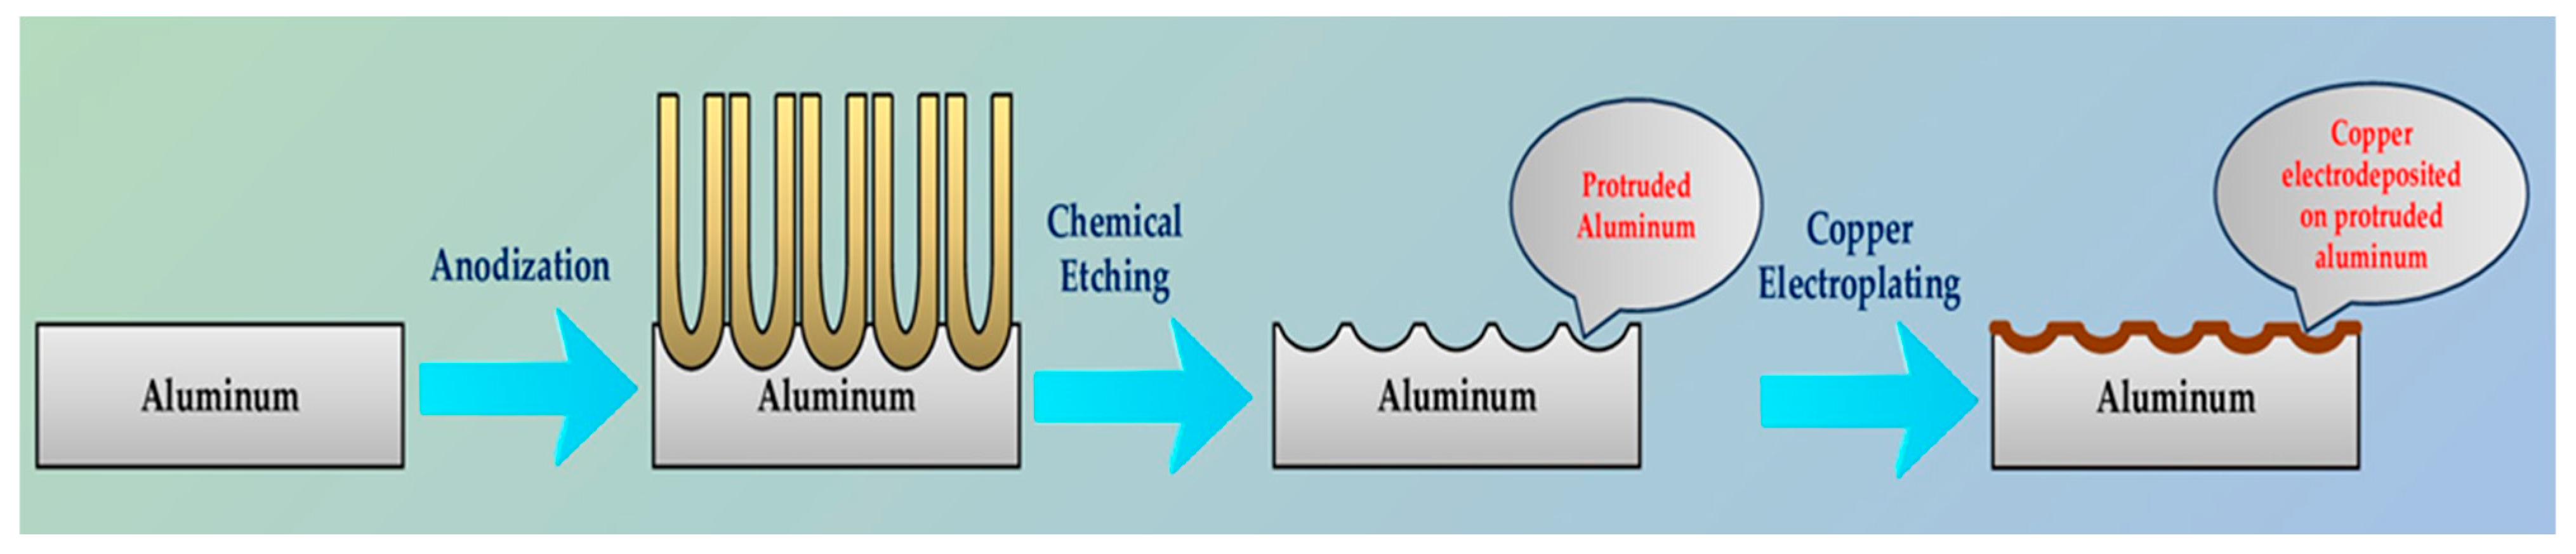
For this study, we employed the anodization approach, a feasible and uncomplicated method for producing a nanoporous structure. The anodization process was carried out using oxalic acid at room temperature and a fixed voltage of 40 V. To generate three distinct nanoporous structures, we utilized three anodization periods of 40 min, 60 min, and 80 min.
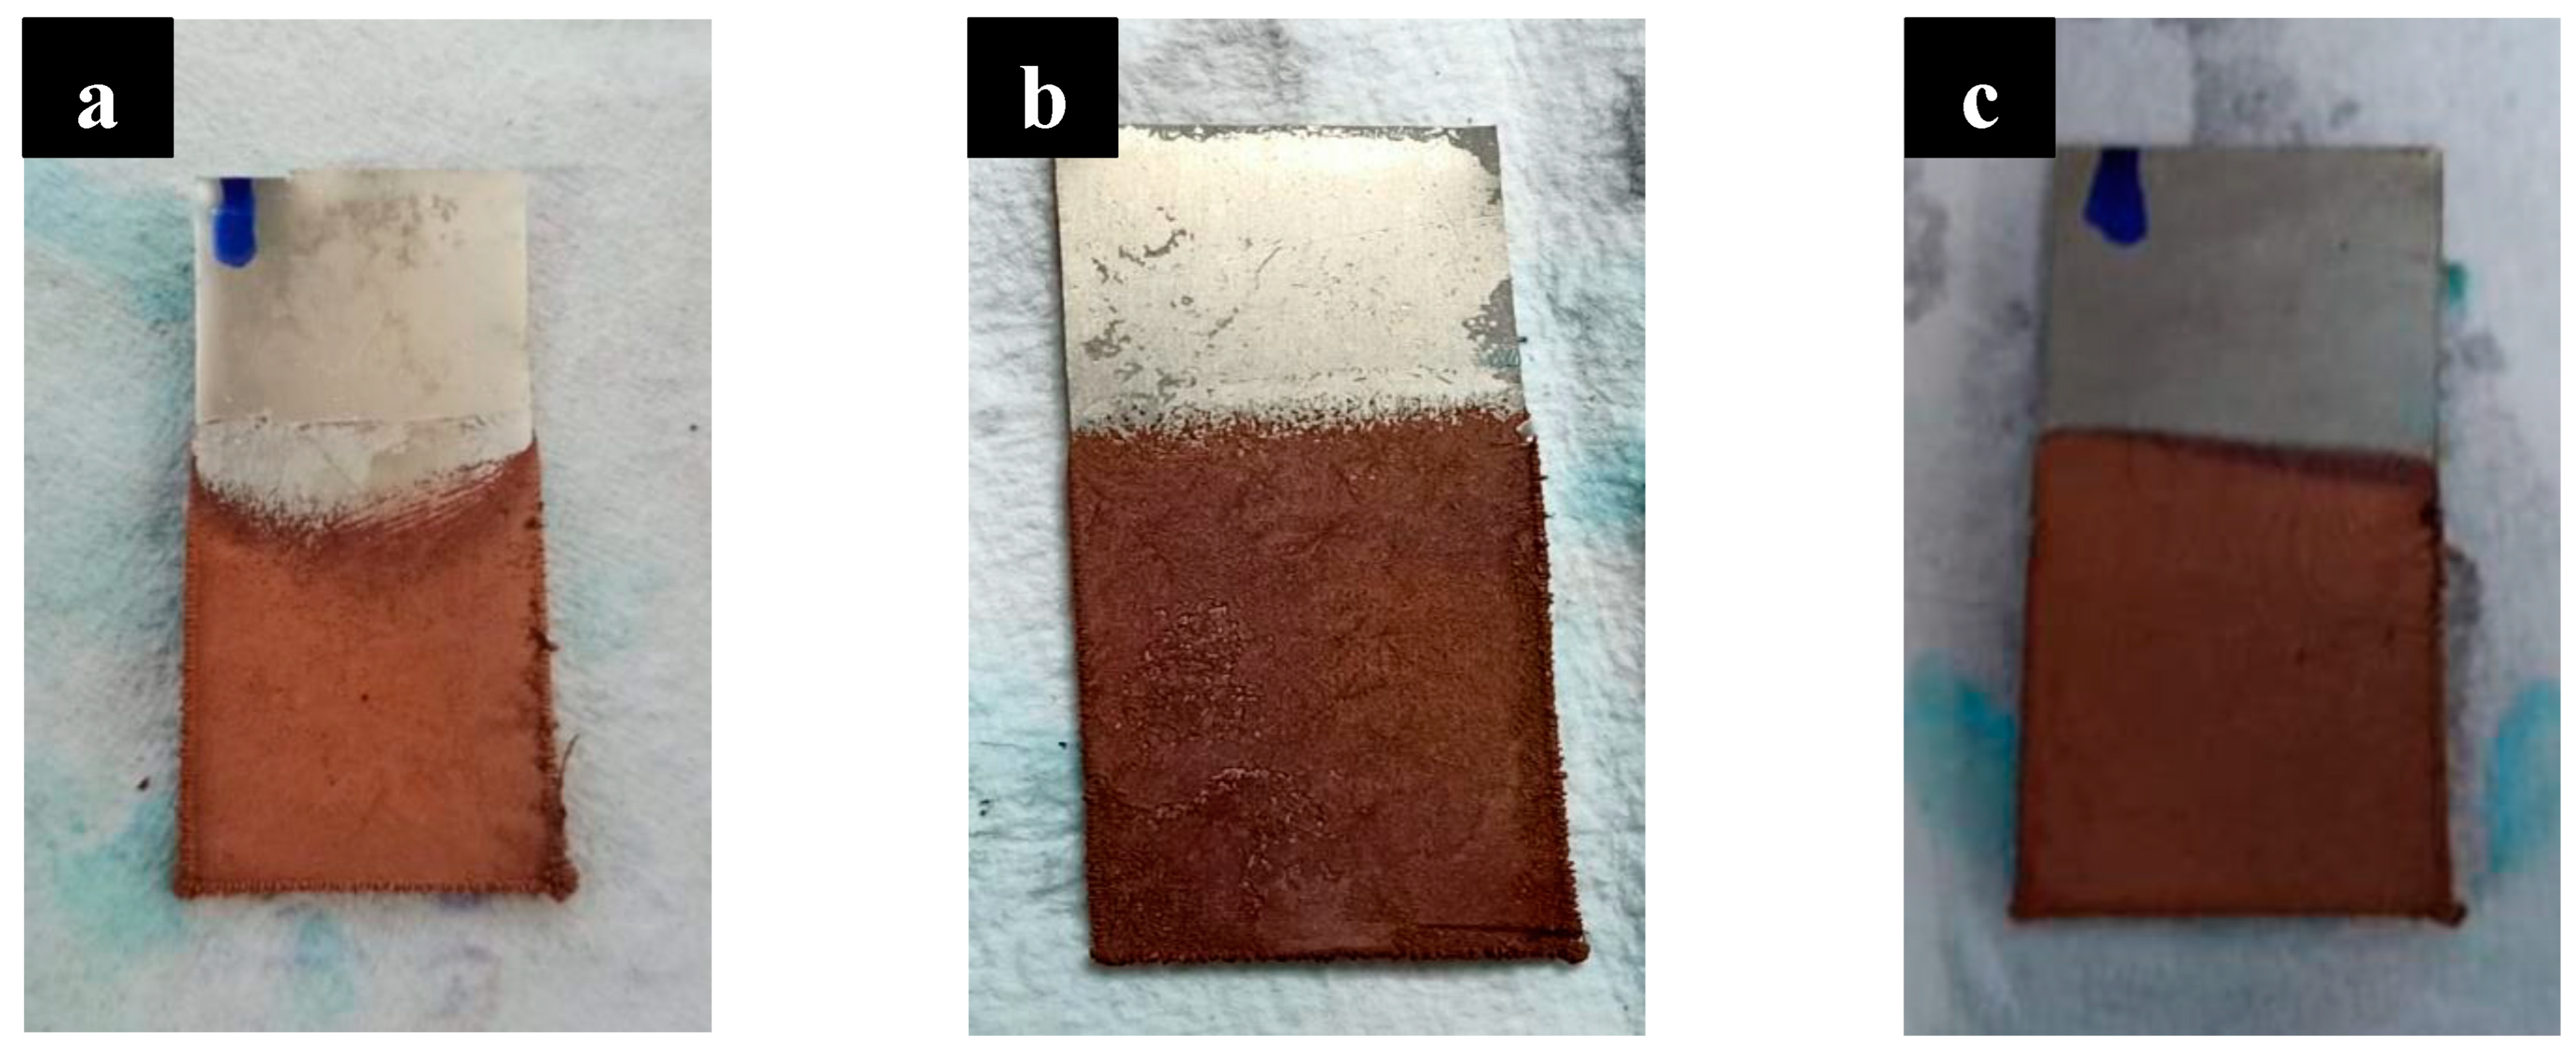
To deposit copper onto the nanoporous structure, the samples underwent chemical etching to remove the oxide layer. Following this, copper electroplating was carried out on the three samples for a duration of 30 min.
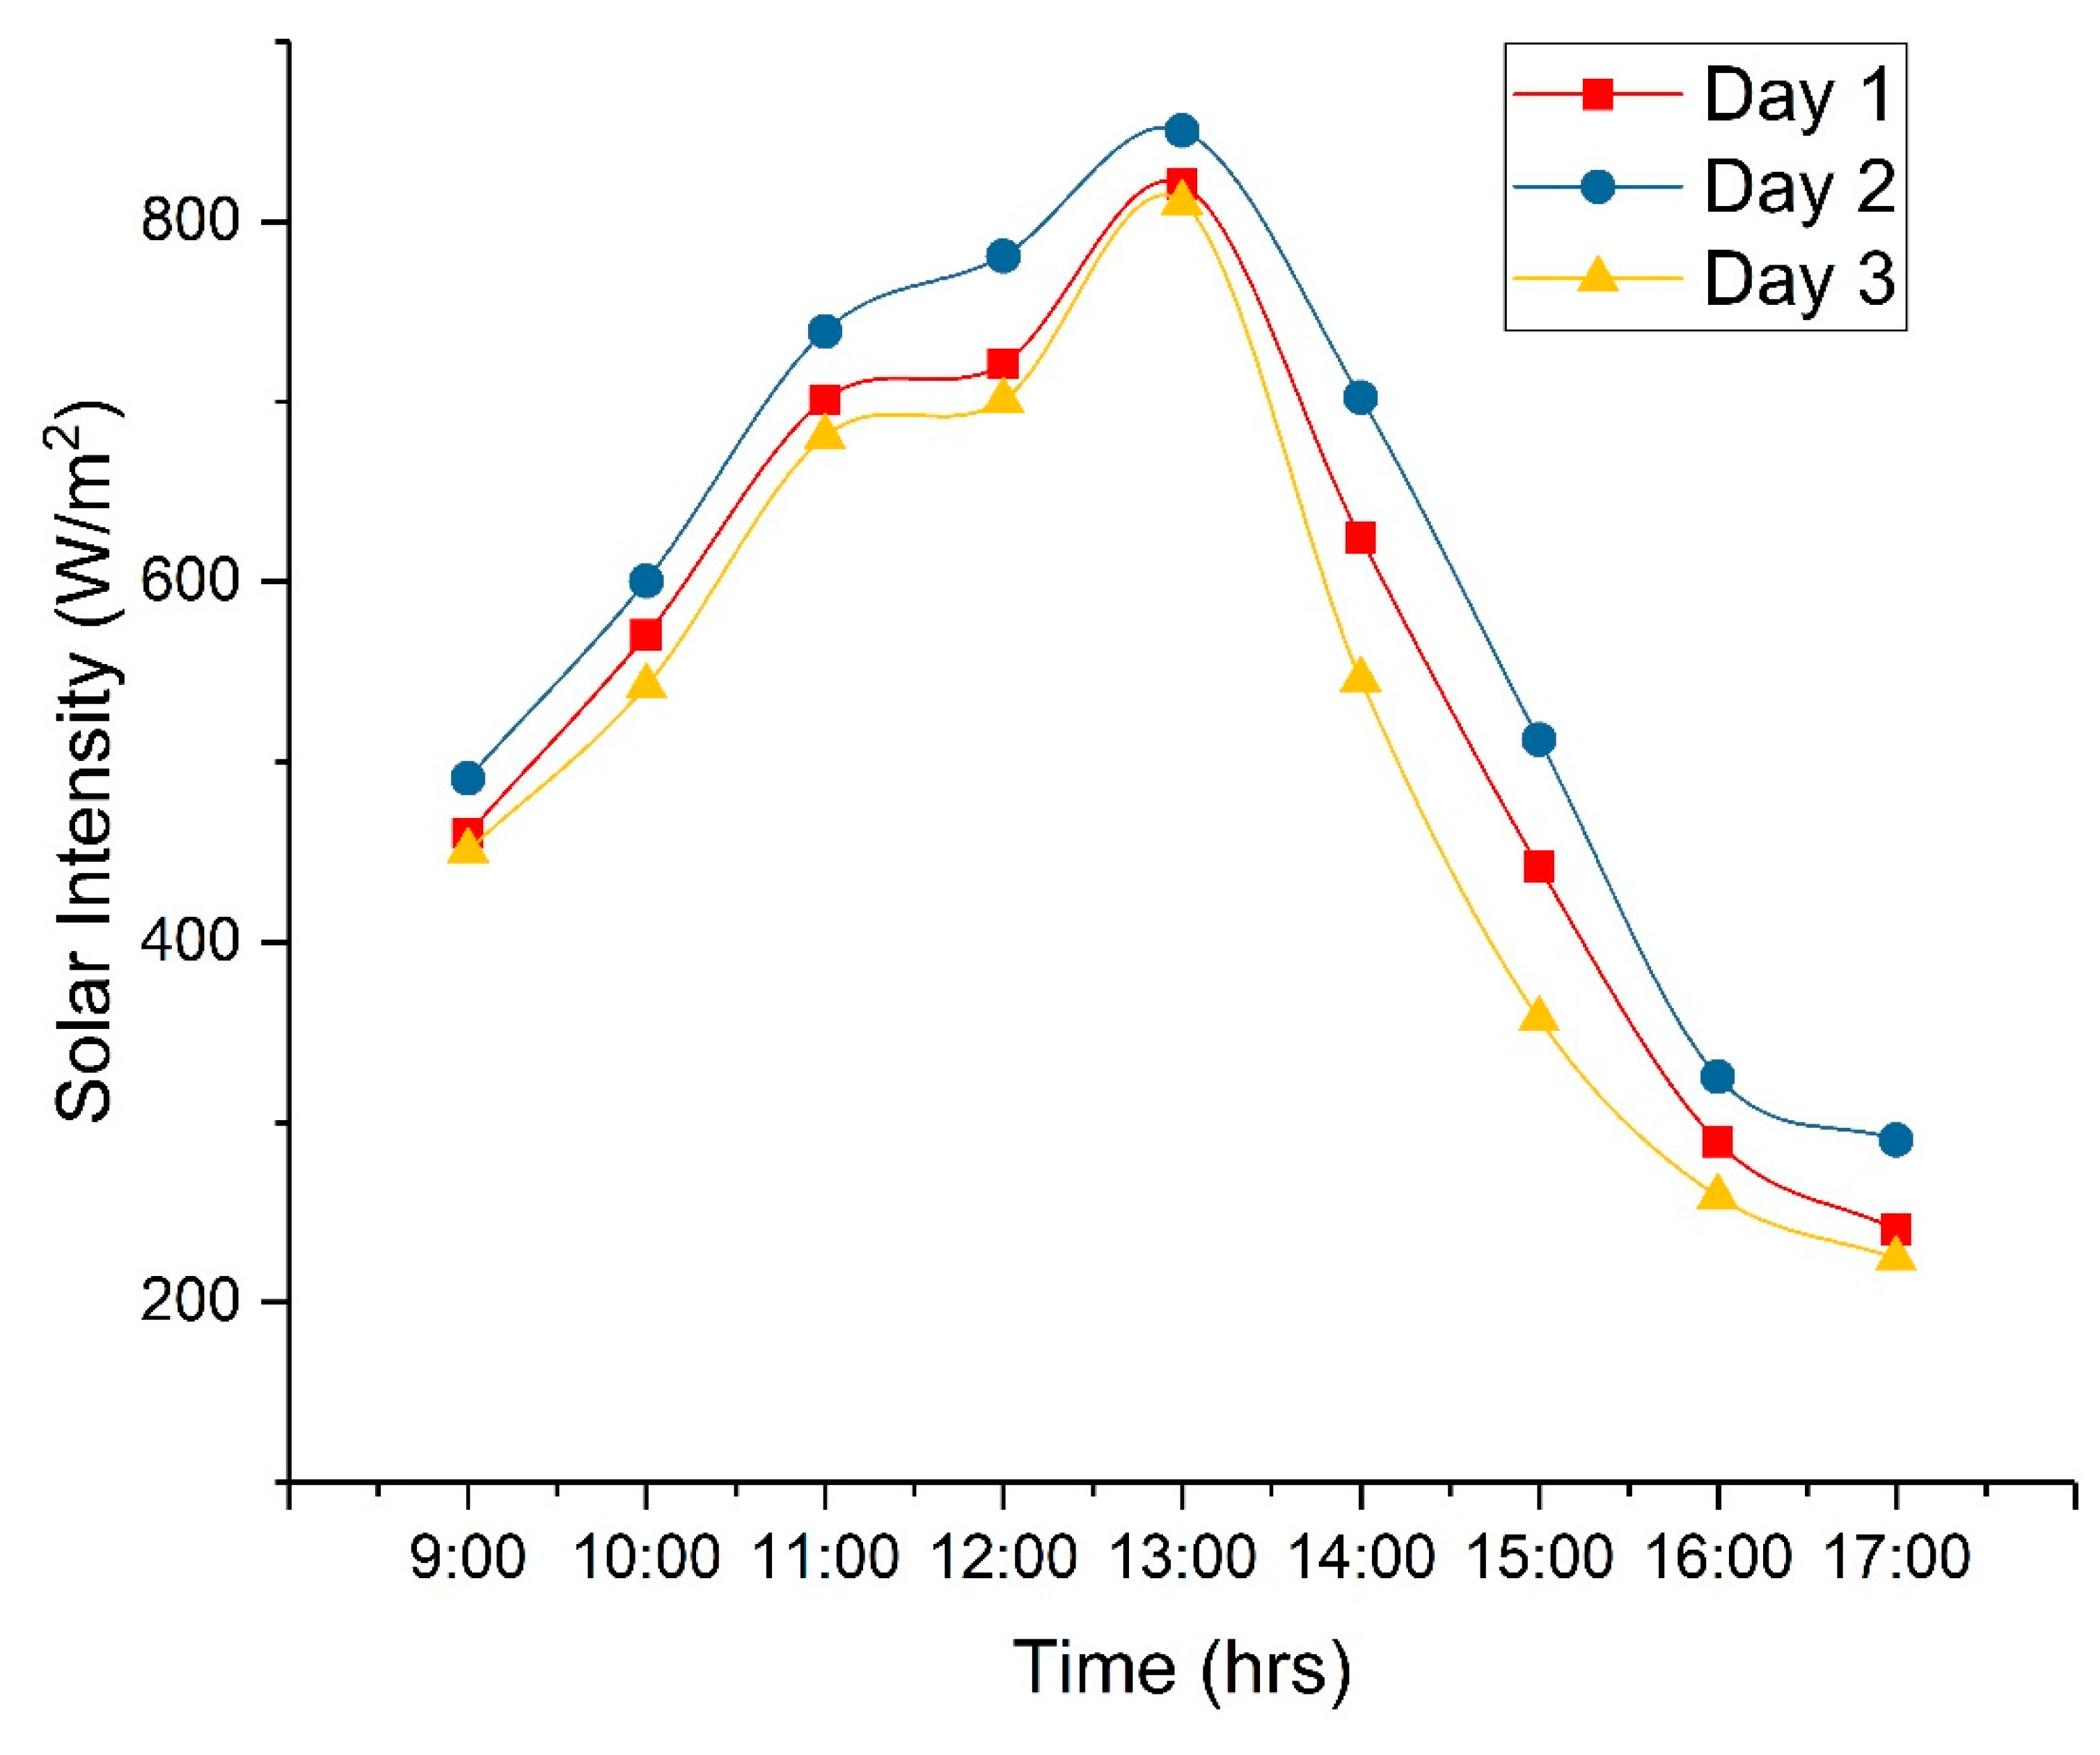
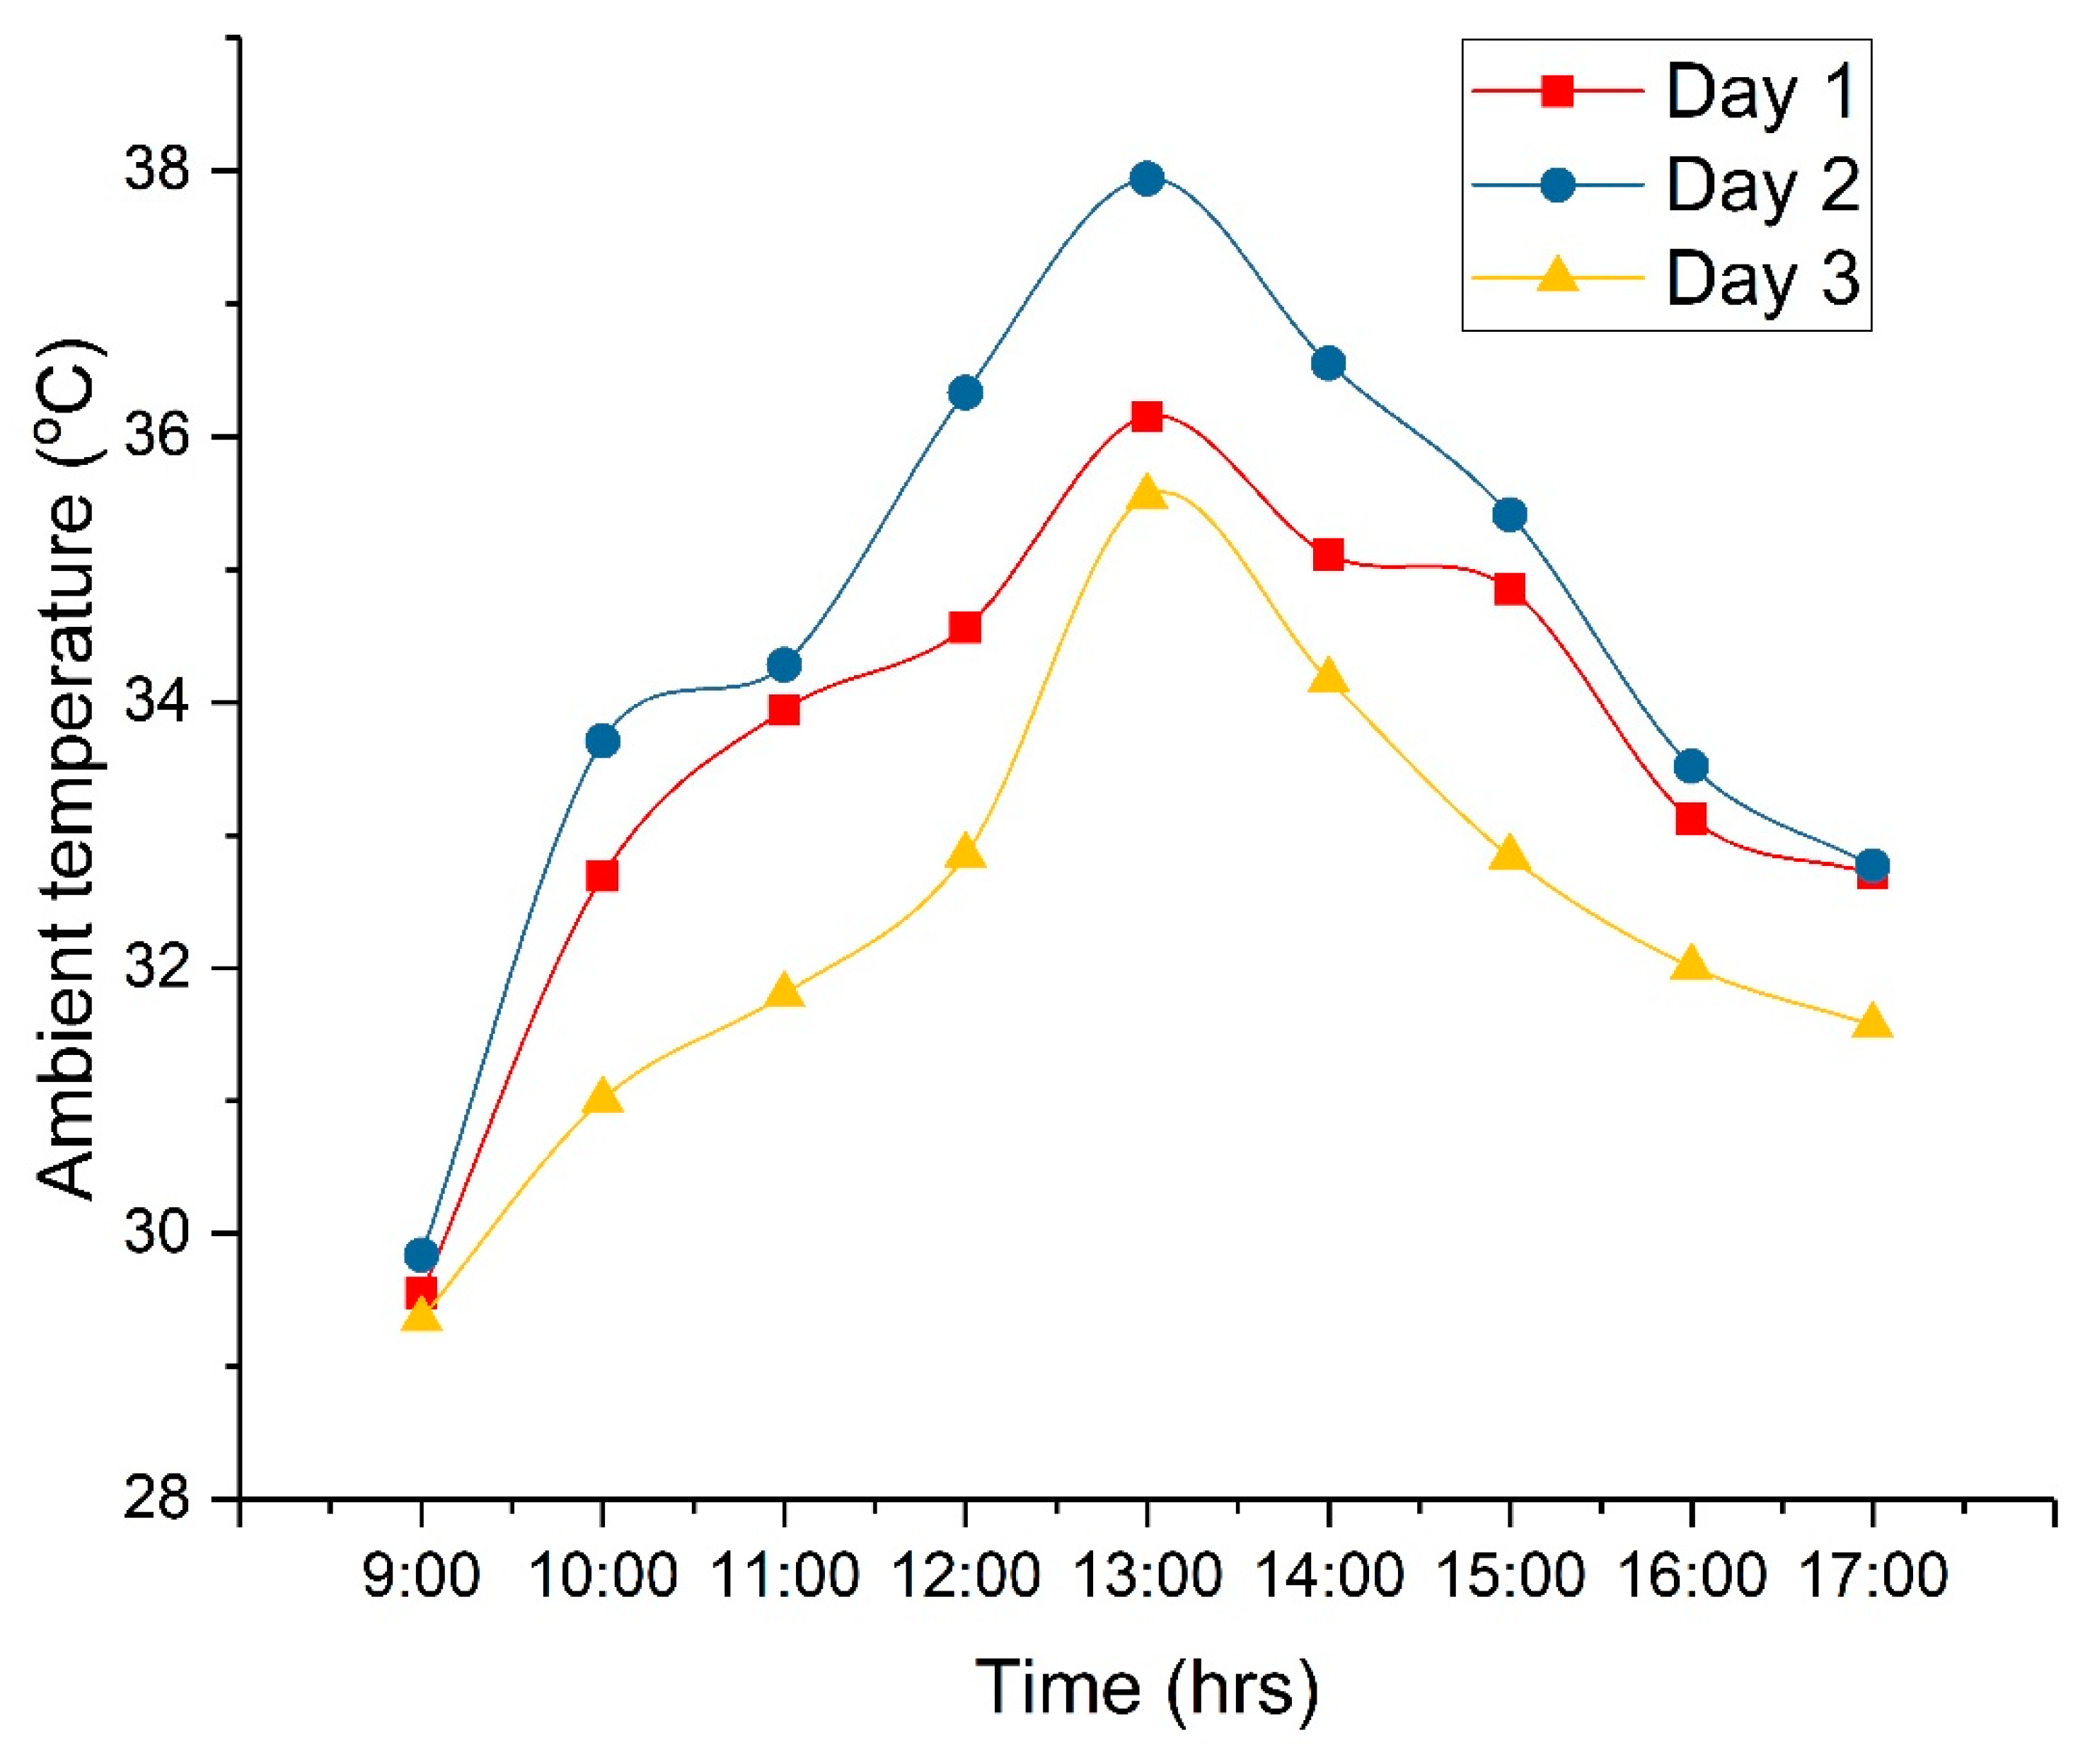
On three separate days, three distinct copper-electroplated samples were utilized in the process of solar desalination.
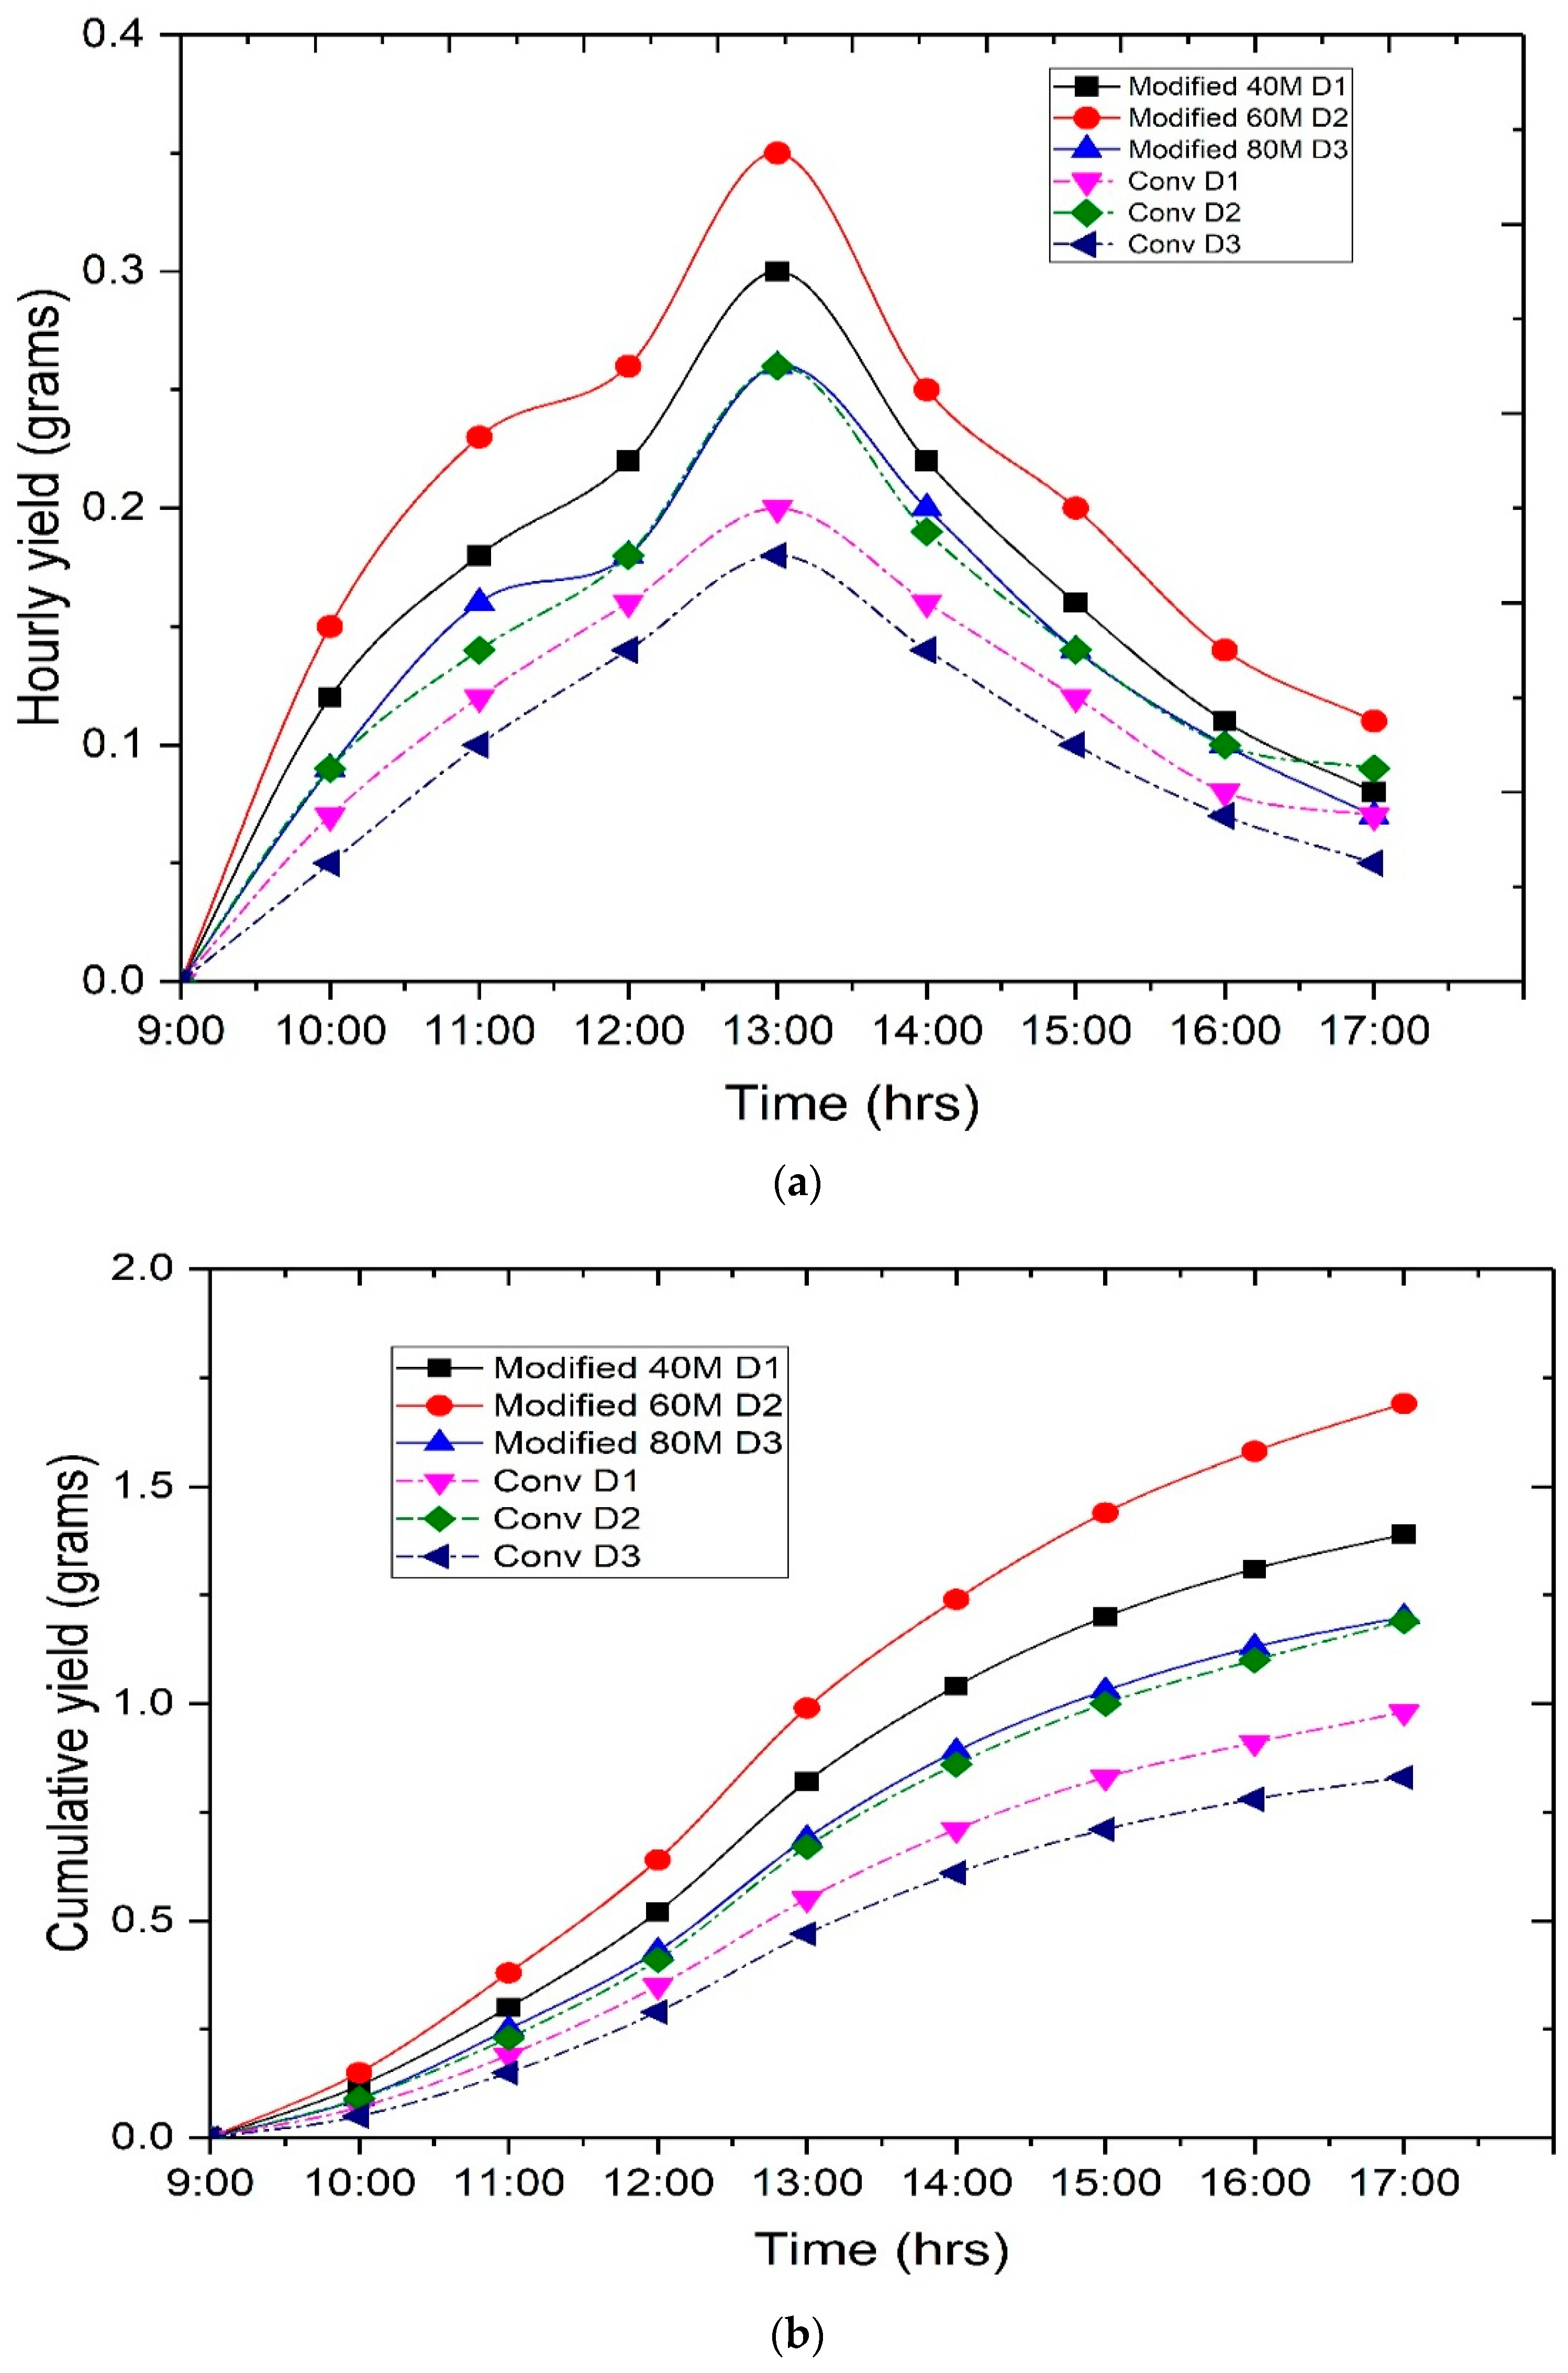
On the first day, the copper sample, specifically the copper deposited on the 40 min anodized sample, exhibited a 14.28% faster rate of evaporation compared to the conventional still. On the second day, the copper sample, specifically the copper deposited on the 60 min anodized sample, had an evaporation rate that is 22.22% higher than the conventional still. On the third day, the copper sample, specifically the copper deposited on the 80 min anodized sample, had an evaporation rate that is 11.11% higher than the evaporation rate of the conventional still.
Upon analyzing the three samples, it was seen that the sample which underwent anodization for 60 min followed by copper deposition displayed a higher percentage of evaporation compared to the other two samples anodized for 40 and 80 min, respectively.
The enhanced evaporation was a consequence of the porous structure attained during anodization, along with the efficient and extensive deposition of copper within these pores. The initial pH of the groundwater was 8.2, which was subsequently reduced to 7.4 for the CSS and 7.2 for the MSS. The initial concentration of total dissolved solids (TDS) in the groundwater was 450 parts per million (ppm). However, after undergoing the desalination process, the TDS levels were significantly decreased and dropped within the permitted limits set by the World Health Organization (WHO) and the Bureau of Indian Standards (BIS).

Author Contributions

Conceptualization, A.K.K., Y.P.K. and V.S.S.; methodology, A.K.K., Y.P.K. and V.S.S.; software, A.K.K. and Y.P.K.; validation, A.K.K., Y.P.K. and V.S.S.; formal analysis, A.K.K., Y.P.K. and V.S.S.; investigation, A.K.K. and Y.P.K.; resources, A.K.K.; data curation, A.K.K.; writing—original draft preparation, A.K.K. and Y.P.K.; writing—review and editing, V.S.S.; visualization, A.K.K. and V.S.S.; supervision, V.S.S.; funding acquisition, A.K.K. All authors have read and agreed to the published version of the manuscript.

Funding

A. K. Kaviti, would acknowledge the funding from the Department of Science & Technology, Government of India with sanction no: DST/TMD/EWO/WTI/2K19/EWFH/2019/25 and VNR VJIET for providing the necessary resources to carry out the investigations efficiently.

Institutional Review Board Statement

Not applicable.

Informed Consent Statement

Not applicable.

Data Availability Statement

Data are contained within the article.

Conflicts of Interest

The authors declare no conflicts of interest.

References

  1. Boretti, A.; Rosa, L. Reassessing the Projections of the World Water Development Report. npj Clean Water 2019, 2, 15. [Google Scholar] [CrossRef]
  2. Chen, L.; Wang, H.; Kuravi, S.; Kota, K.; Park, Y.H.; Xu, P. Low-Cost and Reusable Carbon Black Based Solar Evaporator for Effective Water Desalination. Desalination 2020, 483, 114412. [Google Scholar] [CrossRef]
  3. Wang, X.; Ou, G.; Wang, N.; Wu, H. Graphene-Based Recyclable Photo-Absorbers for High-Efficiency Seawater Desalination. ACS Appl. Mater. Interfaces 2016, 8, 9194–9199. [Google Scholar] [CrossRef]
  4. Feng, Y.; Yin, J.; Liu, S.; Wang, Y.; Li, B.; Jiao, T. Facile Synthesis of Ag/Pd Nanoparticle—Loaded Poly(Ethylene Imine) Composite Hydrogels with Highly Efficient Catalytic Reduction of 4-Nitrophenol. ACS Omega 2020, 5, 3725–3733. [Google Scholar] [CrossRef]
  5. Chen, C.; Kuang, Y.; Hu, L. Challenges and Opportunities for Solar Evaporation. Joule 2019, 3, 683–718. [Google Scholar] [CrossRef]
  6. Zhu, L.; Gao, M.; Peh, C.K.N.; Ho, G.W. Recent Progress in Solar-Driven Interfacial Water Evaporation: Advanced Designs and Applications. Nano Energy 2019, 57, 507–518. [Google Scholar] [CrossRef]
  7. Tao, P.; Ni, G.; Song, C.; Shang, W.; Wu, J.; Zhu, J.; Chen, G.; Deng, T. Solar-Driven Interfacial Evaporation. Nat. Energy 2018, 3, 1031–1041. [Google Scholar] [CrossRef]
  8. Huang, L.; Jiang, H.; Wang, Y.; Ouyang, Z.; Wang, W.; Yang, B.; Liu, H.; Hu, X. Enhanced Water Yield of Solar Desalination by Thermal Concentrated Multistage Distiller. Desalination 2020, 477, 114260. [Google Scholar] [CrossRef]
  9. Ni, G.; Miljkovic, N.; Ghasemi, H.; Huang, X.; Boriskina, S.V.; Lin, C.T.; Wang, J.; Xu, Y.; Rahman, M.M.; Zhang, T.J.; et al. Volumetric Solar Heating of Nanofluids for Direct Vapor Generation. Nano Energy 2015, 17, 290–301. [Google Scholar] [CrossRef]
  10. He, S.; Chen, C.; Kuang, Y.; Mi, R.; Liu, Y.; Pei, Y.; Kong, W.; Gan, W.; Xie, H.; Hitz, E.; et al. Nature-Inspired Salt Resistant Bimodal Porous Solar Evaporator for Efficient and Stable Water Desalination. Energy Environ. Sci. 2019, 12, 1558–1567. [Google Scholar] [CrossRef]
  11. Zhu, M.; Li, Y.; Chen, F.; Zhu, X.; Dai, J.; Li, Y.; Yang, Z.; Yan, X.; Song, J.; Wang, Y.; et al. Plasmonic Wood for High-Efficiency Solar Steam Generation. Adv. Energy Mater. 2018, 8, 1–7. [Google Scholar] [CrossRef]
  12. Geng, L.; Li, L.; Zhang, H.; Zhong, M.; Mu, P.; Li, J. Interfacial Solar Evaporator Synergistic Phase Change Energy Storage for All-Day Steam Generation. J. Mater. Chem. A 2022, 10, 15485–15496. [Google Scholar] [CrossRef]
  13. Guo, Y.; Zhao, F.; Zhou, X.; Chen, Z.; Yu, G. Tailoring Nanoscale Surface Topography of Hydrogel for Efficient Solar Vapor Generation. Nano Lett. 2019, 19, 2530–2536. [Google Scholar] [CrossRef]
  14. Li, Y.; Gao, T.; Yang, Z.; Chen, C.; Kuang, Y.; Song, J.; Jia, C.; Hitz, E.M.; Yang, B.; Hu, L. Graphene Oxide-Based Evaporator with One-Dimensional Water Transport Enabling High-Efficiency Solar Desalination. Nano Energy 2017, 41, 201–209. [Google Scholar] [CrossRef]
  15. Huang, L.; Pei, J.; Jiang, H.; Hu, X. Water Desalination under One Sun Using Graphene-Based Material Modified PTFE Membrane. Desalination 2018, 442, 1–7. [Google Scholar] [CrossRef]
  16. Hong, Z.; Pei, J.; Wang, Y.; Cao, B.; Mao, M.; Liu, H.; Jiang, H.; An, Q.; Liu, X.; Hu, X. Characteristics of the Direct Absorption Solar Collectors Based on Reduced Graphene Oxide Nanofluids in Solar Steam Evaporation. Energy Convers. Manag. 2019, 199, 112019. [Google Scholar] [CrossRef]
  17. Zhou, X.; Zhao, F.; Guo, Y.; Zhang, Y.; Yu, G. A Hydrogel-Based Antifouling Solar Evaporator for Highly Efficient Water Desalination. Energy Environ. Sci. 2018, 11, 1985–1992. [Google Scholar] [CrossRef]
  18. Kashyap, V.; Al-Bayati, A.; Sajadi, S.M.; Irajizad, P.; Wang, S.H.; Ghasemi, H. A Flexible Anti-Clogging Graphite Film for Scalable Solar Desalination by Heat Localization. J. Mater. Chem. A 2017, 5, 15227–15234. [Google Scholar] [CrossRef]
  19. Sajadi, S.M.; Farokhnia, N.; Irajizad, P.; Hasnain, M.; Ghasemi, H. Flexible Artificially-Networked Structure for Ambient/High Pressure Solar Steam Generation. J. Mater. Chem. A 2016, 4, 4700–4705. [Google Scholar] [CrossRef]
  20. Chen, C.; Zhou, L.; Yu, J.; Wang, Y.; Nie, S.; Zhu, S.; Zhu, J. Dual Functional Asymmetric Plasmonic Structures for Solar Water Purification and Pollution Detection. Nano Energy 2018, 51, 451–456. [Google Scholar] [CrossRef]
  21. Zhou, L.; Tan, Y.; Wang, J.; Xu, W.; Yuan, Y.; Cai, W.; Zhu, S.; Zhu, J. 3D Self-Assembly of Aluminium Nanoparticles for Plasmon-Enhanced Solar Desalination. Nat. Photonics 2016, 10, 393–398. [Google Scholar] [CrossRef]
  22. Liu, P.F.; Miao, L.; Deng, Z.; Zhou, J.; Su, H.; Sun, L.; Tanemura, S.; Cao, W.; Jiang, F.; Zhao, L.D. A Mimetic Transpiration System for Record High Conversion Efficiency in Solar Steam Generator under One-Sun. Mater. Today Energy 2018, 8, 166–173. [Google Scholar] [CrossRef]
  23. Liu, H.; Zhang, X.; Hong, Z.; Pu, Z.; Yao, Q.; Shi, J.; Yang, G.; Mi, B.; Yang, B.; Liu, X.; et al. A Bioinspired Capillary-Driven Pump for Solar Vapor Generation. Nano Energy 2017, 42, 115–121. [Google Scholar] [CrossRef]
  24. Li, X.; Xu, W.; Tang, M.; Zhou, L.; Zhu, B.; Zhu, S.; Zhu, J. Graphene Oxide-Based Efficient and Scalable Solar Desalination under One Sun with a Confined 2D Water Path. Proc. Natl. Acad. Sci. USA 2016, 113, 13953–13958. [Google Scholar] [CrossRef]
  25. Murphy, C.J. Materials Science: Nanocubes and Nanoboxes. Science 2002, 298, 2139–2141. [Google Scholar] [CrossRef]
  26. Mirkin, C.A. The Beginning of a Small Revolution. Small 2005, 1, 14–16. [Google Scholar] [CrossRef]
  27. Link, S.; El-Sayed, M.A. Spectral Properties and Relaxation Dynamics of Surface Plasmon Electronic Oscillations in Gold and Silver Nanodots and Nanorods. J. Phys. Chem. B 1999, 103, 8410–8426. [Google Scholar] [CrossRef]
  28. Pavan Kumar, Y.; Swetha, S.; Kumar Kaviti, A. Development of Nano Structures for Solar Driven Desalination. Mater. Today Proc. 2023, 82, 270–278. [Google Scholar] [CrossRef]
  29. Manzoor, S.; Ashraf, M.W.; Tayyaba, S.; Tariq, M.I.; Hossain, M.K. Recent Progress of Fabrication, Characterization, and Applications of Anodic Aluminum Oxide (AAO) Membrane: A Review. C.-Comput. Model. Eng. Sci. 2023, 135, 1007–1052. [Google Scholar] [CrossRef]
  30. Keller, F.; Hunter, M.S.; Robinson, D.L. Structural Features of Oxide Coatings on Aluminum. J. Electrochem. Soc. 1953, 100, 411. [Google Scholar] [CrossRef]
  31. Li, J.M.; Cai, C.; Song, L.X.; Li, J.F.; Zhang, Z.; Xue, M.Z.; Liu, Y.G. Electrodeposition and Characterization of Nano-Structured Black Nickel Thin Films. Trans. Nonferrous Met. Soc. China (Engl. Ed.) 2013, 23, 2300–2306. [Google Scholar] [CrossRef]
  32. Ma, P.; Geng, Q.; Gao, X.; Yang, S.; Liu, G. Cu1.5Mn1.5O4-Based Ceramic Spectrally Selective Coatings for Efficient Solar Absorber Applications. J. Alloys Compd. 2016, 675, 423–432. [Google Scholar] [CrossRef]
  33. Randich, E.; Allred, D.D. General film behaviour 393 chemically vapor-deposited ZrB2 as a selective solar absorber. Thin Solid Films 1981, 83, 393–398. [Google Scholar] [CrossRef]
  34. Wackelgard, E.; Bartali, R.; Gerosa, R.; Laidani, N.; Mattsson, A.; Micheli, V.; Rivolta, B. New Cermet Coatings for Mid-Temperature Applications for Solar Concentrated Combine Heat and Power System. Energy Procedia 2014, 48, 242–249. [Google Scholar] [CrossRef]
  35. Lizama-Tzec, F.I.; Macías, J.D.; Estrella-Gutiérrez, M.A.; Cahue-López, A.C.; Arés, O.; de Coss, R.; Alvarado-Gil, J.J.; Oskam, G. Electrodeposition and Characterization of Nanostructured Black Nickel Selective Absorber Coatings for Solar–Thermal Energy Conversion. J. Mater. Sci. Mater. Electron. 2015, 26, 5553–5561. [Google Scholar] [CrossRef]
  36. Rao, C.N.R.; Mu, A.; Cheetham, A.K. Nanomaterials Chemistry; Rao, C.N.R., Müller, A., Cheetham, A.K., Eds.; Wiley: Hoboken, NJ, USA, 2007; ISBN 9783527316649. [Google Scholar]
  37. Tang, X.J.; Zhang, G.; Zhao, Y.P. Electrochemical Characterization of Silver Nanorod Electrodes Prepared by Oblique Angle Deposition. Nanotechnology 2006, 17, 4439–4444. [Google Scholar] [CrossRef]
  38. Krishna, S.A.M.; Shridhar, T.N.; Krishnamurthy, L. Computational Investigation on Thermal Conductivity Behavior of Al 6061-SiC-Gr Hybrid Metal Matrix Composites. Int. J. Comput. Mater. Sci. Eng. 2015, 4, 1–24. [Google Scholar] [CrossRef]
  39. Mendes, L.F.; Moraes, A.S.; Santos, J.S.; Leite, F.L.; Trivinho-Strixino, F. Investigation of Roughness and Specular Quality of Commercial Aluminum (6061 Alloy) for Fabrication of Nanoporous Anodic Alumina Films. Surf. Coatings Technol. 2017, 310, 199–206. [Google Scholar] [CrossRef]
  40. For, S.M.; Copper, P.; Aluminum, O.N. 20020411 126 Suggested Method for Plating Copper on Aluminum; Technology utilization report, NASA SP-5025; NASA: Washington, DC, USA.
  41. Milusheva, V.; Georgieva, M.; Tzaneva, B.; Petrova, M. Electroless Copper Deposition into Anodic Aluminium Oxide on Aluminum Substrate. In Proceedings of the 2018 IEEE XXVII International Scientific Conference Electronics—ET, Sozopol, Bulgaria, 13–15 September 2018. [Google Scholar] [CrossRef]
  42. Poznyak, A.; Knörnschild, G.; Karoza, A.; Norek, M.; Pligovka, A. Peculiar Porous Aluminum Oxide Films Produced via Electrochemical Anodizing in Malonic Acid Solution with Arsenazo-I Additive. Materials 2021, 14, 5118. [Google Scholar] [CrossRef] [PubMed]
  43. Poznyak, A.A.; Knörnschild, G.H.; Pligovka, A.N.; Larin, T.D. Anodic Alumina Prepared in Aqueous Solutions of Chelating Complex Zinc and Cobalt Compounds. Tech. Phys. 2022, 67, 411–422. [Google Scholar] [CrossRef]
  44. Poznyak, A.; Pligovka, A.; Turavets, U.; Norek, M. On-Aluminum and Barrier Anodic Oxide: Meeting the Challenges of Chemical Dissolution Rate in Various Acids and Solutions. Coatings 2020, 10, 875. [Google Scholar] [CrossRef]
  45. Kanakarn, D.; Venkatachalam, L.; Narasimhan, R.V.; Subramanian, R. Plating on Anodised Aluminium. Bull. Electrochem. 1986, 2, 273–275. [Google Scholar]
  46. Kumar, A.; Ram, S. Results in Engineering Influence of Anodization Time on Al 2 O 3 Nanoporous Morphology and Optical Properties Using Energy Band Gap at Room Temperature. Results Eng. 2023, 17, 100816. [Google Scholar] [CrossRef]
  47. Kolassa, N.; Punzengruber, C.; Suko, J.; Makinose, M. Mechanism of Calcium-Independent Phosphorylation of Sarcoplasmic Reticulum ATPase by Orthophosphate. Evidence of Magnesium-Phosphoprotein Formation. FEBS Lett. 1979, 108, 495–500. [Google Scholar] [CrossRef]
  48. Liu, A.; Shi, Z.; Reddy, R.G. Mechanism Study of Cu-Zn Alloys Electrodeposition in Deep Eutectic Solvents. Ionics 2020, 26, 3161–3172. [Google Scholar] [CrossRef]
  49. Gupta, B.; Kumar, A.; Baredar, P.V. Experimental Investigation on Modified Solar Still Using Nanoparticles and Water Sprinkler Attachment. Front. Mater. 2017, 4, 1–7. [Google Scholar] [CrossRef]
  50. Mohiuddin, S.A.; Kaviti, A.K.; Rao, T.S.; Atchuta, S.R. Experimental Assessment of Productivity and Sustainability of Nanoporous Cr-Mn-Fe Oxide Nanocoating in Solar-Powered Desalination. Process Saf. Environ. Prot. 2022, 162, 61–71. [Google Scholar] [CrossRef]
  51. Kaviti, A.K.; Akkala, S.R.; Sikarwar, V.S.; Sai Snehith, P.; Mahesh, M. Camphor-Soothed Banana Stem Biowaste in the Productivity and Sustainability of Solar-Powered Desalination. Appl. Sci. 2023, 13, 1652. [Google Scholar] [CrossRef]
Figure 1. Following anodization, samples at (a) 40 min; (b) 60 min; (c) 80 min.
Sustainability 16 02220 g001
Figure 2. Al samples electroplated with copper which were anodized at (a) 40 min; (b) 60 min; (c) 80 min.
Sustainability 16 02220 g002
Figure 3. The comprehensive sequence of steps involved in copper electroplating on anodized AAO.
Sustainability 16 02220 g003
Figure 4. Flow diagram showing structure changes after appropriate treatment.
Sustainability 16 02220 g004
Figure 5. Process of solar desalination.
Sustainability 16 02220 g005
Figure 6. SEM images depicting the arial perspective and a three-dimensional representation of samples that underwent anodization in oxalic acid for varying durations of (a) 40 min; (b) 60 min; (c) 80 min.
Sustainability 16 02220 g006
Figure 7. A histogram illustrating the mean diameter of nanopores.
Sustainability 16 02220 g007
Figure 8. Microscopy images of the top view and a three-dimensional model of the copper-plated samples for the aluminum samples that were anodized at (a) 40 min; (b) 60 min; (c) 80 min.
Sustainability 16 02220 g008
Figure 9. SEM pictures of the cross-sectional view and a 3D model of samples that were copper-plated for the aluminum samples anodized at (a) 40 min; (b) 60 min; (c) 80 min.
Sustainability 16 02220 g009
Figure 10. EDAX pictures of the copper-plated aluminum samples that were anodized at (a) 40 min; (b) 60 min; (c) 80 min.
Sustainability 16 02220 g010
Figure 11. Quantitative imagery of copper-plated aluminum samples anodized at (a) 40 min; (b) 60 min; (c) 80 min.
Sustainability 16 02220 g011
Figure 12. The features of copper deposition on anodized aluminum oxide as shown by the X-ray diffraction (XRD) pattern for different anodization times.
Sustainability 16 02220 g012
Figure 13. Patterns of changes in sun irradiance over time.
Sustainability 16 02220 g013
Figure 14. Patterns of changes in air temperature over time.
Sustainability 16 02220 g014
Figure 15. (a) Hourly yield over time; (b) cumulative yield over time.
Sustainability 16 02220 g015
Figure 16. Efficiency curve over time.
Sustainability 16 02220 g016
Table 1. Assessment of groundwater.
Parameters of Water QualityBefore DesalinationAfter Desalination (CSS)After Desalination (MSS)Maximum Permissible Limits of Drinking Water (WHO and BIS Standards) [50]
Hardness (mg/L)315165130200
pH8.27.47.28.5
Chloride (mg/L)58.78.56.6250
Fluoride (mg/L)0.60.400.341.5
TDS (ppm)4502517500
Disclaimer/Publisher’s Note: The statements, opinions and data contained in all publications are solely those of the individual author(s) and contributor(s) and not of MDPI and/or the editor(s). MDPI and/or the editor(s) disclaim responsibility for any injury to people or property resulting from any ideas, methods, instructions or products referred to in the content.

