1. Introduction
Nowadays, urban areas must deal with the greatest exposure and susceptibility to the effects of a changing climate and the related hazards [
1]. Heat waves, extreme heat events, and global warming are increasingly intense and recurrent, and the urban areas are becoming more vulnerable.
According to the United Nations Intergovernmental Panel on Climate Change (IPCC) [
2], the global surface temperature increased by 1.1 °C in the 9-year period from 2011 to 2020. Additionally, global greenhouse gas emissions steadily grew at a rate of 1.3% per year between 2010 and 2019. This increase in greenhouse gas (GHG) levels contributes to global warming and intensifies the risks of hazards and climatic challenges in urban areas. Rising temperatures and heat waves also affect the health, well-being, and thermal comfort of occupants and citizens [
3,
4,
5].
At the same time, cities are undergoing significant growth due to the urbanization process, with a projected urbanized population reaching 68% by 2050 [
6]. It causes changes in the physical environment and urban climate linked to the concentration of the population [
7]. The reduction in vegetation cover and soil moisture leads to the increase in severe urban heat island (UHI) effects, especially during heat waves [
8,
9,
10]. Due to global and urban climate change, the intensity of the UHI phenomenon is rising [
7,
11,
12]. It makes urban areas warmer compared to rural ones [
12], especially in a rapid urban expansion process [
13], changing the ambient temperature and the energy consumption in buildings [
14]. The rising of external temperatures is causing a decrease in heating energy consumption in winter, but also an increase in cooling demand [
15,
16]. Future scenario projections in European Mediterranean cities foresee an average temperature rise of 3–5 °C and a consequent increase in building energy demand in summer [
17].
Ma et al. [
18] identified a toolchain to quantify the impact of UHI and climate change using the case study of a Belgian city. They underline the significant role and the impact of climate change above the UHI in the 2050 scenario. Moreover, the outdoor temperature increase will lead to indoor overheating due to the UHI, increasing in future climate scenarios up to about 13%.
In reality, heat waves and high UHI intensity are already influencing outdoor temperatures in Mediterranean cities. For example, in the city of Lecce, in the south of Italy, Donateo et al. [
19] demonstrated that the UHI intensity diurnal peak reaches 1–3 °C and exceeds 5–6 °C in unfavorable conditions, causing high discomfort and heat stress risk in the worst conditions in summer.
In this framework, recent studies emphasize the need for immediate urban climate initiatives and mitigation actions, aimed at significantly lowering temperatures and establishing adaptive systems for climate resilience [
20].
As known, some urban factors such as urban morphology [
21], fabric pattern, building height-to-street width ratio, building orientation, height and typologies [
22], and mutual shadings effects between buildings [
18] influence the UHI [
23] and cannot be ignored. Regarding the urban fabric, it was demonstrated that the greater the urban compactness, the greater the decrease in solar radiation on building facades [
24]. This is evident in cities such as Barcelona and Rome, where the urban compactness of some district areas reduces external temperatures [
24] and is beneficial during summer. The Medieval narrow streets can block sunlight from directly hitting the pavement for most hours of the day. Moreover, they are often characterized by a funnel shape to accelerate the wind thanks to the Venturi effect. A famous example is the city of Toledo (Spain), characterized by high winding streets [
25], which reduce the UHI intensity [
26].
Salvati et al. [
24] conclude that compact and dense urban textures, such as the historic districts in the Mediterranean climate, can be more climate-adaptable than the modern ones, characterized by widespread and less dense urban patterns. Thus, ancient districts could be assumed as an emblematic model of climate adaptation.
Consequently, in a future roadmap towards hot temperature mitigation, it is necessary to consider the specific characteristics of the urban fabrics, also based on the age of construction.
For the design of new district areas, it is important to consider the main urban morphology indicators, like the buildings’ height, the sky view factor, and building density [
27].
On the other hand, for the existing districts, the situation is different. In modern cities, little attention has been paid to the mitigation of heat peaks; dark and not very permeable materials, streets without shading elements and low wind speed, and the lack of green areas worsen the local warming. Moreover, in consolidated cities, it is not possible to renovate their original morphology, except through a deep and expensive regeneration process that is not realizable in most cases.
However, it is possible to adopt mitigation and adaptation measures to cope with heat waves and the UHI phenomenon, as demonstrated for Borgo Antignano in the city of Naples (south of Italy) [
28]. These actions must be differentiated and suitable for the different morphological characteristics of old and modern districts.
The use of proper and sustainable bioclimatic strategies, such as green spaces, permeable materials, and soils can help to counteract the rising temperatures [
29].
As regards green infrastructure, green roofs as well as the increase in vegetation in general help to reduce the UHI phenomenon and heat waves in the urban renewal process, as demonstrated in many studies [
30,
31,
32,
33]. These solutions also contribute to improving the outdoor thermal comfort of pedestrians at street level [
34]. Many studies consider the use of green roofs on an urban scale, demonstrating a high potential decrease in air temperature [
35,
36]. Regarding vertical greenery, Zheng et al. [
37] deduced that it can significantly reduce, at the same time, facing wall, ground, and air temperatures, with a variable range depending on building height-to-street width ratio.
Integrated with vegetation, the increase in surface albedo can significantly provide a reduction in the net absorbed solar radiation and in the urban ambient temperature [
38]. The application of cool materials is an efficient passive countermeasure to the UHI impact.
Giorio et al. [
39] carried out a study related to the city of Padua in Italy; the main outcomes revealed that cool pavement surfaces were cooler by up to 9 °C in the central hours, reducing air temperatures by 0.6 to 1.2 °C, at the pedestrian level. It confirms the possibility of using such materials as a mitigation measure.
In addition, Del Serrone et al. [
40] highlighted that cool pavements are even more effective combined with vegetation improvement, as in the case of Rome, achieving an air temperature reduction higher than 3 °C and a 50% decrease in the mean radiant temperature.
Furthermore, water spray and fountains can contribute to mitigating the UHI phenomenon [
41]. Using ENVI-met software V4, Fahed et al. [
42] demonstrated that water features could reduce the ambient temperature up to 5 °C in the Mediterranean city of Lebanon.
In this framework, this paper aims at defining a methodology to compare the different mitigation and adaptation strategies to cope with hot summer conditions in a Mediterranean city. The novelty of the study is the analysis of different urban areas, based on diverse historical ages of construction, considering an old and a modern district with a perspective of making cities more resilient to increasingly hot temperatures. The methodological approach was applied to the city of Bari, in the south of Italy, which was considered representative as a Mediterranean medium-sized city.
Diverse mitigation scenarios were chosen depending on the actual possibility of realizing them and on the constraints given by the existing urban areas. The objective was to assess the air temperature reduction and improvement of main environment parameters in the summer regime for the two existing districts. ENVI-met simulations were conducted for the studied areas and for each intervention scenario. On the one hand, the positive impact of narrow streets and shading (as in the case of the old town) was exploited; on the other hand, possible interventions for contemporary settlement (e.g., road vegetation, green roofs, water fountain jets, cool materials) were provided.
Finally, not only typical summer conditions, but also extreme temperatures were considered, to take into account heat peaks that amplify the UHI, as mentioned before.
The objective of the research was to provide solutions that comply with the constraints for a consolidated urban area and, at same time, have the potential to mitigate climate change, global warming, and UHI in the analyzed urban canyons. Moreover, they could be replicated in similar Mediterranean cities towards more effective and adaptive settlements. In fact, in the future strategic vision, cities will be able to withstand climate change and heat waves.
2. Materials and Methods
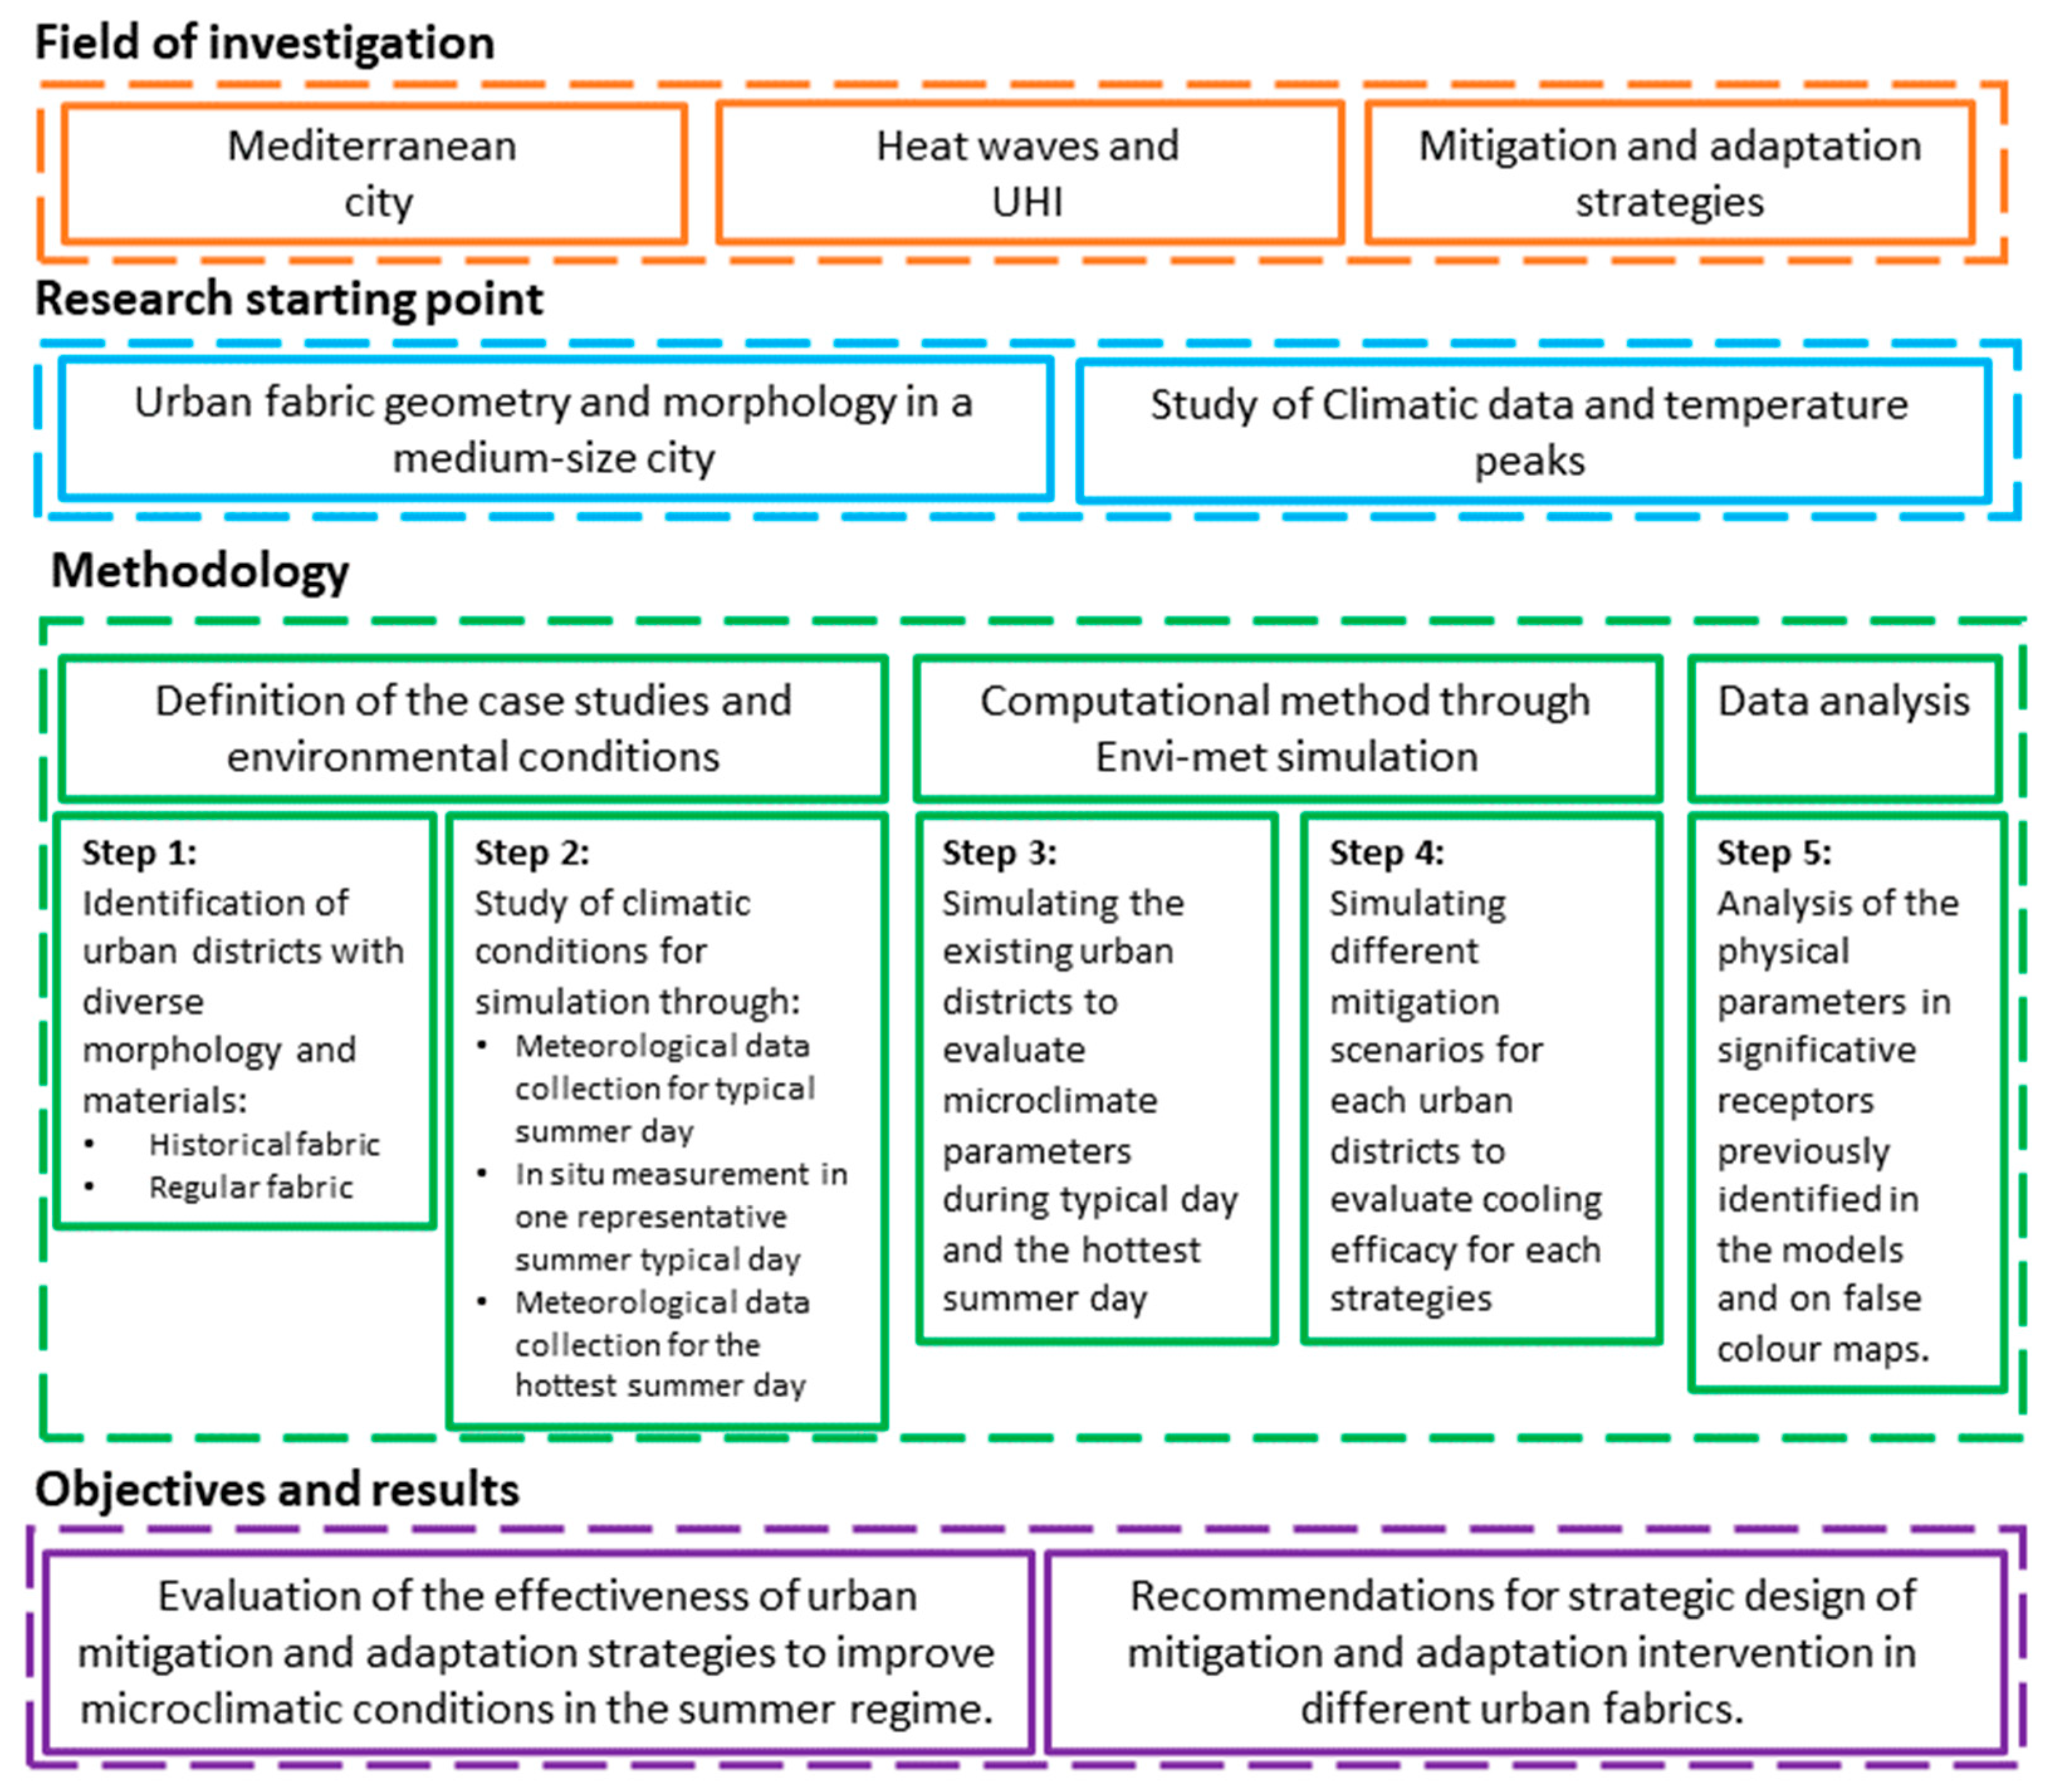
The defined methodology consists of various primary steps, as illustrated in the general framework of the research in
Figure 1.
As introduced in the previous paragraph, the field of investigation regards mainly Mediterranean cities and the impact of heatwaves and UHI in these conditions.
The methodology has been based on three main macro-areas that concern the definition of the case study and related environmental conditions, the computational method, and the data analysis.
In the Mediterranean cities, it is easy to identify urban areas with different identities and morphological characteristics, often marked by different surface treatments, due to belonging to different periods and settlements. Within the urban-area, it is possible to identify the coexistence of both the traditional and modern fabric. The complexity of these urban centers creates unique microclimatic conditions that are interesting to study.
Historic centers are generally small or medium urban agglomerations with irregular fabrics and different shapes that can be compared with the modern city, finding different districts and consideration for the analysis of urban heat island mitigation.
The geometric and technological characteristics of urban space as well as the identification of possible different historical and modern urban fabrics of the case study become the starting point of the methodological proposal and Step 1 of the applied methodology.
At the same time, a study of climatic data and temperature peaks has been carried out over the last 25 years to identify a typical day and the hottest summer day to study the effects of the elevated temperatures and mitigation and adaptation solutions under both extreme and standard summer conditions (Step 2).
The analyzed data were sourced from a historical archive, the “Weather Underground” site [
43], selecting the weather station closest to the study areas. On the website of “Weather Underground”, it was possible to consult the historical archive containing all the meteorological data, including temperature, relative humidity, and wind speed and direction, for their comparison and analysis. Moreover, a measurement campaign of a typical summer day was carried out in order to compare the actual state with the historical meteorological data and the impact on the analyzed districts.
For the construction and analysis of the 3D models of the analyzed districts, multi-disciplinary modelling software (ENVI-met V5.1) was used to study the physical and microclimatic behavior of buildings, gardens, and landscapes [
44], including applications for urban planning, climate adaptation, comfort and human health [
45,
46].
Moreover, as stated in [
47,
48], ENVI-met is a helpful tool used for the simulation of the urban space thermal environment at medium and macro scale (including urban scales). Finally, ENVI-met simulates and predicts complex surface vegetation–air interactions in urban environments.
The approach taken considers the environment as a single organism. Simulation results can show the effects of architectural solutions, sustainable technologies, and the use of cool materials, greenery [
48], and water to improve outdoor microclimatic conditions. ENVI-met is a software with a solid calculation basis (Navier–Stokes equations, fluid-dynamic model and turbulence, radiation and exchange due to plant evapotranspiration, sky-factor modelling, etc.), which enables a result with all the information needed for the evaluation of the microclimate in outdoor spaces [
49].
In order to obtain precise climatic information about specific positions within the model area to be studied, receptors must be inserted before starting the simulation. The advantage of using receptors is that a high temporal resolution can be selected. For each receptor, a snapshot and a time series file are created that can also be used as Excel files.
The locations of the receptors are determined on the basis of the morphological conformation of the streets; in particular, their position is determined in the historical fabric by the examination of the conditions that can create the Venturi effect, while in the modern city, predefined points have been identified that allow for a strategic analysis of the climatic conditions in a regular urban fabric.
The simulations, before and after the design of mitigation strategies, make it possible to study the physical characteristics of the materials (albedo, emissivity) and the environmental characteristics (direct and diffuse solar radiation, natural ventilation and shading), which represent some of the variables that define urban space (Steps 3 and 4).
Mitigation proposals are then formulated to improve the physical behavior of the urban canopy layer, such as increasing the albedo, the inclusion of greenery in the streets, the design of garden roofs, the installation of water jets and eco-sustainable pergolas to ensure shading, and the production of energy from renewable sources.
The results obtained from the simulations were studied to obtain a deeper analysis of the environmental and microclimate parameters (Step 5). The data were organized in proper Excel timesheets and graphs showing the trends of the main climatic indicators: air temperature, wind speed, relative humidity, and mean radiant temperature. The last one at the pedestrian level is a crucial factor for outdoor comfort in urban canyons because it directly influences the perceived thermal environment experienced by individuals in these spaces. Mean radiant temperature refers to the average temperature of all the surfaces surrounding an individual, accounting for the radiation exchange between those surfaces and the human body. In the context of an urban canyon, where buildings, pavements, and other structures contribute to the surrounding environment, the mean radiant temperature becomes a key indicator of thermal comfort.
Moreover, the simulations return a series of outputs that need to be re-processed using calculation programs and supporting graphical interfaces to obtain readable and comparable data. Through this post-processing, by selecting the appropriate time and height, it was possible to obtain chromatic maps of the analyzed study areas for the following parameters: air temperature and incidence of solar radiation.
As a result of the analysis conducted through the previous steps, design recommendations for mitigation and adaptation to the climate crisis are defined by comparing the thermal behavior of the historical and modern fabric of a city.
3. Method Application
3.1. Definition of the Case Studies: The Historical and Regular Fabric
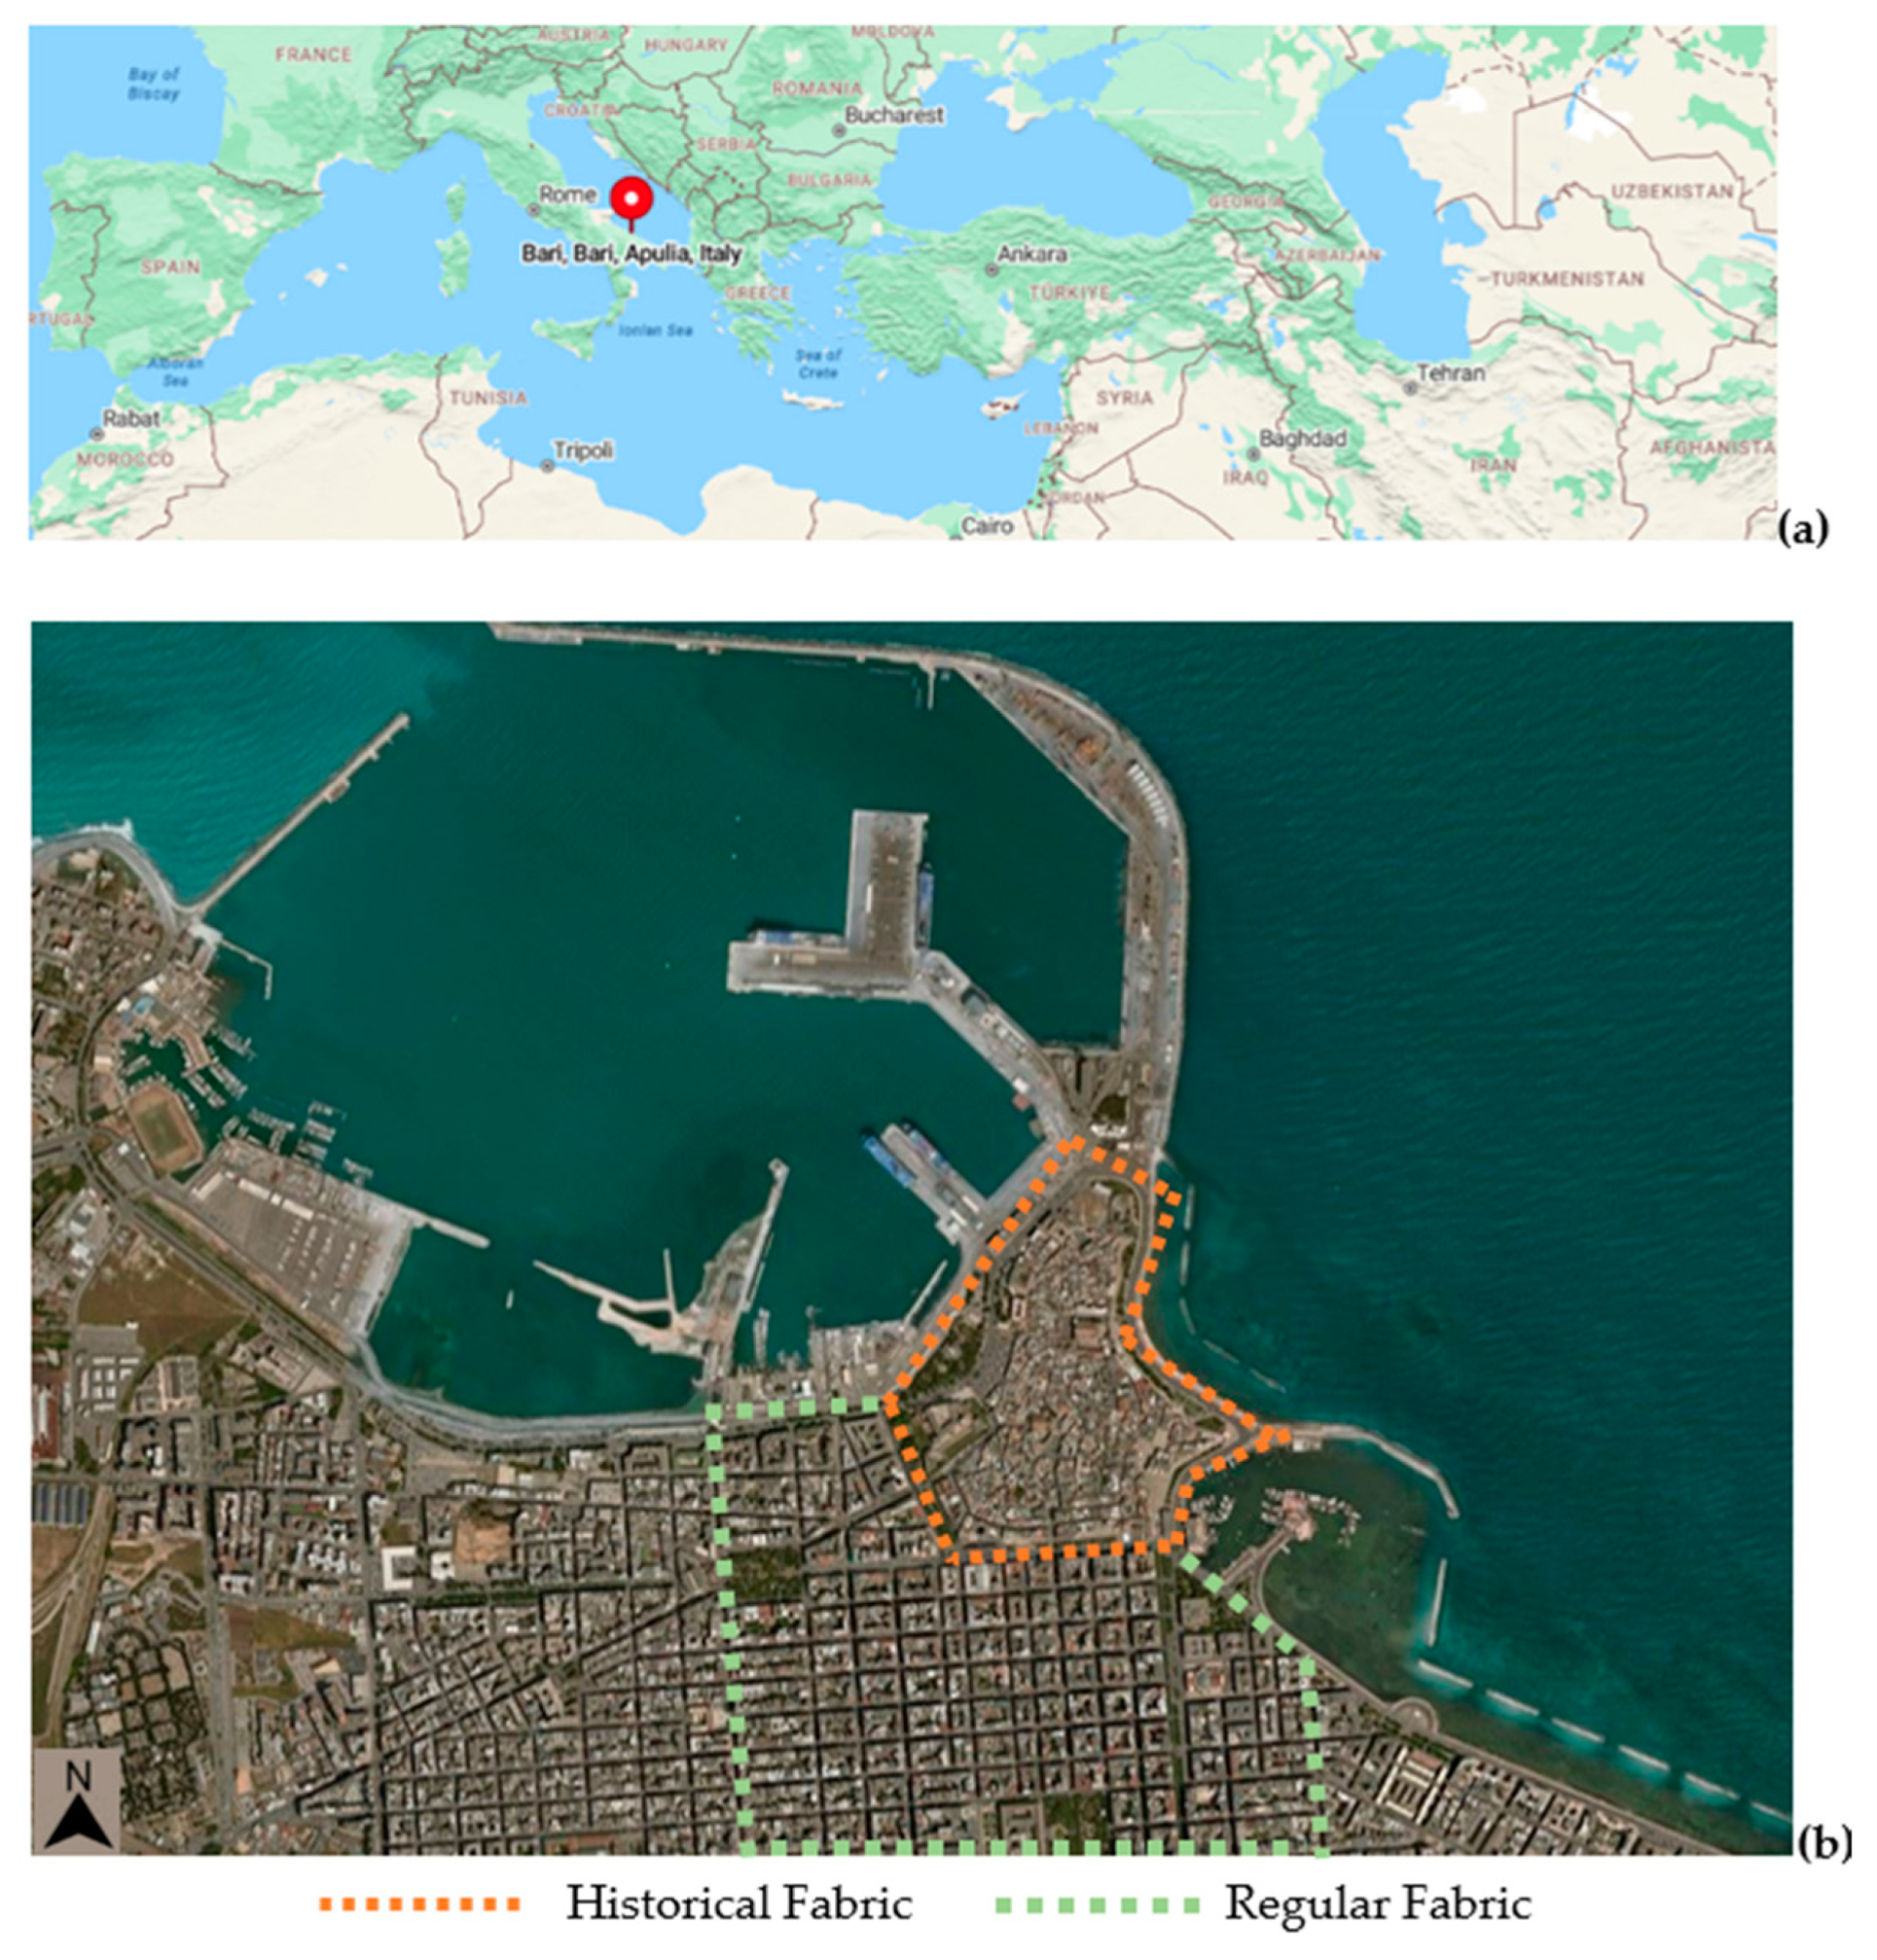
The method was validated in Bari (latitude: 41.12°, longitude: 16.86°), a typical Mediterranean city, capital of the Puglia region, divided into the old part, bordered by the Adriatic Sea and protected by defensive structures, and the modern city, the so-called ‘Borgo Murattiano’. A dual morphology is thus evident, that of a city facing the sea, with historical districts, and that of a city on land, with a regular grid (
Figure 2).
The historical fabric (HF) is developed around the major monuments, the basilica of St. Nicholas and the Cathedral of St. Sabino, creating a network of small streets, alleys, courtyards, and pseudo-skeletons. The building fabric is protected from the sea by a fortified medieval wall.
Within the Borgo Murattiano, initiated in 1813 under the direction of Murat, a marshal of Napoleon, there was stringent control aimed at minimizing the fundamental building block into a ‘module’ within a chessboard-like layout and regular fabric (RF). This module was expected to incorporate gardens or internal courtyards, although they were frequently absent [
50].
The two urban districts also differ in their use of materials. In fact, the walls of buildings in the historic center of Bari are made of limestone, while the walls in the Murat district are made of limestone and of perforated bricks, interspersed with an air space, depending on the period of construction.
3.2. Definition of the Environmental and Climatic Conditions
The thermal performance of an urban district is strongly influenced by the geographical location and climatic context.
Therefore, building from an energy-saving perspective means first of all considering the most significant climatic factors in terms of energy: solar radiation, maximum and minimum temperature values, daily temperature ranges, cloudiness, windiness, atmospheric precipitation, and air humidity.
Similarly important for urban design are the parameters related to microclimate and specifically slope and orientation of the terrain, altitude, and orography of the site. Europe is almost entirely within the temperate climate zone, with temperatures that are neither too hot nor too cold; according to the European classification, we can consider the city of Bari to belong to the Mediterranean zone. According to Köppen and Geiger, the climate classification is Csa.
In order to simplify the evaluation of the influential energy parameters, the Italian territory is divided into six climate zones, named with the letters A to F, according to the degree days of the individual location.
The degree days (GG) [
51] are a parameter that quantifies the average heat requirement needed to maintain a comfortable climate in the home in a given location throughout the year.
In the classification, Bari is in the climate zone C with 1185 degree days. The average temperature is 16.1 °C, with an average annual rainfall of 567 mm. The driest month has a rainfall difference of 47 mm compared to the wettest month. The average temperatures have a variation of 15.3 °C over the year. The hottest month of the year is July.
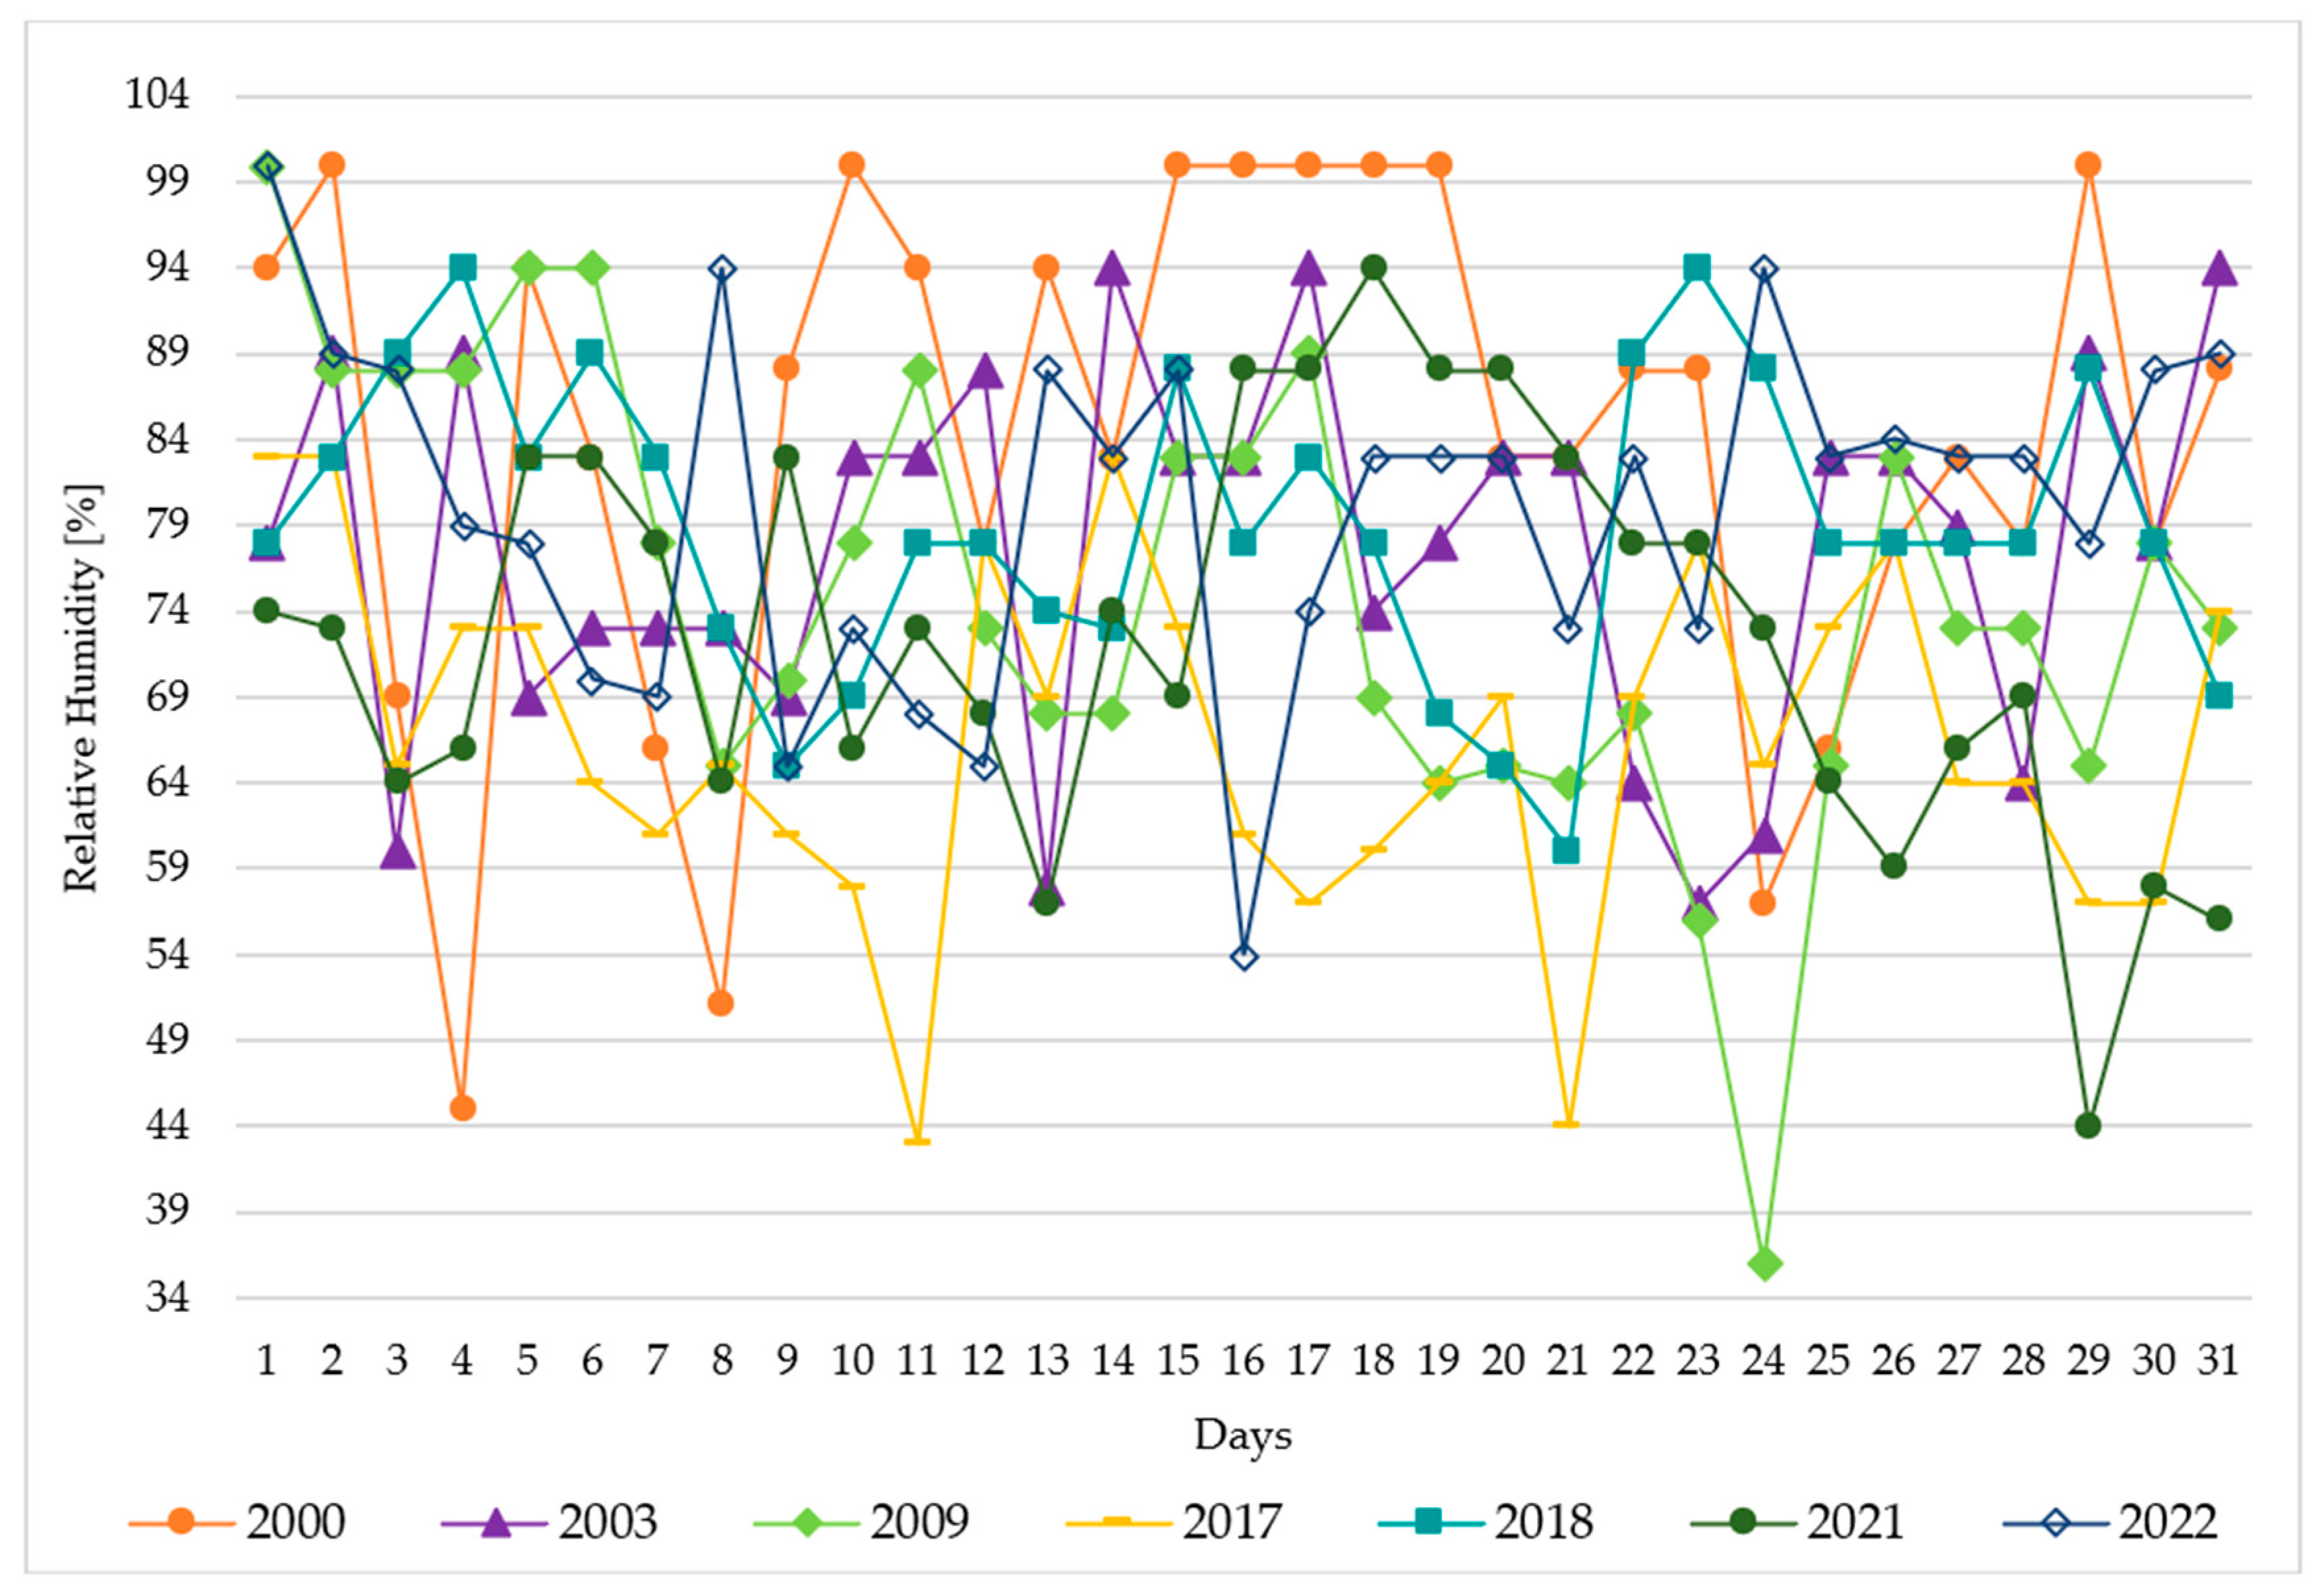
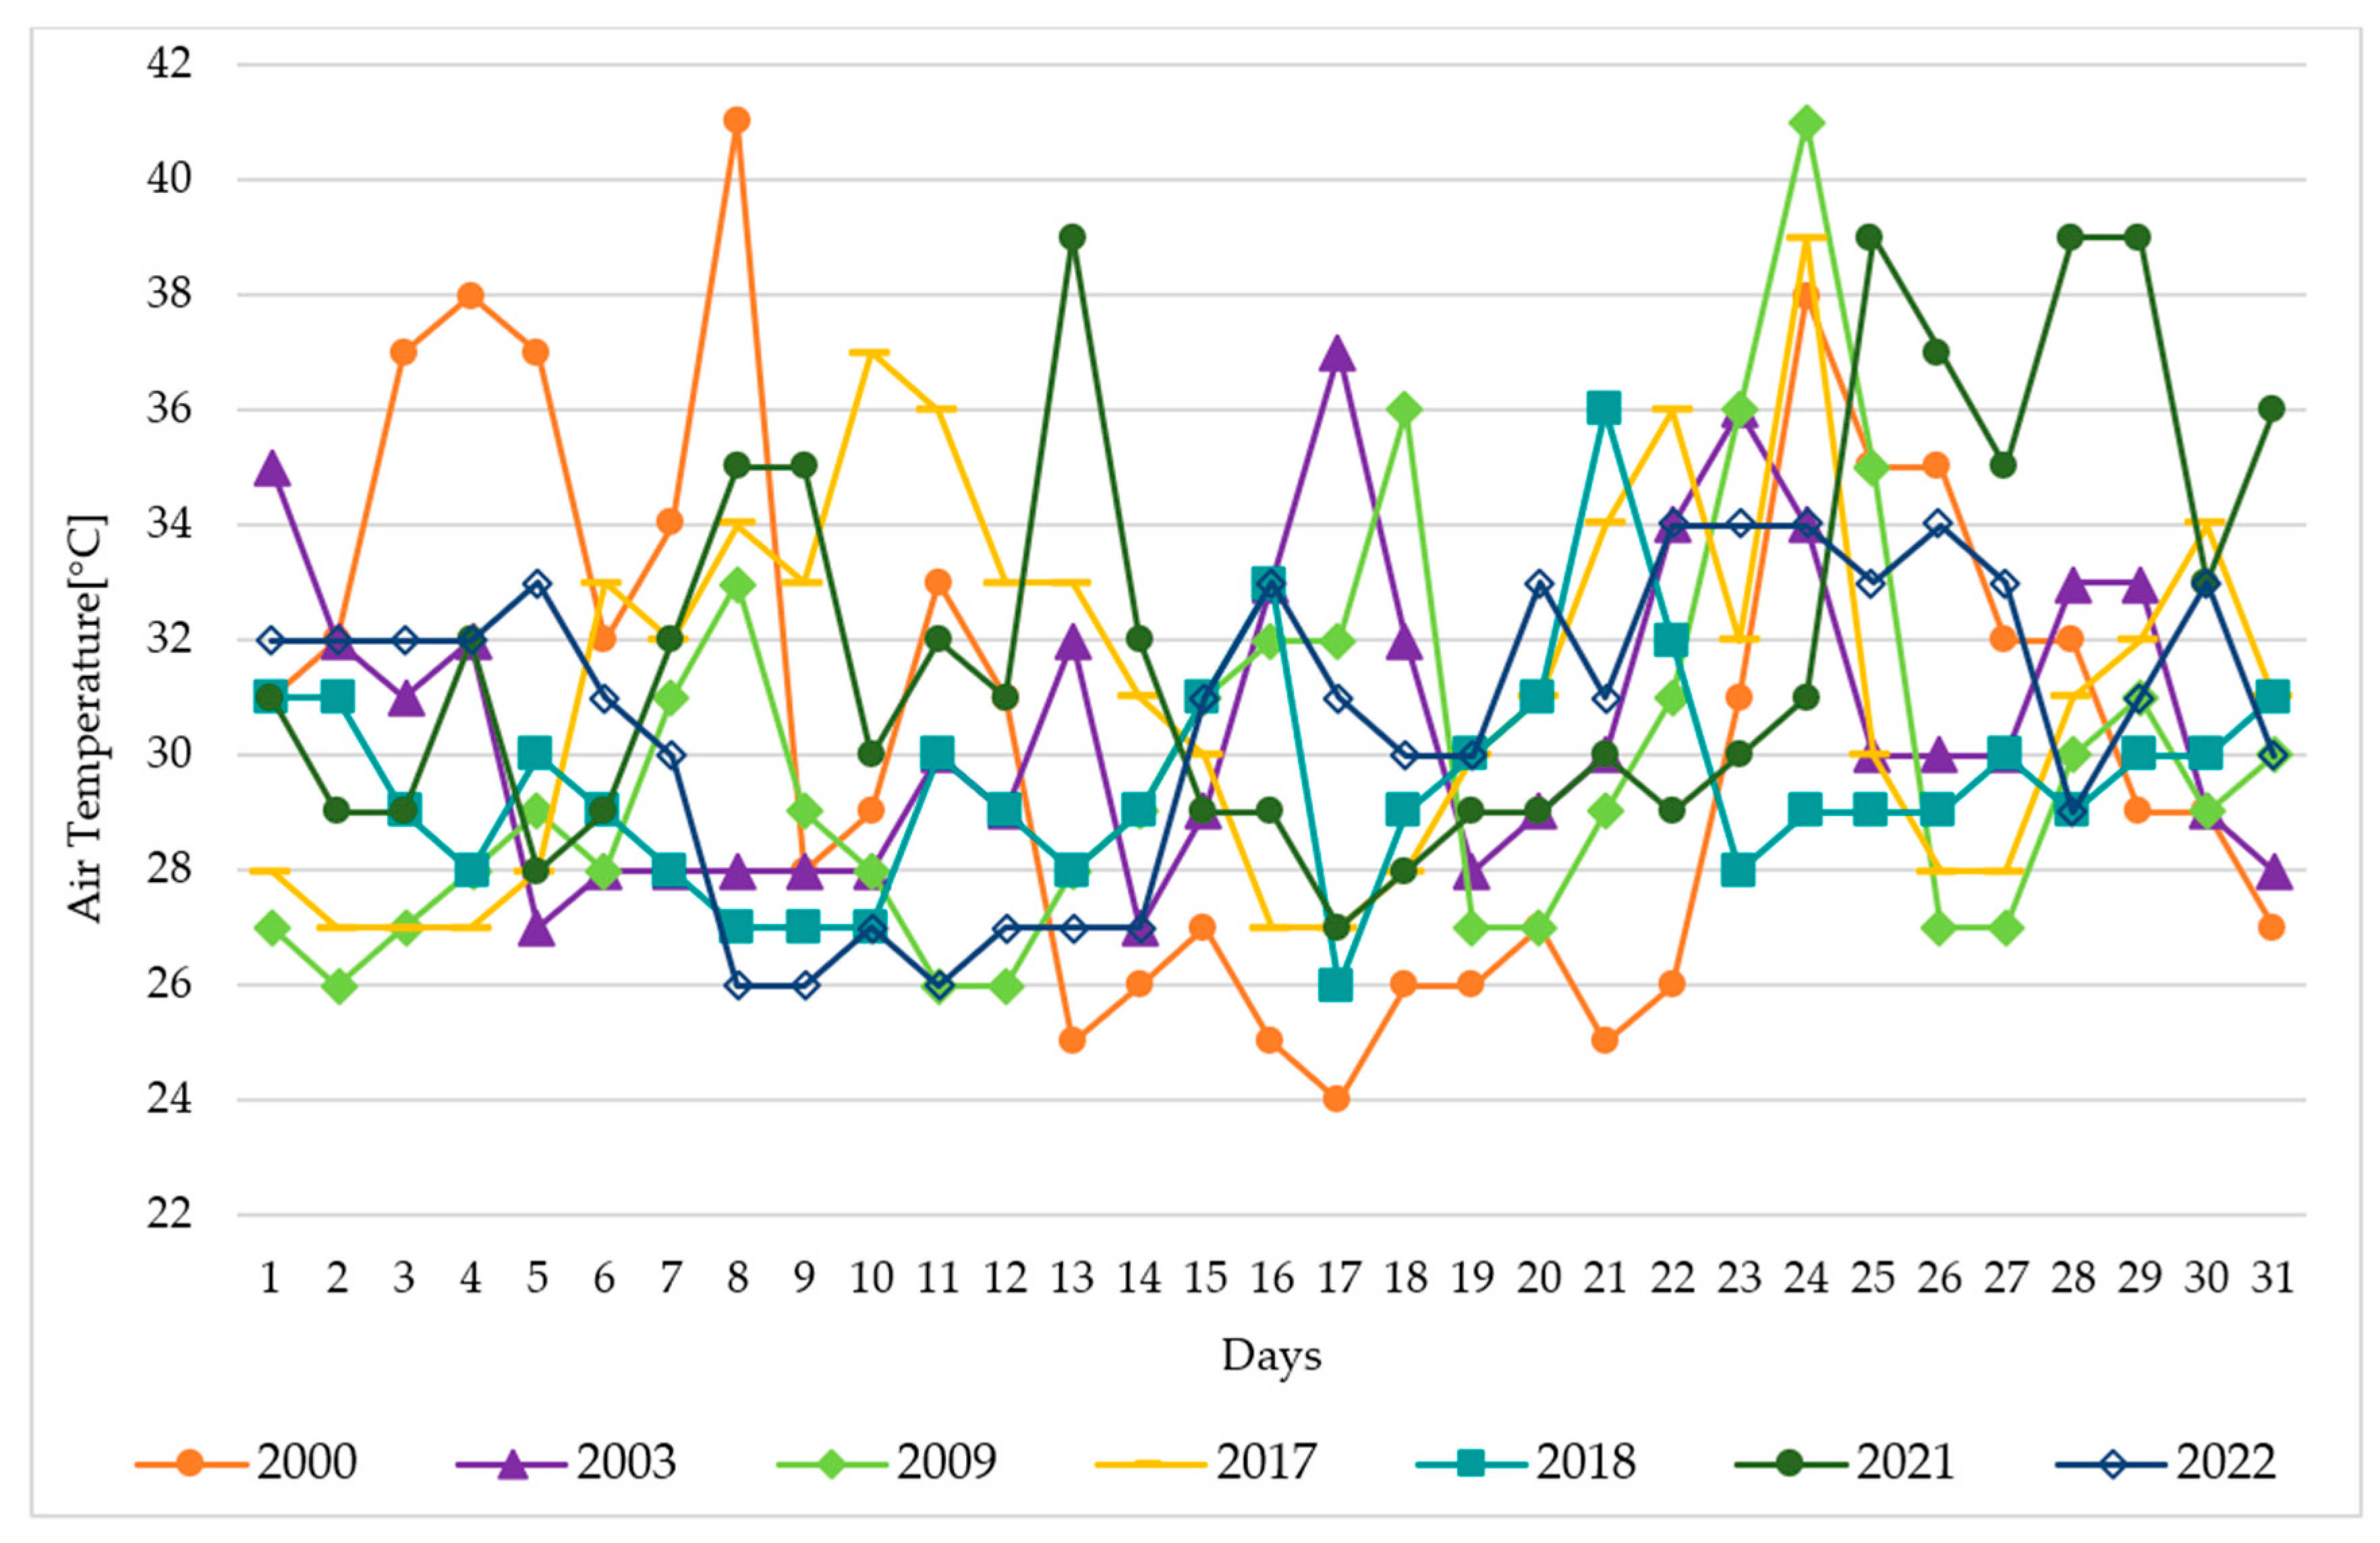
The research was conducted by analyzing the hottest day in the last 25 years for the city of Bari in order to assess the effects of extreme heat conditions that have become increasingly frequent in recent years. Historical records of extreme temperatures in Italy and Europe show for the first time that even these extreme events are outside natural climate variability. Italy is warming up in terms of annual average temperatures. However, what is perceived is not the average warming, but the extremes of heat. In particular, trends in average monthly temperature records over the years can give us information on the changing impact of long heat waves. The number of new heat records has far exceeded those expected in a constant climate regime with longer, more frequent, and more intense heatwaves, indicating real climate change. Therefore, in view of the difficulty of making reliable predictions of long-term heatwaves, historical data from 1998 to 2022 were analyzed for the summer period from June to September.
Anyway, the maximum temperatures were found most frequently in July; thus, the temperature and relative humidity trends in July of the hottest representative years between 1998 and 2022 are shown in
Figure 3 and
Figure 4.
Figure 3 shows that the heat peaks occur on the following days:
- −
8 July 2000 (Tmax = 41°);
- −
24 July 2009 (Tmax = 41°).
Between the two years (2000 and 2009) mentioned above, the daily trend with the highest temperatures occurs in 2009. Moreover, it was decided to include the year 2003, as it is the record year for extreme temperatures in Europe. Finally, the most recent hottest years have been included in the two graphs.
Consequently, following the study of the climatic data over the years, two days were chosen as representative of the typical summer day (19 July 2018) and the extreme temperatures conditions (24 July 2009) for the subsequent analysis, in order to implement urban mitigation strategies based on morphology and climate.
The meteorological conditions were collected from Weather Underground, as in other scientific studies [
52,
53,
54]. It gives representative hourly data, including wind direction and speed, temperature, and relative humidity, from a monitoring station near the airport of Bari-Palese.
The choice of the typical hot day derives from the study of the average of the daily maximum temperatures in July of the years considered. In the survey campaign carried out in recent years, the highest temperature on 19 July 2018 was close to the average value of around 30 °C. Moreover, for this typical summer day, a measurement campaign was carried out; in the middle hours of the day, the measured data showed an increase in the actual temperatures from +1.1 °C at 1:00 p.m. to +3.7 °C at 2:00 p.m. In addition, the difference between weather station and measured data in relative humidity is 17% at 1:00 p.m. Therefore, the measured weather data were also considered for the following analyses.
3.3. Computational Method through ENVI-met Simulations
ENVI-met Settings for the Two Analyzed Districts
The main settings adopted for the two models are shown in
Table 1 and explained in the following.
The calculations were discretized into points and the dimensions of the work area were modified in the size of the grid cell meter part.
For the grid cell, the unit of 1 m = 1 dx = 1 dy = 1 dz was used for the historic center and 2 m = 1 dx = 1 dy = 1 dz for the regular district, where dx, dy, and dz are the dimensions of the single cells.
The model created in spaces was developed on a square grid of 99 × 99 × 34.
For the simulation settings in Envi-met, reference was made to the whole day starting at 4:00 a.m. A starting speed of 3.0 m/s with a WSW direction was set for the wind.
It will also be necessary to provide the software with information regarding the geographical location of the study area in the location on earth section.
The modelling takes into account “edge problems”, i.e., the “calculation errors” that are generated at the edge of the area being simulated. These errors are due to equations that, in order to be solved, must reach ‘solution’, i.e., they must be set equal to zero. Edge errors cannot be avoided, but it is possible to reduce the effect on the interpretation of results by providing a sort of ‘guard ring’ around the area to be modelled; this guard ring was included in the grid dimension above. The area under study is, therefore, in the center of the model.
The extension of the grid in the two directions x and y can be immediately defined, while the vertical grid z presents more complex solutions. This condition is linked to the need to reach very high altitudes in order to obtain reliable microclimatic and atmospheric data during the simulation process.
Envi-met allows a choice between two vertical grid systems:
- −
Equidistant system (solution A): The grid cells all have the same dimension Δz, except for the first, closest to the street level, which is divided into five sub-cells of dimension Δzs = 0.2 Δz. This solution is used when buildings are comparable.
- −
Telescopic system (different options): the size of the cells constituting the grid is not constant, but increases as one advances along the z direction, according to a percentage value defined by the user and called the telescoping factor. An option presents a telescoping factor value of 0 with a maximum possible increase relative to a telescoping factor value of 20% [
55].
This makes it possible to obtain a model in which the external environment above the buildings extends to very high altitudes. This expedience is necessary so that the calculation process underlying the simulations does not deviate. This solution is used in the presence of buildings with considerable heights or buildings that cannot be compared with each other.
In the definition of the case study model, the telescopic system was chosen, setting the percentage value (telescoping factor) related to the increase in size of the individual cells and the height of the grid.
The cell size from which the telescoping factor is applied is defined by the following equation:
Before starting to draw the geometric model, it is necessary to define the materials by assigning the chosen characteristics from the manage database interface.
Concerning the implementation of the chosen districts on ENVI-met and the relative mitigation strategies, some assumptions for both of them were afforded to ensure the simulations yielded reliable results.
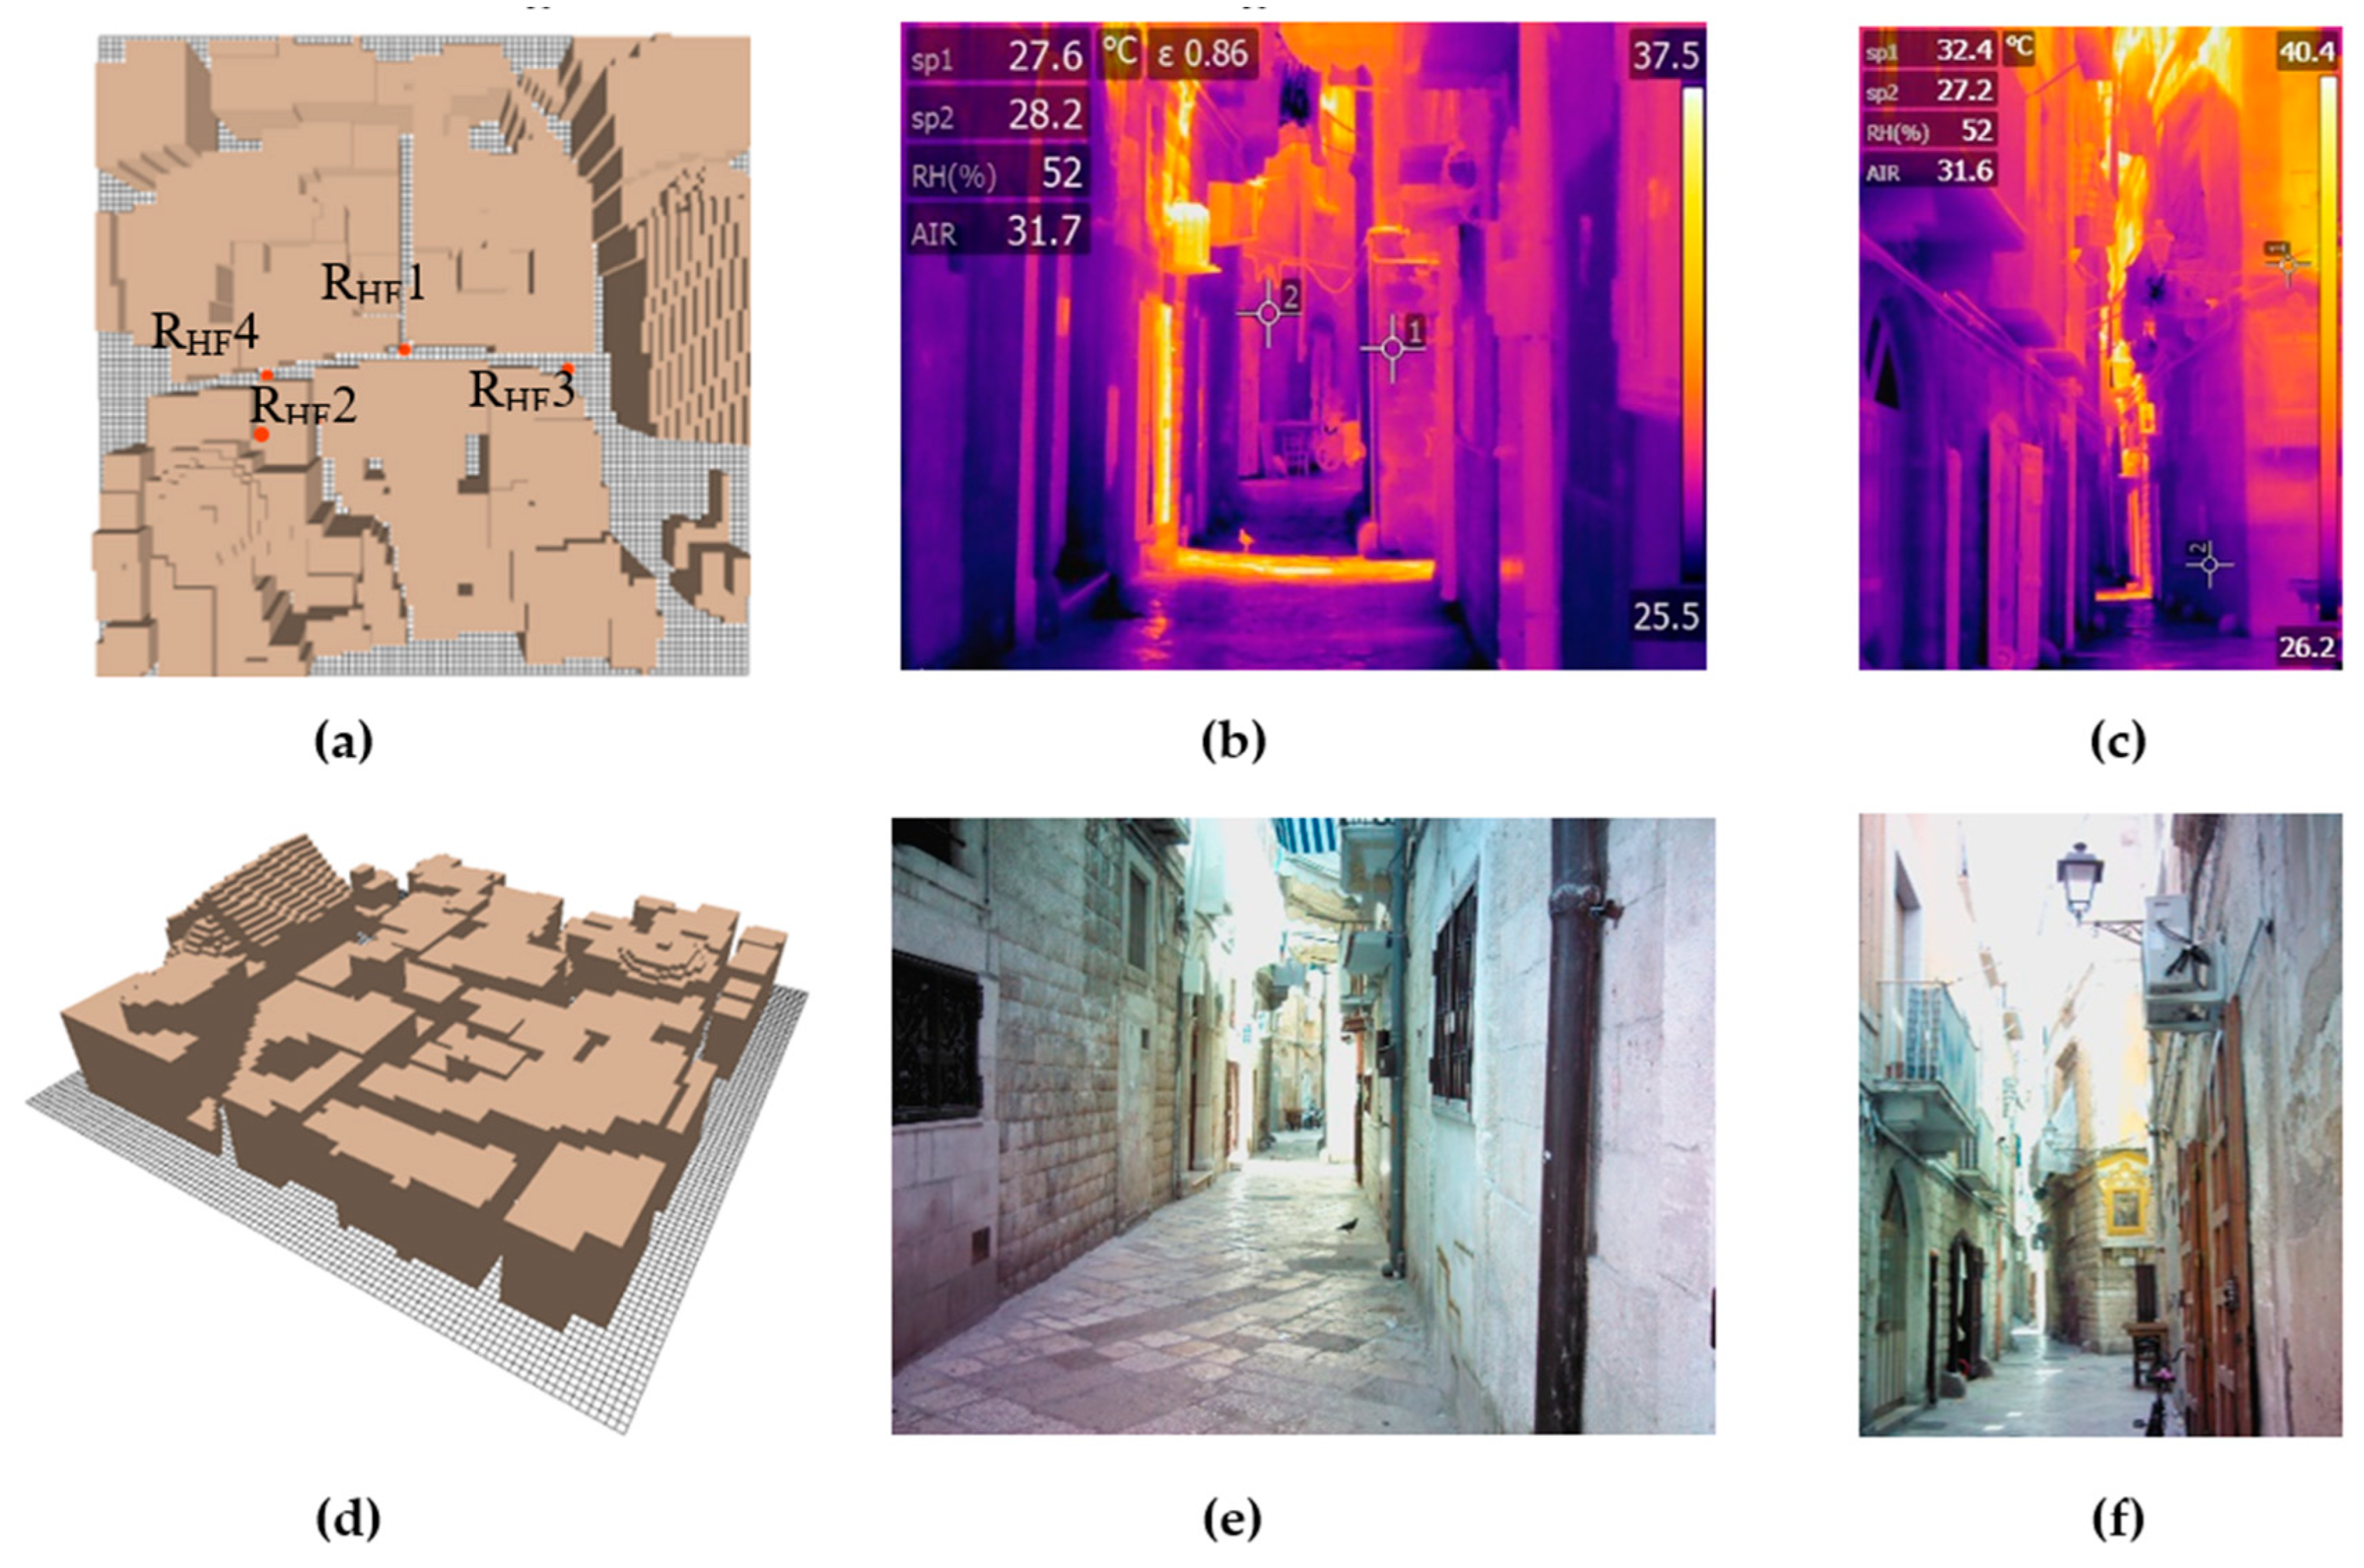
For the historic fabric (HF), an area of 9801 m
2 was considered, with narrow and irregular streets, as visible in
Figure 5.
From the thermographic survey, it is evident that, at the hottest times of the day in the historical urban ‘canyons’, surfaces with temperatures in the 25–27 °C range prevail. This is due to the dense urban morphology that creates large, shaded areas and thanks to materials with a fairly light color, even if darker areas are detected due to inadequate maintenance. Warmer areas, on the other hand, are present where the sun’s rays can penetrate.
The walls are composed of two layers of limestone with rubble in between.
The façades of the buildings in the historic center show the following deterioration phenomena: black crusts, rising damp, biological patina, plaster detachment, color changes, and surface deposits.
These deterioration phenomena result in a low albedo value for vertical surfaces of 40%, while the pavement presents an alternation of “chianche” and crushed stone, to which an albedo value of 35% has been attributed.
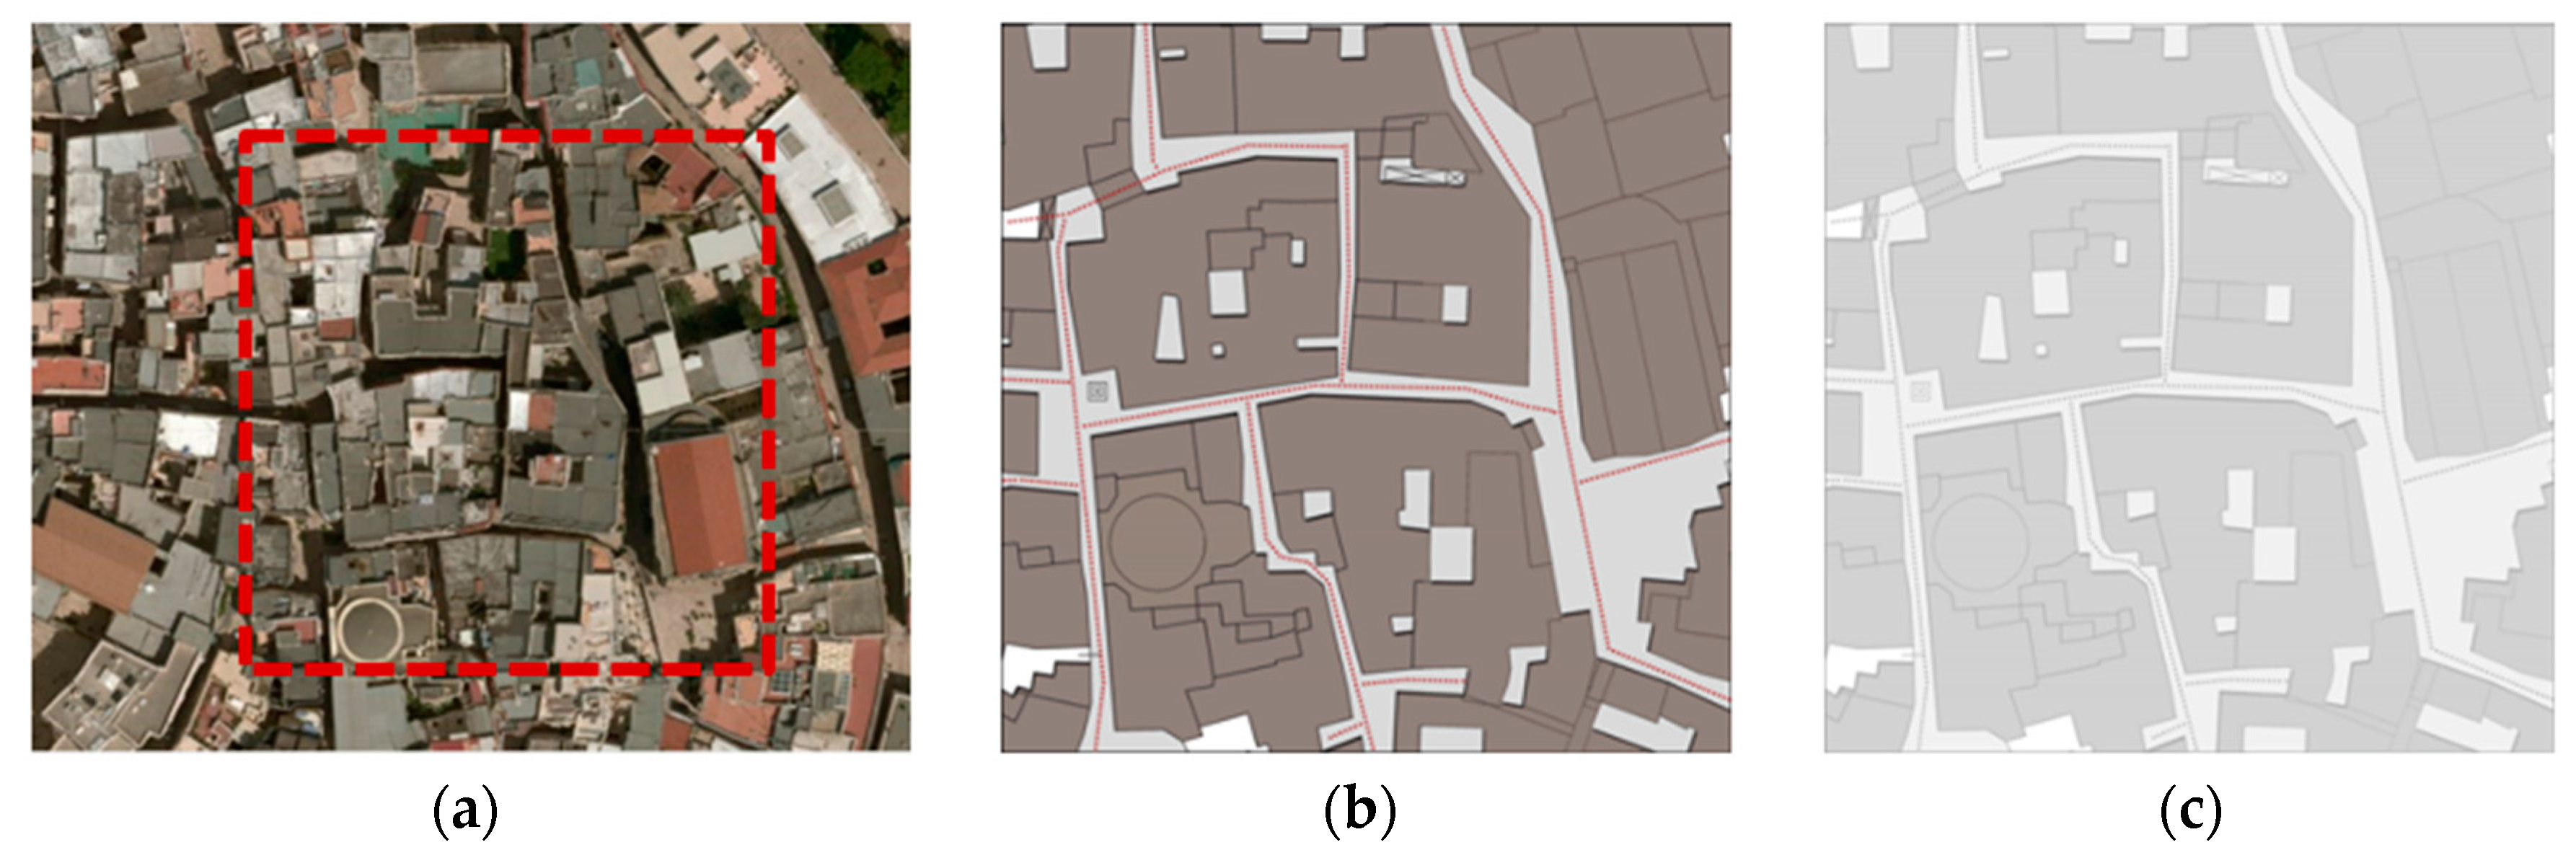
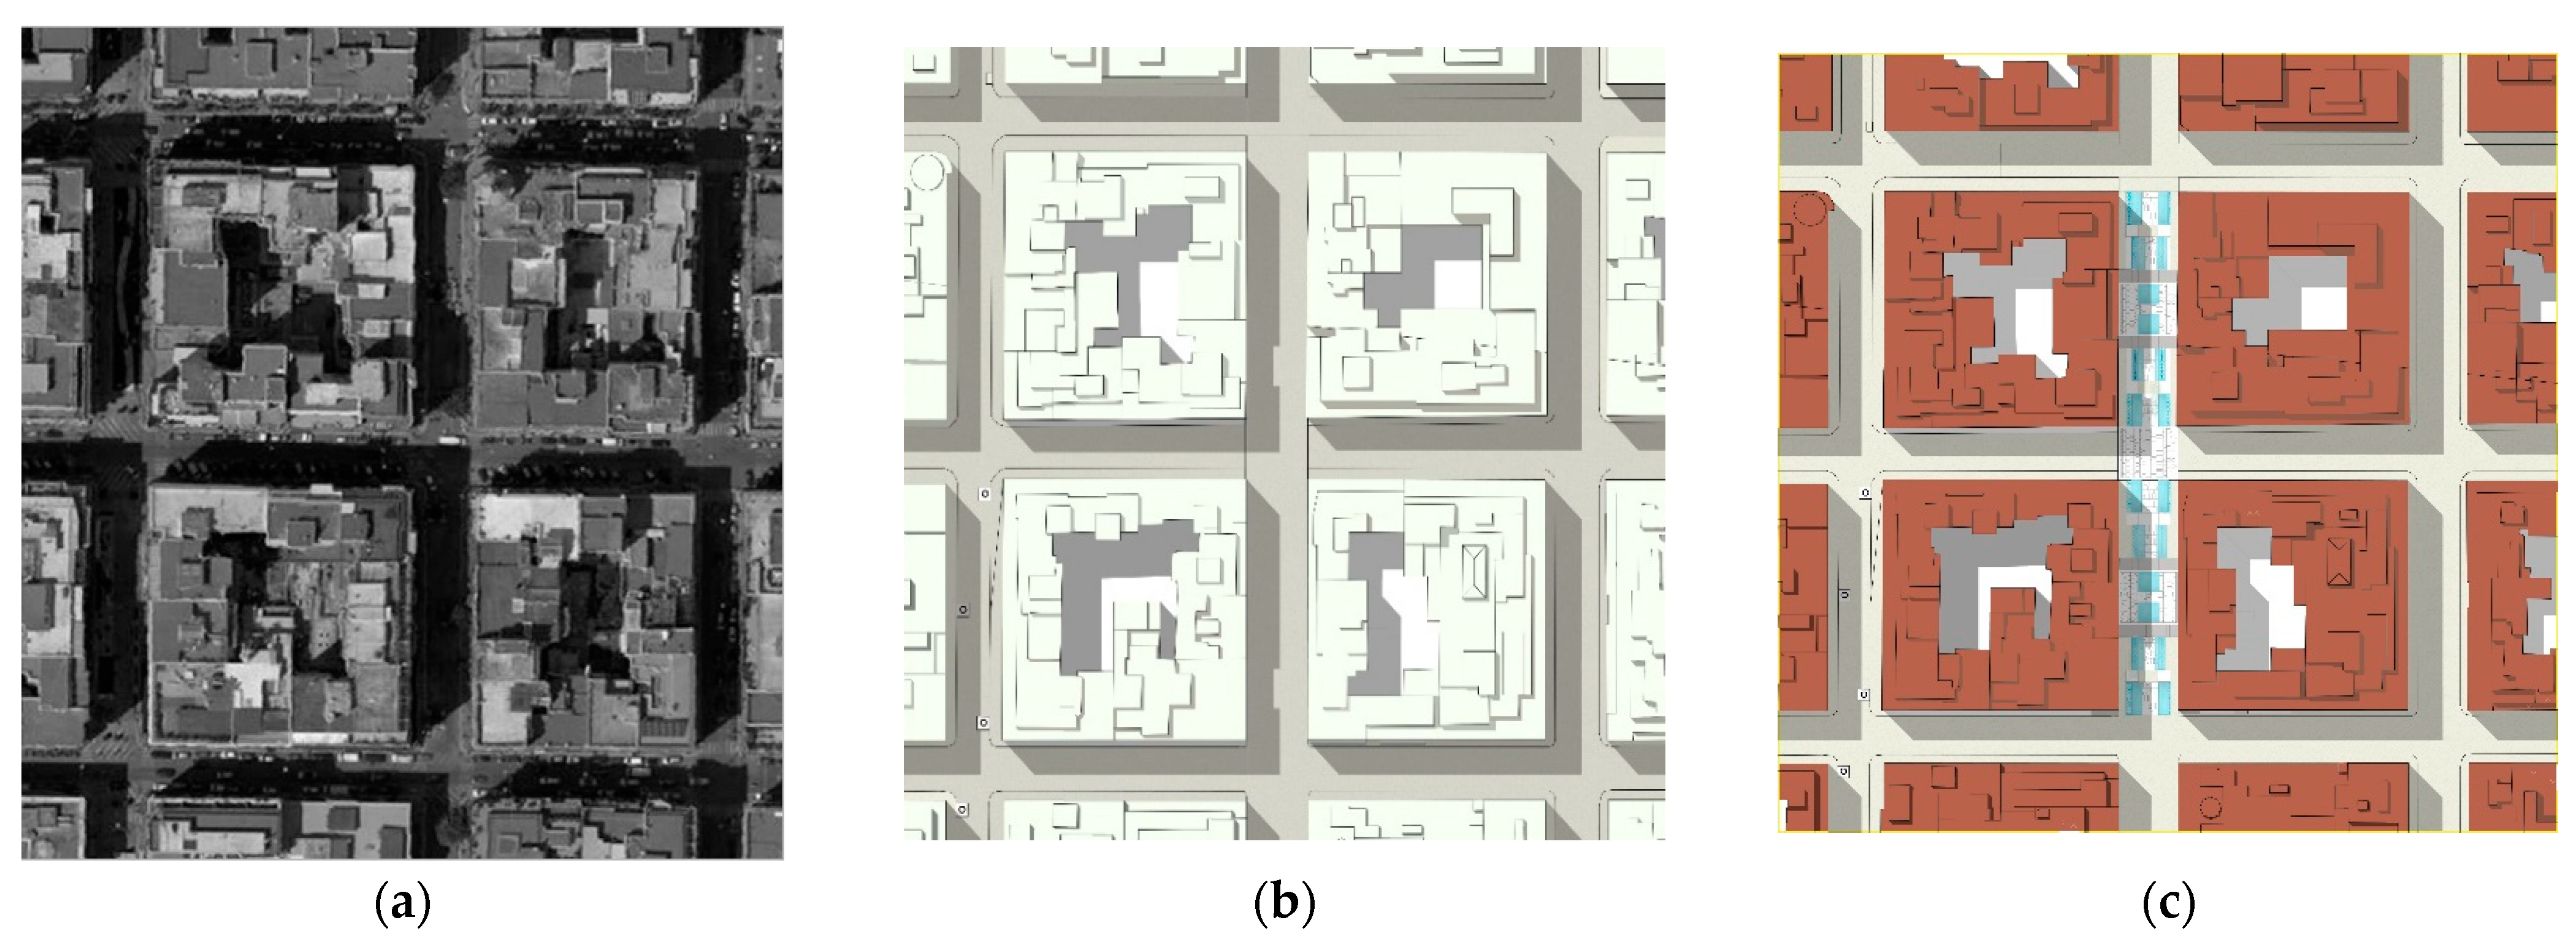
As regards the Murat Quarter (RF), the area considered for the simulations is 39.204 m
2 and it is characterized by a regular urban grid (
Figure 6a,c).
In contrast to the thermographic survey of the historical fabric, in the same time frame, most of the urban canopy of modern fabric shows a temperature range of approximately 33 to 47 °C. The infrared image makes more evident how the lack of shading causes the high value of radiated heat (
Figure 6b).
The wall face of the modern district is, instead, predominantly made of perforated bricks interspersed with an air space.
The study was conducted by examining an important pedestrian artery of the Murat district, called “via Argiro”. Recently, restyling works were carried out on the road surface, which did not result in an improvement in reflectance, being made with dark-colored stamped asphalt, and therefore with a low albedo value of 12% (
Figure 6d–f).
The materials’ characteristics were set up in the model as illustrated in
Table 2.
The different models were analyzed through ENVI-met with the appropriate number of receptors: four receptors in the historical fabric model and five in the regular fabric one (
Figure 5a and
Figure 6a). Receptors R
HF 1, 2, 3, and 4 in the HF_model were placed in order to analyze the Venturi effect, given by the morphological conformation of the streets. The five receptors in the RF_model were included to strategically deepen the climatic conditions of the predefined points.
With respect to the two districts, both the climate data from Bari Airport Station (HF_Base and RF_Base) and the measured climate data (HF_BaseM and RF_BaseM) were taken into account for the typical summer day. This is because it was considered interesting to highlight the variations between the two different datasets and the impact they have on the results of the analyses conducted. Instead, the Bari Airport Station data were considered for the hottest day as a projection of the heat waves and extreme temperatures.
3.4. Mitigation Scenarios
In the consolidated city, it is not always possible to carry out interventions on buildings. Bari, like many other historical cities, has spaces with different morphological and identity characteristics, characterized by small streets and irregularly shaped buildings.
In compliance with the technical implementation rules [
56], for the Historic Centre of Bari (zone A1), it was decided to propose the cleaning of exposed masonry and existing pavement and painting of facades as a mitigation scenario. Therefore, the only realizable mitigation scenario in the historical fabric was the proposal to increase the albedo value to 65%, following the cleaning and maintenance works (
Figure 7). This value has been chosen considering the actual characteristics of the historical masonry. Moreover, as stated in [
38], it should be noted that higher albedo values (above 0.8) are only applicable for clean coated surfaces and may cause visual discomfort (glare), and thus, intermediate albedo values are more suitable.
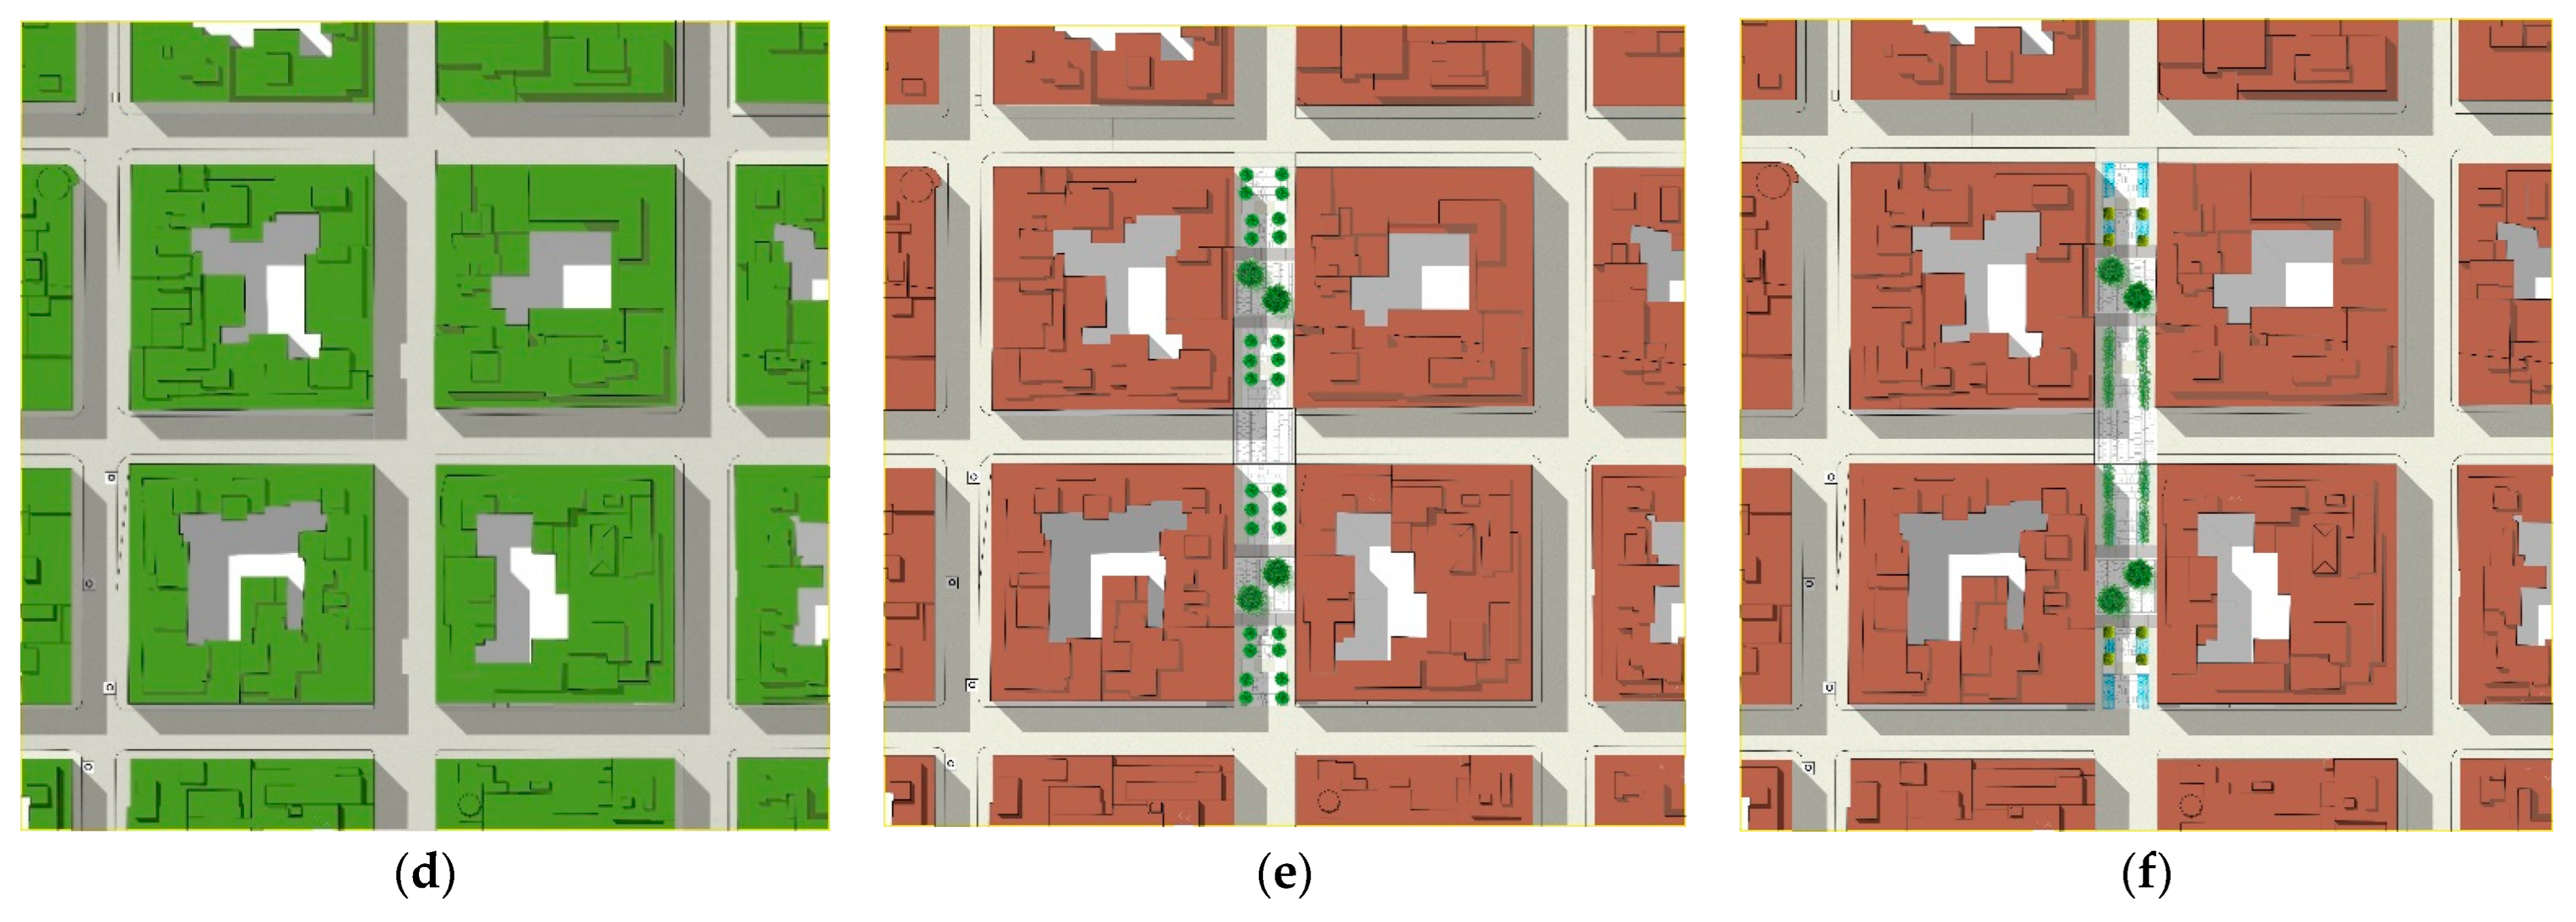
For the modern district, starting from the base model, more urban mitigation solutions were proposed, such as the design of water features, tree and shrub belts, and a combination of the aforementioned strategies (
Figure 8). In addition, the implications of lighter-colored finish layers on the external microclimate were examined, altering the albedo of the walls from 40% to 65%. A combination of wider and narrower paths reminiscent of the historic fabric was created and then the effects of incorporating vegetation, water features, and green roofs were analyzed.
In order to favor evapotranspiration, a study of greenery was carried out with the selection of climbing plants and trees with specific characteristics: deep root system and dense foliage to favor shading, such as the field maple tree [
57].
Table 3 provides a synthesis of the considered scenarios for the two cases.
The mitigation scenarios were simulated under typical and extreme temperature conditions, useful as projections of possible heat waves, comparing the results with the base models.
4. Results and Discussion
4.1. Receptor Data Comparison of Historical Fabric and Regular Fabric
The analyses were carried out for all receptors and for each scenario. Nevertheless, when examining the data, specific and noteworthy receptors were selected.
As an example, the graphics of the air temperatures of historical fabric and regular fabric for the measured weather data on a typical day and for extreme conditions are shown in
Figure 9 and
Figure 10, respectively.
In both cases of the historical fabric, RHF1 is selected for the analysis because it shows an average trend, with the air temperature decreasing especially during the hottest hours. It is due to the shading from facades and the morphological characteristics of the streets. RHF1 exhibits the lowest air temperatures during the central hours; hence, it can also be used as a reference for comparison with the regular fabric that presents generally higher air temperatures, as highlighted by the graphs. Regarding the regular fabric, the trends of receptors are generally more uniform and the choice of the representative one is more arduous. RRF2, due to its central location in the canyon of the regular fabric, shows an intermediate behavior, representative of the entire urban canyon. Receptor RRF3 was included to assess boundary conditions but is located outside the pedestrian road under study; therefore, it was not chosen for comparison with RHF1. Meanwhile, RRF5 and RRF4 are affected by the proximity of buildings and are influenced by shading depending on the time of day.
After these considerations, RHF1 for the historical fabric and RRF2 for the regular one were assumed as the most suitable receptors for the subsequent analyses for the following two reasons. First, they are significant for each studied scenario for each case study; second, it is possible to demonstrate how the positive aspects of the Venturi effect, generated by the conformation of the streets in the old city center, could be returned to the Murat district through urban mitigation design hypotheses. All the analyses and results are generally extensible to the other receptors.
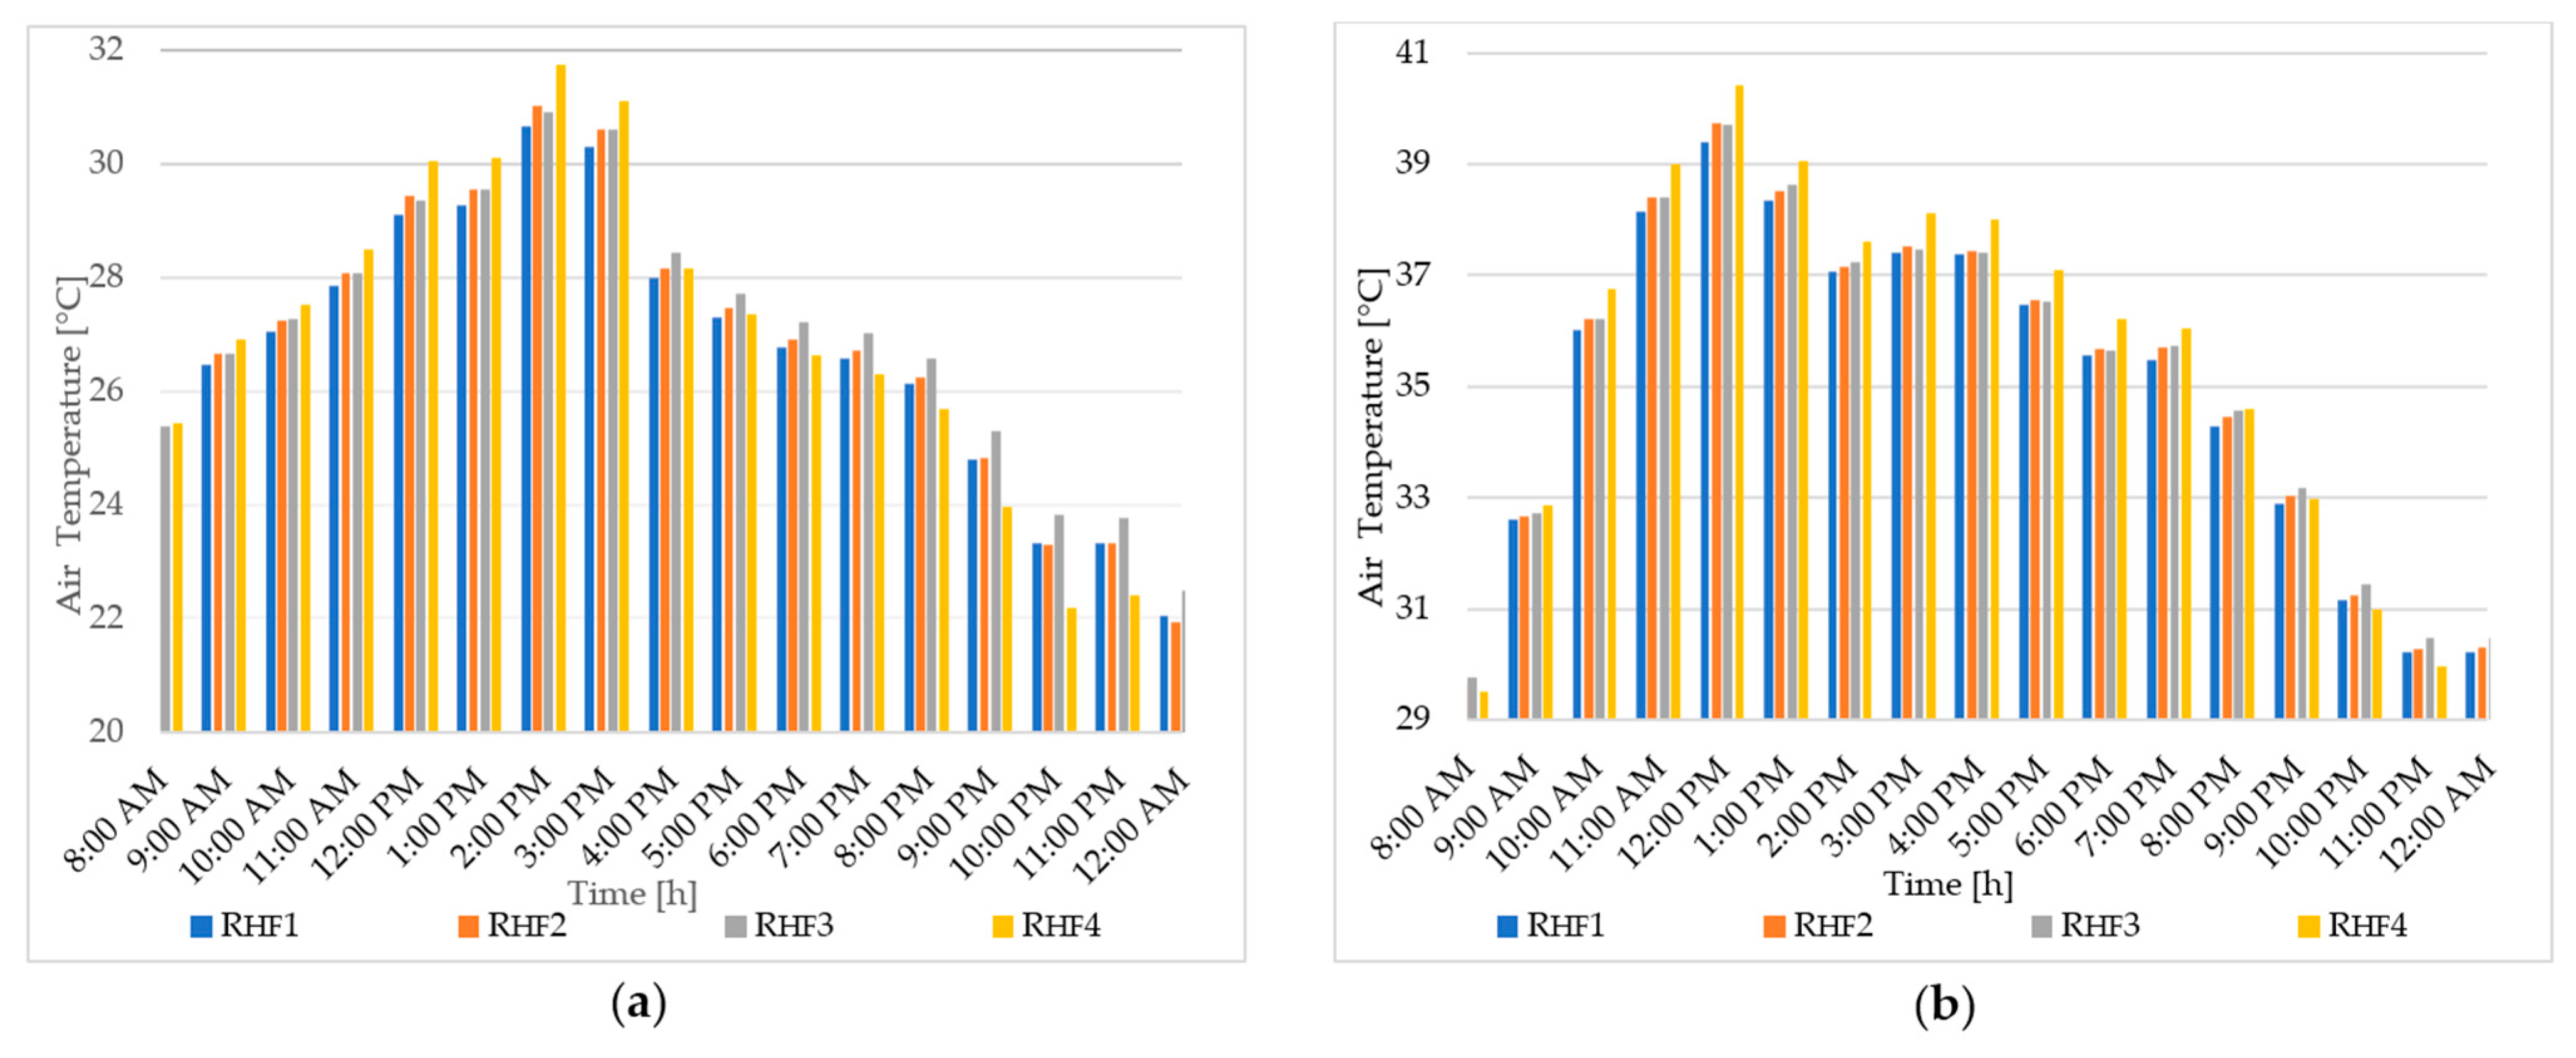
4.2. Historical Fabric Results at the Chosen Receptor and False-Colored Maps
For the typical summer day, upon comparing the air temperatures recorded for RHF1, using both the measured data and the readings from the weather station, it becomes apparent that the air temperatures obtained are more elevated in the “BaseM” scenario than the Base scenario. This is particularly noticeable during the hottest hours.
As can be seen from the data in
Figure 11a and the thermographic analyses (
Figure 5b,c), the values recorded by the weather station have lower values than those measured, especially during the 12:00 a.m.–2:00 p.m. hours. In some cases, there is an increase in T
a of more than 2 °C in the historical fabric at the hottest peak of the day.
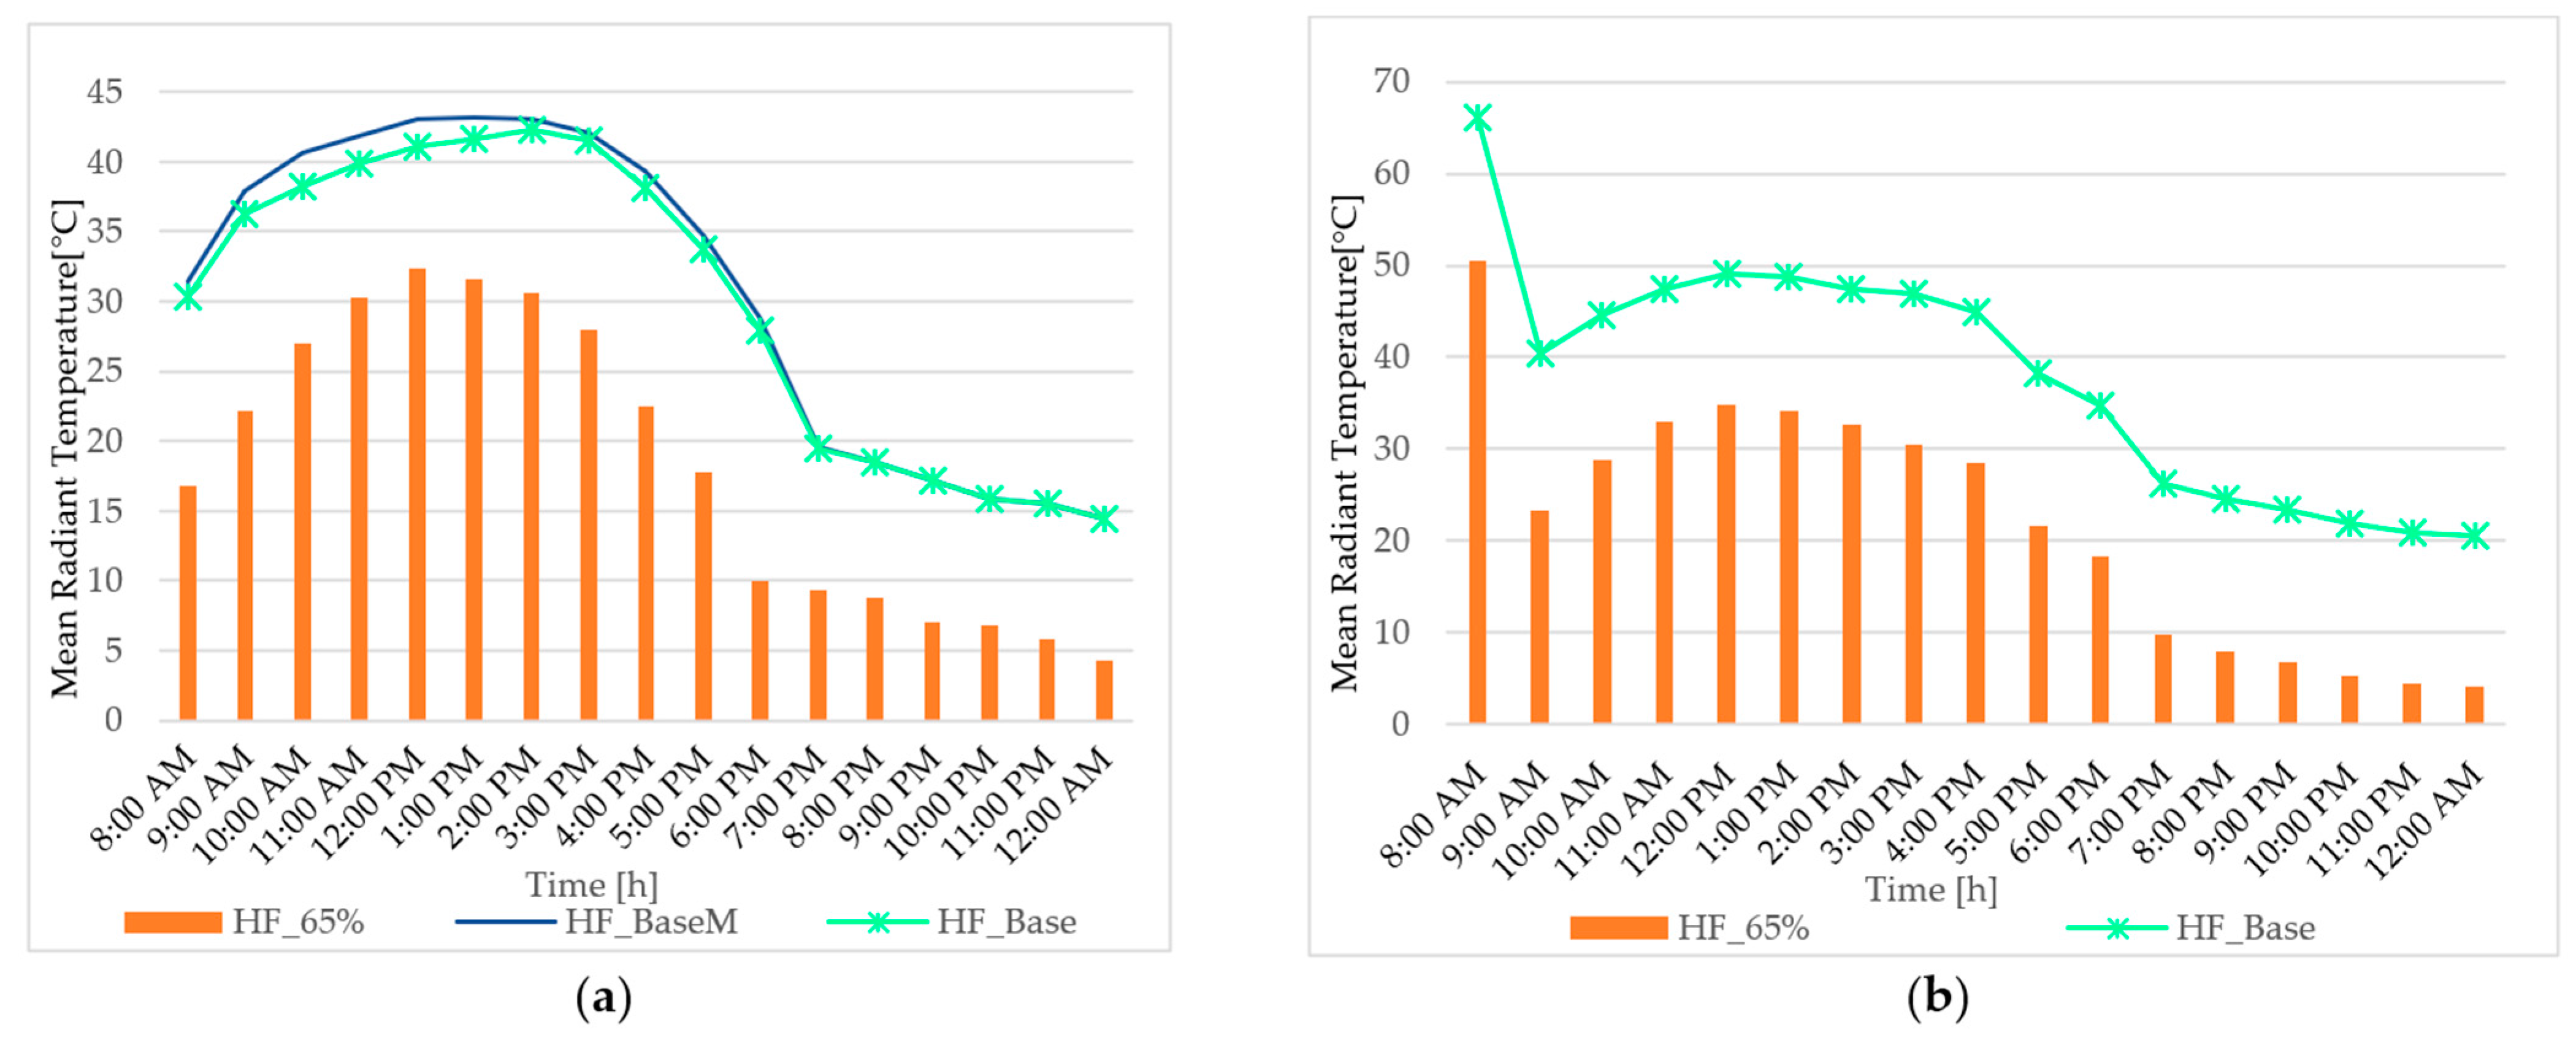
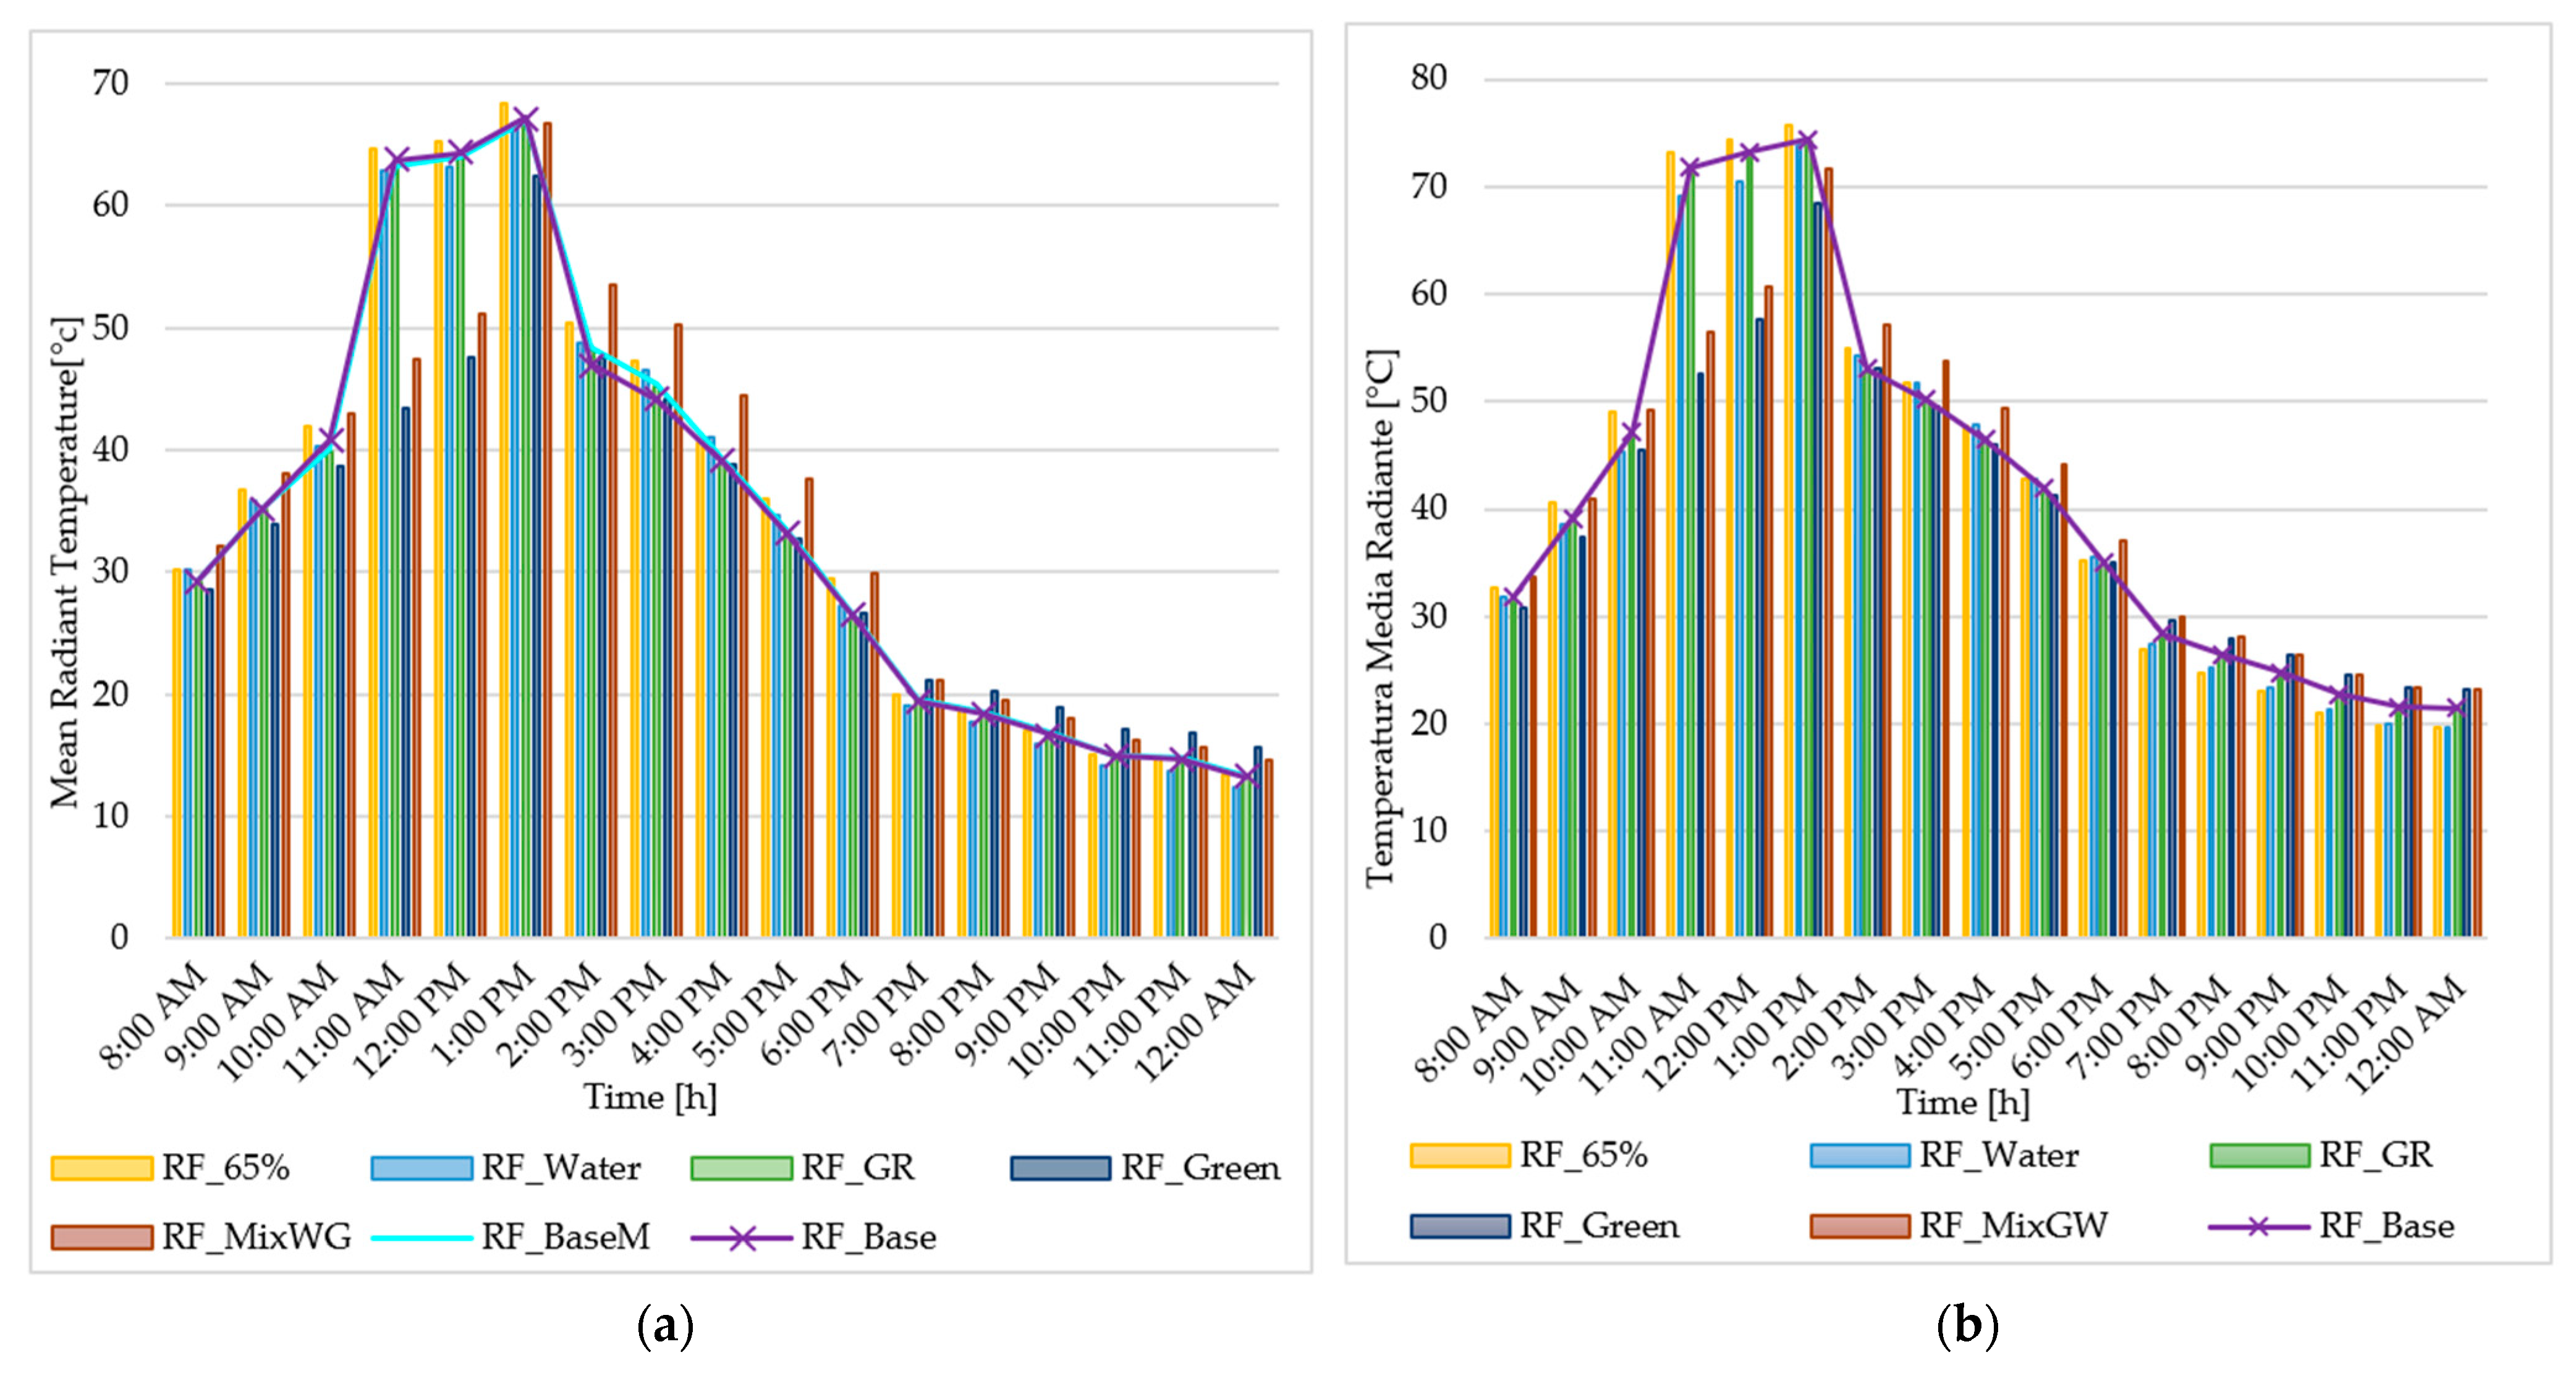
In addition to the graphs of air temperature (T
a), the trends of mean radiant temperature (T
mrt), relative humidity (
Figure 12 and
Figure 13), and wind velocity in the different scenarios at the receptor upon comparing the air temperatures recorded for R
HF1 were produced from simulation results.
During the thermal peak hours, on a typical summer day, the historical fabric records T
a values 2.17 °C higher in HF_BaseM than in HF_Base, while for the mitigation scenario HF_65%, T
a decreases by 1.88 °C, with a slight difference at 3:00 p.m., equal to 2.08 °C, versus HF_BaseM (
Figure 11a). Instead, on the hot extreme day, the maximum difference is maintained in the range from 2:00 p.m. to 4:00 p.m., equal to 2.60 °C (
Figure 11b). Similarly, for T
mrt, HF_65% always exhibits lower values for the whole day than HF_BaseM, versus HF_Base (
Figure 12a) on the typical day. The same mitigation effect of HF_65% on the T
mrt trend is shown in
Figure 12b for the hot extreme day versus HF_Base.
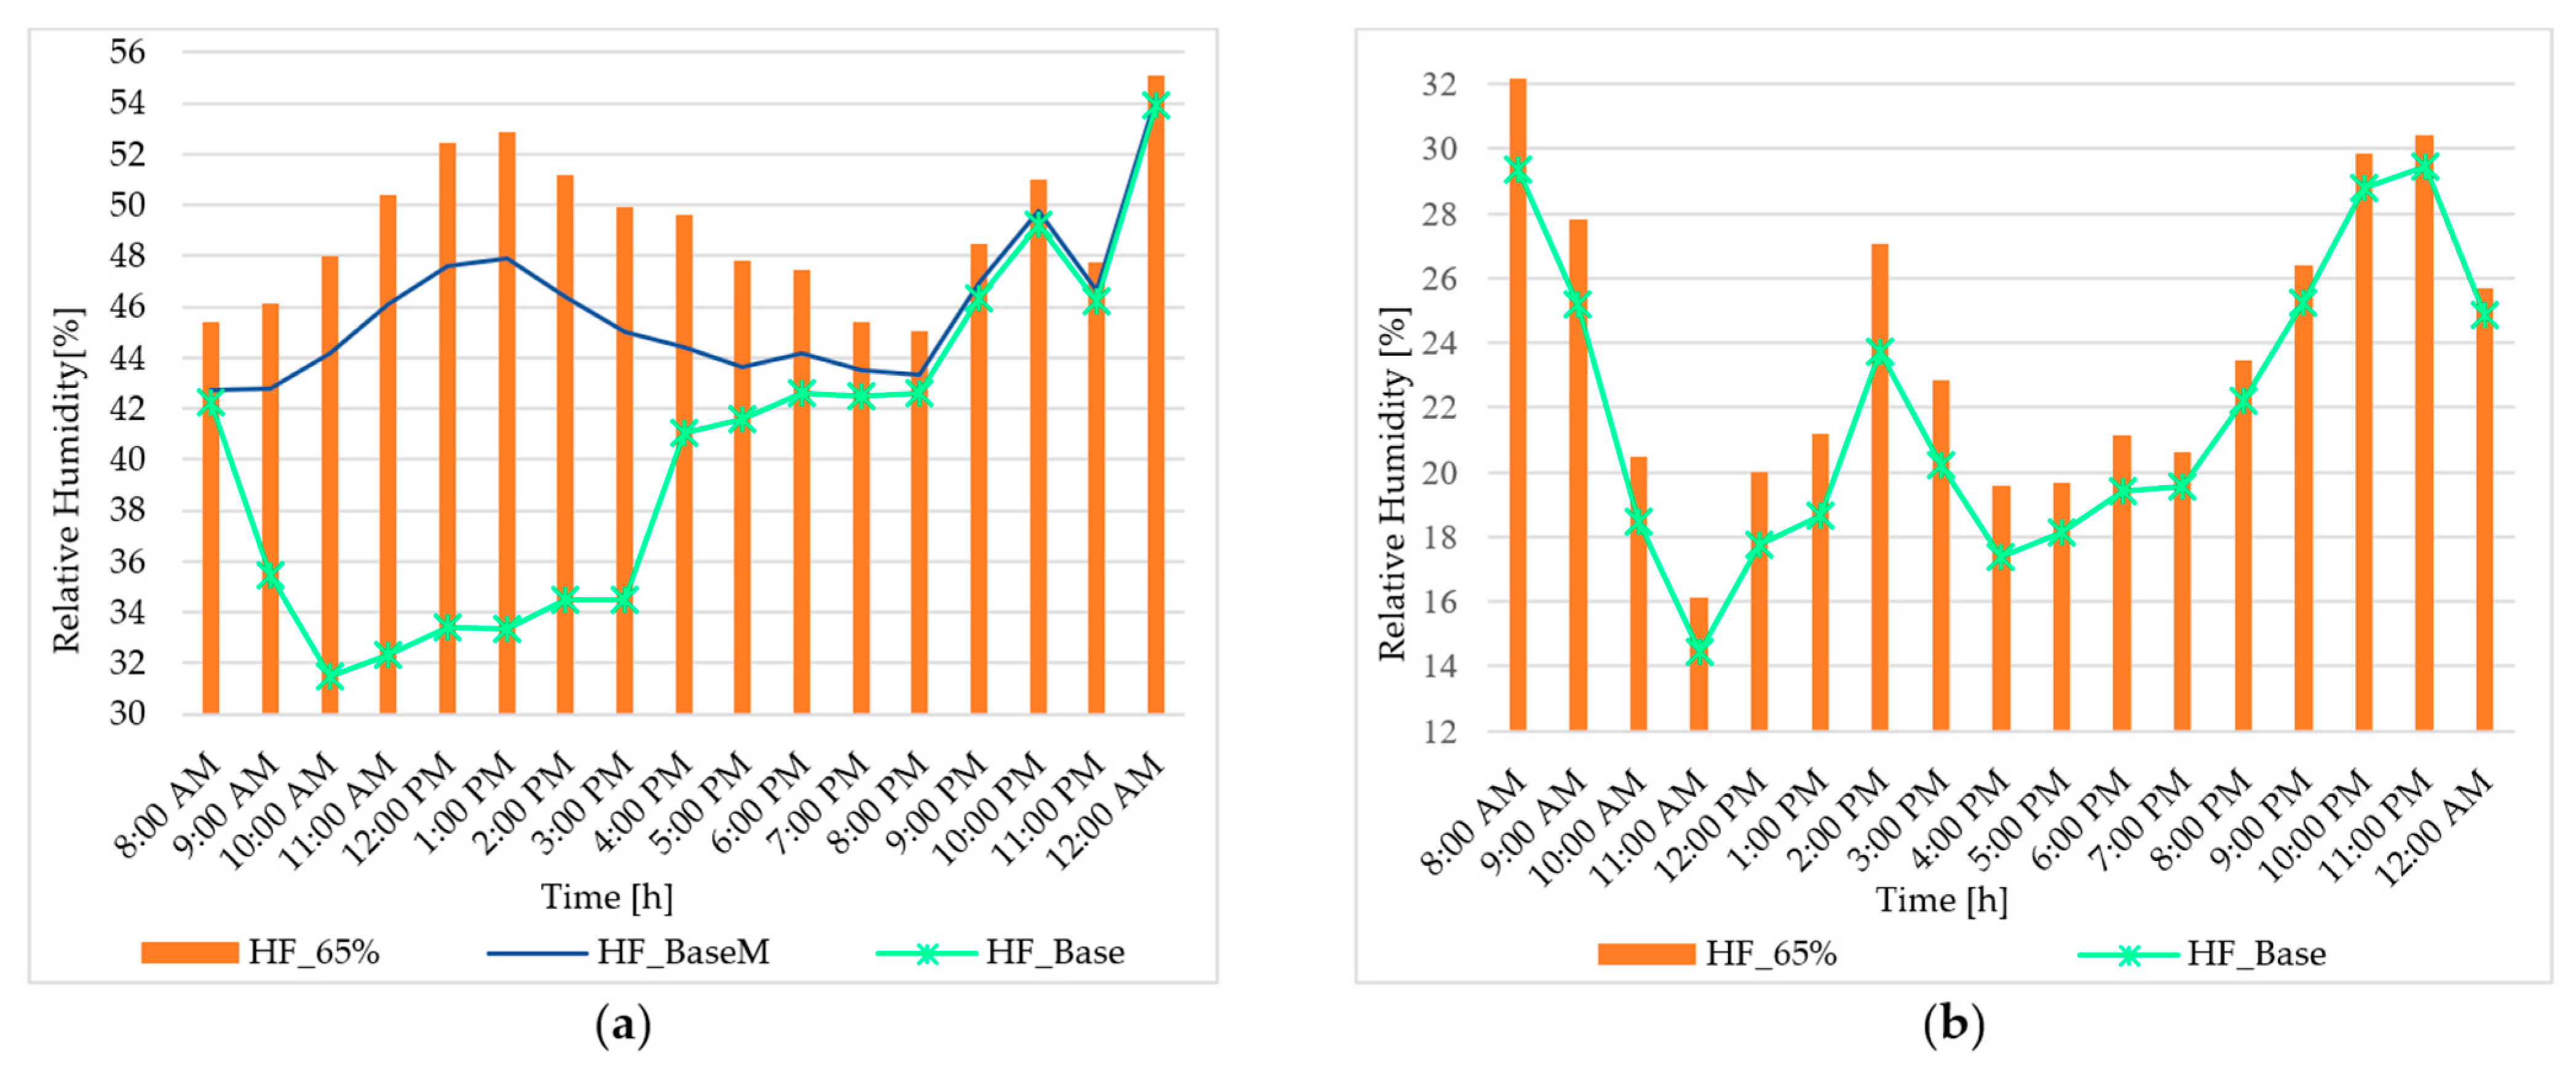
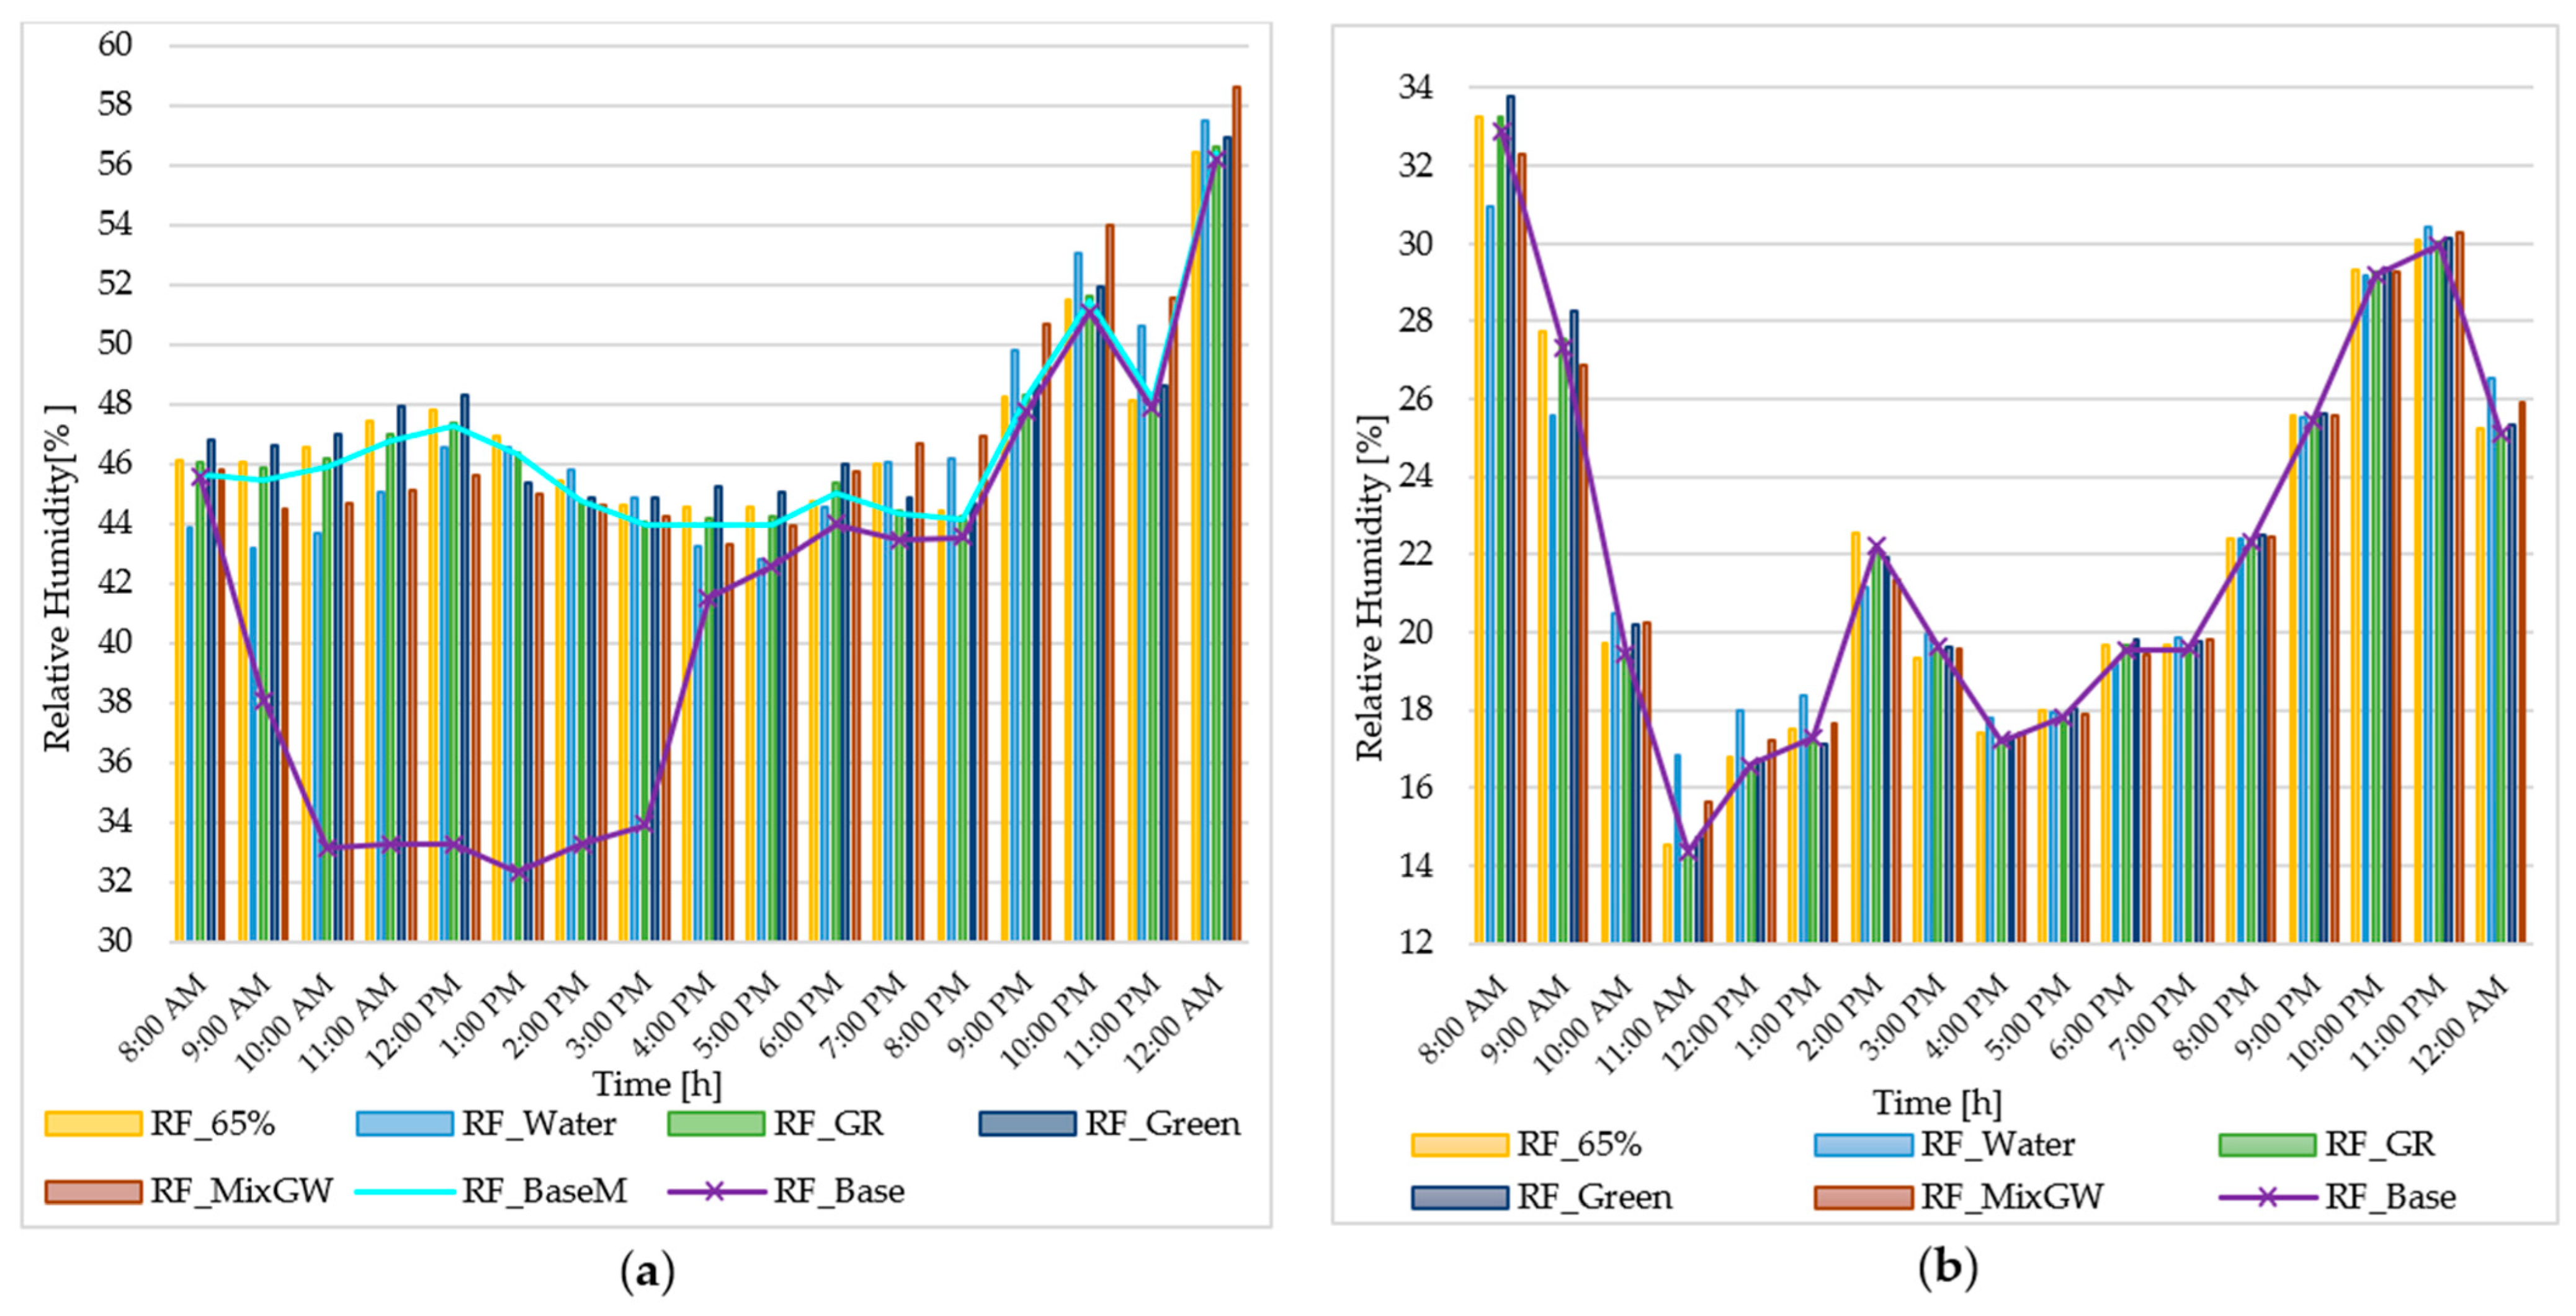
Regarding relative humidity, it is higher for HF_65% due to the lower temperature of HF_Base in both scenarios (
Figure 13). The wind speed graph does not change significantly between the HF scenarios because they make no changes to the surface of the urban canyons.
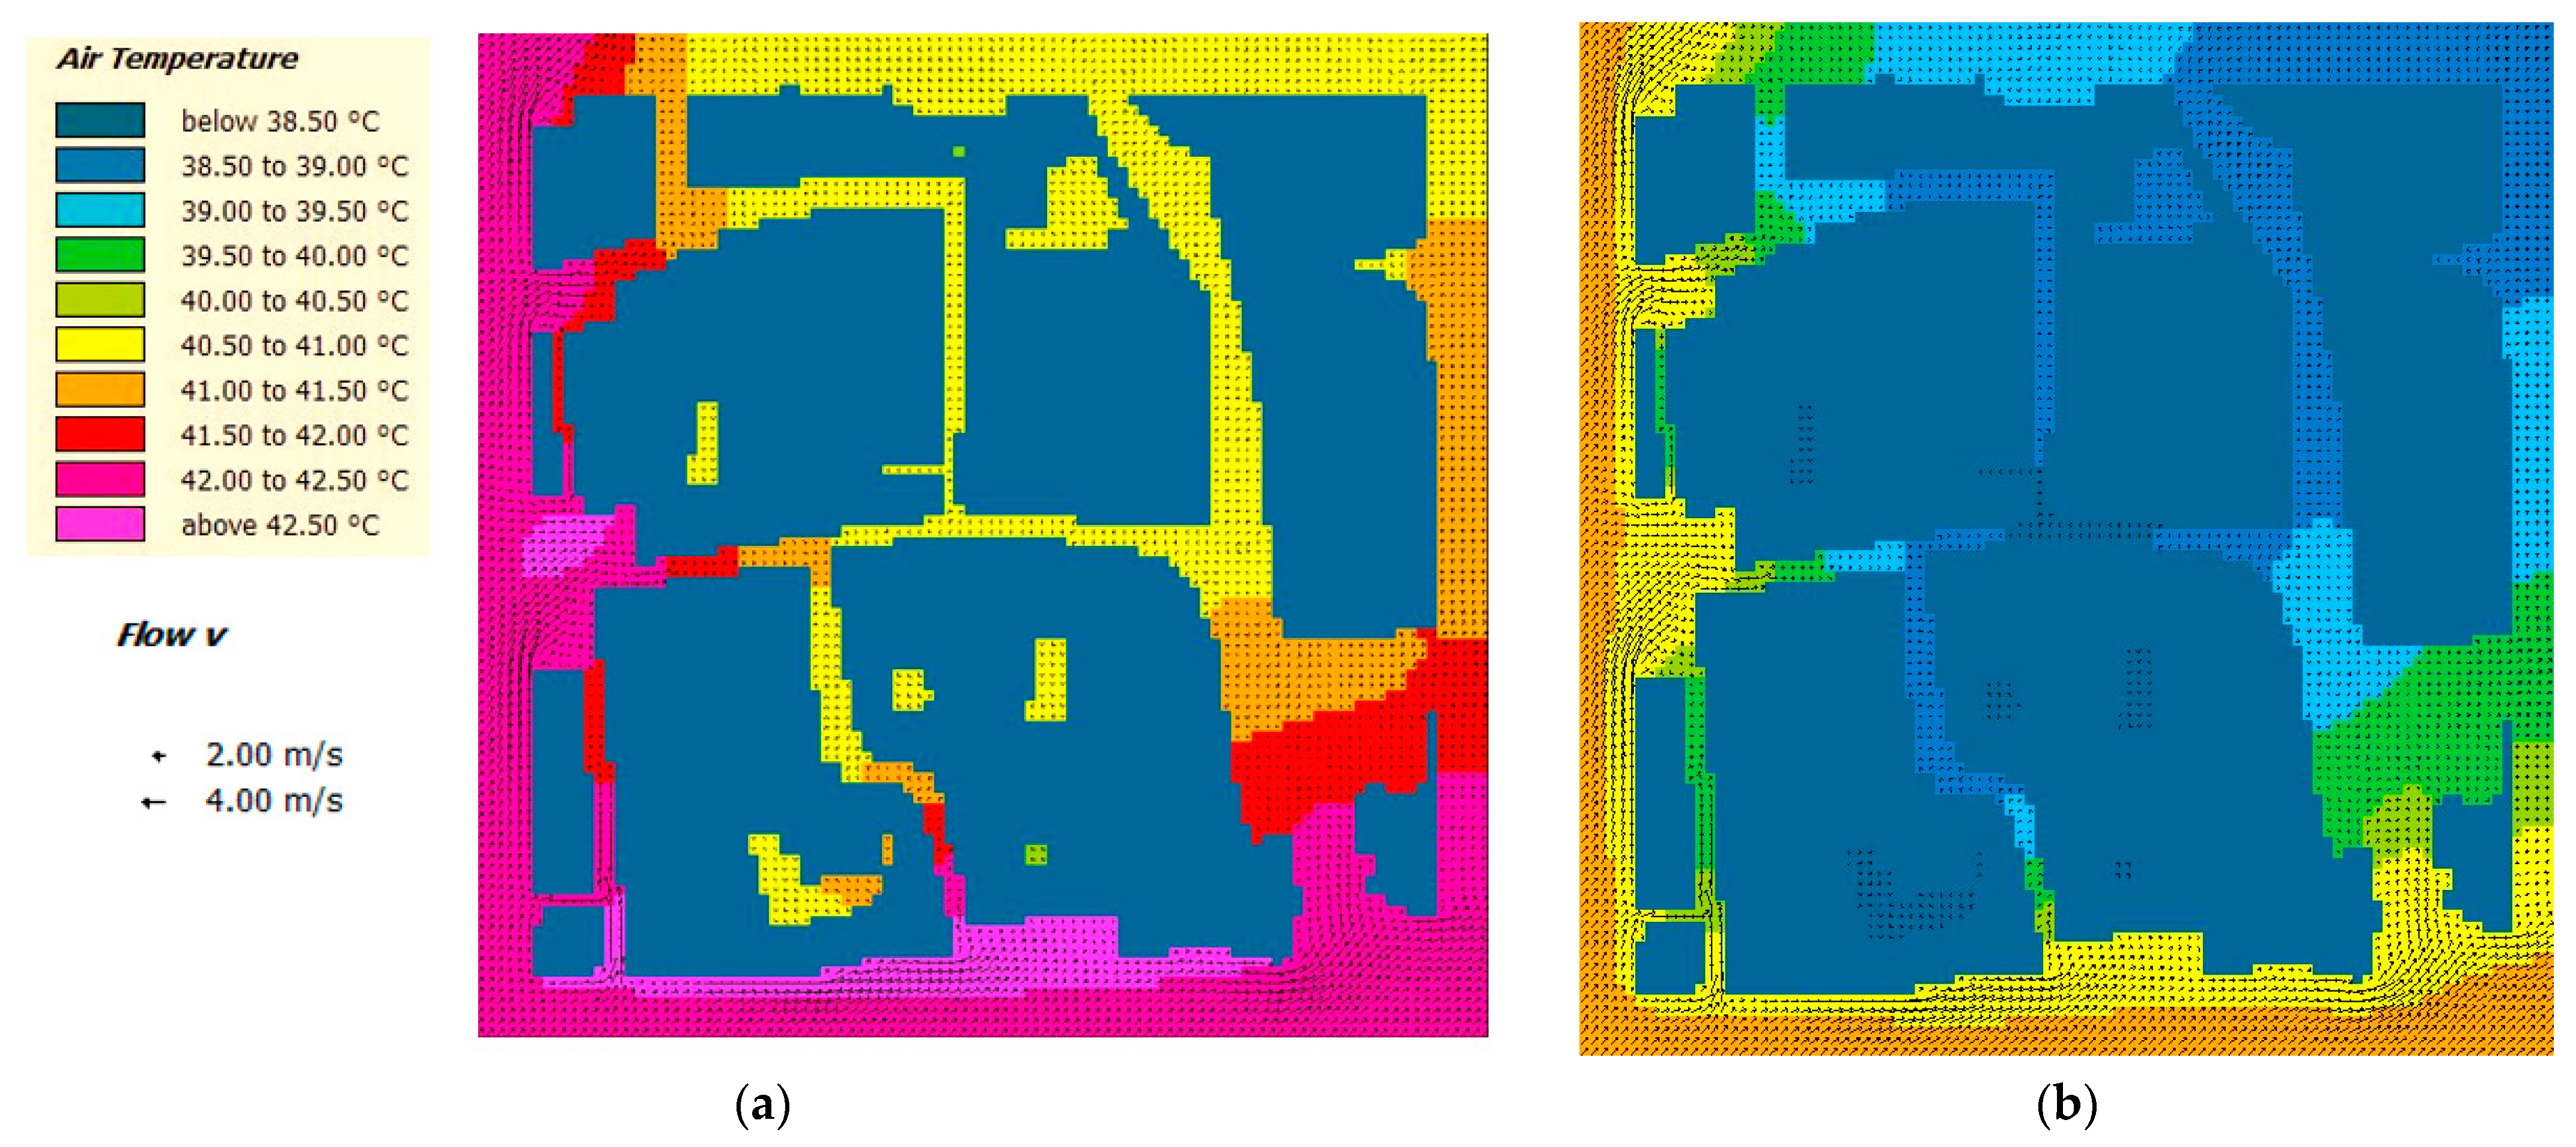
In the historical fabric, an acceleration in airspeed is shown in the maps of the historical district for the Venturi effect where there is a narrowing of the street (
Figure 14). In the maps obtained, the increase in temperature for the HF_BaseM scenario with measured data is evident compared to the HF_Base scenario with climatic data from the weather station. Moreover, the scenario HF_65% achieves a general reduction in T
a with respect to HF_BaseM, resulting in a good result in terms of heat mitigation. This is even more evident in the case of the comparison between HF_Base and HF_65% in hot extreme temperature conditions (
Figure 15). As can be seen from the false-colored maps, the streets analyzed are predominantly in the temperature range of 30.60 to 31.40 °C for HF_65% on the typical summer day, while for HF_BaseM, the temperatures are between 32.20 and 33.00 °C. On the hot extreme day, a similar situation occurs with regard to the reduction in temperature for HF_65% compared to HF_Base.
Finally, a map of the sky view factor was derived, as shown in
Figure 16.
The sky view factor is a non-dimensional parameter between 0 and 1, defined as ‘the percentage of sky visible from a given position on the earth’s surface’. Extreme values refer to totally obstructed areas and open spaces.
It is an important indicator for the radiative geometry of a site, as it summarizes the ratio of radiation received or emitted from a flat surface to the radiation emitted or received from the surrounding hemispheric environment.
Therefore, the SVF expresses through a single value the influence of morphological factors at a specific point, allowing an estimation of relevant climatological information on a microscale.
The higher the SVF, the greater the amount of solar radiation that can reach the urban space during the day and also the greater the possibility of dissipating the re-emitted radiation back into the environment during the night [
58].
In the HF, the SVF is relatively low. This is due to the urban fabric’s morphology, which restricts the penetration of solar radiation, preventing the area from experiencing excessive overheating, since the urban fabric morphology does not allow the penetration of solar radiation, preventing the area from excessive overheating.
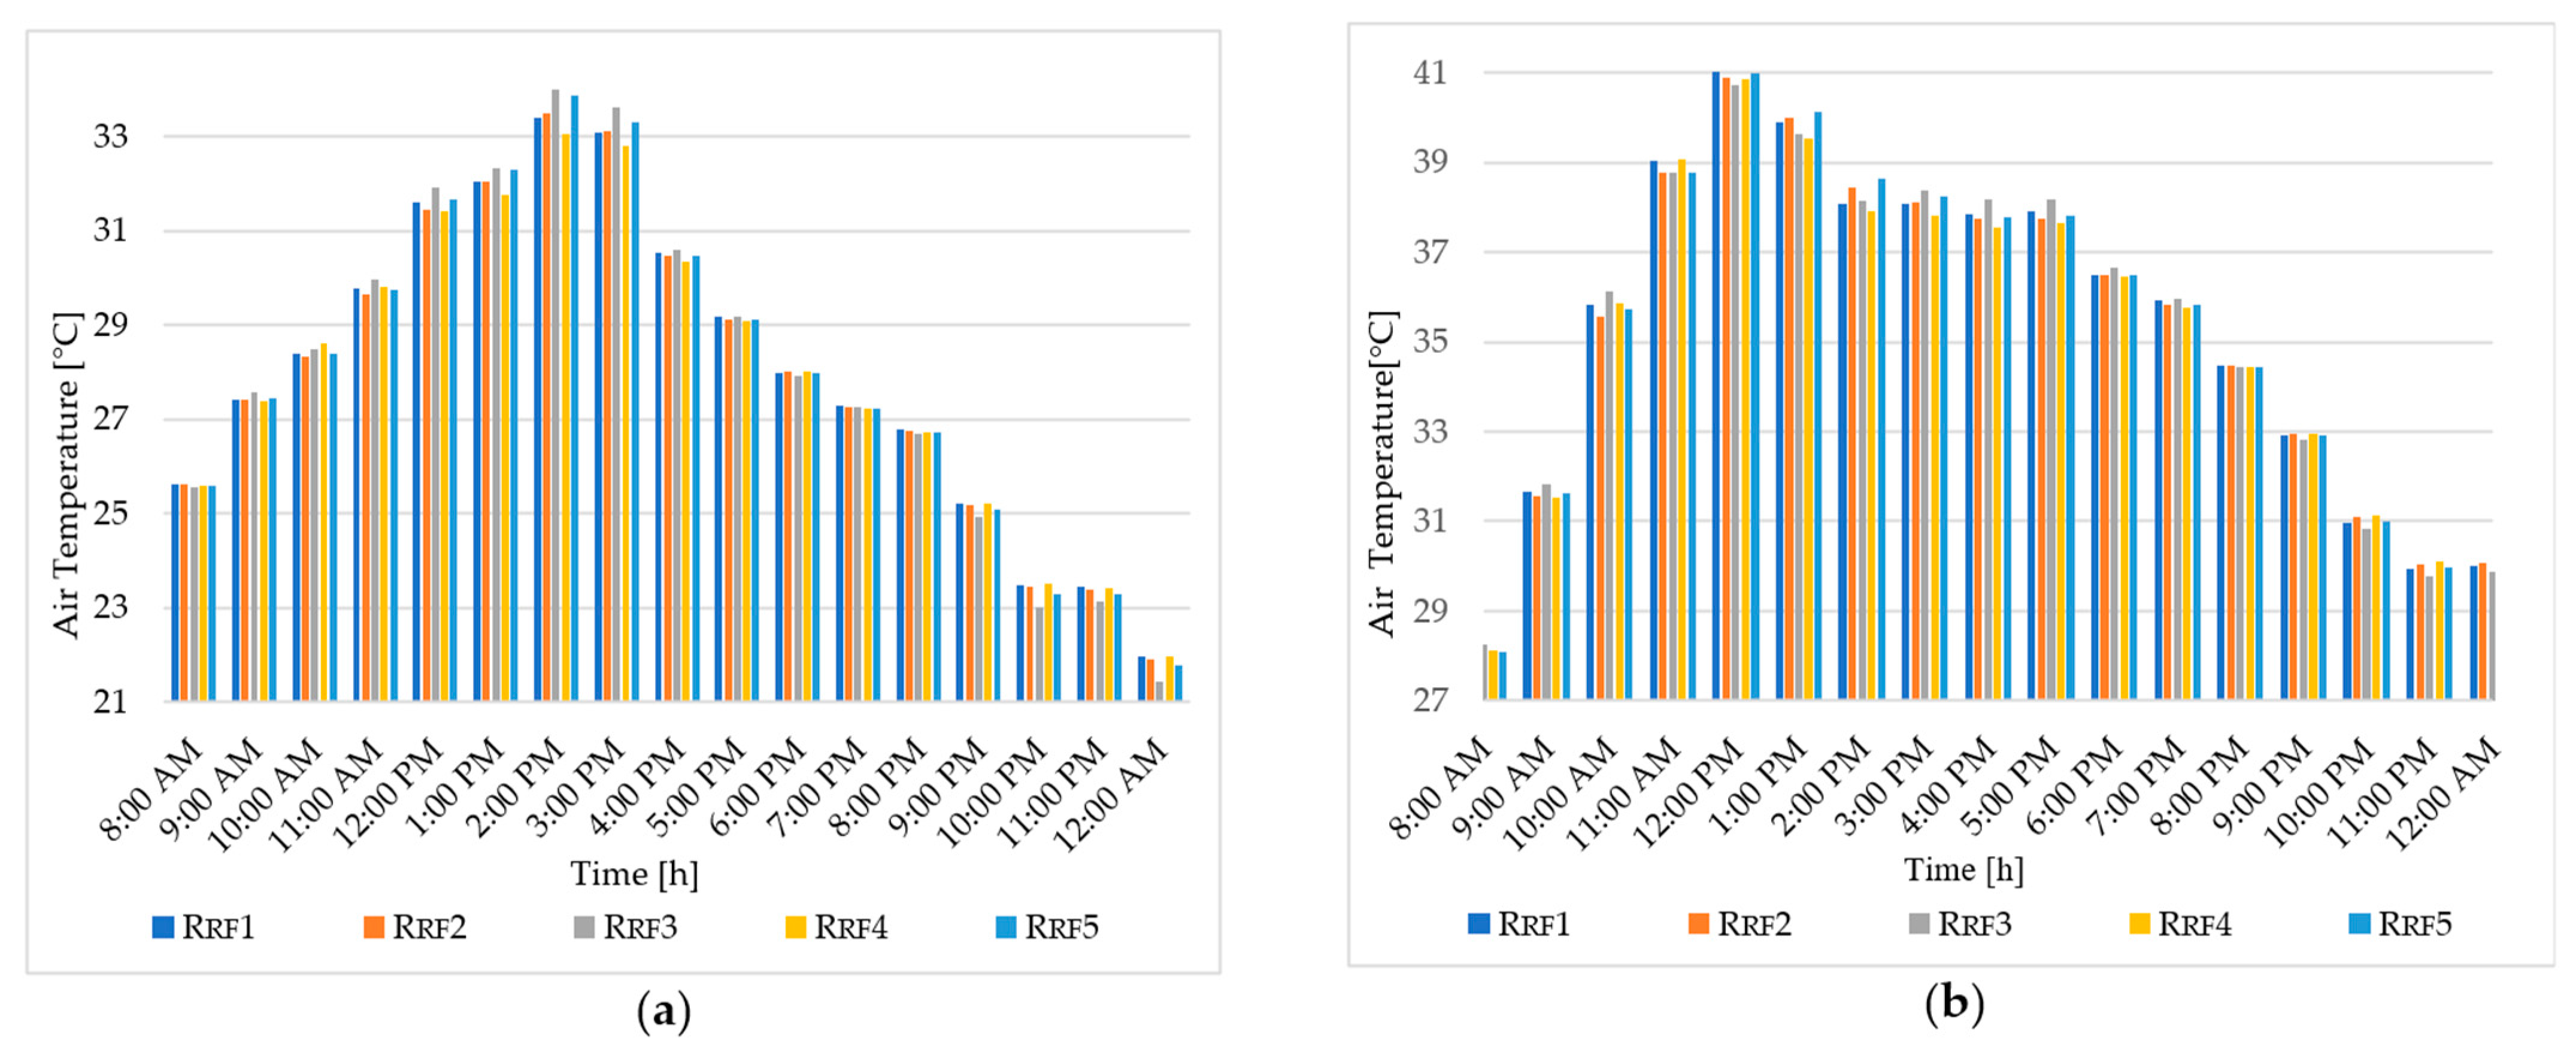
4.3. Regular Fabric Results at the Chosen Receptor and False-Colored Maps
The observed distinctions between outcomes under measured conditions (RF_BaseM) and those derived from meteorological station data (RF_Base) are also particularly pronounced for the regular fabric during periods of maximum thermal intensity and in proximity to receptors, such as RRF2 at 2:00 p.m.
During the periods of maximum thermal intensity, air temperature (T
a) experiences an elevation of 2.34 °C in RF_BaseM compared to RF_Base, as depicted in
Figure 17a. This emphasizes that the use of meteorological station data, as already verified for HF, leads to a substantial underestimation of thermal dynamics in the RF within the built environment.
The comparison of air temperature (T
a) and mean radiant temperature (T
mrt), relative humidity, and wind velocity between different scenarios at receptor R
RF2 in RF is presented
Figure 17,
Figure 18,
Figure 19 and
Figure 20.
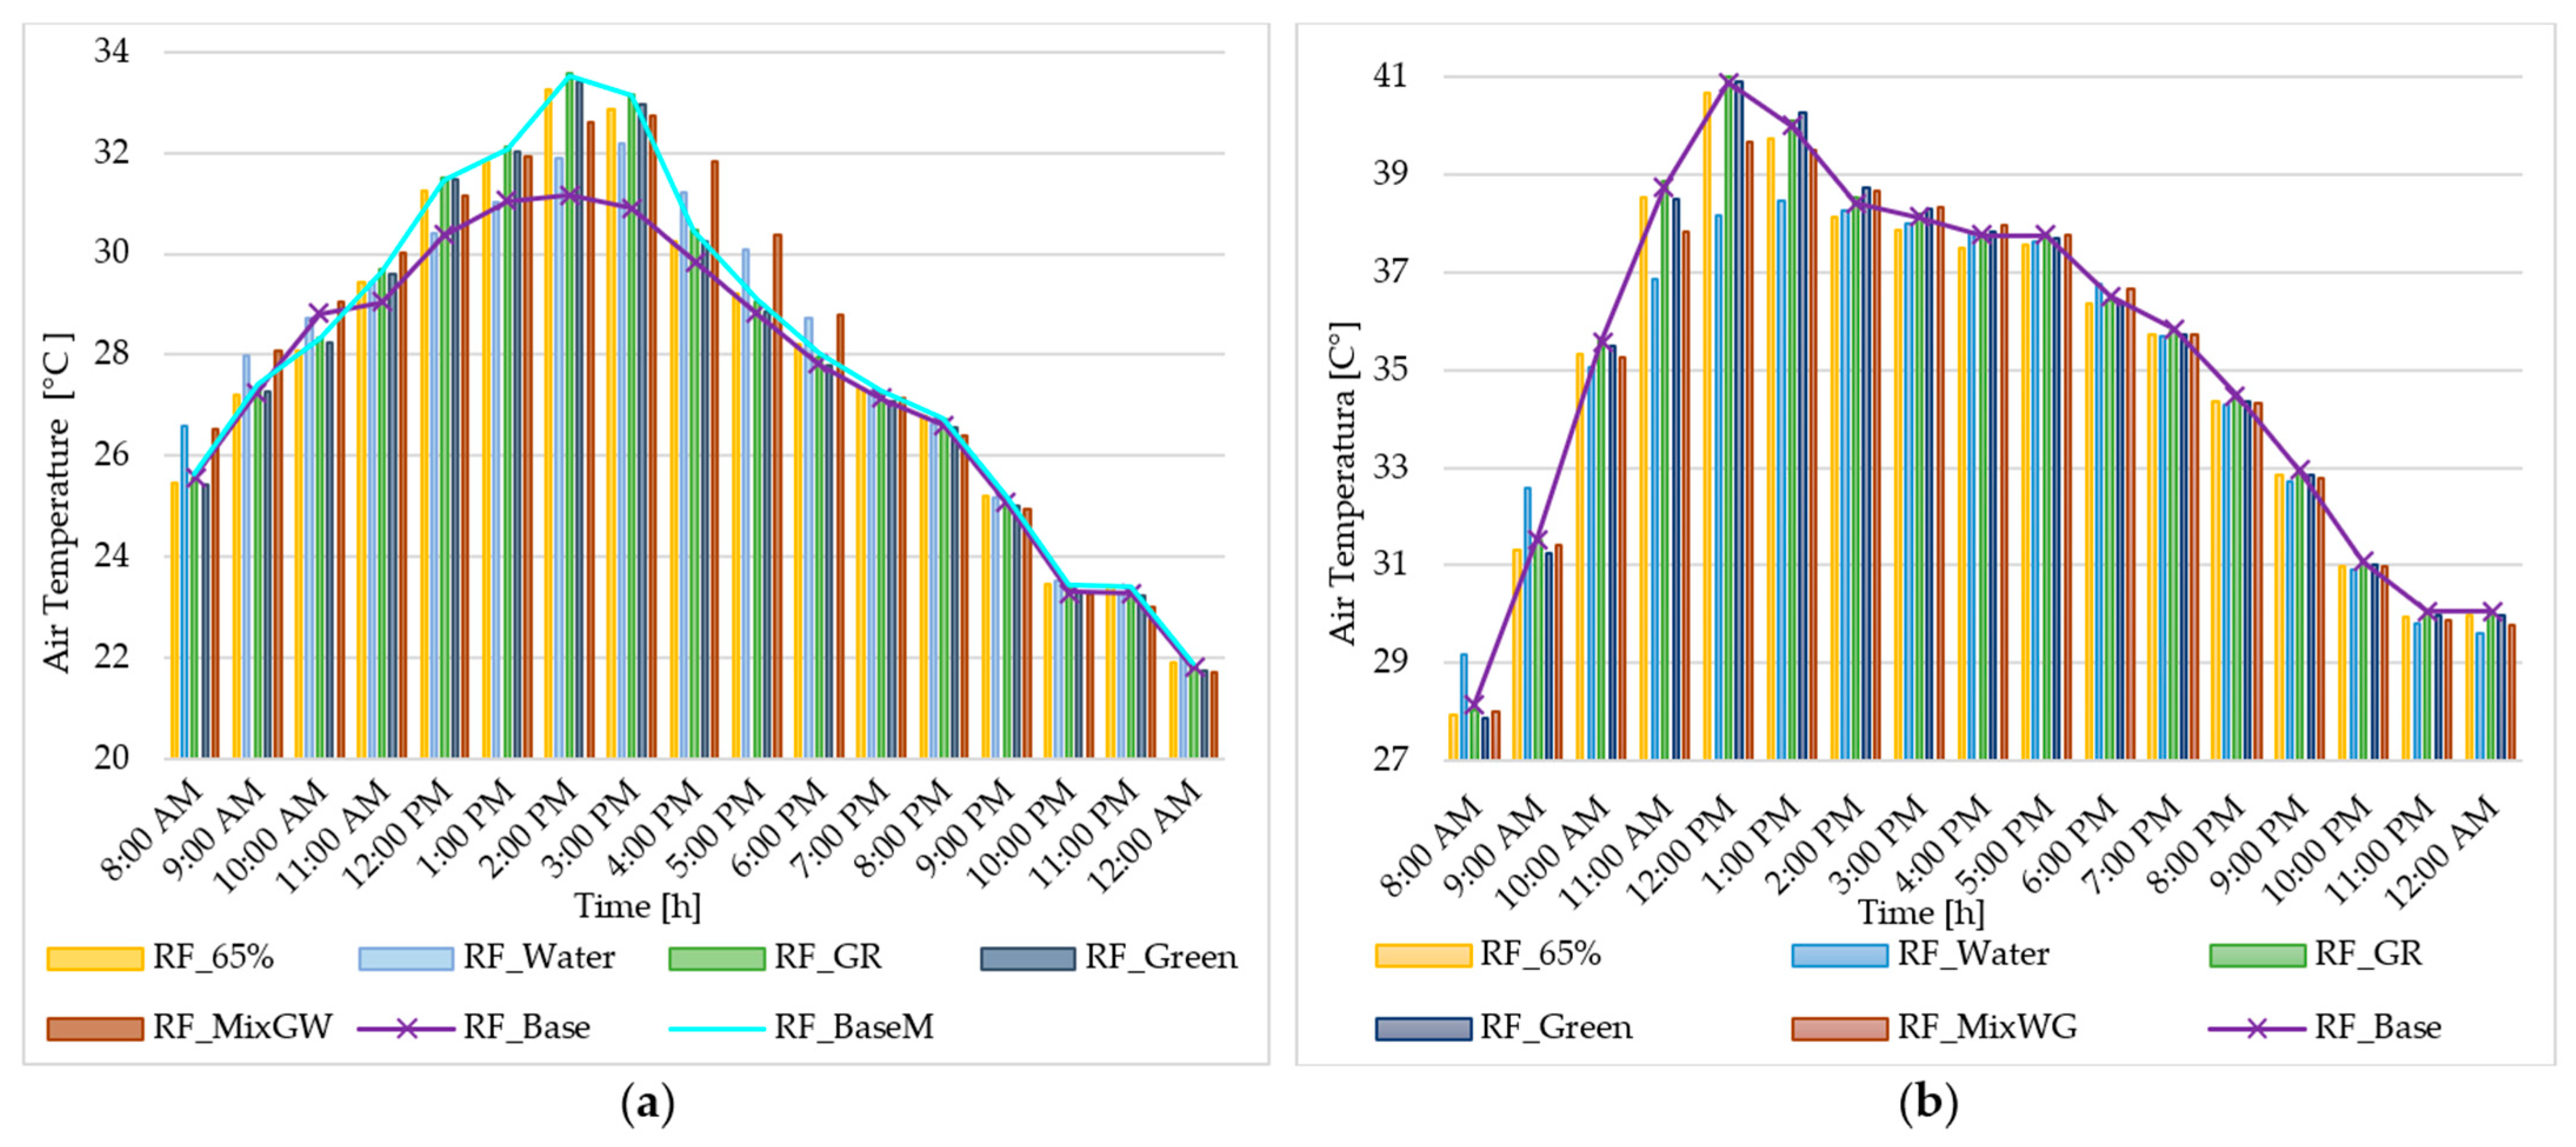
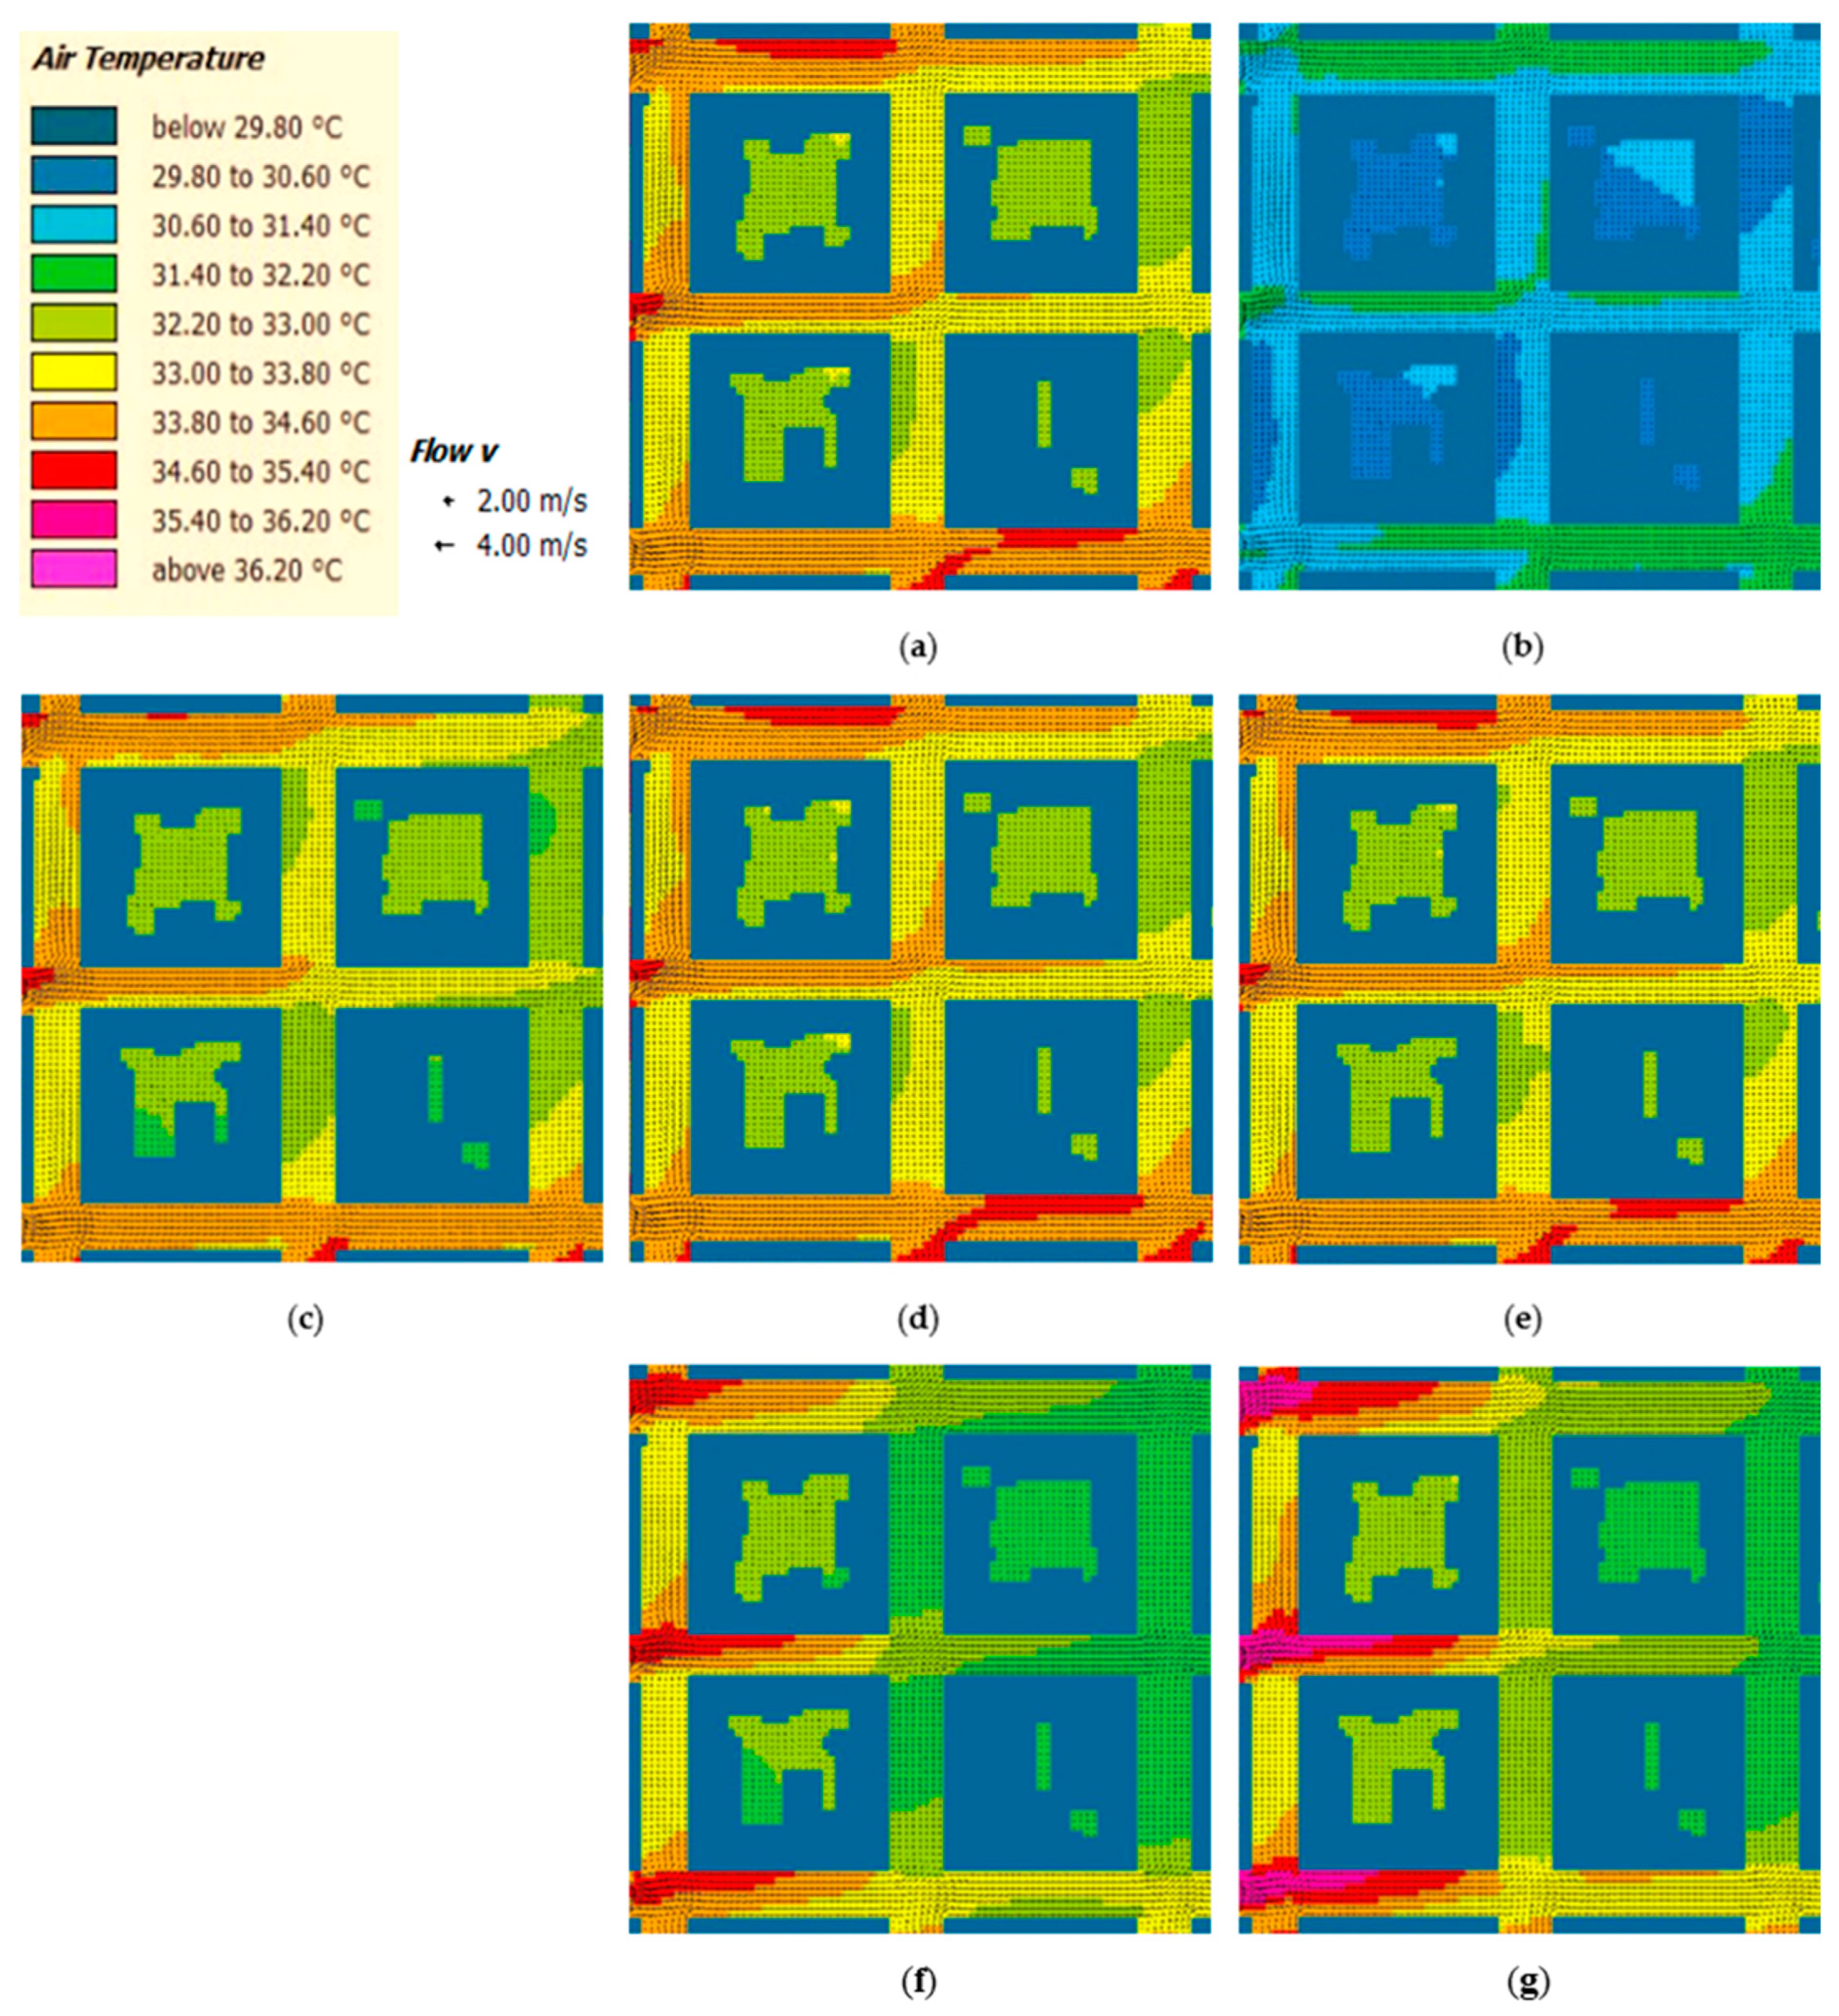
In the typical day, the air temperatures in the RF_BaseM scenario with measured climatic data are higher than the RF_Base scenario with data from the weather station (
Figure 21a,b).
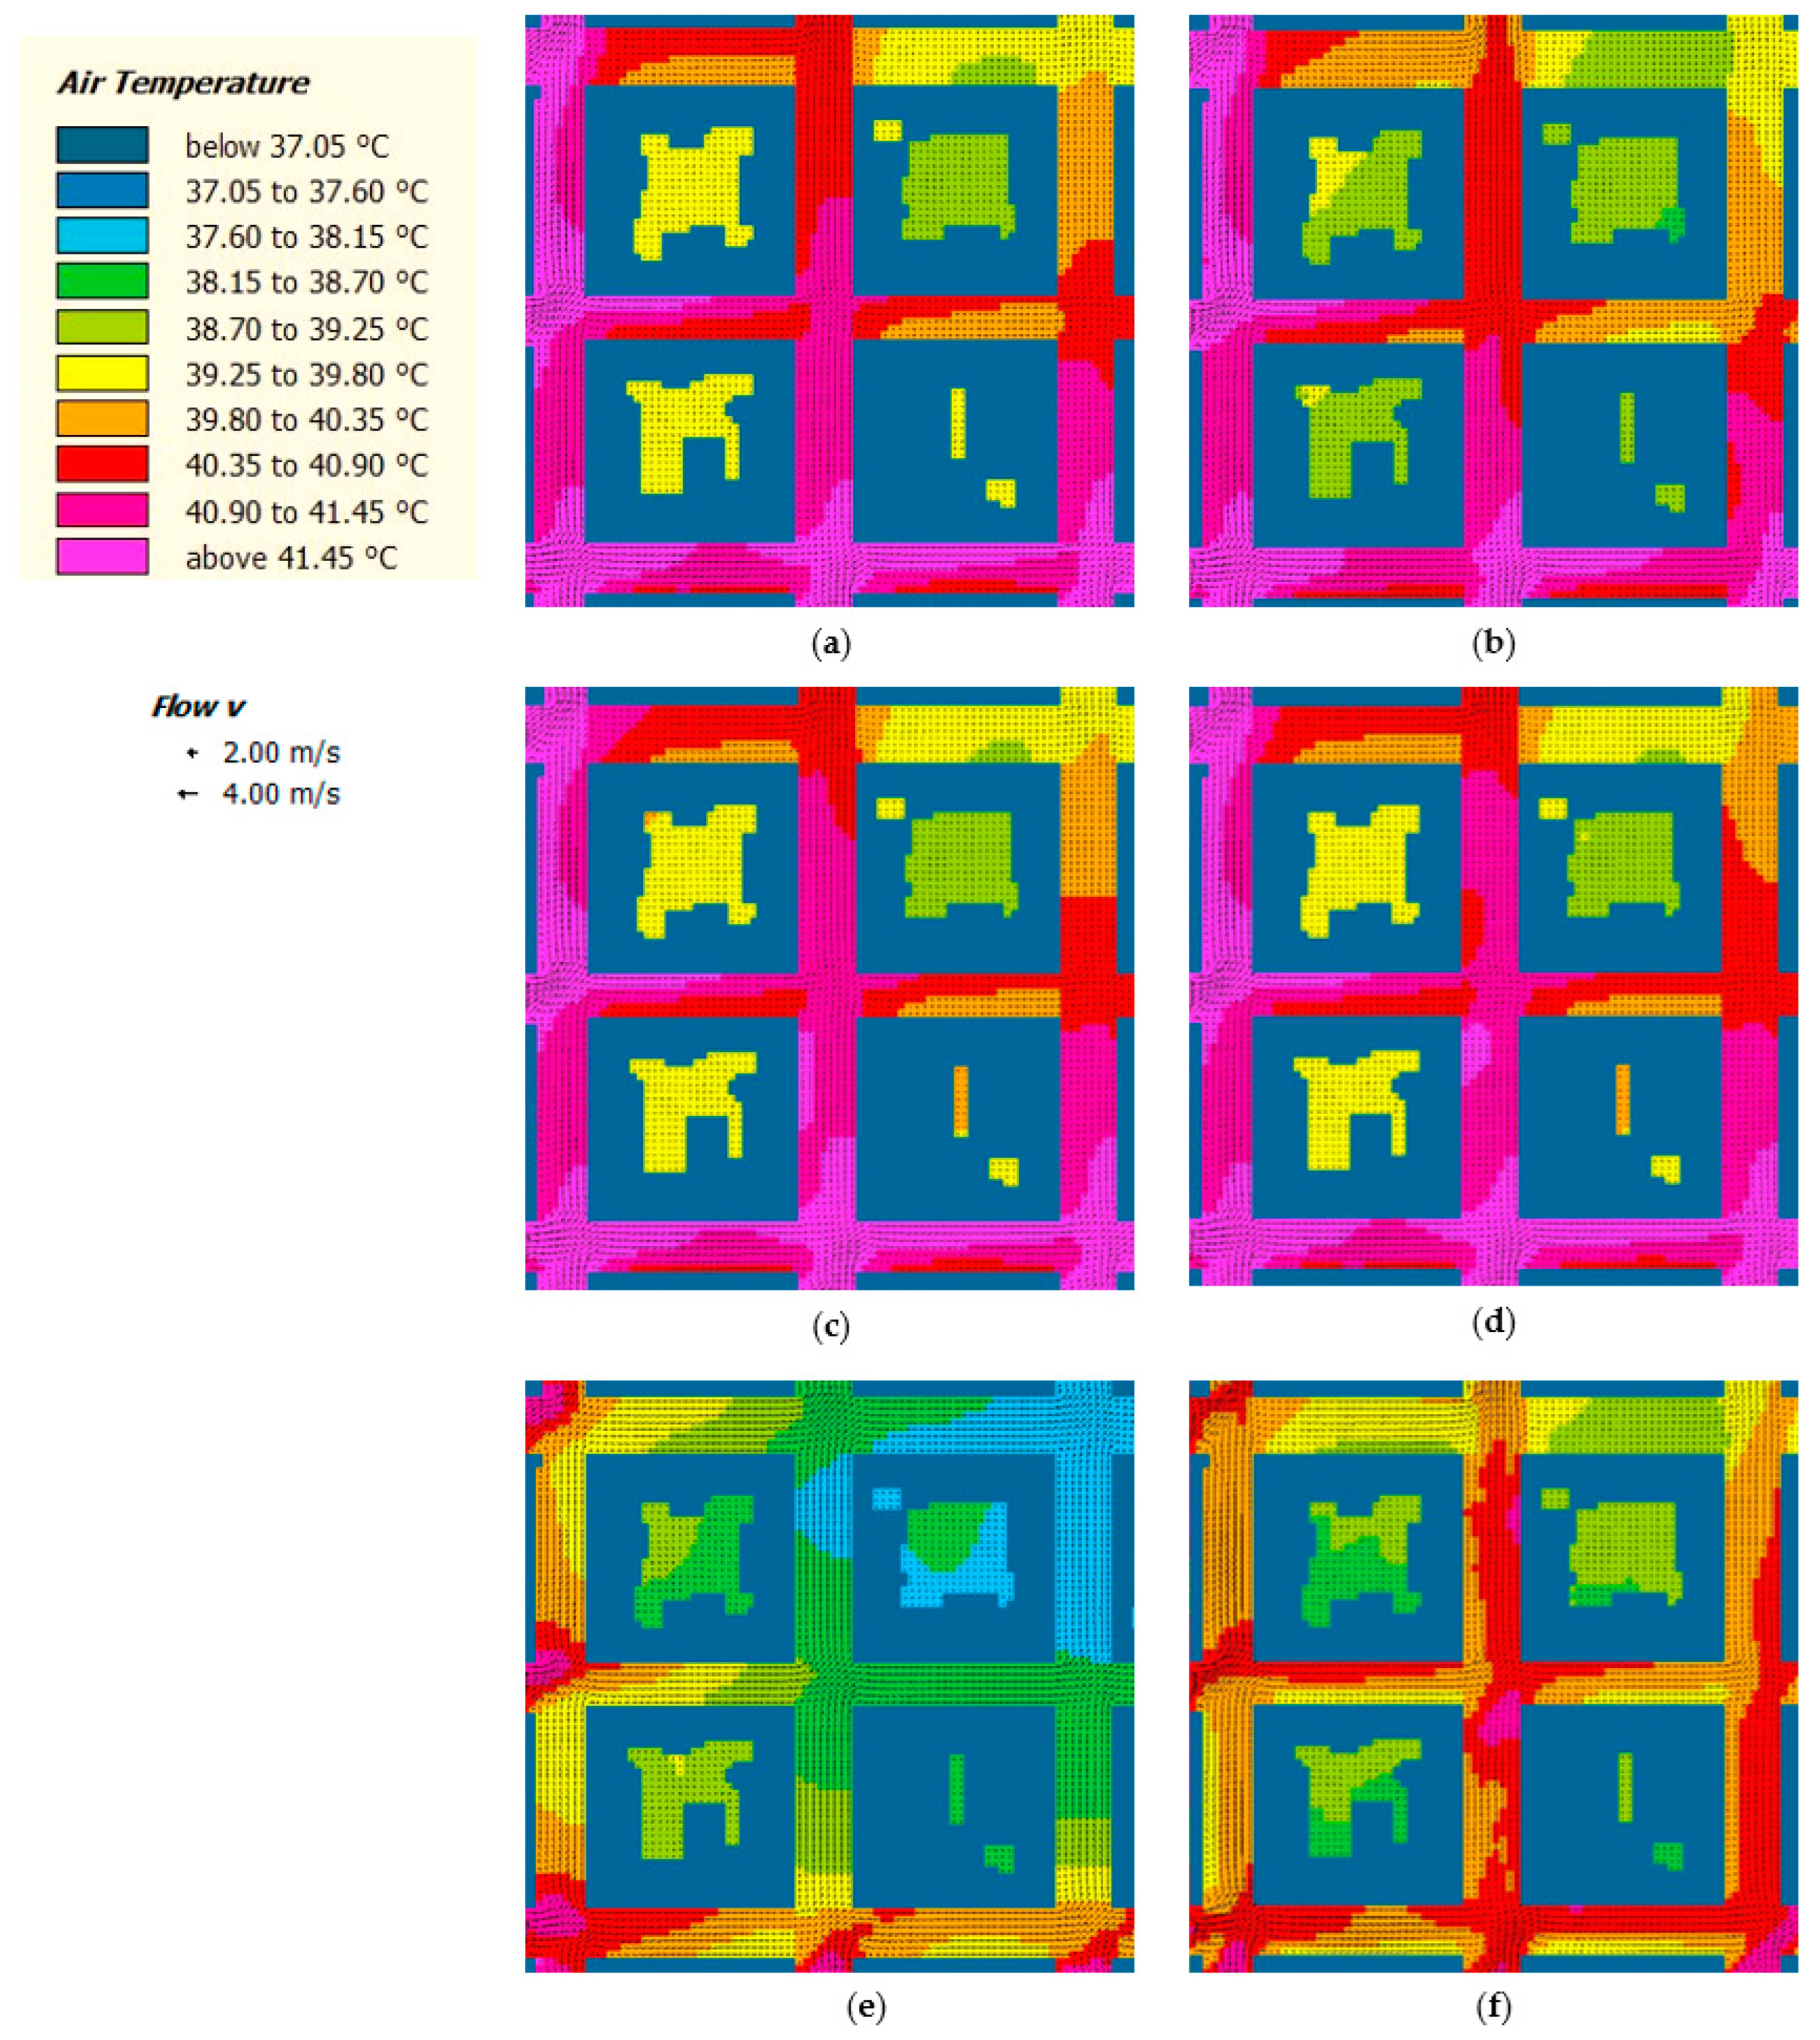
In the analysis of extreme weather conditions depicted in
Figure 22a, the RF experiences very high air temperatures (T
a) ranging almost totally between 40.35 and 41.45 °C.
The introduction of water jets emerges as the most effective mitigation strategy for RF, as can be seen from the false-colored map of RF_Water (
Figure 22e), where the Ta is lowered by 1.65 °C and 3.30 °C compared to RF_Base in some areas of the regular fabric. Following closely is the introduction of vegetation (trees and bushes). However, RF_Green demonstrates fewer benefits due to diminished mitigating effects of plants under high temperatures, attributed to drier soil conditions and stomatal closure according to prior research [
59].
The increased albedo in RF resulting from the direct rays of the sun’s shortwave radiation, which bounces off the street and façades, impacts the comfort of objects and pedestrians from 11:00 to 15:00. The shading created by the inclusion of green (RF_Green) results in a maximum lowering of the average radiant temperature by 19.85 °C for the typical day (
Figure 18a) and 19.25 for the hot extreme day during the hottest hours, compared to the regular fabric in the original condition. On the contrary, RF_GR shows no positive mitigation effects at the pedestrian level, even though it contributes to the improvement of the urban microclimate.
Relative humidity (RH) follows an inversely proportional relationship with air temperature (
Figure 19) and increases with the presence of water jets and greenery (e.g., at 12:00 p.m., ΔRH is 1.37% in RF_Water and 0.08% in RF_Green versus RF_BaseM).
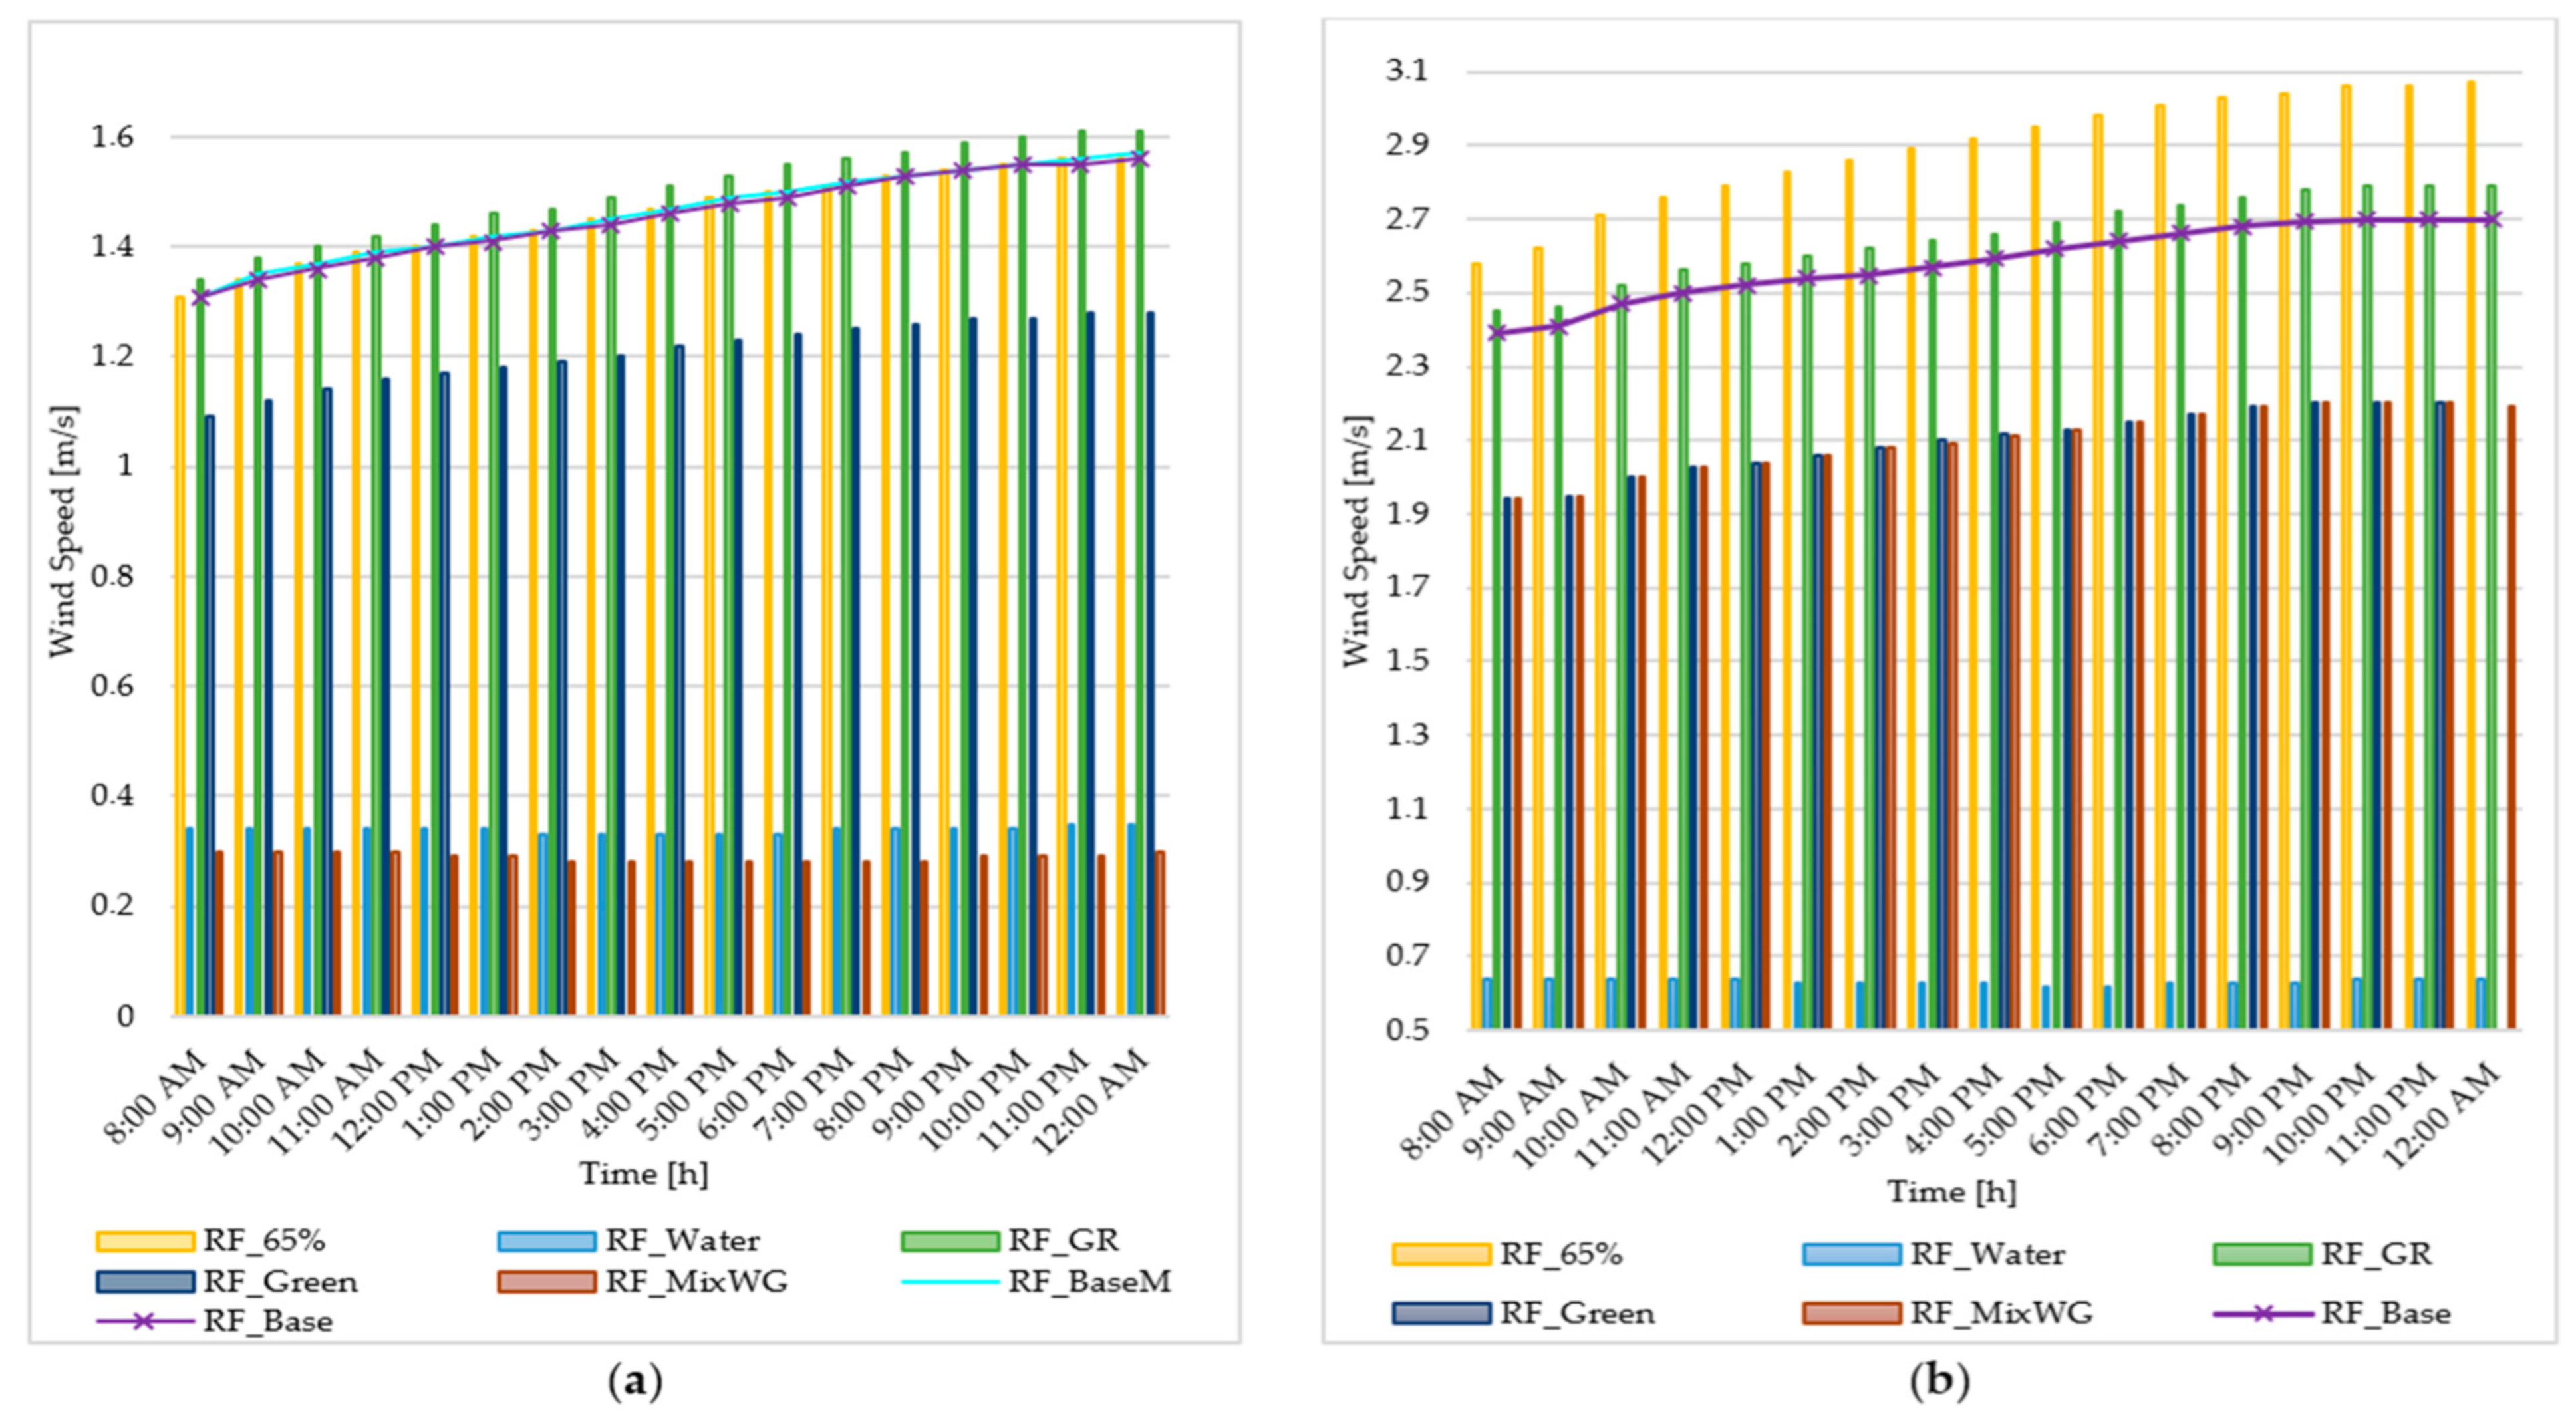
The presence of greenery decreases wind speed by 0.2 m/s, while jets reduce it by 0.6 m/s; nevertheless, water jets contribute to a cooling effect.
An analysis of the wind speed graphs (
Figure 20) and maps (
Figure 21 and
Figure 22) shows a reduction in wind in the solution with vegetation and water, both on the typical summer day and on the extreme hot day. The RF_MixWG solution exhibits an intermediate yet advantageous thermal performance. Despite a diminished wind speed, the entrance of the road displays a noticeable acceleration in airspeed, which is subsequently reduced due to obstructive elements.
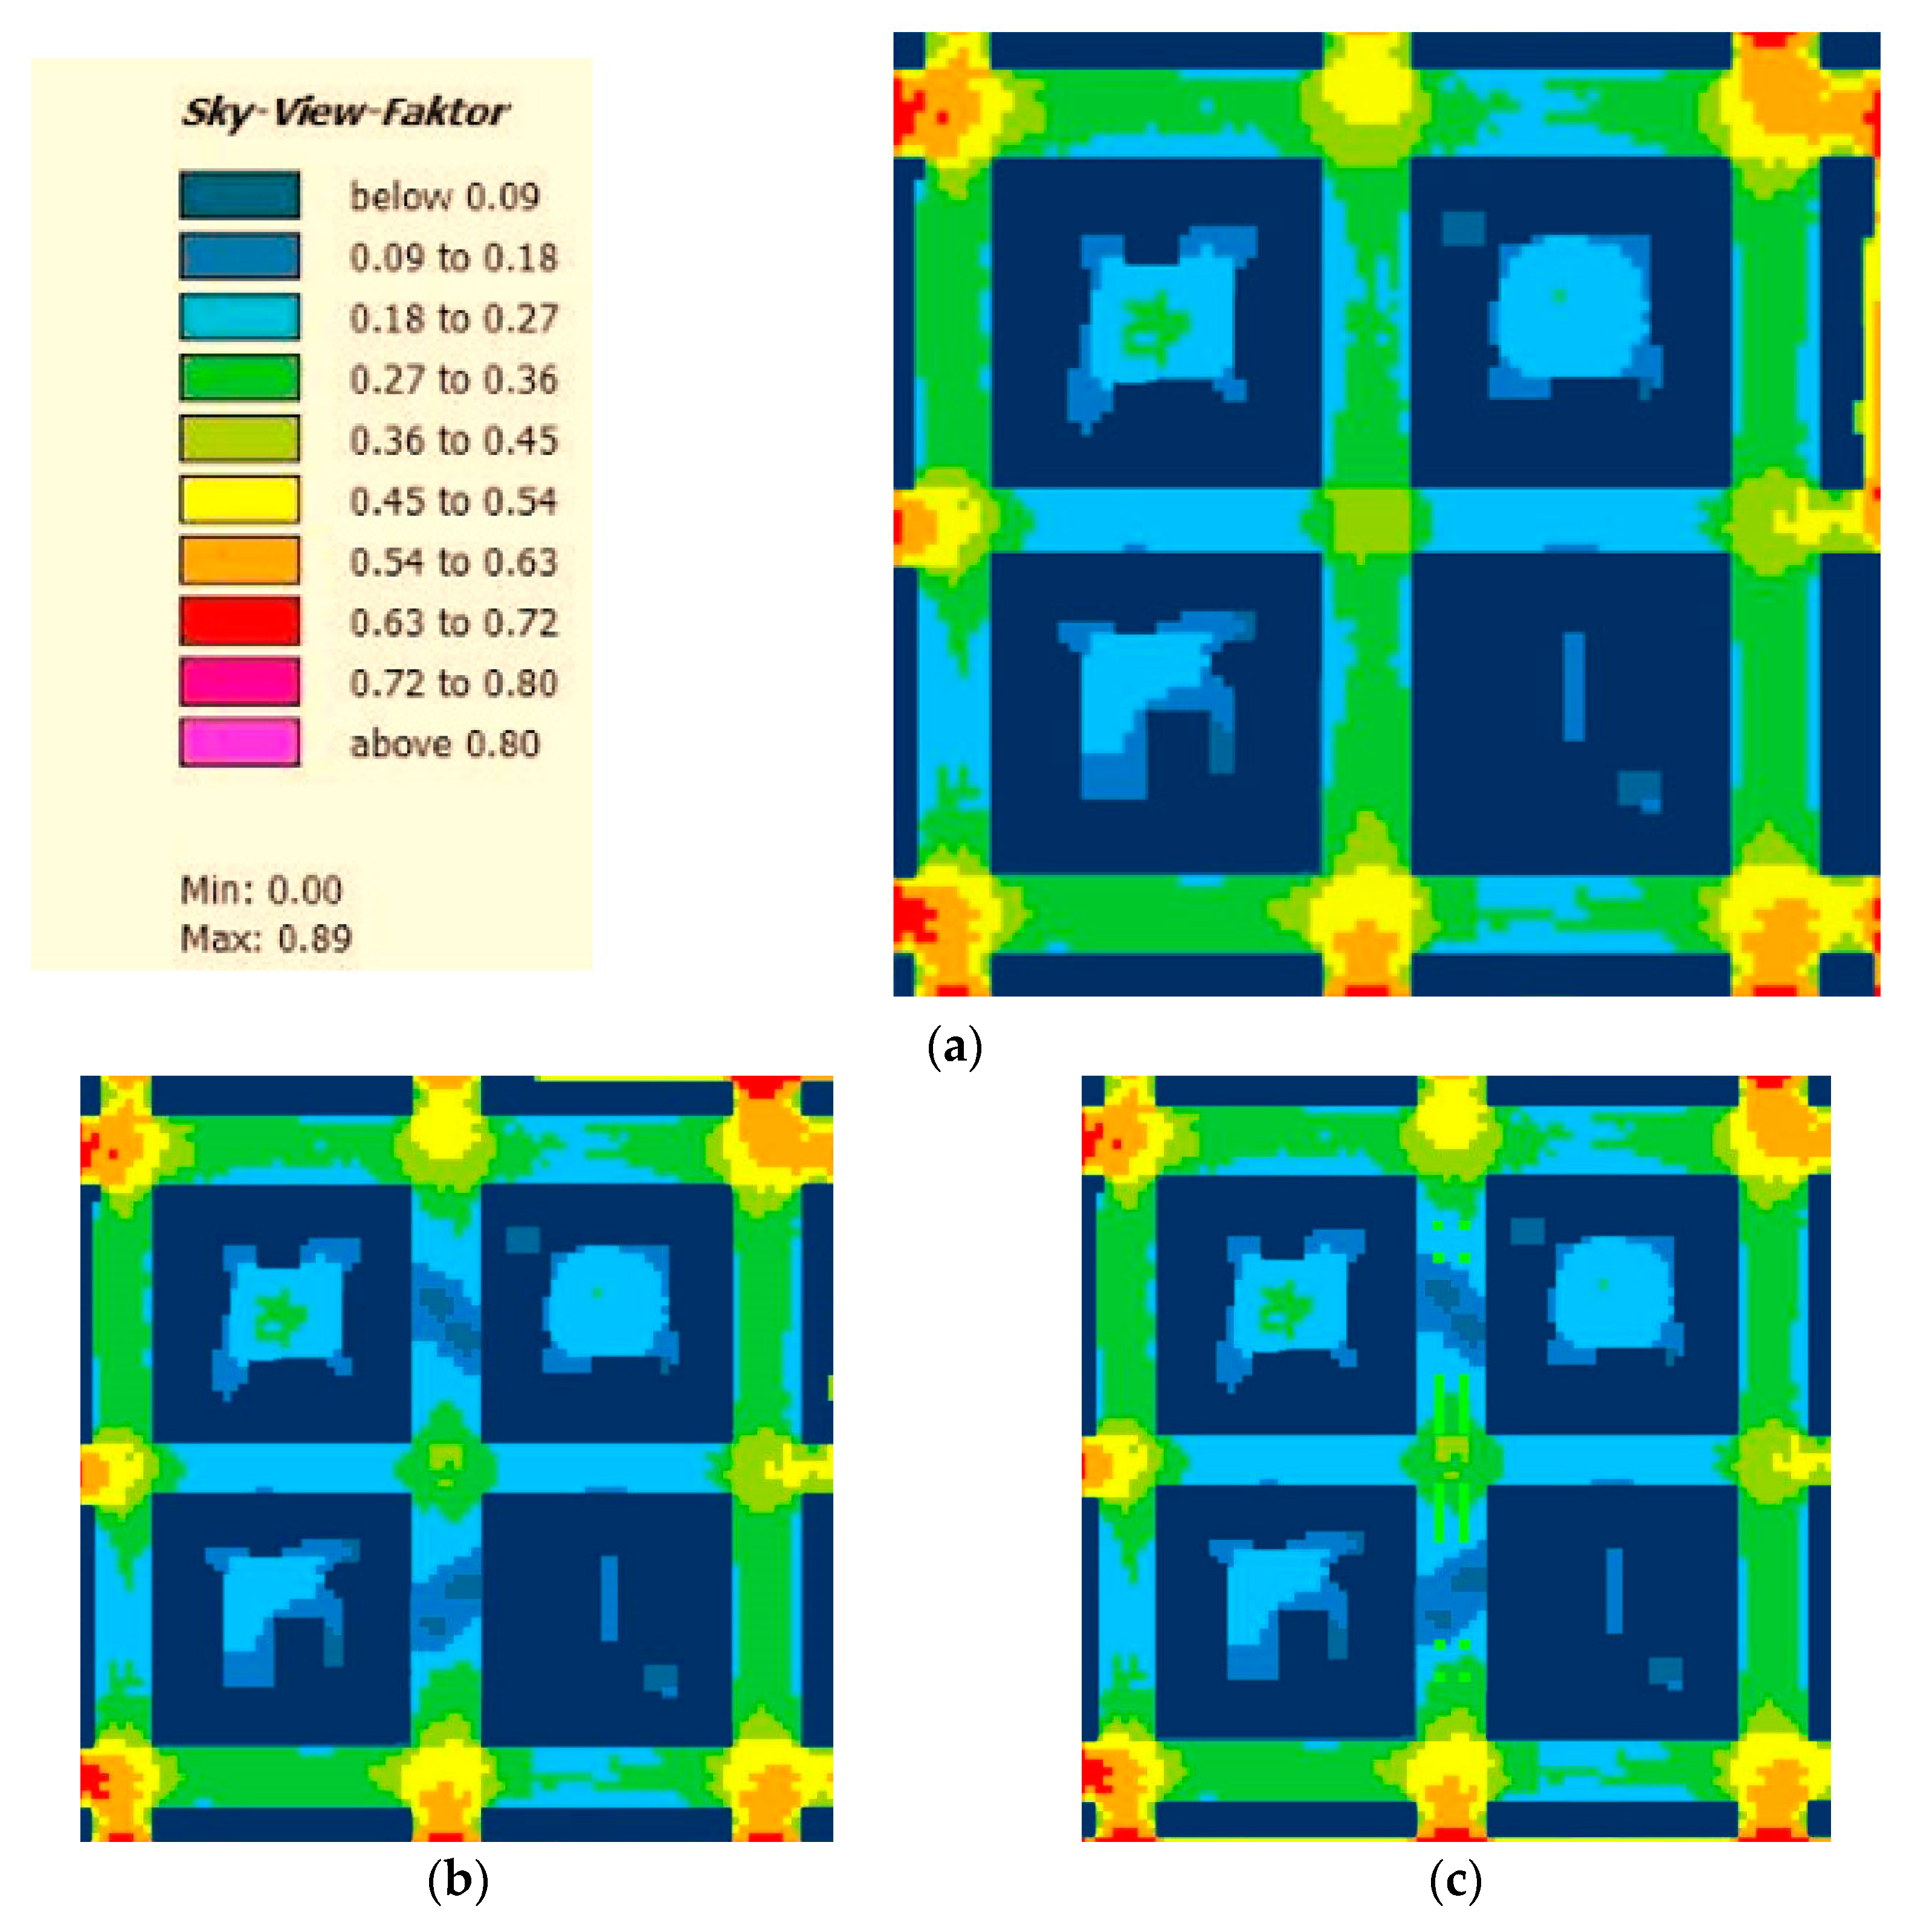
Figure 23a illustrates that the sky view factor (SVF) in RF_Base streets is quite high and allows the penetration of incident solar radiation at 12:00 a.m. There is a reduction in SVF in RF_GR (
Figure 23b) and RF_MixGW (
Figure 23c), as the vegetation reduces the view of the sky, and so the direct sunlight during daylight hours at the pedestrian level.
4.4. Discussion
Comparing the outcomes of the historical fabric and the regular one in the city of Bari, the following considerations are presented for different points of achievements.
The historical fabric exhibits better thermal behavior, since HF outperforms the regular fabric of the modern city in terms of thermal performance, with RF experiencing higher ambient temperatures (Ta) in extreme conditions. In the hottest hour, Ta in HF_BaseM is 1.03 °C less than RF_BaseM and 2.8 °C less than RF_65%.
The benefits of increased albedo for mitigating high temperatures are highlighted. Indeed, higher albedo in HF results in lower Ta in extreme conditions (39.25–39.80 °C in HF_BaseM and 37.05–37.60 °C in HF_65%).
The effectiveness of mitigating strategies is demonstrated as follows:
- −
Mitigating strategies such as RF_65%, RF_Green, and RF_MixWG contribute to temperature reduction, with the most significant effect observed in RF_Water.
- −
Water jets (RF_Water) prove to be the most effective, maintaining Ta below 38.70 °C for most studied streets, accompanied by a 21.12% RH at 1:00 p.m.
- −
Greenery introduction, while beneficial, is less advantageous due to reduced mitigating action at higher temperatures.
The impact of albedo must be considered in relation to comfort. Indeed, direct sunlight on RF surfaces with a high albedo value causes shortwave reflection in the canyon. The last one produces a reduction in pedestrian comfort during the middle hours of the day.
Greenery in RF leads to a reduction in Tmrt in the morning, aligning RF behavior with HF, but reverses in favor of RF_BaseM after 9:00 p.m.
The presence of greenery reduces the wind speed by 0.2 m/s, while water jets decrease it by 0.6 m/s, providing a cooling effect.
Relative humidity (RH) follows an inversely proportional relationship with air temperature, increasing with water jets and greenery.
In extreme conditions (
Figure 11b and
Figure 17b), HF outperforms RF s, with T
a in RF reaching 40.50–41.50 °C, while in HF_BaseM, it is 39.25–39.80 °C, and in HF_65%, 37.05–37.60 °C.
RF_Water exhibits a mitigating effect similar to HF, while RF_MixWG offers advantages for both Ta and Tmrt.
Considering that Mediterranean cities may also suffer from water scarcity, even to the point of drought, the urban street should be provided with water recycling systems for both fountains and the irrigation of greenery.
5. Conclusions
The research extensively investigated various mitigation strategies in both historical and contemporary urban settings in the Mediterranean city of Bari. The aim was to discern optimal solutions to cope with climate change and hot temperature increase.
The historical fabric shows generally better microclimate behavior during both the typical and the hottest day with respect to the modern one.
The adopted historical fabric mitigation scenario (albedo equal to 65%) results in lower air temperatures. This underlines the need to avoid excessively dark surfaces (albedo <40%), as they induce increased air temperatures by intensifying longwave radiations and have limited impact on nighttime cooling. However, the use of high-albedo materials requires thorough consideration. While these materials reduce air temperature, they elevate mean radiant temperatures. Without adequate shading systems, this can lead to issues such as excessive shortwave reflections causing glare and a perceived sense of overheating.
Thanks to the layout of the narrow streets, the low resulting SVF in the historical fabric helps to contrast the excessive penetration of the incident solar radiation. It proves that historical urban settlements were designed in relation to climatic conditions much more than modern settlements, which have more critical energy behavior related to rising temperatures and need suitable strategies.
All the proposed mitigation measures for the modern regular fabric induce temperature reduction in the typical and the hottest conditions. The most effective solutions to reduce hot temperatures and promote passive cooling involved the application of water fountain jets and water fountain jets integrated with vegetation.
The greenery solution is less beneficial, especially under extreme conditions, but it still reaches microclimate conditions more effectively than the existing ones and is comparable to the historical ones. In addition, it contributes to reducing the SVF of the modern urban fabric by introducing trees with large foliage or even tall bushes above the pedestrian level, reaching values similar to the old district. To make this solution more effective, it is essential to provide an adequate irrigation system and to adopt plants that resist high temperatures and have good evapotranspiration capabilities. In this way, vegetation increases the capacity of the city to adapt to rising temperatures.
These findings offer valuable insights for facing the growing increase in hot temperatures and are instrumental in formulating effective strategies for sustainable urban development, with potential applications in future urban planning and design initiatives.
Anyway, the study acknowledges some limitations. The study was based on the choice of two representative days, the first related to typical hot conditions (average maximum temperature in July) and the second related to extreme conditions (hottest day in recent years). Even if it could be interesting to analyze a longer summer period, it would require too high of computational sources due to the very long timescale of the simulations by ENVI-met software. Moreover, the additional results would not provide substantial changes to the research outcomes due to the aim of the study, i.e., the comparison between different scenarios in the same hot climate conditions.
Another limitation of the study includes a lack of analysis on the effects of selected solutions on indoor comfort and the need for broader urban area considerations.
Therefore, future developments of the study are likely to focus on understanding how these interventions simultaneously affect indoor and outdoor temperatures, air quality, and overall occupant well-being through simulations, field studies, and surveys to gather data on the indoor and outdoor microclimate and perceived comfort.
In Mediterranean areas, additional precautions should be considered, encompassing a reduction in solar gain, shielding transparent closures, control of thermal inertia in spaces, and the study of phase shift and attenuation of thermal waves due to opaque enclosures.
Moreover, for future studies, solutions with the introduction of RES (renewable energy sources) to power water recirculation systems could be analyzed in order to make water fountain jet and greenery scenarios more sustainable, including innovative photovoltaic panels or small vertical wind systems to reduce energy consumption.
The research could be extended to encompass a wider array of urban settings, considering diverse geographical and climatic conditions. This would involve studying how the identified strategies perform in different climates, topographies, and urban layouts, leading to more broadly applicable guidelines for a more resilient urban development to cope with climate change.


