Article

Measuring the Industry 5.0-Readiness Level of SMEs Using Industry 1.0–5.0 Practices: The Case of the Seafood Processing Industry

by
Meena Madhavan
*,
Mohammed Ali Sharafuddin
* and
Sutee Wangtueai
College of Maritime Studies and Management, Chiang Mai University, Samut Sakhon 74000, Thailand
*
Authors to whom correspondence should be addressed.
Sustainability 2024, 16(5), 2205; https://doi.org/10.3390/su16052205
Submission received: 25 November 2023 / Revised: 15 February 2024 / Accepted: 23 February 2024 / Published: 6 March 2024

Abstract

:
SMEs across the globe have witnessed increasing internal and external pressure to adopt the recent industrial revolution (4.0 & 5.0). There has been pressure for SMEs to adopt Industry 4.0 technologies, but this did not transpire in traditional industries such as agricultural and seafood processing. Also, there is no published evidence of Industry 4.0 technologies’ support for food processing industries to achieve the United Nations Sustainable Development Goals (UNSDGs). Hence, Industry 5.0 is conceptualized to be (a) human-centric, (b) sustainable, and (c) resilient. However, most of the earlier studies conducted to assess the “Industry 4.0 adoption level” failed to address the respondents’ current level of industrial practices. Therefore, to overcome the research gap, this research aims to measure the current level of industrial practices and I5.0 readiness level of seafood processing SMEs in Thailand. Thus, this research developed a seven-factor framework including “production line”; “major energy source”; “seafood processing”; “packaging”; “labelling”; “anti-bacterial testing methods sensory, texture analyzing and quality control”; and “business process, documentation, and communication”, with forty-two questions related to Industry 1.0–5.0 practices in the context of seafood processing SMEs. The findings reveal that the SMEs are still in I1.0, 2.0, and 3.0 practices. There is minimal adoption of I4.0. However, there is a comparatively higher level of Industry 5.0 readiness among SMEs in terms of business processes, documentation, and communication. Thus, SMEs can adopt Industry 5.0 partially, and escalate step-by-step from Industry 1.0–Industry 4.0 according to changing trends and demand.

1. Introduction

Industrial revolutions (IR) 4.0 and 5.0 differ from the previous industrial revolutions of 1.0, 2.0, and 3.0 in multiple aspects. One major aspect is the structure of the industry itself. In the 21st century, small and medium-sized enterprises play a crucial role in the sustainable development of a national economy [1]. However, the adoption of industry 4.0 and 5.0 did not transpire in developing countries’ traditional, fisheries-based, and agriculture-based industries, and in sectors where manual labor is irreplaceable [2]. For example, the research conducted by the SME Development Bank of Thailand in 2018 revealed that more than 95% of SMEs are still doing their business in “Industry 1.0” and “Industry 2.0”, and only less than 5% have adopted “Industry 3.0” and “Industry 4.0” technologies [3].
On the other hand, “Industry 5.0” has been conceptualized [4] and adopted at the policy level by the European Union [5,6,7]. Since then, the concept of “Industry 5.0” has gained enormous attention from researchers in academia in a very short period. A simple keyword search with “Industry 5.0” in the Scopus database showed 455 documents indexed as on 15 December 2022. Studies proved that external environmental factors like the COVID-19 pandemic had pushed SMEs’ Industry 4.0 and Industry 5.0 adoption [8]. However, there is a lack of clear reported evidence of the pre-Industry 4.0 and 5.0 status of SMEs. Thus, there is a gap in the literature addressing the chronological and arbitrary nature of SMEs’ Industry 5.0 adoption [9]. In order to address the gap, this research aims to identify the “Industry 1.0”, “Industry 2.0”, “Industry 3.0”, “Industry 4.0”, and “Industry 5.0” postharvest technologies and business practices of seafood processing SMEs. It also aims to gain insights into the level of adoption of IR and business practices among the seafood processing SMEs in Thailand. Thus, the objectives of this article are to develop a self-assessment scale for IR-related practices through a literature review from available published documents, focusing on the postharvest technologies of the seafood processing industry, and also to identify the practice, adoption, and readiness level of Thai seafood processing SMEs. The seafood processing industry in Thailand was chosen as the industry of study because it is one of the largest export-driven industries in which approximately 300,000 full-time and part-time workers are employed in various large, medium, small, and micro enterprises [10].

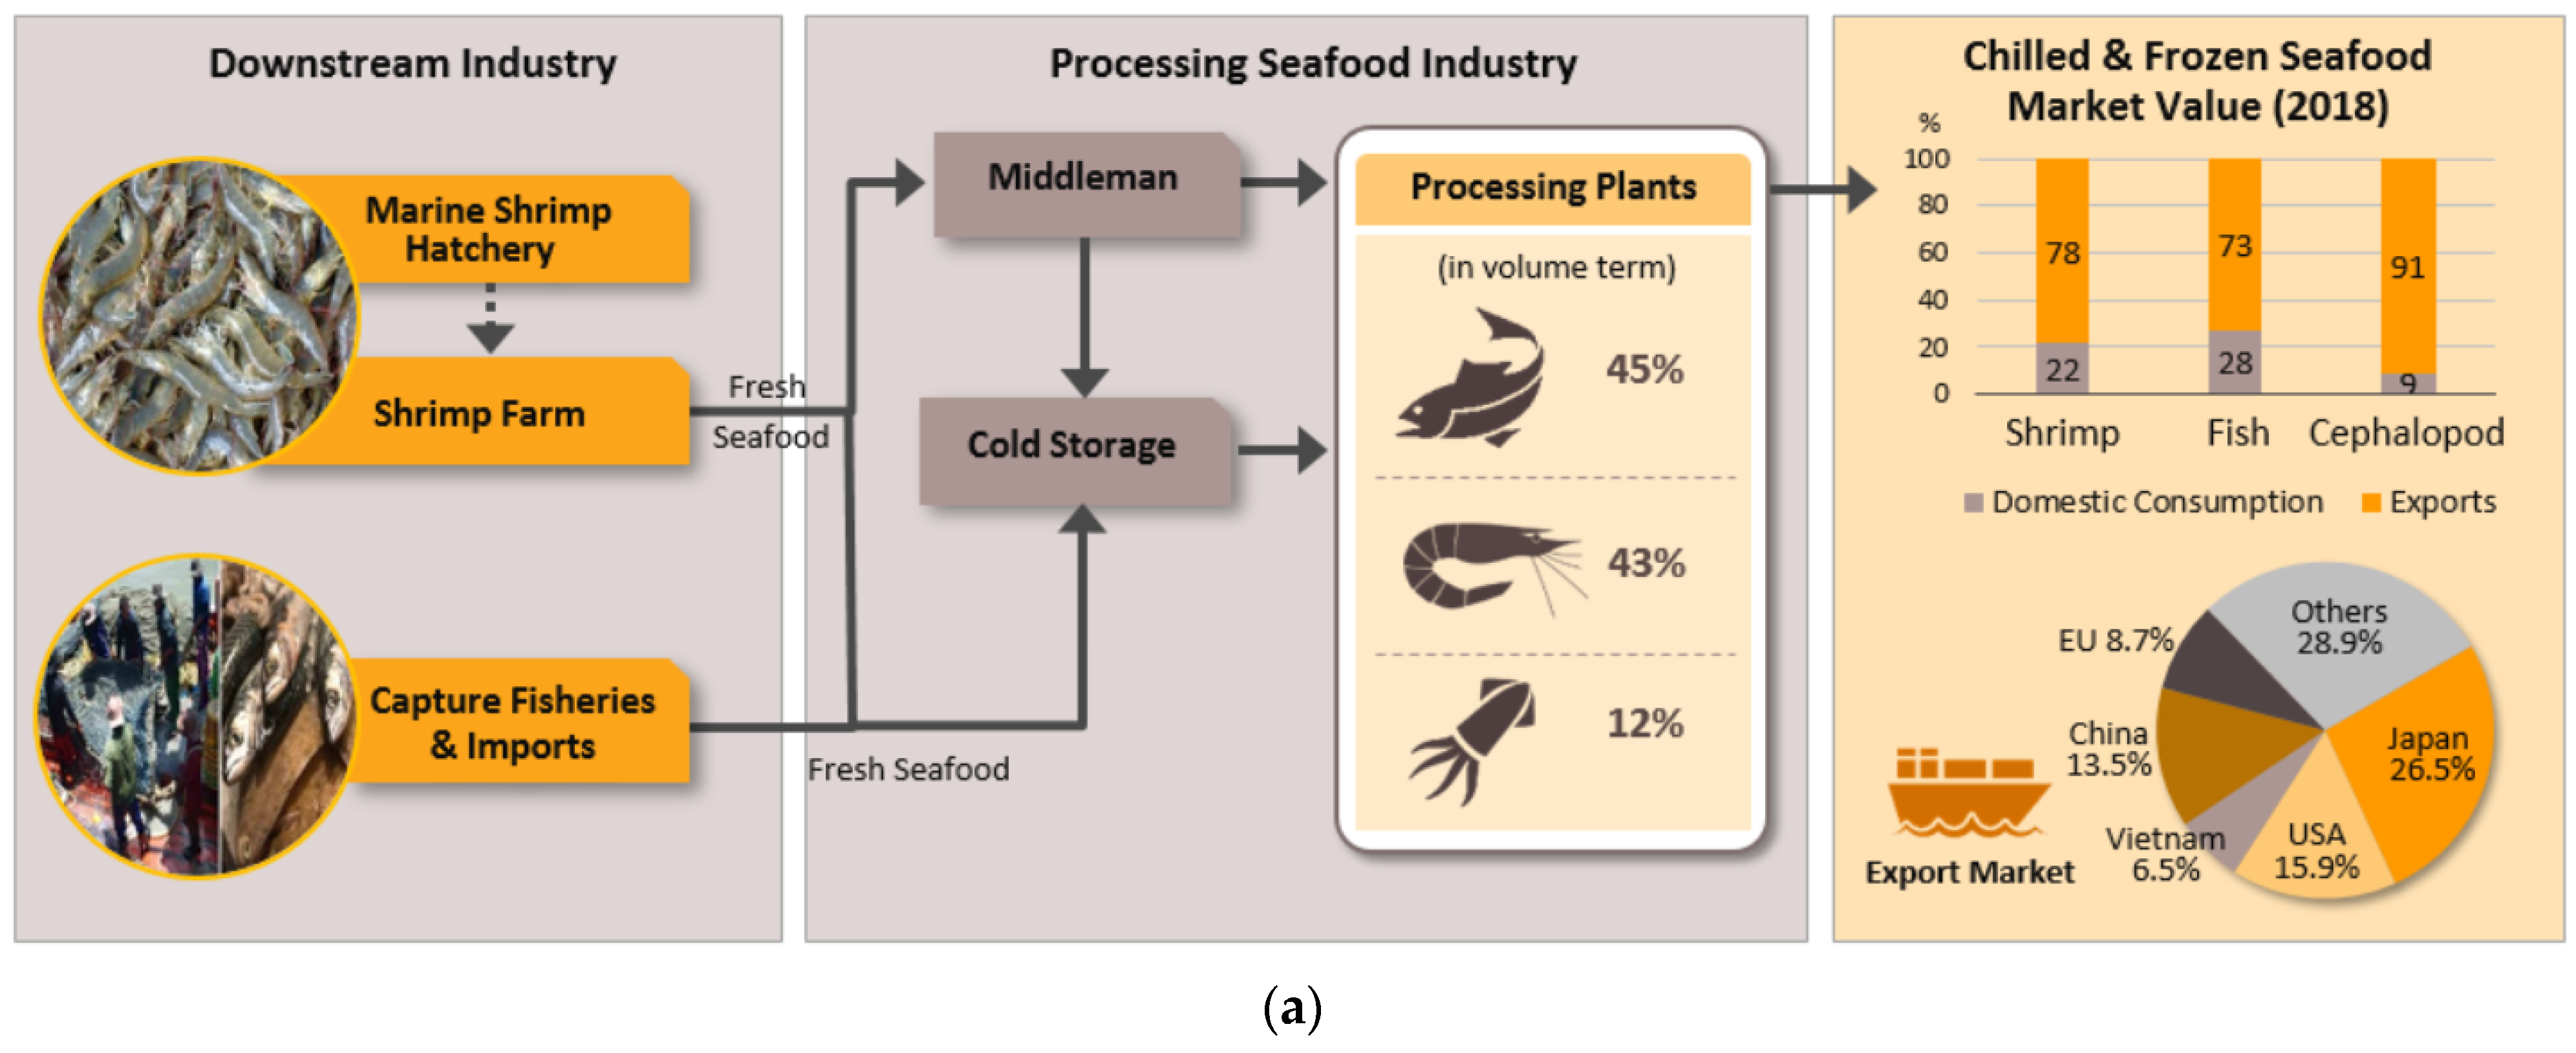
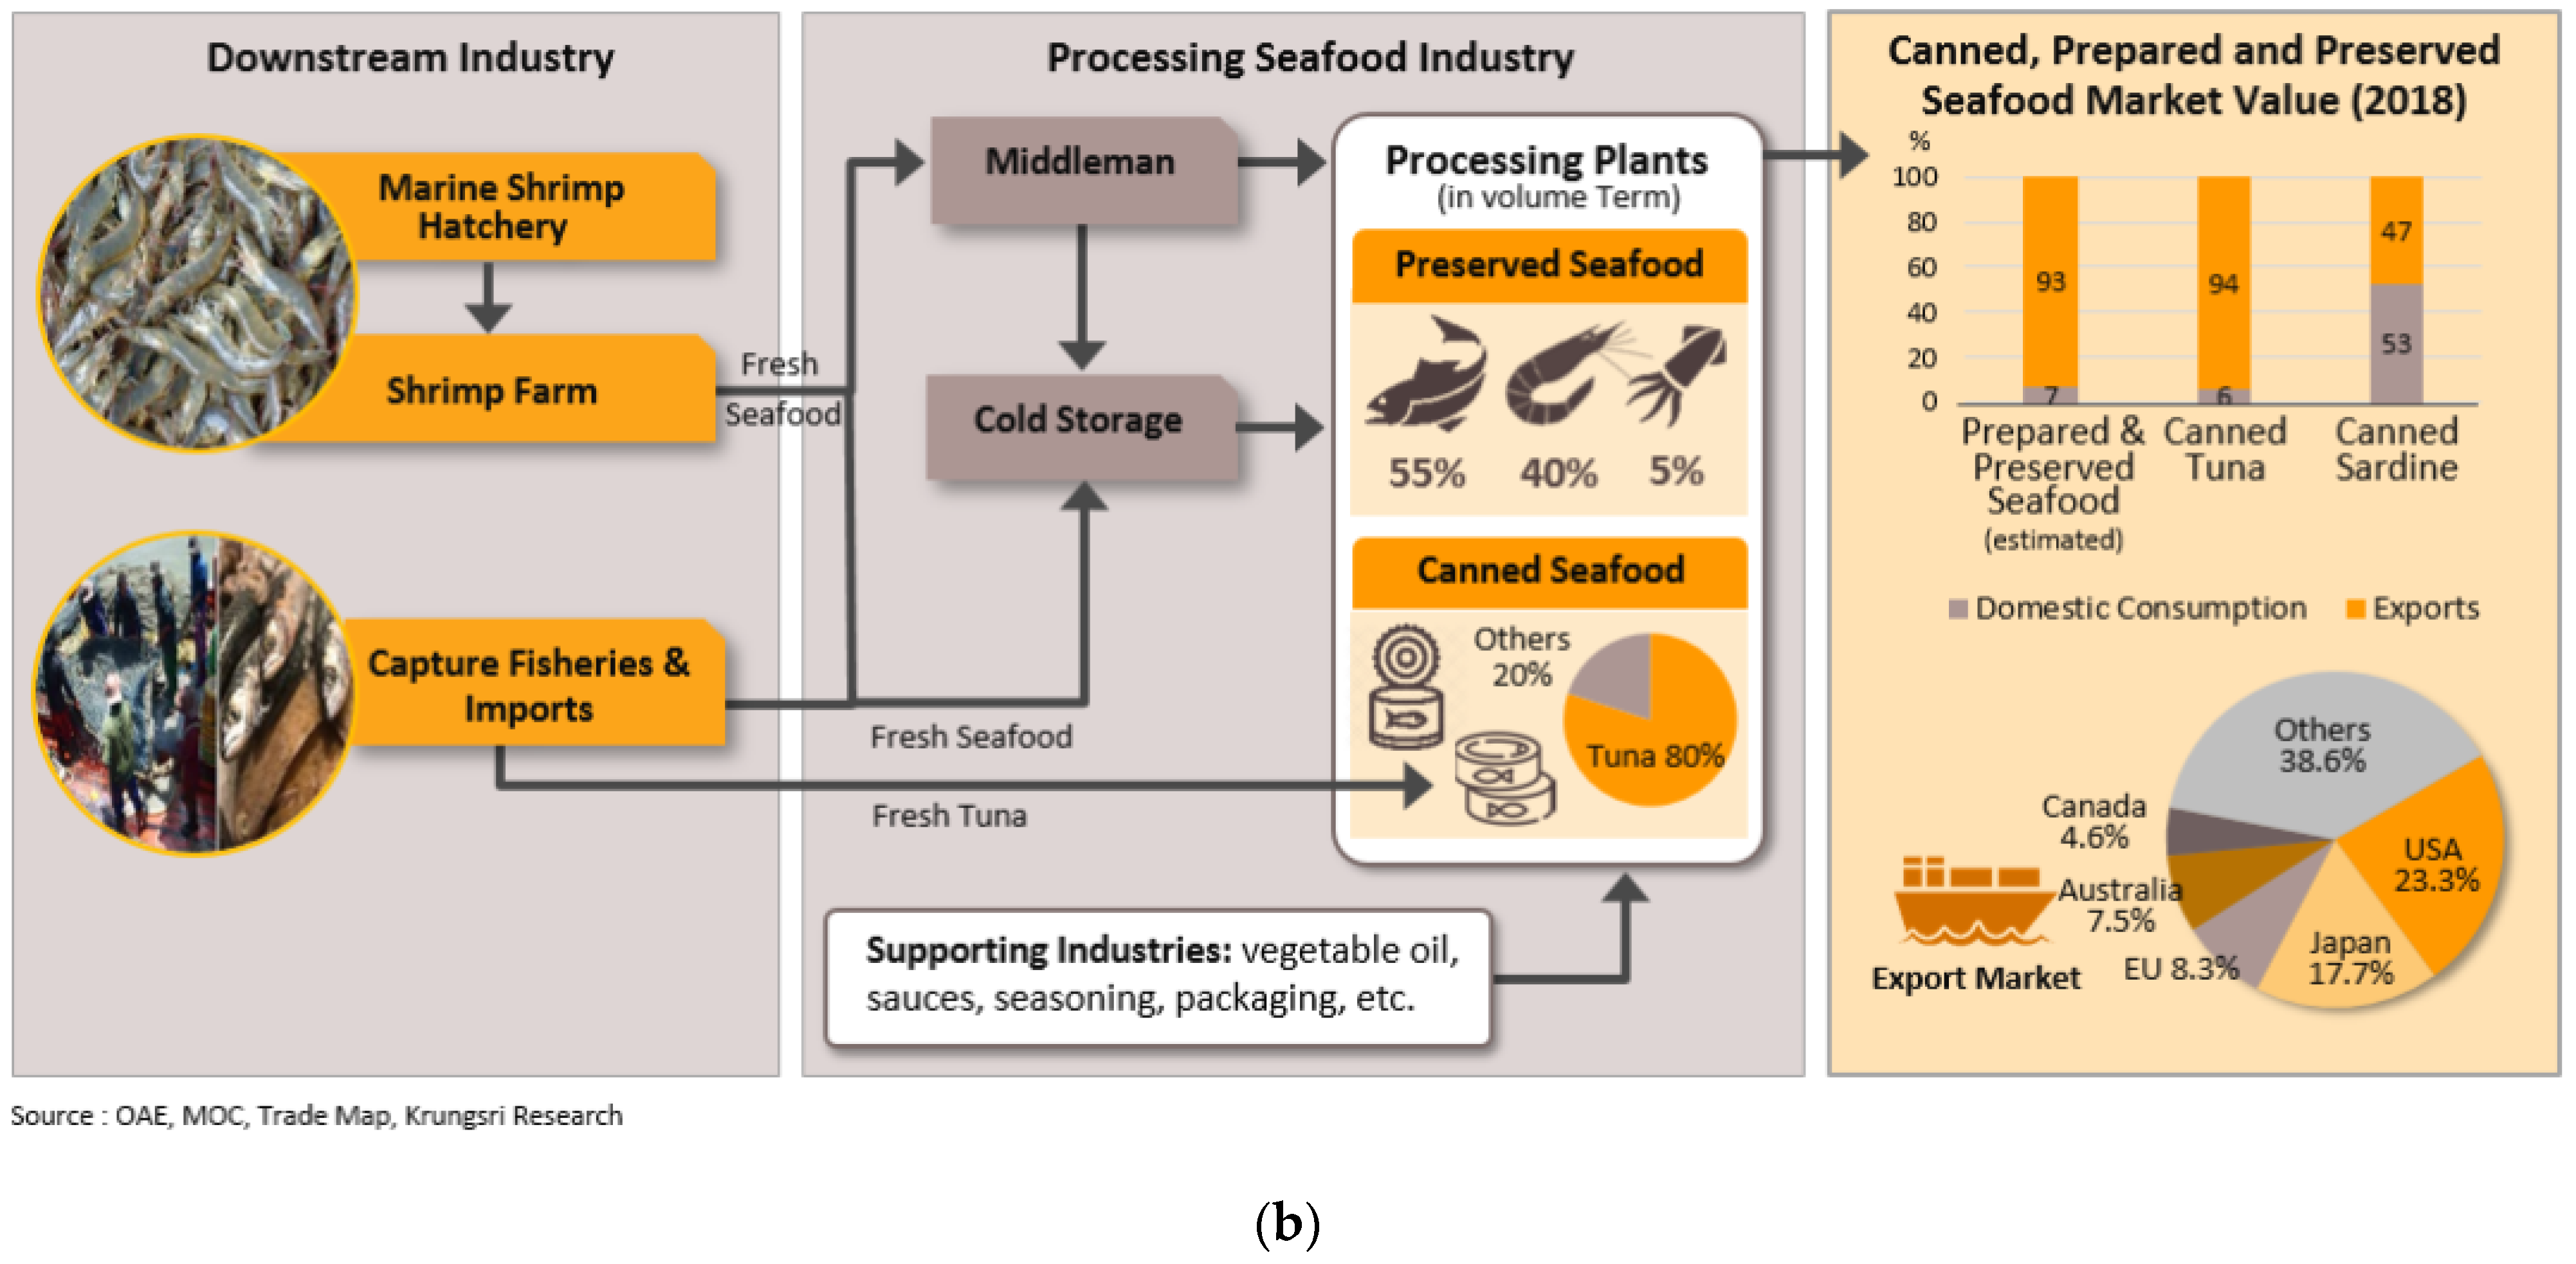
2. Seafood Processing Industry in Thailand

As of 2021, marine products such as fresh, chilled, frozen, and canned fish; crustaceans; and mollusks account for more than 20% of Thailand’s food exports. Also, Thailand ranks among the top five countries in the world in terms of marine food exports [11]. The seafood export industry can be classified into two main groups. The first group is canned fish. In this group, tuna and sardines are the two major types of fish processed, canned, and exported from Thailand. The second group is frozen seafood. Cephalopods, fish, fish fillets, and shrimp are the major frozen seafood exported from Thailand. In 2020, 558.9 thousand tons of canned tuna and 66.4 thousand tons of canned sardines were exported from Thailand. This trade accounts for 2406.24 million USD [12]. By volume, the chilled and frozen seafood processing sector (Figure 1a) handles 45% fish, 43% shrimp, and 12% cephalopods. The processing plants dealing with preserved seafood handle 55% fish, 40% shrimp, and 5% cephalopods. In the canned seafood processing sector (Figure 1b), 80% deal with canned tuna and the remaining 20% deal with other canned seafoods, including canned sardines. The domestic market is also of significant size. But the major difference between the export market and domestic market is the size of the enterprises involved in seafood processing, because in the domestic market, a major portion of the companies that registered as seafood processors were either micro, small, or medium size enterprises. They deal with a vast variety of products such as fish balls; dried fish; fish sauce; shrimp paste; smoked salmon; oyster sauce; clams; mackerel; and canned and readymade food products [13].

3. Literature Review

3.1. Industrial Revolution 3.0 and Seafood Processing Industry

Rapid technological changes in Thailand’s fisheries and the seafood processing industry are well-documented. The upgradation of the seafood processing industry from manual processing (Industry 1.0) to semi-automation (Industry 2.0 and 3.0) began in 1991. Since then, several new technologies have been adopted in the seafood processing industry. In shrimp processing, shrimp-washing tanks, grading tables, conveyor belts, and modern freezing technology were introduced in 1992. Quality control and management standards such as HACCP and good manufacturing practices (GMP) were also introduced during this period. In terms of packaging, vacuum packaging was introduced and adopted to cater to the needs of supermarket consumers. In seafood canneries, the focus was on improving safety and quality, new product development, and yield improvement. The adoption of Industrial Revolution 3.0 in the canned tuna sector in Thailand began in 1994 and progressed significantly [14].

3.2. World Bank Approach for Assessing Adoption of Industry 4.0 in Food Processing SMEs

The World Bank, in their policy research working papers [15,16,17], classifies technology adoption into three aspects. The first aspect is the “general-purpose technology”, in which Industry 2.0 refers to the adoption of electricity and generators; Industry 3.0 refers to the adoption of information and communication technology (ICT); and Industry 4.0 refers to the adoption of digital technologies and smart machinery that can exchange information. The second aspect is the “general business function”, which widely covers all the possible tools, technology, and techniques used in administration; documentation of operational planning; supply chain management; product development; marketing; sales; payment methods; and quality control. The intensity of technology adoption is classified as (1) “Adoption and use of manual and handwritten processes”, (2) “Adoption and use of the computer, telephone and emails”, (3) “Adoption and use of digital platforms, social media, and mobile applications”, (4) “Adoption and use of specialized software for operations, CRM, and process control”, and (5) “Automated system for process control and all-business-function integrated Enterprise Resource Planning (ERP) or equivalent software”. The third aspect is the “sector-specific business functions (SSBF)”. The SSBF for the food- processing industry is classified into “input testing”, “mixing, blending, and cooking”; “anti-bacterial testing methods”; “packaging”; and “food storage”. The findings of the World Bank’s policy research working paper published in 2020 with food processing companies in Vietnam and Senegal, also reflected similar results of research conducted by the SME Development Bank of Thailand in 2018. The technological adoption by small and medium-sized food processing companies of “sector-specific business function” is still at the level of Industry 1.0 and 2.0, i.e., using manual processes and human-operated machinery for mixing, blending, and packaging.

3.3. Industrial Revolution 4.0 and Seafood Processing Industry

Chunthasiri et al. [18] studied the Industry 4.0 readiness of 360 respondents working in the seafood industry in Thailand and found that they strongly agreed with the question “ability to work with data and technological skills”, with a mean score of 4.11 on a five-point Likert scale. This finding is a good example of workforce readiness for seafood processing Industry 4.0. Though there is rising interest among researchers in the field of Industry 4.0 and 5.0, only a few studies have focused on the highly perishable food processing industry [19,20,21].
The review [22] on the role of Industry 4.0 technological innovations in the food processing industry towards achieving the United Nations’ sustainable development goals found that the present state is limited, and more solutions are needed to achieve the UNSDG goals. Also, developments in concepts such as seafood traceability were reviewed [23]. Another important review [20], classified seafood processing 4.0 into three aspects, namely (a) seafood preservation techniques (freezing, edible films and coatings, natural preservatives, and nanotechnology); (b) seafood processing methods (thermal and non-thermal processing); and (c) seafood analytical methodology (hyperspectral sensors, chemical properties, color and other physical properties, microplastic evaluation, microbial spoilage, authentication, process monitoring, advanced mass spectrometry and chromatography). However, the authors concluded that further research is needed to efficiently use Industry 4.0 technologies to achieve sustainability in the seafood processing industry. From the above literature, we conclude that Industry 4.0 research in the seafood processing industry is limited to technology adoption.

3.4. Industrial Revolution 5.0 and Seafood Processing Industry

The concept of Industry 5.0 [4,6,7,8,24,25,26,27,28] has been widely discussed by researchers focusing on production industries. The European Union’s definition of Industry 5.0 emphasizes three aspects, namely (a) human centricity, (b) sustainability, and (c) resilience. However, to the best of the author’s knowledge, no research has been conducted on Industry 5.0 adoption in the context of seafood processing in Thailand. Hence, in the first phase, the theoretical self-assessment scale for SMEs “Industry 5.0” readiness in the seafood processing industry, was framed based on a literature review [15,16,17,20,21,29,30]. The theoretical model (TM) self-assessment scale consisted of seven factors, and thirty six variables of the most widely adopted “Industry 1.0–5.0” approaches/technologies/business practices, classified as seven under each, namely (1) “Production Line” (manual/semi-mechanized production (TM-1.01), semi-automatic assembly line (TM-2.01), automated assembly line (TM-3.01), smart connectivity (TM-4.01), and human-centric automation (TM-5.01)); (2) “Major Energy Source” (coal (TM-1.02), petroleum products (TM-2.02), electricity (TM-3.02), electricity plus renewable energy (TM-4.02), and renewable energy (TM-5.02)); (3) “Seafood (postharvest) Processing” (sun drying (TM-1.03), use of chemical composition as preservatives and manual machinery for drying, freezing, and pasteurization (TM-2.03), electronic and semi-automated machinery for vacuum processing, drying, freezing, and pasteurization (TM-3.03), fully automated machinery for drying, freezing, and pasteurization (TM-4.03), and fully digitalized smart machinery for drying, freezing, and pasteurization with sustainable practices to reduce negative economic, environmental, and social impacts (TM-5.03); (4) “Packaging” (manual hermetic sealing process (TM1.04), semi-automatic machineries (TM-2.04), vacuum and modern packaging technology (TM-3.04), automatic canning/packaging machinery (TM-4.04), and IOT-based automatic canning/packaging machinery with eco-friendly packaging materials (TM-5.04)); (5) “Labelling” (traditional black & white handwritten labelling (TM-1.05), traditional color printed and handwritten labelling (TM-2.05), computerized digital printing (TM-3.05), smart labelling (RFID) (TM-4.05), and eco-friendly smart labelling (TM-5.05)); (6) “Anti-bacterial testing methods, sensory, texture analyzing and Quality control” (human sensory (TM-1.06), manual food laboratory (TM-2.06), computerized food laboratory and adoption of HACCP Standards (TM-3.06), smart food laboratory (TM-4.06), and smart food laboratory with IoT, AI and Cloud-based solutions (TM-5.06)); (7) “Business process, documentation, and communication” (oral communication and day-to-day instructions (TM-1.07), written communication and practicing division of labor (TM-2.07), use of computerized software (ERP) and work order systems (TM-3.07), use of an integrated e-system, ERP, and big data analytics for internal and external communication (TM-4.07), and adopting and using human-centric approaches in automated business processes and management practices, integrated cloud-based e-systems for business openness, market orientation and traceability throughout the value chain, along with lean management practices and resilience plans (TM-5.07)). Human-centricity is studied in two different perspectives. The first one is the operational perspective which focuses on human–machine interactions, ergonomic & accident risks, and employee’s physical wellbeing [31,32,33]. The second one is the management perspective which focuses on an organization’s behavioral culture [34] that improves workers’ conditions and eases their tasks through informed decision making [35]. Therefore, this research included human-centricity in both “Production line” and “Business process, documentation, and communication” in its theoretical model. Further, the role of I5.0 in resilience has gained attention since the COVID-19 pandemic. Studies revealed that I5.0 adoption can improve resilience [36]. However, considering the SME nature of the respondents, resilience plans were included in “Business process, documentation, and communication”. The dimensions and factors (theoretical model) derived from the literature are provided in Table 1.

4. Research Method

The theoretical construct was distributed to six experts, three each from academia, and industry practitioners. Based on detailed one-to-one meetings held with the experts, the questionnaire was modified to suit the industry scenario. Further, the 6-level (Level 0—Outsider, Level 1—Beginner, Level 2—Intermediate, Level 3—Experienced, Level 4—Expert, and Level 5—Leading Performer) readiness scale [37,38] was adopted and modified to assess the current industry level of the respondents. The major changes we made to the scale were due to the nature of the study. The levels were labeled as obsolete (Level 0), decline (Level 1), intermediate (Level 2), slow-rising practice (Level 3), fast-rising practice (Level 4), and peak practice (Level 5) for Industry 1.0 (I1.0) and Industry (I2.0) practices; and outsider (Level 0), beginner (Level 1), intermediate (Level 2), experienced (Level 3), expert (Level 4), and leading performer (Level 5) for Industry 3.0 (I3.0), Industry (I4.0) and Industry (I5.0) practices. Thus, for Industry 1.0 (I1.0), and Industry (I2.0), the questions were changed to self-check the respondents ‘practice level’; for Industry 3.0 (I3.0) and Industry (I4.0) ‘adoption level’, and for Industry (I5.0) ‘readiness level’. The final questionnaire consisted of forty-two variables and is presented in Appendix A. The population and sample were determined based on the published list of companies registered under the Department of Industrial Works [13]. The inclusion criteria were the companies registered with the Thailand Standard Industrial Classification (TSIC) codes of 10222, 10291 [39], which stands for ready-made food products; shrimp paste; canning, and smoked salmon; oyster sauce; clams; and mackerel, respectively. According to the SME Promotion Act B.E. 2562 (2019), the MSMEs are classified based on the investment capital and number of employees [40]. In the manufacturing sector, enterprises with 1–5, 6–50, and 51–200 employees were classified as micro, small, and medium enterprises [41]. From expert opinion and pilot visits to the seafood processing factories, research found that small enterprises with less than 30 employees run their business with minimal and basic setups. Thus, companies which are not involved in seafood processing, and with either less than 30, or more than 200 employees, were excluded from the study. The population size after inclusion and exclusion criteria was 60. Instead of using a workshop approach, this research adopted a one-to-one approach. Researchers fixed an appointment through telephone calls and visited the manufacturing units to clearly explain the concepts and objectives of this research, and then the self-check questionnaire was distributed to collect the responses. Among those, 16 refused to participate in the survey. Thus, the response was collected from the remaining 46 respondents. Among the respondents, 16 were the owners and the remaining 30 were the top-level managers of the enterprise. Informed consent was obtained from all the respondents who participated in the study. Four responses were found incomplete and excluded from the study. Thus, the remaining 42 responses were included in the study. Percentage analysis was conducted to analyze the results of the responses and are presented in the next section.

5. Research Findings

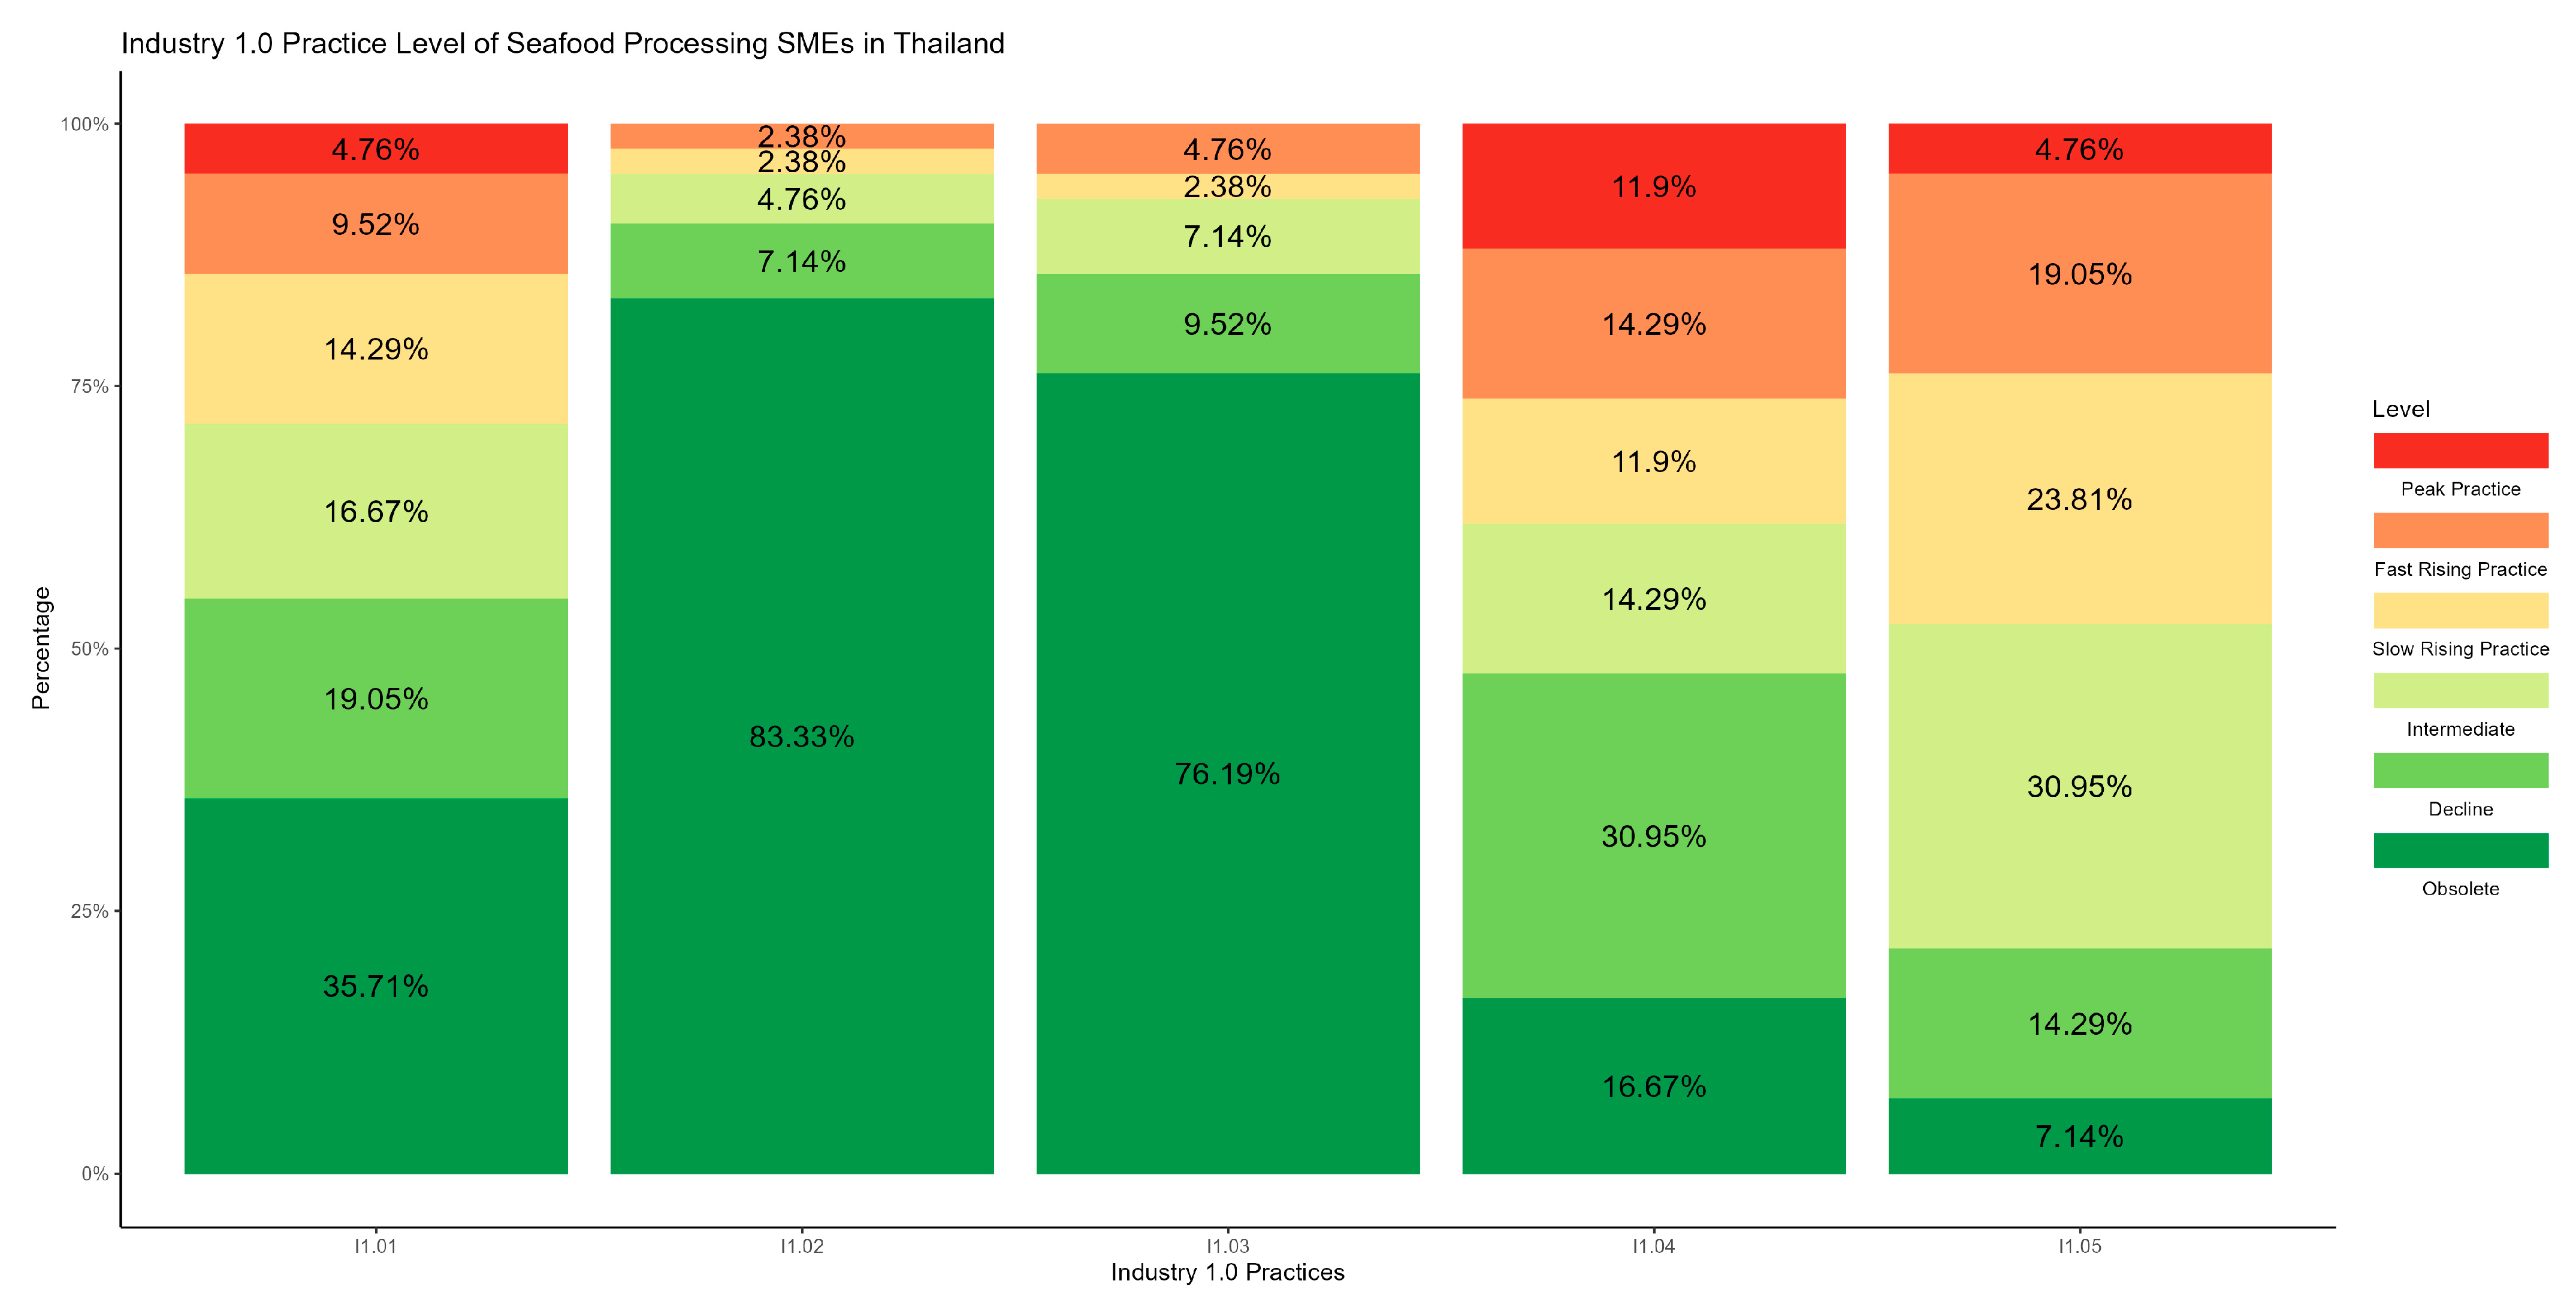
5.1. Industry 1.0 Practice Level

Figure 2 and Table 2 show the Industry 1.0 practice level of seafood processing SMEs. Regarding Industry 1.0 production lines (I1.01), the responses infer that 35.71% mentioned it as obsolete, 19.05% as declining practice, 16.67% as intermediate, 14.29% as slow-rising practice, 9.52% as either experienced or fast-rising practice, and 4.76% as a peak practice.
Thus, the manual or semi-mechanized production line using steam pressure and hot liquids for sterilization (to kill microorganisms) is almost either obsolete or near obsolete. Coal (I1.02) has been one of the major energy sources ever since the first industrial revolution. However, in the seafood processing industry, 83.33% mentioned that its use is obsolete, and only 7.14%, 4.76%, 2.38%, and 2.38%, responded by identifying it as declining practice, intermediate, slow-rising practice, and fast-rising practice, respectively. None of the respondents identified using coal as a peak practice. Sun drying (I1.03) seafood has been a recorded practice since ancient times [42]. However, in the modern seafood processing industry, this practice is not widely adopted, because our results infer that 76.19% and 9.52% identified it as obsolete, and declining practice, respectively. Only 7.14%, 2.38%, and 4.76% selected it as intermediate, slow-rising practice, and fast-rising practice, respectively. None of the respondents identified sun-drying techniques as their peak practice. In terms of manual hermetic sealing and packaging (I1.04), 16.67% responded that the use is obsolete. and 30.95% reported that it is a declining practice. But 14.29%, 11.9%, 14.29%, and 11.9% reported it as intermediate, slow-rising practice, fast-rising practice, and peak practice, respectively. Thus, manual hermetic sealing in the packaging process is still widely practiced among the seafood processors. Regarding business process, documentation, and communication (I1.05), only 7.14% and 14.29% noted oral communication and day-to-day instructions as obsolete and declining practice. Among the remaining, 30.95%, 23.81%, 19.05%, and 4.76% noted it as intermediate, slow-rising practice, fast-rising practice, and peak practice, respectively.
From the above results, we conclude that in terms of overall Industry 1.0 practices among seafood processing SMEs, only 43.81% were obsolete, whereas the remaining 16.2% were declining practice, 14.76% were intermediate, 10.95% were slow-rising practice, 10% were fast-rising practice, and 4.28% were peak practice.

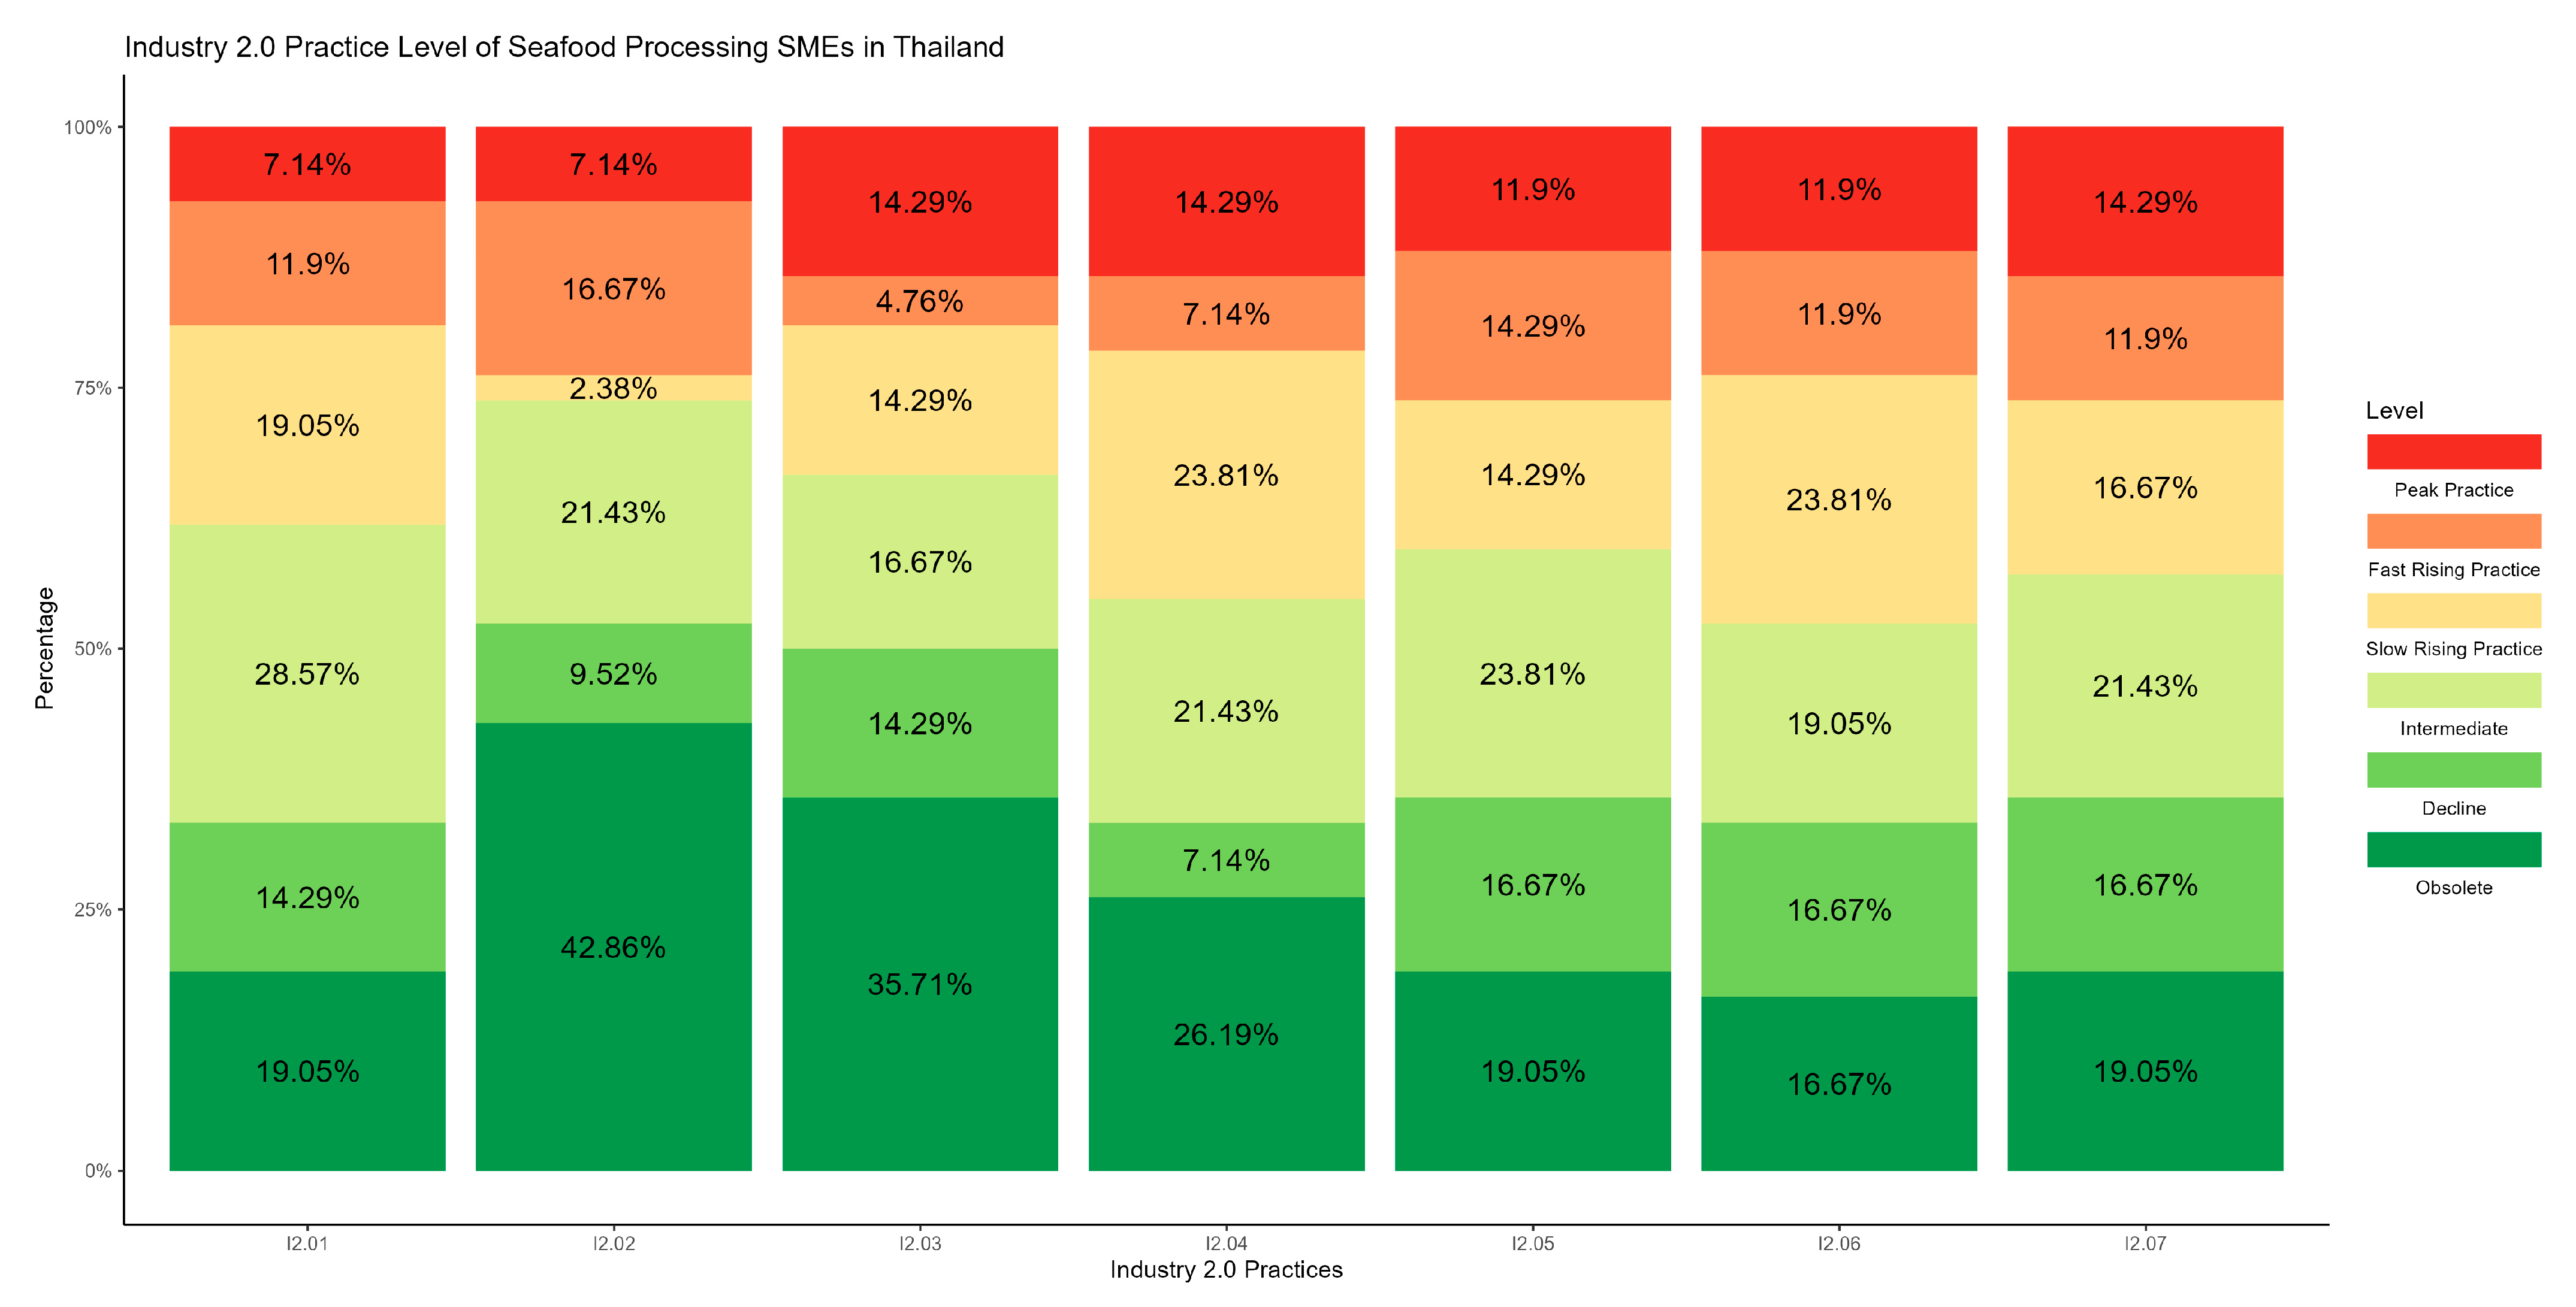
5.2. Industry 2.0 Practice Level

Figure 3 and Table 3 show the Industry 2.0 practice level of seafood processing SMEs. Industry 2.0 refers to the changes from the adoption of petroleum products as an energy source, mechanized production systems, and modern business practices. In terms of production line (I2.01), 19.05% of the respondents noted that a semi-automatic assembly line is obsolete, 14.29% reported it as a declining practice, 28.57% reported it as intermediate, and 19.05% reported it as a slow-rising practice. The remaining 11.9% and 7.14% responded as fast-rising practice, and peak practice, respectively. From the above results it is inferred that the semi-automatic assembly line is still widely in practice.
Regarding major energy sources (I2.02), fossil fuels such as LPG play a major role in small-scale industrial [43] and domestic cooking processes. Among seafood processing SMEs, 42.86%, 9.52%, 21.43%, 2.38%, 16.67%, and 7.14% reported its use as obsolete, declining, intermediate, slow-rising, fast-rising, and peak practice, respectively. The percentage analysis revealed that petroleum products remain as the major source of energy in the production process. There are two types of preservatives used in seafood processing (a) chemical preservatives, and (b) natural preservatives. Though natural preservatives were used for a long period in history, chemical preservation has emerged since the second industrial revolution. Thus, only chemical preservation (I2.03) was used in the questionnaire to study the Industry 2.0 practice level of seafood processing SMEs. 35.71% responded that the use of chemical preservatives in their seafood processing is obsolete. The remaining 14.29%, 16.67%, 14.29%, 4.76%, and 14.29% reported it as declining, intermediate, slow-rising, fast-rising, and peak practice, respectively. The second set of postharvest food processing equipment evolved during the second industrial revolution were freezers and ovens. In terms of using refrigerators and ovens (I2.04) in seafood processing, 26.19% responded as obsolete, whereas the remaining 7.14%, 21.43%, 23.81%, 7.14%, and 14.29% responded as decline, intermediate, slow-rising, fast-rising, and peak practice.
In terms of using semi-automatic machinery for packaging, 19.05% responded as obsolete, 16.67% as declining practice, 23.81% as intermediate, 14.29% as slow-rising, 14.29% fast-rising, and 11.9% as peak practice. Division of labor and use of written communication were used to study the business process, documentation, and communication of seafood processing SMEs. In practicing division of labor 16.67% responded as obsolete, 16.67% as declining, 19.05% as intermediate, 23.81% as slow-rising, 11.9% as fast-rising, and 11.9% as peak practice. Written communication also had a similar percentage share with 19.05% obsolete, 16.67% declining, 21.43% intermediate, 16.67% slow-rising, 11.9% fast-rising and 14.29% as peak practice. Overall, only 25.51% rated the industry 2.0 practices as obsolete. The remaining 13.61%, 21.77%, 16.33%, 11.22% and 11.56% rated them as declining, intermediate, slow-rising, fast-rising, and peak practice, respectively.

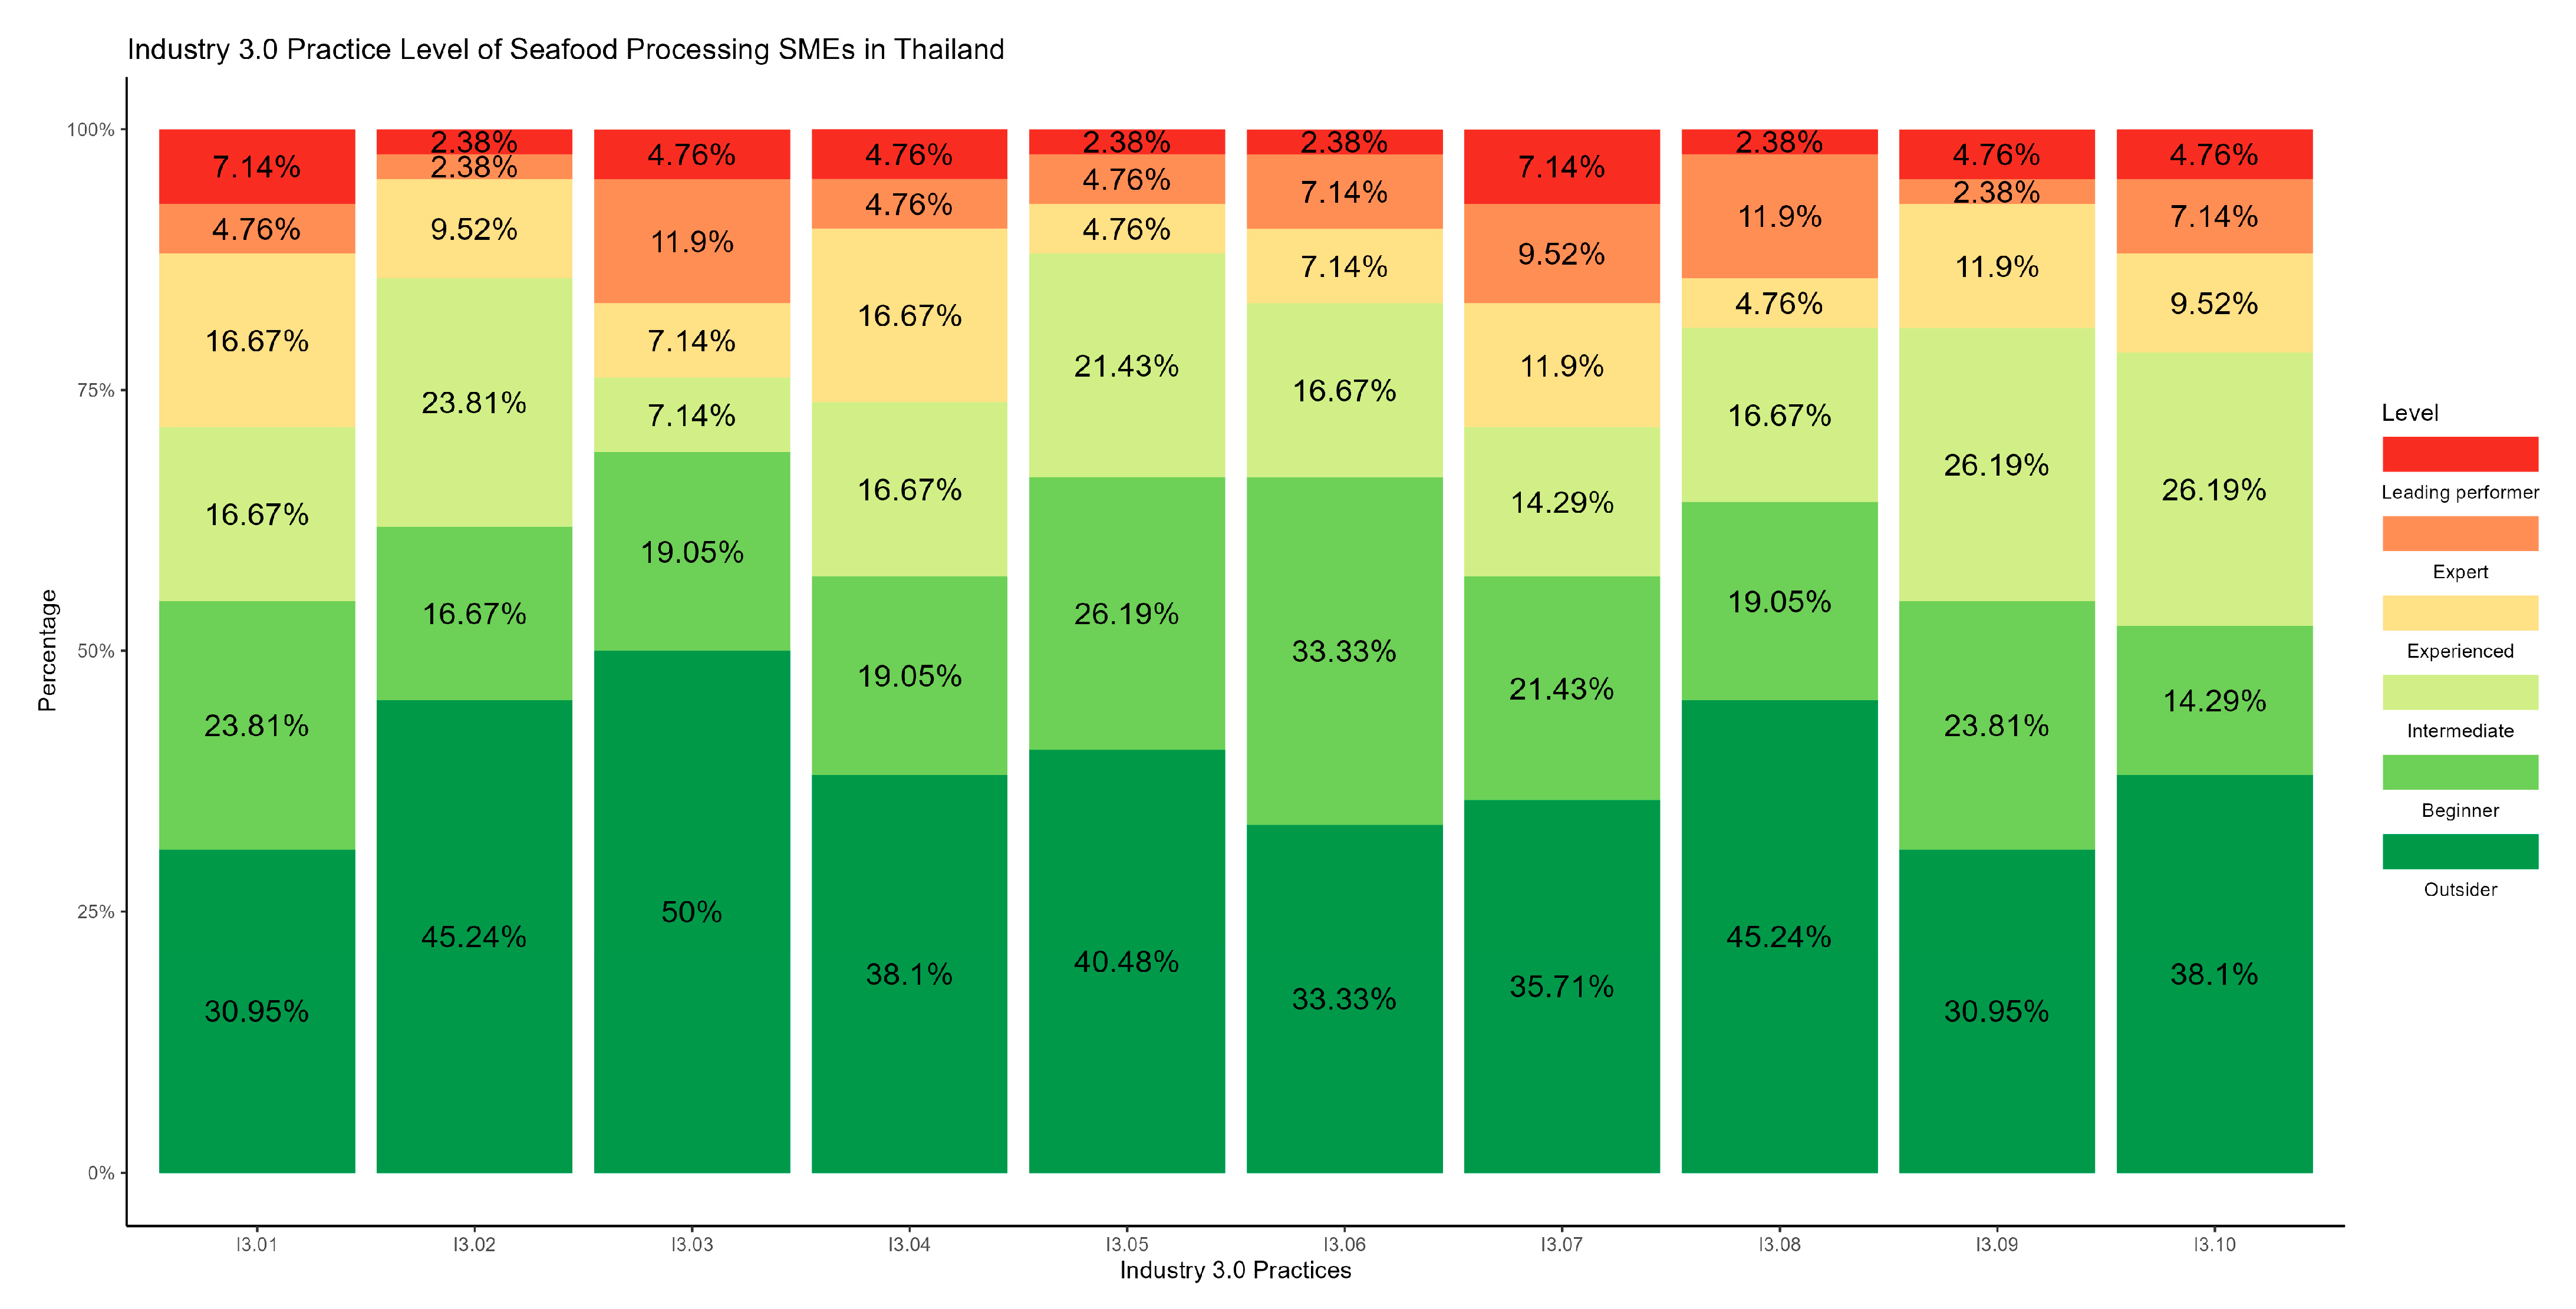
5.3. Industry 3.0 Practice Level

Figure 4 and Table 4 show the Industry 3.0 practice level of seafood processing SMEs. Industry 3.0 mainly refers to the digitalization and automation of factories. In terms of production line (I3.01), 30.95% were outsiders, 23.81% were beginners, 16.67% were intermediate, 16.67% were experienced, only 4.76% were experts, and 7.14% were leading performers, in using an automated assembly line for seafood processing. The major early shift from industry 2.0 to 3.0 in terms of energy source is the use of electricity in the production process. However, in later periods, shifting towards renewable energy came into practice. Thus, for the question on ‘use of renewable energy along with electricity’ (I3.02), 45.24% were outsiders, 16.67% were beginners, 23.81% were intermediate, 9.52% were experienced, and only 2.38% were expert and 2.38% leading performers. For seafood processing 3.0, two questions were asked, one on the use of computerized machinery and the second on the use of advanced dry freezers. 50% were outsiders, 19.05% were beginners, 7.14% were intermediate, 7.14% experienced, 11.9% were experts, and 4.76% were leading performers in using computerized machinery (I3.03); 38.1% were outsiders, 19.05% were beginners, 16.67% were intermediate, 16.67% were experienced, 4.76% were experts, and 4.76% were leading performers in using advanced dry freezers (I3.04). In terms of packaging 3.0, two questions were included: one on the use of vacuum packaging, and the second was kept as generic due to the availability of different primary and secondary packaging technologies. For vacuum packaging (I3.05), 40.48% marked themselves as outsiders, 26.19% as beginners, 21.43% as intermediate, 4.76% as experienced, 4.76% as expert, and 2.38% as leading performers.
For other modern packaging technologies (I3.06), 33.33% marked themselves as outsiders, 33.33% as beginners, 16.67% as intermediate, 7.14% as experienced, 7.14% as expert, and 2.38% as leading performers. In terms of using digitally printed labels (I3.07), 35.71% were outsiders, 21.43% were beginners, 14.29% were intermediate, 11.9% were experienced, 9.52% were expert, and 7.14% were leading performers. Computerization of food laboratories for anti-bacterial testing methods, sensory, texture analyzing, and quality control (I3.08) were well developed during Industry 3.0. However, 45.24% of the respondents marked themselves as outsiders, and the remaining 19.05%, 16.67%, 4.76%, 11.9%, and 2.38% marked themselves as beginners, intermediate, experienced, expert, and leading performers in using it. Two questions were used to identify business process, documentation, and communication 3.0: new technologies and internet for communication for external communication, and computerized work order systems for internal communication. In terms of new technologies and internet for communication (I3.09), 30.95% were outsiders, 23.81% were beginners, 26.19% were intermediate, 11.9% were experienced, 2.38% were expert, and 4.76% were leading performers. In terms of computerized work order systems (I3.10), 38.1% were outsiders, 14.29% were beginners, 26.19% were intermediate, 9.52% were experienced, 7.14% were expert, and 4.76% were leading performers. From the percentage average it is inferred that only 38.81% rated themselves as outsiders with Industry 3.0 practices. The remaining 21.67% at beginner level, 18.57% at intermediate level, 10% at experienced level, 6.66% at expert level, and 4.28% leading performer level.

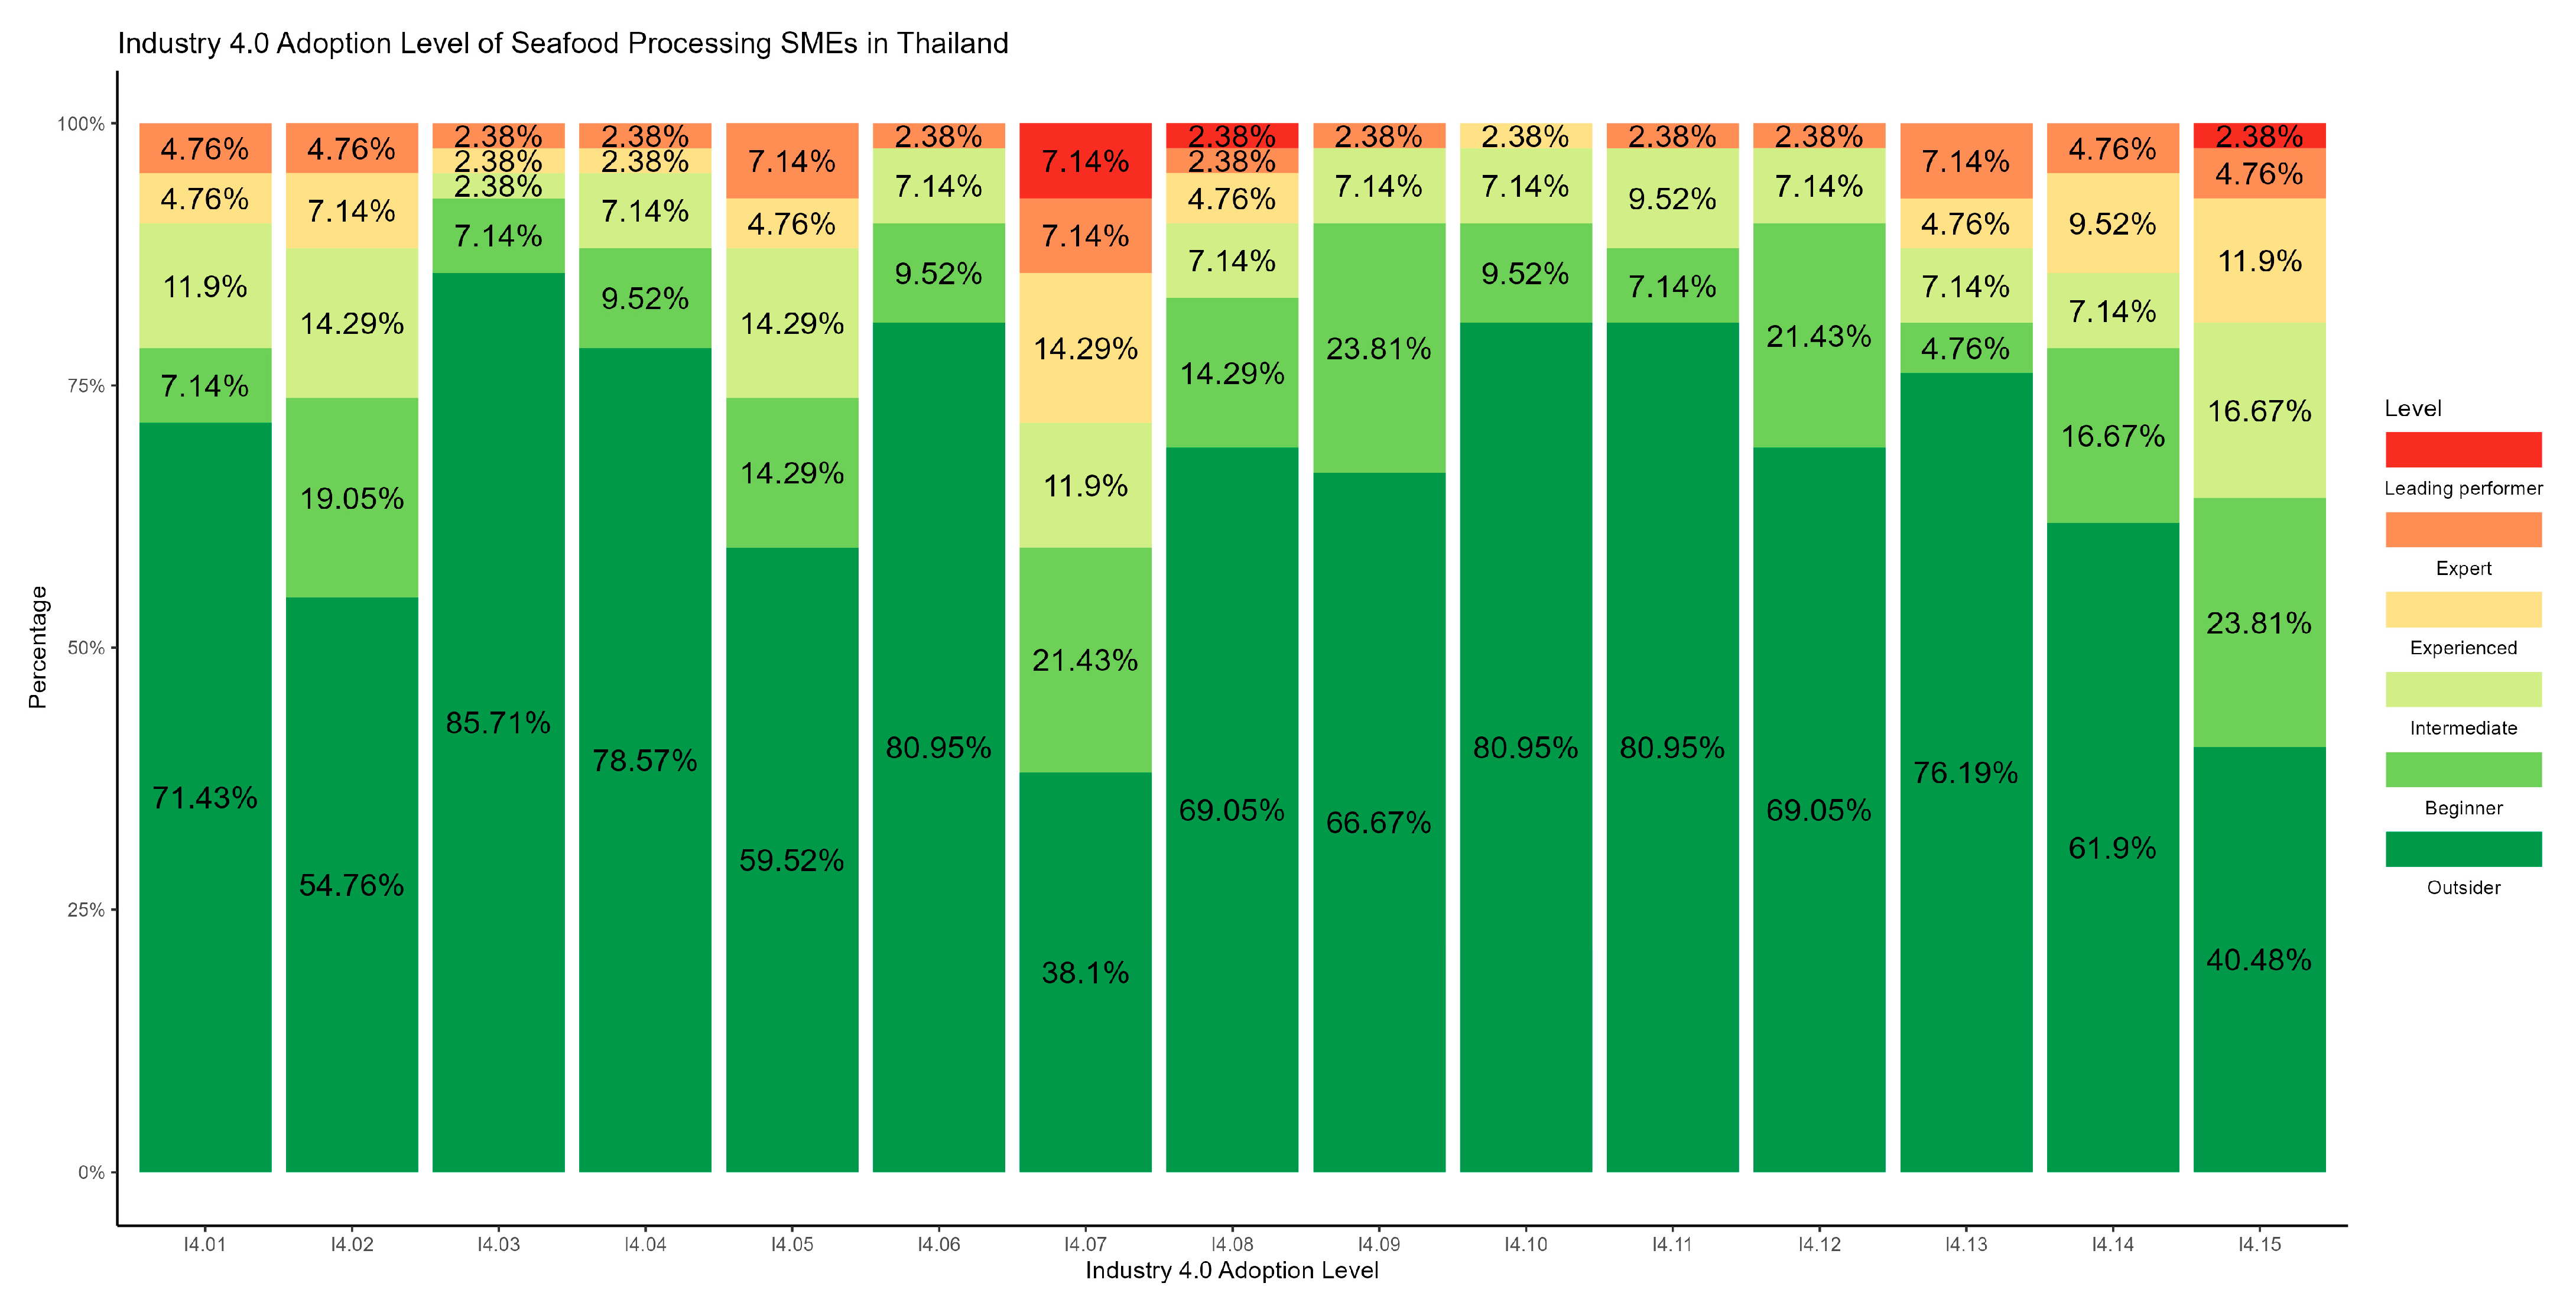
5.4. Industry 4.0 Adoption Level

Industry 4.0 is a transformative concept for the integration of advanced technologies, automation, and data exchange in manufacturing processes to create intelligent, interconnected, and highly efficient industrial ecosystems. Figure 5 and Table 5 show the Industry-4.0 practice level of seafood processing SMEs. Three questions related to the adoption level of production line were asked: the first on the smart automation of production line, the second on the complete digitalization of the production process, and the third on the adoption of robots in the production line. In terms of being fully automated (smart assembly line) (I4.01), 71.43% were outsiders, 7.14% were beginners, 11.9% were intermediate, 4.76% were experienced, and 4.7% were expert, while none identified themselves as leading performers. In terms of the complete digitalization of the production process (I4.02), 54.76% were outsiders, 19.05% were beginners, 14.29% were intermediate, 7.14% were experienced, and 4.76% were expert, while none identified themselves as leading performers. In terms of the adoption of robots in the production line (I4.03), 85.71% were outsiders, 7.14% were beginners, 2.38% were intermediate, 2.38% were experienced, and 2.38% were expert, while none identified themselves as leading performers. Regarding the adoption of robotic machinery in seafood processing (I4.04), 78.57% were outsiders, 9.52% were beginners, 7.14% were intermediate, 2.38% were experienced, and 2.38% were experts, while none identified themselves as leading performers. Nearly similar levels were also marked for the adoption of high-pressure processing techniques (I4.06): 80.95% were outsiders, 9.52% were beginners, 7.14% were intermediate, and 2.38% were experts, while none identified themselves as either experienced or leading performers. In terms of adopting eco-friendly extraction methods (I4.05), 59.52% were outsiders, 14.29% were beginners, 14.29% were intermediate, 4.76% were experienced, and 7.14% were experts, while none identified themselves as leading performers. For the next question on the adoption of thermal and non-thermal processing and preservation technologies (I4.07), 38.1% marked themselves as outsiders, 21.43% as beginners, 11.9% as intermediate, 14.29%as experienced, 7.14% as experts, and 7.14% as leading performers.
Two questions were asked regarding the adoption of packaging 4.0, namely (a) automated canning/packaging, and (b) smart vacuum processing and packaging machines. Regarding adoption of automated canning/packaging machines (I4.08), 69.05% marked themselves as outsiders, from the remaining 14.29%, 7.14%, 4.76%, 2.38%, and 2.38% identified themselves as beginners, intermediate, experienced, experts, and leading performers. Further, with respect to the adoption of smart vacuum processing and packaging machines (I4.09), 66.67% marked themselves as outsiders, 23.81% as beginners, 7.14% as intermediate, and 2.38% as experts. None of the respondents identified themselves as either experienced or leading performers. For the next question regarding the adoption of smart labelling (RFID) (I4.10), 80.95% were outsiders, 9.52% were beginners, 7.14% were intermediate, and 2.38% were experienced, while none of the respondents were either expert or leading performers. In terms of anti-bacterial testing methods, sensory, texture analyzing and quality control, 80.95%, 7.14%, 9.52%, and 2.38% marked themselves outsiders, beginners, intermediate, and experts, while none identified themselves as experienced or leading performers in using smart sensory and texture-analyzing machinery (I4.11). A slightly different trend was noticed in the adoption of AI technologies for food sensing (I4.12), 69.05% were outsiders, 21.43% were beginners, 7.14% were intermediate, and 2.38% were experts. However, none were either experienced or leading performers. The last set of questions was related to business process, documentation, and communication 4.0. The first one was on adoption of the ERP system (I4.13); 76.19% responded as outsiders, 4.76% were beginners, 7.14% were intermediate, 4.76% were experienced, and 7.14% were experts in using the ERP system, whereas none were leading performers. In terms of using big data to analyze consumer demand and consumer behavior (I4.14), 61.9% were outsiders, 16.67% were beginners, 7.14% were intermediate, 9.52% were experienced, and 4.76% were experts. However, none identified themselves as leading performers. The final question was related to the adoption of an e-system or software for communicating with internal employees and external suppliers (I4.15): 40.48% marked themselves as outsiders and 23.81% as beginners. The remaining 16.67%, 11.9%, 4.76%, and 2.38% marked themselves as intermediate, experienced, expert, and leading performers.
The percentage average for Industry 4.0 infers that 67.62% were outsiders and 13.97% were beginners. Thus, 81.59% were either outsiders or beginners. Only 9.21%, 4.6, and 3.81% were intermediate, experienced, and experts in adopting Industry 4.0. A mere 0.79% identified themselves as leading performers, which counted only from thermal and non-thermal processing and preservation technologies, automated canning/packaging, and e-system or software for communicating with internal employees and external suppliers.

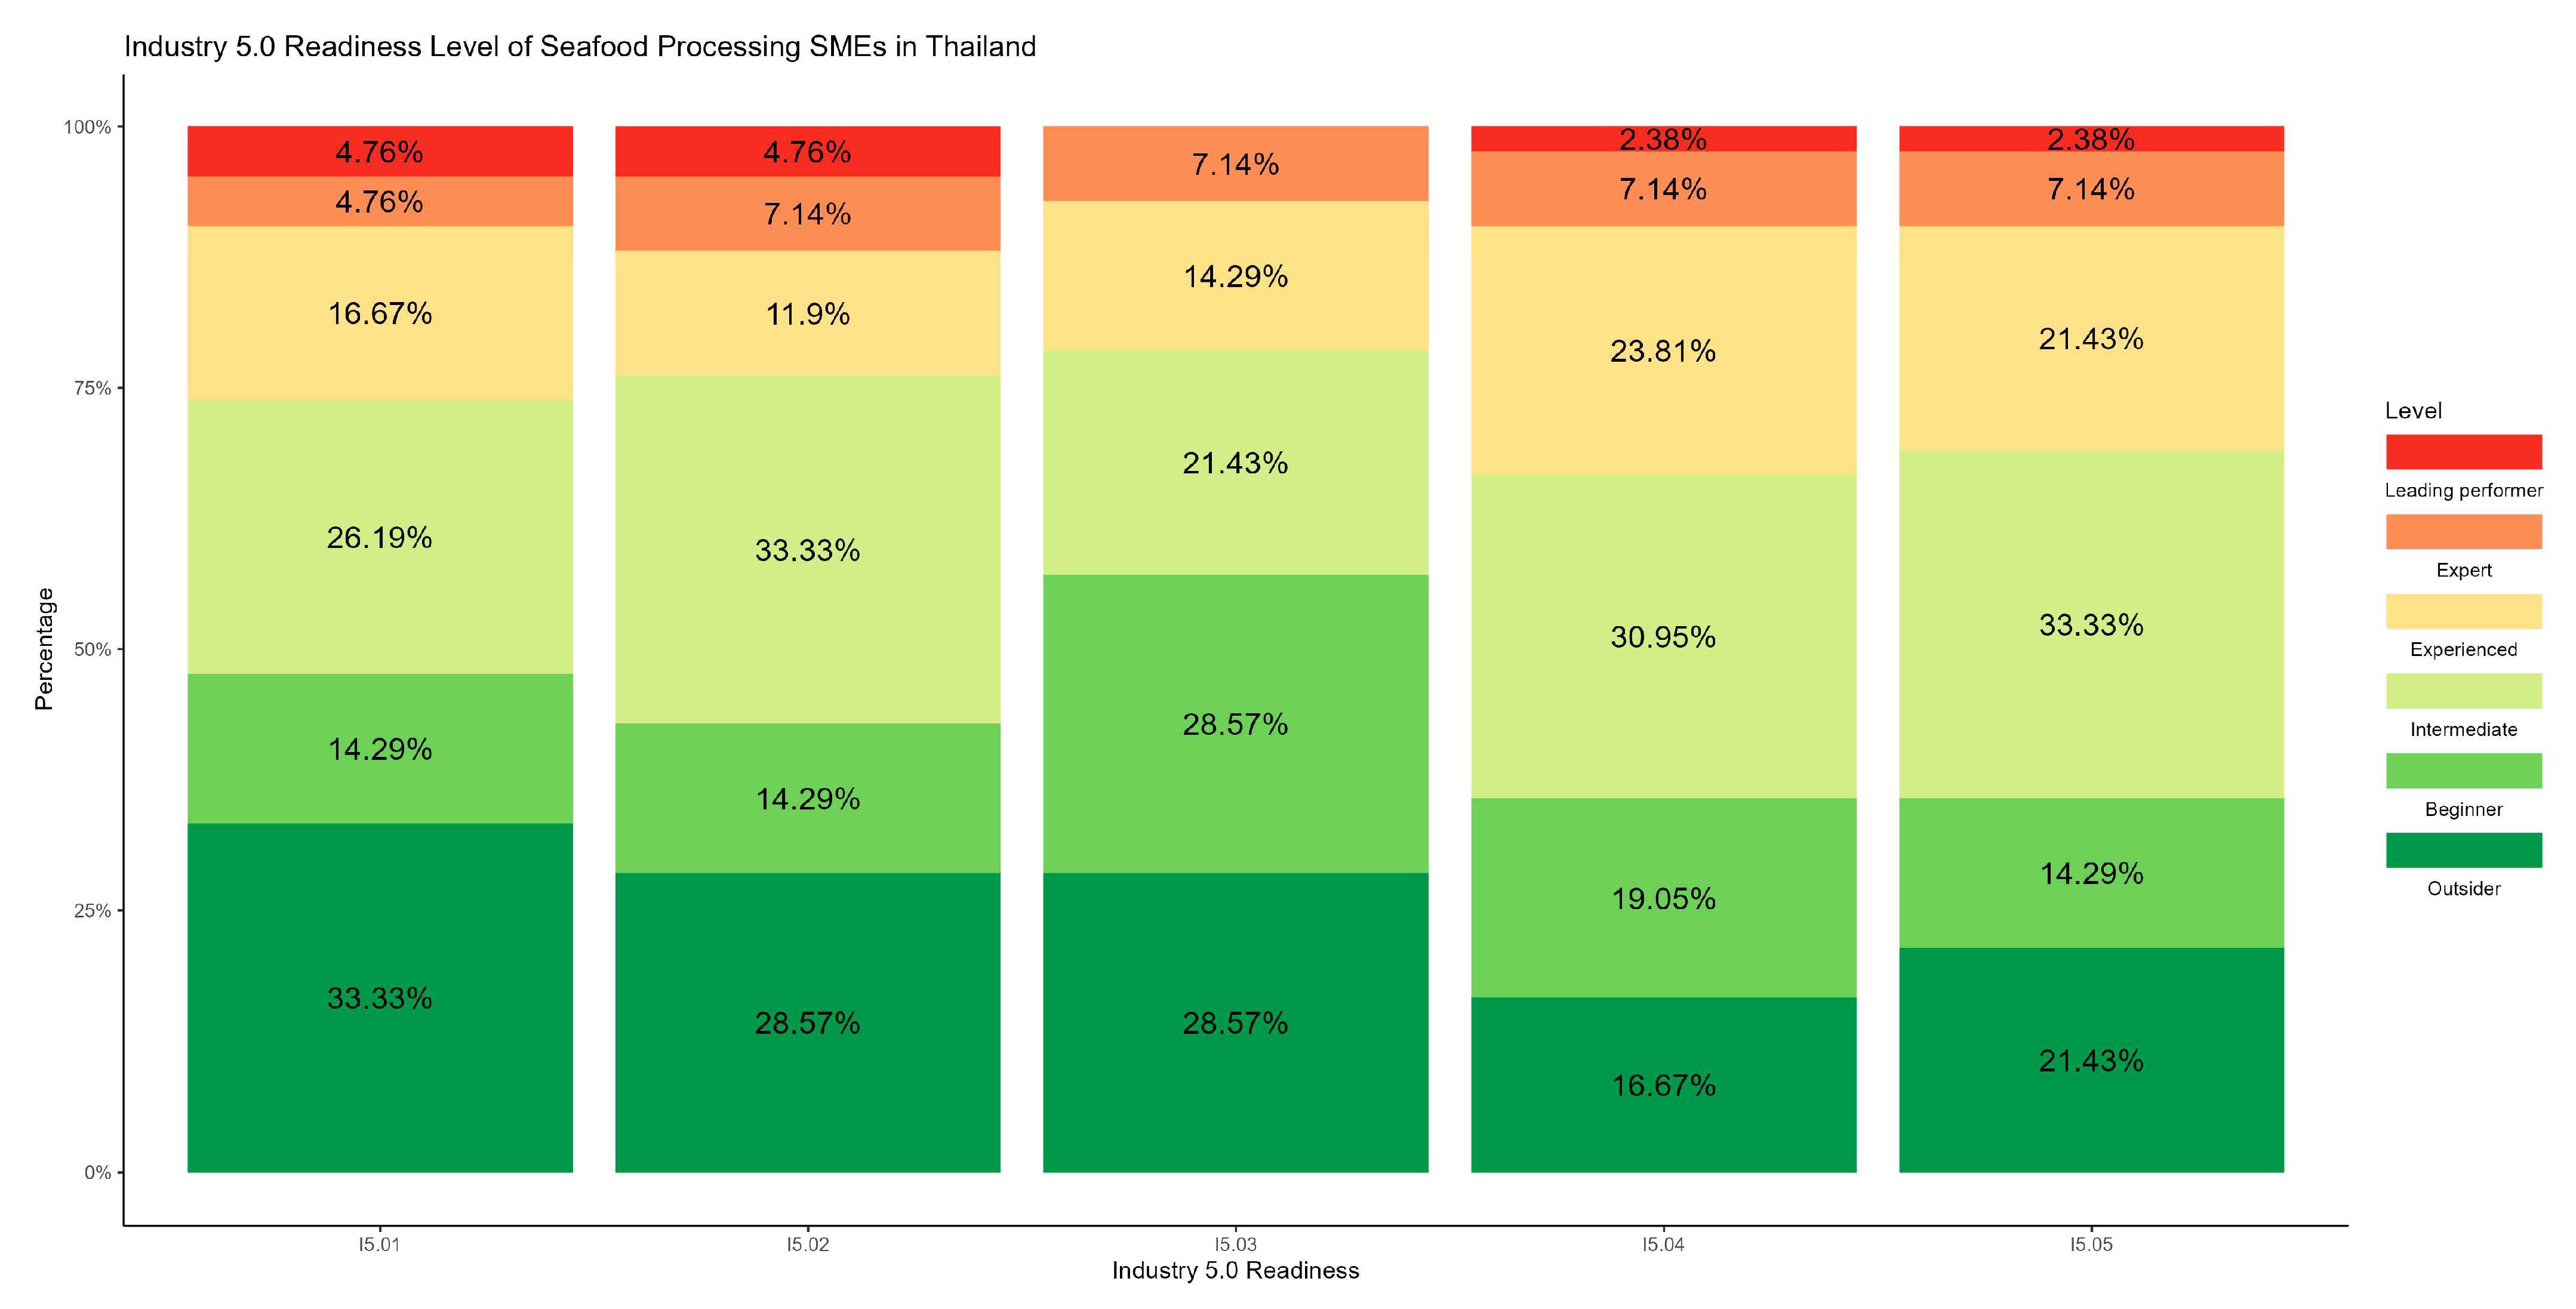
5.5. Industry 5.0 Readiness Level

Industry 5.0 is a concept that builds upon Industry 3.0 and 4.0, emphasizing the collaborative partnership between humans and advanced technologies to achieve sustainable and inclusive growth in manufacturing and industrial processes. Thus, questions regarding production line; energy source; seafood processing; packaging; labelling; and anti-bacterial testing methods, sensory, texture analyzing, and quality control, were set aside. Only questions related to business process, documentation, and communication were included for assessing the Industry 5.0 readiness level. Figure 6 and Table 6 show the Industry-5.0 practice level of seafood processing SMEs.
In terms of human-centric management practices (I5.01), 33.33% marked themselves as outsiders, 14.29% as beginners, 26.19% as intermediate, 16.67% as experienced, 4.76% as experts, and 4.76% as leading performers. Regarding adopting fair trade practices using business openness, market orientation, and traceability throughout the value chain (I5.02), 28.57% marked themselves as outsiders, 14.29% as beginners, 33.33% as intermediate, 11.9% as experienced, 7.14% as experts, and 4.76% as leading performers. In terms of using lean management to effectively manage resources and reduce waste (I5.03), 28.57% were outsiders, 28.57% were beginners, 21.43% were intermediate, 14.29% were experienced, 7.14% were experts, and none were leading performers. A total of 16.67%, 19.05%, 30.95%, 23.81%, 7.14%, and 2.38% identified themselves as outsiders, beginners, intermediate, experienced, expert, and leading performers in adopting sustainability practices to reduce negative economic, environmental, and social impacts (I5.04). On the final question regarding the readiness for developing/adopting resilience plans to handle economic/environmental disruptions (I5.05), 21.43%, 14.29%, 33.33%, 21.43%, 7.14%, and 2.38% marked themselves as outsiders, beginners, intermediate, experienced, expert, and leading performers, respectively.
From the percentage average it is inferred that 25.71%, 18.10%, 29.05%, 17.62%, 6.66%, and 2.86% were outsiders, beginners, intermediate, experienced, expert, and leading performers, respectively.

6. Findings, Discussion, and Conclusions

This article classified the “Industry 1.0”, “Industry 2.0”, “Industry 3.0”, “Industry 4.0”, and “Industry 5.0” of the seafood processing industry, and assessed the current industry adoption level of the respondents with a 6-level scale. It also subclassified the adoption levels based on (a) production line; (b) major energy source; (c) seafood processing; (d) packaging; (e) labelling; (f) anti-bacterial testing methods, sensory, texture analyzing and quality control; and (g) business process, documentation, and communication. The scale was distributed to seafood processing SMEs in Thailand to analyze their level of adoption. In line with previous findings [3,16,17], the results revealed that most of the respondents are still with Industry 1.0, 2.0 and 3.0 practices. However, this study precisely identified the level of adoption in each sub-classification, bringing more insights into the industry. In terms of Industry 4.0, there is a relatively larger proposition of penetration in thermal and non-thermal processing and preservation technologies, and electronic systems or software for communicating with internal employees and external suppliers. All the other factors remain mainly unadopted by the SMEs. However, the results also revealed that the Industry 5.0 readiness of the SMEs is comparatively higher than that of the previous one in terms of business process, documentation, and communication.
The above findings have at least three major implications. Firstly, an SME may be adopting Industry 4.0 for any one of the processes as per Table 1, a business practice from Industry 5.0, and may still use “Industry 2.0”/“Industry 3.0” practices for another process. Thus, studies intended to assess the Industry 5.0 readiness level in the future should include the present practice level, and adoption levels of previous industrial revolution-related practices. This will help researchers to clearly understand the current condition of practices in the industry and identify the requirements to adopt Industry 5.0. Secondly, the sections in the classifications are minimized to suit studies intended to assess small and medium-sized enterprises (SMEs). Though several “Industry 4.0” technologies emerged and are conceptualized by researchers, this framework maintained the least number by cogitating on the nature of SMEs. Therefore, researchers can adopt this seven-dimensional framework (Table 1) and change the questions based on their industrial process. Further, this scale can also be adopted and extended to suit the service industries. Thirdly, there is no evidence of the fully-fledged adoption of “Industry 4.0“ by SMEs in the seafood processing industry. There is only minimal and partial adoption of Industry 4.0-related technologies [44]. Similarly, Thai seafood processing SMEs can escalate from their present state of “Industry 1.0”, “Industry 2.0”, and “Industry 3.0” to partial adoption of “Industry 5.0”. Also, open innovation practices [8] could facilitate SMEs to take advantage of industrial revolutions with lower costs in technology, research and development, and sustainable development. Thus, further research on their perceived “Industry 5.0” suitability for sustainable growth will bring more insights on the readiness of seafood processing SMEs. The practitioners and society can adopt this self-measurable construct (Appendix A) for assessing the current level of practices and Industry 5.0 readiness level. Assessing the current level of practices using this framework will provide more insights on areas of adoption and improvement. The major limitation of this study is that it did not intend to propose any hypotheses to measure causal relations. Thus, this framework can be extended to study several status quo-related causal relationships such as “Why SMEs are not moving beyond I3.0 and not adopting any particular I4.0 technologies and practices”. Geographical location, business size, and time period are the other limitations of this study. Hence, the framework can be used to assess industries at different geographical locations.

Author Contributions

Conceptualization (M.M.); Methodology (M.M. and M.A.S.); Investigation (M.M. and M.A.S.); Data curation (M.M. and M.A.S.); Software (M.A.S.); Resources (M.M.); Formal analysis (M.M. and M.A.S.); Validation (M.M. and M.A.S.); Funding acquisition (M.M.); Project administration (M.M.); Writing—original draft (M.M. and M.A.S.); Writing—review & editing (M.M., M.A.S. and S.W.); Visualization (M.M. and M.A.S.); Supervision (S.W.). All authors have read and agreed to the published version of the manuscript.

Funding

This project is funded by the National Research Council of Thailand (NRCT). Capital Name: Research and Innovation Grants for Young Talented Researchers 2021, Contract number: N41A640113.

Institutional Review Board Statement

The Research Ethics Committee of Chiang Mai University has reviewed and issued the “Certificate of Exemption” (COE No. 002/66, CMUREC Code No. 65/234, Date: 6 January 2023) which was approved based on the international guidelines for human research protection including the Declaration of Helsinki, International Conference on Harmonization in Good Clinical Practice (ICH-GCP), and The Belmont Report.

Informed Consent Statement

Informed consent was obtained from all the respondents who participated in this study. The study and its purpose were explained to all the respondents who participated in this study. The anonymity and confidentiality of the data were maintained at all times.

Data Availability Statement

The data are not publicly available due to privacy and ethical restrictions.

Acknowledgments

We thank the National Research Council of Thailand (NRCT) for funding this research (Capital Name: Research and Innovation Grants for Young Talented Researchers 2021. Contract number: N41A640113). All the authors thank the participants (seafood processing SMEs of Thailand) for their support and participation in this research. The authors thank the College of Maritime Studies and Management, Chiang Mai University, Samut Sakhon, for their encouragement and support in conducting this research successfully.

Conflicts of Interest

The authors declare no conflicts of interest.

Appendix A

Table A1. Industrial Revolutions and Seafood Processing Industry (Self-check final scale).
LabelLevels012345
Industry 1.0
(Obsolete—0, Decline—1, Intermediate—2, Slow-rising practice—3, Fast-rising Practice—4, Peak Practice—5)
I1.01manual or semi-mechanized production using steam pressure and hot liquids for sterilization (kill microorganisms).
I1.02Using coal as an energy source in the production process.
I1.03Using sun drying methods.
I1.04Using manual hermetic sealing process.
I1.05Only oral communications are used to instruct the employees on day-to-day operations.
Industry 2.0
(Obsolete—0, Decline—1, Intermediate—2, Slow-rising practice—3, Fast-rising Practice—4, Peak Practice—5)
012345
I2.01Producing in mass using semi-automatic assembly lines.
I2.02Using petroleum products for production process (Diesel/Kerosene/LPG) as an energy source in the production process.
I2.03Applying chemical compositions in drying, freezing, and pasteurization.
I2.04Using refrigerators and oven for freezing, storing, and drying.
I2.05Using semi-automatic machineries in the production process.
I2.06Practicing division of labor in food processing, preservation, and other functional departments.
I2.07Using written communication to provide instructions without a standard format (TQM/Quality Management Systems).
Industry 3.0
(Outsider—0, Beginner—1, Intermediate—2, Experienced—3,
Expert—4, Leading performer—5)
012345
I3.01Using electronically automated machineries for seafood and seafood products processing.
I3.02Using renewable energy sources in the organization.
I3.03Using programmed/computerized machineries in processing (sterilization, freeze-drying, drying).
I3.04Using advanced equipment in freezing.
I3.05Using vacuum packaging for preservation of seafood and seafood products.
I3.06Using modern packaging technology.
I3.07Using digital printing on packages.
I3.08Using food laboratories along with anyone of the following applications such as computers, advanced equipment, biotechnology, and nanotechnology.
I3.09Using new technologies and the internet in all functional areas of business management.
I3.10Using software or work order system in the firm for communication.
Industry 4.0
(Outsider—0, Beginner—1, Intermediate—2, Experienced—3,
Expert—4, Leading performer—5)
012345
I4.01Usage of automated machineries.
I4.02Usage of a fully digitalized manufacturing process.
I4.03Usage of robots in the production line (picking, moving, and placing).
I4.04Usage of robotic machineries in processing.
I4.05Usage of eco-friendly extraction technologies.
I4.06Usage of high-pressure processing technologies.
I4.07Usage of thermal and non-thermal processing and preservation technologies.
I4.08Usage of automatic canning/packaging machineries.
I4.09Usage of vacuum processing and packaging machines.
I4.10Usage of smart labelling (RFID).
I4.11Usage of sensory and texture analyzing machineries.
I4.12Usage of artificial intelligence (AI) food sensing technologies for tracing food safety and quality.
I4.13Use of ERP systems.
I4.14Usage of big data to analyze consumer demand and consumer behavior.
I4.15Usage of e-system or software for communicating with internal employees and external suppliers.
Industry 5.0
(Outsider—0, Beginner—1, Intermediate—2, Experienced—3,
Expert—4, Leading performer—5)
012345
I5.01Using human-centric approach in automated business processes and management practices.
I5.02Adopting fair trade practices using business openness, market orientation and traceability throughout the value chain.
I5.03Using lean management to effectively manage resources and reduce waste.
I5.04Adopt sustainability practices to reduce negative economic, environmental, and social impacts.
I5.05Develop/adopt resilience plans to handle economic/environmental disruptions.

References

  1. Madhavan, M.; Sharafuddin, M.A.; Chaichana, T. Impact of Business Model Innovation on Sustainable Performance of Processed Marine Food Product SMEs in Thailand—A PLS-SEM Approach. Sustainability 2022, 14, 9673. [Google Scholar] [CrossRef]
  2. Simonetto, M.; Peron, M.; Fragapane, G.; Sgarbossa, F. Digital Assembly Assistance System in Industry 4.0 Era: A Case Study with Projected Augmented Reality. In Proceedings of the Advanced Manufacturing and Automation X; Wang, Y., Martinsen, K., Yu, T., Wang, K., Eds.; Springer: Singapore, 2021; pp. 644–651. [Google Scholar]
  3. SMEs Development Bank of Thailand. Available online: https://www.smebank.co.th/en/news/detail/622 (accessed on 15 December 2022).
  4. Rada, M. INDUSTRY 5.0—From Virtual to Physical. Available online: https://www.linkedin.com/pulse/industry-50-from-virtual-physical-michael-rada (accessed on 12 December 2022).
  5. European Economic and Social Committee Industry 5.0 Will Bring about a New Paradigm of Cooperation between Humans and Machines. Available online: https://www.eesc.europa.eu/en/news-media/eesc-info/012019/articles/66151 (accessed on 13 December 2022).
  6. Müller, J. Enabling Technologies for Industry 5.0: Results of a Workshop with Europe’s Technology Leaders; Results of a Workshop with Europe’s Technology Leaders; European Commission: Luxembourg, 2020. [Google Scholar]
  7. Directorate-General for Research and Innovation (European Commission); Breque, M.; De Nul, L.; Petridis, A. Industry 5.0: Towards a Sustainable, Human Centric and Resilient European Industry; Publications Office of the European Union: Luxembourg, 2021. [Google Scholar]
  8. Madhavan, M.; Wangtueai, S.; Sharafuddin, M.A.; Chaichana, T. The Precipitative Effects of Pandemic on Open Innovation of SMEs: A Scientometrics and Systematic Review of Industry 4.0 and Industry 5.0. J. Open Innov. Technol. Mark. Complex. 2022, 8, 152. [Google Scholar] [CrossRef]
  9. Hein-Pensel, F.; Winkler, H.; Brückner, A.; Wölke, M.; Jabs, I.; Mayan, I.J.; Kirschenbaum, A.; Friedrich, J.; Zinke-Wehlmann, C. Maturity Assessment for Industry 5.0: A Review of Existing Maturity Models. J. Manuf. Syst. 2023, 66, 200–210. [Google Scholar] [CrossRef]
  10. International Labour Organization. Endline Research Findings on Fishers and Seafood Workers in Thailand; International Labour Organization: Geneva, Switzerland, 2020. [Google Scholar]
  11. Sowcharoensuk, C. Industry Outlook 2019–2021: Processed Seafood; Krungsri Research: Bangkok, Thailand, 2019; Available online: https://www.krungsri.com/en/research/industry/industry-outlook/food-beverage/processed-seafood/io/io-frocessed-seafood-20-th (accessed on 18 December 2022).
  12. MOC, Thailand. Available online: https://www.moc.go.th/ (accessed on 18 December 2022).
  13. Department of Industrial Works|Department of Industrial Works. Available online: https://www.diw.go.th/webdiw/ (accessed on 2 June 2023).
  14. Suwanrangsi, S. Advances in Fish Processing Technology in Thailand in Relation to Quality Management. In Proceedings of the Seminar on the Advances in Fish Processing Technology in Southeast Asia in Relation to Quality Management, Singapore, 29 October–1 November 1996; Marine Fisheries Research Department, Southeast Asian Fisheries Development Center: Singapore, 1997; pp. 72–93. [Google Scholar]
  15. Cirera, X.; Comin, D.; Cruz, M.; Lee, K.M.; Soares Martins-Neto, A. Firm-Level Technology Adoption in Vietnam; Policy Research Working Papers; No.9567; The World Bank: Washington, DC, USA, 2021. [Google Scholar]
  16. Cirera, X.; Comin, D.; Cruz, M.; Lee, K.M. Firm-Level Adoption of Technologies in Senegal; Policy Research Working Papers; WPS9657; The World Bank: Washington, DC, USA, 2021. [Google Scholar]
  17. Cirera, X.; Comin, D.; Cruz, M. A New Approach to Measure Technology Adoption at the Firm-Level; The World Bank: Washington, DC, USA, 2020. [Google Scholar]
  18. Chunthasiri, Y.; Intarakamhang, U.; Kongprasert, N.; Carr, S.C.; Young-Hauser, A.M. Causal Model of Talent Utilization, Engagement and Performance among Employees in the Seafood Processing Industry. J. Behav. Sci. 2021, 16, 109–122. [Google Scholar]
  19. Echegaray, N.; Hassoun, A.; Jagtap, S.; Tetteh-Caesar, M.; Kumar, M.; Tomasevic, I.; Goksen, G.; Lorenzo, J.M. Meat 4.0: Principles and Applications of Industry 4.0 Technologies in the Meat Industry. Appl. Sci. 2022, 12, 6986. [Google Scholar] [CrossRef]
  20. Hassoun, A.; Siddiqui, S.A.; Smaoui, S.; Ucak, İ.; Arshad, R.N.; Garcia-Oliveira, P.; Prieto, M.A.; Aït-Kaddour, A.; Perestrelo, R.; Câmara, J.S. Seafood Processing, Preservation, and Analytical Techniques in the Age of Industry 4.0. Appl. Sci. 2022, 12, 1703. [Google Scholar] [CrossRef]
  21. Jideani, A.I.O.; Mutshinyani, A.P.; Maluleke, N.P.; Mafukata, Z.P.; Sithole, M.V.; Lidovho, M.U.; Ramatsetse, E.K.; Matshisevhe, M.M. Impact of Industrial Revolutions on Food Machinery—An Overview. J. Food Res. 2020, 9, 42. [Google Scholar] [CrossRef]
  22. Hassoun, A.; Prieto, M.A.; Carpena, M.; Bouzembrak, Y.; Marvin, H.J.P.; Pallarés, N.; Barba, F.J.; Punia Bangar, S.; Chaudhary, V.; Ibrahim, S.; et al. Exploring the Role of Green and Industry 4.0 Technologies in Achieving Sustainable Development Goals in Food Sectors. Food Res. Int. 2022, 162, 112068. [Google Scholar] [CrossRef] [PubMed]
  23. Hassoun, A.; Alhaj Abdullah, N.; Aït-Kaddour, A.; Ghellam, M.; Beşir, A.; Zannou, O.; Önal, B.; Aadil, R.M.; Lorenzo, J.M.; Mousavi Khaneghah, A.; et al. Food Traceability 4.0 as Part of the Fourth Industrial Revolution: Key Enabling Technologies. Crit. Rev. Food Sci. Nutr. 2022, 64, 873–889. [Google Scholar] [CrossRef] [PubMed]
  24. Akundi, A.; Euresti, D.; Luna, S.; Ankobiah, W.; Lopes, A.; Edinbarough, I. State of Industry 5.0—Analysis and Identification of Current Research Trends. Appl. Syst. Innov. 2022, 5, 27. [Google Scholar] [CrossRef]
  25. Atwell, C. Yes, Industry 5.0 Is Already on the Horizon. Available online: https://www.machinedesign.com/automation-iiot/article/21835933/yes-industry-50-is-already-on-the-horizon (accessed on 12 December 2022).
  26. Demir, K.; Cicibaş, H. Industry 5.0 and a Critique of Industry 4.0. In Proceedings of the 4th International Management Information Systems Conference, Istanbul, Turkey, 17 October 2017. [Google Scholar]
  27. Kumar, R.; Gupta, P.; Singh, S.; Jain, D. Human Empowerment by Industry 5.0 in Digital Era: Analysis of Enablers. In Advances in Industrial and Production Engineering. Lecture Notes in Mechanical Engineering; Phanden, R.K., Mathiyazhagan, K., Kumar, R., Paulo Davim, J., Eds.; Springer: Singapore, 2021; pp. 401–410. [Google Scholar]
  28. Rada, M. INDUSTRY 5.0 Definition’, Published Year: 2017. Available online: https://www.linkedin.com/pulse/industrial-upcycling-definition-michael-rada (accessed on 12 December 2022).
  29. Gergin, Z.; Üney-Yüksektepe, F.; Güneş Gençyılmaz, M.; Tülin Aktin, A.; Gülen, K.G.; İlhan, D.A.; Dündar, U.; Cebeci, Ö.; Çavdarlı, A.İ. Industry 4.0 Scorecard of Turkish SMEs. In Proceedings of the International Symposium for Production Research 2018; Durakbasa, N.M., Gencyilmaz, M.G., Eds.; Springer International Publishing: Cham, Switzerland, 2019; pp. 426–437, ISBN 978-3-319-92266-9. [Google Scholar]
  30. Machado, M.C.; Carvalho, T.C.M. de B. Maturity Models and Sustainable Indicators—A New Relationship. Sustainability 2021, 13, 13247. [Google Scholar] [CrossRef]
  31. Nowacki, K. Accident Risk in the Production Sector of EU Countries—Cohort Studies. Int. J. Environ. Res. Public Health 2021, 18, 3618. [Google Scholar] [CrossRef] [PubMed]
  32. Rawan, M.R.M.; Daril, M.A.M.; Wahab, M.I.A.; Subari, K.; Manan, Q.; Parveen, S. The Evolution of Ergonomics Risk Assessment Method to Prevent Work-Related Musculoskeletal Disorders (WMSDS). Int. J. Online Biomed. Eng. (Ijoe) 2022, 18, 87–97. [Google Scholar] [CrossRef]
  33. Abdul Aziz, F.; Ghazalli, Z.; Mohamed, N. A Web-Based Ergonomics Assessment System for Prioritizing Critical Work-Related Musculoskeletal Disorders Risk Factor. IOP Conf. Ser. Mater. Sci. Eng. 2020, 788, 012024. [Google Scholar] [CrossRef]
  34. Edgeman, R. Complex Management Systems and the Shingo Model: Foundations of Operational Excellence and Supporting Tools; Productivity Press: New York, NY, USA, 2019; ISBN 978-1-315-22963-8. [Google Scholar]
  35. Fonda, E.; Meneghetti, A. The Human-Centric SMED. Sustainability 2022, 14, 514. [Google Scholar] [CrossRef]
  36. Sindhwani, R.; Afridi, S.; Kumar, A.; Banaitis, A.; Luthra, S.; Singh, P.L. Can Industry 5.0 Revolutionize the Wave of Resilience and Social Value Creation? A Multi-Criteria Framework to Analyze Enablers. Technol. Soc. 2022, 68, 101887. [Google Scholar] [CrossRef]
  37. Lichtblau, K.; Stich, V.; Bertenrath, R.; Blum, M.; Bleider, M.; Millack, A.; Schmitt, K.; Schmitz, E.; Schröter, M. Industrie 4.0 Readiness; IMPULS-Stiftung: Frankfurt, Germany, 2015; pp. 1–78. Available online: https://impuls-stiftung.de/wp-content/uploads/2022/05/Industrie-4.0-Readiness-english.pdf (accessed on 16 December 2022).
  38. Industrie 4.0-Readiness-Check. Available online: https://www.industrie40-readiness.de/?lang=en (accessed on 2 June 2023).
  39. Business Type Code Search and Recommendation System—Department of Business Development. Available online: https://tsic.dbd.go.th/index (accessed on 2 June 2023).
  40. The Office of SMEs Promotion (OSMEP). Available online: https://www.sme.go.th/th/index.php (accessed on 2 February 2024).
  41. Definition of MSMEs. Available online: https://www.sme.go.th/en/page.php?modulekey=363 (accessed on 2 February 2024).
  42. National Center for Home Food Preservation|NCHFP Publications. Available online: https://nchfp.uga.edu/publications/nchfp/factsheets/food_pres_hist.html (accessed on 2 June 2023).
  43. Sharafuddin, M.A.; Madhavan, M.; Chaichana, T. The Effects of Innovation Adoption and Social Factors between Sustainable Supply Chain Management Practices and Sustainable Firm Performance: A Moderated Mediation Model. Sustainability 2022, 14, 9099. [Google Scholar] [CrossRef]
  44. Martín-Gómez, A.M.; Agote-Garrido, A.; Lama-Ruiz, J.R. A Framework for Sustainable Manufacturing: Integrating Industry 4.0 Technologies with Industry 5.0 Values. Sustainability 2024, 16, 1364. [Google Scholar] [CrossRef]
Figure 1. (a) The chilled and frozen seafood industry [11]. (b) Canned seafood, prepared and preserved seafood industry [11].
Sustainability 16 02205 g001aSustainability 16 02205 g001b
Figure 2. Industry 1.0 practice level of SMEs.
Sustainability 16 02205 g002
Figure 3. Industry 2.0 practice level of SMEs.
Sustainability 16 02205 g003
Figure 4. Industry 3.0 practice level of SMEs.
Sustainability 16 02205 g004
Figure 5. Industry 4.0 practice level of SMEs.
Sustainability 16 02205 g005
Figure 6. Industry 5.0 practice level of SMEs.
Sustainability 16 02205 g006
Table 1. Industrial Revolutions and Seafood Processing Industry (Theoretical Model (TM)).
S. NoIndustry 1.0Industry 2.0Industry 3.0Industry 4.0Industry 5.0
Production Line
1.manual/semi-mechanized productionsemi-automatic assembly lineautomated assembly linesmart connectivityhuman-centric automation
Major Energy Source
2.coalpetroleum productselectricity electricity + renewable Energyrenewable energy
Seafood processing
3.sun dryinguse chemical composition as preservatives and manual machinery for drying, freezing, and pasteurizationelectronic and semi-automated machinery for vacuum processing, drying, freezing, and pasteurizationfully automated machinery for drying, freezing, and pasteurizationfully digitalized smart machinery for drying, freezing, and pasteurization, with sustainable practices to reduce negative economic, environmental, and social impacts
Packaging
4.manual hermetic sealing processsemi-automatic machineryvacuum and modern packaging technologyautomatic canning/packaging machineryIOT-based automatic canning/packaging machinery with eco-friendly packaging materials
Labelling
5.traditional black & white handwritten labellingtraditional color printed and handwritten labellingcomputerized digital printingsmart labelling (RFID)eco-friendly smart labelling
Anti-bacterial testing methods, sensory, texture analyzing and quality control
6.human sensorymanual food laboratorycomputerized food laboratorysmart food laboratorysmart food laboratory (IoT, AI, and cloud-based solutions)
adoption of HACCP Standards
Business process, documentation, and communication
7.oral communication and day-to-day instructionswritten communication and practicing division of laboruse of computerized software (ERP) and work order systemsuse of integrated e-system, ERP, and big data analytics for internal and external communicationadopting and using human-centric approaches in automated business processes and management practices, integrated cloud-based e-systems for business openness, market orientation and traceability throughout value chain along with lean management practices and resilience plans
Table 2. Industry 1.0 Practice level of SMEs.
LabelIndustry 1.0
Level012345
11.01Production Line
Manual/semi-mechanized35.7119.0516.6714.299.524.76
11.02Major Energy Source
Coal83.337.144.762.382.380
I1.03Seafood processing
Sun drying76.199.527.142.384.760
I1.04Packaging
Manual hermetic sealing process16.6730.9514.2911.914.2911.9
I1.05Business process, documentation, and communication
Oral communication and day-to-day instructions7.1414.2930.9523.8119.054.76
Industry 1.0 Percentage Average43.8116.214.7610.9510.04.28
Table 3. Industry 2.0 Practice level of SMEs.
LabelIndustry 2.0
Level012345
Production Line
I2.01Semi-automatic assembly Line19.0514.2928.5719.0511.97.14
Major Energy Source
I2.02Fossil fuel (Diesel/Kerosene/LPG)42.869.5221.432.3816.677.14
Seafood processing
I2.03Preservatives35.7114.2916.6714.294.7614.29
I2.04Refrigerators and ovens26.197.1421.4323.817.1414.29
Packaging
I2.05Semi-automatic machineries19.0516.6723.8114.2914.2911.9
Business process, documentation, and communication
I2.06Division of labor16.6716.6719.0523.8111.911.9
I2.07Written communication19.0516.6721.4316.6711.914.29
Industry 2.0 Percentage Average25.5113.6121.7716.3311.2211.56
Table 4. Industry 3.0 Practice level of SMEs.
LabelIndustry 3.0
Level01 2 3 4 5
13.01Production Line
Automated assembly line30.9523.8116.6716.674.767.14
13.02Major Energy Source
Electricity + renewable energy45.2416.6723.819.522.382.38
I3.03Seafood processing
Computerized machineries5019.057.147.1411.94.76
I3.04Advanced dry freezers38.119.0516.6716.674.764.76
I3.05Packaging
Vacuum packaging40.4826.1921.434.764.762.38
I3.06Other modern packaging technologies33.3333.3316.677.147.142.38
I3.07Labelling
Digital printing35.7121.4314.2911.99.527.14
I3.08Anti-bacterial testing methods, sensory, texture analyzing and Quality control
Computerized modern food laboratory45.2419.0516.674.7611.92.38
I3.09Business process, documentation, and communication
New technologies and internet for communication30.9523.8126.1911.92.384.76
I3.10Computerized work order system38.114.2926.199.527.144.76
Industry 3.0 Percentage Average38.8121.6718.5710.006.664.28
Table 5. Industry 4.0 Practice level of SMEs.
LabelIndustry 4.0
Level01 2 3 4 5
Production Line
I4.01Fully automated (smart assembly line)71.437.1411.94.764.760
I4.02Fully digitalized54.7619.0514.297.144.760
I4.03Adoption of robots in production line85.717.142.382.382.380
-Major Energy Source
Electricity + renewable energy------
I4.04Seafood processing
Robotic machineries in processing78.579.527.142.382.380
I4.05Eco-friendly extraction59.5214.2914.294.767.140
I4.06High-pressure processing80.959.527.1402.380
I4.07Thermal and non-thermal processing and preservation technologies38.121.4311.914.297.147.14
Packaging
I4.08Automated canning/packaging69.0514.297.144.762.382.38
I4.09Smart vacuum processing and packaging machines66.6723.817.1402.380
Labelling
I4.10Smart labelling (RFID)80.959.527.142.3800
Anti-bacterial testing methods, sensory, texture analyzing, and quality control
I4.11Sensory and texture analyzing machineries80.957.149.5202.380
I4.12AI technologies in food sensing69.0521.437.1402.380
I4.13Business process, documentation, and communication
ERP systems76.194.767.144.767.140
I4.14Big data to analyze consumer demand and consumer behavior61.916.677.149.524.760
I4.15E-system or software for communicating with internal employees and external suppliers40.4823.8116.6711.94.762.38
Industry 4.0 Percentage Average67.6213.979.214.63.810.79
Table 6. Industry 5.0 Practice level of SMEs.
LabelIndustry 5.0
Level012345
Production Line
--------
Major Energy Source
--------
Seafood processing
--------
Packaging
--------
Labelling
--------
Anti-bacterial testing methods, sensory, texture analyzing and quality control
--------
Business process, documentation, and communication
I5.01Human-centric management practices33.3314.2926.1916.674.764.76
I5.02Fair trade practices28.5714.2933.3311.97.144.76
I5.03Lean management28.5728.5721.4314.297.140
I5.04Sustainability practices16.6719.0530.9523.817.142.38
I5.05Resilience ready21.4314.2933.3321.437.142.38
Industry 5.0 Percentage Average25.7118.1029.0517.626.662.86
Disclaimer/Publisher’s Note: The statements, opinions and data contained in all publications are solely those of the individual author(s) and contributor(s) and not of MDPI and/or the editor(s). MDPI and/or the editor(s) disclaim responsibility for any injury to people or property resulting from any ideas, methods, instructions or products referred to in the content.

