1. Introduction
Ammonia has attracted considerable attention for sustainable development of the maritime sector as a carbon-neutral energy source, particularly in light of increasing apprehensions about climate change and sustainable development [
1,
2]. Recognized as a sustainable energy source, ammonia serves as an effective carrier of hydrogen [
3]. Ammonia can be derived from various sources [
4], including fossil fuels; biomass; and renewable alternatives, like wind and solar power. Ammonia offers the advantage of being storable through chemical energy storage techniques, facilitating the conversion of excess electrical energy into a carbon-neutral fuel [
5].
Ammonia is colorless, toxic, and flammable, with a liquid atmospheric boiling point of −33.41
, a critical temperature (Tc) of 132.25
, and a critical pressure (Pc) of 11.333 MPa [
6]. The relative density of dry ammonia vapor compared with air is 0.6, and under standard conditions, its density is 0.7713 kg/m
3 at 25
[
7]. Ammonia gas, at concentrations between 150 and 200 ppm, causes general discomfort; at 400–700 ppm, it induces irritation, becoming immediately harmful at 500 ppm [
8]. Explosive potential exists within the concentration range of 15.7–27.4% (volume fraction) in the ammonia/air mixture [
8]. Ammonia, which is usually stored as a liquid under pressure, poses risks of leakage due to factors such as corrosion, lax sealing, and operational errors [
4]. With strong effects on the eyes and respiratory system, leaked ammonia may poison the surrounding population, causing significant environmental pollution. Numerous serious leakage accidents have occurred globally, resulting in casualties and environmental impacts. From 1985 to 2019, around 71 incidents related to anhydrous ammonia were recorded according to statistical data. The main factors that led to fatalities and injuries were determined to be either inhaling the gas or being exposed to fires. By analyzing typical occurrences in ammonia plants and their operations, it was determined that the release of ammonia can happen due to various factors. These include human errors and operational mishaps, as well as deficiencies in maintenance and inspection procedures during activities such as storage tank operations, pipeline operations, and bunkering processes. An ammonia leak poses a potential hazard to surrounding areas, and the extent of its toxicity is contingent upon the extent of its dispersion. This can be approximated by assessing the severity of the release.
Numerous investigations have been conducted on ammonia gas leakage and dispersion accidents, primarily concentrating on models for the dispersion of toxic gas. Tan et al. [
7] conducted experiments in a food factory to establish the pattern of ammonia dispersion. The findings revealed a direct proportionality between the concentration at each measuring point and the flow rate. As the wind speed increased, the ammonia concentration initially rose and then declined at various points. The results reveal that the dispersion of ammonia was more evident when a wind field was present. The highest concentration was observed within the wind speed range of 0.8–1.2 m/s. Bouet et al. [
9] conducted experiments on the atmospheric dispersion of ammonia to measure concentrations of anhydrous ammonia within a range from a few meters to 2 km from the point of release. The objective was to gather data to enhance two-phase discharge and dispersion modeling. The releases emanated from a 6-tonne storage tank containing pressurized liquid ammonia and a discharge device with a 2-inch outlet diameter. Fifteen trials were conducted with diverse release configurations mimicking industrial scenarios, including impinging jets on the ground and a wall at varying distances, as well as release through a flange without a seal. The amount of ammonia released from the liquid phase exhibited variability in the tests, ranging from 1.4 to 3.5 tons, with durations spanning 7 to 14 min. These variations corresponded to flow rates ranging from 2 to 4.5 kg/s. These experiments demonstrated that for discharges with the same flow rates, the distances associated with identical concentrations varied significantly depending on the configurations. The existence of obstacles or containment barriers that gathered liquid ammonia tended to decrease these distances. Concurrently, numerous numerical simulation studies were conducted for comparison with field experiments, validating their findings against experimental data [
10]. Although large-scale experiments offer a close approximation to real accidents, the inability to control weather conditions introduces challenges in examining meteorological factors, such as wind and ambient conditions. Furthermore, conducting extensive field experiments is expensive, replication poses challenges, and observing changes in variables becomes difficult. Several investigations have delved into the movement of ammonia utilizing diverse approaches, with dynamic flux chambers, wind tunnels, and micrometeorological techniques playing pivotal roles. However, the inherent dangers associated with the high toxicity of ammonia in laboratory experiments have steered most studies toward a focus on numerical simulations.
Numerical simulation research is widely adopted due to its broad applicability, cost-effectiveness, and high precision. Several mathematical models and simulation tools have been created to evaluate the release source strength, encompassing both the rate of chemical release from containment and the degree of vaporization at the release point [
11,
12]. Subsequently, the source strength model is connected to a dispersion model to calculate the spatial reach of the resulting toxic cloud. The modeling, simulation, and validation of ammonia dispersion have been extensively conducted using commercial software, like FLACS-CFD, PHAST [
13], ALOHA [
14], and FLUENT [
15], in studies focused on ammonia safety. Labovsky et al. [
16] modeled the flash and dispersion of ammonia by Fluent 6.3 and compared the results with those from the FLADIS experiment of the Riso National Laboratory. The results advised incorporating realistic experimental data for both wind velocity and wind direction by introducing them through inlet boundary conditions. To create a genuine environment for studying ammonia dispersion, it is recommended to implement transitional periodic boundary conditions on the lateral boundaries. Clara et al. [
17] simulated ammonia leakage during the bunkering process and examined influence of key parameters, such as environmental conditions, wind speed, release rate, and release duration, on the dispersion of ammonia. The findings indicate that the safest method for bunkering ammonia involves storing it in fully refrigerated tanks at atmospheric pressure, where it exists as a saturated liquid. The severity of consequences escalates notably when the release height exceeds 5 m. It is crucial to avoid vertical releases of ammonia, as they result in the most severe outcomes. A reduction in the release duration and transfer flow rate was found to be effective at mitigating the severity. In the context of this study’s scenario, the dispersion of an ammonia cloud over water was prolonged due to the substantial vaporization resulting from the significant heat generated during ammonia dissolution in seawater. Additionally, the spread of ammonia over the sea encompasses a greater expanse during daytime compared with nighttime.
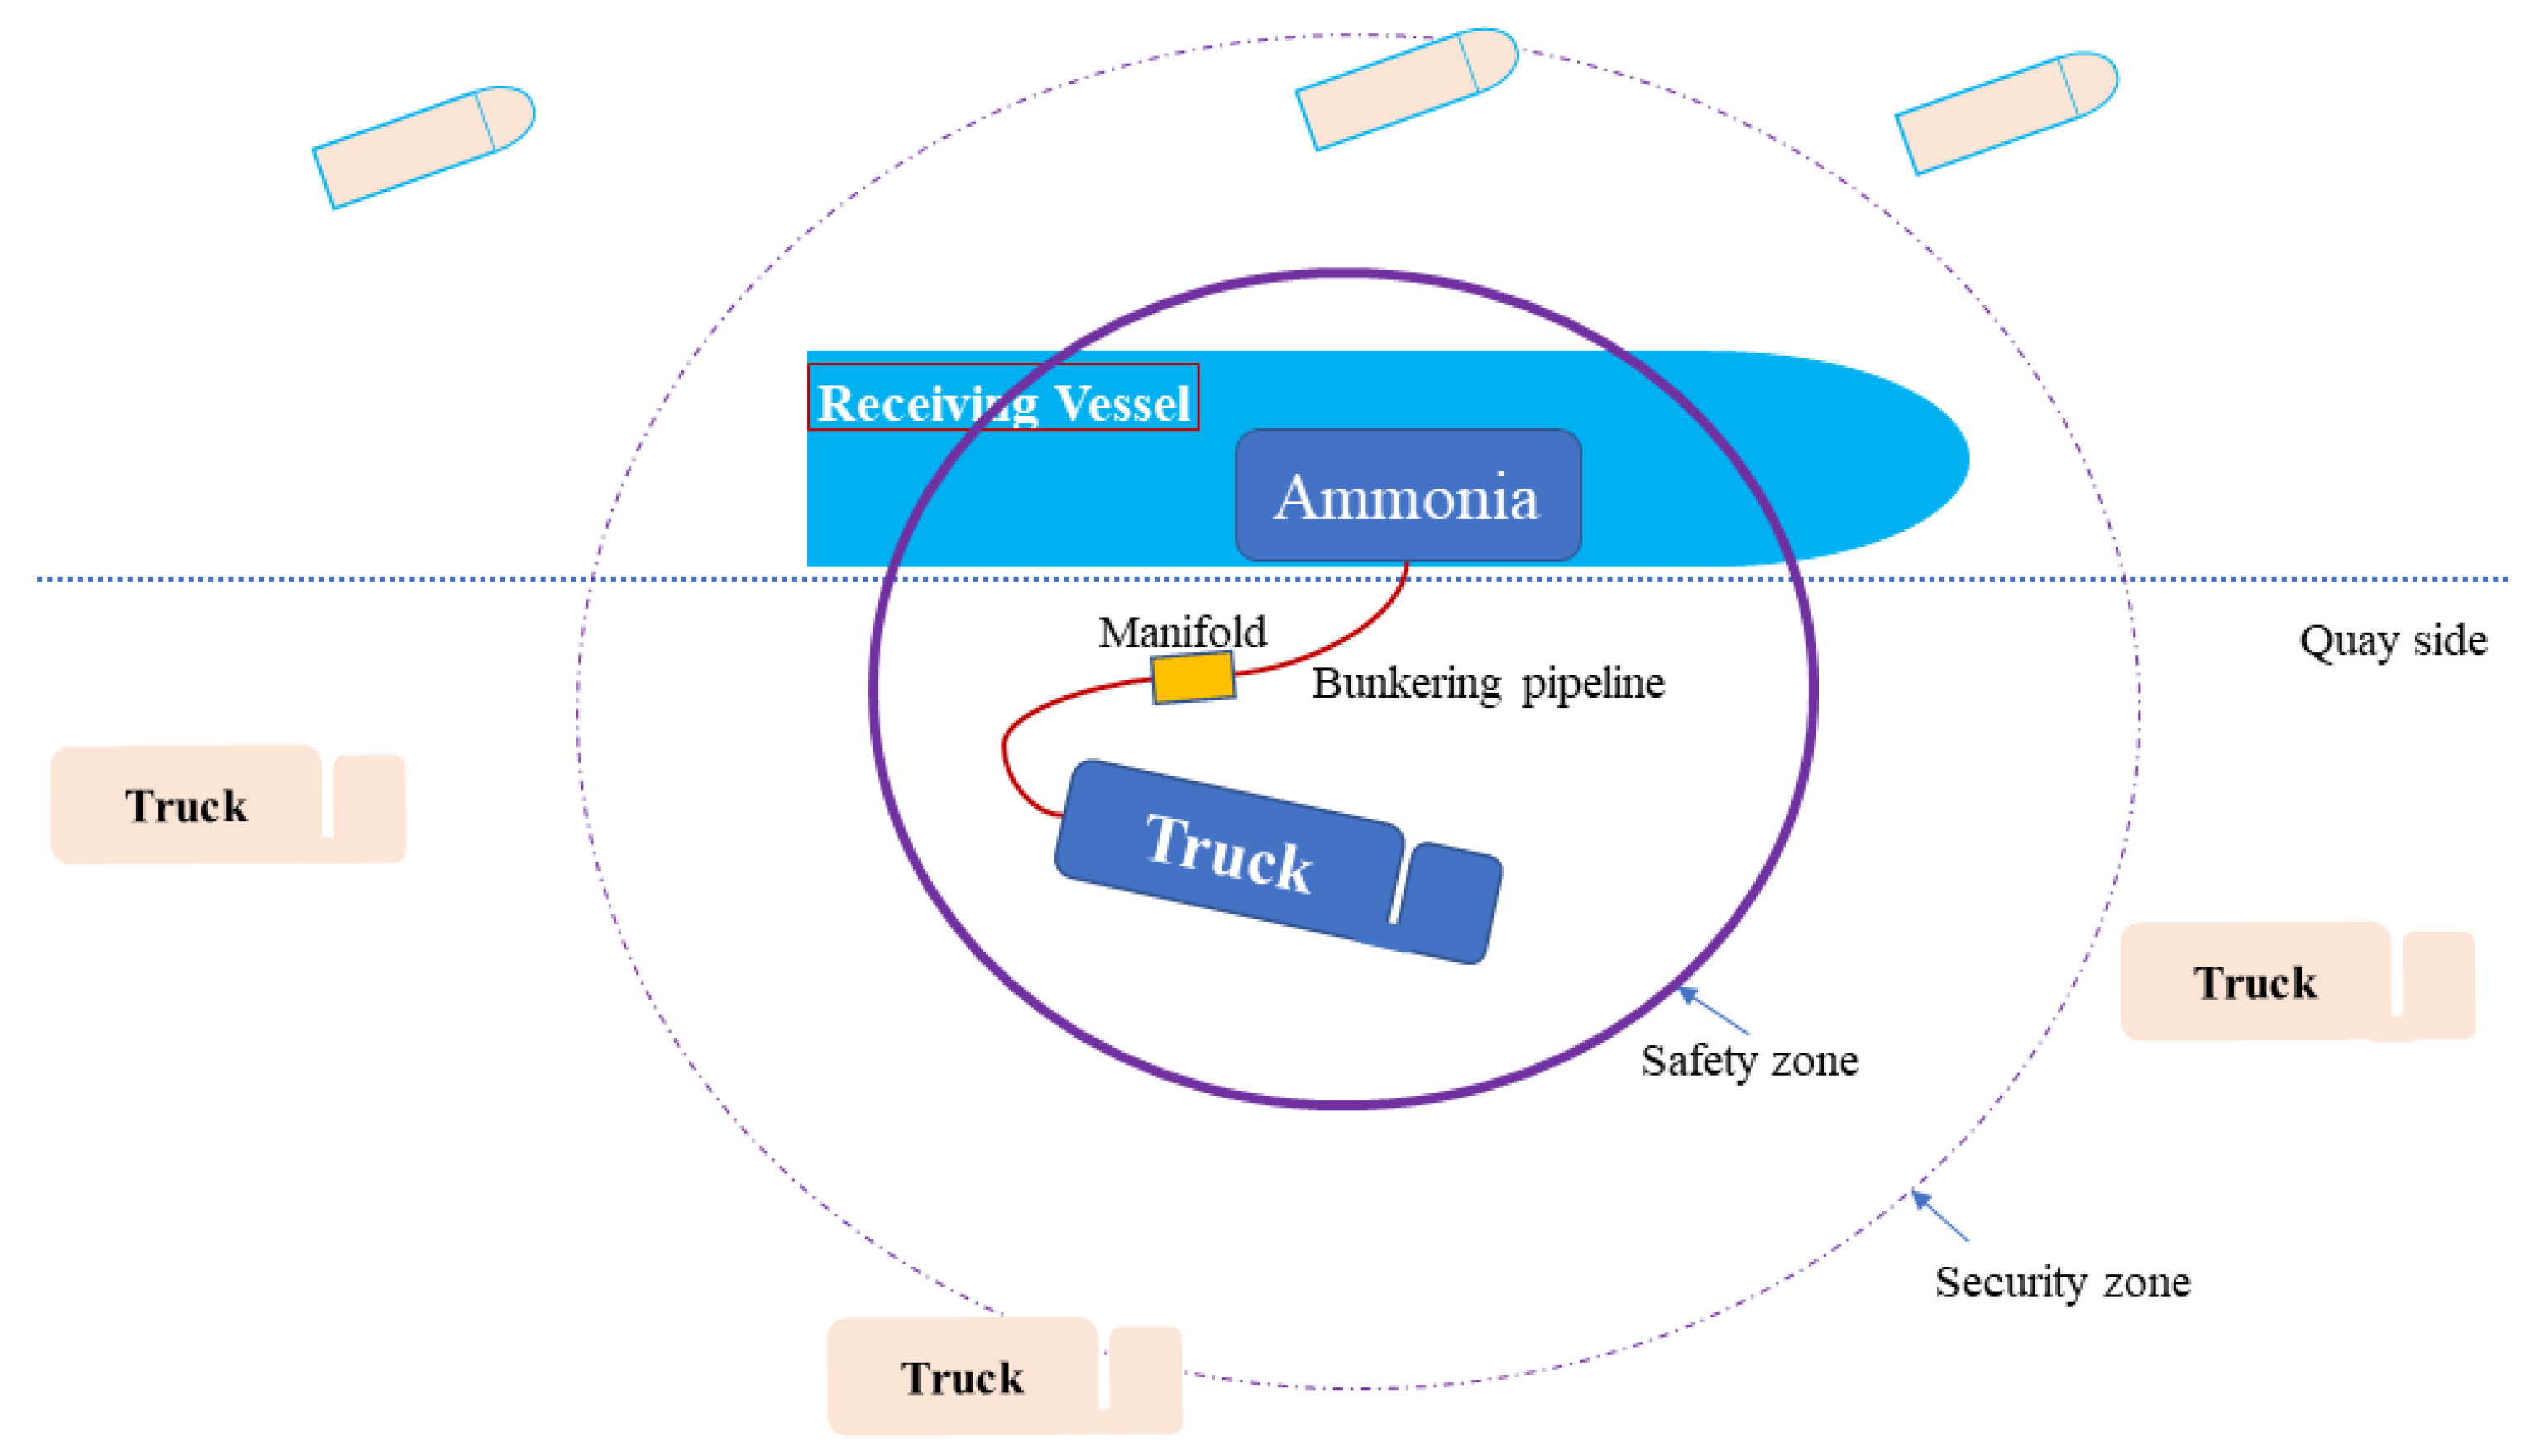
As for ammonia as a marine fuel, the bunkering process is necessary and unavoidable. There are three main methods for bunkering, namely, ship to ship, truck to ship, and terminal to ship. Despite extensive research efforts, previous studies tended to be too specific to draw overarching insights into the key factors that impact the safety of ammonia bunkering and determining the extents of safety zones. Consequently, the findings from these studies are more applicable to individual scenarios rather than offering generalizable conclusions. Consequently, there is a notable absence of detailed regulations by IMO member states addressing all ammonia-fueled ships while assessing the risks associated with truck-to-ship (TTS) ammonia bunkering and defining safety zones. Guidelines pertaining to ammonia bunkering typically mandate the establishment of a safety zone as a fundamental safety measure. The purpose of this safety zone is to ensure safety, both within and outside its boundaries, by regulating personnel access and work activities (as in
Figure 1). An industry standard outlined in the International Standardization Organization (ISO) [
18] exists for designing the safety zone. It introduces two approaches, namely, the deterministic and risk-based methods, each of which is applicable to specific bunkering conditions. The deterministic approach is generally suitable for routine bunkering, while the risk-based approach is strongly recommended for exceptional situations, like simultaneous operations (SIMOPs). Both approaches have their advantages and disadvantages. The deterministic approach offers a concise procedure but may result in an imprecise safety zone layout due to its reliance on deterministically defined LNG leak scenarios and simulations. On the other hand, the risk-based approach, which utilizes the qualitative risk assessment (QRA) established in the industry, can produce a high-quality layout. However, it is resource-intensive in terms of cost and time, making it potentially unsuitable for practical engineering purposes.
Motivated by the limitations of previous research and existing regulations, this study addressed these gaps. This present study centered on investigating the dispersion traits of leaked gas in TTS ammonia bunkering. The objective was to pinpoint the crucial factors that influence the size of the safety zone in situations involving ammonia bunkering. Case studies involve representative service vessels with 7500 m3. The truck and ship were assumed to undergo TTS bunkering with an ammonia bunkering vessel having a storage capacity of 37,000 L. The risk assessment adopted a generic and deterministic approach to estimate safety zone levels for the specified ships. By pinpointing critical parameters that influence safety zone expansion, this research aimed to provide ship owners and flag authorities with insights into estimating appropriate safety zones during ammonia bunkering. This investigation serves as a preliminary study with the intention of contributing to the enhancement of current international regulations.
This study sought to enhance our understanding of ammonia truck-to-ship bunkering safety procedures, focusing on evaluating the impact of operational variables on ammonia cloud dispersion over a port area during accidental releases in bunkering operations. This study aimed to offer guidelines for the procedure of estimating safety and establishing safety zones during the truck-to-ship LNG bunkering process. The objective was to provide comprehensive insights into ensuring safety measures and defining secure areas in this specific bunkering operation. Simulation variations included input parameters such as storage conditions, release height, release direction, release duration, and transfer flow rate. The effects of the toxicity of ammonia and material surface for release were incorporated.
2. Research Methodology
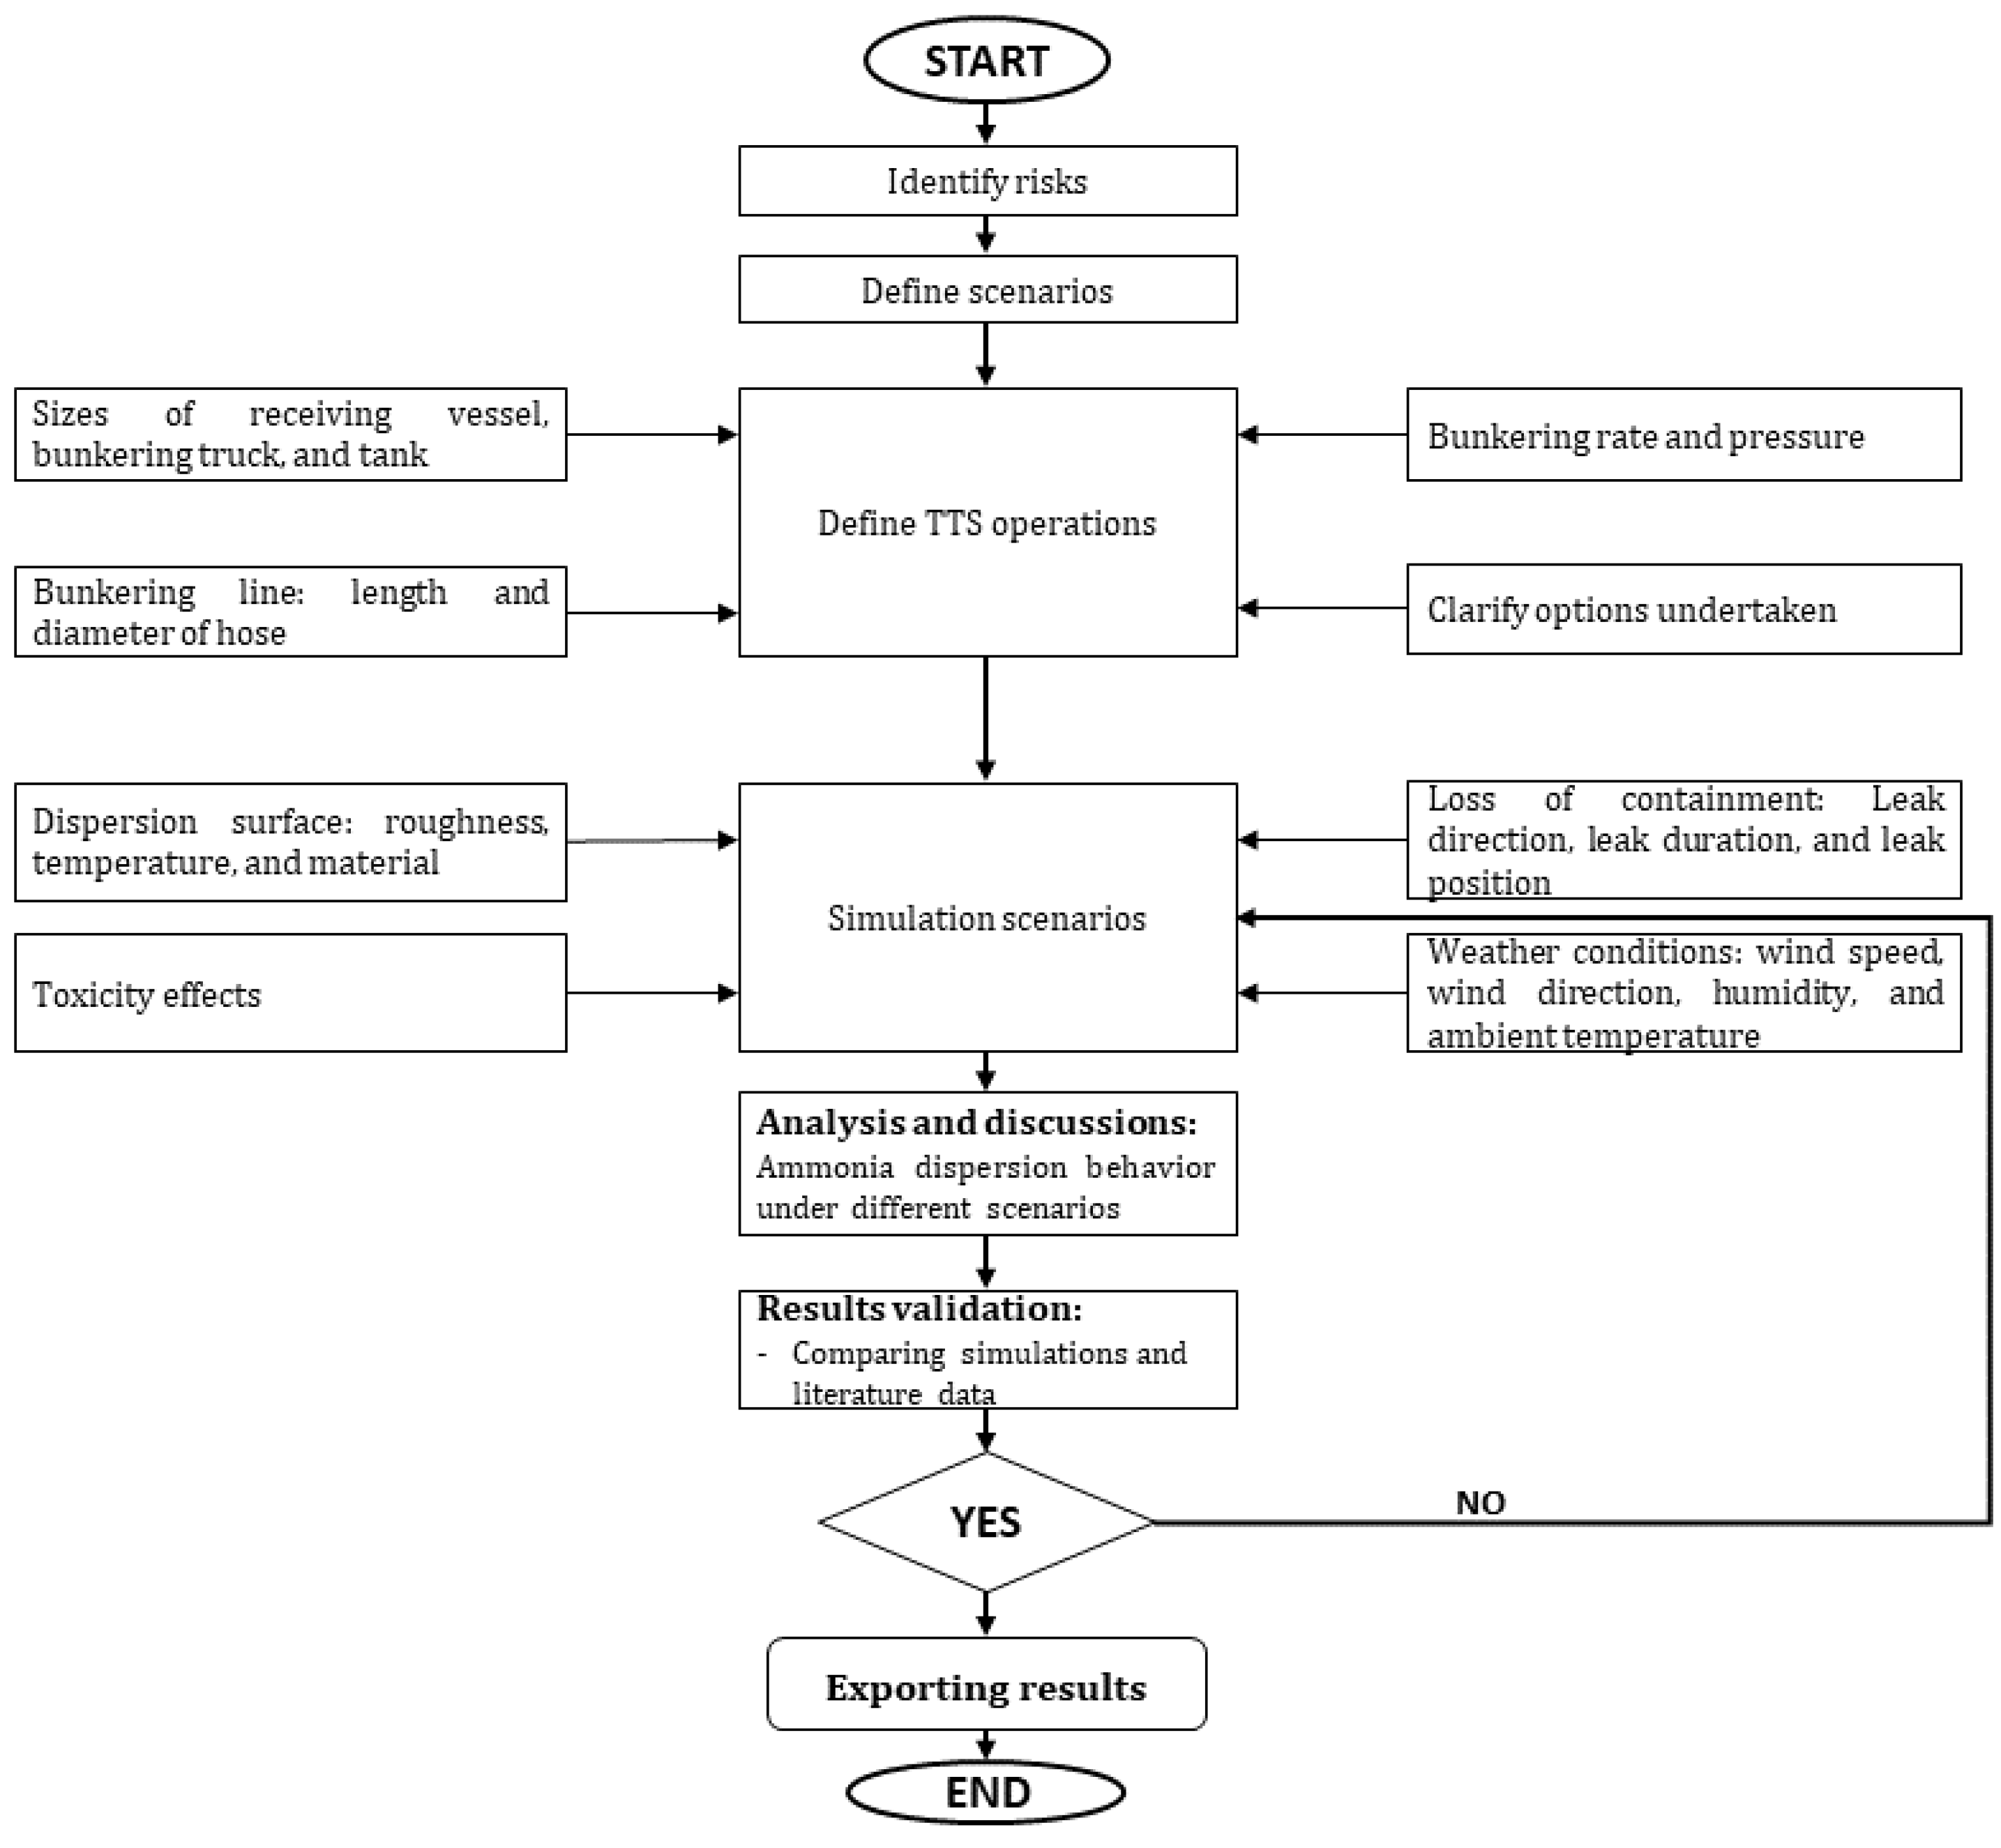
The research procedure is illustrated in
Figure 2. Initially, a theoretical ammonia bunkering mode and vessel setup were defined, followed by the identification of potential containment loss scenarios during ammonia bunkering through a literature review. Subsequently, release scenarios were formulated, and parameters were chosen to simulate the spatial dispersion of ammonia in the atmosphere—from the release point to downwind distances. It is essential to highlight that the ammonia bunkering industry and the implementation of safety zones are currently in the early phases of development. Given the impracticality and high costs associated with conducting experiments for every conceivable scenario, there is a pressing need to introduce methodologies and practical solutions. These solutions aim to minimize expenses, streamline processes, and ensure user-friendly operations within the industry. This underscores the importance of employing simulation methods. EFFECTS software V.12 was employed to evaluate the dispersion characteristics, effects of surrounding factors, toxic impacts, and consequences of exposure. The following explanations, in conjunction with
Figure 2, present a comprehensive step-by-step guide for implementing the quantitative risk assessment of ammonia truck-to-ship bunkering:
When discussing the inadvertent release of NH3 during bunkering, the ISO guidelines (ISO identify a potential ammonia transfer line failure as a plausible scenario. Considering the diameter of the ammonia transfer line, possible leak sizes and the pressure and temperature of ammonia inside pipelines were established. These statistics present various leak sizes categorized into ranges. For subsequent consequence analysis, a representative value for each category was designated.
Second, multiple simulation scenarios were defined for each leak category in a specific direction. This method incorporated this concept to depict the impact of each scenario on the layout of the safety zone.
After that, a consequence analysis was executed for each scenario, characterizing the propagation of flammable gas in the leak direction as the maximum footprint. This footprint signified the farthest distance of LFL concentration from the leak point. Through this process, the method gauged the influence of each scenario on the overall risk, with the substituted value representing a combined risk value incorporating both the frequency and consequence of each scenario.
Lastly, all substituted values were consolidated into a singular value, which was denoted as the design radius of the circular safety zone. This value served as the ultimate input for designing the safety zone in the deterministic approach. While both methods relied on a flammable boundary at the ammonia leakage for their layout design, the effective boundary could vary based on the leak direction, which was considered a random variable. Consequently, deriving a circular safety zone with the maximum flammable distance of the leak as its radius was deemed a more logical approach.
2.1. Computational Zone
The simulations were conducted within a 2D computational domain that spanned dimensions of 1000 m × 1000 m in the X- and Y-directions (as in
Figure 3). The release scenario involved the assumption that NH
3 (ammonia) was discharged at a rate of 24.06 kg/s through a 0.05 m leak hole area.
In the area of the leakage, the simulations incorporated a specific stability class (Pasquill D class) characterized by neutral stability. The anticipated average wind speed at a height of 4.6 m was 3.6 m/s, with the wind directed toward the north (considered as the x-direction in this simulation). The wind profile was established at the inlet boundaries, and the stability class played a crucial role in molding the patterns of turbulent kinetic energy and turbulent dissipation rate. The ground was subject to a no-slip condition, while passive outflow conditions were applied at the exits.
Table 1,
Table 2 and
Table 3 present the specifications for the truck, the receiving vessel, and the bunkering pipeline.
2.2. Ammonia Release Procedure
The ammonia-bunkering procedure can raise significant societal concerns, as exposure to deadly ammonia gas poses severe risks to human health, potentially causing outcomes such as blindness; lung injuries; and, in extreme cases, fatalities. Exposure to ammonia can also cause discomfort and adverse effects on the eyes, nose, throat, and respiratory system. Furthermore, it is essential to recognize the inherent flammability hazards linked to ammonia. Although ammonia is being investigated as a possible maritime fuel, there is a scarcity of comprehensive information available on the subject. There has been insufficient research to thoroughly examine the risks and safety implications associated with using ammonia as a transportation fuel. In order to avoid unexpected damage arising from ammonia leakage during the bunkering process, it is crucial to establish a safety zone. The designated safety zone must strictly forbid ignition sources and restrict access solely to authorized individuals involved in approved activities.
The characteristics of heavy gas dispersion are evident in the release and spread of ammonia. The process of ammonia leakage can be categorized into five primary stages. In the initial phase, ammonia is released from storage tanks, pipes, hoses, or similar equipment and contacts the surrounding air. Due to its low temperature and greater density in comparison to air, ammonia accumulates as a chilled reservoir on the ground or water surface. In this stage, the most influential factors include the leak characteristics (rate, size, and direction), ammonia storage and transfer conditions (temperature, pressure), and phase of the ammonia leak (liquid, gas). In the second stage, the ammonia gathered in the low-temperature pool initiates dispersion over a wider area [
19,
20]. Thus, the influential factors may include fuel characteristics and vaporization impacts (heat flux, toxicity, ship structure and cargo state, etc.). Subsequently, in the third phase, as the ambient temperature typically exceeds the boiling point of ammonia, it begins evaporating due to the surrounding heat, resulting in the formation of a broad vapor cloud with lower temperatures. Finally, this vapor cloud undergoes a diffusion process propelled by the wind.
Figure 4 depicts the evolution of ammonia leakage and its diffusion. It is essential to acknowledge that the state of the leaked ammonia, the quantity of the leakage, and the extent of diffusion differ at each phase of the procedure. Moreover, it is necessity to consider time in ammonia release, heat absorption, evaporation, and dispersion, the length of the leakage period, and thus, the timeframe allocated for computational fluid dynamics (CFD) analysis is a pivotal element in defining the safety management zone for ammonia leaks.
2.3. Leakage Model Development
Due to the elevated operational pressure, the release of ammonia is likely to take the form of a jet. Furthermore, upon exposure to ambient conditions, a portion of the spilled liquid promptly undergoes evaporation.
The swift transition of phases, termed the “flashing effect”, is predominantly influenced by the operational conditions. To incorporate this phenomenon into the simulation, the concept of the flash utility is employed in conjunction with EFFECTS to address the limitations inherent in a conventional simulation.
The equations governing the continuous release of substances are the conservation equations [
21,
22]:
- -
Conversion of energy:
- -
Conversion of species:
- -
Height parameter equation:
- -
The vertical entrainment rate:
where
,
denotes the combined layer height Hm, and
Ue denotes the effective friction velocity. The velocity of the cloud is denoted as
U, while B and h represent the cloud’s half-width and height, respectively.
ρ signifies the density, m denotes the mass fraction,
Cp represents the specific heat, and T stands for the temperature.
fpc represents the phase energy change, and
ft represents the ground heat flux.
Vg denotes the horizontal crosswind gravity flow, and
fu and
fvg are the terms for downwind and crosswind friction. The rates of horizontal and vertical entrainment are given by
Ve and
We. The parameter
Zc represents the cloud height parameter. Subscript “a” indicate the ambient conditions, while “
s” refers to the source conditions. These equations are amenable to numerical solutions using a Runge–Kutta time integration scheme, enabling the determination of averaged cloud properties (
ρ,
U,
T,
m) and cloud shape properties (
B,
b,
h,
Zc).
2.4. Leakage Scenarios
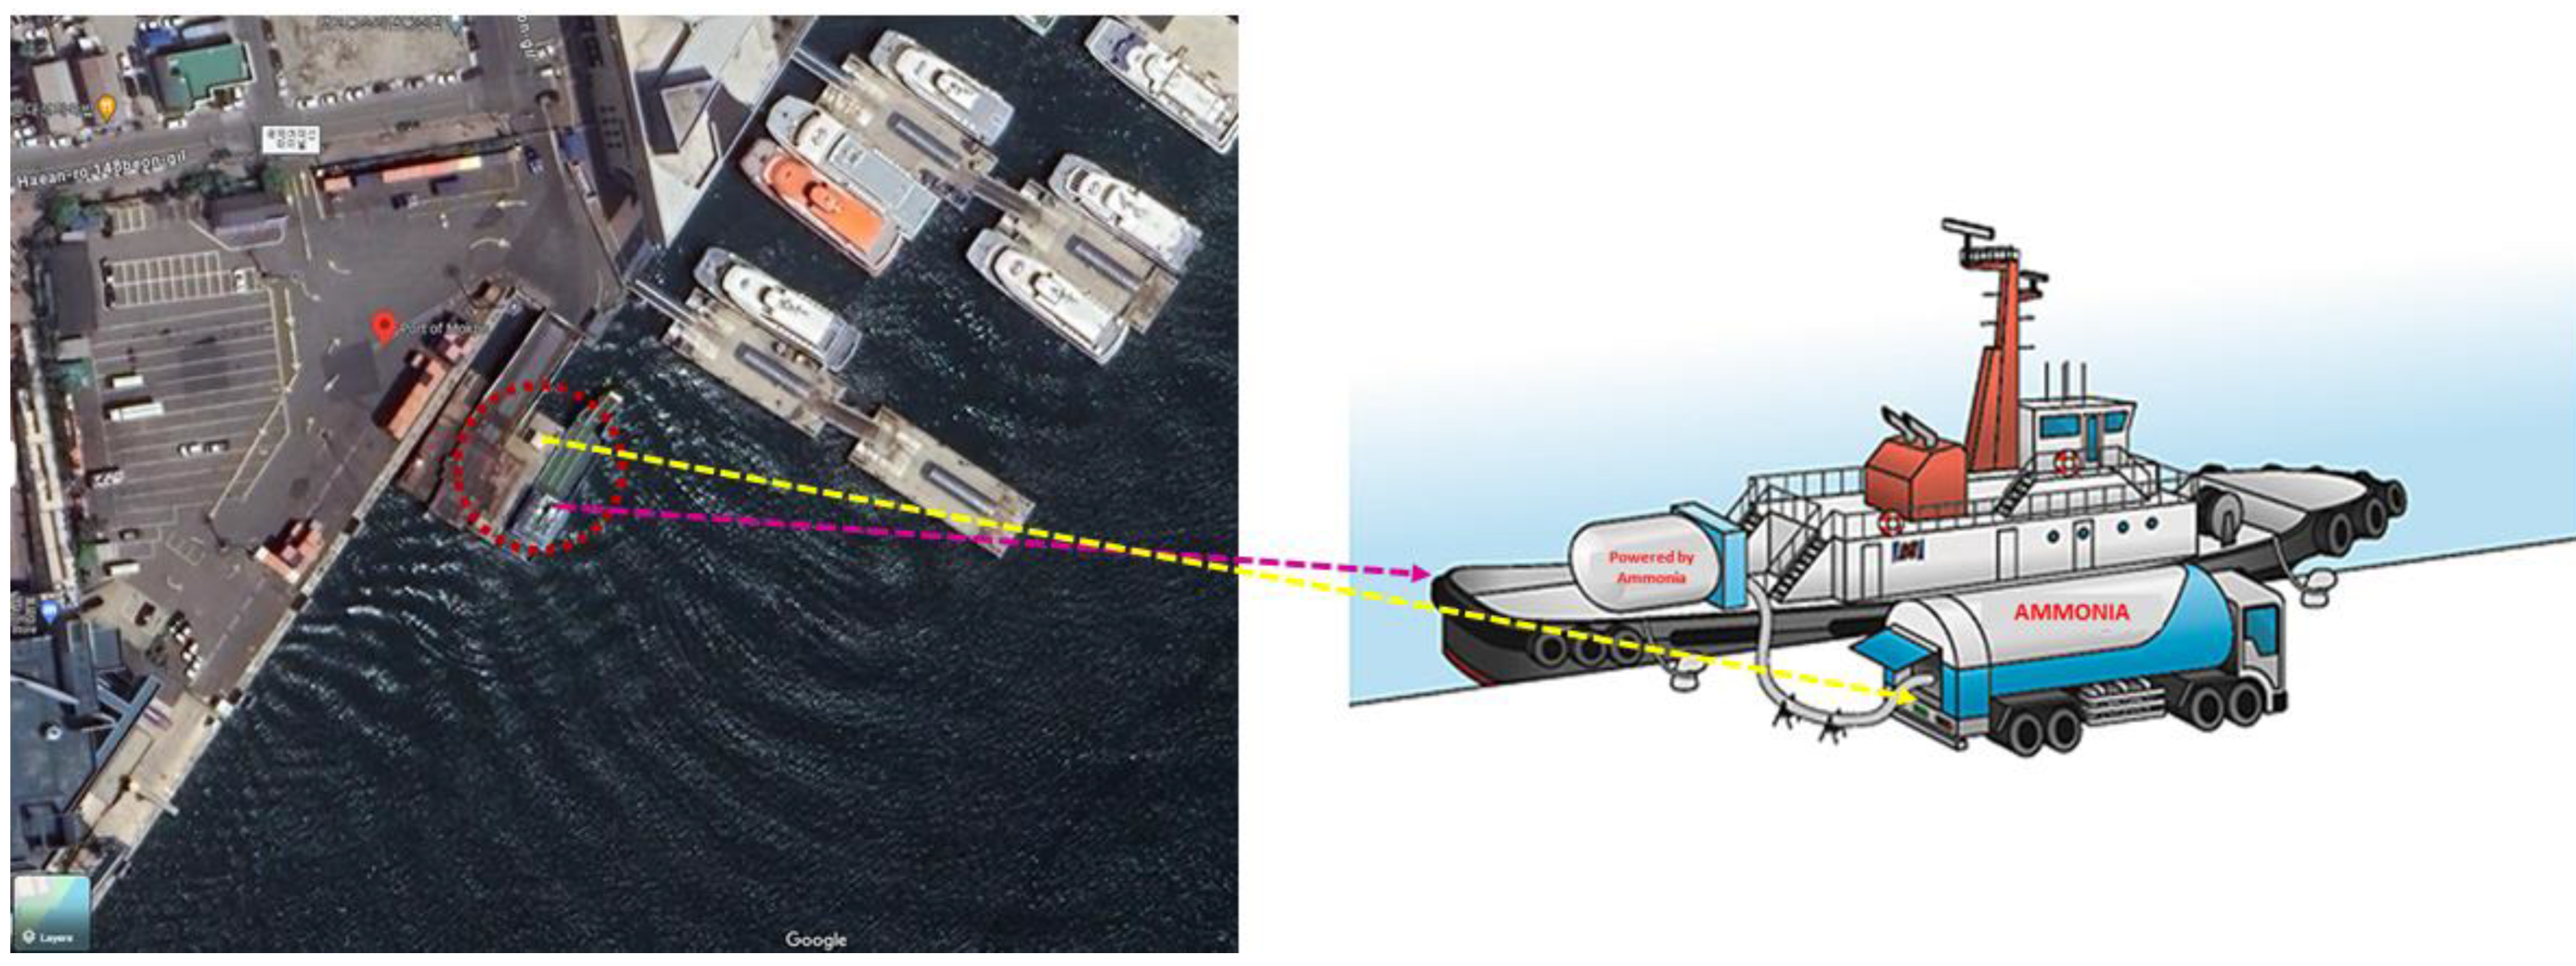
During the truck-to-ship bunkering process, ammonia (NH3) may be discharged for several reasons, including unexpected attacks leading to damage to the vessel’s structure, punctures in the NH3 tank, accidental collisions, allisions, or groundings. This study focused on NH3 bunkering taking place in the bunkering area of Mokpo Port, South Korea, involving an NH3 receiving vessel and an NH3 bunkering truck.
Assuming a scenario in the NH
3 bunkering process where the NH
3 bunkering hose is broken and leaks due to significant waves and unintentional vessel movements, there could be a release of NH
3 in the bunkering area. The assumed duration of the leakage was approximately 90 s at the full pumping rate before the emergency shutdown system (ESD) activates after 30 s, automatically terminating the bunkering process, and another 60 s for all remaining ammonia in the pipelines to be discharged. This study considered the leakage conditions and ambient parameters detailed in
Table 4, with the pipeline pressure assumed to be 7.35 bar.
Considering the increased pressure within the pipelines and the relatively diminutive size of the leak aperture, it was assumed that the leakage took the form of a jet. The leak rates were computed using Equation (6) and are presented in
Table 4, showcasing the results of the leak rate calculation at the leak point corresponding to the hole size.
The release from small orifices in high-pressure pipelines can be characterized as a jet-type leakage [
23]. The construction and validation of models depicting LNG leakage in the truck-to-ship bunkering process were executed using the computational software EFFECTS V12.2. In general, the outcomes outlined by EFFECTS primarily depict the repercussions that arise from situations where containment is lost. These consequences are typically articulated in terms of the rates and duration of flow, dimensions of flames, levels of radiation, overpressure magnitudes, and results pertaining to gas concentrations. Such outcomes often depend on the distance or the X and Y locations relative to the coordinates of the release. Upon release into the atmosphere, the speed of the gas cloud dilution and the distance at which specific threshold concentrations are detectable are contingent on wind patterns and meteorological conditions. The dispersion model has the capability to forecast concentrations relative to distance and time; anticipate the size, location, and flammable mass of a combustible cloud; or calculate toxic dosages. These dosages can then be translated into lethality levels using Probit functions that are currently accessible.
The calculation of the leakage rate at the specified point of release was undertaken [
24,
25,
26]:
In this context, signifies the initial rate of leakage in kilograms per second (kg/s); represents the orifice’s cross-sectional area (m2); stands for the density of ammonia; represents the discharge coefficient set at 0.62 for a sharp-edged leakage hole; and and denote the pressure of the working fluid inside the pipeline and atmospheric pressure, respectively, measured in pascals (Pa). Additionally, represents gravity (9.81 m/s2), and is the vertical distance between the surface of the ammonia pool and the center of the leakage hole, representing the height of the liquid surface hole.
Table 4.
Leak rates of ammonia according to the hole diameter.
Table 4.
Leak rates of ammonia according to the hole diameter.
Density
[—kg/m3] [27,28] | Liquid Storage Temp.
() | Leak Hole Size
[mm] [29] | Discharge Area
[m2] | Ambient Temperature
[] | Leak Rate
(kg/s) |
|---|
| 653.1 | −34 | 150 | 0.0176 | 26 | 216.01 |
| 100 | 7.85 × 10⁻³ | 96.34 |
| 50 | 1.96 × 10⁻³ | 24.06 |
2.5. Boundary Conditions and Initial Conditions
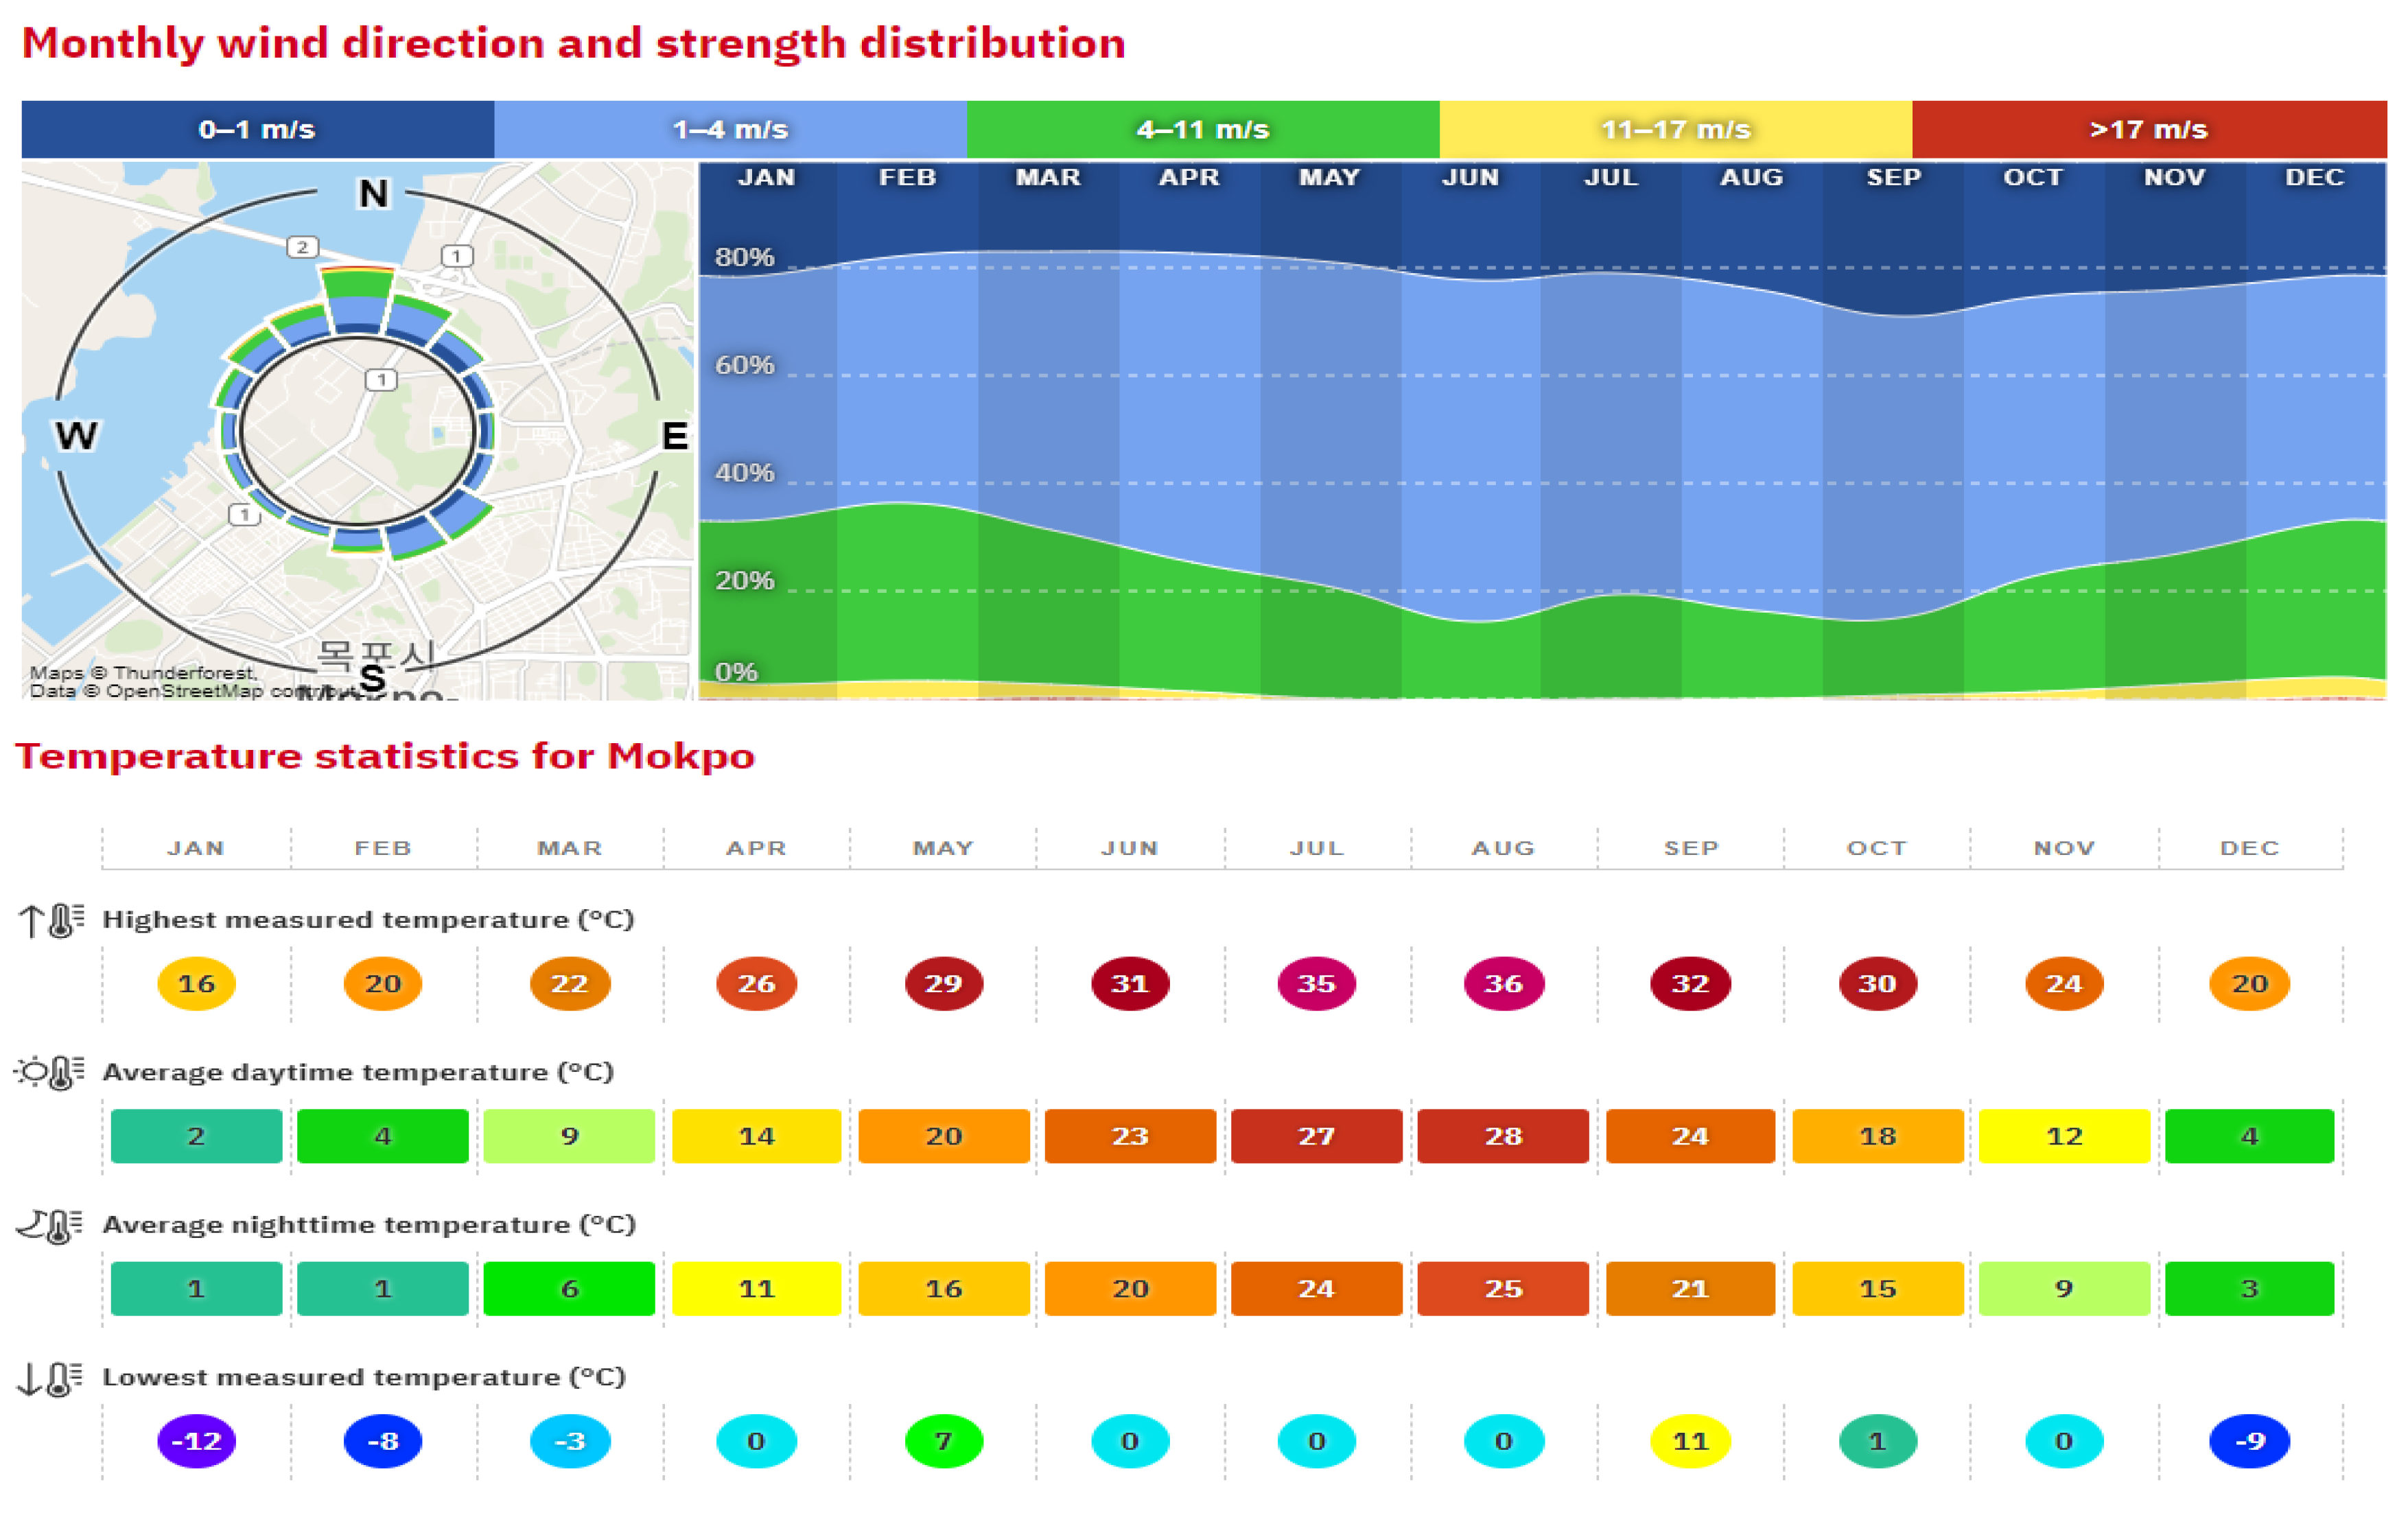
In this investigation, ammonia was examined in its liquid state within a bunkering system. The bunkering operation involved truck-to-ship transfer at Mokpo port, South Korea. As per average statistics obtained from
www.windfinder.com, at Mokpo port, the wind speed typically ranges from 1 m/s to 17 m/s (as in
Figure 5). The simulation incorporated three different wind speeds of 2, 5, and 10 m/s, representing typical wind speeds for different periods of the year. The temperature ranged from −12
to 36
(as in
Figure 6). The average yearly humidity of Mokpo port is around 60%. Therefore, the simulation scenarios were made with typical data that were representative for each season of the year. The details on the weather conditions at Mokpo port that were used in the simulation scenarios are presented in
Table 5.
The chosen input parameter for simulation was determined based on the consideration of factors that occur most frequently in a given year.
2.6. Simulation Tool
This research utilized EFFECTS version 12.2 (Gexcon AS, Norway) to simulate and compare dispersion models of ammonia release. EFFECTS is globally adopted software, particularly for modeling dense gas dispersion [
30]. It has received extensive validation from industry experts [
22,
31]. Functioning as a unified dispersion model, EFFECTS seamlessly integrates the source strength model with the dispersion model. This integration facilitates the simulation of two-phase ammonia releases, tracing their progression from the initial release point to the heavy gas slumping phase, and ultimately, to the buoyant and passive diffusion phase in the atmosphere over both land and water surfaces. The model takes into consideration the toxic effects of the release.
The unified dispersion model (UDM) accounts for release conditions, such as pressurized or unpressurized, and release duration, whether instantaneous or steady state. It also considers the interaction of the release with its surroundings to determine the internal buoyancy of the ammonia cloud and its downstream dispersion. Additionally, the UDM incorporates the formation, spreading, dissolution, and vaporization (boiling and evaporation) of the rainout pool on both land and water surfaces. In cases of large-scale cryogenic liquid spills, an ice layer may form on the sea surface, which influences the spreading of the rainout pool and affects the dissolution and vaporization of ammonia. However, in this study, where ammonia was spilled from the unintentional breaking of a bunkering hose in the pipeline, EFFECTS omitted the simulation of vapor cloud formation due to a steady convection of heat from the ambient and concrete surface to the rainout pool (as in
Figure 7).
Furthermore, EFFECTS exclusively considered the thermodynamic interactions of ammonia with moist air, accounting for latent heat and sensible heat exchanges, leading to the condensation and vaporization of atmospheric components. However, EFFECTS did not address the chemical reaction of ammonia with any chemical species in the atmosphere.
3. Results
Ammonia, with a boiling temperature of −33 , exhibits rapid evaporation (flash) upon release into the atmosphere. The extent of this evaporation, forming a vapor cloud, is influenced by factors such as the storage temperature, pressure, and leakage characteristics. Simultaneously, another segment of the discharged flow remains suspended in the form of a cloud, manifesting as entrained liquid droplets (aerosol), which arise from both mechanical and thermal influences. The quantity of aerosol depends on the initial thermodynamic conditions, including storage temperature, and mechanical parameters like the discharge velocity through the release orifice. Various models, rather than a universally accepted equation, are available in the literature for this calculation.
In the simulation code utilized, the aerosol fraction can be designated as a constant value (varying from 0 to 100%, as determined by the user input) or permitted to fluctuate in accordance with the flash fraction (F). The latter approach was employed in the calculations, assuming that for flash fractions below 5%, no aerosol is formed (indicating a low flashing release with a pool fraction of 1 − F). In contrast, in cases where F exceeds 25% (indicating a substantial flashing release), no pool is generated, and the aerosol fraction is established as 1 − F. This aligns with experimental findings in the literature [
32]. Between these extremes, both a pool and aerosol are present, and the aerosol fraction becomes an increasing linear function of F.
The remaining portion of the discharged flow descends to the ground, creating a liquid pool from which vapor is produced gradually through the process of evaporation. The rate of evaporation depends on several factors such as the liquid’s boiling temperature, equilibrium vapor pressure, and wind velocity. The vapor produced adds to the mass of the harmful substance within the spreading cloud, impacting the distances of dispersion.
3.1. Effect of Leak Rate
To assess the impact of the leak rate on the vapor cloud dispersion distance, the parameters—specifically, fixed weather conditions (wind speed and direction at 5 m/s and north direction, respectively), the leak direction set in the horizontal direction, and a leak duration of 90 s, were employed. The simulation was conducted with NH3 release from the unintentional breaking of a bunkering hose during truck-to-ship bunkering at the area of Mokpo Port, South Korea.
As in Equation (6) and
Table 4, the leak rate of ammonia was calculated to be 24.06 kg/s, 96.34 kg/s, and 216.01 kg/s for leak hole sizes of 50 mm, 100 mm, and 150 mm, respectively. The ambient temperature, pressure, and humidity of the area at Mokpo Port were selected to be 26
, 1 bar, and 60%, respectively (as in
Table 5).
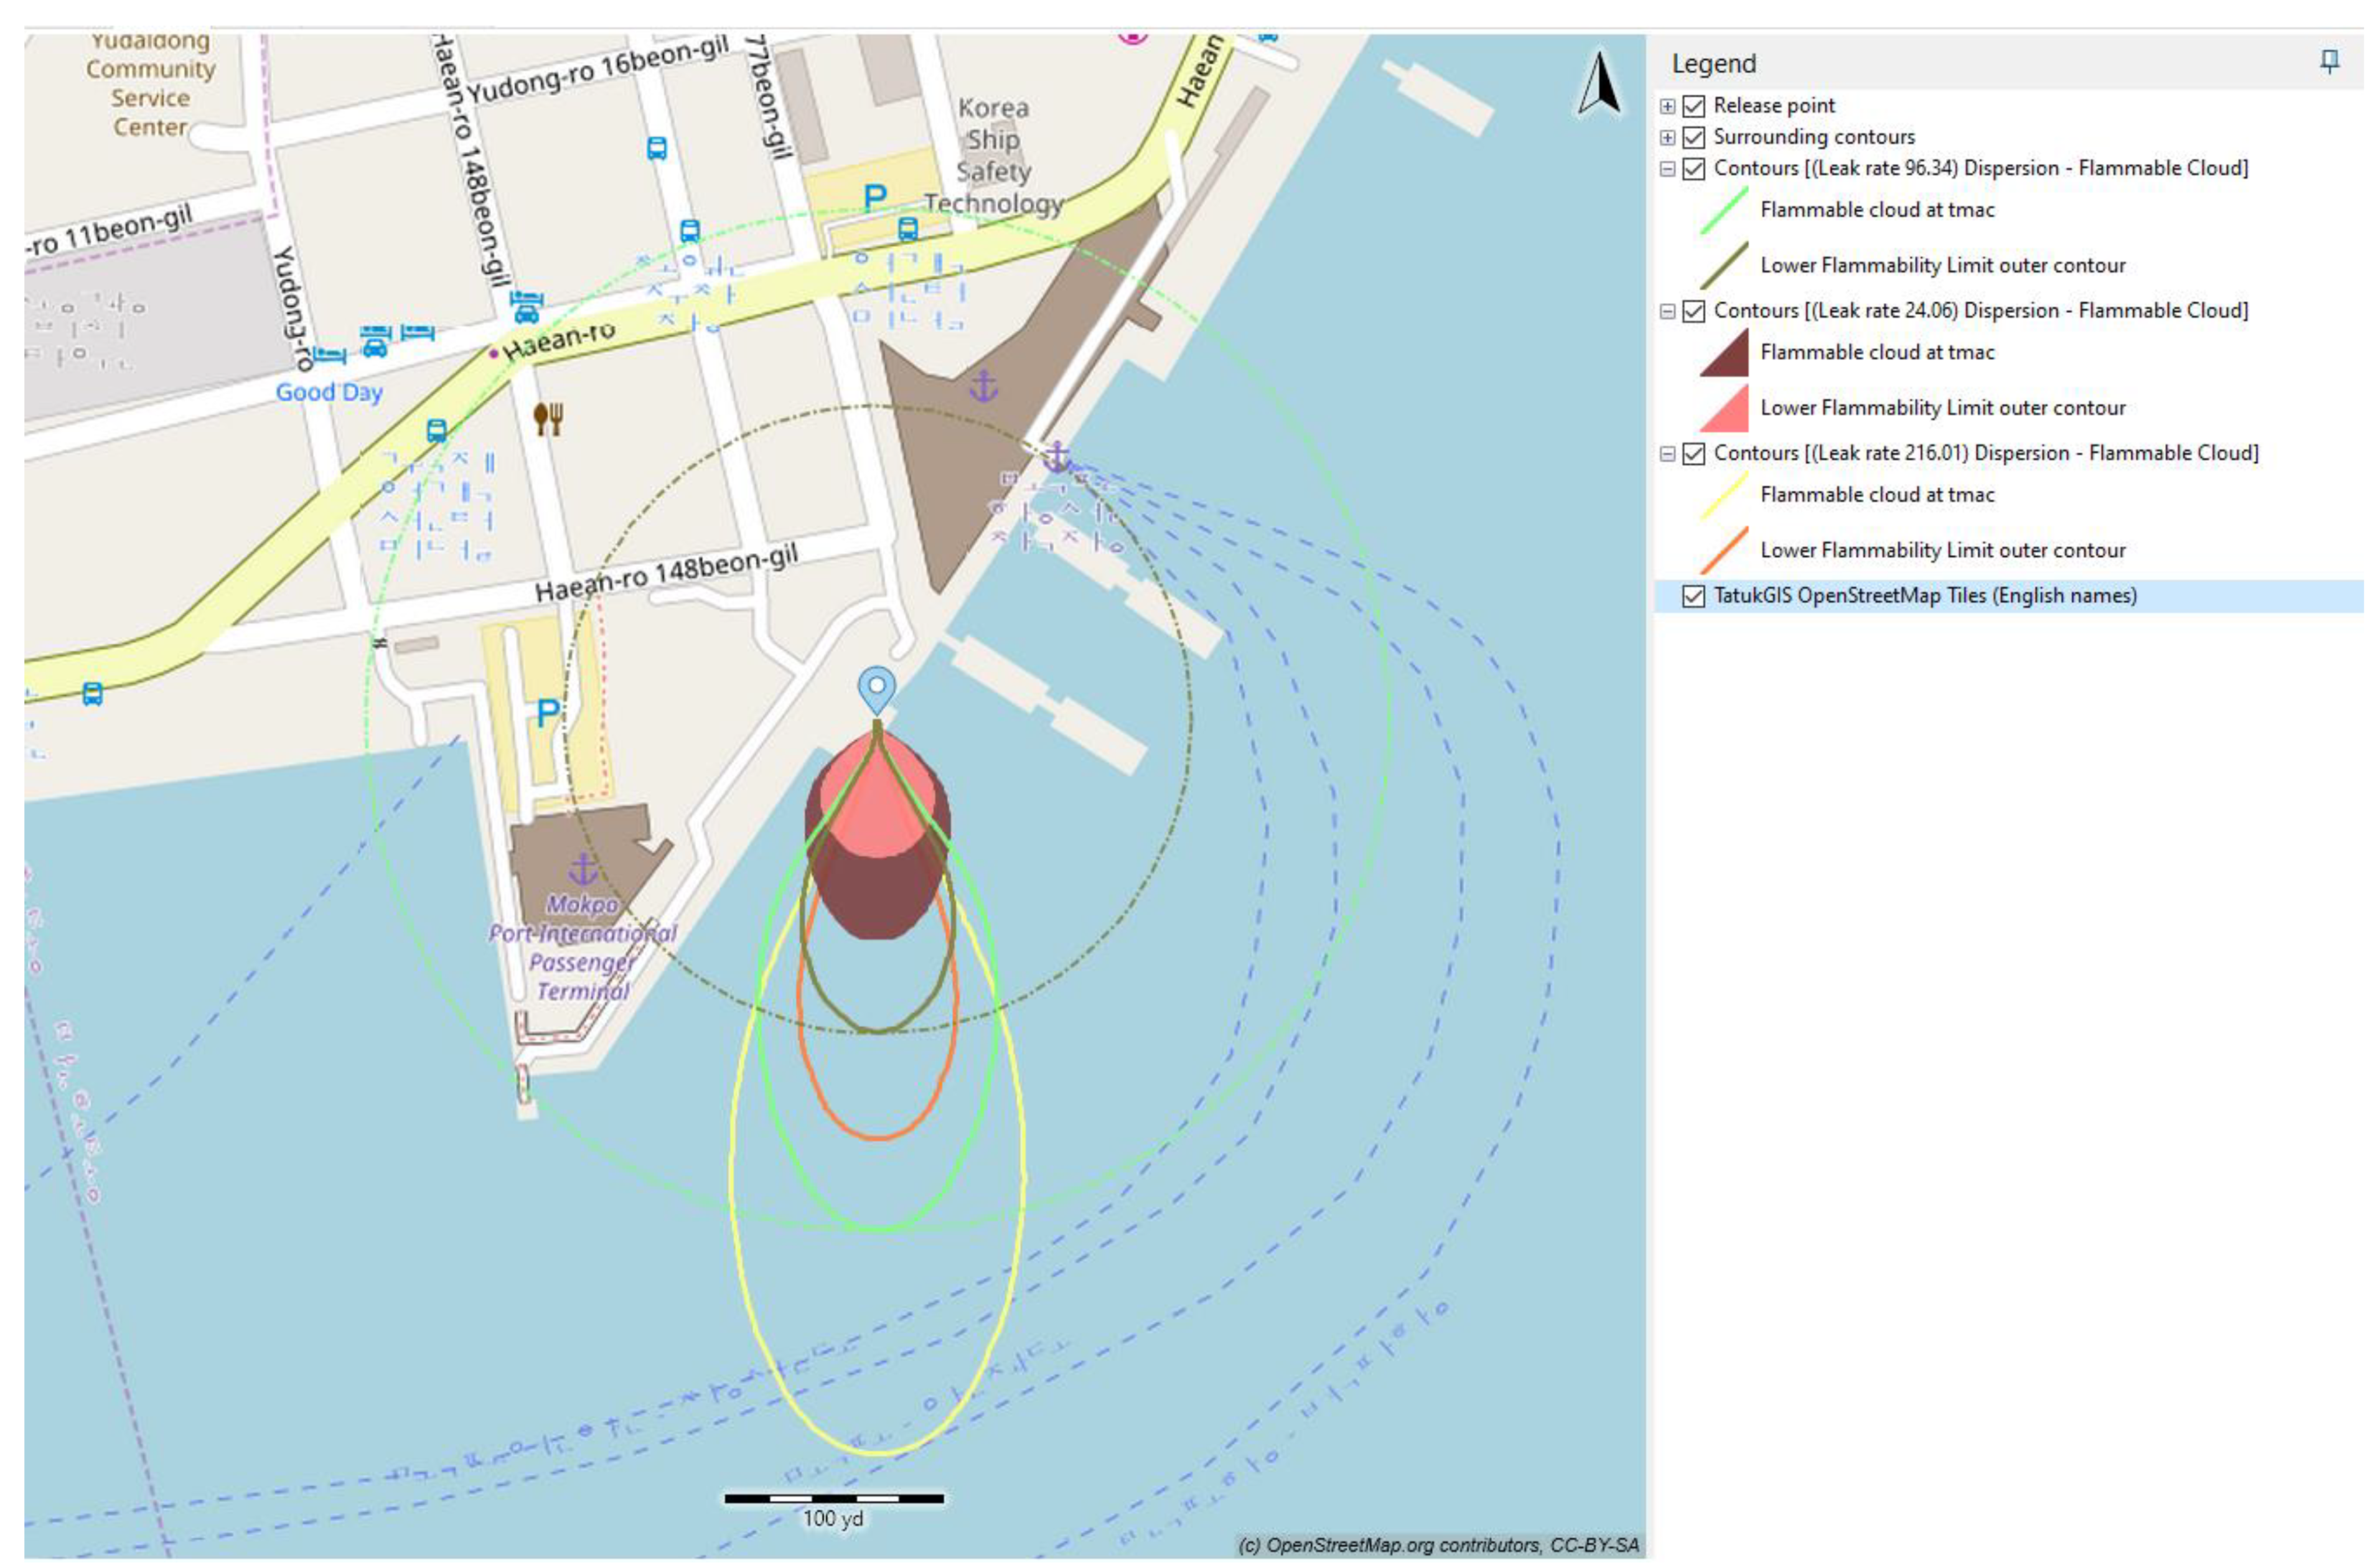
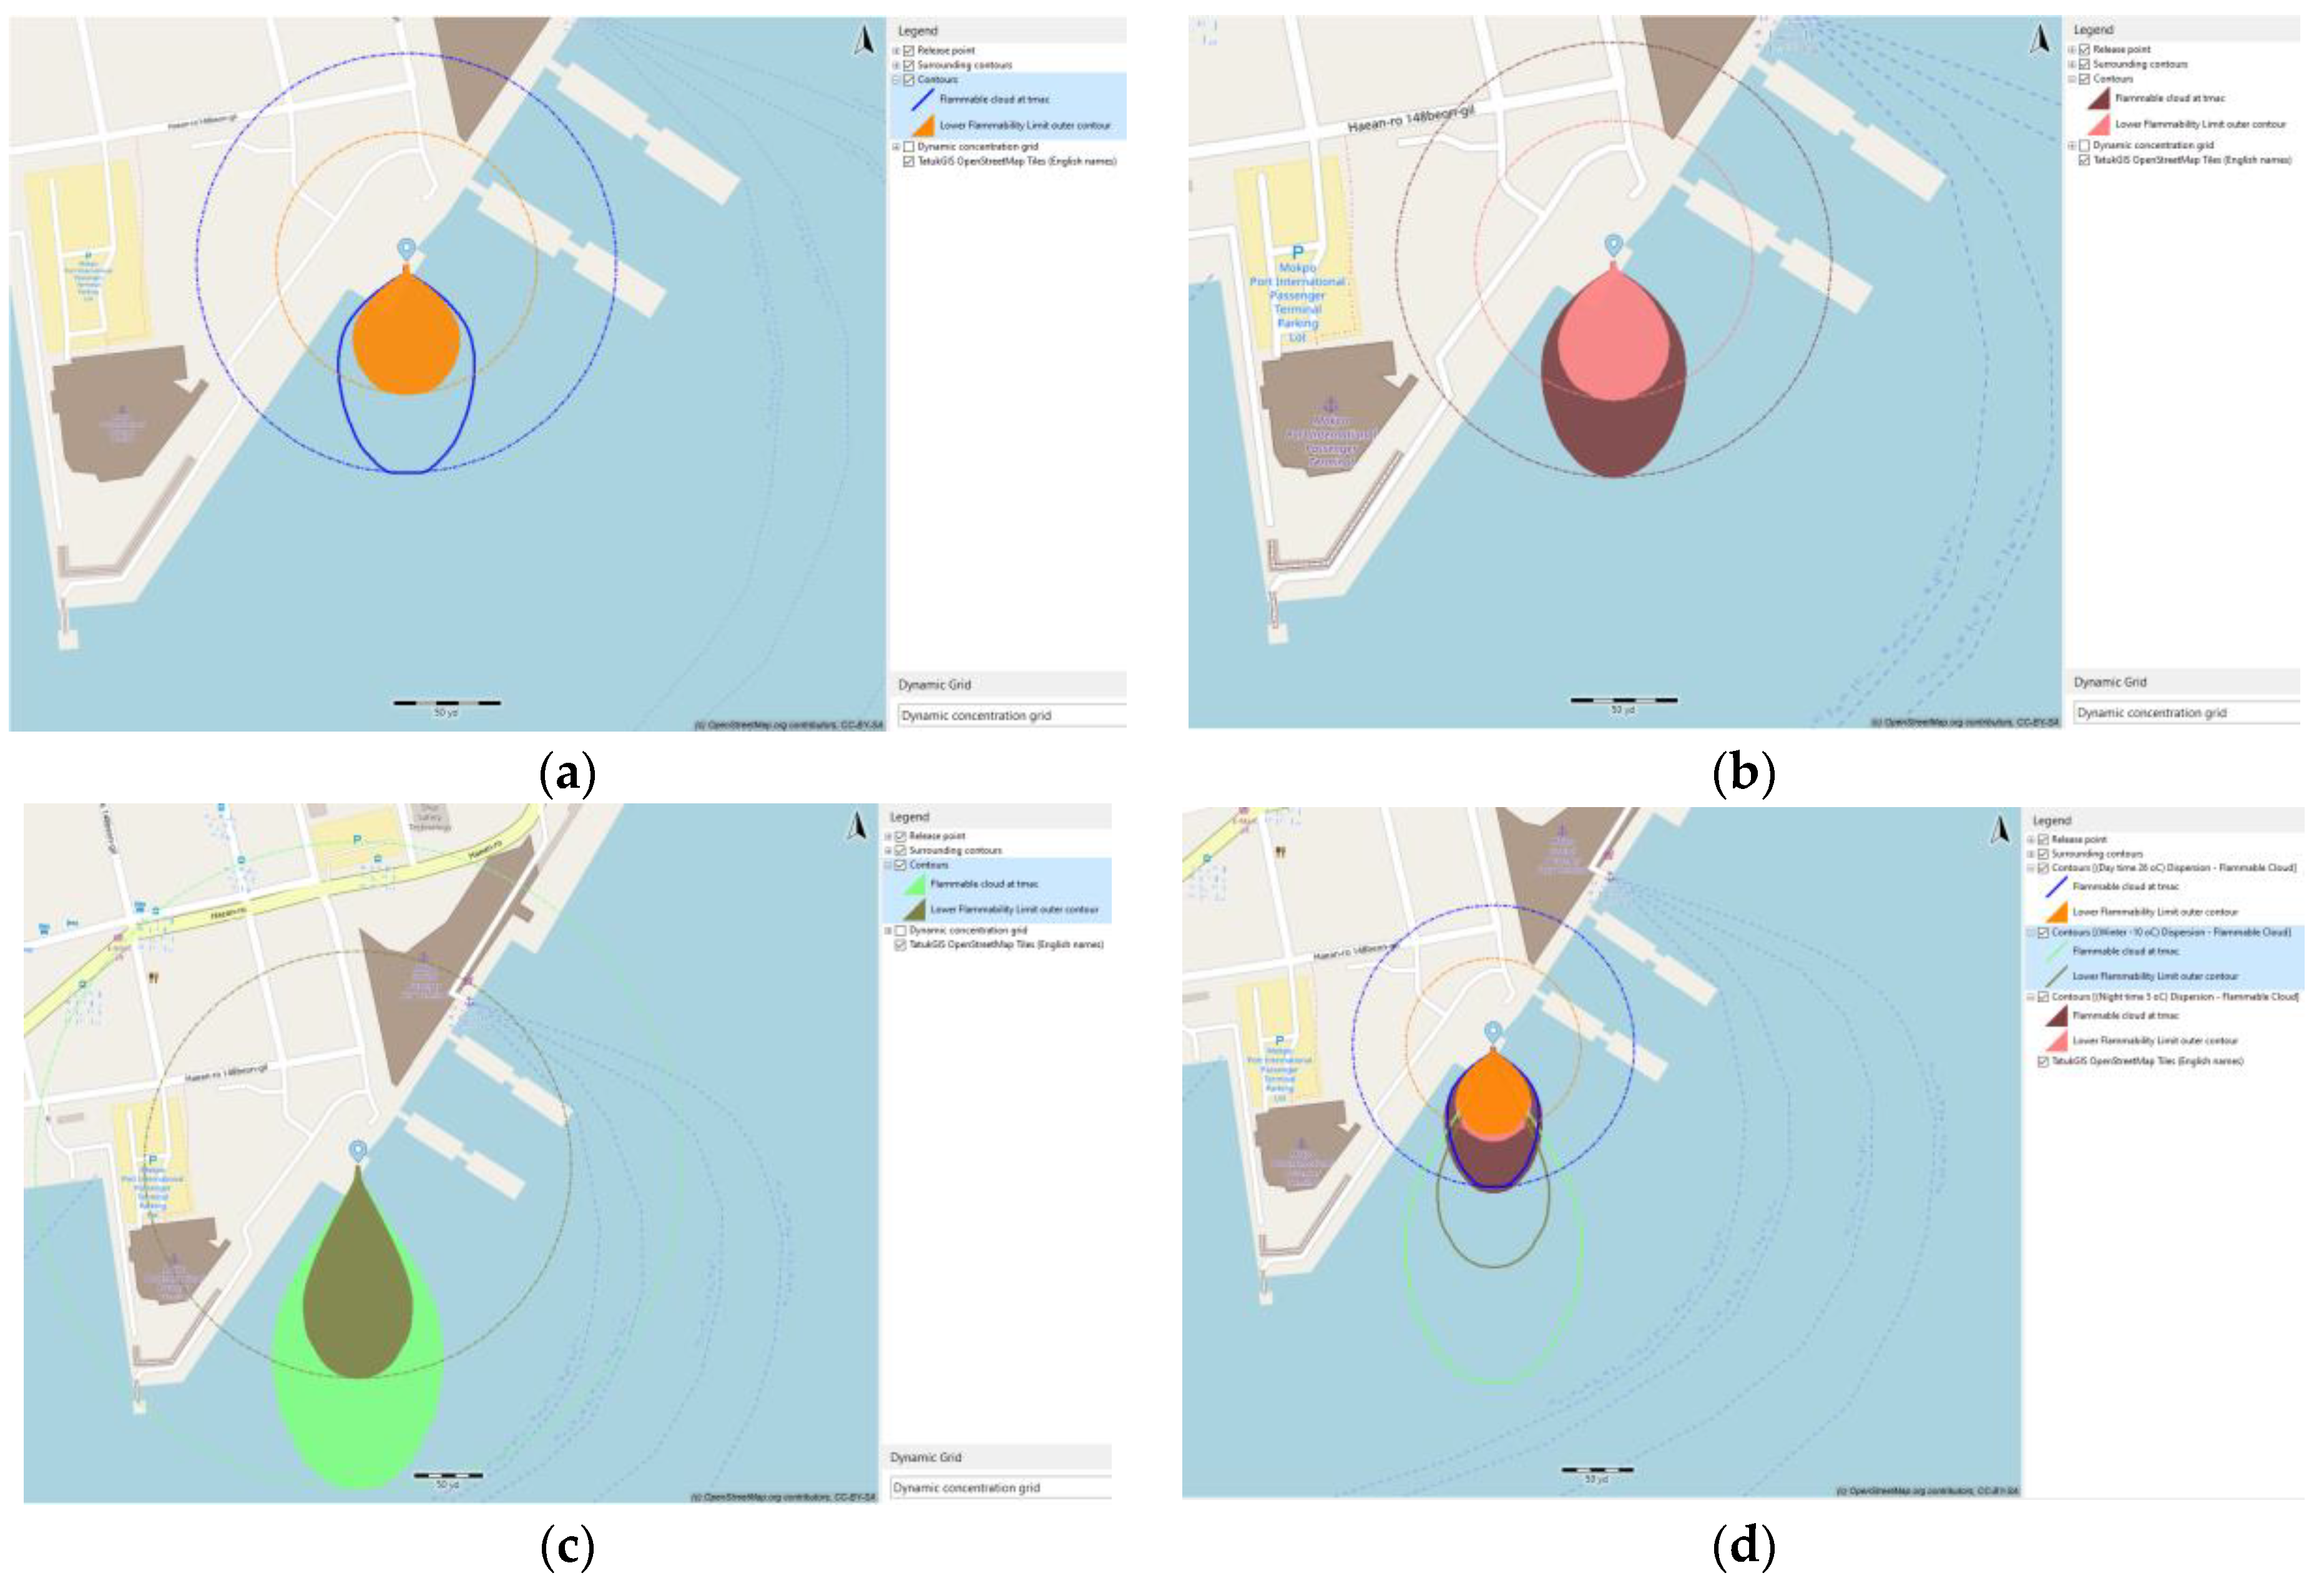
Figure 8 illustrates the variation in color contour within the vapor cloud dispersion, representing changes in fuel molar concentration over time. The characterization of NH
3 vapor dispersion was determined based on their respective lower flammability limits, which range from 14.8% to 33.4%.
At each value of leak rate, the flammable cloud at T
mac (time for maximum area of cloud) and its lower flammability limit outer contour were examined. In order to show the effect of the leak rate on the dispersion behavior of ammonia, the three dispersion contours are presented in the same window (as in
Figure 8), in which maroon and coral represent the flammable cloud at T
mac and lower flammable limit outer contour at a leak rate of 24.06 kg/s, whereas mint and silver, as well as gold and salmon, represent these quantities at leak rates of 96.34 kg/s and 216.01 kg/s, respectively.
According to
Figure 8 and
Table 6, as the leak rate of ammonia release increased, the contour distance of the ammonia vapor cloud also increased, resulting in an expansion of the maximum flammable cloud area. The maximum distances to reach a flammable concentration were 92 m, 212 m, and 305 m, corresponding to increasing leak rates from 24.04 kg/s to 96.34 kg/s and 216.01 kg/s. The impact of the leak rate on vapor cloud dispersion and the maximum dispersion area was evident. In the case of a larger pipeline and an unforeseen leak, it becomes essential to establish a correspondingly larger safety area.
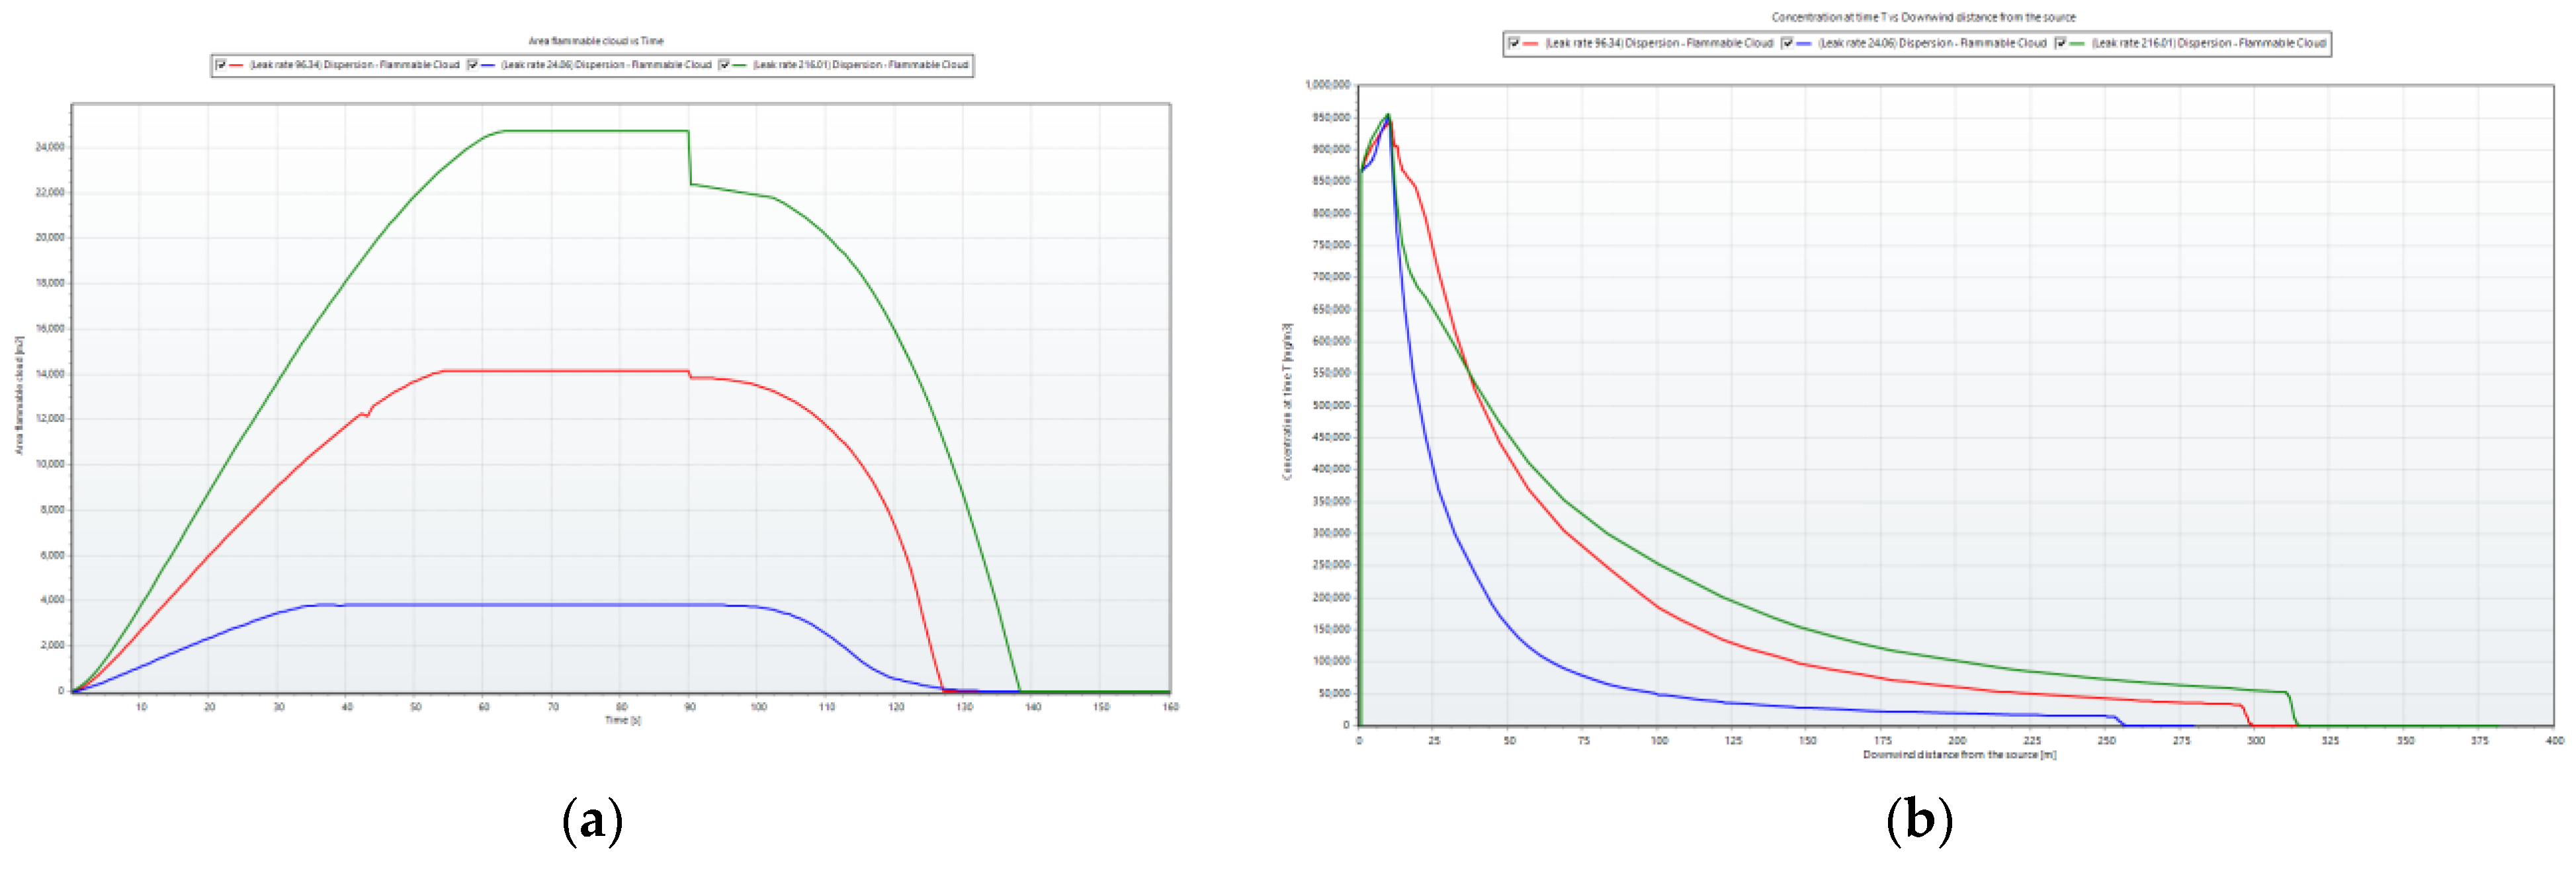
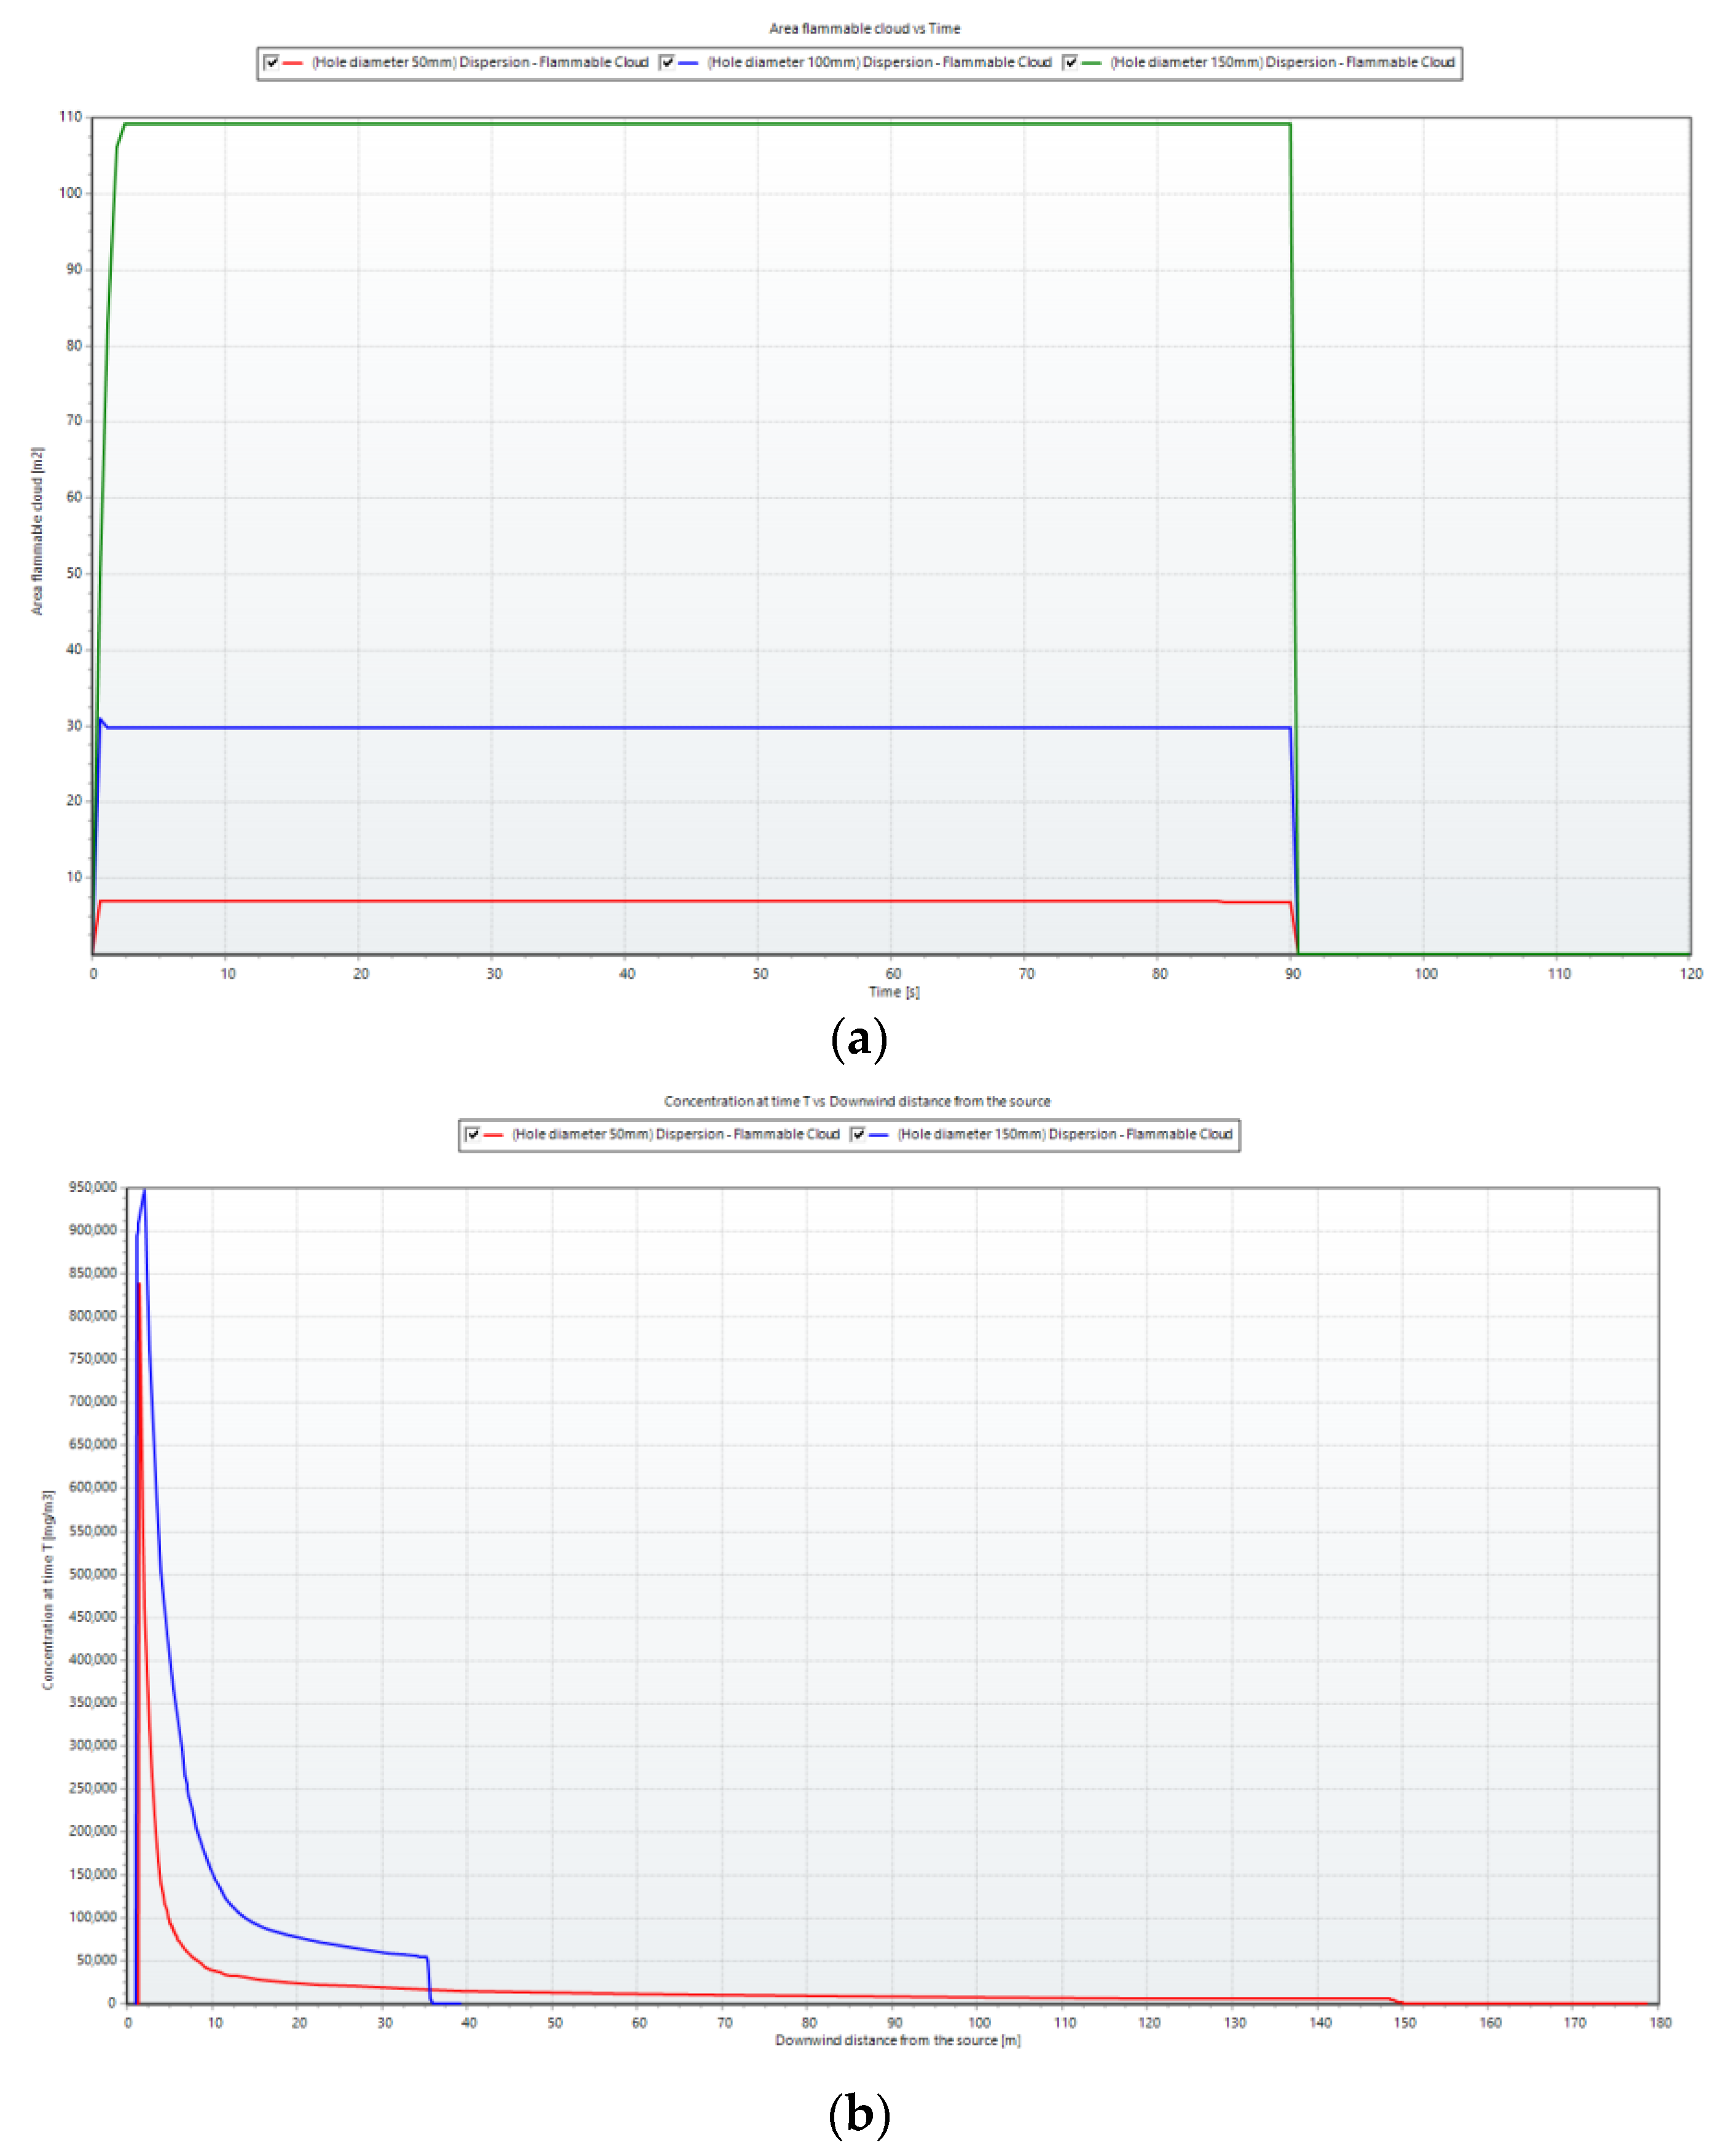
To clearly depict the changes in the flammable ammonia cloud over time,
Figure 9 was created. In
Figure 9a, the flammable cloud area increased over time and decreased upon leak shutdown (after 90 s). A higher leak rate resulted in a larger flammable cloud area and a longer dispersion time. At higher leak rate values, the flammable cloud area underwent more pronounced increases and decreases compared with lower values.
In
Figure 9b, the concentration at the leak source reached its maximum around the first 30 s and decreased over time. A higher leak rate corresponded to a longer downwind distance from the source. The concentration at each measurement point was observed to escalate with the release rate, demonstrating a proportional relationship. In particular, the concentration near the release source surpassed that of other points. Along the central axis, the concentration at measuring points increased more rapidly with the release rate, whereas this trend was less evident for other points. In the area near the windward side of the obstacle, there was a swift rise in concentration corresponding to the release rate. However, for the crosswind and leeward directions, the ammonia concentration exhibited little variation with different release rates.
After passing the barrier, the increase in the concentration at each point became less pronounced. This observation indicates that the dispersion of ammonia gas across a sequence of obstacles, which was influenced by the characteristics of the wind, led to a more even distribution of the gas.
3.2. Effect of Weather Condition
Figure 10 illustrates the maximum impact distances for various meteorological conditions based on the wind velocity (v). With the exception of one scenario (downwind N under Pasquill stability class F (very stable)), the calculations consistently showed that higher wind velocities led to shorter distances, indicating that increased wind speeds facilitated a rapid dilution of the cloud. Excluding class F, which was examined separately, it was observed that class A (very unstable) was particularly responsive to changes in the wind velocity. Overall, the impact distances for these classes fell within the same variability range.
Concerning the downwind distance under stable atmospheric condition F, there was an initial increase in the dispersion cloud distance. As in
Table 7, the lower flammable contour limit at the outer contour and its 50% LFL increased from 138 m to 142 m and 153 m to 207 m as the wind velocity rose from 2 to 5 m/s. However, when the wind speed increased from 5 m/s to 10 m/s, the LFL and 50% LFL outer contours decreased from 142 m/s to 54 m/s and 207 m/s to 74 m/s, respectively.
This unexpected outcome can be explained by recognizing that under stable conditions, the wind speed exerts dual opposing effects: an increased velocity facilitates the dilution of the toxic cloud with “fresh” air, while simultaneously raising the mass transfer coefficient of the liquid in the pool. This augmentation enhances the rate of evaporation, leading to a subsequent increase in the overall mass within the cloud. Given these considerations, a comparable impact was expected for other substances. Ultimately, even for this particular substance, concerning dispersion, class F emerged as the most challenging atmospheric condition among those examined. This finding also aligns with Duong et al. [
33], who simulated ammonia dispersion with different wind velocities. This simulation outcome indicates that for ammonia, the maximum critical distances were greater under medium wind speed conditions compared with high wind speed conditions. The slower and smoother gas dispersion associated with moderate wind speeds led to a heightened level of flammability in the area. Consequently, it was deduced that alongside moderate wind speeds, higher wind speeds contributed to increased dispersion and a more extended critical distance covering a larger area. Tan et al. [
7] experimented ammonia leakage and dispersion characteristics on the factory and produced a similar trend of ammonia dispersed by wind.
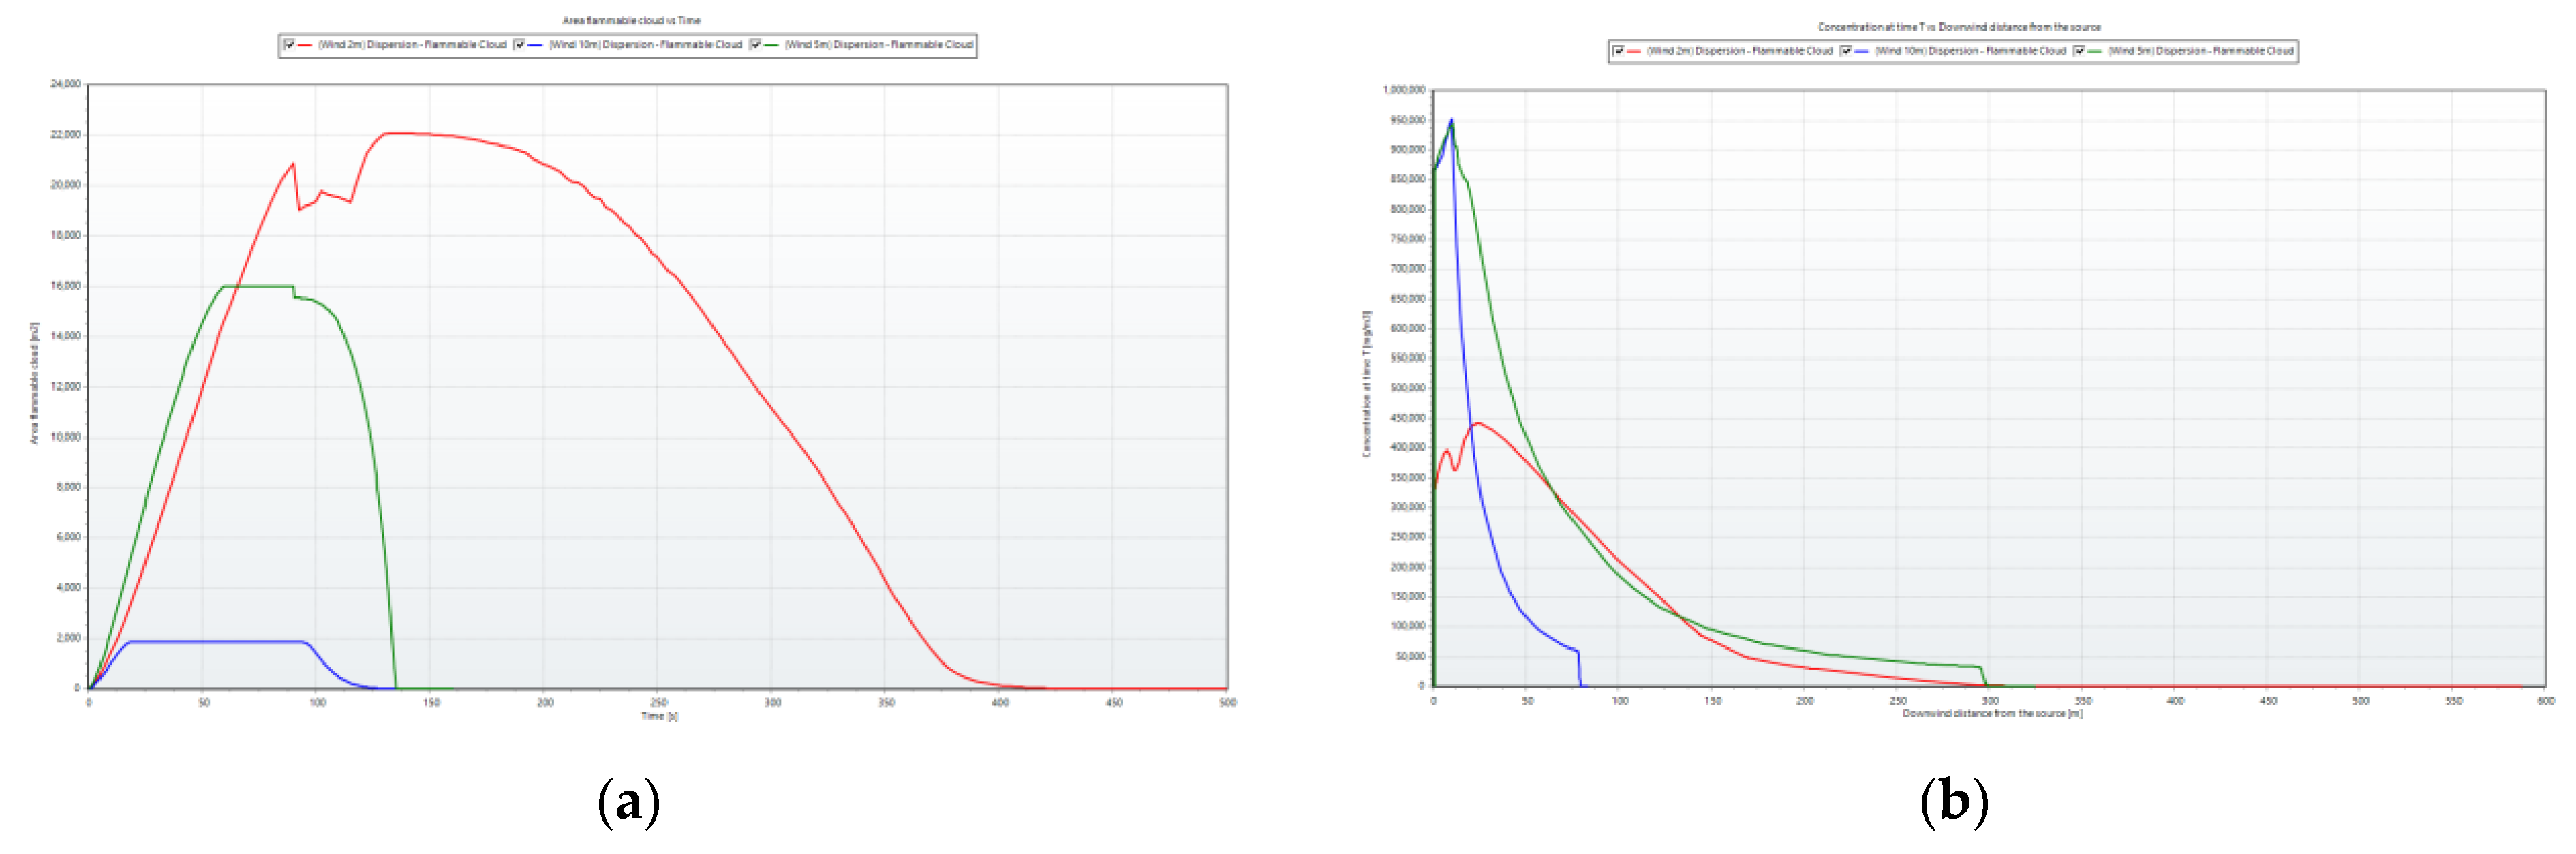
For a clearer depiction of the changes in the flammable ammonia cloud over time under varying wind speeds,
Figure 11 was generated. The graphs corresponding to wind velocities of 2 m/s, 5 m/s, and 10 m/s are illustrated by the red, green, and blue curves, respectively.
The vapor cloud area formed by a wind speed of 2 m/s was the largest, while the vapor cloud area formed by a wind speed of 10 m/s was the smallest. This discrepancy arose because the contact time with the surrounding area and ambient conditions was the longest at lower wind speeds, leading to an extended dispersion time for the vapor cloud.
3.3. Effect of Ambient Temperature
In investigating the impact of ambient temperature on the dispersion of ammonia vapor, three representative ambient temperatures were considered: 26 , 5 , and −10 , reflecting typical conditions in summer (day and night) and winter. Apart from influencing the heat flux and speed of mixing with the surrounding air during ammonia leakage, the ambient temperature also played a role in determining the flash vapor fraction post-release and the evaporation rate from the pool.
For instance, at the average daytime temperature of 26 , in the release, the vapor mass fraction was 69%, whereas during nighttime at 5 , it decreased to 47%.
The influence of ambient temperature on the vapor dispersion characteristics of ammonia is illustrated in
Figure 12 and
Table 8. As the ambient temperature decreased, the flammable cloud distance increased. This phenomenon can be attributed to a smaller temperature differential between the leaked ammonia and the ambient surroundings, leading to an extended dispersion time. Under identical wind speed and environmental conditions, the prolonged dispersion time resulted in a greater area and distance of dispersion.
It is worth noting that during the truck-to-ship bunkering process in winter, the safety zone will be larger than during bunkering in the summer.
The changing process of flammable cloud area according to time with each value of ambient temperature is presented in
Figure 13. The blue, green, and red curves are representative of the changing of flammable cloud at −10
, 5
, and 26
, respectively. A larger flammable area was found at an ambient temperature of −10
because of the longer ammonia dispersion time. The increase in the flammable area was lower when the temperature increased.
3.4. Effect of Hole Diameter
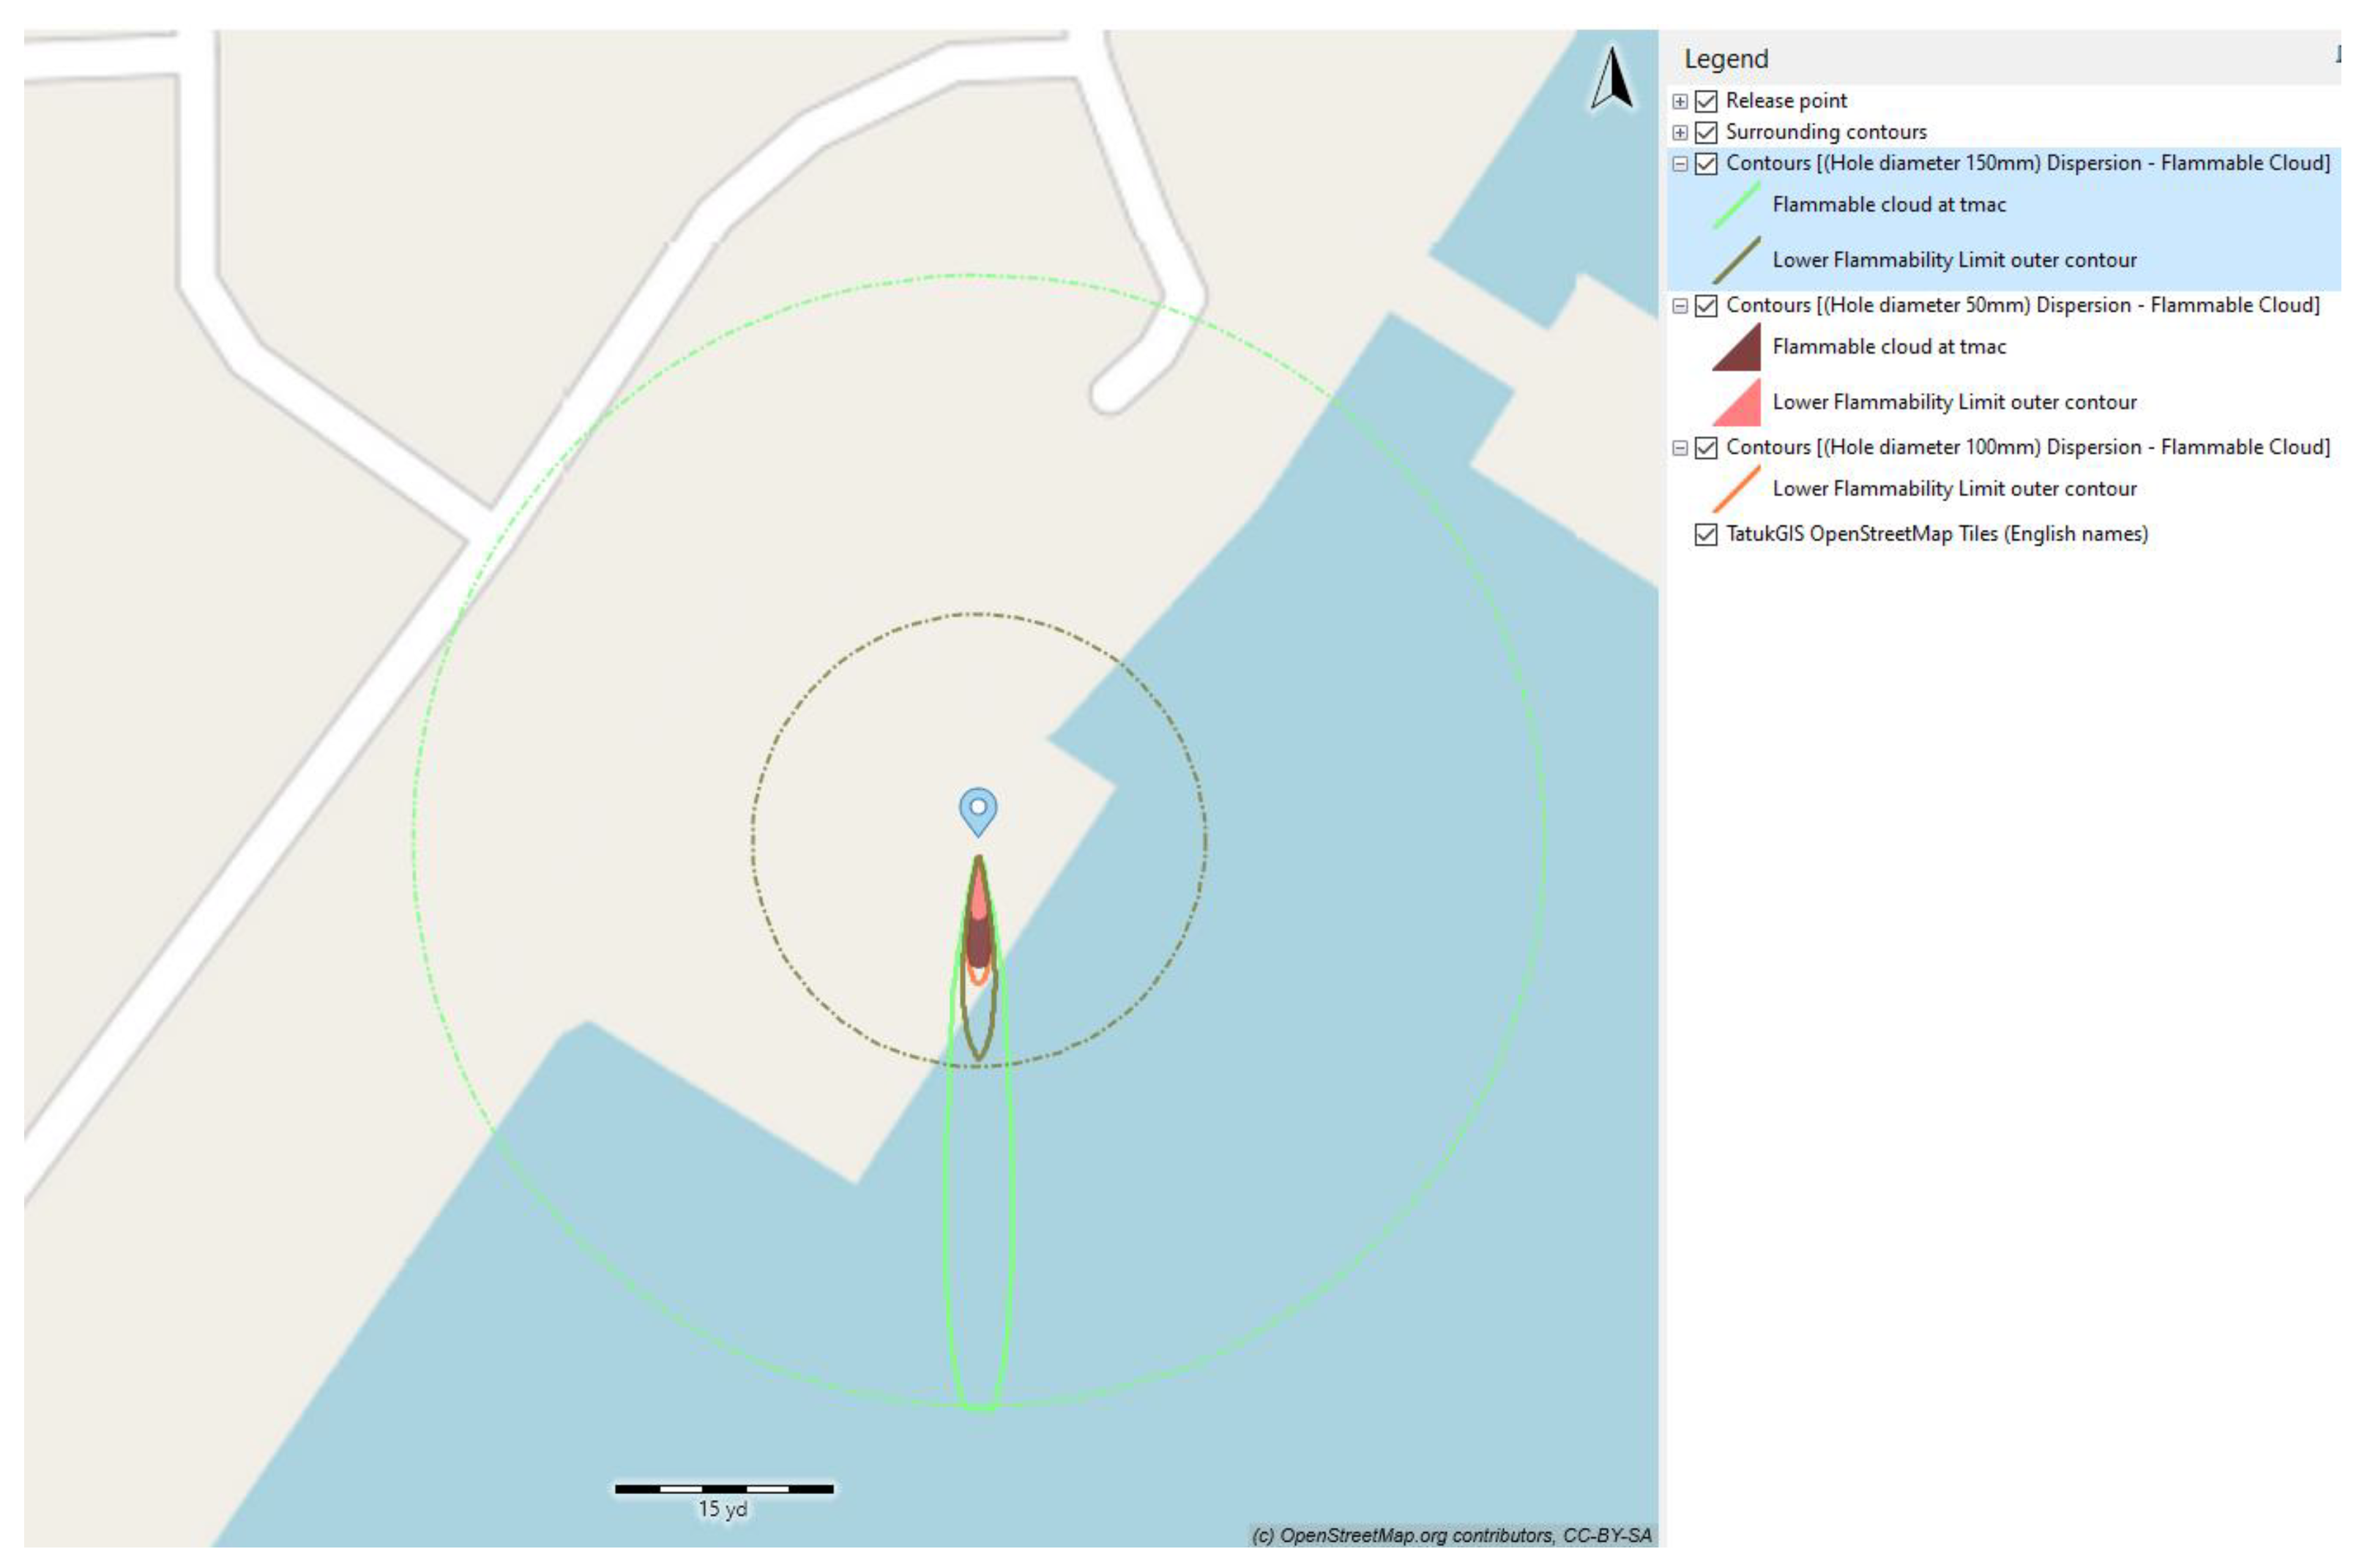
Three values of the diameter of the leak size were examined, namely, 50 mm, 100 mm, and 150 mm. Examining
Figure 14 and
Table 9 reveals that the trend of impact distance relative to hole size consistently followed a linear pattern (with regression coefficients exceeding 0.99). Class F was selected as the weather condition. The release time of 90 s and wind speed at 5 m/s were selected for the simulation.
The dispersion of vapor clouds formed by each leak hole size case is depicted in
Figure 14 and summarized in
Table 9. It is noticeable that there was a rising trend in vapor cloud dispersion with an increase in the size of the leak hole. The 50% LFL outer contour expanded from 8 m to 39 m, correlating with the enlarged leak hole sizes ranging from 50 mm to 150 mm. This observation can be explained by the larger amount of ammonia being released with a larger leak hole, resulting in a more extensive dispersion area. Consequently, a larger safety zone is necessary in the event of a substantial leakage occurrence.
Figure 15 illustrates the flammable cloud area and concentration of ammonia dispersion over time. The red, green, and blue curves present the flammable area and concentration curves for leak holes that are 150 mm, 100 mm, and 50 mm, respectively. It is evident that the area formed by the leak hole of 150 mm was much larger than that of 100 mm and 50 mm. The differences between them were nonlinear.
3.5. Toxic Effects of Ammonia
Tan et al. [
34] demonstrated the toxic characteristics of ammonia, indicating that a safe concentration range for ammonia should be chosen, with a value less than 39.5 ppm. The American Society of Heating, Refrigerating, and Air-Conditioning Engineers (ASHRAE) [
35] and the Korean Register [
36] prescribe audible and visible alarms to minimize the risk of ammonia leakage when the gas vapor concentration reaches 25 ppm. Consequently, the hazardous range in this study was determined by selecting the concentration of ammonia at 25 ppm. The safety range of the mole fraction for ammonia bunkering in this scenario was chosen between 25 ppm and 33.4%.
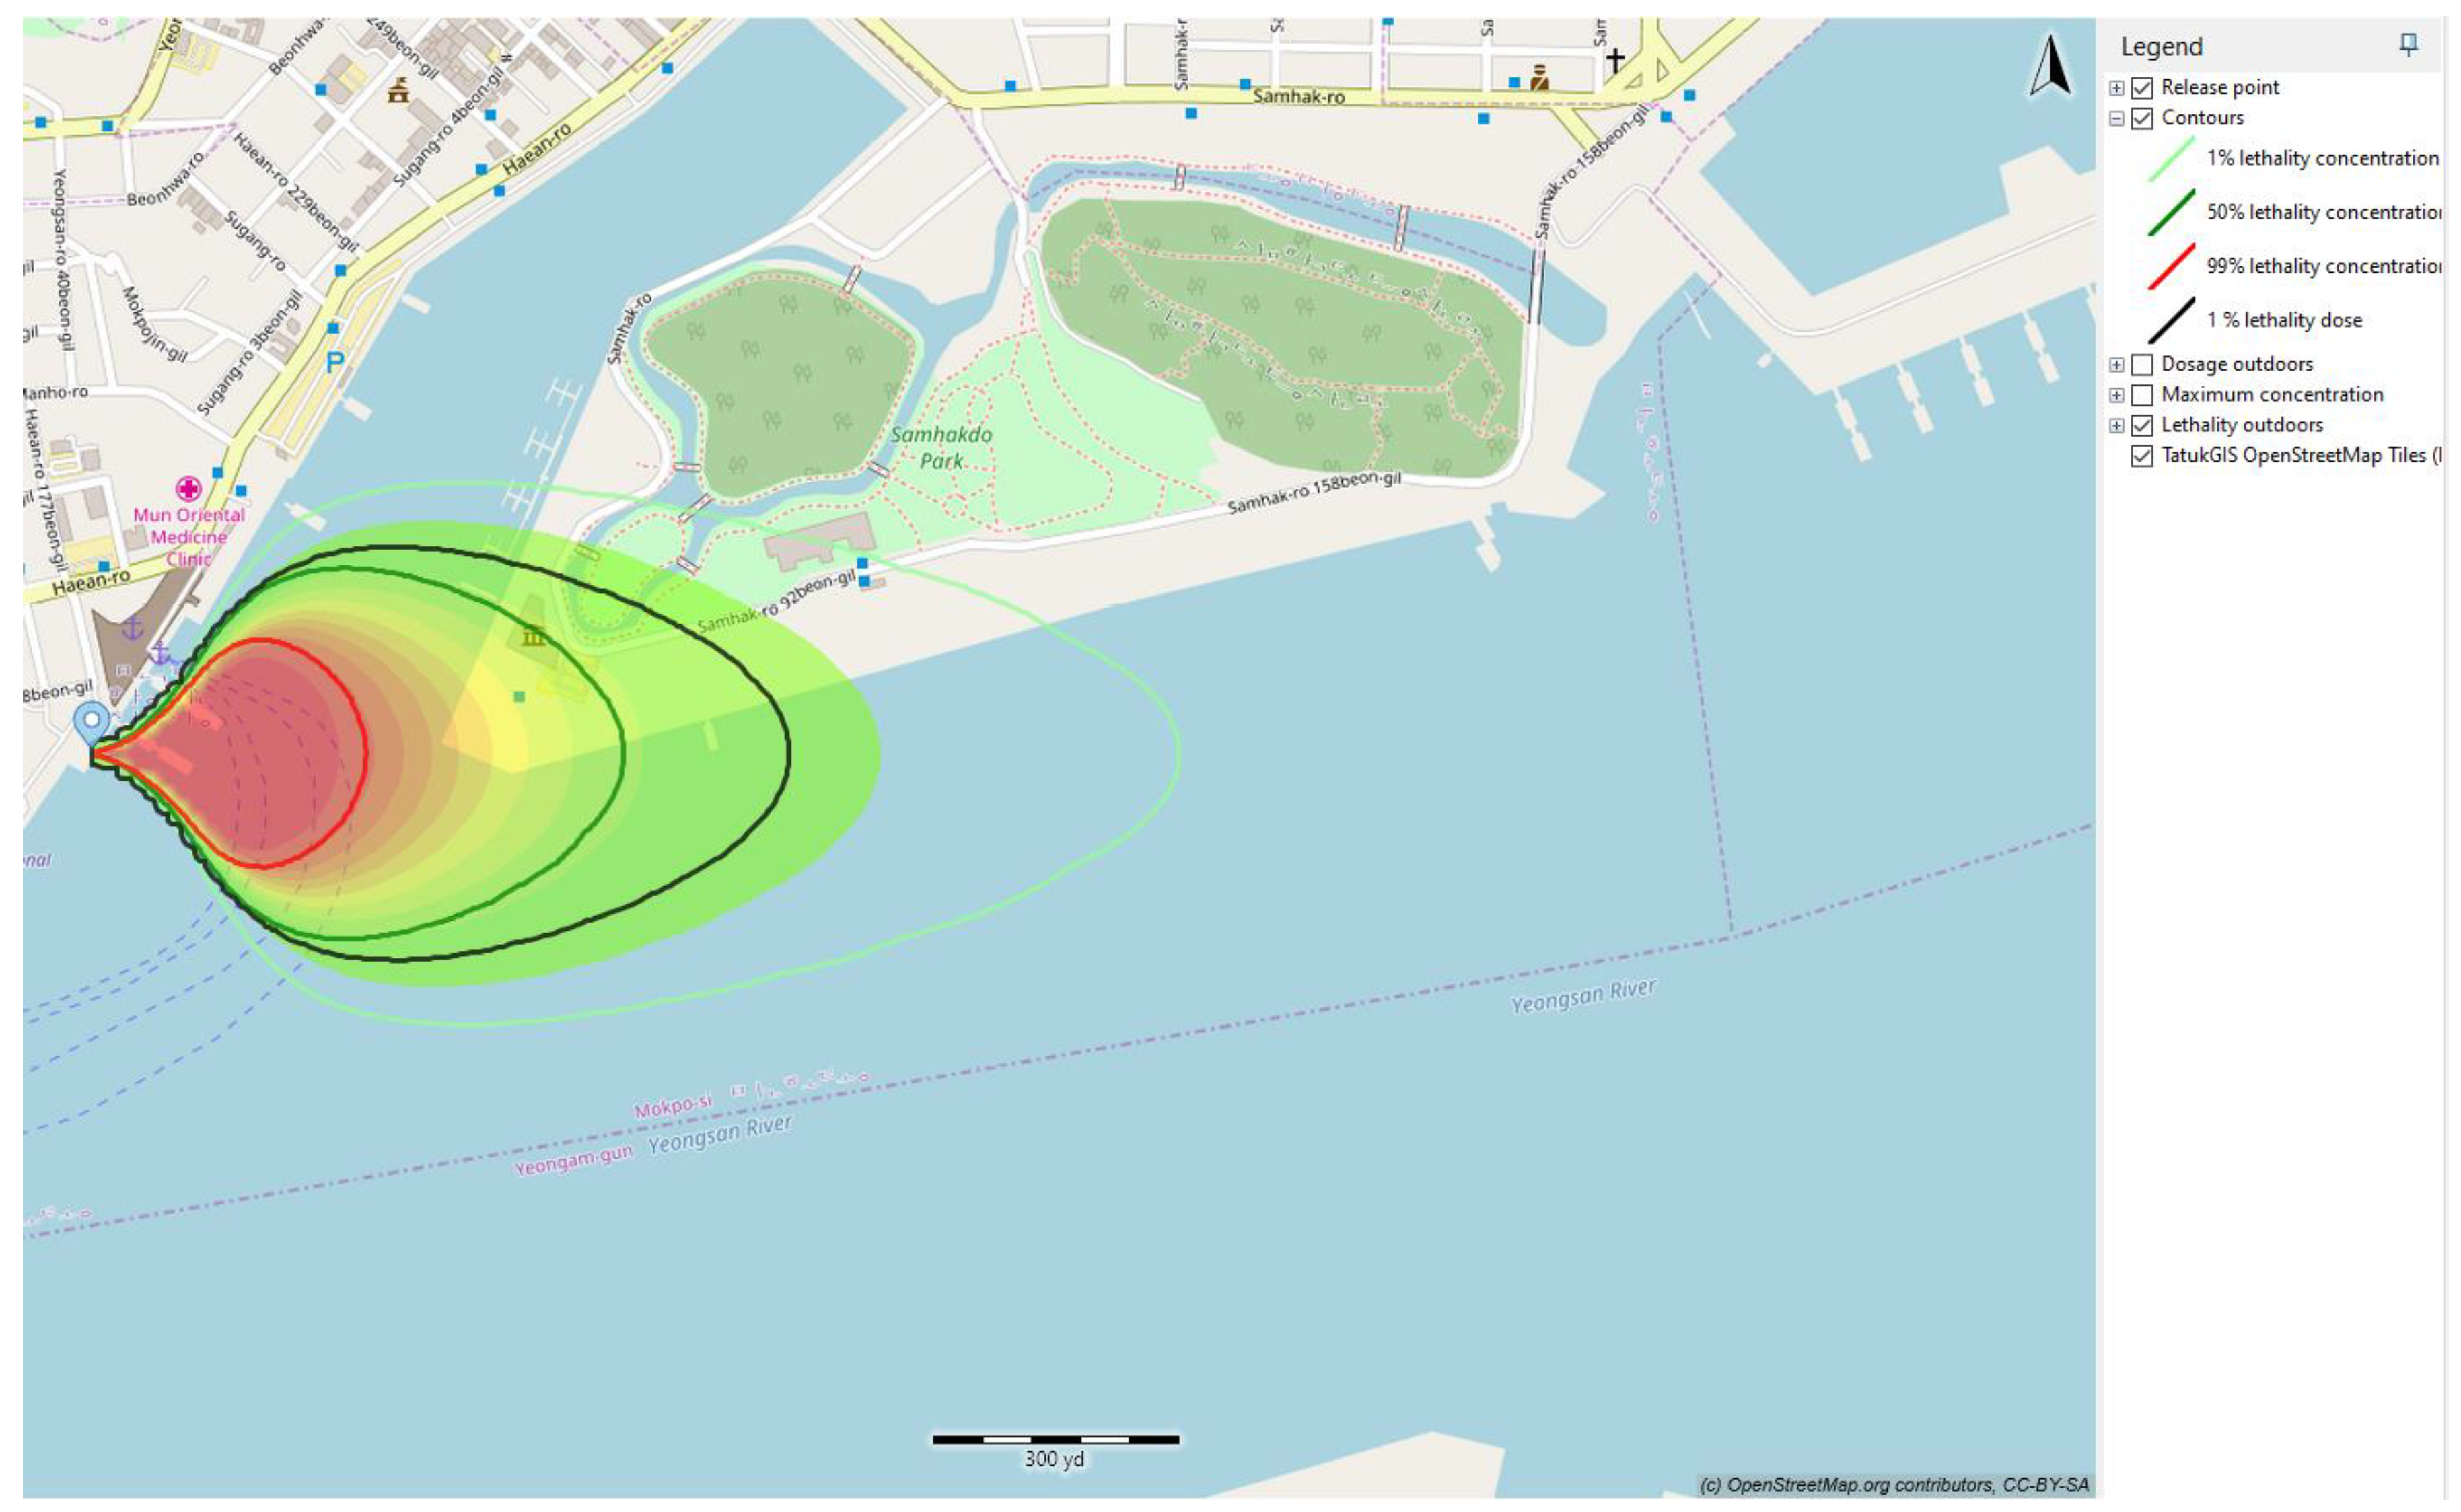
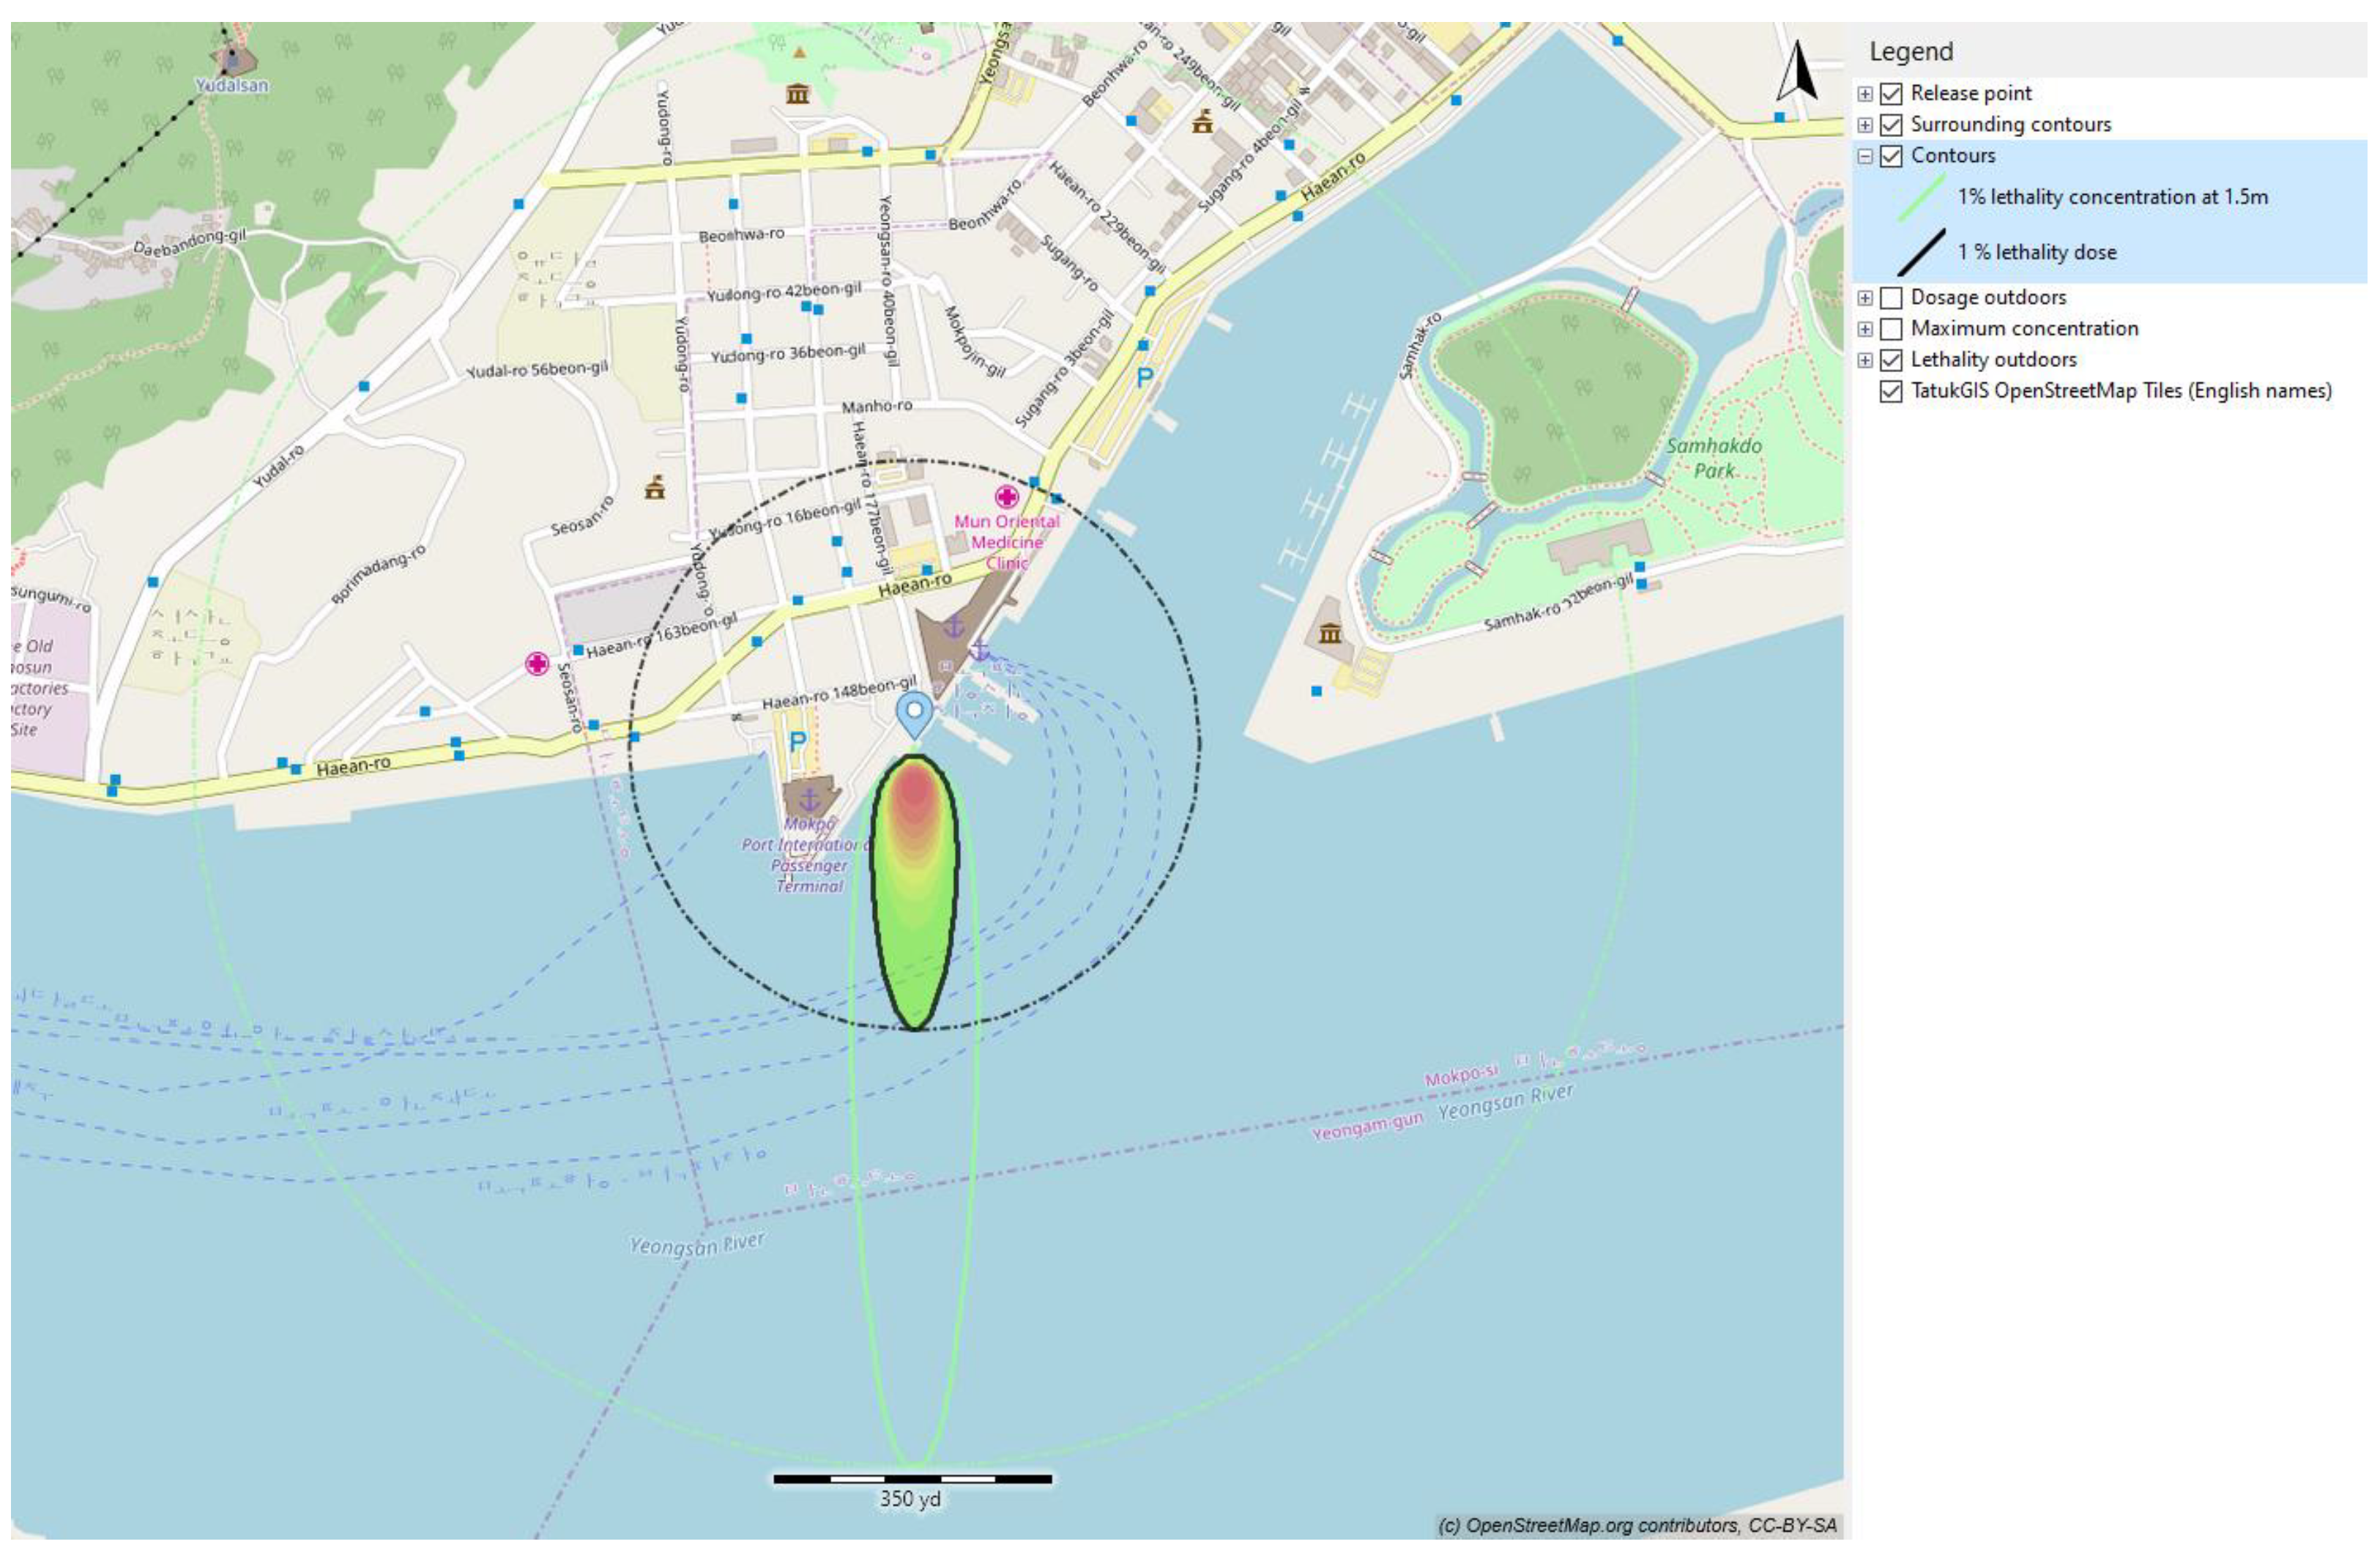
In this current study, the effect of toxicity of ammonia is represented via the lethality dose. The lethality of ammonia in this case is presented in
Figure 16 and
Table 10. The 1% lethality dose was selected to present the effect of toxicity of ammonia to humans and other traffic surrounding the truck-to-ship bunkering area.
Figure 16 presents the 1% lethality footprints for scenarios that compared the outcomes resulting from variations in operational input parameters.
The smallest 1% lethality footprint was observed for a 50 mm hole size of ammonia released at 8 m. The lethality footprints for release with a larger leak hole size was higher than for a small value of the leak size. Because the leak size was directly related to the amount of ammonia leaked, when the released quantity was limited, the surrounding air effectively dispersed the released ammonia, reducing its concentration to levels below lethality. A smaller quantity of the rainout pool on the sea surface resulted in a larger surface-area-to-volume ratio, facilitating the dissolution of ammonia into the seawater. Furthermore, with a smaller released quantity, there was less heat generated during the ammonia dissolution in water, minimizing rapid boiling and turbulence at the seawater surface. Consequently, the 1% lethality footprints for the 30 s release were significantly smaller than those for the 90 s release.
The simulation conducted for a release duration of 90 s revealed that the 3% lethality footprints decreased to 109 m2 for a 150 mm hole, 31 m2 for a 100 mm hole, and 7 m2 for a 50 mm hole. The implementation of safety devices has the potential to reduce the 1% lethality footprint. Consequently, the maximum distance to flammable concentration was reduced from 39 m to 8 m, corresponding to a decrease in hole size from 150 mm to 50 mm. Within this range of leak hole sizes, the flammable mass at a given time was also reduced from 2.4 kg/h to 0.1 kg/h.
The dispersion clouds of ammonia at different hole sizes are presented in
Figure 17 with the plume size view. A decrease in the release duration corresponded to a smaller quantity of ammonia being released. When the release duration was reduced from 90 s to 30 s, the 1% lethality footprints decreased by more than 70%. Therefore, minimizing the isolation time was crucial. The simulation by Clara et al. [
17] also pointed out that safety devices capable of instantly closing valves in the event of hose rupture can restrict the released ammonia to the hose content, potentially reducing the 1% lethality footprints by more than 90%. The most severe consequences arise from a vertical discharge of ammonia, and this should be avoided at all costs. Significantly mitigating the severity can be achieved by reducing the release duration and transfer flow rate.
Figure 17 represents the concentration along the centerline of the plume at the downwind position where the plume touches down. This graph depicts the relationship between the height and concentration along the centerlines, illustrating the behavior of a plume along the vertical (Z) axis. This is particularly crucial for plume rise and heavy gas dispersion models, which involve significant vertical movement of the plume. As the ammonia dispersed with different leak hole sizes, the side view of the plume was consistently centered around the release height, although the mixing layer height may introduce some reflective behavior in the concentrations. This output was exclusively computed for negatively buoyant plumes.
4. Discussion
This study primarily aimed to ascertain the maximum distances of NH3 dispersion in the most unfavorable leakage scenario, highlighting notable variations across various accidental conditions. The investigation was specifically tailored to a typical scenario of bunkering accidents, which inherently imposed limitations on drawing broader conclusions. The parametric studies indicate that weather conditions (wind and ambient conditions) and leak characteristics, including the leak direction, leakage rate, and hole size, played a crucial role in determining the safety zone. The results highlight that wind speed significantly influenced the extension of the safety zone area, albeit with an inverse proportionality—higher wind speeds led to smaller critical zones. When assessing the safe zone for NH3 bunkering, considerations of both the wind speed and direction are imperative to minimize risks associated with leaked gas dispersion.
In instances where the wind aligned with the gas discharge from the leak hole, case studies exploring the impacts of wind directions revealed the need for a more expansive establishment of the safety zone. The analysis of the wind direction impact emphasized that the surrounding environment (congested or open) significantly influenced the level of the safety zone. This model and analysis served to estimate the effects of surrounding factors and various leak characteristics on the safety distance of NH3 bunkering, thereby mitigating hazards associated with the bunkering process.
The size of the leakage opening also affected the dispersion of ammonia vapor in the cloud. It is noteworthy that there was an upward trend in the dispersion of vapor clouds as the size of the leakage opening increased. The 50% LFL outer boundary expanded from 8 m to 39 m, corresponding to the increased sizes of the leakage openings ranging from 50 mm to 150 mm. This observation can be explained by the larger quantity of ammonia being released through a larger leakage opening, resulting in a more extensive dispersion area. As a consequence, a larger safety zone is required in the event of a significant leakage incident. However, the increase in cloud dispersion was not directly proportional to the increase in the size of the leakage opening. Therefore, the characteristics of the cloud dispersion should be thoroughly examined in specific cases of leakage.
As the surrounding temperature dropped, the distance covered by the flammable cloud increased. This occurrence can be explained by a reduced temperature contrast between the leaked ammonia and the surrounding environment, resulting in an extended dispersion duration. With consistent wind speed and environmental factors, the prolonged dispersion time led to a larger coverage area and distance.
It is important to highlight that during the truck-to-ship bunkering process in winter, the required safety zone will be greater compared with bunkering activities conducted in the summer.
The toxicity and lethality dose of ammonia was greatly influenced by the size of the safety zone during the bunkering process. The lethality dose was affected by the amount of ammonia leakage, time of dispersion, and leak hole size.
5. Conclusions
Creating a safety zone and accurately determining the distance between truck-to-ship bunkering are crucial measures for improving ammonia bunkering safety. This scholarly paper offers valuable insights by presenting case studies that vividly showcase the potential dispersion of flammable gas in various NH3 bunkering methods. Ship designers, owners, and regulatory bodies can employ this information to formulate enhanced safety zone guidelines, with the aim to mitigate the risks associated with unintentional NH3 leaks during bunkering procedures.
Ensuring the safety of NH3 bunkering is vital, where this involves determining both the safety zone and the distance between the bunkering vessel and the receiving vessel. Given the absence of specific regulations governing the construction of the safety zone in truck-to-ship bunkering in a port area, this research article stands out as an exceptional contribution. It utilized case studies involving two types of sample vessels to furnish ship designers, owners, and regulators with insights into the potential dispersion of combustible gases.
The case studies delved into accidental NH3 leaks under diverse bunkering conditions and scenarios. The effects of leak characteristics, weather condition, and toxicity of ammonia were examined. The main findings derived from the investigation are outlined below:
After a leakage, NH3 disperses onto the ground, creating a circular liquid pool that interacts with the air, eventually evaporating into low-temperature steam. Clouds settle and gather around the storage tank in a gas–liquid two-phase flow, exhibiting reduced density compared with the air in the distant region, signifying the diffusion of light gas. Owing to the sustained high concentration of fuel in this zone, this should be a primary consideration for alarm prediction.
The heat transfer between NH3 and the surrounding environment is significantly affected by the leakage aperture. The delay in establishing a stable liquid pool and gas cloud underscores the recommendation to develop strategies that reduce both the rate and duration of leaks in the bunkering process. This strategy aims to mitigate the consequences of unintentional NH3 releases.
The ambient temperature significantly affected the dispersion distance and area. Lowering the ambient temperature resulted in a higher dispersion distance. The truck-to-ship bunkering in the winter requires a larger safety zone than bunkering in the summer.
The effect of mild wind speed was higher than the effects of high and low values of wind speed. This was because the mixing of ammonia and surrounding air were smoother and longer than for high/low wind speed (high turbulence).
The toxicity of ammonia must be considered when establishing the bunkering safety zone. The lethality dose of ammonia was linear with the leak hole size, leakage time, and amount of ammonia released.
The results of this study offer fresh insights into how adjustments to each of the key operational parameters can influence the dispersion of ammonia over a seawater surface. Additionally, the findings provide information on the potential reduction that can be achieved by modifying these operational parameters. This information is valuable for devising effective operational and mitigation control measures and sustainable development for ammonia bunkering operations.


