1. Introduction
The sustainable energy autonomy of small and rural communities, located far away from the nearest electrical grid and, therefore, unlikely to be interconnected, due to the high interconnection cost and the low electricity demand, imposing no economic feasibility of the overall endeavor, constitutes traditionally a popular and favorite topic of the relevant scientific and technical community. Aiming, apart from energy autonomy, at the sustainability of the power production plants, the proposed solutions are configured with the combined operation of power production technologies from Renewable Energy Sources (RES) and energy storage technologies, formulating the so-called “Hybrid Power Plants” (HPP) [
1,
2].
Essentially, the energy autonomy of these small and rural communities has to face three major objectives:
Full real-time coverage of the power demand, without external support;
Stability and dynamic security of the power supply;
Cost-effective production and maintenance process.
Working mainly on the aforementioned three objectives, several relevant articles can be found in the scientific literature. The most commonly met approach is the combination of wind parks or small wind turbines with photovoltaics and electrochemical batteries, to undertake the power demand of a small community [
3,
4,
5]. These systems are, in general, characterized by high flexibility and modularity, due to the easily adapted size of the storage plant. Also, since the power and frequency regulation is based on power electronics, they ensure a high response rate and capacity to efficiently undertake any potential disturbances or contingencies in the power production system and the electrical grid. Finally, they exhibit low budgets. On the other hand, the setup levelized cost is considerably high, due to the batteries’ high procurement levelized cost (for lithium-ion batteries in the range of 400 USD/kWh of storage capacity). This, in turn, restricts the installed storage capacity of the plant, which leads to short time periods of autonomous operation and low energy supply security. As a final result, the achievement of 100% coverage of the energy demand is very difficult with the support of electrochemical storage, precisely due to the low available storage capacity [
6,
7]. Recent studies have examined the capacity of such plants to operate under liberalized wholesale electricity markets, showing that a considerable drop in battery procurement costs should be achieved [
3].
The drawback of the low storage capacity is often compensated with the introduction of additional alternative storage technologies, as supplements in the hybrid power plant’s layout. A typical case can be the introduction of a hydrogen production and storage plant, typically with electrolysis units [
4,
5,
8,
9], approaching, in this way, “green hydrogen” production. This approach can strengthen the economic and technical features of the plant, especially when the energy demand coverage in the transportation sector is examined, although the hydrogen production still exhibits high energy costs.
Another promising amendment, with regard to the classic wind–photovoltaic–battery configuration, is the introduction of a power production technology from biomass resources, such as solid biomass, biogas, or bio-methane [
1,
5,
10,
11,
12]. Such technologies, of course, are feasible in geographical regions rich in biomass resources, such as Egypt [
11] or Cameroon [
12] or the tropical climates in eastern Asia, and originate, most commonly, either from agriculture, livestock, or urban processes. The great asset that a biomass technology brings is guaranteed power production. Practically, the need to maintain thermal generators powered by fossil fuels as back-up units is eliminated, since this secure and guaranteed production is, by all means, undertaken by the biomass generators. The feasibility and the effectiveness of such systems is maximized when they are concurrently utilized for heat production, namely, as cogeneration plants. The heat can be supplied either for decentralized final usage in agricultural [
13] or the urban sector [
14] or through district heating networks for the heat demand coverage of a whole settlement, a neighborhood, or a community [
15,
16,
17]. In most cases, especially when there are considerable heating loads during the whole annual period, the economic feasibility of these systems is high, with the payback period of the corresponding investments in the range of 4–5 years [
16]. Additionally, these systems create new occupation opportunities and are characterized, in general, with high added value [
17].
Approaching larger power demand scales, while the potential power production technologies remain the same, the most popular and technically feasible storage technologies are based on mechanical storage, either in the form of static pressure or in the form of gravitational energy. More specifically, energy storage with the aforementioned two alternatives is achieved with well-known Compressed Air Energy Storage systems (CAES) [
18,
19,
20] and Pumped Hydro Storage systems (PHS) [
21,
22,
23].
PHS systems, in general, constitute the most technically feasible and economically competitive technology, with the most installations worldwide, compared to any other available energy storage technology. They offer large storage capacities, which can provide autonomous operation periods of several days, imposing, thus, high energy supply security, a crucial parameter especially for non-interconnected electrical grids. On the condition of available favorable land morphology, they can also exhibit a very low levelized setup cost, which can be as low as 30 EUR/kWh of storage capacity [
24,
25]. PHS systems have been widely studied and proposed for 100% full coverage of power demand in insular systems, offering security of supply and competitive production cost, even lower than 0.12 EUR/kWh [
26,
27,
28,
29]. The main drawbacks of PHS systems are their high budget, the requirement for specific favorable land morphology for adequate and cost-effective installation, and that they seem to be feasible for power demand higher than a minimum size (at the range of 5 MW). Additionally, they are not modular and flexible, such as the electrochemical storage devices.
In cases of no availability of favorable land morphology, such as in flat land terrains, or of low power demand, the alternative option of CAES can be introduced. The total efficiency of the storage cycle in CAES systems is in the range of 50% [
30,
31], while in PHS it can reach 70% [
32,
33]. This drawback is anticipated to be handled with the technology of adiabatic CAES, which, however, still faces major practical and technical issues regarding heat storage [
34,
35]. CAES are more flexible, they can be developed in small size (micro-CAES), and they do not require any specific land configurations. Micro-CAES can be a competitive option for small power demand scales [
18] or for specific remote power production, such as non-interconnected desalination plants [
20]. In these cases, micro-CAES can exhibit better economic features than electrochemical storage plants. On the other hand, it is not easy to develop CAES systems in the size of PHS systems, because of the required large storage capacities (in the range of hundreds of thousands of cubic meters) and at high pressures (which can be up to 70 bars). The only two so far implemented and operating CAES systems of a large size in Germany and in the USA utilize underground former salt mining caves as air storage tanks [
36].
The aforementioned plants and systems have been proposed and studied for a variety of applications, such as rural settlements [
5,
15,
37], non-interconnected islands [
25,
26,
28,
29,
36], decentralized consumptions, like desalination plants [
20,
38], agricultural uses [
13,
39], etc. Following these efforts, the present article investigates the optimum solution for the power demand coverage in a rural and non-interconnected Monastery from renewable energy production and storage technologies. No similar work was found in the relevant literature. The innovation of this work lies in the peculiarities met in monasteries, regarding both the energy demand, the available resources, and the restrictions regarding the conservation of the natural environment and their historical and architectural attitude. Additionally, new operation algorithms are proposed in this article for the alternatively examined layouts. Through an iterative optimization process, new results and insights are found. As a case study, the Greek Orthodox Monastery of Xenofontos, in Mount Athos, was selected.
2. Methodology and Data
This article alternatively examines two different syntheses of hybrid power plants for the coverage of small size, rural, and non-interconnected power demand. These two alternative layouts are as follows:
A hybrid power plant consisting of small wind turbines and a photovoltaic station, as the main power production units, a small PHS plant, as the storage unit, and a conventional diesel generator, as the back-up unit;
A hybrid power plant consisting of small wind turbines and a photovoltaic station, as the main power production units, lithium-ion batteries, as the storage unit, and a conventional diesel generator, as the back-up unit.
As it is conceivable, the only difference regarding the involved technologies between the two examined systems is the storage technology, which, in the first case, is a small-size PHS plant and, in the second case, is a cluster of lithium-ion batteries. However, as will be seen, this unique difference introduces considerable changes in the operation and the achieved results of the HPP.
Two different operation algorithms are developed for the two alternatively examined HPPs, imposed, practically, by the technical specifications and the economic features of the involved storage technology in each case: demand response, storage capacity, setup, and operation cost. The annual operation of each plant is computationally simulated, and according to the developed operation, algorithms and iterative executions are implemented for different sizing scenarios, aiming at the approach or even the achievement of real-time 100% coverage of the electricity demand through the whole annual period.
A fundamental economic analysis is implemented for both systems, which enables the calculation of some essential economic features, such as the setup cost, the maintenance cost, and the Levelized Cost Of Electricity (LCOE), which is also used as the sizing optimization criterion.
As a case study, as mentioned also in the previous section, the HPPs will be examined for the Monastery of Xenofontos, in Mount Athos. The annual power demand time series was developed given the power demand data captured from the existing power production and management system.
Additionally, the available RES potential was estimated from the available climate data in the European Centre for Medium-Range Weather Forecasts (ECMWF) and for the period 2000–2019 [
40] for a geographical point only 5.0 km away from the geographical location of the Monastery. All meteorological data were downloaded in the form of annual time series with hourly average values. These are used for all accomplished computational simulations and calculations.
As none of these plants have so far been implemented, the whole work is purely based on the computational simulation results and not on experimental or real operation data.
3. Power Demand and Meteorological Data
3.1. Power Demand
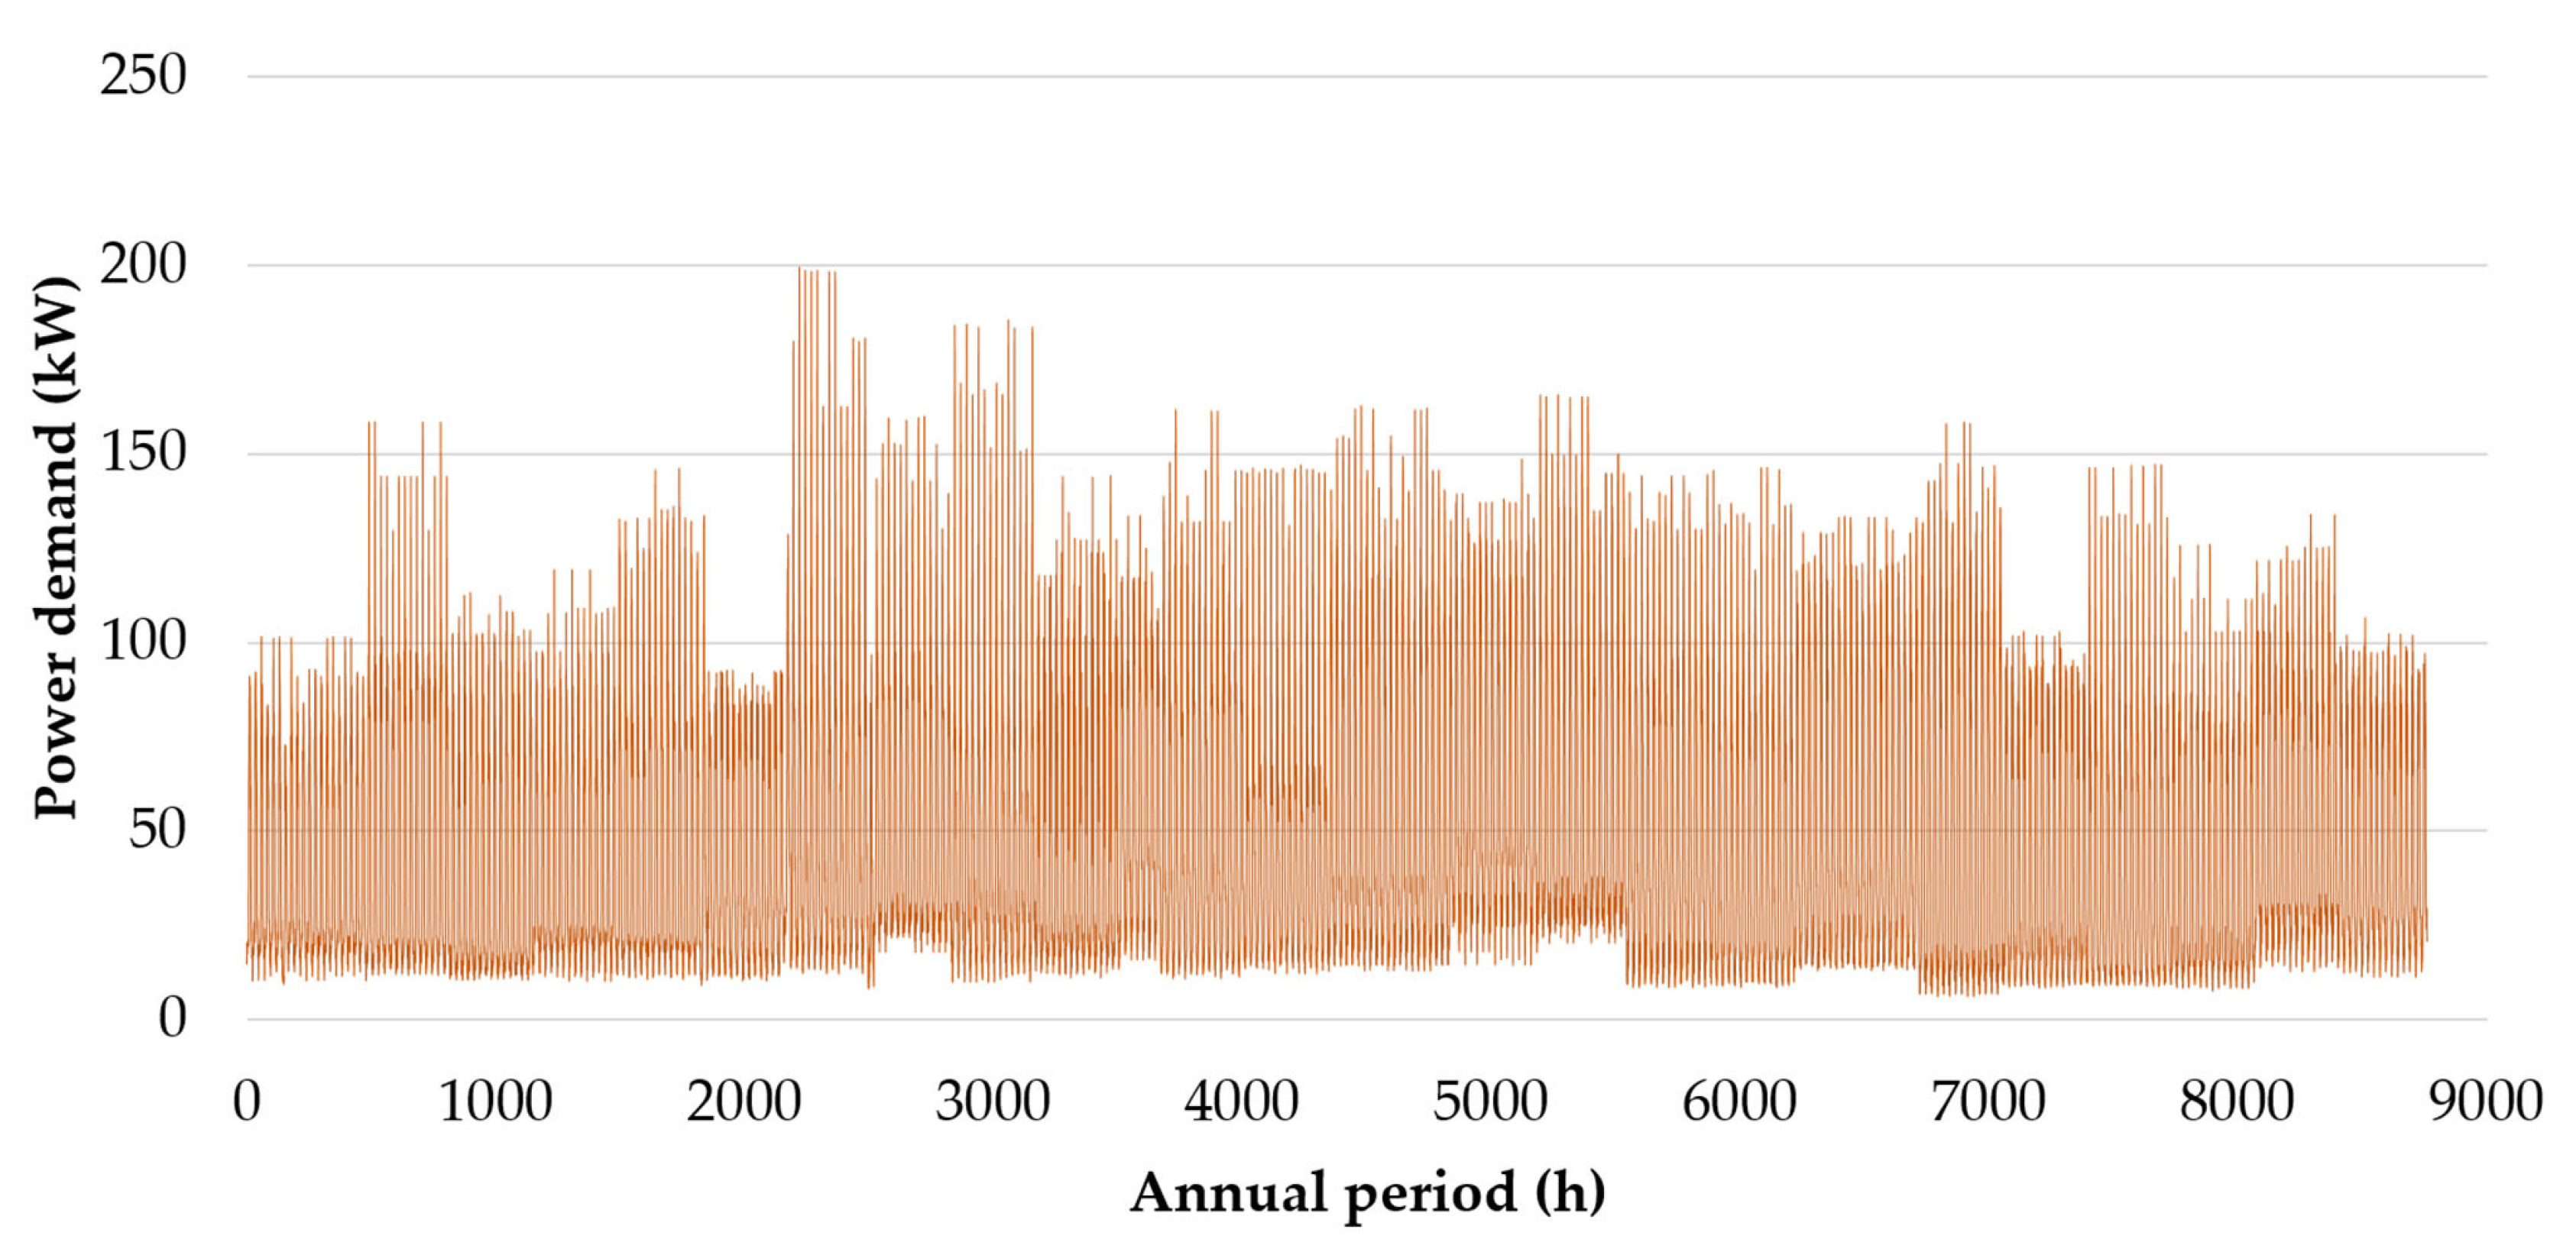
The Monastery is powered mainly by a diesel generator set, of 200 kW nominal power output, supported by a small photovoltaic plant of 150 kW and lead-acid batteries with total storage capacity of 50 kWh. Due to the installation of these technologies, an essential power production and storage management system has also been installed, through which typical power demand daily profiles are available, however only in graphical format and not in the form of a time series. Based on the available power demand daily profiles, the annual power demand time series of hourly average values was developed. Initially, power demand daily graphical profiles for every 15 days were digitized (in total, 24 for the annual period) so as to formulate the corresponding daily power demand time series, with hourly average values. The daily profiles were introduced in the correct time positions in a new annual time series power demand with hourly average values. The gaps between the introduced daily profiles were filled with new daily profiles, produced arithmetically, following a linear interpolation with weighted factors between two consecutive available digitized profiles, so as to ensure a smooth transition between them. Finally, given that the power demand exhibits a different profile on Sundays, additional Sunday daily profiles were digitized according to the captured data, and they were introduced for every 7 days in the developed annual power demand time series. In this way, the annual power demand time series with hourly average values presented in
Figure 1 was developed.
A monthly analysis of the annual power demand is given in
Table 1. The average daily consumption was calculated for every month by simply dividing the total electricity consumption per month by the number of each month’s days.
3.2. Meteorological Data
The available RES potential in the Monastery of Athos was estimated based on the climate conditions in the under-consideration geographical area. To this end, the available meteorological data were used from the ECMWF and for the period 2000–2019 [
40] for a geographical point only 5.0 km to the northeast of the Monastery. All meteorological data were downloaded in the form of annual time series with hourly average values.
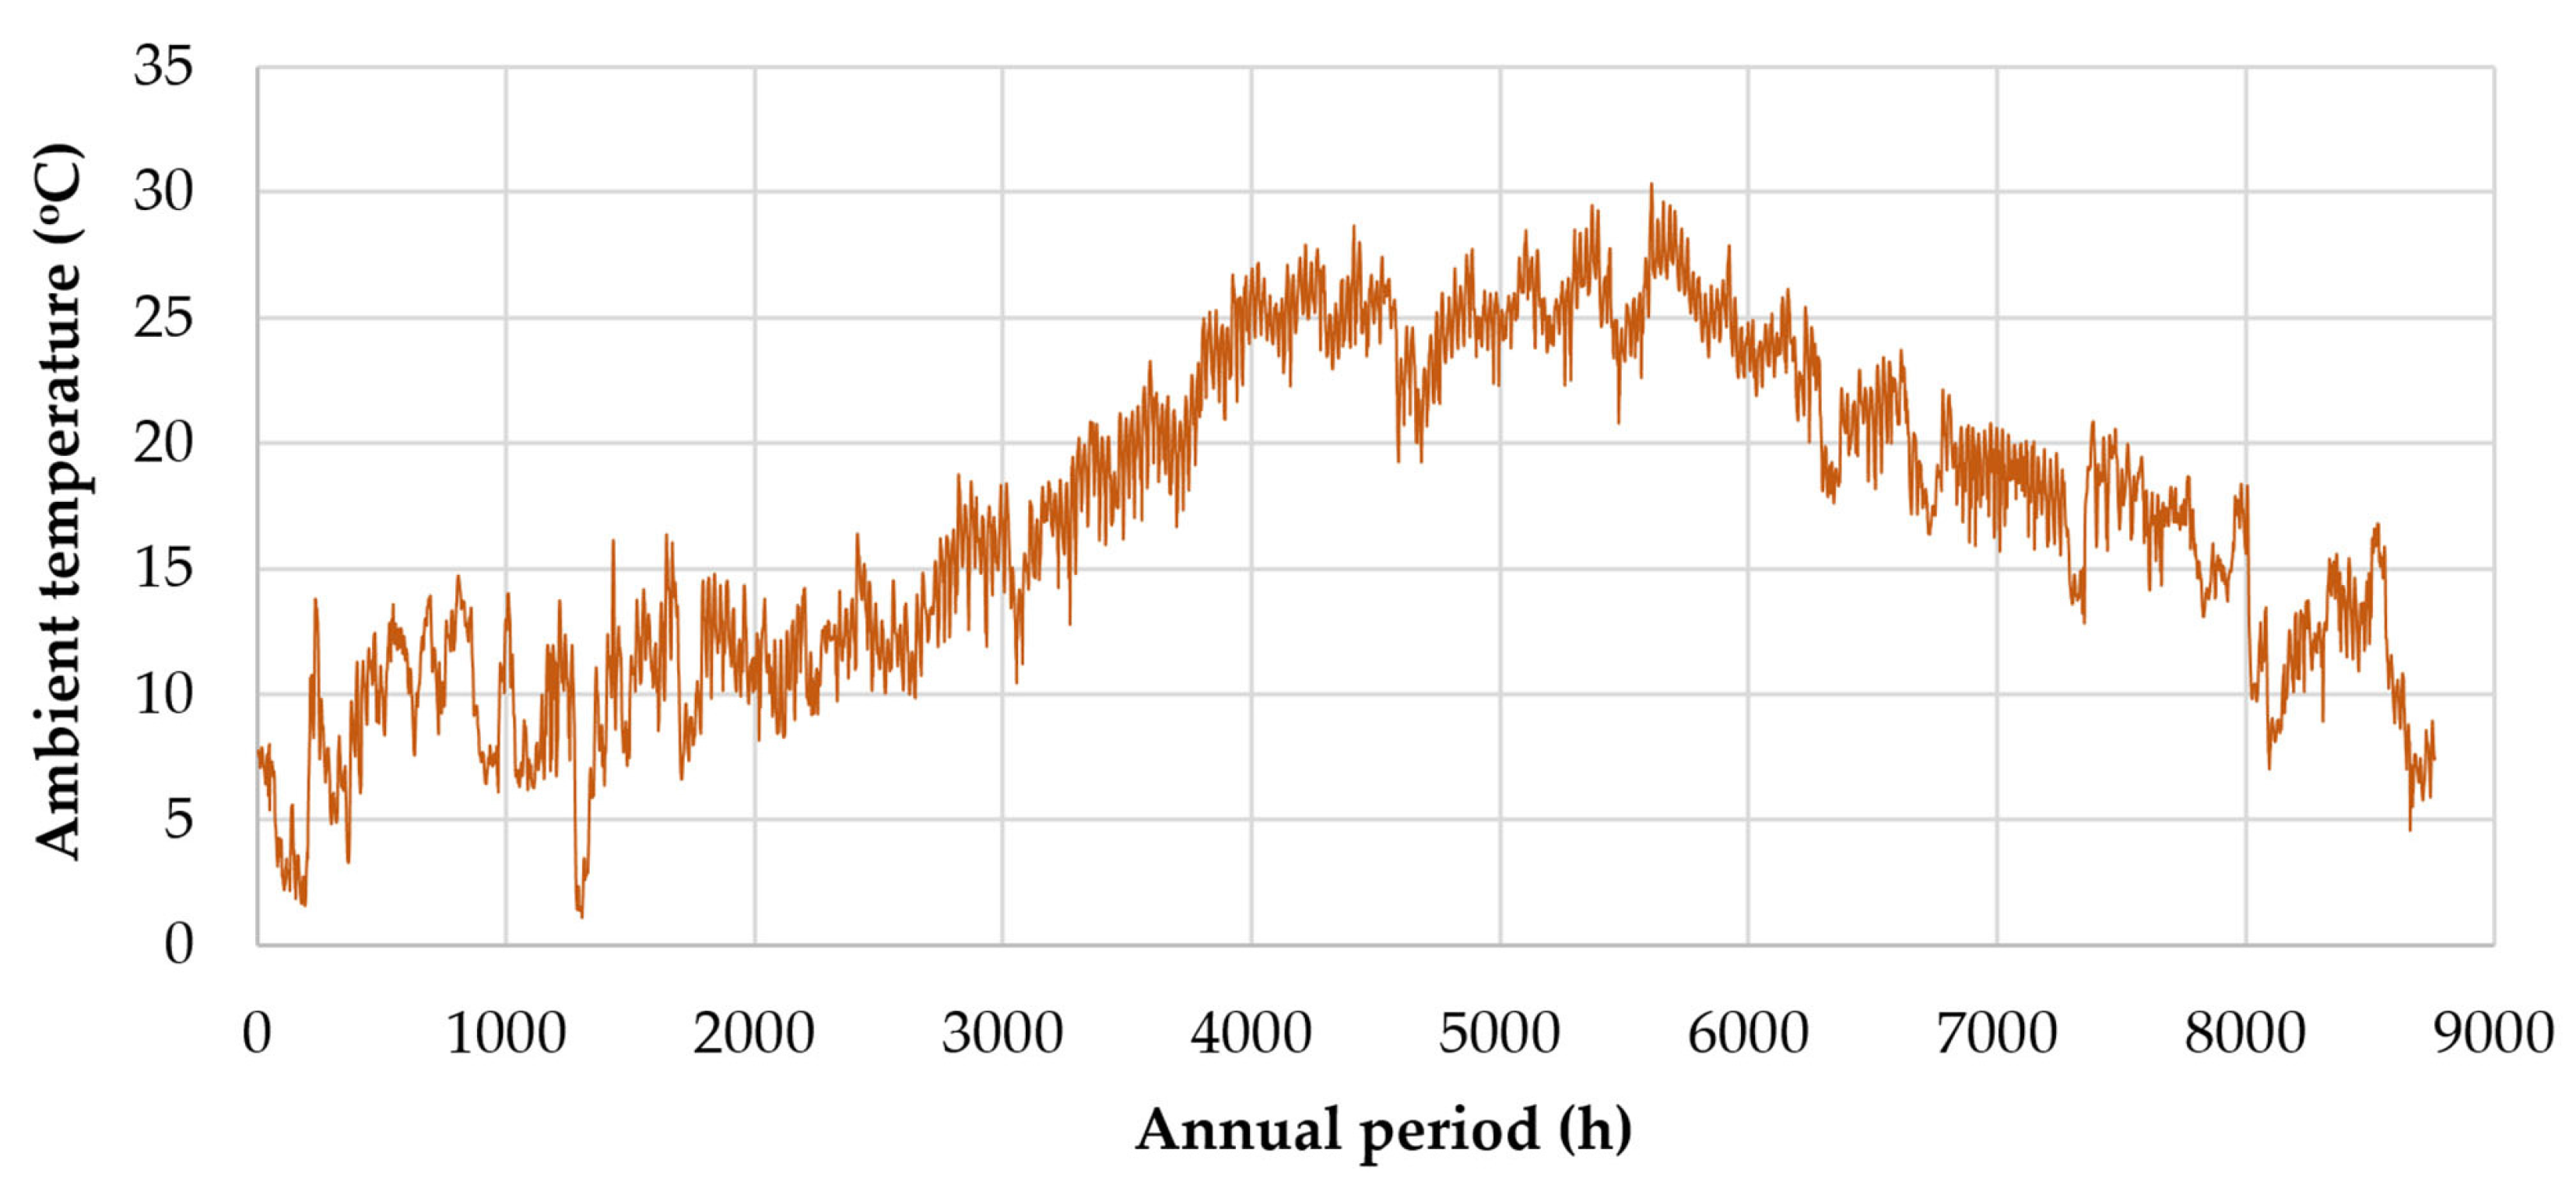
More specifically, in
Figure 2, the annual fluctuation of the ambient temperature is presented for the year 2019. This ambient temperature annual time series will be used for the calculation of the electrical power output from the photovoltaic plant.
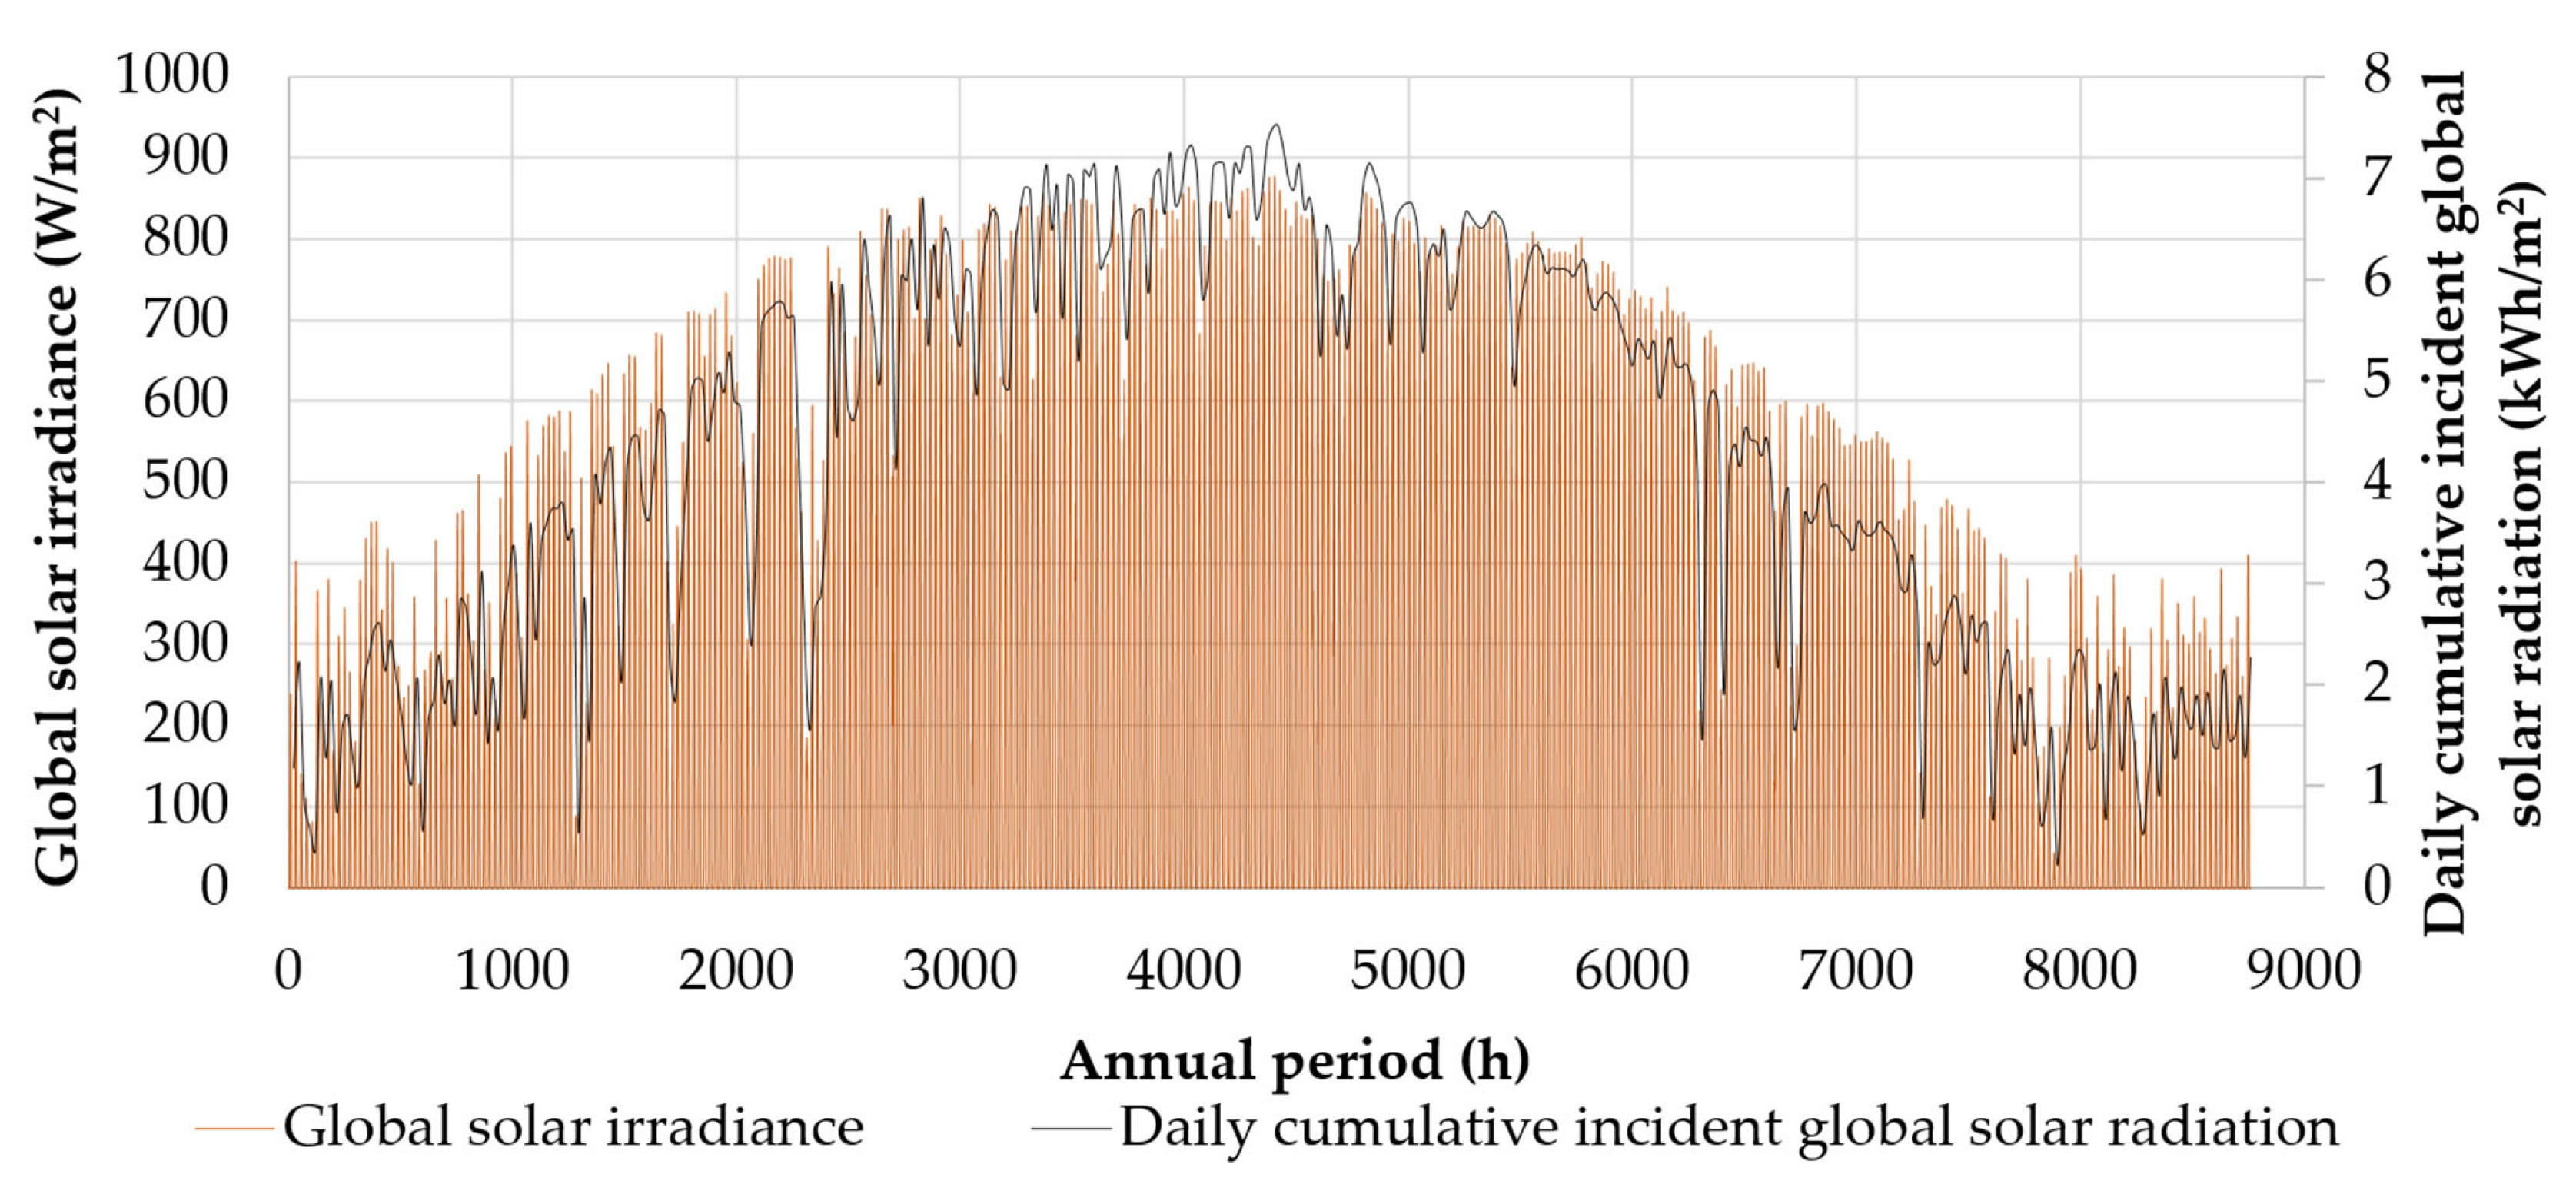
Similarly, in
Figure 3, the annual fluctuation of the incident solar irradiance on the horizontal plane and the daily cumulative solar radiation are also presented. This time series will also be used for the calculation of the electrical power output from the photovoltaic plant.
Additionally, in
Figure 4, the fluctuation through the 20-year measurement period of the annual maximum solar incident irradiance and the annual cumulative incident solar radiation on the horizontal plane is also presented. The minimum and the maximum annual cumulative incident solar radiation on the horizontal plane are calculated equal to 1499 kWh/m
2 and 1592 kWh/m
2 for the years 2002 and 2007, respectively.
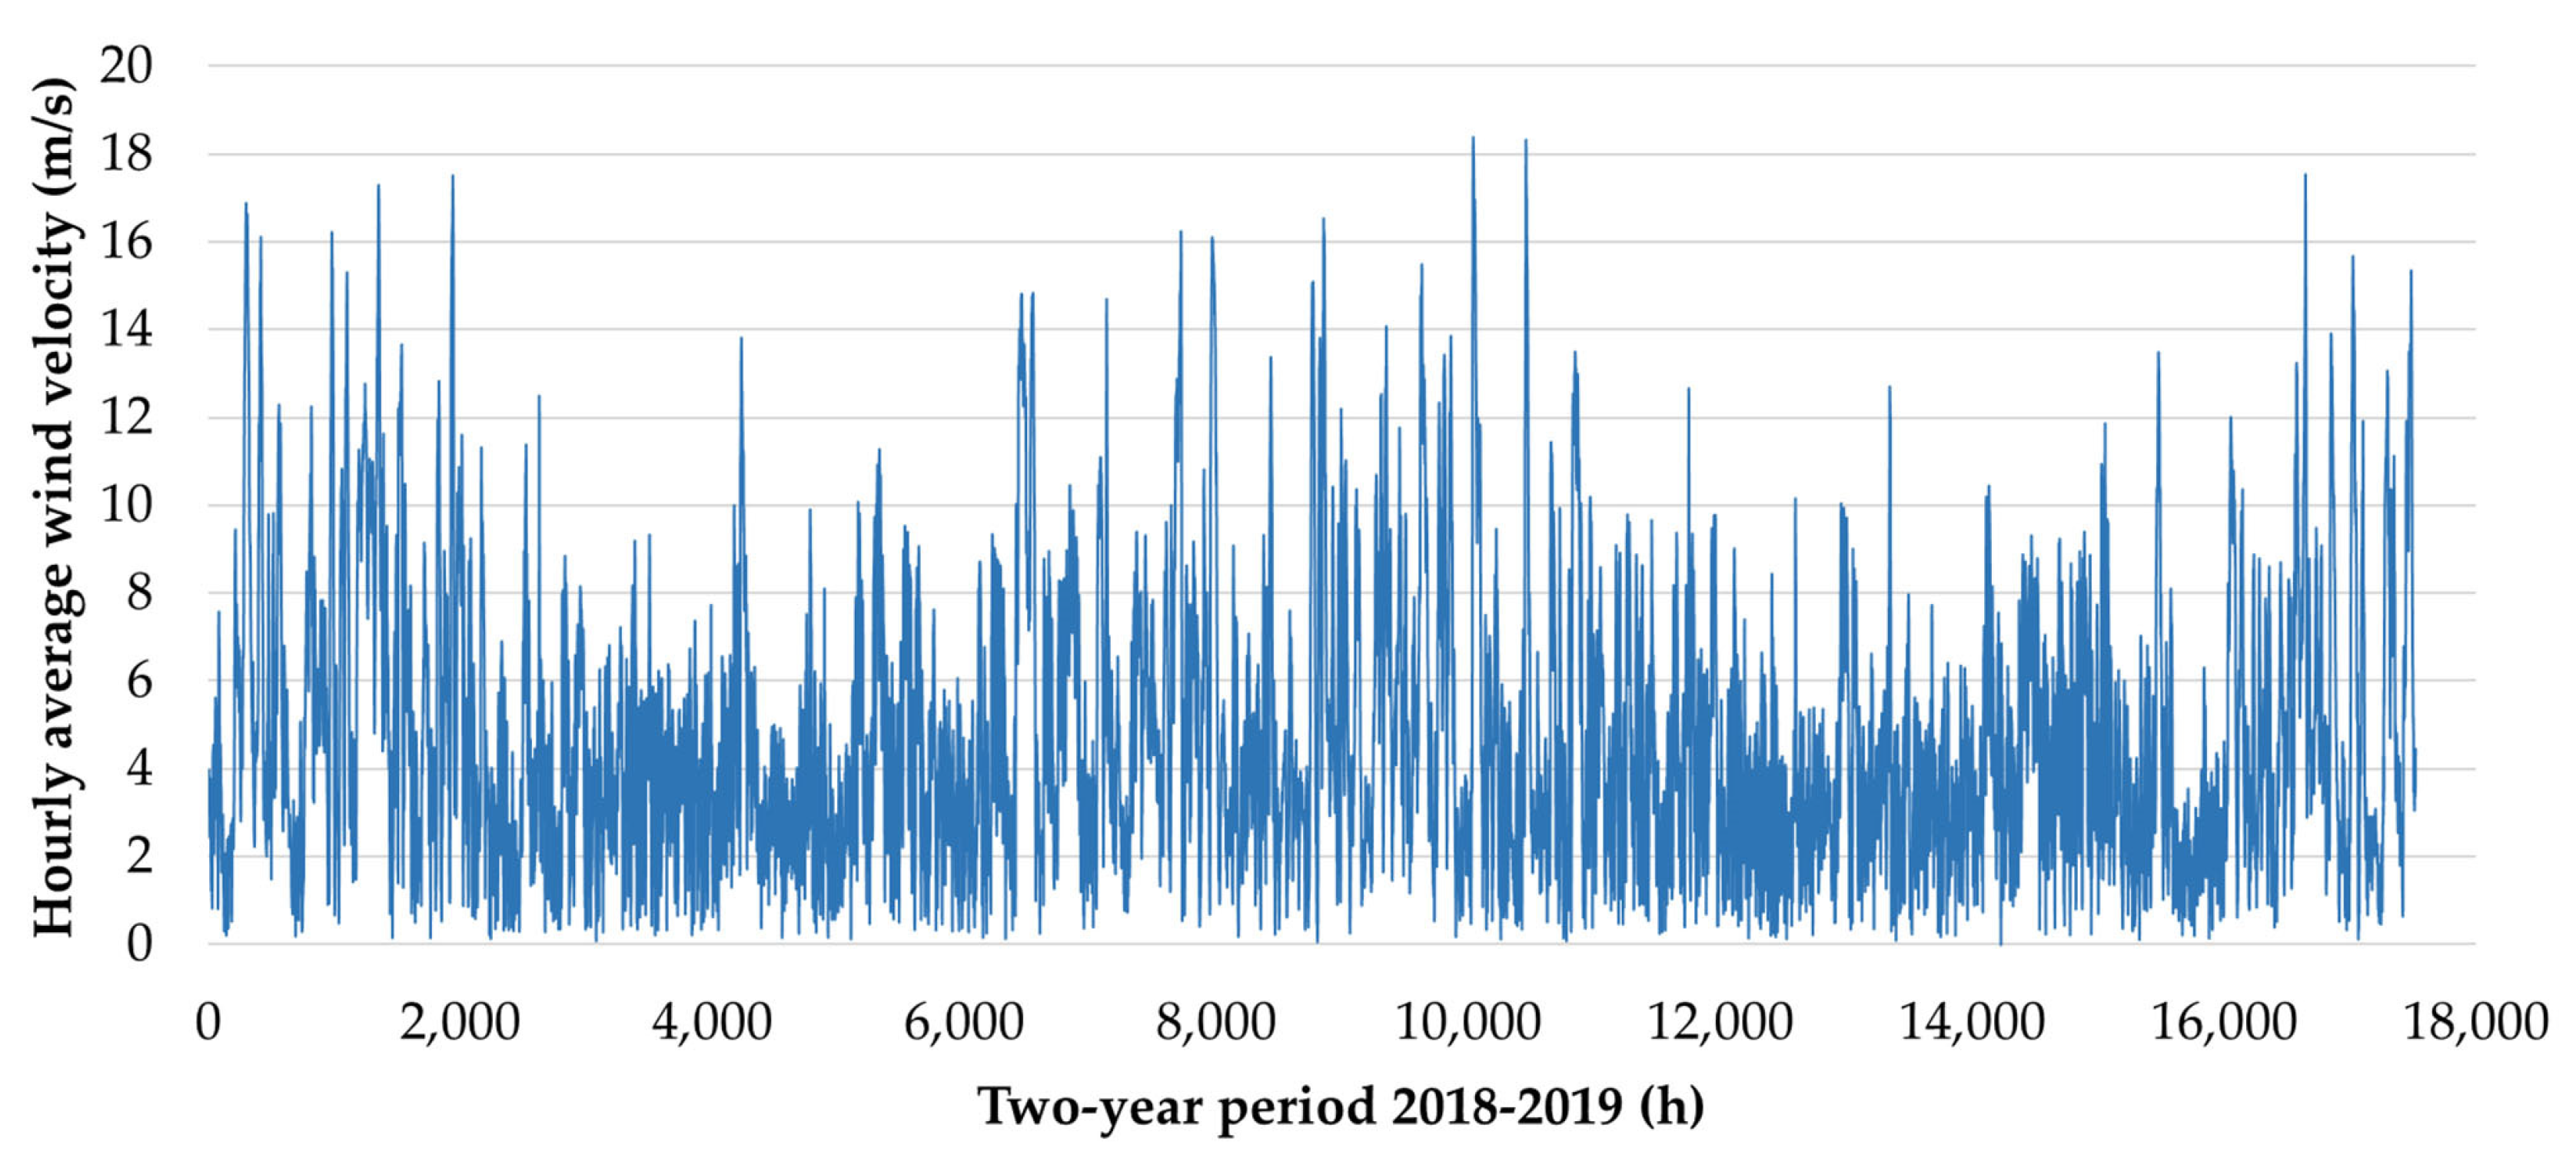
Finally, in
Figure 5, the fluctuation of the wind velocity at 10 m height above ground is presented for the two consecutive years 2018 and 2019. The replication of the annual wind velocity profile is clear in this graph. The wind velocity annual time series for the year 2019 will be used for the calculation of the power production from the wind turbines. The annual average wind velocity for the 20-year measurement period is calculated equal to 4.2 m/s (minimum value) in 2000 to 4.9 m/s (maximum value) in 2012. In 2019, it was calculated at 4.5 m/s, close to the 20-year average value, which is 4.6 m/s.
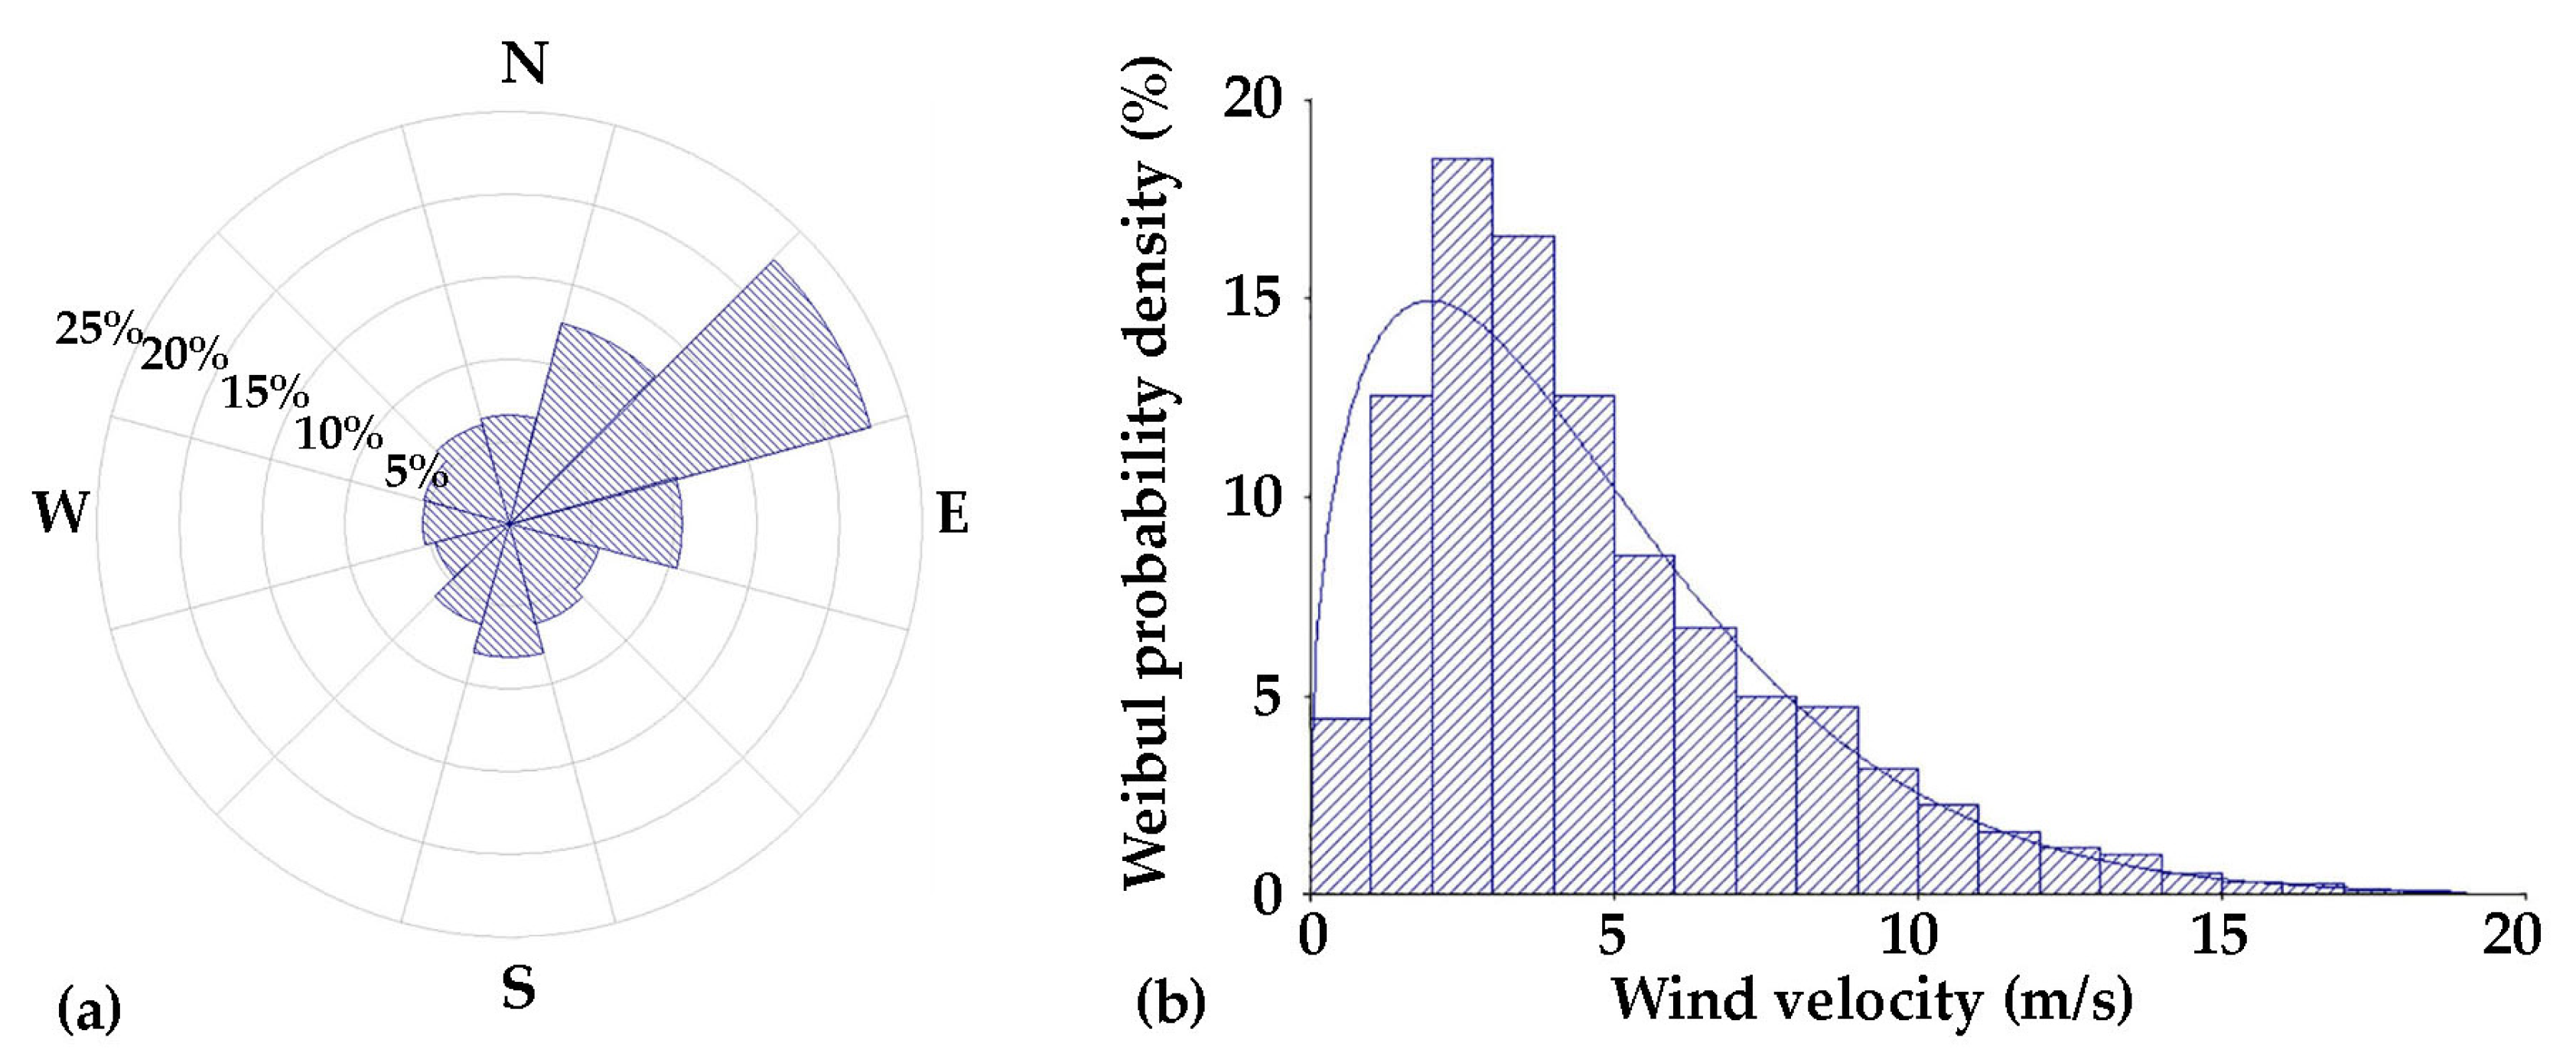
Additionally, in
Figure 6, the wind velocity annual wind rose graph, and the corresponding Weibull probability density graph is also given [
41]. The wind rose graph shows a wind blowing prevailing direction from the northeast. Both graphs are given for the year 2019. The Weibul C and k parameters are calculated equal to 4.9 m/s and 1.39, respectively.
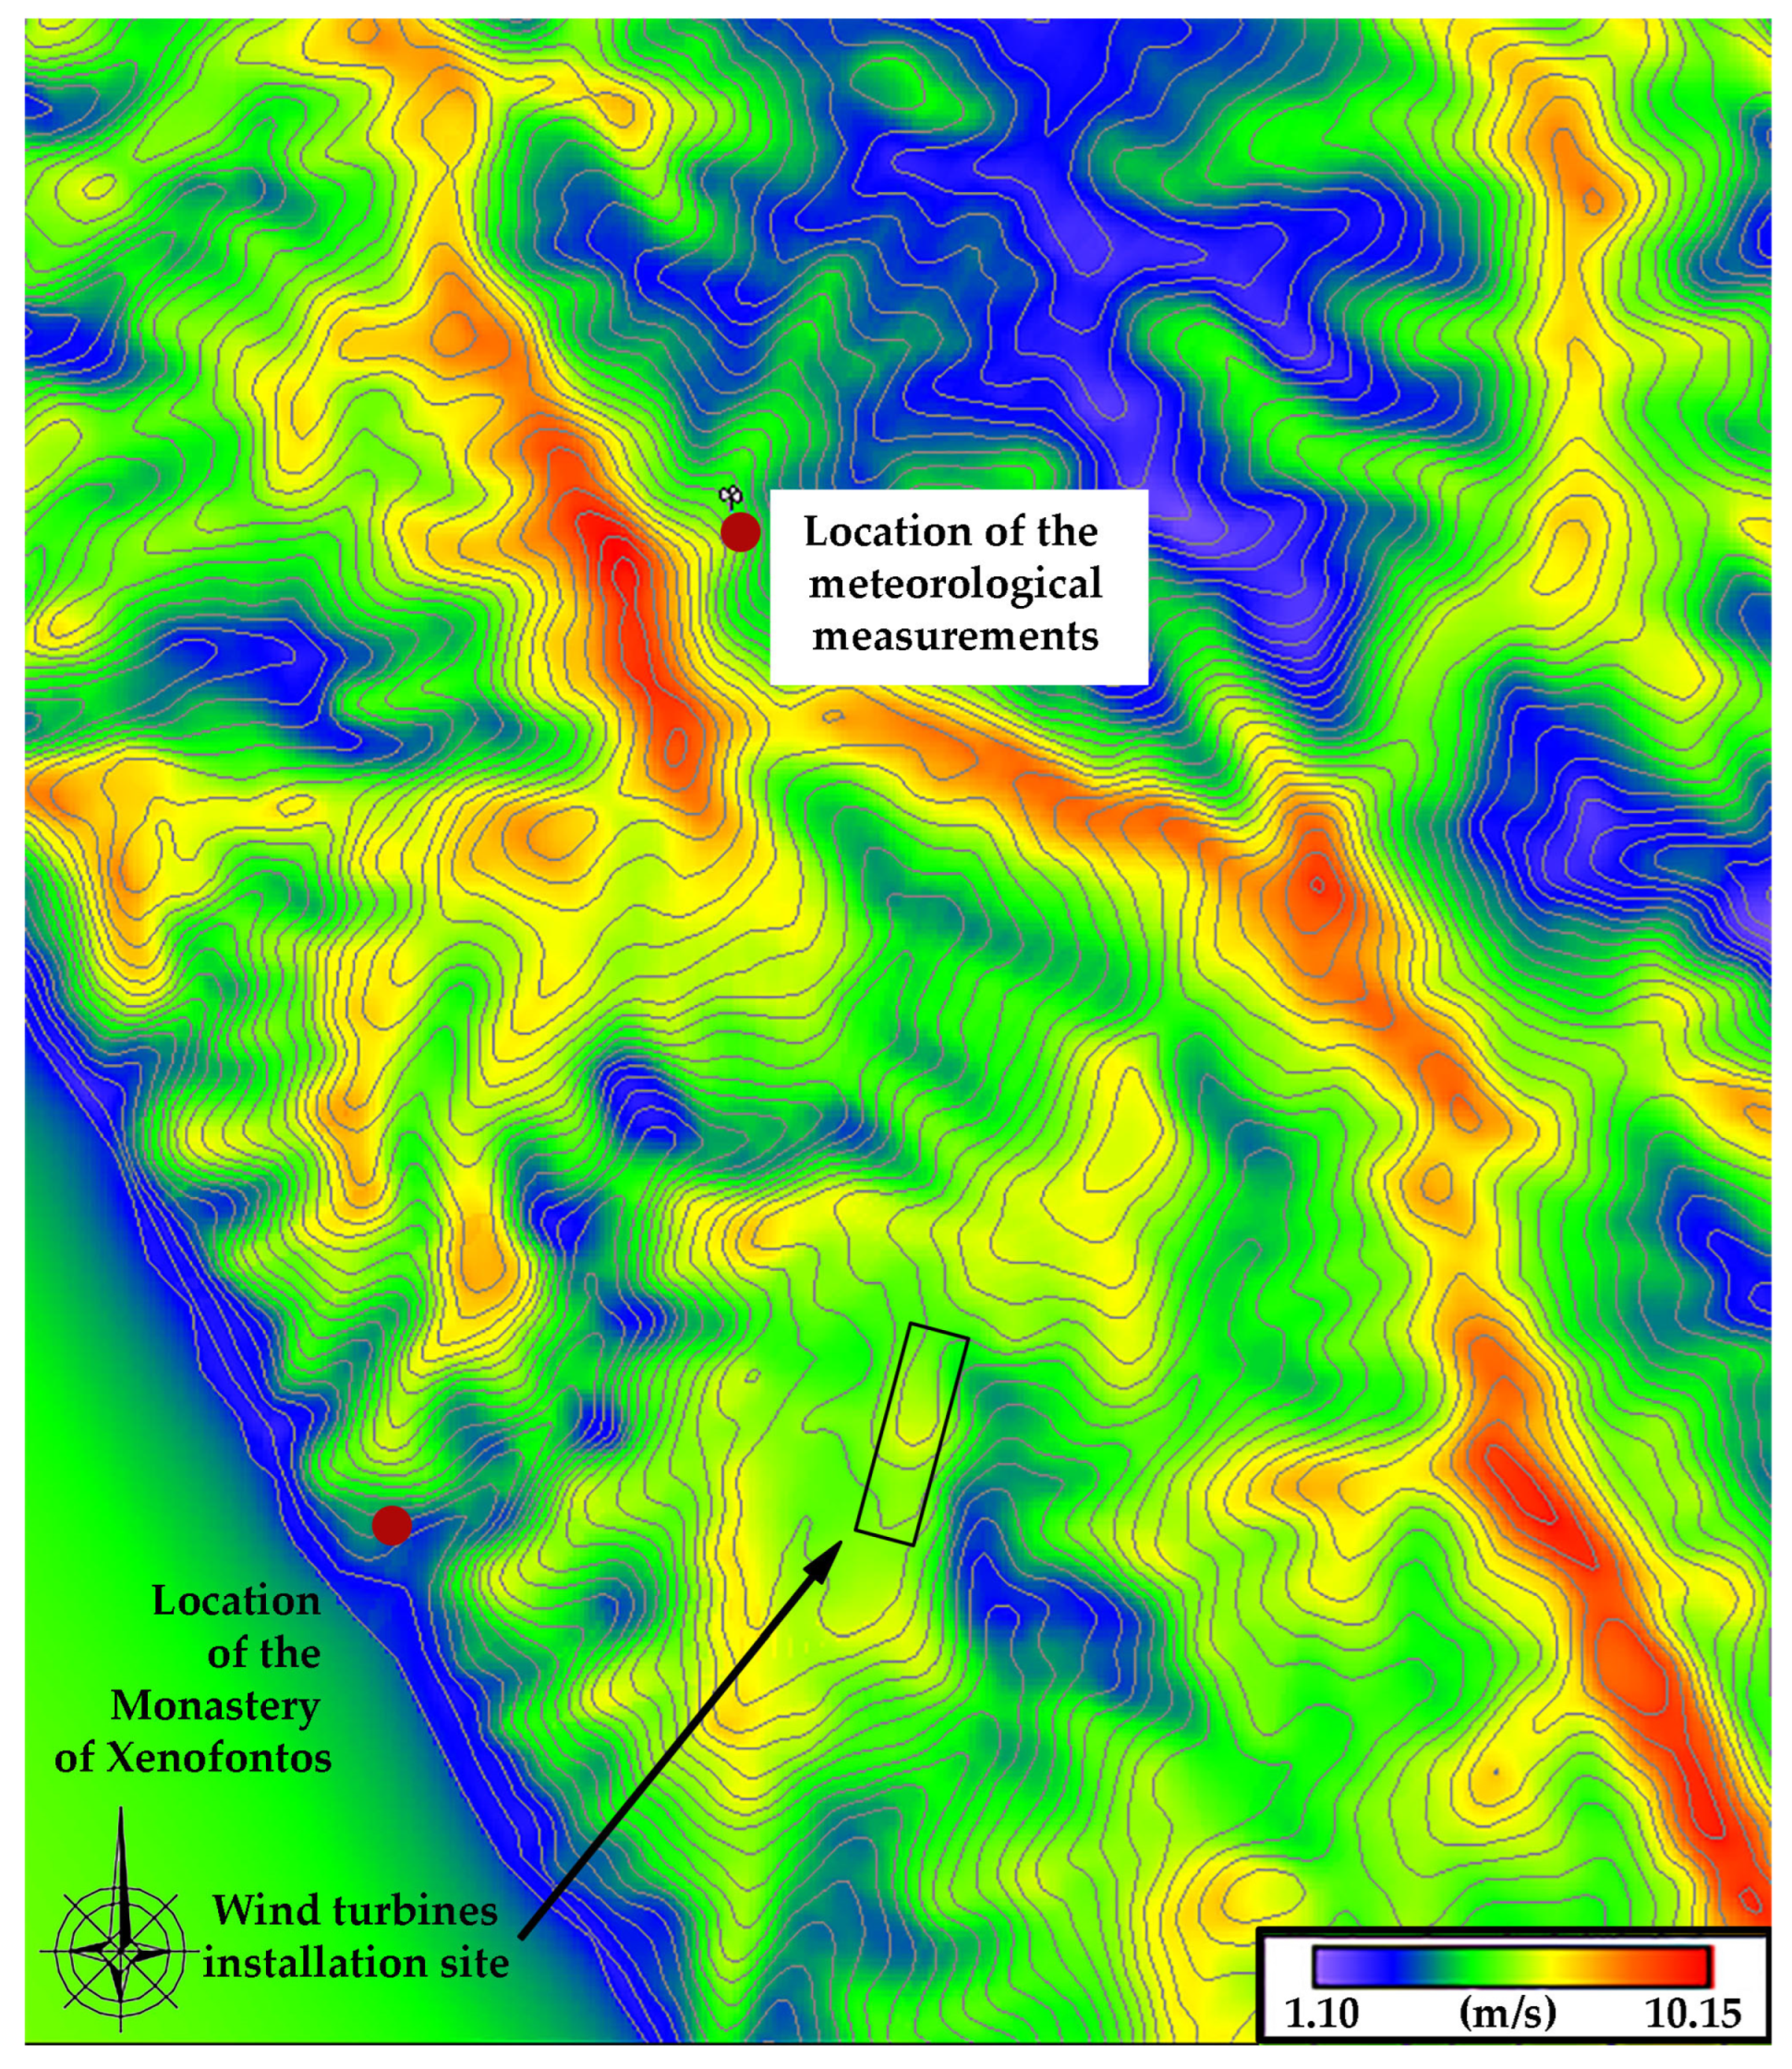
Finally, in
Figure 7, the wind potential map at the under-consideration geographical area is depicted versus the annual average wind potential.
The map was developed with the widely acknowledged application of WAsP of the Denmark Technical University [
42]. To this end, the land terrain at the specific area was digitized and introduced in the application, together with the annual wind potential measurements. In the same figure, the location of the meteorological measurements station and the selected site for the wind turbine installations are also depicted, showing their vicinity (distance approximately close to 4.5 km).
4. Layouts and Operation Algorithms
The operation algorithms for the two alternative hybrid power plants are presented in this section. Both algorithms are executed for every time calculation step, namely, for every hour, given that the introduced annual time series are formulated with hourly average values.
4.1. The Hybrid Power Plant with the PHS System
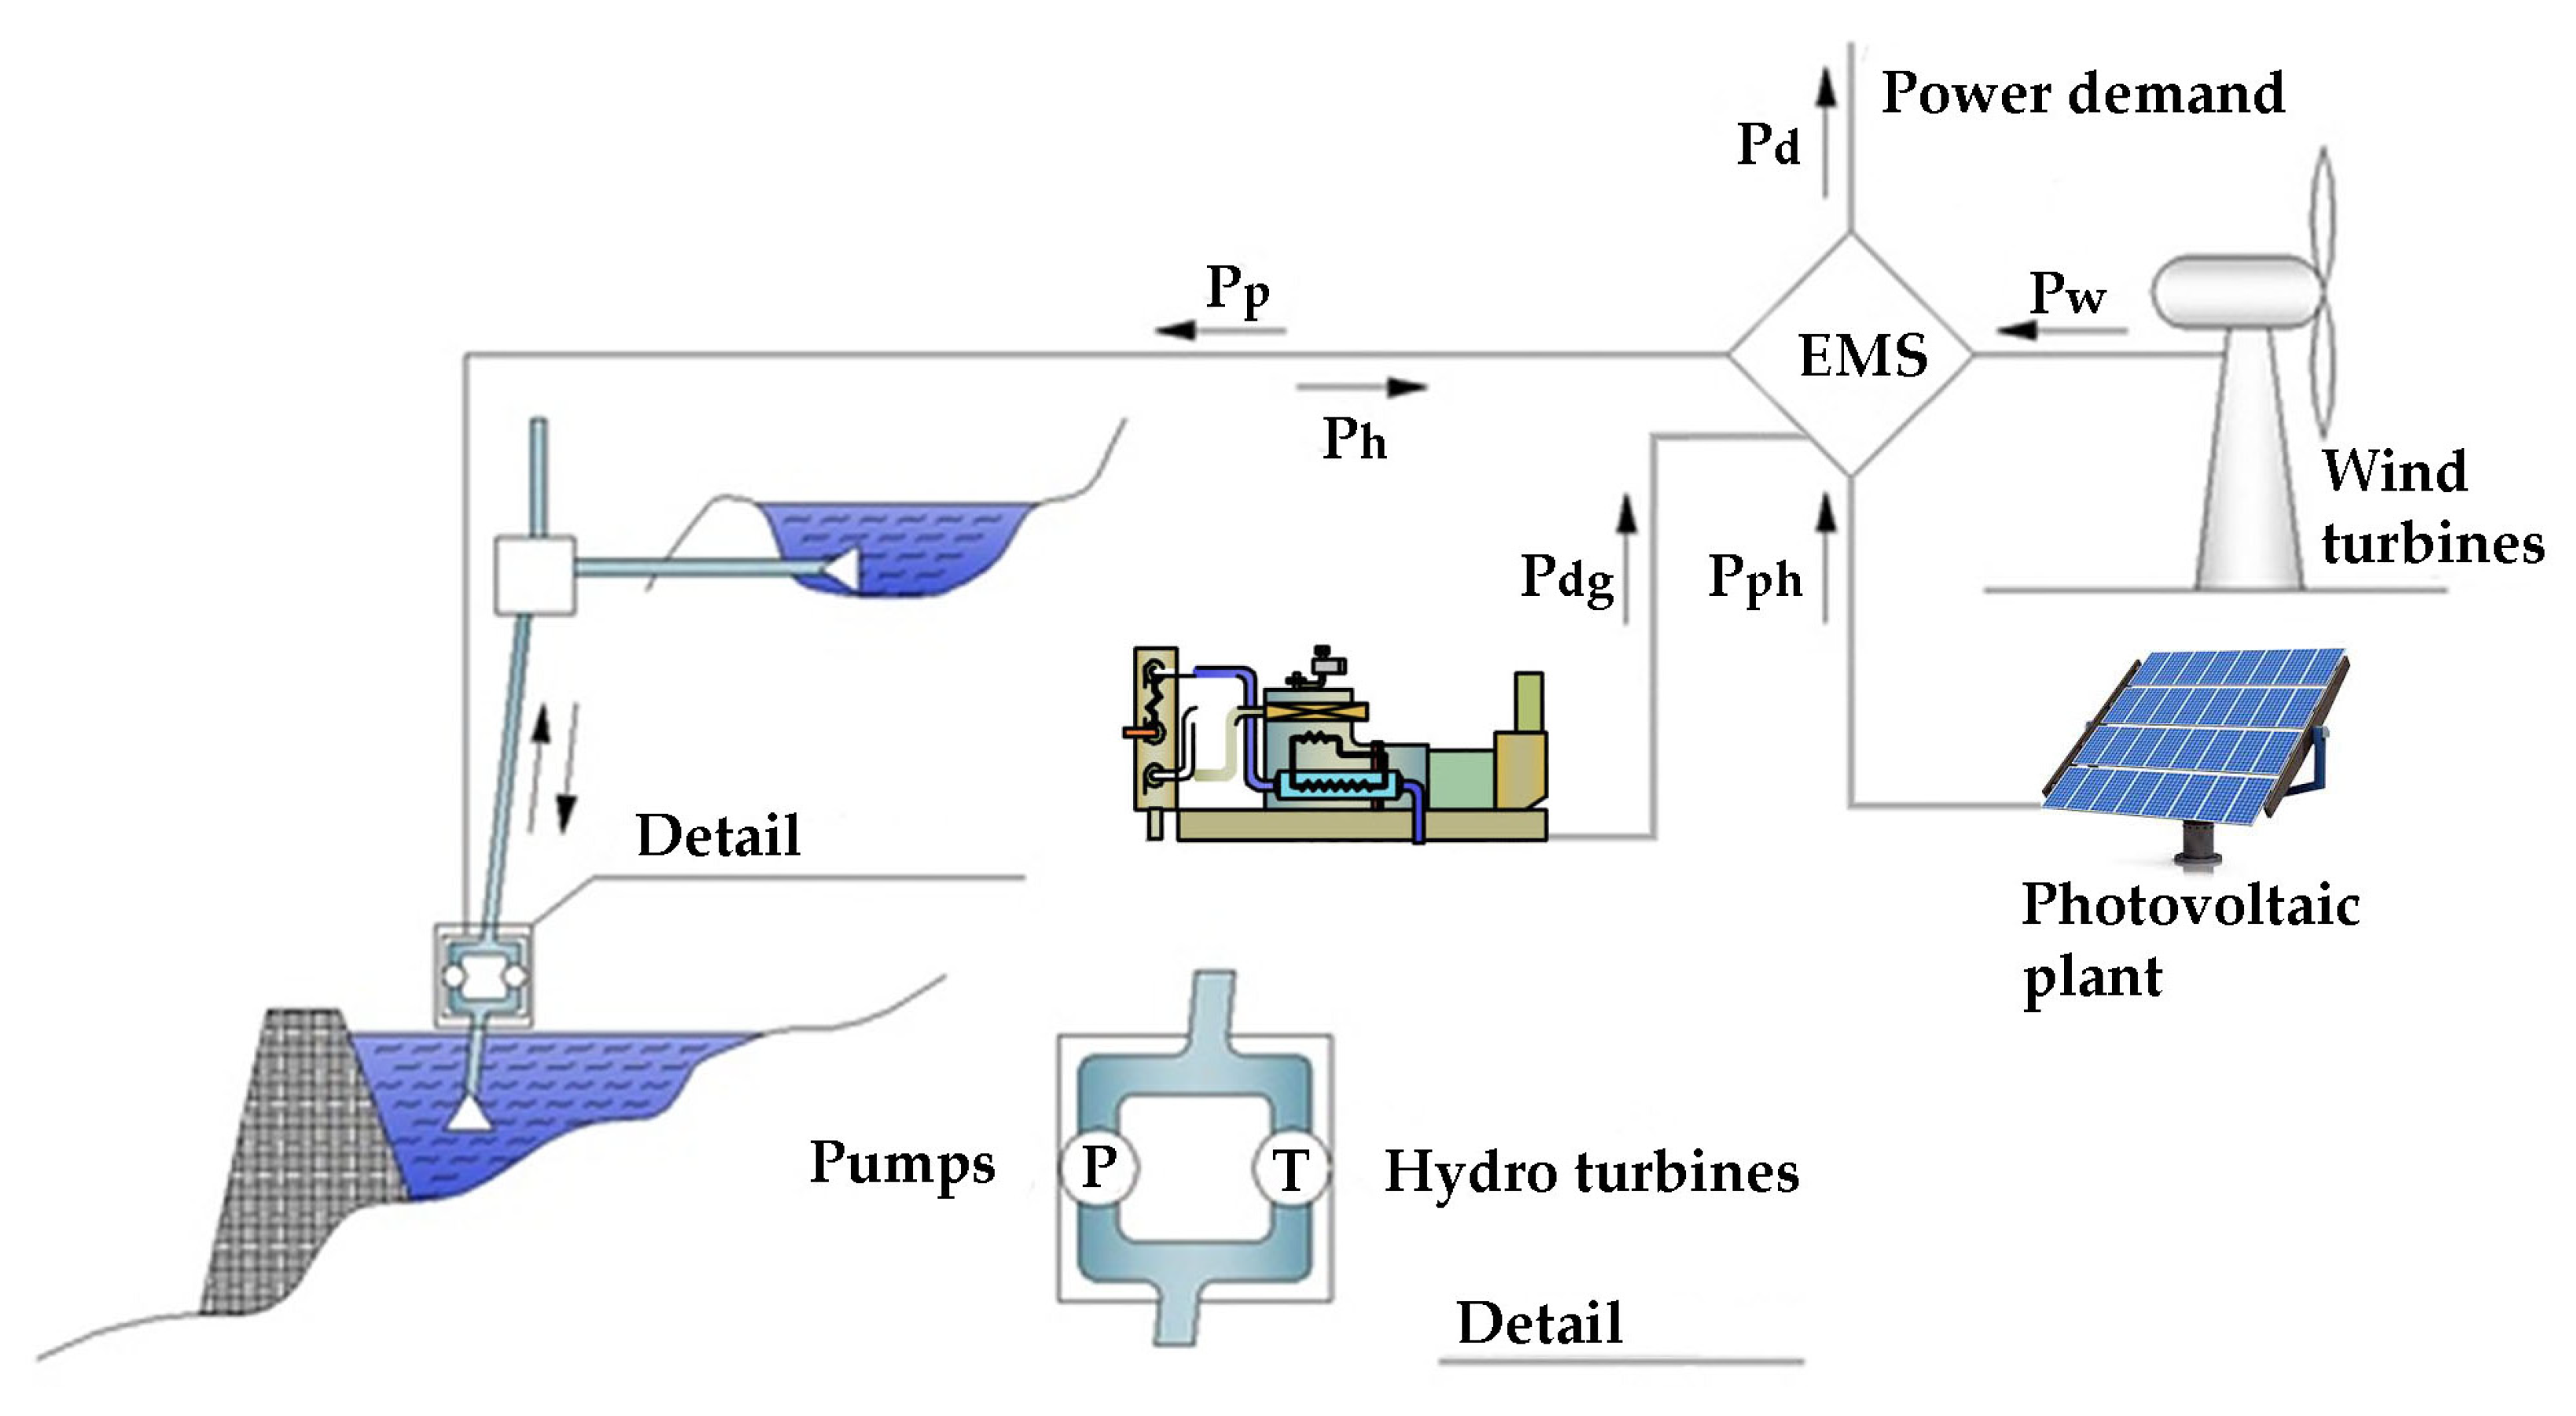
The layout of the first examined system is depicted in
Figure 8. It consists of small wind turbines, a photovoltaic plant, and a PHS system as a storage plant. It will be also supported by a conventional diesel generator as the back-up unit. An Energy Management System (EMS) will undertake the implementation of the operation algorithm as presented below:
The operation algorithm of this HPP is analyzed in the following steps:
For every time calculation step j, the total power production Pw and Ppv from the wind turbines and the photovoltaic plant is introduced, as well as the power demand Pd. The total power production from the RES technologies PRES will be
- 2.
For security reasons, the wind power production is always supplied for power storage, namely, it cannot be used for direct power demand coverage. The total direct penetration P
RESp from the photovoltaic plant is restricted at 50% of the current power demand, for dynamic security and stability reasons. In general, this percentage has been found to be from 30% to 50% for secure RES penetration in electrical systems [
43,
44,
45]. In this case, given the fast response of hydro turbines, the percentage of 50% was selected. This means that
- 3.
The remaining power demand Pdrem, after the photovoltaic power penetration, will be equal to
- 4.
The available power for storage PRESav is equal to
- 5.
The required water volume VP that must be pumped in the PHS upper reservoir in order to store the available power PRESav for the duration t of the time calculation step is given by the following relationship (γ the specific weight of water, HP the total pump head and ηP the average, overall pumps’ efficiency):
- 6.
The required water volume VT that must be removed from the PHS upper reservoir is calculated, so that the remaining power demand Pdrem can be covered by the hydro turbines for the duration t of the time calculation step (Hh the total water falling head and ηh hydro turbines’ average, overall efficiency):
- 7.
The remaining water volume in the PHS upper reservoir at the end of the time step j will be
- 8.
The remaining water volume Vst(j) is checked whether it exceeds or not the maximum volume storage capacity Vmax of the upper reservoir, and the following cases are distinguished:
- a.
If V
st(j) > V
max, then the available power for storage P
RESav from the RES units cannot be fully stored. The absorbed power P
st for storage will be defined by the available margin for water storage in the upper reservoir, namely:
The produced power surplus P
sur from the RES units will be
Given the fact that the upper reservoir is full, the water volume in the reservoir will be adequate for the full coverage of the remaining power demand P
drem from the hydro turbines. Hence, the hydro turbines’ produced power will be
The power production P
dg from the diesel generator will be equal to zero:
The remaining water volume in the PHS upper reservoir at the end of the current time calculation step will obviously be equal to V
max:
- b.
If V
st(j) ≤ V
max, then the available power for storage P
RESav from the RES units will be fully stored. The absorbed power P
st for storage will be equal to
4.2. The Hybrid Power Plant with the Lithium-Ion Batteries
The layout of the second examined system is depicted in
Figure 9. It consists of small wind turbines, a photovoltaic plant, and a cluster of lithium-ion batteries (Li-ion) as a storage plant. It will be also supported by a diesel generator as the back-up unit. The operation of the system will be accomplished by the inverter’s control system and the operation controller of the diesel generator.
The operation algorithm of this second examined plant is analyzed in the following steps:
For every time calculation step j, the total power production P
w and P
pv from the wind turbines and the photovoltaic plant is introduced, as well as the power demand P
d. The total power production from the RES technologies P
RES will be
- 2.
The photovoltaic power penetration can reach 100% of the current power demand, due to the smoother power production profile, with regard to the wind turbines, and the system’s management from the inverters’ power electronics, which enable direct reaction to any potential disturbance in the production system. Hence, as a first step, the photovoltaic power production Ppv is compared to the power demand Pd:
- a.
If P
pv < P
d, then all the available power production from the photovoltaic plant is supplied for the power demand coverage. The photovoltaic power direct penetration P
pv-p will be equal to
Unlike the photovoltaic plant, the wind turbines’ direct penetration is restricted up to a maximum penetration percentage with regard to the current power demand, which is defined at 50% in this study. The wind power production Pw is compared to the remaining power demand, after the photovoltaics’ penetration:
If P
w < 0.50∙(P
d − P
pv-p), then all the available wind power production can be fully absorbed for direct power demand coverage; hence, the wind power direct penetration P
wp will be
If P
w ≥ 0.50∙(P
d − P
pv-p), the available wind power production exceeds the margin for direct wind power penetration, so the wind power penetration will be restricted according to the maximum allowed percentage:
- b.
If Ppv ≥ Pd, then all the current power demand can be fully covered by the photovoltaic production. The direct photovoltaic penetration will be
- 3.
Assuming that the remaining power demand Pdrem will be fully covered by the storage plant and the available power for storage PRESav will be fully stored, the new storage energy Est(j) in the batteries at the end of the current time calculation step with duration t will be
where
Εst(j − 1): the energy stored in the batteries at the end of the previous time step j − 1;
t: the duration of the time calculation step (1 h);
ηst: the charging efficiency of the batteries;
ηdis: the discharging efficiency of the batteries.
- 4.
The following cases are distinguished:
- a.
If Ε
st(j) > E
st-max, where E
st-max is the maximum total storage capacity of the batteries, then the available storage margin in the batteries is not enough for the full storage of the available power P
RESav. In that case, the stored power P
st will be defined by the available storage margin, namely, it will be
Obviously, due to the batteries’ full storage level, the remaining power demand will be fully covered by them; hence, the batteries’ power production Pbat will be
- b.
If Ε
st(j) ≤ E
st-max, then the available storage margin in the batteries is adequate for the full storage of the available power P
RESav; hence, the stored power will be
The RES power production surplus is null:
Additionally, it is further investigated if the energy storage level Εst(j) at the end of the current time calculation step j is lower than their minimum charge level Est-min. Specifically, the following two sub-cases are distinguished:
If Ε
st(j) < E
st-min, then the available stored energy in the batteries from the previous time step Ε
st(j − 1) is not adequate for the full coverage of the remaining power demand. The power production from the batteries will be
The diesel generator production will be
Apparently, the batteries’ new charge level will be equal to their lowest charge level:
- ii.
If Εst(j) ≥ Est-min, then the available stored energy is enough for the full coverage of the remaining power demand. The batteries’ power production will be given by the relationship 3).
- 5.
For the aforementioned cases:
The batteries’ charge rate P
st-bat will be
The batteries’ discharge rate P
dis-bat will be
5. Assumptions, Technical Features, and Economic Parameters
5.1. Technical Features
In the aforementioned algorithms, the power production from the photovoltaics and the wind turbines are involved. The power production from the photovoltaics is calculated following the essential methodology described in the relevant literature [
46], together with the essential theory of solar geometry and solar radiation, which will lead to the calculation of the incident solar irradiance on the photovoltaic panels [
47]. The required data are the incident solar irradiance on the horizontal plane (
Figure 3), the ambient temperature (
Figure 2), the wind velocity (
Figure 5), and the photovoltaic panels’ installation inclination versus the horizontal plane. The panels will be installed with a southern orientation. Following an iterative calculation process, summarized in
Table 2, it is found that for the specific geographical location, the annual cumulative incident solar radiation is maximized for 30° inclination.
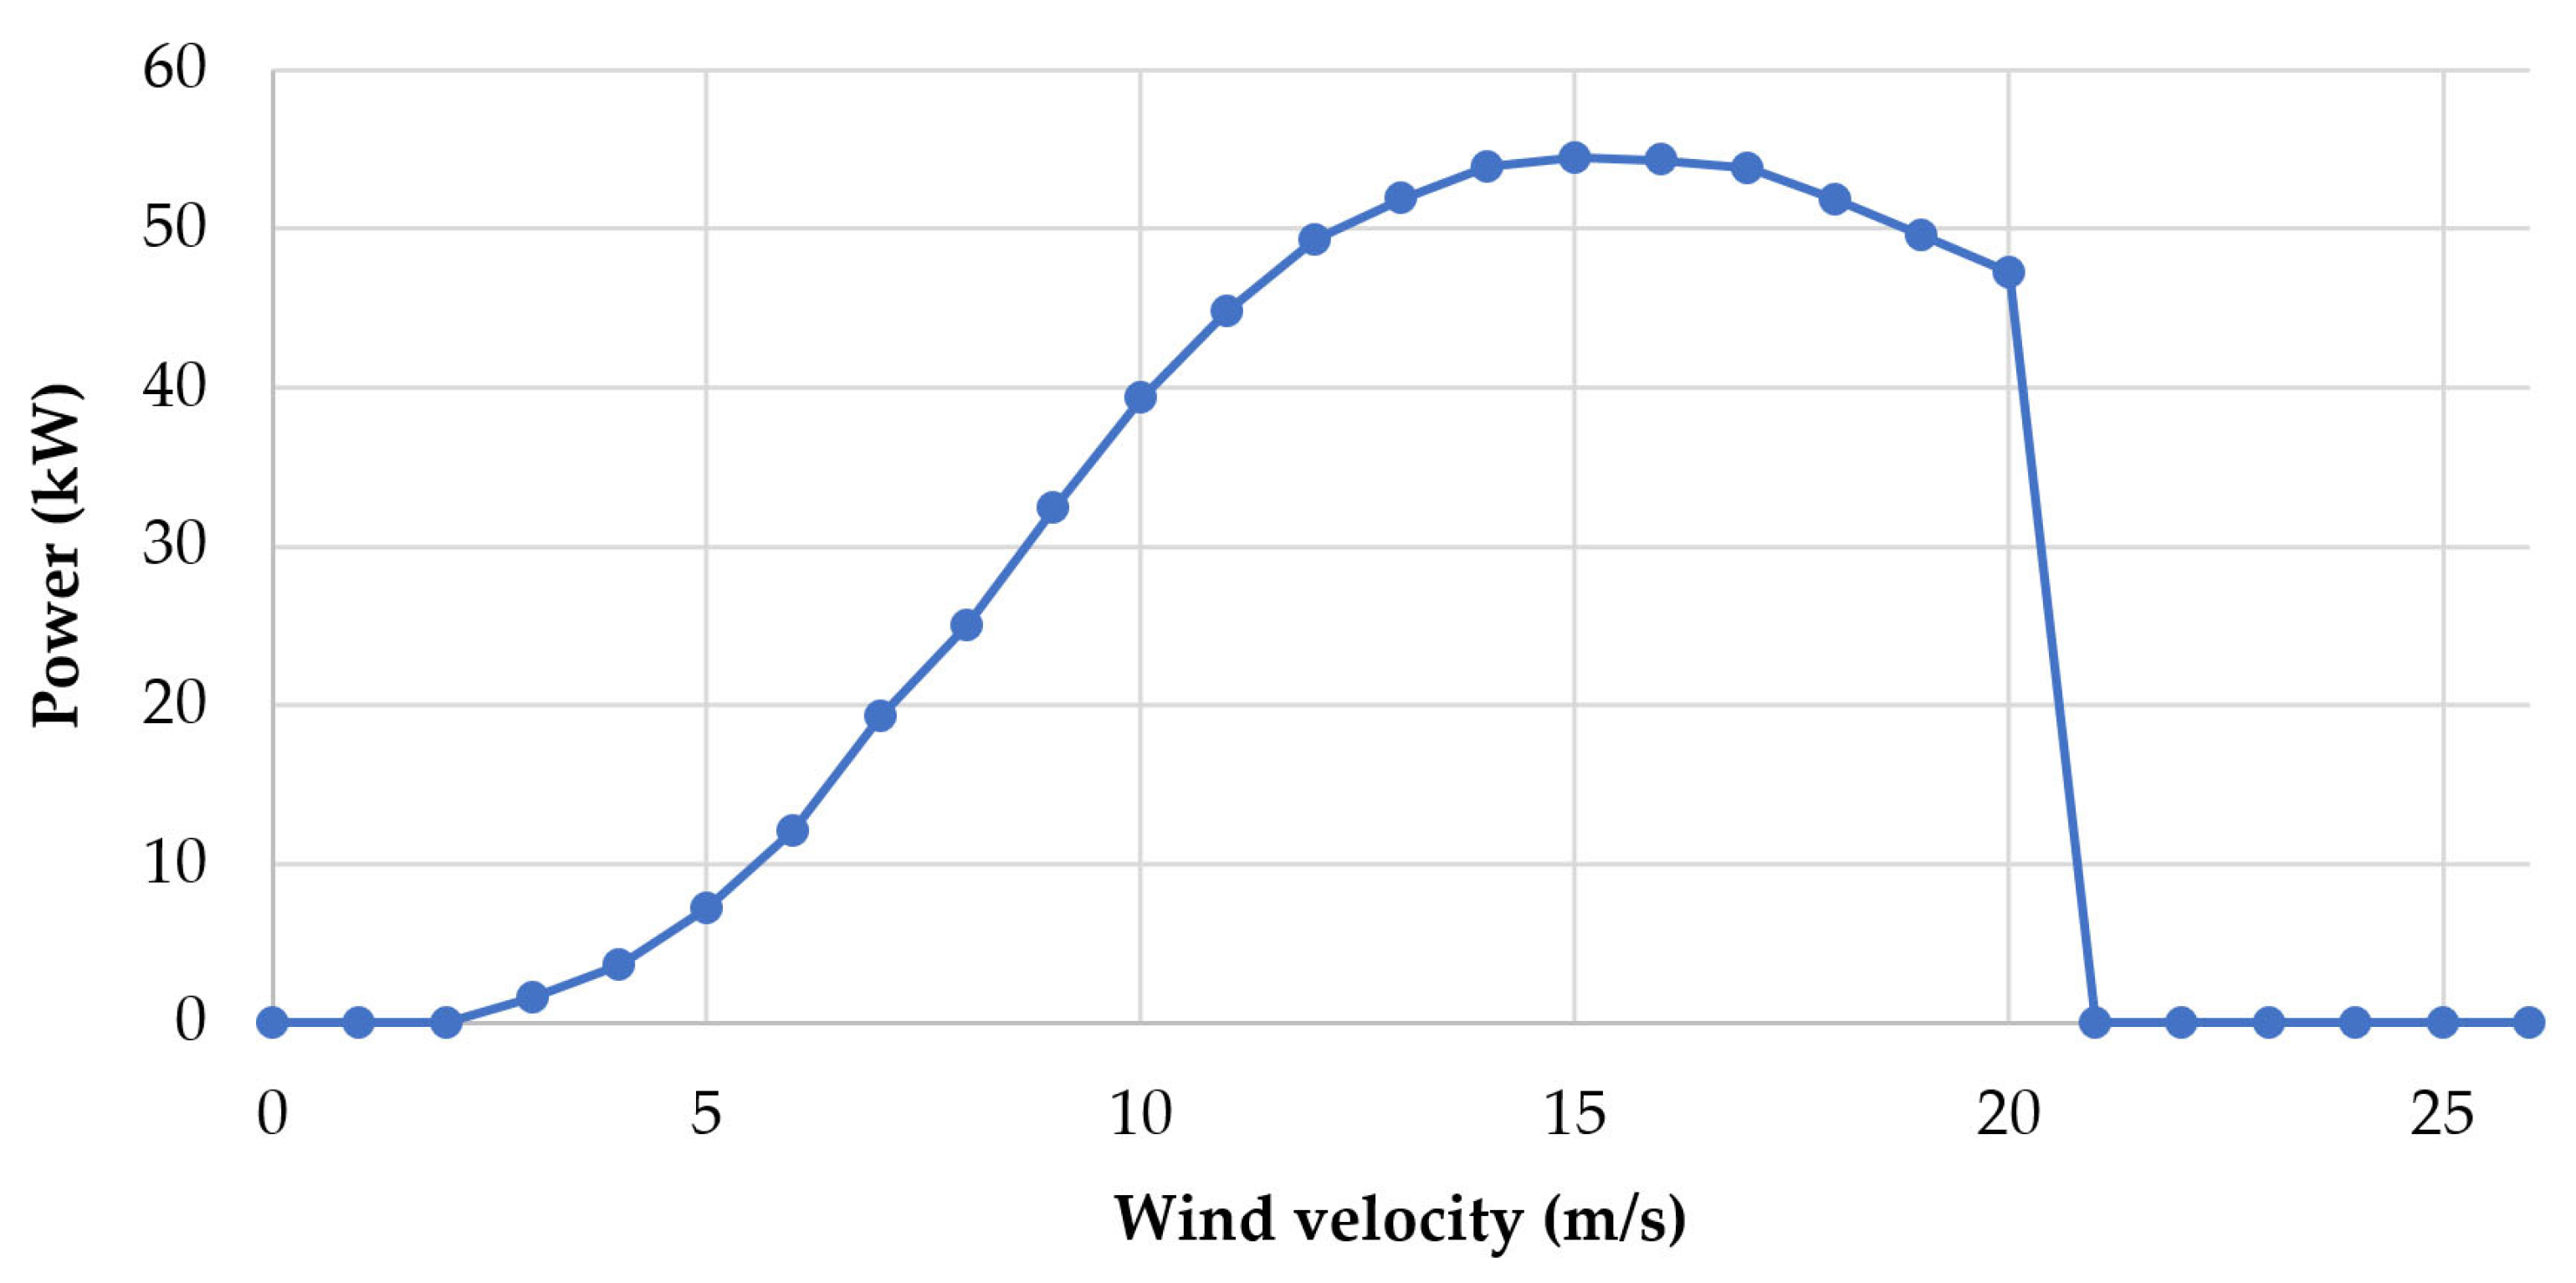
The produced electrical power from the wind turbines is simply calculated from the annual wind velocity time series at the site selected for the wind turbines’ installation (
Figure 5 and
Figure 7) and a typical power curve for a small wind turbine of 50 kW nominal power, as shown in
Figure 10.
The location of the PHS installation is depicted in
Figure 11, on a 3D digitized land terrain. The lower reservoir installation site is located on land previously used for mining. This means that the already formulated cavity will enable the minimization of the required excavation works, while, impacts on the natural environment are also eliminated. The absolute altitudes of the lower and the upper reservoir free surfaces are 256 m and 378 m, respectively, giving a nominal geostatic head of 122 m. The total maximum storage capacity of each tank is 25,236 m
3. Given the geostatic head and the volume of the upper reservoir, the achieved storage capacity of the PHS plant is calculated at 10.5 MWh. This storage capacity, divided by the annual average daily electricity consumption (1.2 MWh,
Table 1), gives an autonomy operation period of the PHS plant of 8.7 days.
The geometrical dimensions of the reservoirs are depicted on the typical 2D and 3D views presented in
Figure 12.
The total length of the pipeline is calculated at 879.4 m and will consist of 151.2 m of an underground horizontal part, through a tunnel, and of 728.2 m of on-surface installation, inside a canal that will be created with excavation, and then it will be filled, to eliminate any optical deterioration of the physical landscape. Glass reinforced polyester tubes will be used, given their lower cost and anti-corrosive attributes.
Regarding the second investigated HPP layout, with electrochemical battery support, for the needs of this work, it is assumed that lithium-ion batteries will be employed, with an average charge and discharge efficiency of 90% and a maximum discharge depth kept at 80%. The selected type is the Lithium Iron Phosphate (LFP), due to its high life period and discharge depth [
48].
Additionally, the life period of the lithium-ion batteries is adopted equal to 8 years, so for a total life period of the hybrid power plant of 25 years (see next
Section 5.2), two replacements of the batteries should be implemented, the first one at the 9th year, and the second one at the 17th year.
Finally, regarding the operation of the thermal generator as a back-up production unit, a total efficiency of 43% is assumed, where the lowest calorific value of the consumed diesel oil is adopted equal to 10.25 kWh/L [
49] and its procurement price at 0.9 EUR/L.
5.2. Economic Parameters
The sizing optimization of the examined system was based on the minimization of the LCOE, on the condition of 100% power demand coverage from the renewable energy sources. For the execution of the iterative calculations, the economic parameters presented in
Table 3 were assumed, based on real quotations provided by the equipment potential manufacturers and on relevant essential market research.
The LCOE was calculated with the following relationship [
50]:
where
CAPEX: the total setup of the plant;
OPEX: the annual operation and maintenance cost;
t: the lifetime period of the plant, assumed equal to 25 years;
Eel: the annual electricity production from the hybrid power plant, excluding the thermal generator production.
The annual operation and maintenance costs are calculated with the following relationship:
where
Cmaint: the annual maintenance cost, set equal to EUR 10,000;
Eth: the annual electricity production from the thermal generator;
ηth: the total efficiency of the thermal generator, set equal to 43%;
Hu: the lowest calorific value of diesel oil, equal to 10.25 kWh/L;
cd: the diesel oil procurement price, set equal to 0.9 EUR/L.
6. Results
6.1. The Hybrid Power Plant with the PHS
An iterative calculation process was executed for different dimensioning scenarios of the plant, regarding the size of the reservoirs and the nominal capacity of the wind park and the photovoltaic station. For each one of these scenarios, the annual electricity production and storage were calculated by applying the computational simulation algorithm presented in
Section 4.1. Finally, based on the aforementioned technical features and economic assumptions, the LCOE for each one of these scenarios was also calculated. The results are summarized in
Table 4.
As seen in
Table 4, the iterations were executed for four different sizes of the upper reservoir, starting from 30,000 m
3 and ending at 15,000 m
3. The capacity of 30,000 m
3 was also included in the calculations just to have a clear picture of this configuration too, even though, given the available land morphology in the PHS installation site, it was selected to keep the maximum storage capacity at 25,000 m
3, so as not to deteriorate considerably the natural landscape due to extensive excavation works.
We also note that this sizing optimization process has as its major target achieving 100% annual demand coverage from the RES technologies and the PHS. Obviously, a second-order criterion is the minimization of the LCOE. Given these objectives, it is seen that the optimum solution is the construction of two reservoirs with 20,000 m3 storage capacity each and the installation of two wind turbines of 50 kW each and a photovoltaic plant of 350 kW. With this scenario, the annual penetration of the hybrid power plant is 100%. and the LCOE is minimized at 0.2274 EUR/kWh. The total setup cost of the overall project is estimated at EUR 2,215,000.
The PHS setup cost is calculated as the sum of the reservoirs, the pipelines, the hydro power plant, pump station, and 50% of the connection grid setup cost. The PHS-specific setup cost is calculated by dividing the PHS setup cost by the achieved storage capacity. As seen in
Table 4, the PHS-specific setup cost is calculated at 215.9 EUR/kWh of storage capacity, for the optimum size of the HPP.
The optimum scenario, apart from meeting the dimensioning objectives, has two additional important positive features. Firstly, the number of installed wind turbines is only two, and, secondly, the storage capacity of the reservoirs is 20% reduced with regard to their maximum possible size at the specific site. Both these features contribute to the restriction of any potential impacts and deterioration of the natural landscape, due to the construction of the project, and will certainly facilitate the licensing process and, finally, the implementation of the plant.
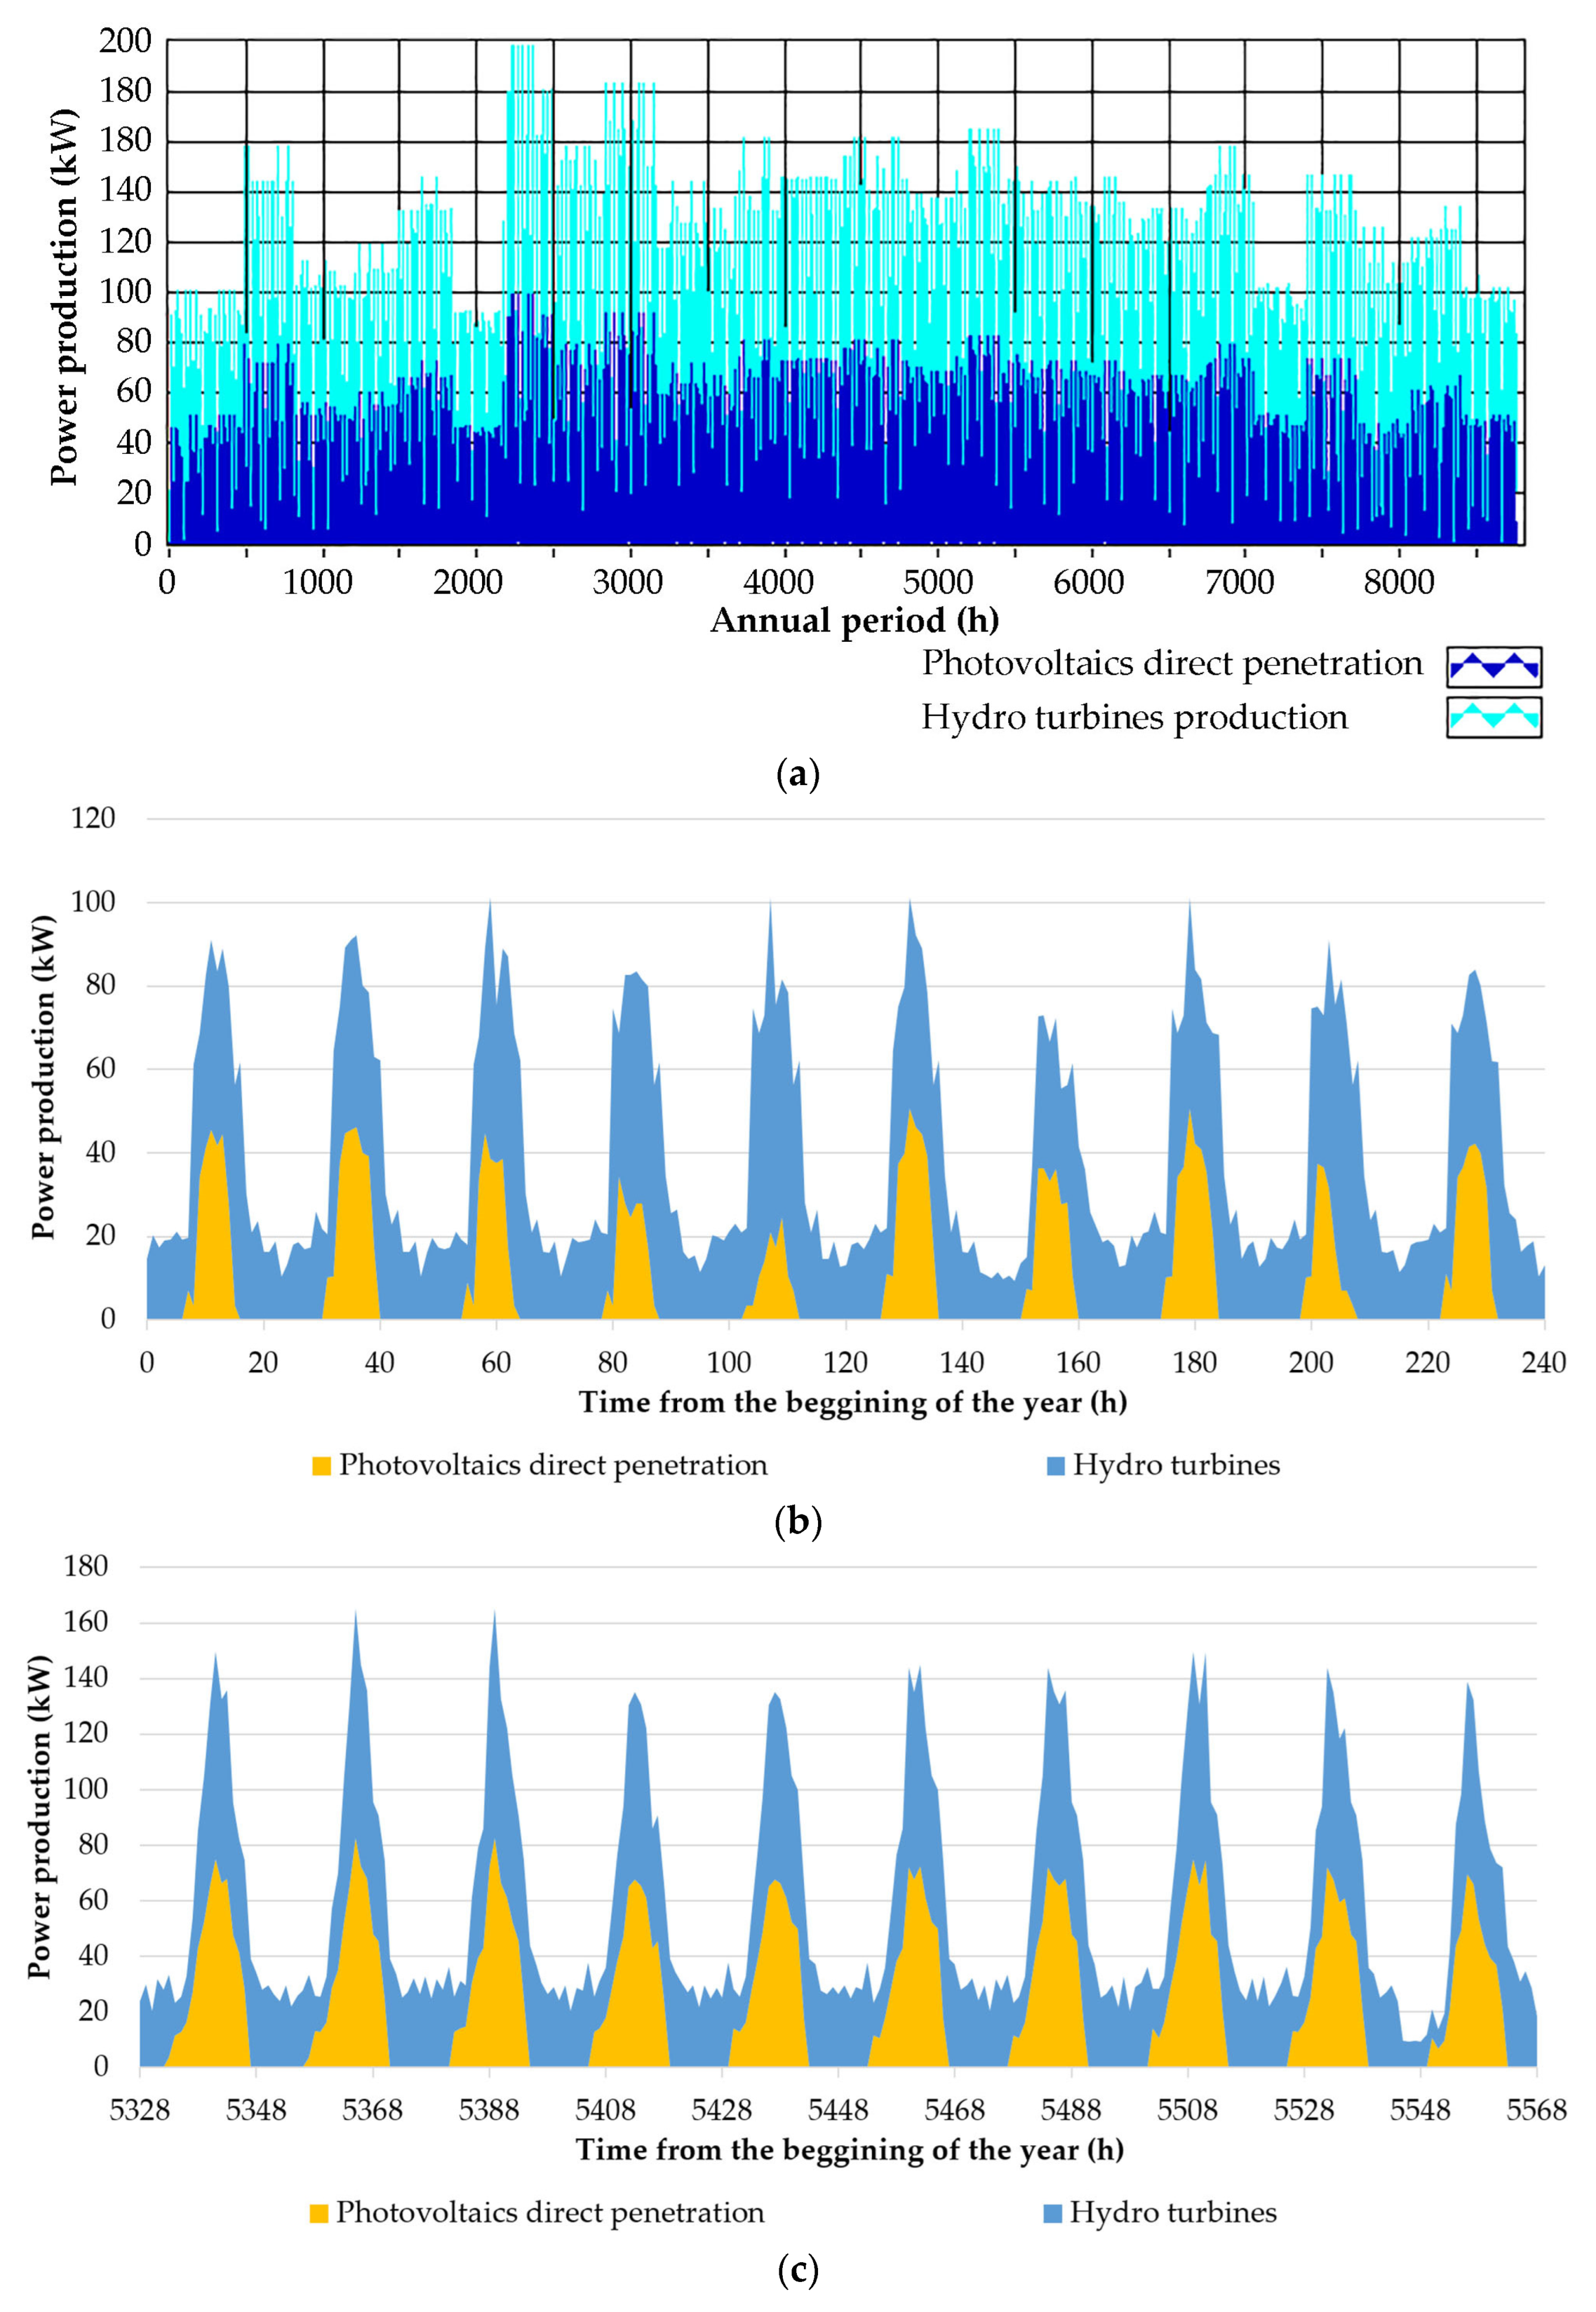
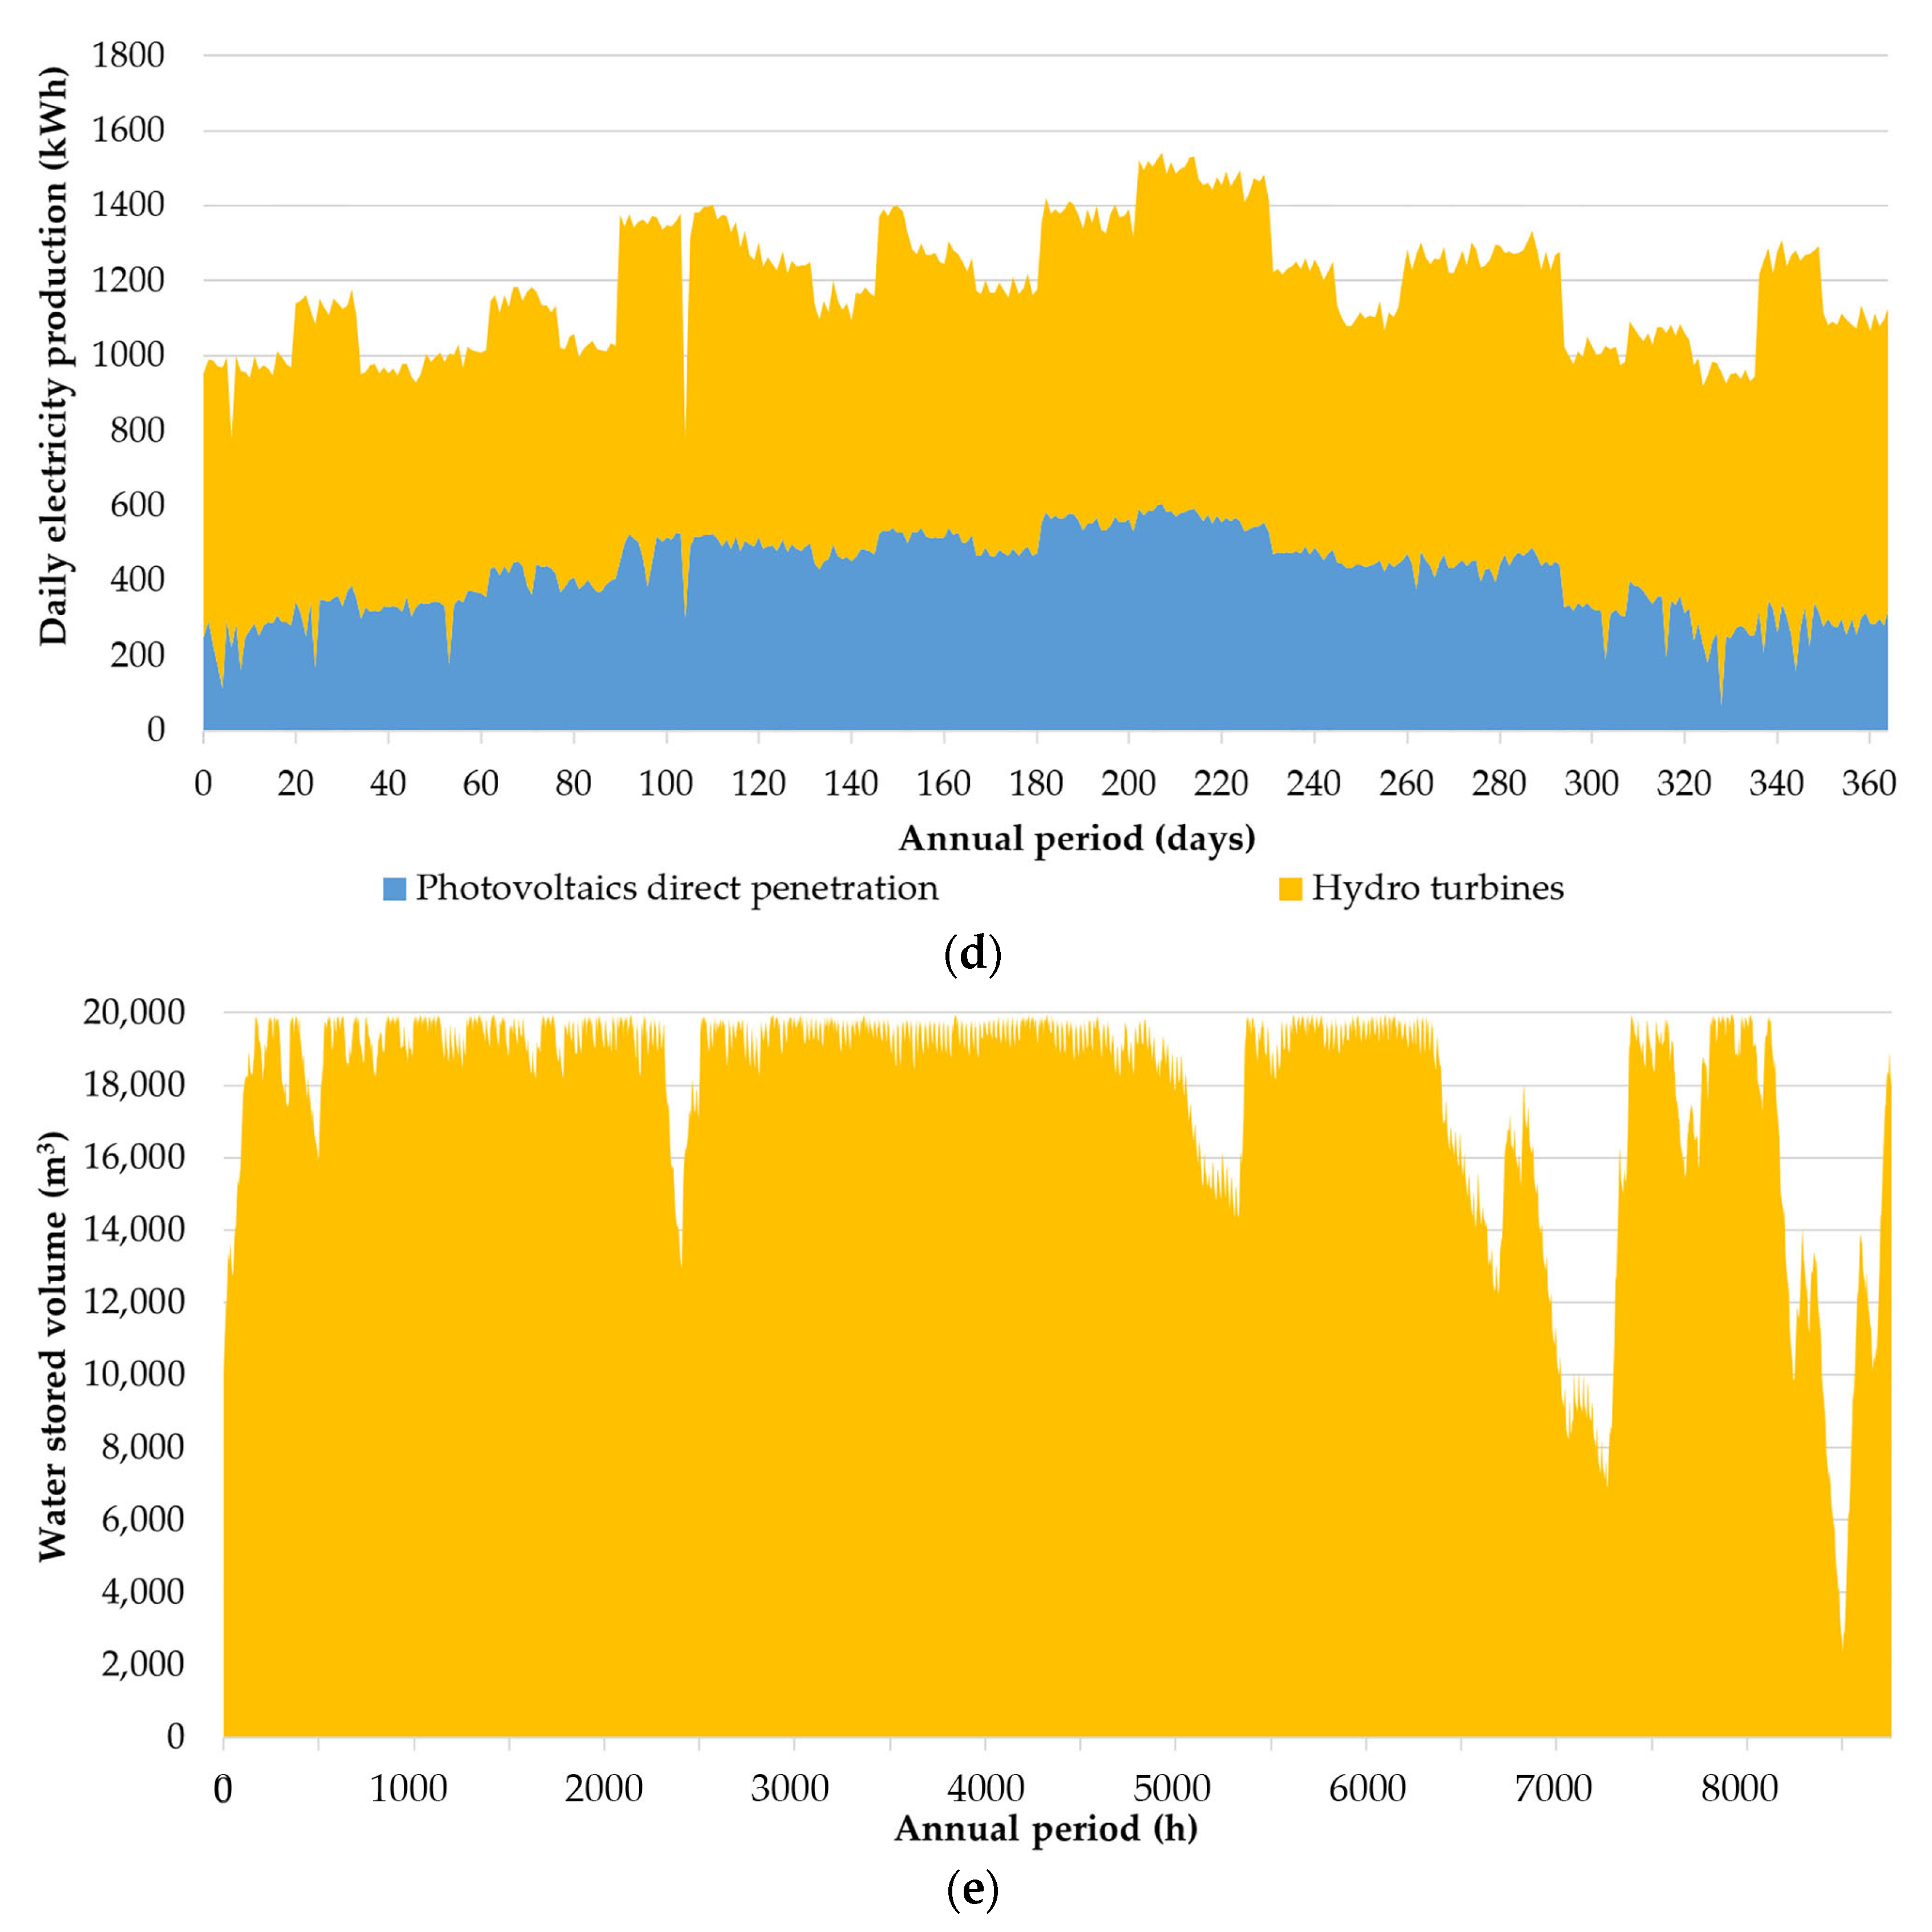
In
Figure 13a, the annual power production synthesis graph is presented with this first-examined HPP and for the optimum sizing scenario, while in
Figure 13b,c, the power production synthesis graphs are presented from the 1st to the 10th of January and from the 11th to the 20th of August, respectively.
In
Figure 13d, the annual fluctuation of the daily electricity production is presented.
Finally, in
Figure 13e, the annual fluctuation of the water stored volume in the PHS upper reservoir is presented.
In
Table 5, the monthly aggregated electricity production is given for the involved units.
6.2. The Hybrid Power Plant with the Lithium-Ion Batteries
Similarly, with the HPP layout with the support of the PHS plant, in the case of the second examined layout, with the support of the lithium-ion batteries, again the optimization process was based on an iterative calculation process for different dimensioning scenarios of the plant, regarding the number of the wind turbines, the nominal power of the photovoltaic plant, and the storage capacity of the lithium-ion batteries. The optimization process was based on the computational simulation of the HPP’s annual operation, following the algorithm described in
Section 4.2.
Given the relatively low storage capacity of the lithium-ion batteries, imposed by their high procurement cost, the achievement of clear 100% RES penetration most probably will not be economically feasible. To examine this, the iteration process was executed with two alternative objectives:
Firstly, the minimization of the LCOE cost, without satisfying the criterion for 100% RES penetration;
Secondly, with the concurrent satisfaction of both criteria, namely, achievement of 100% RES penetration and minimization of the LCOE, namely, as was implemented with the first HPP.
The results of the two optimization processes are presented in
Table 6 and
Table 7, respectively.
As seen in
Table 6, the minimum LCOE, equal to 0.1096 EUR/kWh is achieved for 300 kWh of storage capacity, one wind turbine of 50 kW, and 300 kWp of photovoltaic plant, leading to annual RES penetration of 90.2%. The annual RES production surplus is 24.7% with regard to the initial RES available electricity production. The diesel oil annual procurement cost is calculated equal to EUR 8672. The setup cost of this HPP is equal to EUR 845,915, including two battery replacements.
On the other hand, given the results presented in
Table 7, the minimum required plant that gives 100% RES penetration consists of lithium-ion batteries with 2700 kWh storage capacity, two wind turbines of 50 kW nominal power each, and 500 kW
p of photovoltaic power. The total setup cost of the plant, including two battery replacements, is calculated at EUR 3,353,237. The electricity-production-specific cost is calculated equal to 0.3208 EUR/kWh, namely, 2.9 times higher than its minimum value.
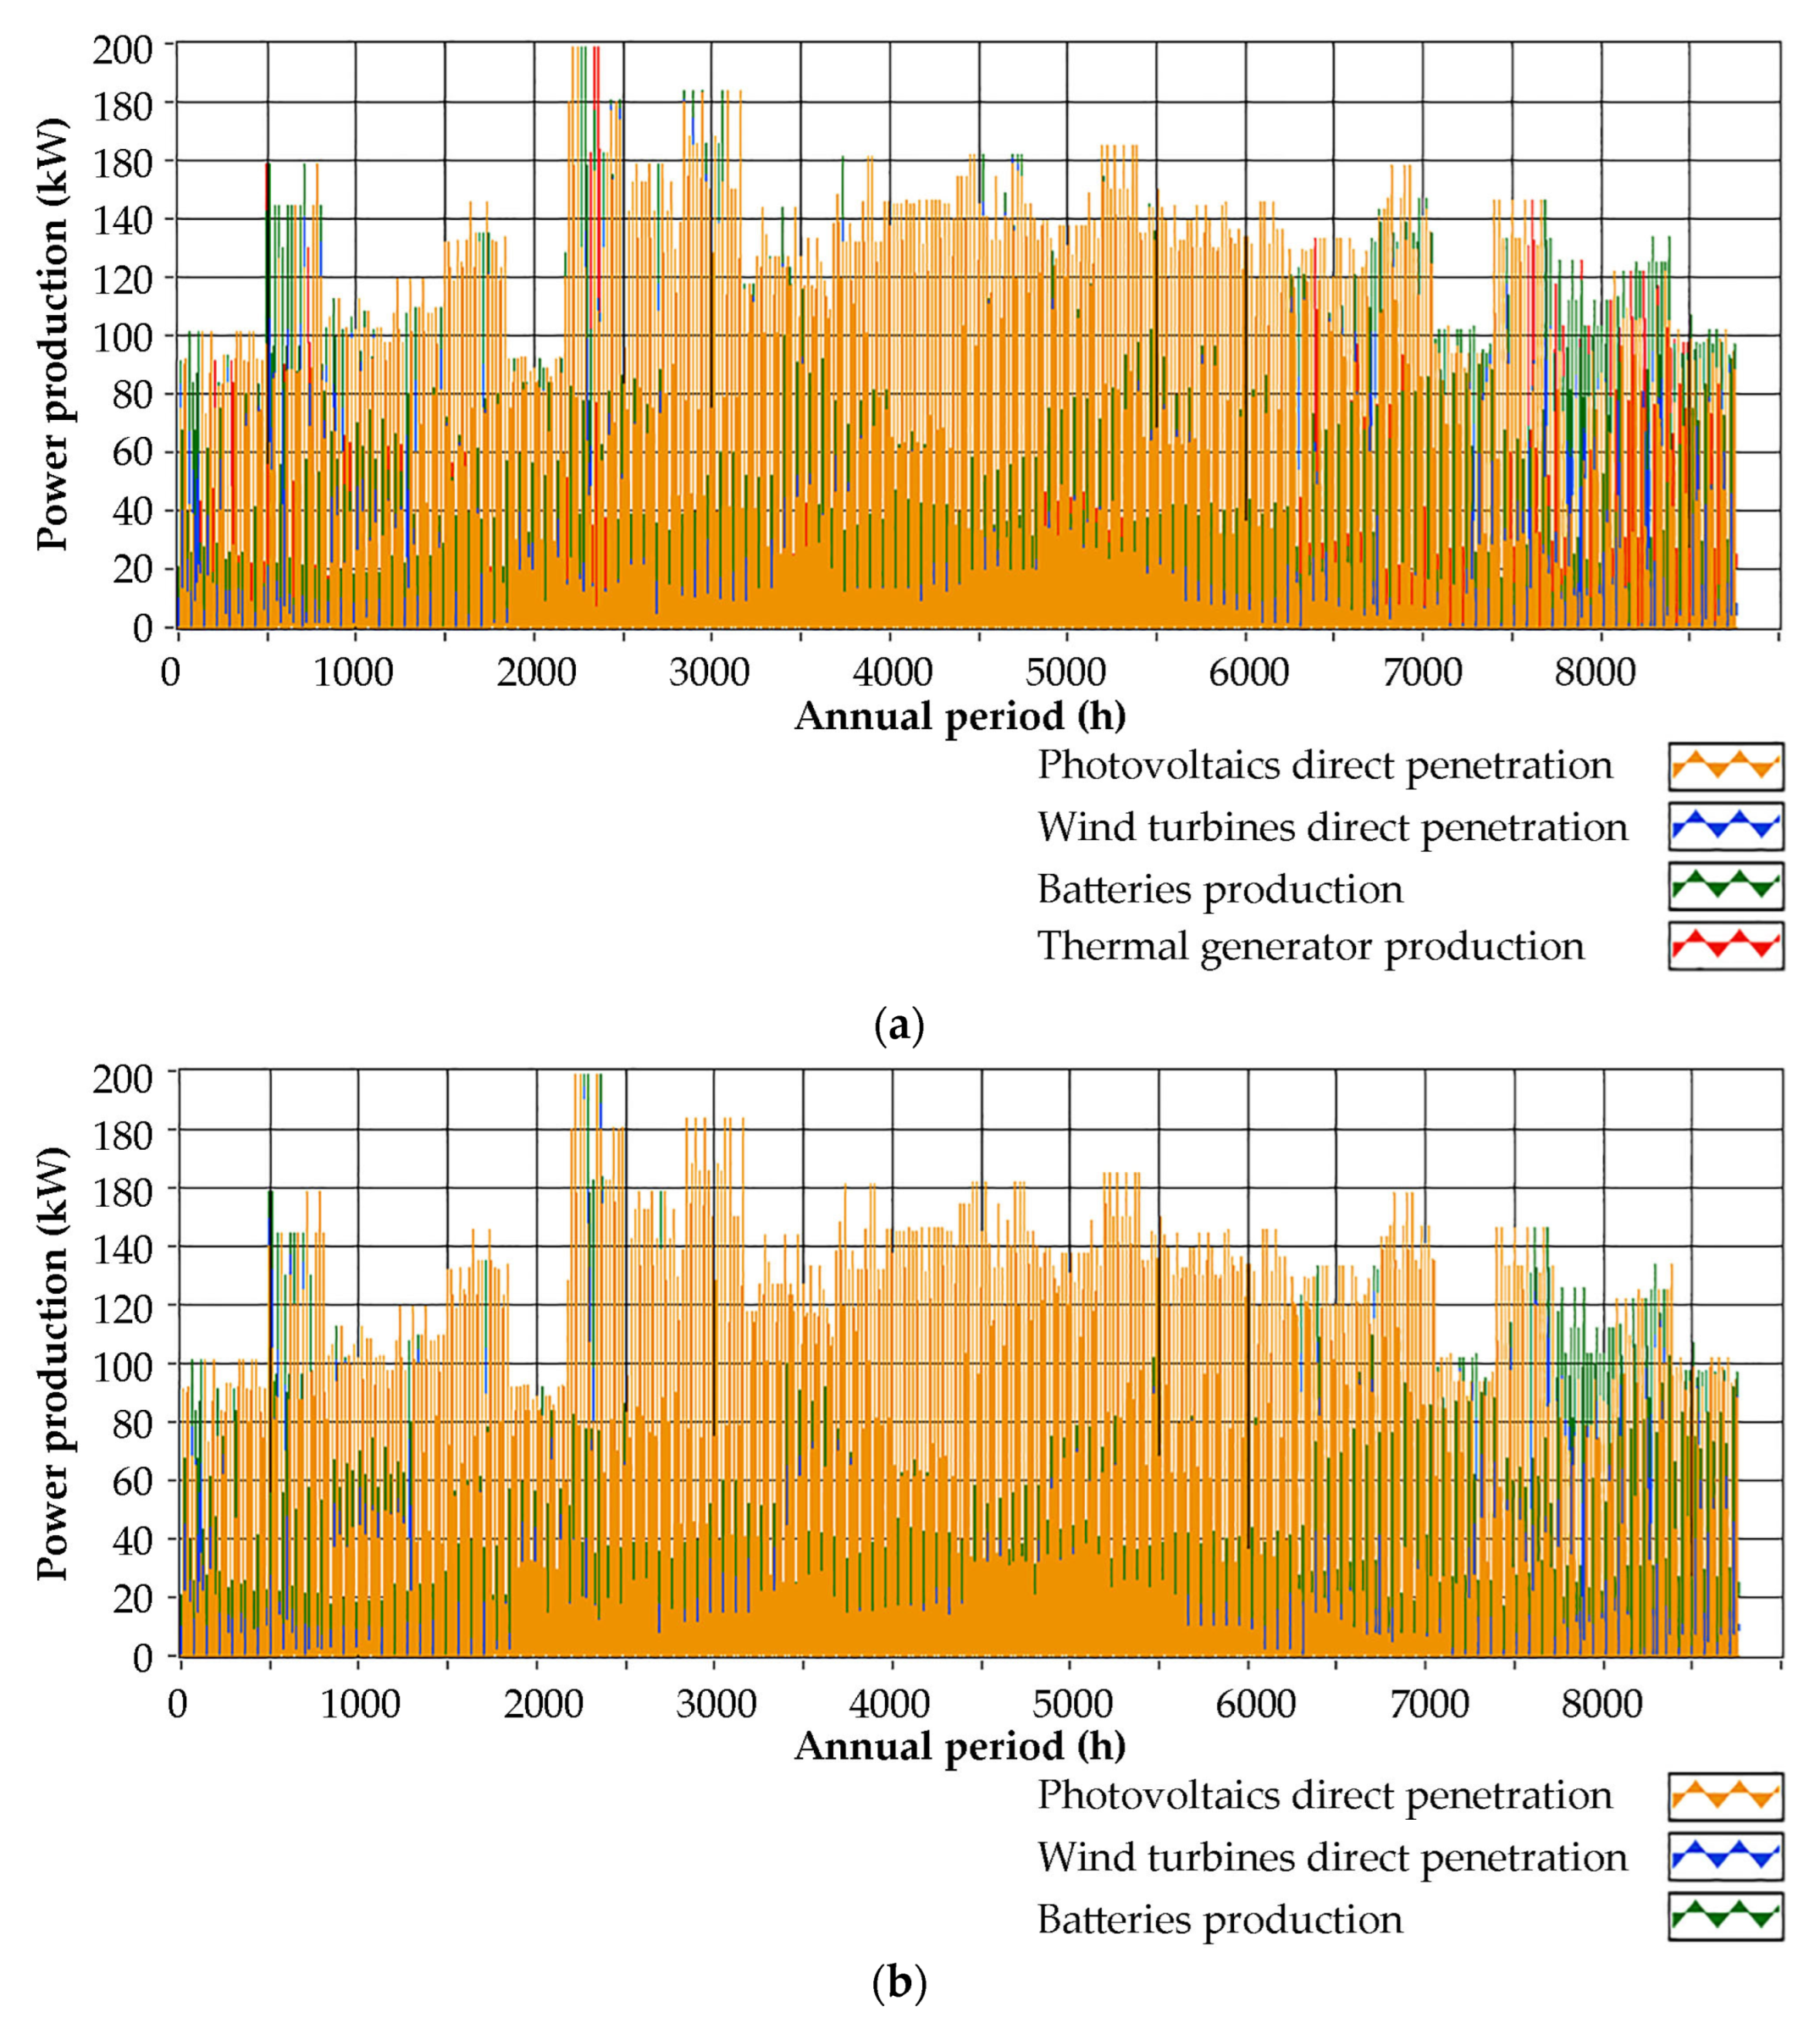
In
Figure 14a,b, the annual power production synthesis graphs are presented for the specific HPP and for the sizing scenario with the minimum LCOE and with 100% RES penetration.
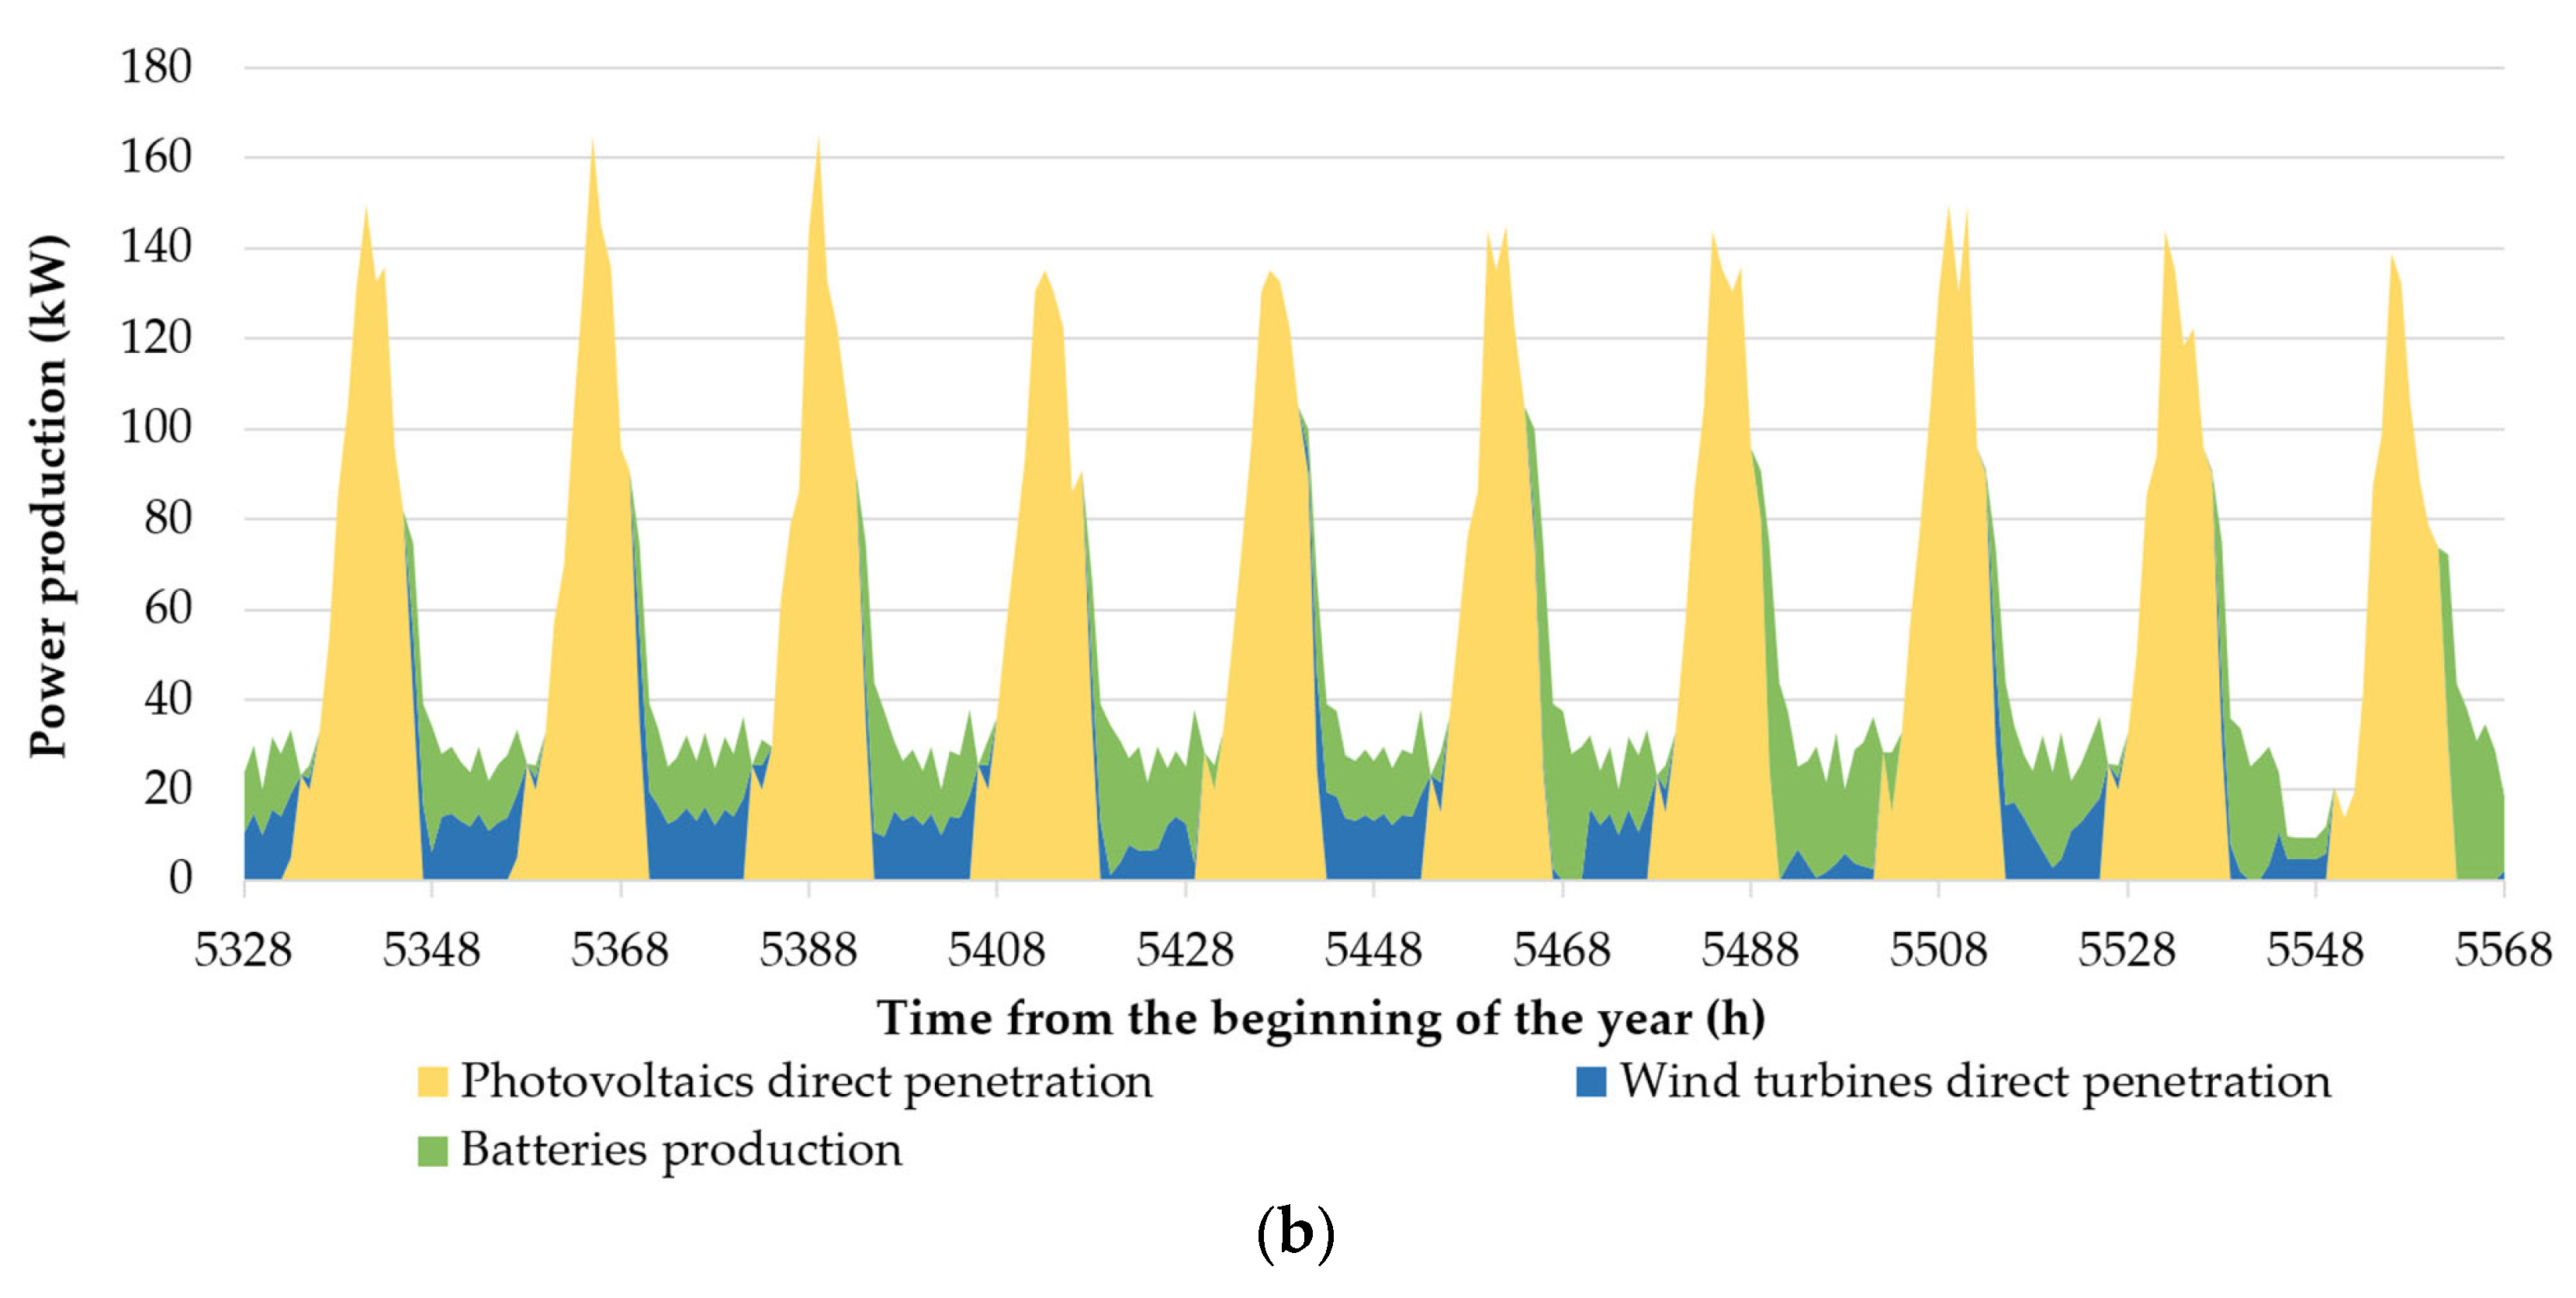
Additionally, for the aforementioned two sizing scenarios, in
Figure 15a,b, the power production synthesis graphs are presented from the 1st to the 10th of January. Similar graphs are, finally, presented in
Figure 16a,b for the aforementioned two sizing scenarios and from the 11th to the 20th of August.
In
Figure 17, the monthly aggregated electricity production from the involved units is presented.
In
Table 8, the monthly aggregated electricity production is given for the involved units.
7. Discussion
From the results presented in the previous section, it is concluded that 100% real-time coverage of the annual electricity demand in the Monastery with RES can be achieved, leading also to a relatively low LCOE, only with the HPP layout with the PHS. In this case, the LCOE was calculated at 0.2274 EUR/kWh, which can be considered as acceptable, particularly for the type and the circumstances of the specific case study: low power demand scale for an autonomous, non-interconnected community. The storage capacity of each one of the water reservoirs should be 20,000 m3 and the installed RES power should be 100 kW for the wind park (two wind turbines of 50 kW each) and 350 kWp for the photovoltaic plant. The annual RES electricity surplus is 22.4%, which can also be considered as sensible. The project’s total setup cost was calculated equal to EUR 2,215,000.
The achievement of 100% RES penetration with the HPP supported by electrochemical storage leads to a considerably high increase in the LCOE, at 0.3208 EUR/kWh. This is, obviously, due to the higher setup cost configured by the still high procurement prices of lithium-ion batteries. The required size of the project is defined by 2700 kWh of storage capacity, 100 kW of wind park, and 500 kWp of photovoltaic plant. The project’s total setup cost is calculated at EUR 3,353,237 (including two batteries replacements), namely, 51.4% higher than the setup of the first HPP. Finally, the annual RES electricity surplus is calculated 51.9%, precisely due to the low available storage capacity. This value cannot be accepted and constitutes another indicator, apart from the LCOE, of the low economic feasibility for the achievement of 100% RES penetration with the specific HPP layout.
On the other hand, the potentially minimum LCOE is remarkably lower than both the aforementioned LCOE values. It is achieved with the second investigated HPP, with electrochemical storage, and it was calculated equal to 0.1096 EUR/kWh. The plant’s size is defined by 300 kWh of storage capacity, one wind turbine of 50 kW, and 300 kWp of photovoltaic power. With this plant’s size, the achieved annual RES penetration is 90.2% and the annual RES electricity surplus 24.7%. The annual diesel oil procurement cost, for the coverage of the remaining power demand with the thermal generator, was estimated at EUR 8672, assuming a diesel oil procurement price of 0.90 EUR/L. In this case, the project’s setup cost is minimized, dropping at EUR 845,915, while the annual RES electricity surplus becomes 24.7%.
At a first glance, accounting only the minimization of the LCOE, the last-presented HPP and size should be selected. It exhibits the lowest setup cost and the lowest LCOE, and it leaves only 9.8% annual electricity demand to be produced by the thermal generator. This could be the obvious conclusion. Another advantage of this choice is that the construction of the PHS is cancelled, so any probable deterioration, even minor, of the natural landscape will be avoided.
However, particularly for Monasteries, especially in Mount Athos, it should be also taken into account that these kinds of projects are often 100% funded by funding calls or even donations from pilgrims, institutes, etc. This, practically, means that the setup cost of the project, perhaps, does not constitute a main issue. On the contrary, regarding the economics of the project, the most important issue is to minimize the operation and maintenance cost, which should be covered every year by the Monastery’s revenues. At this point, it should be clarified that the HPP, regardless the involved units and size, will not produce any kind of direct income, since the produced electricity will be exclusively used for the power demand coverage in the Monastery. Hence, the minimization of the plant’s operation and maintenance cost is essential and can be achieved with the elimination of the diesel oil consumption. In this case, the HPP with the PHS is, of course, the most appropriate solution. Furthermore, this plant has also the advantage that it only needs to be constructed once, and it exhibits a long-life period, unlike electrochemical batteries, which should be replaced regularly, roughly, every 8 years, imposing a considerable periodic expense on the project’s economics and creating this additional burden for the monks to seek for the required monetary amount.
Another important outcome is the storage capacity setup- or procurement-specific cost. For the selected scenario with the PHS plant, the setup-specific cost was calculated at 215.9 EUR/kWh of storage capacity. The corresponding feature of the HPP with the lithium-ion batteries was calculated at 886.4 EUR/kWh, including two replacements, for 25 years of life.
Finally, the HPP with the PHS exhibits two additional comparative important advantages. Firstly, its high added value, since all the works and the majority of the equipment can be accomplished and supplied by local experts and firms. Secondly, its long autonomy time period, which is very important regarding the security of the system. For 20,000 m3 of water storage capacity, the autonomy operation period, accounting a daily average electricity consumption of 1200 kWh, is calculated at 6.9 days. The achieved autonomy period with the lithium-ion batteries, even under the economically infeasible scenario of 100% demand coverage with 2700 kWh of storage capacity and 80% maximum discharge depth, is calculated only at 1.8 days.
8. Conclusions
This article presents a parametric study on the electricity demand coverage from renewable energy sources for small size autonomous communities, such as non-interconnected Monasteries. Two alternative hybrid power plant layouts were investigated, with the main difference being the storage plant. In the first case, a small pumped hydro storage system was employed, while in the second case, lithium-ion batteries were introduced. In both cases, small wind turbines and photovoltaics were used as electricity production units. Two different operation algorithms were also developed, adapted to the specific needs of the Monastery and the technical operational features of the involved technologies. The method was applied in the Monastery of Xenofontos, in Mount Athos.
Given the accomplished and presented work, the support of the pumped storage system offers high autonomy period (7 days) and exhibits the capacity for 100% electricity demand coverage with acceptable LCOE (0.2274 EUR/kWh). The 100% electricity demand coverage with the support of lithium-ion batteries leads to a 52% increase in the LCOE and only 1.8 days of autonomy period. If the achievement of 100% annual electricity demand coverage from renewables is not crucial, then the HPP with the electrochemical battery support exhibits the minimum LCOE, equal to 0.1096 EUR/kWh and 90% annual renewables penetration.
The study proves the technical and economic feasibility for the power demand coverage with hybrid power plants in cases of autonomous, rural communities, and a very low demand scale. If there is favorable land morphology at the installation site, the introduction of a small size pumped storage system can be feasible. Electrochemical batteries can be the optimum solution if the annual renewables penetration percentage is acceptable to remain in the range of 90% and the annual expense of the diesel oil procurement can be affordable. This, however, may not be the case, particularly for Monasteries, where the setup cost of such systems is most likely to be covered by subsidies and donations, whereas, on the contrary, the annual operation cost should be covered by any potential regular incomes.
Pumped storage plants also have the comparative advantages of higher added value and long autonomy periods. On the other hand, the required technical work for the installation of a pumped storage system will surely imposes a larger impact on the local landscape aesthetics, which, depending on the specific case, may not be acceptable.
The results of this study are highly applicable to similar cases of remote and rural insular or agricultural communities and very low power demand scale.


