Article

Improving Sustainability in Urban and Road Transportation: Dual Battery Block and Fuel Cell Hybrid Power System for Electric Vehicles

by
Carlos Armenta-Déu
Facultad de Ciencias Físicas, Universidad Complutense de Madrid, 28040 Madrid, Spain
Sustainability 2024, 16(5), 2110; https://doi.org/10.3390/su16052110
Submission received: 29 January 2024 / Revised: 22 February 2024 / Accepted: 27 February 2024 / Published: 3 March 2024
(This article belongs to the Special Issue Hybrid Energy System in Electric Vehicles)

Abstract

:
This work aims to study and analyze sustainability improvement in urban and road transportation by using a hybrid power system for electric vehicles consisting of a dual low- and high-rate operation lithium battery block and a fuel cell. The proposed power system reduces the energy consumption in electric vehicles, thus helping to enhance a sustainable process of environmental urban pollution and reducing or eliminating fossil fuel dependence, enhancing global sustainability. In this configuration, the high-rate lithium battery powers the electric vehicle in high-power-demand processes like acceleration mode or on an uphill road; the low-rate battery operates at a low output power range, servicing the auxiliary systems and low power loads, and the fuel cell supplies energy in intermediate-power-demand conditions, normal driving mode, constant velocity, or flat and downhill terrain. The dual power system improves global efficiency, since every power unit operates optimally, depending on the driving conditions. Power sharing optimizes the lithium battery performance and fuel cell capacity, minimizing the size and weight of each energy system and enlarging the driving range. A comparative study between different lithium battery configurations and fuel cells shows an efficiency improvement of 31.4% for the hybrid dual-battery block and fuel cell operating in low, high, and intermediate output power ranges, respectively. The study is based on a simulation process recreating current driving conditions for electric cars in urban, peripheral, and intercity routes. An alternative solution consisting of a hybrid system, fuel cell, and high-rate lithium battery produces a 29% power gain.

1. Introduction

Global sustainability represents one of the most relevant challenges that modern society has to face at present. The high dependence on fossil fuels has led humanity to an uncertain future due to the constant reduction in energy resources derived from gas and oil. A sustainable process involves adapting energy consumption to the availability of renewable energy, which represents a problem due to the variability and intermittency of renewable sources. A viable solution is to reduce energy consumption so that imbalances do not occur between generation and consumption, thus enabling the use of renewable energy as a source and guaranteeing a sustainable future.
One of the main sectors where these measures can be most effective is the transport sector, urban and road, due to its high dependence on fossil fuels. The use of electric vehicles, especially in large cities with very congested areas, represents the ideal scenario in which to apply energy savings, since we can obtain energy for recharging batteries and fuel cells through sources that are entirely renewable, which would eliminate dependence on fossil fuels and lead to a completely sustainable process.
Today, lithium batteries are the current power sources for electric vehicles because of their high specific energy and power density, which make them especially suitable for driving conditions [1,2,3,4,5,6,7,8,9,10]. They offer a high lifespan, low maintenance, and reasonably high autonomy, meaning a good driving range [11,12]. Lithium batteries are less sensitive than other type of batteries to changes in discharge conditions, with a low influence of discharge rate on their capacity; nevertheless, sudden changes in power demand provokes a capacity variation, thus affecting driving range [13,14]. An additional effect due to continuous variation in the discharge rate generates aging effects, which reduce battery lifespan [15,16,17,18,19,20]. This situation is unavoidable, since driving includes acceleration and deceleration processes, changes in vehicle velocity, and power demand variation at uphill road segments.
Many studies have focused on the performance characterization of lithium batteries under variable driving conditions, which include dynamic conditions [21,22,23,24,25,26] and thermal effects [27]. Indeed, changes in temperature generate either a reduction or increase in battery capacity and driving range. as well as lowering their lifetime [28,29,30]. Battery capacity changes can be controlled through an accurate determination of the state of charge (SOC) [31], which helps users to develop reasonable managing strategies to ensure that the battery operates within the current charge/discharge range. Operating within the normal charge/discharge range also avoids generating irreversible processes in the active matter, resulting in an abnormal capacity fading. Among the many parameters that influence lithium battery performance, sudden changes in draining current are perhaps the most important [32,33].
Driving protocols devoted to analyzing the response of lithium batteries to operational driving conditions, like NEDC [34,35,36], WLTP [37,38,39], FTP-75 [40,41,42], or JC08 [43,44,45], show how batteries react to sudden changes in vehicle speed, thus in discharge rate, to estimate the driving range for electric vehicles. These protocols evidence a reduction in driving range if dynamic conditions include higher and longer acceleration, as in the case of NEDC and WLTP [46,47,48,49,50]. This latter protocol replaces the former because it represents a more realistic layout of the current driving mode in our society, where acceleration occurs more often and lasts longer [51,52].
The implementation of electric vehicles equipped with lithium batteries is promoted by political decision to reduce GHG emissions, especially in urban zones where pollution is critical [53,54,55,56,57,58,59,60], because politicians are concerned by scientific reports warning about the disastrous effects that climatic change may have on human life on earth. These reports suggest a progressive mitigation of climatic change by reducing carbon emissions to the environment [61,62,63,64,65,66,67]. One the contributing sectors to carbon, sulfur dioxide, and nitrox oxides is the internal combustion engine public and private transport sector, which emits millions of greenhouse gas emissions every year [68,69,70,71,72], especially when compared to electric vehicles [73]. However, the limited autonomy compared to internal combustion engine (ICE) cars represents a barrier for future customers [74,75,76,77,78,79,80]. The increasing battery autonomy and EV driving range is one of the main subjects of present research in the lithium batteries field and electric vehicle applications.
Indeed, plugin and battery electric vehicles are not carbon-dioxide-emissions-free, since the electricity used to charge the batteries is currently generated in fossil fuel power plants; therefore, they have a carbon footprint [81,82]. Nevertheless, if we consider only GHG emissions due to road traffic, it is evident that electric vehicles represent a serious alternative for environmental impact reduction. On the other hand, considering that fossil fuels also have a carbon footprint, we may skip the environmental impact before driving.
The use of renewable energy sources for electricity generation suffers from intermittency and variability, which makes them unreliable for continuous use; the solution to this problem comes from the storage system, currently in large battery blocks, which may exchange charge with the grid [83,84,85,86].
Another problem derived from using electric vehicles is the need for frequent battery recharging, which means obtaining access to a recharge point connected to the grid. In urban areas, a private or public charging station is the solution, but the density of this type of installation is still scarce in many cities [87,88,89,90,91,92,93]. This situation represents a significant drawback in the implementation of EVs, because the fear of a sudden vehicle stop due to total discharge of the battery is an impediment to the acquisition of electric vehicles by future customers.
A compromise solution between environmental protection and easy access to quick energy release from fossil fuels is the hybrid (HEV) or plug-in hybrid electric vehicle (PHEV), where a combination of ICE car and EV occurs. The hybridization between an internal combustion engine and electric motor provides a long driving range and lower carbon emissions than conventional cars only powered by ICE, but continues to have pollutant effects and still requires battery charging, either from the grid like plug-in hybrid electric vehicles or from the combustion engine as in HEVs [94,95,96,97,98,99,100,101,102,103,104,105,106,107,108].
Recent studies [109] have shown that, by enhancing diesel combustion engine management, GHG emissions are considerably lower, which reduces environmental impact. This solution, although it does not eliminate carbon, sulfur, and nitrox dioxide emissions, may represent an alternative to the use of electric engines in the case where ICE replacement is not under consideration.
Additional work [67] has illustrated how the road traffic influence on environmental impact is reduced if we adopt a recycling protocol for electric vehicle components like batteries and motors, etc. Recycling not only helps to avoid pollution due to rejected components, but also saves energy, since we eliminate the manufacturing process of recycled elements.
We can also mention specific papers that aimed to emphasize the reduction in greenhouse gas emissions (GHG) by enhancing the internal combustion engine performance, incorporating additives to the primary fuel, or applying regulatory measurements [110,111,112,113].
An alternative power system is the fuel cell electric vehicle (FCEV), which depends on hydrogen supply for operation. FCEVs also work on electricity generated at the fuel cell; therefore, their autonomy depends on the hydrogen stored in the fuel tank. The driving range for FCEVs currently exceeds EV autonomy [114,115,116,117,118], but still requires a hydrogen recharging process; the great advantage is the quickness of this process, faster than recharging an electric battery.
Fuel cell cars have significant advantages compared to electric vehicles, like quicker fuel recharge, a longer driving range, and less weight [114,119,120,121,122,123,124,125]; however, fuel cells suffer from a lower performance when releasing energy at high rates, which makes them unsuitable for sudden quick discharges [126,127,128,129,130]. Proton exchange fuel cells (PEM), which equip electric vehicles, traditionally show a low specific power, forcing them to modify the fuel cell structure to face high power demand rates, such as accelerations or uphill road segments [131,132,133,134]. Other types of fuel cells show a higher performance in high discharge rate but suffer from a slow energy release, which is incompatible with driving conditions [135,136,137].
Combining a high-rate lithium battery for heavy driving conditions, a low-rate battery for auxiliary services and small electric loads, and a fuel cell for medium power rates provides a very effective hybrid system for power electric vehicles in any condition. This configuration reduces the size and weight of the electric vehicle power source, enhances the performance, increases the energy efficiency, and enlarges the driving range [138].
On the other hand, a hybrid system like the one proposed in this paper is suitable for operating on single power source, a battery or fuel cell, or in combined mode with both power sources supplying energy simultaneously if necessary. Additionally, this configuration is able to switch from one power source to another if the electric vehicle control system determines the driving conditions and enhances the power system global efficiency by switching.
A fuel cell and lithium battery hybrid system allows for preserving energy for emergency situations, like the miscalculation of driving range resulting in an unexpected sudden stop of the electric vehicle because of power exhaustion. In addition, the hybridization of a fuel cell and lithium battery provides a redundant power source, a practical solution in places where access to hydrogen recharge stations is scarce.
This paper represents a contribution to the state of the art in the electric vehicle configurations aiming to improve energy efficiency and save energy relating to former models. The main contribution of this paper is the new power system layout, consisting of a dual-battery block, light and heavy duty, plus a fuel cell. This configuration represents an advance in electric vehicle power system management, since it enhances performance due to the optimum use of the power source, the light or heavy duty battery and fuel cell, depending on the power requirements for the specific driving conditions.

2. Theoretical Foundations

Proton Exchange Membrane Fuel Cell (PEMFC) output power operates in a high range, depending on the set configuration. PEMFC is characterized by a low voltage, typically 1.23 volts per cell in ideal conditions, and a limited delivery intensity, depending on the cell size.
Since the voltage of a fuel cell depends on the activation, ohmic, and concentration processes, we may establish [139]
V F C = V r Δ V = V r Δ V a c t Δ V o h m Δ V c o n c
Vr is the reversible voltage of the fuel cell and ΔV is the voltage drop [140] due to the activation [141,142,143], ohmic [144], and concentration [145] processes.
The global current generated by a fuel cell depends on the hydrogen flow according to the following expression:
I F C = 3.2 × 10 19 ρ H 2 V H 2 M H 2
ρ, M, and V are the density, molecular weight, and hydrogen flow, respectively.
Combining Equations (1) and (2) and considering that the reversible fuel cell voltage and the voltage drop, ΔV, are constant:
P F C = 3.2 × 10 19 V r Δ V m H 2 M H 2 = k H 2 m H 2
with:
k H 2 = 3.2 × 10 19 V r Δ V M H 2
M H 2 is the hydrogen molecular weight.
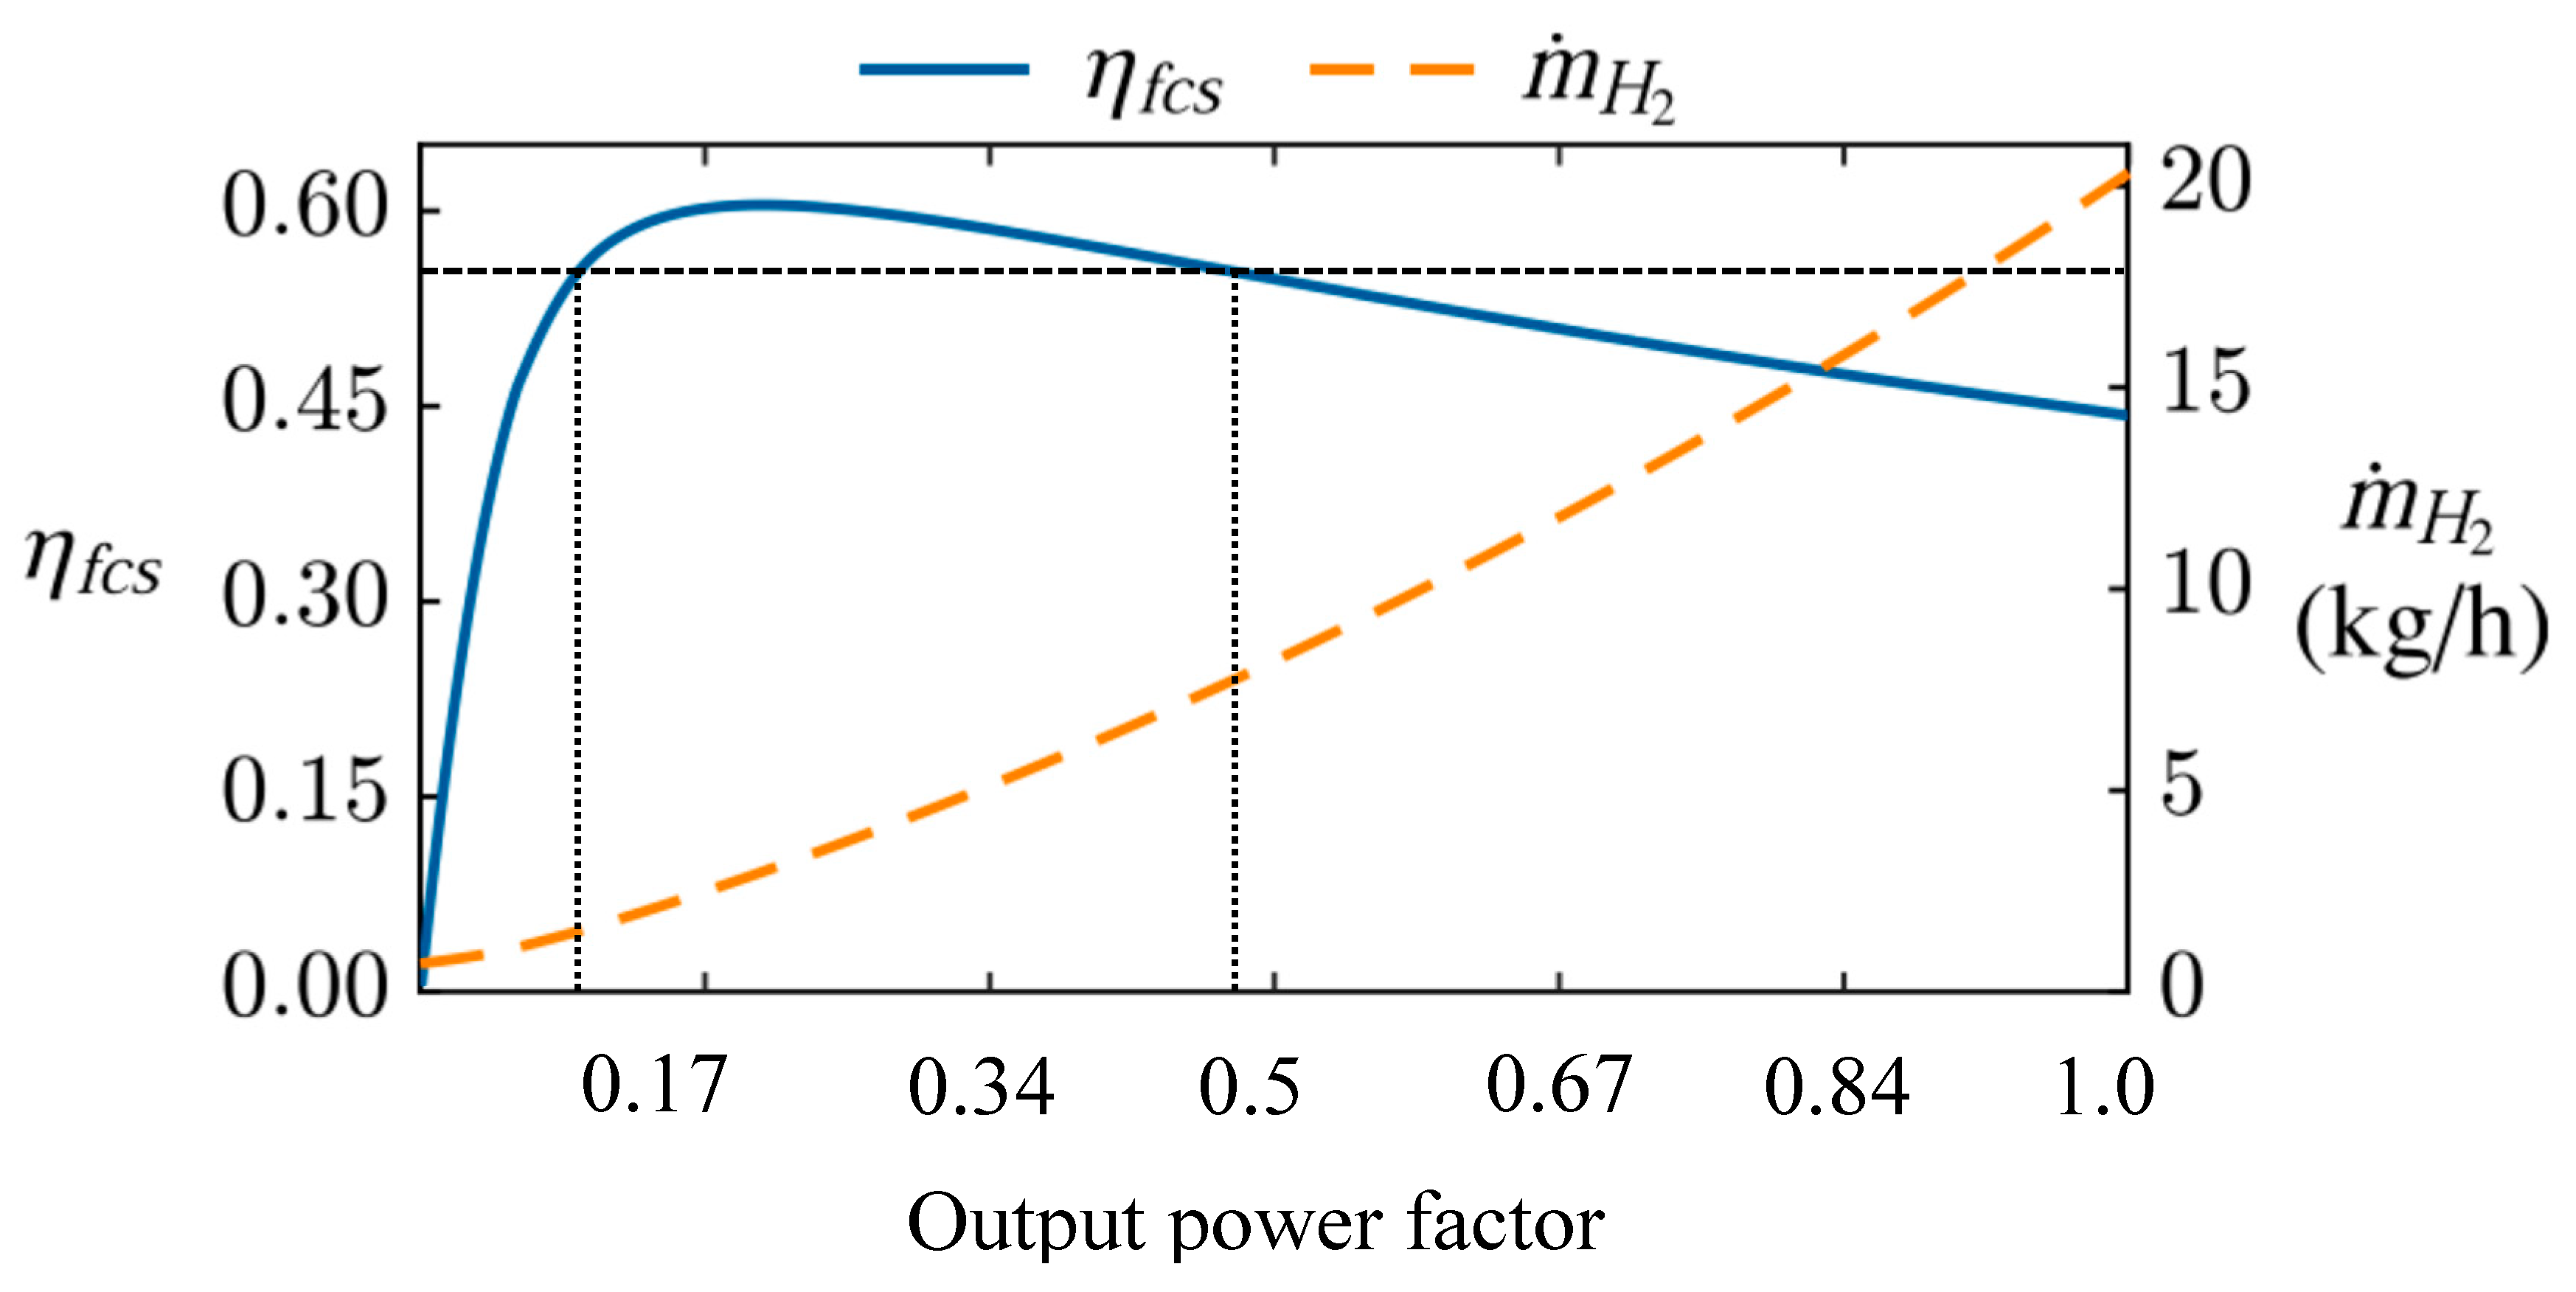
The fuel cell delivers power with a variable efficiency, depending on the power rate, as shown in Figure 1.
We observe in Figure 1 that the fuel cell operates at optimum efficiency when delivering 25% of its maximum output power. Since, in electric vehicles, the output power changes according to the driving conditions, the fuel cell cannot operate at maximum efficiency at all times; therefore, to optimize the operation of the hybrid power system, it is recommended to set up a high-efficiency range in which the fuel cell should operate. To maximize the fuel cell efficiency during electric vehicle operation, we select a maximum efficiency variation of 10% from the peak value, from 0.54 to 0.60, according to the data shown in Figure 1. This range corresponds to an output power factor from 0.10 to 0.48, which means that the fuel cell should cover the electric vehicle power demand within a range from 10% to 48%.
If we apply the fuel cell efficiency curve to driving conditions, it is necessary to obtain an algorithm that matches the efficiency evolution; since the curve is complex and does not respond to a low-degree polynomial function, we divide the curve into sections where different algorithms apply. According to this methodology, we can express the fuel cell efficiency as:
η F C = 9.342 F P 0 < F P < 0.038 18.823 F P 2 + 5.5899 F P + 0.1914 0.038 < F P < 0.172 0.603 0.0286 ( F P 0.172 ) 0.172 < F P < 0.275 0.6 0.213 ( F P 0.275 ) 0.275 < F P < 1.0
FP is the output power factor.
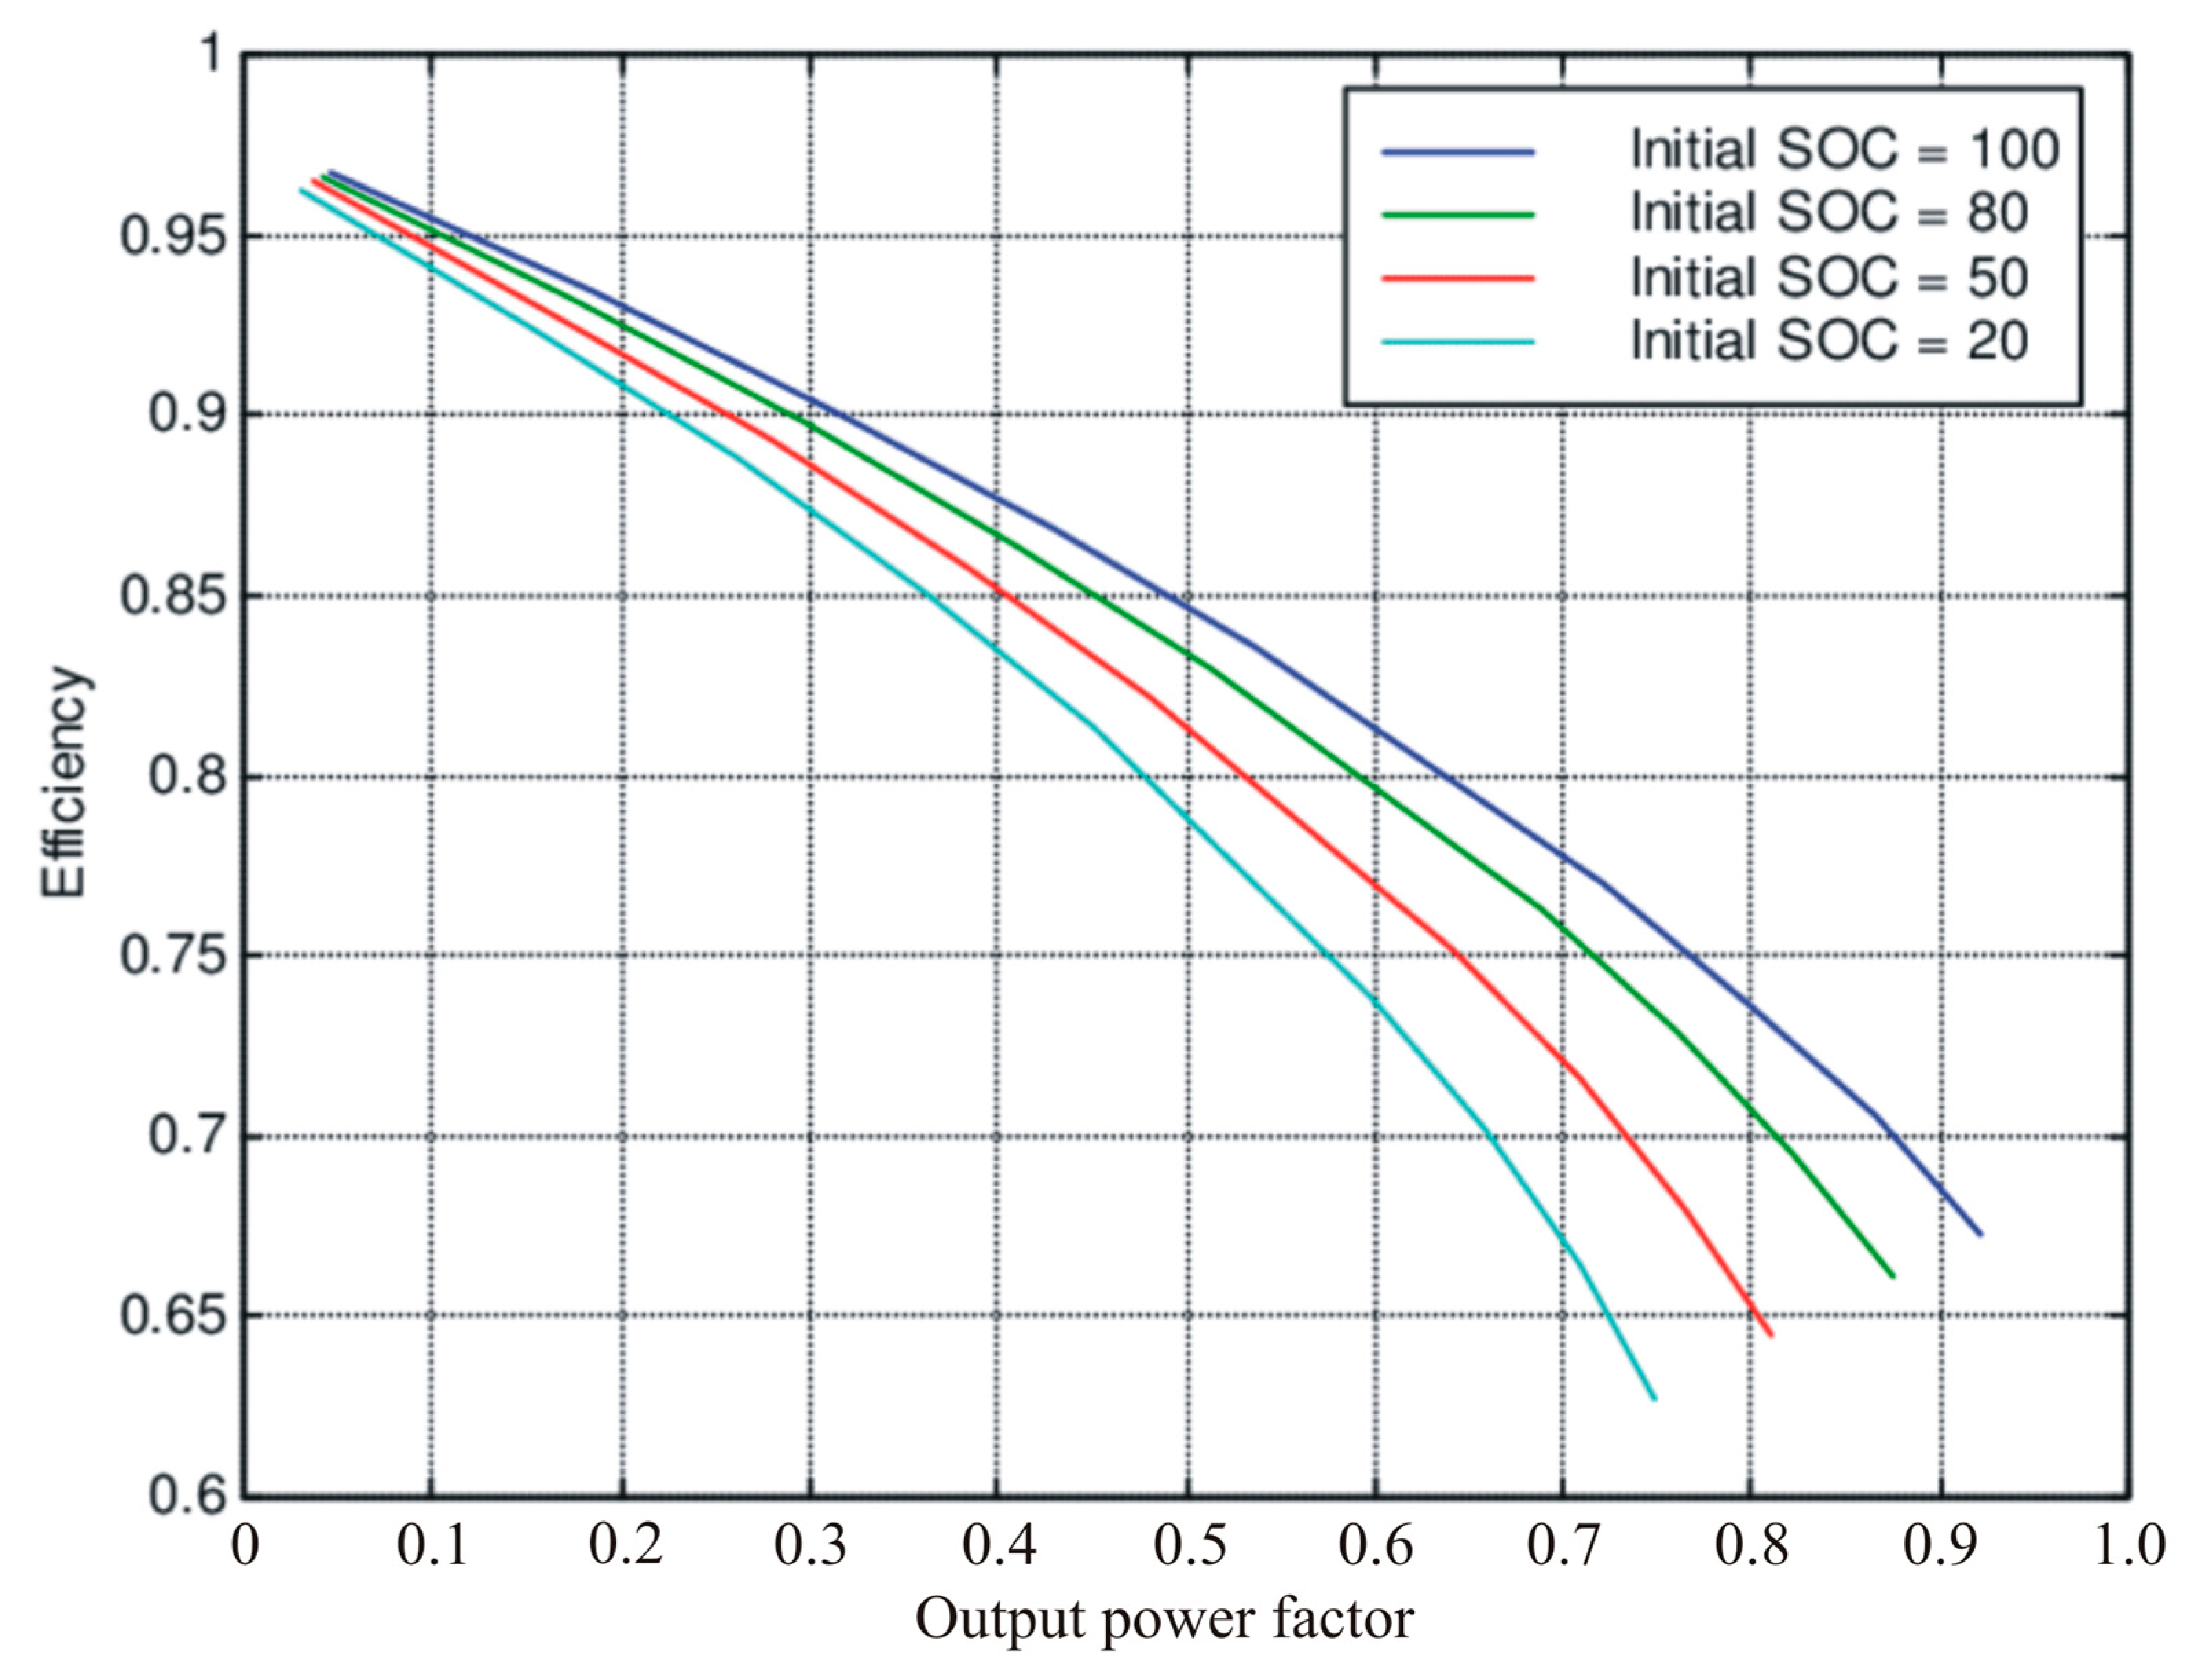
In the case of lithium batteries, the efficiency curve dependence on the output power factor shows a polynomial fitting evolution similar to the one for fuel cells (Figure 2).
If we define the maximum electric vehicle power as P E V o , applying Equation (3), we obtain:
m H 2 = F P P E V o k H 2 = P F C k H 2
Equation (6) provides the hydrogen mass flow required to generate the electric vehicle power demand within the optimum setup range for the fuel cell efficiency. FP moves in the range of 0.1 < FP < 0.48.
The lithium battery discharge efficiency evolves with the output power factor, depending on the state of charge, as represented in Figure 2.
To facilitate the operation with the lithium battery efficiency shown in Figure 2, we correlated the efficiency curves to a third-degree polynomial function, resulting the following correlation functions:
η = 0.5205 F P 3 + 0.5771 F P 2 0.441 F P + 0.9997   ( R 2 = 0.9981 )   ( S O C = 100 ) 0.5170 F P 3 + 0.5530 F P 2 0.468 F P + 0.9950   ( R 2 = 0.9962 )   ( S O C = 80 ) 0.5770 F P 3 + 0.5290 F P 2 0.4855 F P + 0.994   ( R 2 = 0.9973 )   ( S O C = 50 ) 0.6325 F P 3 + 0.5050 F P 2 0.503 F P + 0.993   ( R 2 = 0.9955 )   ( S O C = 20 )
Since a battery during discharge changes the state of charge continuously, we correlated the coefficient of the algorithm representing the battery discharge efficiency, which resulted in the following expression:
η = a 1 F P 3 + a 2 F P 2 + a 3 F P + a 4
where the coefficients ai depend on the battery state of charge (SOC). On the other hand, the coefficients also depend on the type of battery, whether it is low or high rate; therefore, we correlate the coefficients for both types of battery, obtaining:
a 1 = 0.0018 ( S O C ) 0.6695   ( l o w   r a t e ) 0.0002 ( S O C ) 0.5030   ( h i g h   r a t e ) a 2 = 0.0012 ( S O C ) + 0.4566   ( l o w   r a t e ) 0.0008 ( S O C ) + 0.4890   ( h i g h   r a t e ) a 3 = 0.0006 ( S O C ) 0.5147   ( l o w   r a t e ) 0.0013 ( S O C ) 0.5760   ( h i g h   r a t e ) a 4 = 3 × 10 5 ( S O C ) + 0.9923   ( l o w   r a t e ) 0.0002 ( S O C ) + 0.9762   ( h i g h   r a t e )
For an electric vehicle power demand below the lower threshold of the fuel cell output power, we should use the low-rate discharge lithium battery, since the discharge rate for this power range is low; however, for a power demand above the upper threshold of the fuel cell output power, the high-rate discharge lithium battery should power the electric vehicle.
The power requirement in electric vehicles is derived from the classic dynamic equation:
P E V = m a + κ v 2 + μ m g + m g sin α v
The term in brackets represents the global force on the electric vehicle, and <v> is the average velocity. Global force consists of four terms, inertial (ma), drag (κv2), rolling (μmg), and uphill or downhill (mgsinα) force, where m, a, and v are the vehicle mass, acceleration, and speed, κ and μ are the drag and rolling coefficients, and α is the road tilt.
The control system should detect the vehicle speed and acceleration to calculate the power demand. The drag coefficient derives from the vehicle aerodynamic coefficient through the equation:
κ = 1 2 ρ C x S
where ρ is the air density, Cx is the aerodynamic coefficient, and S is the vehicle front surface.
Since the aerodynamic coefficient and front surface are characteristic parameters for every vehicle, and the air density remains constant within the operating temperature range, we may consider the drag coefficient to be constant.
The rolling coefficient depends on the vehicle speed and tire pressure, as in:
μ = 0.005 + 1 p 0.01 + 9.5 × 10 7 v 2
where p is the pressure of the vehicle tires in bars and the vehicle speed, v, is expressed in km/h.
In the case where we consider the influence of the vehicle speed on the rolling coefficient, we should apply the following expression:
μ v = 0.01 1 + 0.036 v
If we consider the combined influence of ambient temperature and vehicle speed:
μ T a m b , v = 1.9 × 10 6 T a m b 2 2.1 × 10 4 T a m b + 0.013 + 5.4 × 10 5 v
We calculate the rolling coefficient by measuring the ambient temperature and vehicle speed and applying Equation (14).
The control system determines the road tilt from an installed altimeter, from Google Maps, or an equivalent application.
The control system determines the vehicle speed by combining distance over time data and acceleration from the expression [21]:
a = v f 2 v i 2 / 2 d
Since, in acceleration processes, the velocity changes, the control system uses a short distance step in Equation (15).

3. Control System

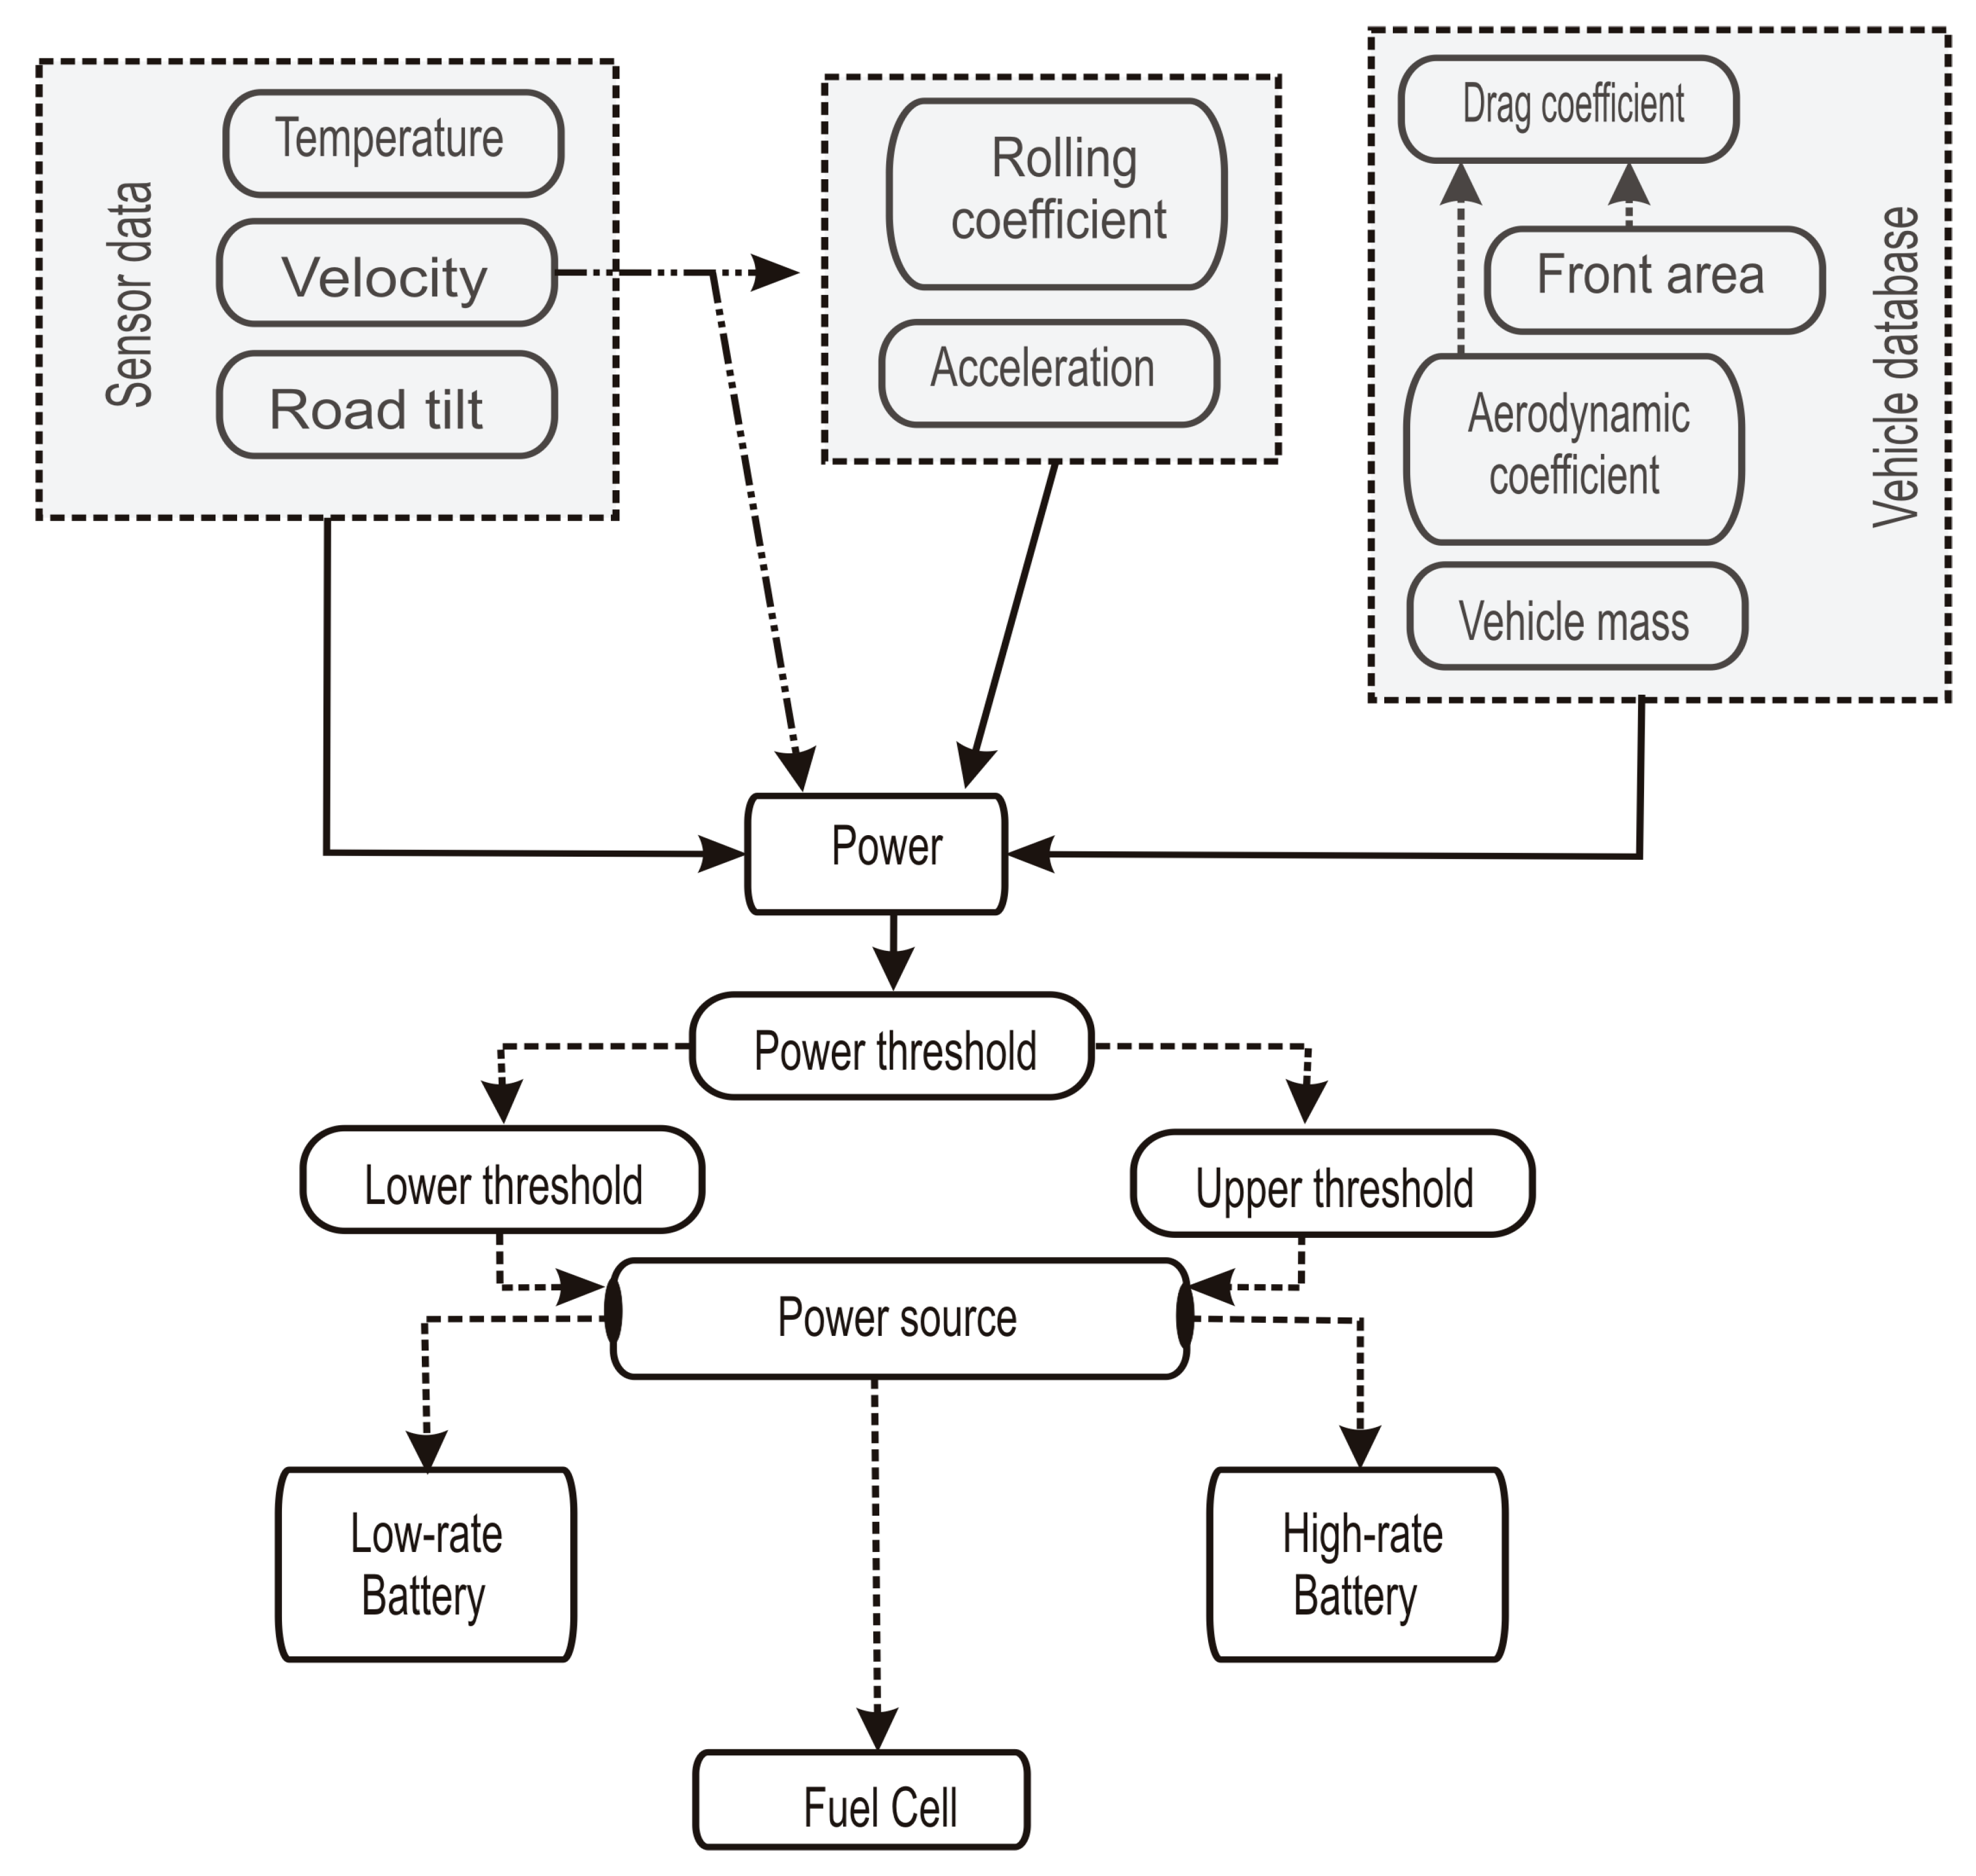
Once all the parameters involved in the power demand algorithm are known, the control system calculates the power demand, comparing the value to the setup threshold, switching from one power source to another, as shown in Figure 3.
The control system collects data from the vehicle database and sensors, determines the dynamic force parameters, and calculates the power demand; then, it compares the obtained value to the lower and higher threshold setup and engages the corresponding power source, the low-rate battery if the power demand is below the lower threshold, the high-rate battery if it is above the upper threshold, and the fuel cell if the power requirement is between these thresholds.
The continuous use of a battery indeed reduces its lifespan. However, this lifespan also depends inversely on the cycling depth of discharge (DOD); therefore, if we use a single battery for all driving conditions, the DOD increases for a daily route distance. Using a dual-battery block, light and heavy duty, where every battery runs on a specific task according to its characteristics, reduces the DOD of every battery, thus enlarging the battery lifespan. Additionally, if we combine the dual-battery block with a fuel cell, the battery DOD for a daily route is even lower and the lifespan becomes even longer. The control system automatically commutes from one power source to another with a switching time of less than 0.1 s, because of the built-in electronic control; therefore, the electric vehicle powertrain never runs out of energy.
The control system also evaluates the depth of discharge of the two batteries, applying the following algorithm:
D O D i = I D , i t i C r , i
Sub-index i denotes the route segment.
ID is the discharge current, t is the operation time, and Cr is the current battery capacity, which depends on the discharge rate, as:
C r , i = C n I r e f I D , i 0.0148
Cn is the nominal battery capacity provided by the manufacturer and Iref is the reference discharge current corresponding to the nominal capacity.
Combining Equations (16) and (17):
D O D i = t i C n I D , i 1.0148 I r e f 0.0148
Applying Ohm’s law:
D O D i = t i C n P i 1.0148 I r e f 0.0148 V b a t 1.0148
Because the nominal battery capacity, reference discharge time, and battery voltage are set up, Equation (19) converts into:
D O D i = K P i 1.0148 t i
where:
K = 1 C n I r e f 0.0148 V b a t 1.0148
Since the control system calculates the power demand, Pi, and measures the operating time, ti, it determines the battery depth of discharge for every route segment.
The control system adds the calculated depth of discharge (DOD) values and compares the cumulated data with the DOD limit value for the battery; when reaching this value, the control system blocks access to this battery and connects to the other one, if available, or to the fuel cell if both batteries are exhausted.
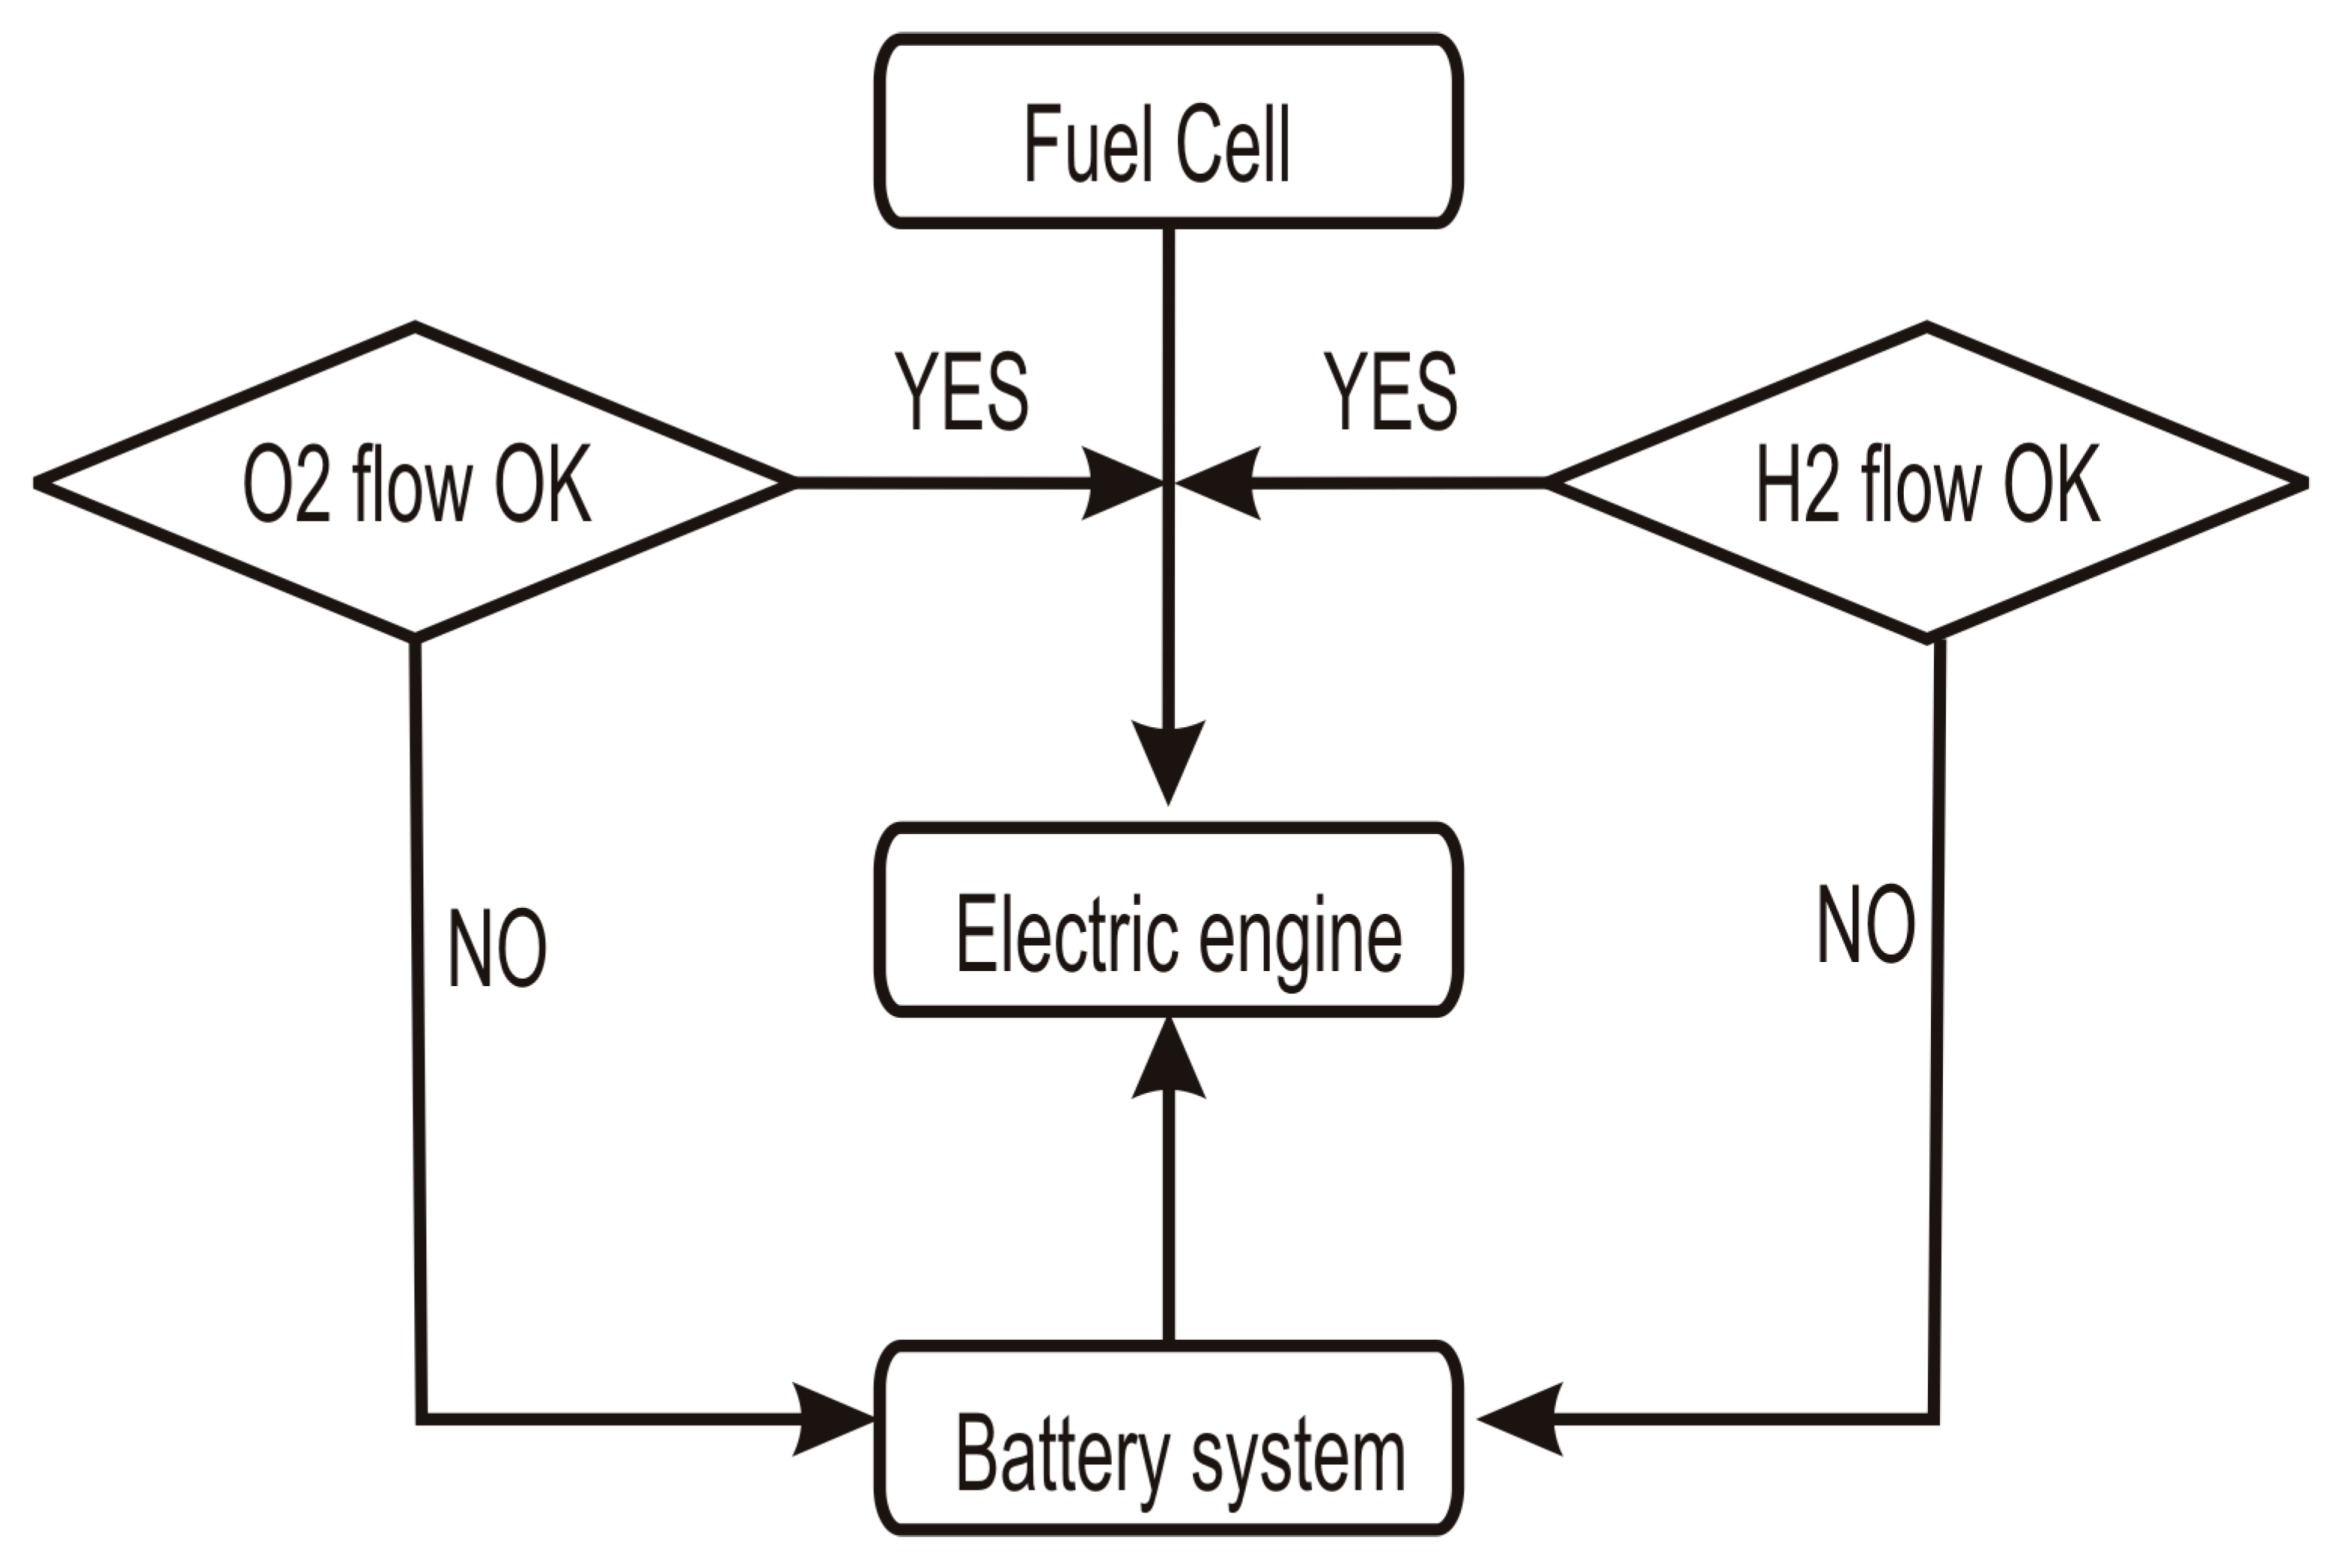
The control system regulates the hydrogen flow to the fuel cell according to Equation (5). Provided that we configure the fuel, the reversible cell voltage and the voltage drop are known; therefore, the hydrogen mass flow only depends on the cell power consumption, PFC, which is determined using Equation (6).
If the air flow is stopped or diminished below the minimum required to maintain the fuel cell’s operation, the fuel cell does not continue working and the system commutes to battery power source; this situation reduces the driving range of the vehicle and requires servicing. The flowchart in Figure 4 shows the control system operation.
The fuel cell is equipped with a water removal unit that eliminates water to avoid membrane flooding.

4. Engineering Design

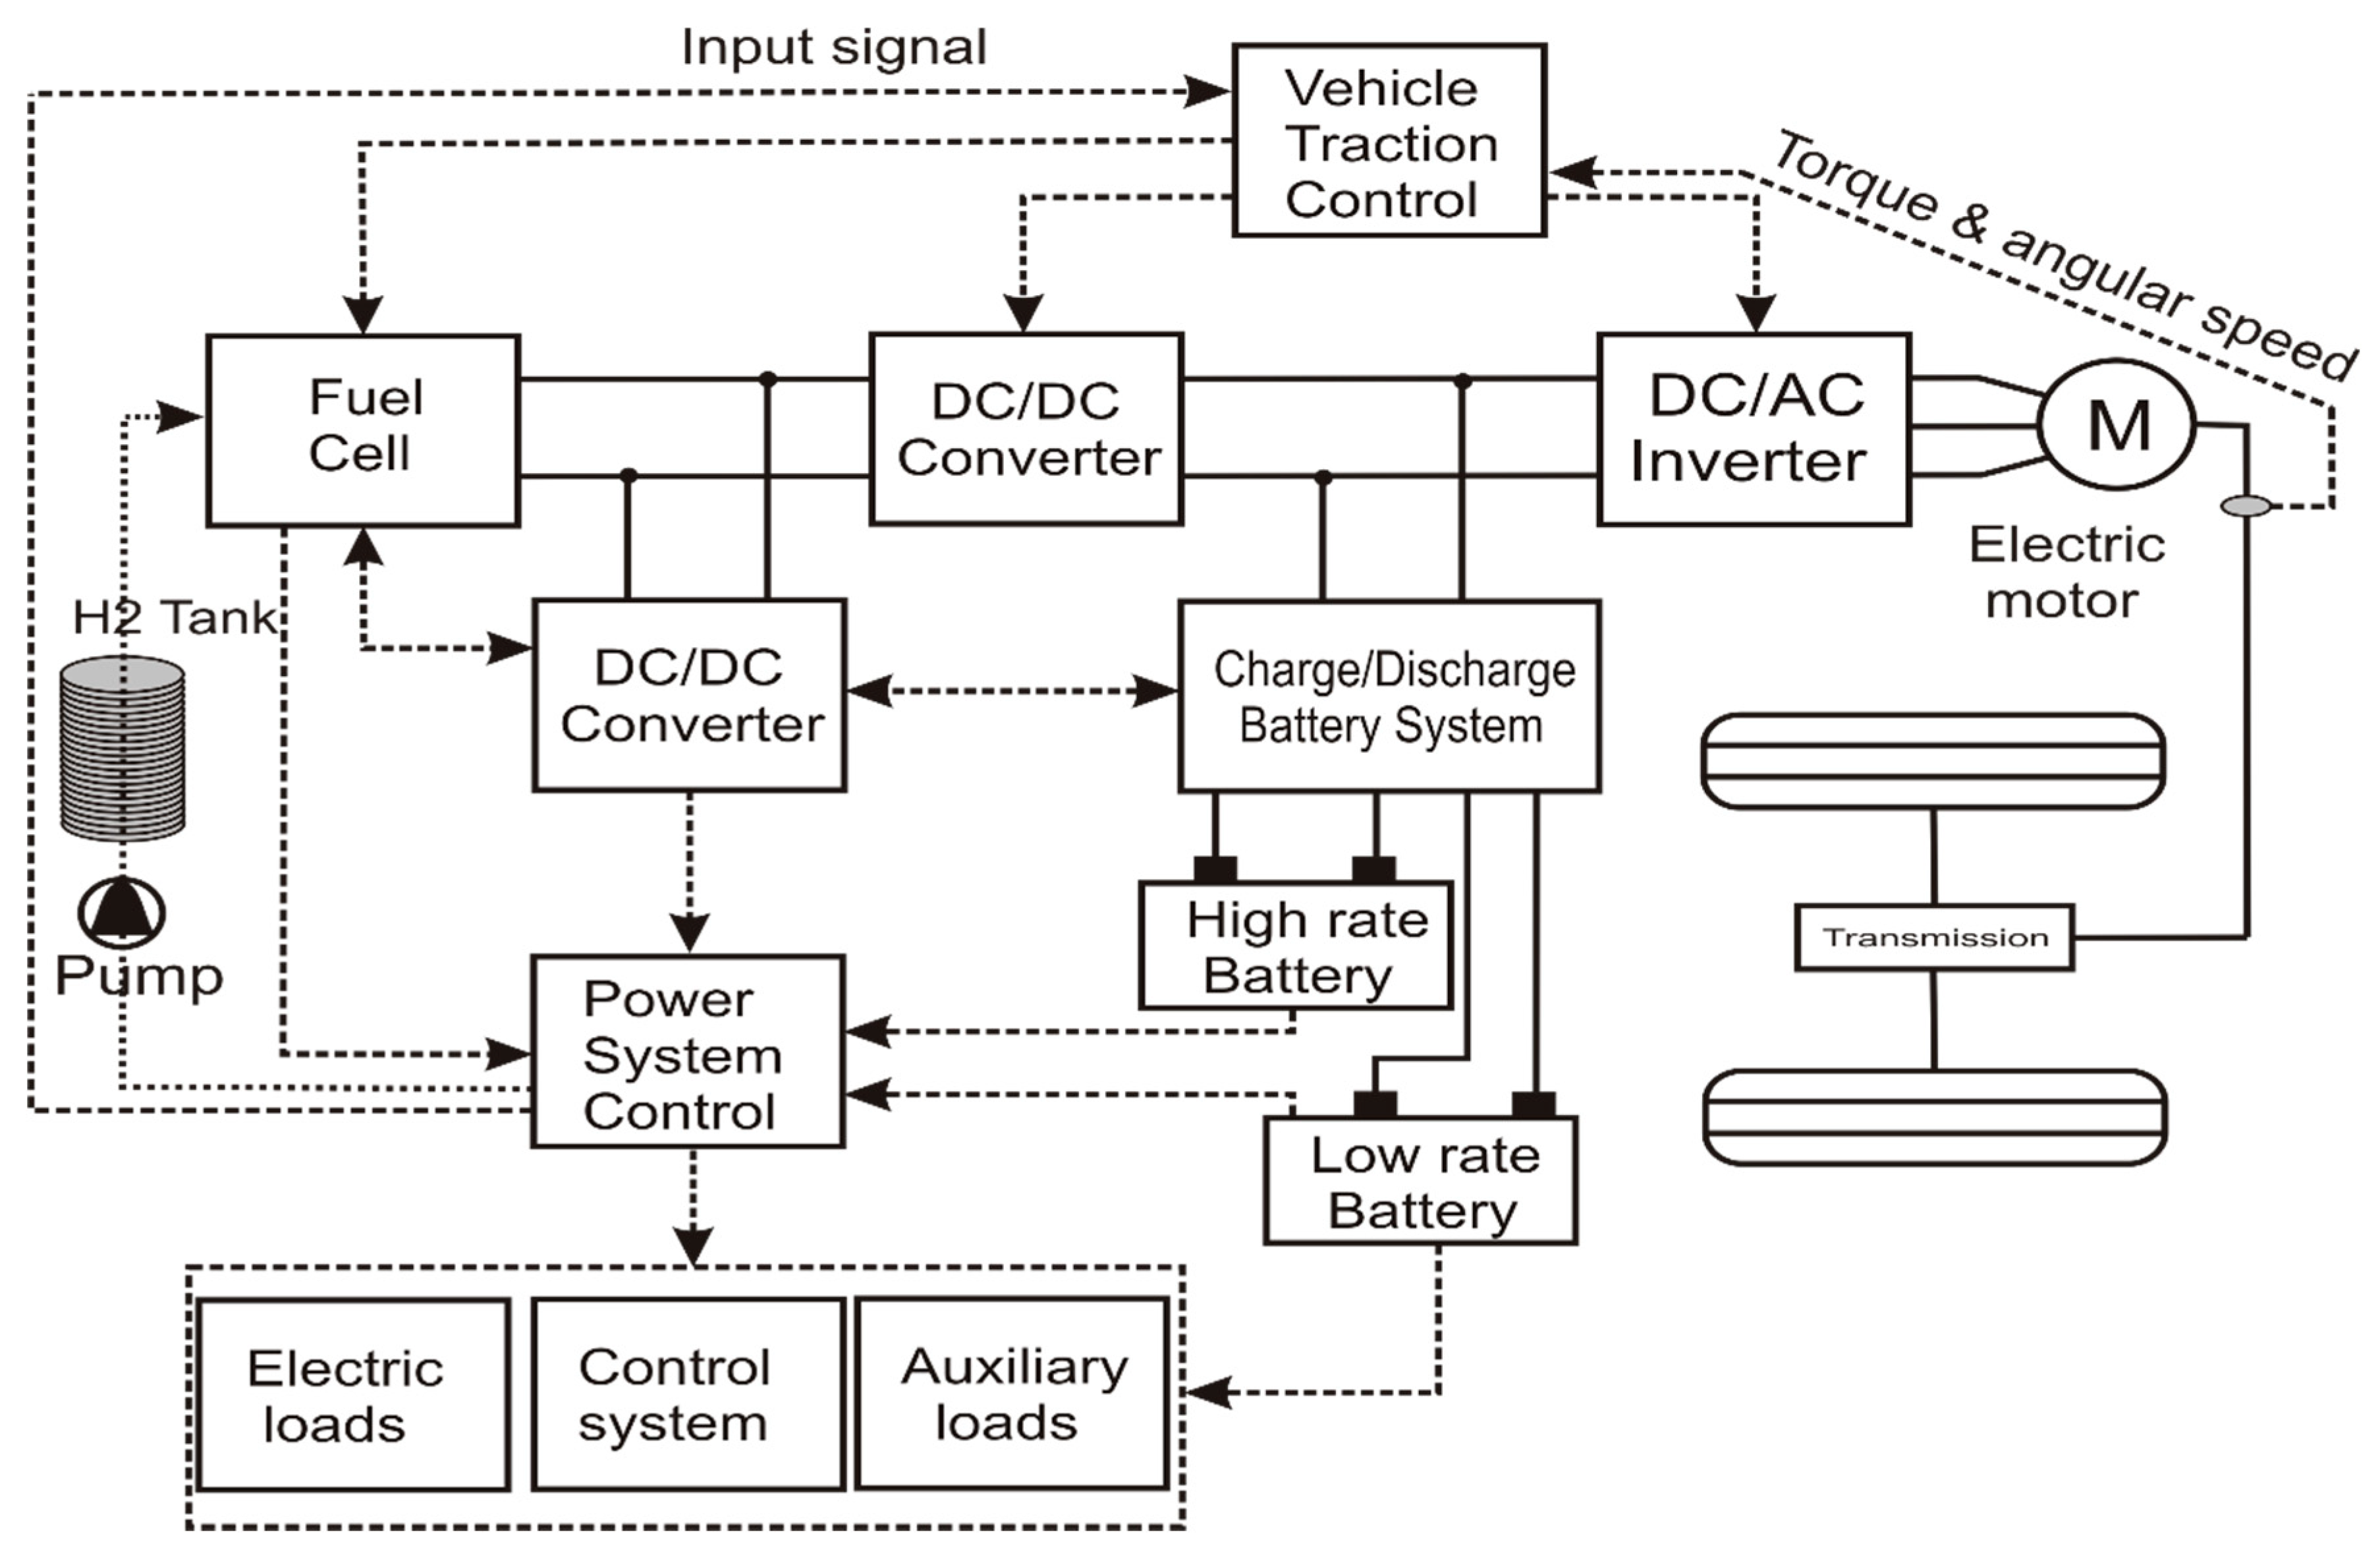
Hybrid fuel cells and lithium battery power systems for electric vehicles respond to the layout shown in Figure 5.
The basic structure of a fuel cell power system in an electric vehicle consists of a series and parallel fuel cell grouping to generate the required voltage and current to supply power to the electric motor. Figure 5 shows the schematic layout of the fuel cell power system for an electric vehicle.
The power system shown in Figure 5 operates under the control protocol set up by the implemented software, which includes the output power factor thresholds and the criteria corresponding to the specific power source configuration.
The power system control activates or deactivates every power source according to the power demand and the output power factor. Activation and deactivation occur automatically, with no delay, thanks to the system’s electronic control, which ensures a continuous power supply to the electric vehicle at all times.
The power source supplies energy not only to run the vehicle, but to serve the auxiliary elements, which means a negligible fraction of the global consumed energy, especially when compared to the required energy to power the vehicle.
Regarding the battery system size, we should mention that a dual-battery block only uses 5% more space than a single battery of the combined battery block capacity.

5. Simulation

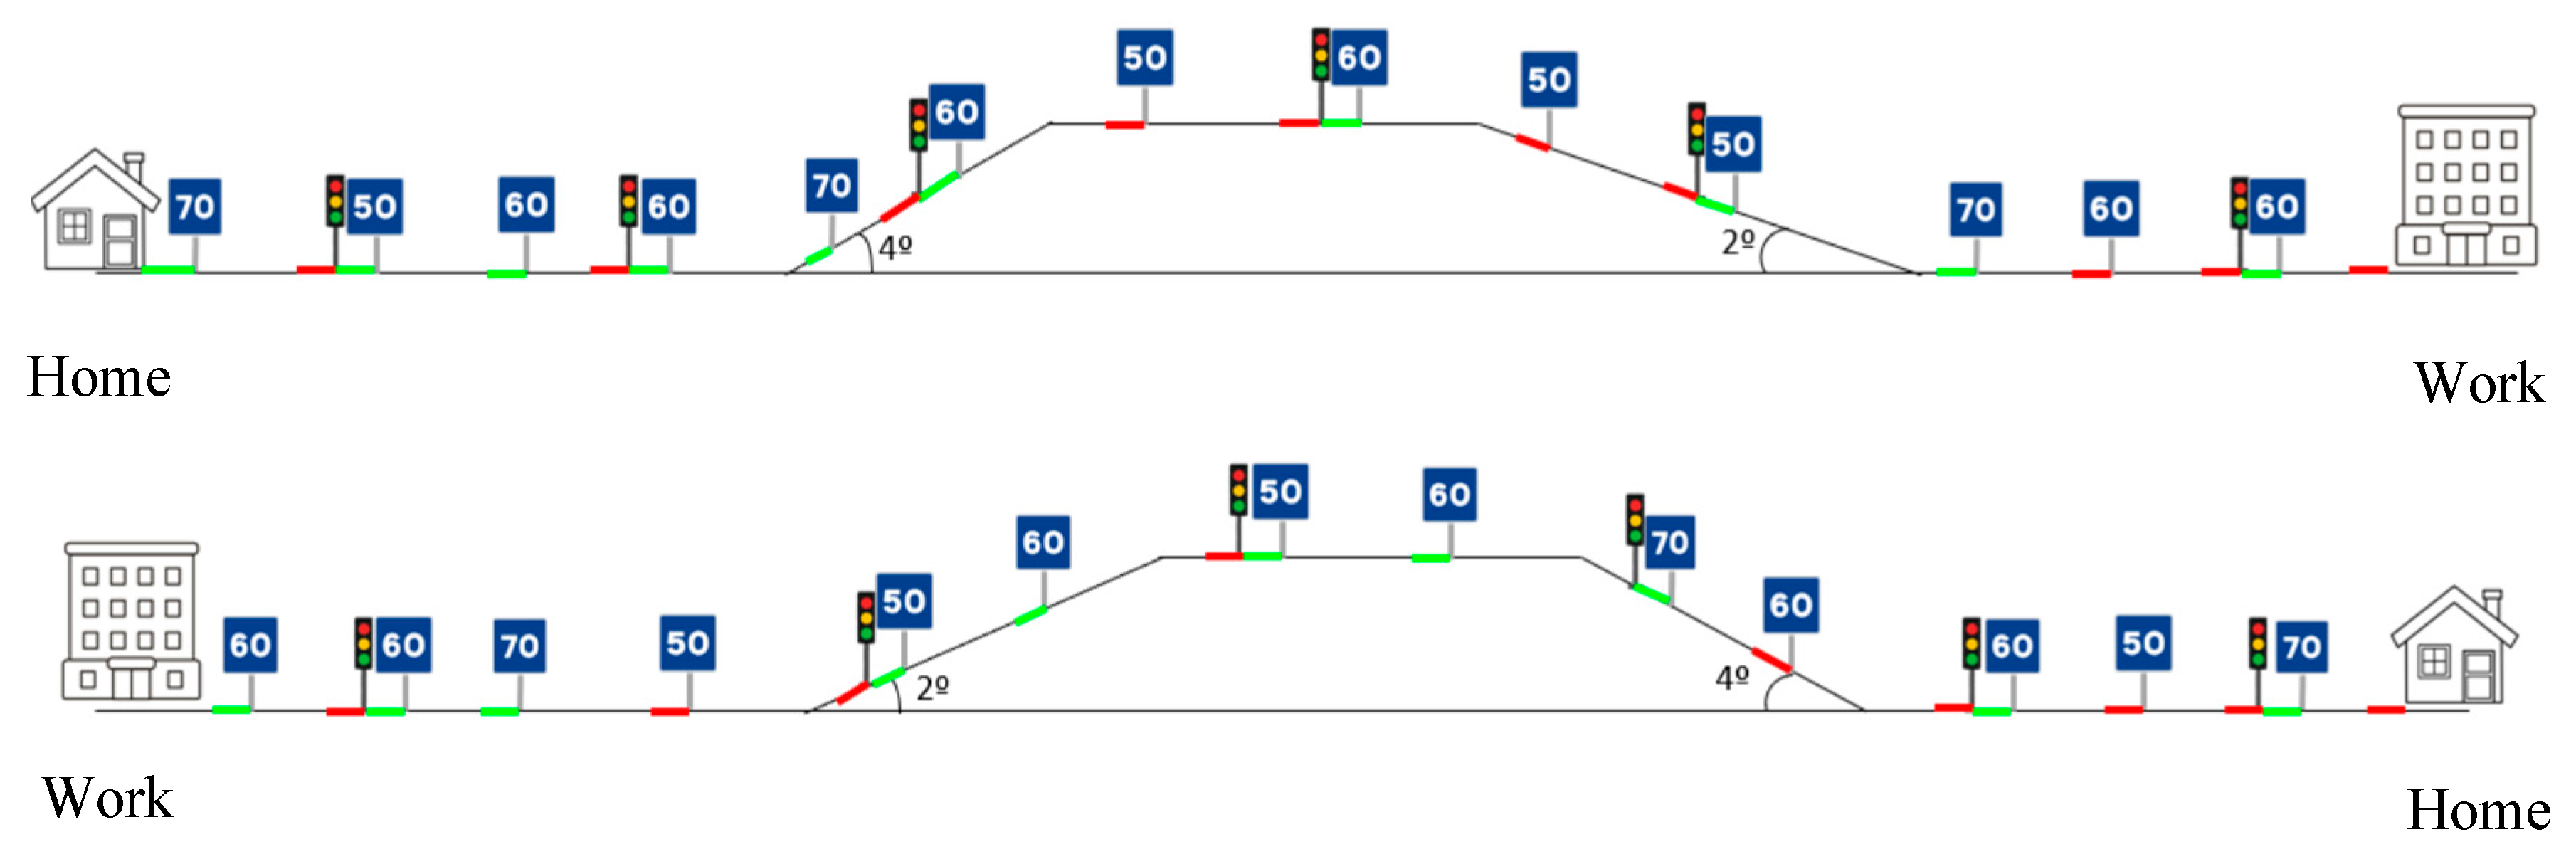
Hybrid system evaluation requires a simulation process that reflects the driving conditions, whatever they are. To facilitate the analysis of the hybrid system performance, we define a specific route which includes all road types and driving conditions, for example, horizontal, uphill and downhill road, acceleration, deceleration, and constant driving. Combining all them, we obtain a route like the one shown in Figure 6 [80].
The green, red, and gray segments in Figure 6 represent the acceleration, deceleration, and constant velocity processes. We consider an urban standard round-trip route for a total driving time of 20 min and a travelling distance of 20 km each way.
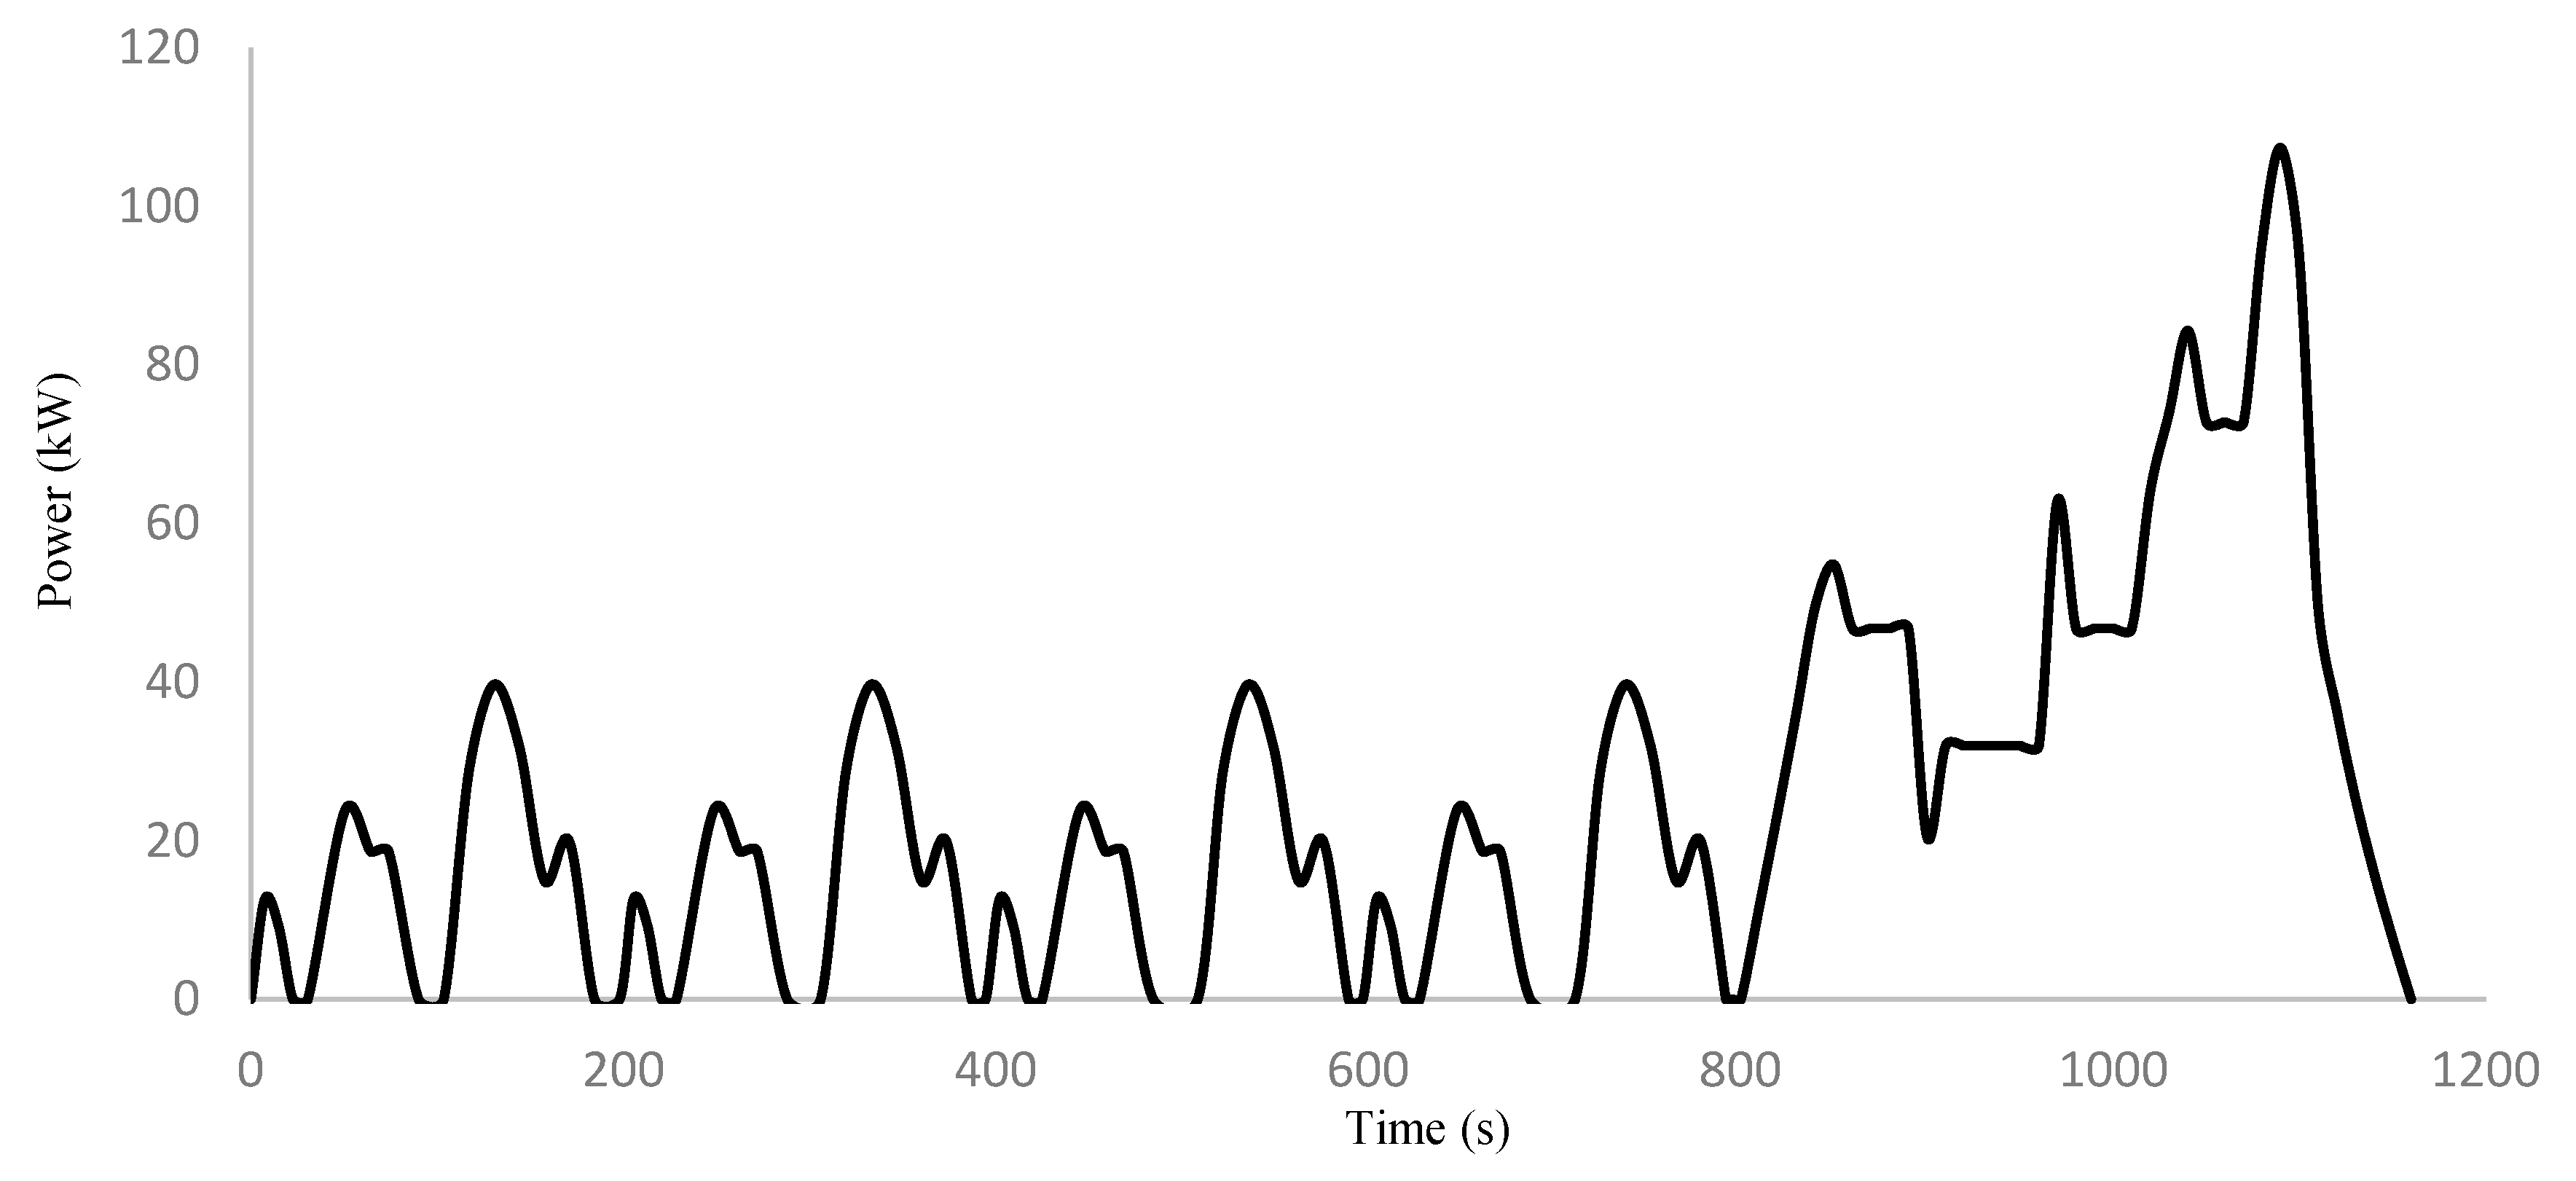
Applying driving conditions to the round-trip route shown in Figure 3, we obtain the evolution of the power demand (Figure 7) [21].
The values for Figure 7 are derived from the electric vehicle characteristics listed in Table 1.
Integrating the power evolution in Figure 7 over time resulted in a consumed energy of 4.568 kWh. The test ran on an electric vehicle prototype equipped with a 60 kWh battery. The partial distance corresponding to the running test was 30 km. Therefore, the electric vehicle prototype driving range resulted in being 394 km, consistent with the standard values in commercial electric vehicles [146,147,148,149,150].
We considered an electric vehicle powered by a 145 CV (106 kW) electric engine to run the simulation. Applying the fuel cell efficiency curve, we divided the power range into three sections: lower than 10%, between 10% and 48%, and higher than 48% of the maximum power source; therefore, the power thresholds were 10.6 kW and 50.9 kW.
The power range division corresponds to the three different sections where the fuel cell power efficiency is constant (see Figure 1).
To analyze the different power configurations, we developed the simulation for the following cases (Table 2).
Depending on the configuration adopted for the electric vehicle power system, there were different energy consumptions for the low, medium, and high sections; therefore, for the global process. Table 3 shows the simulation results for the configurations indicated in Table 2.
An analysis of the simulation results shows that the D-configuration was the one that used less energy, therefore making it the most efficient. The use of a fuel cell for low and medium output power, the C-configuration, increased the energy consumption and penalized the efficiency. Nevertheless, using the fuel cell only for a low output power range, the B-configuration, produced better results with a lower energy consumption and higher efficiency. An intermediate value for the consumed energy and system efficiency occurred for the A-configuration, where a high-rate battery was omitted, and the fuel cell powered the vehicle for a medium and high output power factor.
For a more extensive analysis, we compare the data from Table 3 to the energy consumption for a single power source, low-rate battery, high-rate battery, and fuel cell. The results of the comparative analysis are shown in Table 4.
Analyzing the data from Table 4, we realize that the hybrid system saves energy compared to a single power source. Table 5 shows the energy savings for every single power source and configuration.
The energy saving was higher when compared to the low-rate battery because of the lower efficiency of this power source for the entire operational range. The lowest energy saving corresponded to the fuel cell, the most efficient power source. On average, the energy savings for the low-rate battery, high-rate battery, and fuel cell were 35.7%, 33.1%, and 27.8%, respectively.
If we use a gasoline combustion engine, the average energy consumption is 248,782 kWh. Compared to the data from Table 4, we realize the hybrid power system reduces the energy consumption by 48.8% on average.
We sized the power source elements by applying the configuration criteria set up in Table 2 to the simulation results in Table 3. Table 6 shows the energy capacity, in kWh, of the three power units, depending on the power source configuration.
We rounded the energy capacity values to accommodate comparing the simulation results to commercial data.
Since fuel cells have no storage energy but a hydrogen reservoir, we should convert the energy capacity in Table 6 into hydrogen mass storage. Applying Equations (4) and (6) and considering the standard values for a PEMFC [126]:
m H 2 = 3.32 × 10 27 3.6 × 10 6 P F C 3.2 × 10 19 0.655
Which results in the following values (Table 7).
Applying the fuel cell operational time for every configuration and considering a 500 atmosphere tank pressure, the hydrogen tank volume results are shown in Table 8.
An analysis of the results from Table 6 shows that the A and C configurations require a rank volume that exceeds the current value for a light electric vehicle; therefore, these configurations are unsuitable for commercial applications.
The B-configuration requires a lower hydrogen tank but needs a larger high-rate battery capacity, which means more space and a higher cost, since high-rate batteries are more expensive than low-rate ones.
On the other hand, the D-configuration is more complex than the B-configuration since it requires two types of lithium battery instead of a single one. Nevertheless, the higher cost of the high-rate lithium battery compensates the additional cost of the more complex layout.
The data obtained from calculations confirm the expected results within a 92% accuracy.
The high accuracy obtained from the simulation validates the methodology and proves that the proposed method is suitable for managing multi-power-source systems for electric vehicles. It also confirms the expected results, as for the determined values for the different parameters in the various operating conditions.
The application of mathematical models like Taguchi [151] or TOPSIS [152] may optimize the calculation process, especially by reducing losses and increasing accuracy. These procedures have not been applied, since we believe the accuracy value obtained from the simple proposed process is good enough to validate the methodology. However, the use of the aforementioned models will result in a higher accuracy.

6. Hydrogen Risks and Safety Precautions

Hydrogen is highly flammable, and leaks create serious fire risks; however, due to its lightness, hydrogen rapidly disperses upwards, reducing this ignition risk. Nevertheless, hydrogen ignites and burns easier than gasoline or diesel, which increases the fire risk. Indeed, static electricity from a finger is enough to trigger an explosion in contact with hydrogen [153,154,155]. Therefore, we must consider safety precautions in electric vehicles equipped with fuel cells and hydrogen and at urban hydrogen refueling stations [156,157,158]. Since hydrogen is odorless and colorless, it is undetectable in ambient air, even when flaming; therefore, it represents a significant risk, especially in confined areas like a car cockpit, because it displaces oxygen and provokes suffocation [159,160,161].
To prevent hydrogen hazards, fuel cell electric vehicles provide safety measurements to prevent car drivers and passengers from dying. To warn about undetected hydrogen leaking, FCEV manufacturers implement hydrogen detection sensors in the cockpit to warn car drivers of abnormal hydrogen concentration. Adequate ventilation prevents hydrogen concentrations in the cockpit. They also equip hydrogen storage tanks with a Thermally Activated Pressure Relief Device (TPRD), which controls the tank pressure and relieves fuel excess to the environment, if necessary [162,163,164,165].

7. Future and Complementary Work

Electric vehicle power system layouts are subjected to alternative configurations like a single electric battery and fuel cell, which is now under study by the author, a fuel cell and supercapacitor, a single battery and supercapacitor, a dual-battery block, or an electric battery and PV system.

8. Conclusions

The combination of a fuel cell with low- and high-rate lithium batteries for powering electric vehicles results in the most efficient configuration of hybrid power sources, minimizing the global energy consumption when used for the appropriate output power range. In this case, we recommend using the low-rate battery for the low output power range, the fuel cell for the intermediate output power range, and the high-rate battery for high output power range. The output power range is from 0% to 10% for low one, 10% to 48% for intermediate, and above 48% for the high one.
An alternative solution is a hybrid fuel cell and high-rate lithium battery, which shows a less complex structure and a little higher energy consumption. This configuration operates with the fuel cell for the low output power range and within the high-rate lithium battery for the intermediate and high output power ranges. Despite an apparent less complex layout for this configuration, it may not represent a cheaper system, since the larger size of the high-rate lithium battery compensates for the extra cost of the double-lithium-battery system.
Alternative configurations like using a low-rate lithium battery for the low output power range and a fuel cell for the intermediate and high range, or a fuel cell for the low and intermediate output power range and high-rate lithium battery for the high output power range, are not suitable for commercial applications because of the large hydrogen tank required to service the fuel cell unit.
Despite this paper proposing alternative configurations for electric vehicles which improve energy efficiency and reduce energy consumption, additional work may be conducted to optimize the electric vehicle performance through managing tools like fuzzy logic and neuronal networks applied to battery capacity and reliability and to fuel cell structure and operation.

Funding

This research has received no funding.

Institutional Review Board Statement

No applicable.

Informed Consent Statement

Not applicable.

Data Availability Statement

Data available from author on request.

Conflicts of Interest

No conflict of interest.

References

  1. Ogura, K.; Kolhe, M.L. Battery technologies for electric vehicles. In Electric Vehicles: Prospects and Challenges; Elsevier: Amsterdam, The Netherlands, 2017; pp. 139–167. [Google Scholar]
  2. Chen, X.; Shen, W.; Vo, T.T.; Cao, Z.; Kapoor, A. An overview of lithium-ion batteries for electric vehicles. In Proceedings of the 2012 10th International Power & Energy Conference (IPEC), Ho Chi Minh City, Vietnam, 12–14 December 2012; IEEE: Piscataway, NJ, USA, 2012; pp. 230–235. [Google Scholar]
  3. Liu, W.; Placke, T.; Chau, K.T. Overview of batteries and battery management for electric vehicles. Energy Rep. 2022, 8, 4058–4084. [Google Scholar] [CrossRef]
  4. Kennedy, B.; Patterson, D.; Camilleri, S. Use of lithium-ion batteries in electric vehicles. J. Power Sources 2000, 90, 156–162. [Google Scholar] [CrossRef]
  5. Lowe, M.; Tokuoka, S.; Trigg, T.; Gereffi, G. Lithium-Ion Batteries for Electric Vehicles: The US Value Chain; Center on Globalization, Governance & Competitiveness Duke University: Durham, NC, USA, 2010. [Google Scholar]
  6. Zeng, X.; Li, M.; Abd El-Hady, D.; Alshitari, W.; Al-Bogami, A.S.; Lu, J.; Amine, K. Commercialization of lithium battery technologies for electric vehicles. Adv. Energy Mater. 2019, 9, 1900161. [Google Scholar] [CrossRef]
  7. Diouf, B.; Pode, R. Potential of lithium-ion batteries in renewable energy. Renew. Energy 2015, 76, 375–380. [Google Scholar] [CrossRef]
  8. Perner, A.; Vetter, J. Lithium-ion batteries for hybrid electric vehicles and battery electric vehicles. In Advances in Battery Technologies for Electric Vehicles; Woodhead Publishing: Sawston, UK, 2015; pp. 173–190. [Google Scholar]
  9. Vidyanandan, K.V. Batteries for Electric Vehicles; Power Management Institute: Noida, India, 2019. [Google Scholar]
  10. Lai, X.; Chen, Q.; Tang, X.; Zhou, Y.; Gao, F.; Guo, Y.; Bhagat, R.; Zheng, Y. Critical review of life cycle assessment of lithium-ion batteries for electric vehicles: A lifespan perspective. Etransportation 2022, 12, 100169. [Google Scholar] [CrossRef]
  11. Lu, L.; Han, X.; Li, J.; Hua, J.; Ouyang, M. A review on the key issues for lithium-ion battery management in electric vehicles. J. Power Sources 2013, 226, 272–288. [Google Scholar] [CrossRef]
  12. Affanni, A.; Bellini, A.; Franceschini, G.; Guglielmi, P.; Tassoni, C. Battery choice and management for new-generation electric vehicles. IEEE Trans. Ind. Electron. 2005, 52, 1343–1349. [Google Scholar] [CrossRef]
  13. Armenta-Déu, C.; Carriquiry, J.P.; Guzmán, S. Capacity correction factor for Li-ion batteries: Influence of the discharge rate. J. Energy Storage 2019, 25, 100839. [Google Scholar] [CrossRef]
  14. Armenta-Déu, C. Reduction of Electric Vehicle Driving Range due to Battery Capacity Fading. J. Automob. Eng. Appl. 2021, 8, 2. [Google Scholar] [CrossRef]
  15. Atalay, S.; Sheikh, M.; Mariani, A.; Merla, Y.; Bower, E.; Widanage, W.D. Theory of battery ageing in a lithium-ion battery: Capacity fade, nonlinear ageing and lifetime prediction. J. Power Sources 2020, 478, 229026. [Google Scholar] [CrossRef]
  16. Broussely, M.; Biensan, P.; Bonhomme, F.; Blanchard, P.; Herreyre, S.; Nechev, K.; Staniewicz, R.J. Main aging mechanisms in Li ion batteries. J. Power Sources 2005, 146, 90–96. [Google Scholar] [CrossRef]
  17. Fernández, I.J.; Calvillo, C.F.; Sánchez-Miralles, A.; Boal, J. Capacity fade and aging models for electric batteries and optimal charging strategy for electric vehicles. Energy 2013, 60, 35–43. [Google Scholar] [CrossRef]
  18. Omar, N.; Firouz, Y.; Gualous, H.; Salminen, J.; Kallio, T.; Timmermans, J.M.; Coosemans, T.; Van den Bossche, P.; Van Mierlo, J. Aging and degradation of lithium-ion batteries. In Rechargeable Lithium Batteries; Woodhead Publishing: Sawston, UK, 2015; pp. 263–279. [Google Scholar]
  19. Keil, P.; Jossen, A. Aging of lithium-ion batteries in electric vehicles: Impact of regenerative braking. World Electr. Veh. J. 2015, 7, 41–51. [Google Scholar] [CrossRef]
  20. Collath, N.; Tepe, B.; Englberger, S.; Jossen, A.; Hesse, H. Aging aware operation of lithium-ion battery energy storage systems: A review. J. Energy Storage 2022, 55, 105634. [Google Scholar] [CrossRef]
  21. Martínez-Arriaga, M.; Armenta-Déu, C. Simulation of the Performance of Electric Vehicle Batteries under variable Driving Conditions. J. Automob. Eng. Appl. 2020, 7, 1–15. [Google Scholar] [CrossRef]
  22. García-Arranz, L.; Armenta-Déu, C. Performance Tests to Determine Driving Range in Electric Vehicles. J. Mechatron. Autom. 2021, 8, 10–20. [Google Scholar]
  23. Desantes, J.M.; Novella, R.; Pla, B.; Lopez-Juarez, M. Effect of dynamic and operational restrictions in the energy management strategy on fuel cell range extender electric vehicle performance and durability in driving conditions. Energy Convers. Manag. 2022, 266, 115821. [Google Scholar] [CrossRef]
  24. Al-Wreikat, Y.; Serrano, C.; Sodré, J.R. Driving behaviour and trip condition effects on the energy consumption of an electric vehicle under real-world driving. Appl. Energy 2021, 297, 117096. [Google Scholar] [CrossRef]
  25. Szumska, E.M.; Jurecki, R.S. Parameters influencing on electric vehicle range. Energies 2021, 14, 4821. [Google Scholar] [CrossRef]
  26. Varga, B.O.; Sagoian, A.; Mariasiu, F. Prediction of electric vehicle range: A comprehensive review of current issues and challenges. Energies 2019, 12, 946. [Google Scholar] [CrossRef]
  27. Steinstraeter, M.; Heinrich, T.; Lienkamp, M. Effect of low temperature on electric vehicle range. World Electr. Veh. J. 2021, 12, 115. [Google Scholar] [CrossRef]
  28. Belt, J.R.; Ho, C.D.; Miller, T.J.; Habib, M.A.; Duong, T.Q. The effect of temperature on capacity and power in cycled lithium ion batteries. J. Power Sources 2005, 142, 354–360. [Google Scholar] [CrossRef]
  29. Lu, Z.; Yu, X.L.; Wei, L.C.; Cao, F.; Zhang, L.Y.; Meng, X.Z.; Jin, L.W. A comprehensive experimental study on temperature-dependent performance of lithium-ion battery. Appl. Therm. Eng. 2019, 158, 113800. [Google Scholar] [CrossRef]
  30. Bandhauer, T.M.; Garimella, S.; Fuller, T.F. A critical review of thermal issues in lithium-ion batteries. J. Electrochem. Soc. 2011, 158, R1. [Google Scholar] [CrossRef]
  31. Zhang, R.; Li, X.; Sun, C.; Yang, S.; Tian, Y.; Tian, J. State of Charge and Temperature Joint Estimation Based on Ultrasonic Reflection Waves for Lithium-Ion Battery Applications. Batteries 2023, 9, 335. [Google Scholar] [CrossRef]
  32. Lu, Z.; Yu, X.; Zhang, L.; Meng, X.; Wei, L.; Jin, L. Experimental investigation on the charge-discharge performance of the commercial lithium-ion batteries. Energy Procedia 2017, 143, 21–26. [Google Scholar] [CrossRef]
  33. Ma, S.; Jiang, M.; Tao, P.; Song, C.; Wu, J.; Wang, J.; Deng, T.; Shang, W. Temperature effect and thermal impact in lithium-ion batteries: A review. Prog. Nat. Sci. Mater. Int. 2018, 28, 653–666. [Google Scholar] [CrossRef]
  34. Testing and Assessment Protocol Release 2.0. FIA Foundation. Updated on 20 April 2012. Available online: https://www.fia.com/news/pf-20-ready-2021-season (accessed on 21 December 2023).
  35. Emission Test Cycles ECE 15 + EUDC/NEDC. DieselNet. Available online: https://dieselnet.com/standards/cycles/ece_eudc.php (accessed on 22 December 2023).
  36. New European Driving Cycle. Available online: https://en.wikipedia.org/wiki/New_European_Driving_Cycle (accessed on 20 December 2023).
  37. Worldwide Harmonized Light Vehicles Test Procedure (WLTP)-Transport-Vehicle Regulations-UNECE Wiki. Available online: https://wiki.unece.org/ (accessed on 20 December 2023).
  38. WLTPfacts.eu-Worldwide Harmonised Light Vehicle Test Procedure. Available online: https://www.wltpfacts.eu/ (accessed on 20 December 2023).
  39. Worldwide Harmonised Light Vehicles Test Procedure. Available online: https://en.wikipedia.org/wiki/Worldwide_Harmonised_Light_Vehicles_Test_Procedure (accessed on 20 December 2023).
  40. US EPA. Dynamometer Drive Schedules; US EPA: Washington, DC, USA, 2014. [Google Scholar]
  41. DieselNet Emission Test Cycles-FTP-75. Available online: https://dieselnet.com/standards/cycles/ftp75.php (accessed on 23 December 2023).
  42. FTP-75. Available online: https://en.wikipedia.org/wiki/FTP-75#cite_note-EPA_cycles-5 (accessed on 20 December 2023).
  43. Japan Automobile Manufacturers Association. From 10•15 to JC08: Japan’s New Economy Formula; Japan Automobile Manufacturers Association: Tokyo, Japan, 2009. [Google Scholar]
  44. Prius Certified to Japanese 2015 Fuel Economy Standards with JC08 Test Cycle. Green Car Congress. 11 August 2007. Retrieved 9 April 2012. Available online: https://www.greencarcongress.com/2007/08/prius-certified.html (accessed on 23 December 2023).
  45. Japanese JC08Test. Fuel Economy in Automobiles. Available online: https://en.wikipedia.org/wiki/Fuel_economy_in_automobiles#JC08 (accessed on 20 December 2023).
  46. Emissions Tests Explained. Rivervale. Available online: https://www.rivervaleleasing.co.uk/guides/leasing-overview/difference-between-wltp-and-nedc-emissions-tests-explained (accessed on 20 December 2023).
  47. Lee, H.; Lee, K. Comparative evaluation of the effect of vehicle parameters on fuel consumption under NEDC and WLTP. Energies 2020, 13, 4245. [Google Scholar] [CrossRef]
  48. Liu, X.; Zhao, F.; Hao, H.; Chen, K.; Liu, Z.; Babiker, H.; Amer, A.A. From NEDC to WLTP: Effect on the Energy Consumption, NEV Credits, and Subsidies Policies of PHEV in the Chinese Market. Sustainability 2020, 12, 5747. [Google Scholar] [CrossRef]
  49. Koszałka, G.; Szczotka, A.; Suchecki, A. Comparison of fuel consumption and exhaust emissions in WLTP and NEDC procedures. Combust. Engines 2019, 58, 186–191. [Google Scholar] [CrossRef]
  50. Karamangil, M.; Tekin, M. Comparison of fuel consumption and recoverable energy according to NEDC and WLTP cycles of a vehicle. CT&F-Cienc. Tecnol. Y Futuro 2022, 12, 31–38. [Google Scholar]
  51. WLTP Cycle Replaces NEDC. Eurococ. Available online: https://www.eurococ.eu/en/blog/wltp-cycle-replaces-nedc/#:~:text=The%20WLTP%20simulates%20the%20real,reflect%20real-world%20driving%20conditions (accessed on 20 December 2023).
  52. Kasten, P.; Blanck, R. The Changeover from the NEDC to the WLTP and Its Impact on the Effectiveness and the Post-2020 Update of the CO2 Emission Standards; Öko-Institut: Breisgau, Germany, 2017. [Google Scholar]
  53. Leard, B.; McConnell, V. Progress and Potential for Electric Vehicles to Reduce Carbon Emissions; No. 20-24; Resources for the Future: Washington, DC, USA, 2020. [Google Scholar]
  54. Casals, L.C.; Martinez-Laserna, E.; García, B.A.; Nieto, N. Sustainability analysis of the electric vehicle use in Europe for CO2 emissions reduction. J. Clean. Prod. 2016, 127, 425–437. [Google Scholar] [CrossRef]
  55. Mehlig, D.; Staffell, I.; Stettler, M.; ApSimon, H. Accelerating electric vehicle uptake favours greenhouse gas over air pollutant emissions. Transp. Res. Part D Transp. Environ. 2023, 124, 103954. [Google Scholar] [CrossRef]
  56. Ghosh, A. Possibilities and challenges for the inclusion of the electric vehicle (EV) to reduce the carbon footprint in the transport sector: A review. Energies 2020, 13, 2602. [Google Scholar] [CrossRef]
  57. Fuinhas, J.A.; Koengkan, M.; Leitão, N.C.; Nwani, C.; Uzuner, G.; Dehdar, F.; Relva, S.; Peyerl, D. Effect of battery electric vehicles on greenhouse gas emissions in 29 European Union countries. Sustainability 2021, 13, 13611. [Google Scholar] [CrossRef]
  58. Afkhami, B.; Akbarian, B.; Ansari, E. Adoption of battery electric vehicles for reduction of greenhouse gases and air pollutant emissions: A case study of the United States. Energy Storage 2022, 4, e280. [Google Scholar] [CrossRef]
  59. Ajanovic, A.; Haas, R. Dissemination of electric vehicles in urban areas: Major factors for success. Energy 2016, 115, 1451–1458. [Google Scholar] [CrossRef]
  60. Kester, J.; Noel, L.; de Rubens, G.Z.; Sovacool, B.K. Policy mechanisms to accelerate electric vehicle adoption: A qualitative review from the Nordic region. Renew. Sustain. Energy Rev. 2018, 94, 719–731. [Google Scholar] [CrossRef]
  61. Ripple, W.J.; Wolf, C.; Newsome, T.M.; Barnard, P.; Moomaw, W.R. World scientists’ warning of a climate emergency. BioScience 2020, 70, 8–100. [Google Scholar] [CrossRef]
  62. McMichael, A.J.; Woodruff, R.E.; Hales, S. Climate change and human health: Present and future risks. Lancet 2006, 367, 859–869. [Google Scholar] [CrossRef] [PubMed]
  63. Van Aalst, M.K. The impacts of climate change on the risk of natural disasters. Disasters 2006, 30, 5–18. [Google Scholar] [CrossRef]
  64. Haines, A.; Kovats, R.S.; Campbell-Lendrum, D.; Corvalán, C. Climate change and human health: Impacts, vulnerability, and mitigation. Lancet 2006, 367, 2101–2109. [Google Scholar] [CrossRef]
  65. Patz, J.A.; Campbell-Lendrum, D.; Holloway, T.; Foley, J.A. Impact of regional climate change on human health. Nature 2005, 438, 310–317. [Google Scholar] [CrossRef] [PubMed]
  66. Skrúcaný, T.; Kendra, M.; Stopka, O.; Milojević, S.; Figlus, T.; Csiszár, C. Impact of the Electric Mobility Implementation on the Greenhouse Gases Production in Central European Countries. Sustainability 2019, 11, 4948. [Google Scholar] [CrossRef]
  67. Milojević, S.; Miletic, I.; Stojanovic, B.; Milojević, I.; Miletić, M. Logistics of electric drive motor vehicles recycling. Mobil. Veh. Mech. Int. J. Veh. Mech. Engines Transp. Syst. 2020, 46, 2. [Google Scholar] [CrossRef]
  68. Jing, R.; Yuan, C.; Rezaei, H.; Qian, J.; Zhang, Z. Assessments on emergy and greenhouse gas emissions of internal combustion engine automobiles and electric automobiles in the USA. J. Environ. Sci. 2020, 90, 297–309. [Google Scholar] [CrossRef] [PubMed]
  69. Choi, W.; Yoo, E.; Seol, E.; Kim, M.; Song, H.H. Greenhouse gas emissions of conventional and alternative vehicles: Predictions based on energy policy analysis in South Korea. Appl. Energy 2020, 265, 114754. [Google Scholar] [CrossRef]
  70. Schipper, L.; Leather, J.; Fabian, H. Transport and Carbon Dioxide Emissions: Forecasts, Options Analysis, and Evaluation; Asian Development Bank: Mandaluyong, Philippines, 2009. [Google Scholar]
  71. Sim, S.; Oh, J.; Jeong, B. Measuring greenhouse gas emissions for the transportation sector in Korea. Ann. Oper. Res. 2015, 230, 129–151. [Google Scholar] [CrossRef]
  72. Gerber Machado, P.; Rodrigues Teixeira, A.C.; Mendes de Almeida Collaço, F.; Hawkes, A.; Mouette, D. Assessment of greenhouse gases and pollutant emissions in the road freight transport sector: A case study for São Paulo State, Brazil. Energies 2020, 13, 5433. [Google Scholar] [CrossRef]
  73. Varma, M.; Mal, H.; Pahurkar, R.; Swain, R. Comparative analysis of green house gases emission in conventional vehicles and electric vehicles. Int. J. Adv. Sci. Technol. 2020, 29, 689–695. [Google Scholar]
  74. Adhikari, M.; Ghimire, L.P.; Kim, Y.; Aryal, P.; Khadka, S.B. Identification and analysis of barriers against electric vehicle use. Sustainability 2020, 12, 4850. [Google Scholar] [CrossRef]
  75. Panwar, U.; Kumar, A.; Chakrabarti, D. Barriers in implementation of electric vehicles in India. Int. J. Electr. Hybrid Veh. 2019, 11, 195–204. [Google Scholar] [CrossRef]
  76. Chidambaram, K.; Ashok, B.; Vignesh, R.; Deepak, C.; Ramesh, R.; Narendhra, T.M.; Usman, K.M.; Kavitha, C. Critical analysis on the implementation barriers and consumer perception toward future electric mobility. Proc. Inst. Mech. Eng. Part D J. Automob. Eng. 2023, 237, 622–654. [Google Scholar] [CrossRef]
  77. Sopha, B.M.; Purnamasari, D.M.; Ma’mun, S. Barriers and enablers of circular economy implementation for electric-vehicle batteries: From systematic literature review to conceptual framework. Sustainability 2022, 14, 6359. [Google Scholar] [CrossRef]
  78. Mahdavian, A.; Shojaei, A.; Mccormick, S.; Papandreou, T.; Eluru, N.; Oloufa, A.A. Drivers and barriers to implementation of connected, automated, shared, and electric vehicles: An agenda for future research. IEEE Access 2021, 9, 22195–22213. [Google Scholar] [CrossRef]
  79. Krishna, G. Understanding and identifying barriers to electric vehicle adoption through thematic analysis. Transp. Res. Interdiscip. Perspect. 2021, 10, 100364. [Google Scholar] [CrossRef]
  80. O’Neill, E.; Moore, D.; Kelleher, L.; Brereton, F. Barriers to electric vehicle uptake in Ireland: Perspectives of car-dealers and policy-makers. Case Stud. Transp. Policy 2019, 7, 118–127. [Google Scholar] [CrossRef]
  81. Xia, X.; Li, P.; Xia, Z.; Wu, R.; Cheng, Y. Life cycle carbon footprint of electric vehicles in different countries: A review. Sep. Purif. Technol. 2022, 301, 122063. [Google Scholar] [CrossRef]
  82. Li, P.; Xia, X.; Guo, J. A review of the life cycle carbon footprint of electric vehicle batteries. Sep. Purif. Technol. 2022, 296, 121389. [Google Scholar] [CrossRef]
  83. Sun, C.; Zhang, H. Review of the Development of First-Generation Redox Flow Batteries: Iron-Chromium System. ChemSusChem 2021, 15, e202101798. [Google Scholar] [CrossRef]
  84. Poullikkas, A. A comparative overview of large-scale battery systems for electricity storage. Renew. Sustain. Energy Rev. 2013, 27, 778–788. [Google Scholar] [CrossRef]
  85. Staffell, I.; Rustomji, M. Maximising the value of electricity storage. J. Energy Storage 2016, 8, 212–225. [Google Scholar] [CrossRef]
  86. Fuchs, G.; Lunz, B.; Leuthold, M.; Sauer, D.U. Technology Overview on Electricity Storage; ISEA: Aachen, Germany, 2012. [Google Scholar]
  87. Falchetta, G.; Noussan, M. Electric vehicle charging network in Europe: An accessibility and deployment trends analysis. Transp. Res. Part D Transp. Environ. 2021, 94, 102813. [Google Scholar] [CrossRef]
  88. Hall, D.; Moultak, M.; Lutsey, N. Electric Vehicle Capitals of the World; ICCT White Paper; ICCT: Washington, DC, USA, 2017. [Google Scholar]
  89. Trends Incharging Infrastructure. Global EV Outlook 22. International Energy Agency (IEA). Available online: https://www.iea.org/reports/global-ev-outlook-2022/trends-in-charging-infrastructure (accessed on 23 December 2023).
  90. Charging Stations. Electromaps. A Wallbox Company. Available online: https://www.electromaps.com/en/charging-stations (accessed on 23 December 2023).
  91. AmpUp EV Charging. Available online: www.ampup.io (accessed on 23 December 2023).
  92. Electric Vehicle Charging Network. Available online: https://en.wikipedia.org/wiki/Electric_vehicle_charging_network#cite_note-AmpUp-20 (accessed on 23 December 2023).
  93. EV Charging Stations Data. Eco-Movement. Available online: https://www.eco-movement.com/charging-station-dataset-demo/?gclid=EAIaIQobChMIhpmk2cu1gwMVkpNoCR1VEQnJEAMYASAAEgJhpfD_BwE (accessed on 23 December 2023).
  94. Qawasmeh, B.R.; Al-Salaymeh, A.; Swaity, A.; Mosleh, A.; Boshmaf, S. Investigation of performance characteristics of hybrid cars. Environ. Eng. 2017, 14, 59–69. [Google Scholar]
  95. Asfoor, M.S.; Sharaf, A.M.; Beyerlein, S. Use of GT-Suite to study performance differences between internal combustion engine (ICE) and hybrid electric vehicle (HEV) powertrains. In Proceedings of the 16th International Conference on Applied Mechanics and Mechanical Engineering, Cairo, Egypt, 27–29 May 2014; Military Technical College: Cairo, Egypt, 2014; Volume 16, pp. 1–16. [Google Scholar]
  96. Penina, N.; Turygin, Y.V.; Racek, V. Comparative analysis of different types of hybrid electric vehicles. In Proceedings of the 13th Mechatronika 2010, Trencianske Teplice, Slovakia, 2–4 June 2010; IEEE: Piscataway, NJ, USA, 2010; pp. 102–104. [Google Scholar]
  97. Elkelawy, M.; Alm ElDin Mohamad, H.; Samadony, M.; Elbanna, A.M.; Safwat, A.M. A Comparative Study on Developing the Hybrid-Electric Vehicle Systems and its Future Expectation over the Conventional Engines Cars. J. Eng. Res. 2022, 6, 21–34. [Google Scholar] [CrossRef]
  98. Awadallah, M.; Tawadros, P.; Walker, P.; Zhang, N.; Tawadros, J. A Comparative Fuel Analysis of a novel HEV with conventional vehicle. In Proceedings of the 2017 IEEE 85th Vehicular Technology Conference (VTC Spring), Sydney, Australia, 4–7 June 2017; IEEE: Piscataway, NJ, USA, 2017; pp. 1–6. [Google Scholar]
  99. Dong, H.; Fu, J.; Zhao, Z.; Liu, Q.; Li, Y.; Liu, J. A comparative study on the energy flow of a conventional gasoline-powered vehicle and a new dual clutch parallel-series plug-in hybrid electric vehicle under NEDC. Energy Convers. Manag. 2020, 218, 113019. [Google Scholar] [CrossRef]
  100. Kumar, A.; Thakura, P.R. ADVISOR-based performance analysis of a hybrid electric vehicle and comparison with a conventional vehicle. IETE J. Res. 2023, 69, 753–761. [Google Scholar] [CrossRef]
  101. Howey, D.A.; Martinez-Botas, R.F.; Cussons, B.; Lytton, L. Comparative measurements of the energy consumption of 51 electric, hybrid and internal combustion engine vehicles. Transp. Res. Part D Transp. Environ. 2011, 16, 459–464. [Google Scholar] [CrossRef]
  102. Veza, I.; Asy’ari, M.Z.; Idris, M.; Epin, V.; Fattah, I.R.; Spraggon, M. Electric vehicle (EV) and driving towards sustainability: Comparison between EV, HEV, PHEV, and ICE vehicles to achieve net zero emissions by 2050 from EV. Alex. Eng. J. 2023, 82, 459–467. [Google Scholar] [CrossRef]
  103. Doust, M.; Otkur, M. Carbon footprint comparison analysis of passenger car segment electric and ICE-Propelled vehicles in Kuwait. Alex. Eng. J. 2023, 79, 438–448. [Google Scholar] [CrossRef]
  104. Carlson, R.B.; Lohse-Busch, H.; Diez, J.; Gibbs, J. The measured impact of vehicle mass on road load forces and energy consumption for a BEV, HEV, and ICE vehicle. SAE Int. J. Altern. Powertrains 2013, 2, 105–114. [Google Scholar] [CrossRef]
  105. Sinha, R. Comparative Environmental Impact Analysis of Electric, Hybrid, and Conventional Internal Combustion Engine Vehicles. Res. Sq. 2023, preprint. [Google Scholar]
  106. Garcia, A.; Monsalve-Serrano, J.; Villalta, D.; Tripathi, S. Electric Vehicles vs e-Fuelled ICE Vehicles: Comparison of Potentials for Life cycle CO2 Emission Reduction; No. 2022-01-0745; SAE Technical Paper; SAE: Warrendale, PA, USA, 2022. [Google Scholar]
  107. Graham, R. Comparing the Benefits and Impacts of Hybrid Electric Vehicle Options; Electric Power Research Institute (EPRI): Palo Alto, CA, USA, 2001. [Google Scholar]
  108. Huang, Y.; Surawski, N.C.; Organ, B.; Zhou, J.L.; Tang, O.H.; Chan, E.F. Fuel consumption and emissions performance under real driving: Comparison between hybrid and conventional vehicles. Sci. Total Environ. 2019, 659, 275–282. [Google Scholar] [CrossRef]
  109. Milojevic, S.; Glisovic, J.; Savic, S.; Boskovic, G.; Bukvic, M.; Stojanovic, B. Variable Systems in Tribologically Optimized Diesel Engines for Vehicles in Road Traffic. Atmosphere 2024, 15, 184. [Google Scholar] [CrossRef]
  110. Leach, F.; Kalghatgi, G.; Stone, R.; Miles, P. The scope for improving the efficiency and environmental impact of internal combustion engines. Transp. Eng. 2020, 1, 100005. [Google Scholar] [CrossRef]
  111. Berggren, C.; Magnusson, T. Reducing automotive emissions—The potentials of combustion engine technologies and the power of policy. Energy Policy 2012, 41, 636–643. [Google Scholar] [CrossRef]
  112. Siddartha, G.N.V.; Ramakrishna, C.S.; Kujur, P.K.; Rao, Y.A.; Dalela, N.; Yadav, A.S.; Sharma, A. Effect of fuel additives on internal combustion engine performance and emissions. Mater. Today Proc. 2022, 63, A9–A14. [Google Scholar] [CrossRef]
  113. Reitz, R.D.; Ogawa, H.; Payri, R.; Fansler, T.; Kokjohn, S.; Moriyoshi, Y.; Agarwal, A.; Arcoumanis, D.; Assanis, D.; Bae, C.; et al. IJER editorial: The future of the internal combustion engine. Int. J. Engine Res. 2020, 21, 3–10. [Google Scholar] [CrossRef]
  114. De Wolf, D.; Smeers, Y. Comparison of Battery Electric Vehicles and Fuel Cell Vehicles. World Electr. Veh. J. 2023, 14, 262. [Google Scholar] [CrossRef]
  115. Prathibha, P.K.; Samuel, E.R.; Unnikrishnan, A. Parameter study of electric vehicle (EV), hybrid EV and fuel cell EV using advanced vehicle simulator (ADVISOR) for different driving cycles. In Green Buildings and Sustainable Engineering: Proceedings of GBSE 2019; Springer: Singapore, 2020; pp. 491–504. [Google Scholar]
  116. Loengbudnark, W.; Khalilpour, K.; Bharathy, G.; Taghikhah, F.; Voinov, A. Battery and hydrogen-based electric vehicle adoption: A survey of Australian consumers perspective. Case Stud. Transp. Policy 2022, 10, 2451–2463. [Google Scholar] [CrossRef]
  117. Lee, U.; Jeon, S.; Lee, I. Design for shared autonomous vehicle (SAV) system employing electrified vehicles: Comparison of battery electric vehicles (BEVs) and fuel cell electric vehicles (FCEVs). Clean. Eng. Technol. 2022, 8, 100505. [Google Scholar] [CrossRef]
  118. Thomas, C.E. Fuel cell and battery electric vehicles compared. Int. J. Hydrog. Energy 2009, 34, 6005–6020. [Google Scholar] [CrossRef]
  119. Li, M.; Zhang, X.; Li, G. A comparative assessment of battery and fuel cell electric vehicles using a well-to-wheel analysis. Energy 2016, 94, 693–704. [Google Scholar] [CrossRef]
  120. Cano, Z.P.; Banham, D.; Ye, S.; Hintennach, A.; Lu, J.; Fowler, M.; Chen, Z. Batteries and fuel cells for emerging electric vehicle markets. Nat. Energy 2018, 3, 279–289. [Google Scholar] [CrossRef]
  121. Offer, G.J.; Howey, D.; Contestabile, M.; Clague, R.; Brandon, N.P. Comparative analysis of battery electric, hydrogen fuel cell and hybrid vehicles in a future sustainable road transport system. Energy Policy 2010, 38, 24–29. [Google Scholar] [CrossRef]
  122. Pramuanjaroenkij, A.; Kakaç, S. The fuel cell electric vehicles: The highlight review. Int. J. Hydrogen Energy 2023, 48, 9401–9425. [Google Scholar] [CrossRef]
  123. Wishart, J. Fuel Cells vs Batteries in the Automotive Sector; Intertek Technol Report; Intertek: London, UK, 2014. [Google Scholar]
  124. Das, H.S.; Tan, C.W.; Yatim, A.H.M. Fuel cell hybrid electric vehicles: A review on power conditioning units and topologies. Renew. Sustain. Energy Rev. 2017, 76, 268–291. [Google Scholar] [CrossRef]
  125. Emadi, A.; Williamson, S.S. Fuel cell vehicles: Opportunities and challenges. In Proceedings of the IEEE Power Engineering Society General Meeting, Denver, CO, USA, 6–10 June 2004; IEEE: Piscataway, NJ, USA, 2004; pp. 1640–1645. [Google Scholar]
  126. Barbir, F. PEM Fuel Cells: Theory and Practice; Academic Press: Cambridge, MA, USA, 2012. [Google Scholar]
  127. Benziger, J.; Chia, E.; Moxley, J.F.; Kevrekidis, I.G. The dynamic response of PEM fuel cells to changes in load. Chem. Eng. Sci. 2005, 60, 1743–1759. [Google Scholar] [CrossRef]
  128. Schmittinger, W.; Vahidi, A. A review of the main parameters influencing long-term performance and durability of PEM fuel cells. J. Power Sources 2008, 180, 1–14. [Google Scholar] [CrossRef]
  129. Wu, H.W. A review of recent development: Transport and performance modeling of PEM fuel cells. Appl. Energy 2016, 165, 81–106. [Google Scholar] [CrossRef]
  130. Yan, Q.; Toghiani, H.; Causey, H. Steady state and dynamic performance of proton exchange membrane fuel cells (PEMFCs) under various operating conditions and load changes. J. Power Sources 2006, 161, 492–502. [Google Scholar] [CrossRef]
  131. Li, H.; Zhao, H.; Jian, S.; Tao, B.; Gu, S.; Xu, G.; Wang, G.; Chang, H. Designing proton exchange membrane fuel cells with high specific power density. J. Mater. Chem. A 2023, 11, 17373–17391. [Google Scholar] [CrossRef]
  132. Mishra, V.; Yang, F.; Pitchumani, R. Analysis and design of PEM fuel cells. J. Power Sources 2005, 141, 47–64. [Google Scholar] [CrossRef]
  133. Wang, Y.; Diaz, D.F.R.; Chen, K.S.; Wang, Z.; Adroher, X.C. Materials, technological status, and fundamentals of PEM fuel cells—A review. Mater. Today 2020, 32, 178–203. [Google Scholar] [CrossRef]
  134. San Martin, J.I.; Zamora, I.; San Martin, J.J.; Aperribay, V.; Torres, E.; Eguia, P. Influence of the rated power in the performance of different proton exchange membrane (PEM) fuel cells. Energy 2010, 35, 1898–1907. [Google Scholar] [CrossRef]
  135. Mekhilef, S.; Saidur, R.; Safari, A. Comparative study of different fuel cell technologies. Renew. Sustain. Energy Rev. 2012, 16, 981–989. [Google Scholar] [CrossRef]
  136. Carrette, L.; Friedrich, K.A.; Stimming, U. Fuel cells: Principles, types, fuels, and applications. ChemPhysChem 2000, 1, 162–193. [Google Scholar] [CrossRef] [PubMed]
  137. Tomczyk, P. MCFC versus other fuel cells—Characteristics, technologies and prospects. J. Power Sources 2006, 160, 858–862. [Google Scholar] [CrossRef]
  138. Ahmadi, S.; Bathaee, S.M.T.; Hosseinpour, A.H. Hosseinpour. Improving fuel economy and performance of a fuel-cell hybrid electric vehicle (fuel-cell, battery, and ultra-capacitor) using optimized energy management strategy. Energy Convers. Manag. 2018, 160, 74–84. [Google Scholar] [CrossRef]
  139. Benmouiza, K.; Cheknane, A. Analysis of proton exchange membrane fuel cells voltage drops for different operating parameters. Int. J. Hydrogen Energy 2018, 43, 3512–3519. [Google Scholar] [CrossRef]
  140. Srinivasan, S. Fuel Cells: From Fundamentals to Applications; Springer Science & Business Media: Berlin, Germany, 2006. [Google Scholar]
  141. Xu, Z.; Qi, Z.; He, C.; Kaufman, A. Combined activation methods for proton-exchange membrane fuel cells. J. Power Sources 2006, 156, 315–320. [Google Scholar] [CrossRef]
  142. Van Der Linden, F.; Pahon, E.; Morando, S.; Bouquain, D. A review on the Proton-Exchange Membrane Fuel Cell break-in physical principles, activation procedures, and characterization methods. J. Power Sources 2023, 575, 233168. [Google Scholar] [CrossRef]
  143. Qi, Z.; Kaufman, A. Quick and effective activation of proton-exchange membrane fuel cells. J. Power Sources 2003, 114, 21–31. [Google Scholar] [CrossRef]
  144. Dey, T.; Singdeo, D.; Bose, M.; Basu, R.N.; Ghosh, P.C. Study of contact resistance at the electrode–interconnect interfaces in planar type Solid Oxide Fuel Cells. J. Power Sources 2013, 233, 290–298. [Google Scholar] [CrossRef]
  145. Chae, K.J.; Choi, M.; Ajayi, F.F.; Park, W.; Chang, I.S.; Kim, I.S. Mass transport through a proton exchange membrane (Nafion) in microbial fuel cells. Energy Fuels 2008, 22, 169–176. [Google Scholar] [CrossRef]
  146. Drive Electric. Electric Vehicle Range-Everything You Need to Know. Available online: https://www.drive-electric.co.uk/guides/general/electric-vehicle-range-everything-you-need-to-know/#:~:text=Generally%2C%20today%27s%20electric%20cars%20can,distances%20every%20day%20for%20work (accessed on 29 January 2024).
  147. Evenergy. EV Basics-EV Driving Range. Available online: https://www.evenergi.com/ev-basics-ev-driving-range/ (accessed on 29 January 2024).
  148. Average EV Range Worldwide by Type 2017–2021. Statista. Available online: https://www.statista.com/statistics/1312369/average-ev-range-worldwide-by-type/ (accessed on 29 January 2024).
  149. EV Range: Everything You Need to Know. Car and Driver. Available online: https://www.caranddriver.com/shopping-advice/a32603216/ev-range-explained/ (accessed on 29 January 2024).
  150. The Complete Guide to Electric Car Range. Select Car Leasing. Available online: https://www.selectcarleasing.co.uk/hybrid-electric-cars/guides/electric-car-range (accessed on 29 January 2024).
  151. Introduction to the Taguchi Methods. Available online: https://www.ee.iitb.ac.in/~apte/CV_PRA_TAGUCHI_INTRO.htm (accessed on 29 January 2024).
  152. Chakraborty, S. TOPSIS and Modified TOPSIS: A comparative analysis. Decis. Anal. J. 2022, 2, 100021. [Google Scholar] [CrossRef]
  153. Crowcon Detecting Gas. Saving Lives. Crowcon Detection Instruments Ltd. A Halma Company. Posted on 21st, January 2021. Available online: https://www.crowcon.com/es/blog/the-dangers-of-hydrogen/ (accessed on 29 January 2024).
  154. Crowl, D.A.; Jo, Y.D. The hazards and risks of hydrogen. J. Loss Prev. Process Ind. 2007, 20, 158–164. [Google Scholar] [CrossRef]
  155. Mirza, N.R.; Degenkolbe, S.; Witt, W. Analysis of hydrogen incidents to support risk assessment. Int. J. Hydrogen Energy 2011, 36, 12068–12077. [Google Scholar] [CrossRef]
  156. Gye, H.R.; Seo, S.K.; Bach, Q.V.; Ha, D.; Lee, C.J. Quantitative risk assessment of an urban hydrogen refueling station. Int. J. Hydrogen Energy 2019, 44, 1288–1298. [Google Scholar] [CrossRef]
  157. Li, Z.; Pan, X.; Ma, J. Quantitative risk assessment on a gaseous hydrogen refueling station in Shanghai. Int. J. Hydrogen Energy 2010, 35, 6822–6829. [Google Scholar]
  158. Suzuki, T.; Shiota, K.; Izato, Y.I.; Komori, M.; Sato, K.; Takai, Y.; Ninomiya, T.; Miyake, A. Quantitative risk assessment using a Japanese hydrogen refueling station model. Int. J. Hydrogen Energy 2021, 46, 8329–8343. [Google Scholar] [CrossRef]
  159. Rodionov, A.; Wilkening, H.; Moretto, P. Risk assessment of hydrogen explosion for private car with hydrogen-driven engine. Int. J. Hydrogen Energy 2011, 36, 2398–2406. [Google Scholar] [CrossRef]
  160. Li, H. How Safe is Your Hydrogen-Powered Car?—Some Safety and Human Factors Issues. Doctoral Dissertation, Loughborough University, Loughborough, UK, 2023. [Google Scholar]
  161. Clausen, S.T. Risks When Using New Types of Fuel. Master’s Thesis, Høgskulen på Vestlandet, Bergen, Norway, 2022. [Google Scholar]
  162. Seguridad en Vehículos Eléctricos a Hidrógeno. Aspectos de Seguridad. Plataforma de Electromovilidad. Movilidad Eléctrica. Ministerio de Energía. Available online: https://energia.gob.cl/electromovilidad/hidrogeno-verde/aspectos-de-seguridad (accessed on 29 January 2024).
  163. Buttner, W.J.; Loiselle-Lapoint, A.; Wischmeyer, T. Compliance Measurements of Fuel Cell Electric Vehicle Exhaust. In Proceedings of the 2019 International Conference on Hydrogen Safety, Adelaide, Australia, 24–26 September 2019. [Google Scholar]
  164. Foorginezhad, S.; Mohseni-Dargah, M.; Falahati, Z.; Abbassi, R.; Razmjou, A.; Asadnia, M. Sensing advancement towards safety assessment of hydrogen fuel cell vehicles. J. Power Sources 2021, 489, 229450. [Google Scholar] [CrossRef]
  165. Buttner, W.; Rivkin, C.; Burgess, R.; Hartmann, K.; Bloomfield, I.; Bubar, M.; Post, M.; Boon-Brett, L.; Weidner, E.; Moretto, P. Hydrogen monitoring requirements in the global technical regulation on hydrogen and fuel cell vehicles. Int. J. Hydrogen Energy 2017, 42, 7664–7671. [Google Scholar] [CrossRef]
Figure 1. Efficiency and hydrogen consumption rate for a fuel cell electric vehicle.
Sustainability 16 02110 g001
Figure 2. Discharge efficiency of lithium batteries as a function of the state of charge.
Sustainability 16 02110 g002
Figure 3. Control system flowchart.
Sustainability 16 02110 g003
Figure 4. Fuel cell operation control system flowchart.
Sustainability 16 02110 g004
Figure 5. Schematic view of a hybrid fuel cell–lithium battery power system for electric vehicles.
Sustainability 16 02110 g005
Figure 6. Simple daily round trip route.
Sustainability 16 02110 g006
Figure 7. Evolution of the power demand with time.
Sustainability 16 02110 g007
Table 1. Electric vehicle characteristics.
ParameterUnitSymbolValue
Weightkgm1644
Front aream2S2.5
Aerodynamic coefficient---Cx0.30
Rolling coefficient---μ0.015
Air densitykg/m3ρ1.133
Table 2. Power source configuration.
Power Demand Range (kW)0–10.610.6–50.950.9–106
Power source configuration
ALow-rate batteryFuel Cell
BFuel CellHigh-rate battery
CFuel CellHigh-rate battery
DLow-rate batteryFuel CellHigh-rate battery
Table 3. Energy consumption (kWh) for different power source configurations.
ConfigurationABCD
Low768657,80357,8037686
Medium86,65540,41086,65586,655
High31,85415,26915,26915,299
Total126,195113,482159,727109,641
Table 4. Comparative analysis of energy consumption (kWh) for single and hybrid power source.
Power SourceABCDLow-Rate BatteryHigh-Rate BatteryFuel Cell
Total energy126,195113,482159,727109,641197,895190,209176,312
Table 5. Saving energy (%) in hybrid power system use.
Hybrid System Configuration ↓Low-Rate BatteryHigh-Rate BatteryFuel Cell
A36.233.728.4
B42.740.335.6
C19.316.09.4
D44.642.437.8
Table 6. Energy capacity (kWh) for the power units.
ConfigurationLow-Rate BatteryFuel CellHigh-Rate Battery
A7.7118.5
B57.855.7
C144.515.3
D7.786.715.3
Table 7. Hydrogen mass flow for the fuel cell unit (kg/s).
ConfigurationABCD
Low6.7583.2968.2374.941
Table 8. Hydrogen tank volume (liters).
ConfigurationABCD
Low118.129.9194.872.1
Disclaimer/Publisher’s Note: The statements, opinions and data contained in all publications are solely those of the individual author(s) and contributor(s) and not of MDPI and/or the editor(s). MDPI and/or the editor(s) disclaim responsibility for any injury to people or property resulting from any ideas, methods, instructions or products referred to in the content.

