1. Introduction
Sustainable development is one of the most significant challenges in the modern world. The concept of sustainable development can be defined, according to one of the early interpretations of the term, as the right to satisfy the developmental aspirations of the current generation without limiting the rights of future generations to meet their needs. This definition assumes that the economic and civilizational development of the current generation should not occur at the expense of depleting non-renewable resources and damaging the environment for the benefit of future generations, who also have the right to their own development. It is important to note that despite years of research and discussion, this concept has not received a clear, unified definition. As a partial explanation for the discrepancies, one can point to the very large and complex number of elements that make up the concept of sustainable development. However, there is currently no universally accepted definition of this phenomenon [
1,
2,
3,
4].
Indicators, on the other hand, can be seen as useful tools for evaluation, communication, and decision making. In another perspective, they are quantitative tools that synthesize and simplify data relevant to the assessment of specific phenomena. Indicators of sustainable development can be defined as statistical measures that enable the measurement of social, environmental, and economic aspects. It should be emphasized that indicators are a fundamental tool for monitoring sustainable development, as they present this concept of development in a rational and measurable manner [
1,
3].
The subject of the article is an attempt to demonstrate the effectiveness of implementing sustainable development in the African Sahel region, with particular emphasis on the third goal of this idea (good health and quality of life, i.e., well-being).
The Sahel is a latitudinal belt of land south of the Sahara that is not a desert area nor a typical savanna. Its territory is defined by two annual isohyets (lines of equal rainfall)—200 mm in the north and 500 mm in the south. Therefore, the criterion for defining the boundaries of the Sahel is arbitrary and dependent on the amount of rainfall in a given period.
The African Sahel region includes Senegal, Sudan, Mauritania, Mali, Niger, Chad, and Eritrea. Its total area is nearly 7 million square kilometers. In 2005, this area was inhabited by over 83.4 million people, and by 2022, it had exceeded 139.1 million, marking an increase of nearly 67%. The population has increased in all countries (
Table 1). The largest increase, of nearly 88%, occurred in Niger, while the smallest increase, of 32%, was recorded in Eritrea.
The studied countries are characterized by a relatively low life expectancy at birth (
Table 2). The average for all the surveyed countries was 56.6 years in 2005, which increased to 62.6 years by 2020. A positive trend is that this increase was observed in all the studied countries. Senegal has the best situation, while Chad has the worst.
The economic situation in the studied countries is highly diverse, as indicated by differences in both GDP per capita (current USD) (
Figure 1) and GDP growth rate (annual %) (
Figure 2).
A particularly concerning phenomenon occurred in Sudan and Chad, when a decline in GDP was recorded.
The analyzed countries also exhibit significant variations in terms of inflation rates. Sudan, in particular, faced a very challenging situation in recent years (
Table 3). The country experienced a phenomenon of hyperinflation in the last years under examination.
In terms of achieving sustainable development goals, no international context is as complex and, from a research perspective, as intricate as Africa. This is evident from the fact that it is not possible to apply universal criteria for analyzing social phenomena occurring on this continent. Undoubtedly, there are numerous reasons for such a state of affairs, including political unpredictability, the dynamics of coups and state upheavals, economic instability, illegal activities of terrorist groups, and private armed militias.
It is also essential to remember that while African states gained independence at different times, they did not entirely shed the legacy of colonialism, which only reinforced their dependence on Western countries and perpetuated the lack of political autonomy for entities meant to guarantee social justice, democracy, and more dynamic development. In recent decades, the pool of issues characteristic of Africa has been further compounded by challenges related to the consequences of climate change [
6,
7,
8,
9].
From the mid-1960s to the late 1980s, the Sahel region witnessed dramatic events triggered by climatic factors. The years 1972–1975 and 1984–1985 were particularly challenging for this region, as they saw mass deaths due to drought and famine. Contemporary research confirms that the African Sahel is still under the threat of desertification, with climate change being the primary factor. This phenomenon is largely a result of the excessive emission of greenhouse gases and other atmospheric pollutants, which are mainly generated by highly developed countries. Insufficient rainfall and the widespread desertification of arable lands and grazing areas have led to numerous conflicts, often supported by Islamist terrorist groups and private armed militias [
10,
11,
12,
13,
14].
In the last decade, deepening crises caused by climate change and political instability have created an unprecedented need for humanitarian assistance, encompassing the entire Sahel region today. The main causes of humanitarian crises in this part of Africa are uncontrolled armed conflicts, food insecurity, and overall hunger and malnutrition affecting most of the population in the region. It is estimated that over 5.1 million people in the Sahel are in permanent life-threatening situations. Rising terrorist violence has forced the civilian population to move to other areas within the region, further generating conflicts and crises. In early 2020, nearly 4.5 million people living there were forced to leave their homes, becoming a marginalized group of internal refugees. This number was 1 million higher than in 2018. The lack of security and human rights protection as well as unresolved and escalating conflicts among local communities not only destabilizes the development of this region but also promotes the spread of terrorism and crime within its territory. Additionally, the inability of some states to achieve political self-determination often leaves these countries with little control and oversight [
15,
16,
17,
18].
The Sahel region is characterized by high rainfall instability and unpredictability, which have changed in intensity and frequency in recent decades. This has significant implications for the local population because 80% of the region’s economy relies on agriculture. Insufficient annual rainfall has particular consequences, including soil degradation (desertification, erosion), loss of biodiversity, the disappearance of rivers and lakes, threats to the health of both humans and animals, and a drastic reduction in the quality of life. Semi-arid Sahel areas have natural pastures with low grass and tall green herbs. This vegetation serves as a source of food for livestock such as camels, cattle, grazing cattle, sheep, and goats. Originally, thorny shrubs formed dense forest areas, but now these areas resemble open terrain. In recent years, there have been alarming signs of previously cultivated Sahel areas merging into desert areas. Shorter and less intense rainfall leads to the drying not only of arable lands and pastures but also of rivers and lakes. Lake Chad, located in the central–western part of the Sahel, has lost 50% of its water over the last 50 years. The shoreline of this lake borders four African countries: Chad, Niger, Nigeria, and Cameroon. In this region, the lake served as a source of water not only for the local flora and fauna but also for over 30 million people. The shrinking shoreline of this lake has led to numerous serious conflicts between neighboring states. Undoubtedly, climate change is the main cause of the lake’s decline, but neglect by numerous entities responsible for the lake has also played a significant role [
19,
20].
The instability and decrease in rainfall have also led to changes in the cycles of crop cultivation and animal grazing. This has been a cause of numerous, often armed, conflicts between migrating herders and local farmers. As a result, this has not only reduced meat and milk production but also drastically influenced the rise in the prices of these products. Deteriorating food security and hunger pose the greatest threat to the lives of the youngest inhabitants of the Sahel, namely children. In 2020, over 5.4 million children living in Burkina Faso, Chad, Gambia, Mali, Mauritania, Niger, Nigeria, and Senegal were affected by hunger, with 2.4 million experiencing its extreme form [
21].
It is expected that malnutrition and hunger in this region will persist in the coming years and may even take on a more dangerous form if significant preventive measures are not taken by highly developed countries. In addition, there is a lack of proper healthcare, access to clean drinking water, sanitation facilities, and other essential social services, which are crucial for improving the living conditions of those suffering from hunger and malnutrition. The recent increase in infectious disease epidemics (cholera in Niger and Chad, measles in Burkina Faso and Chad, and COVID-19 across the region) has also contributed to an increase in the mortality rate and a decrease in the quality of life. According to UN reports, the lack of radical assistance measures from highly developed countries will leave the Sahel region with the following problems [
17,
22,
23]:
Over 1.5 million children with severe acute malnutrition (SAM) will not receive the necessary treatment they require.
Lack of access to water, sanitation, and hygiene services (WASH) will contribute to an increase in infectious diseases, leading to epidemics.
People living in areas without protection from local and state authorities will be vulnerable to sexual, religious, and gender-based violence (this type of violence will be particularly evident in refugee camps).
Thirty million people residing in the Sahel region may be deprived of access to life-saving medical aid, with women and girls, who are particularly susceptible to sexual violence, being among those affected.
Millions of children deprived of regular education will become easy targets for enslavement and forced recruitment by radical terrorist groups.
Communities affected by the consequences of climate change will be unable to cope with the loss of livelihoods and the increasing risk of conflicts.
Lack of shelter and basic living conditions will lead to a cascade of unpredictable traumatic experiences and threats for thousands of families in the Sahel region.
On 16 February 2014, representatives from five countries, namely Mauritania, Mali, Burkina Faso, Niger, and Chad, signed an intergovernmental agreement for cooperation aimed at resolving tensions and issues in the region [
24]. This organization of these states, known as the G5 Sahel, was supported by the European Union, with significant involvement from France. The strategic objective of the initiative was to enhance development and security in the region, with a particular emphasis on addressing the most fundamental challenges in three key areas:
Political—particularly addressing issues related to dysfunctional governance in states and the protection and observance of human rights.
Security—especially focusing on the eradication of activities by terrorist and criminal groups, strengthening efforts to mitigate the impacts of climate change and undertaking initiatives to prevent mass migrations and local conflicts.
Developmental—concerning the support for economic growth and weak socio-economic resilience, the eradication of endemic poverty, and the enhancement of demographic control.
However, at the beginning of 2023, there was a clear penetration of the G5 Sahel by Russian political circles, resulting in Mali’s withdrawal from the agreement reached in 2014.
3. Results
The first goal is defined as follows: “By 2030, reduce the global maternal mortality ratio to less than 70 per 100,000 live births” (
Figure 3). Information regarding the indicator values from 2005 to 2017 in individual countries is presented in
Figure 1. It can be observed that none of the surveyed countries approached the target to be achieved. In all countries, the indicator value was significantly higher than the target value. Chad consistently had the worst performance among all the surveyed countries, while Sudan and Senegal performed the best. A positive trend is that all the surveyed countries experienced a decrease in the indicator value. Comparing 2017 to 2005, the highest decrease, exceeding 44%, was observed in Sudan, while the lowest decrease, only 7%, occurred in Mauritania.
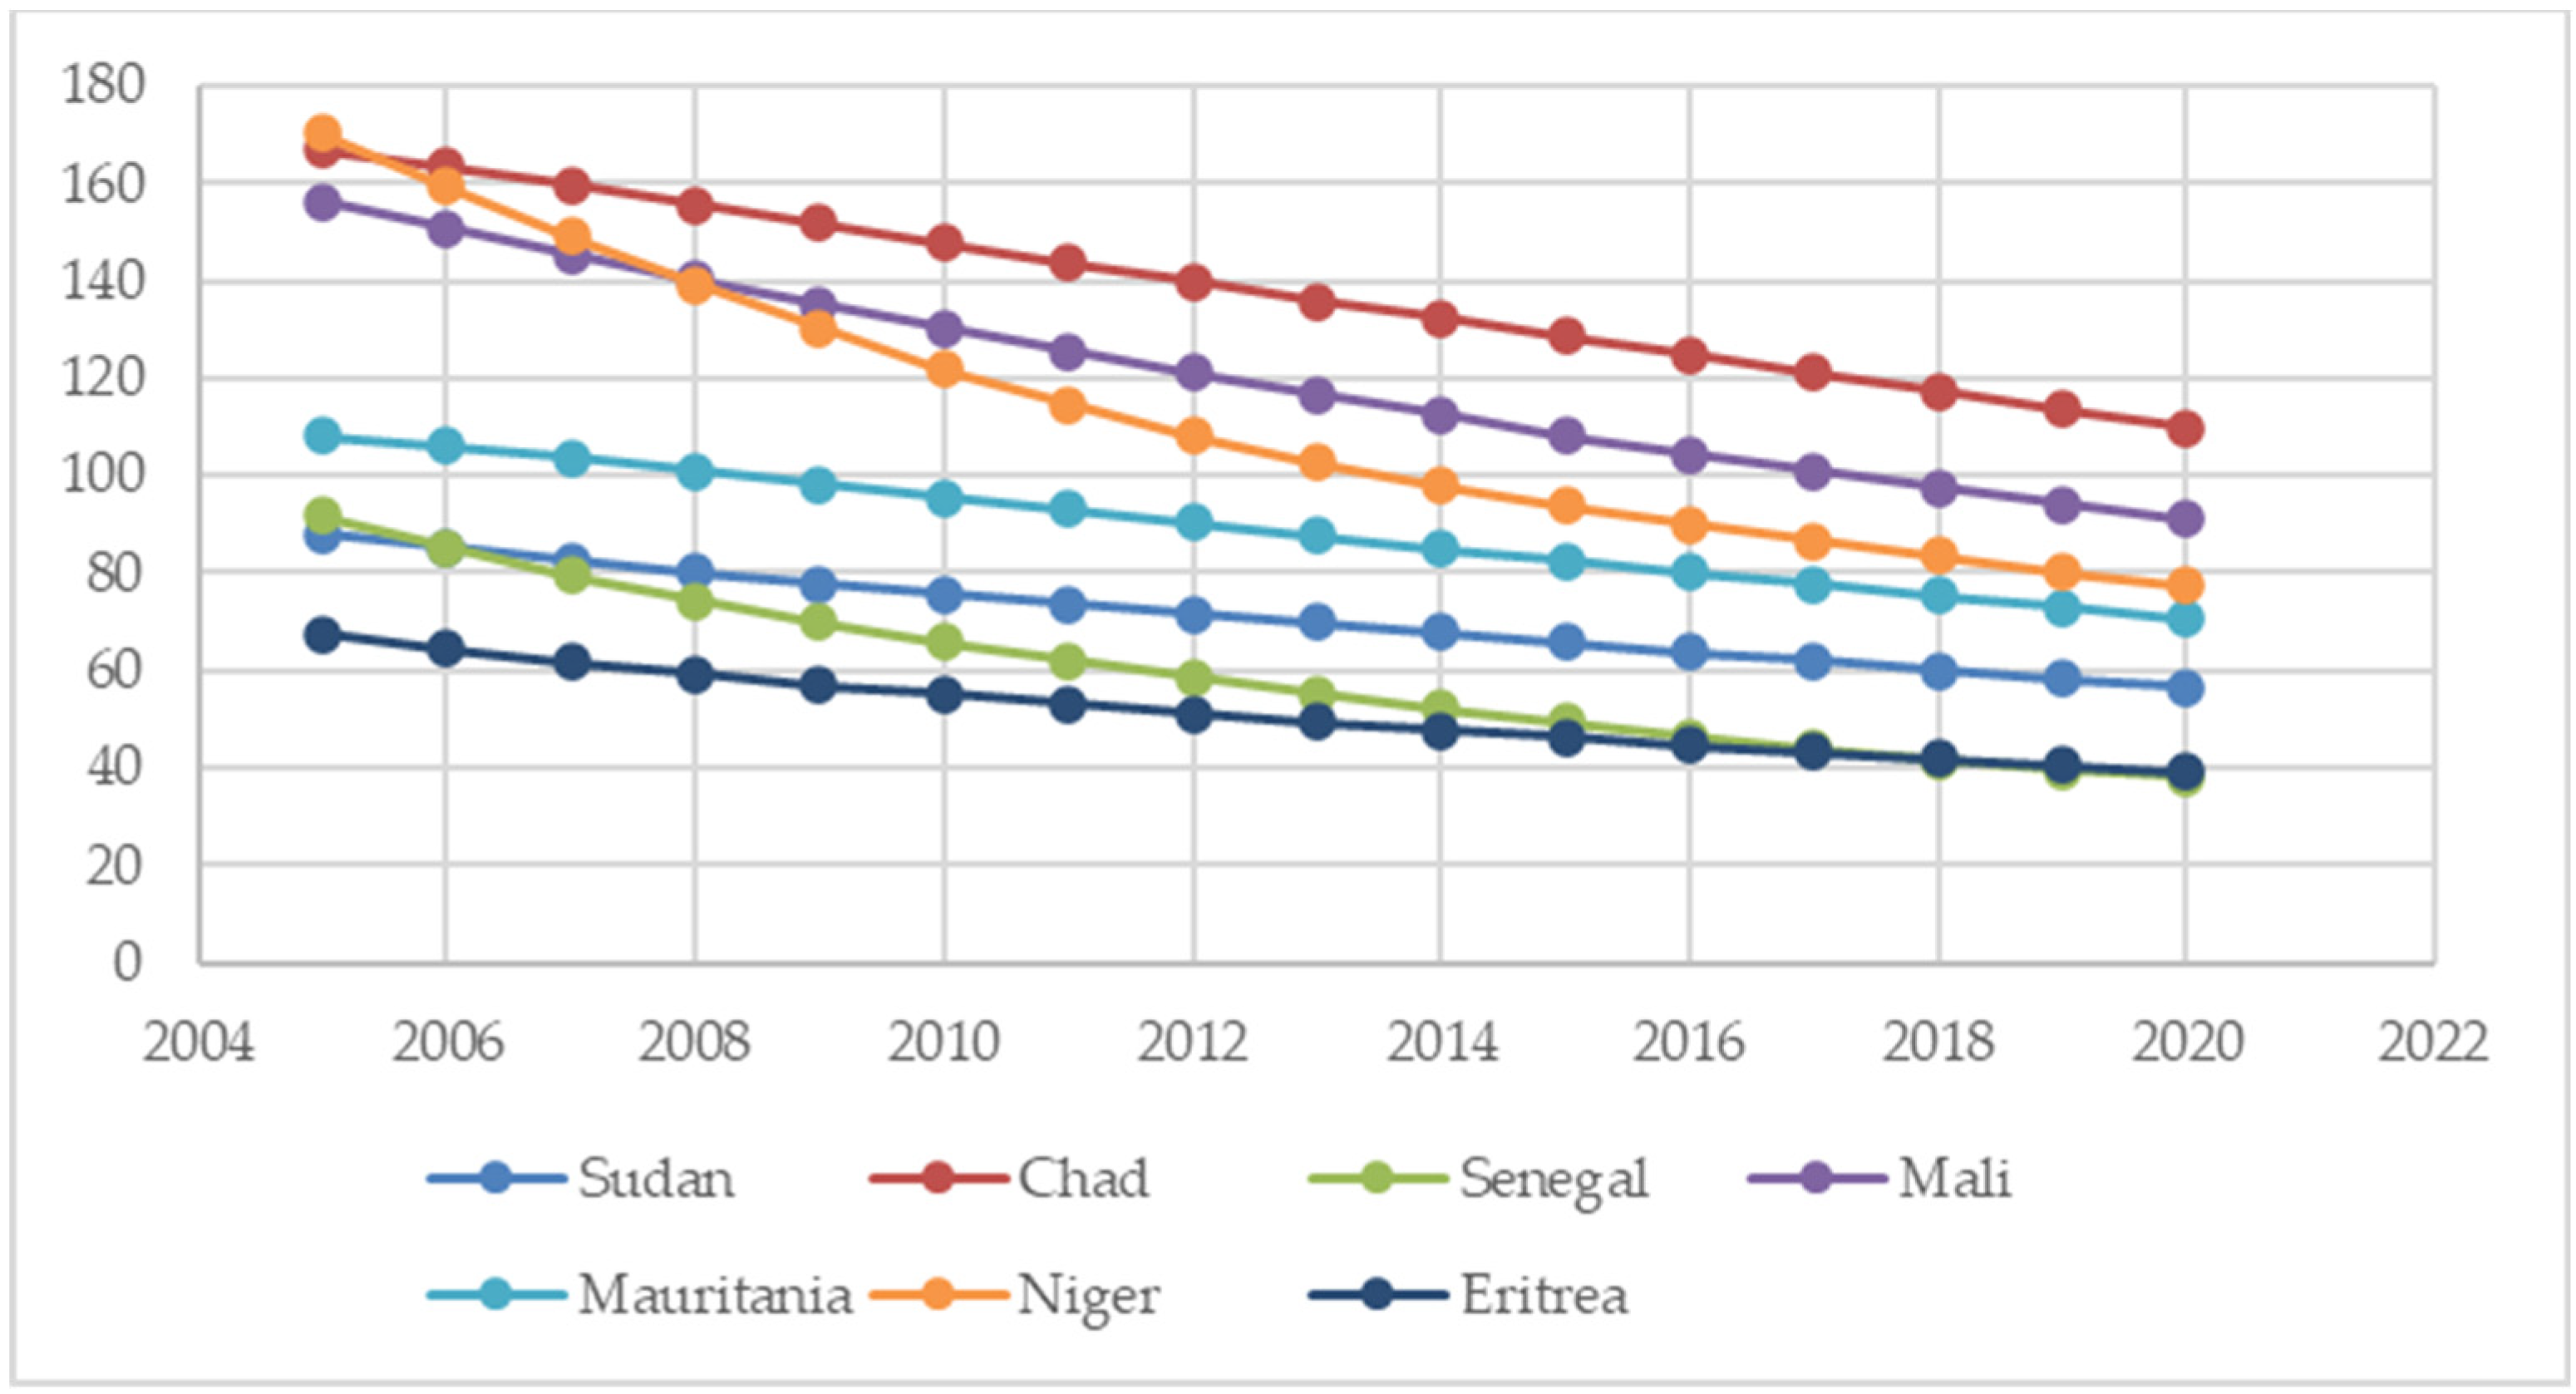
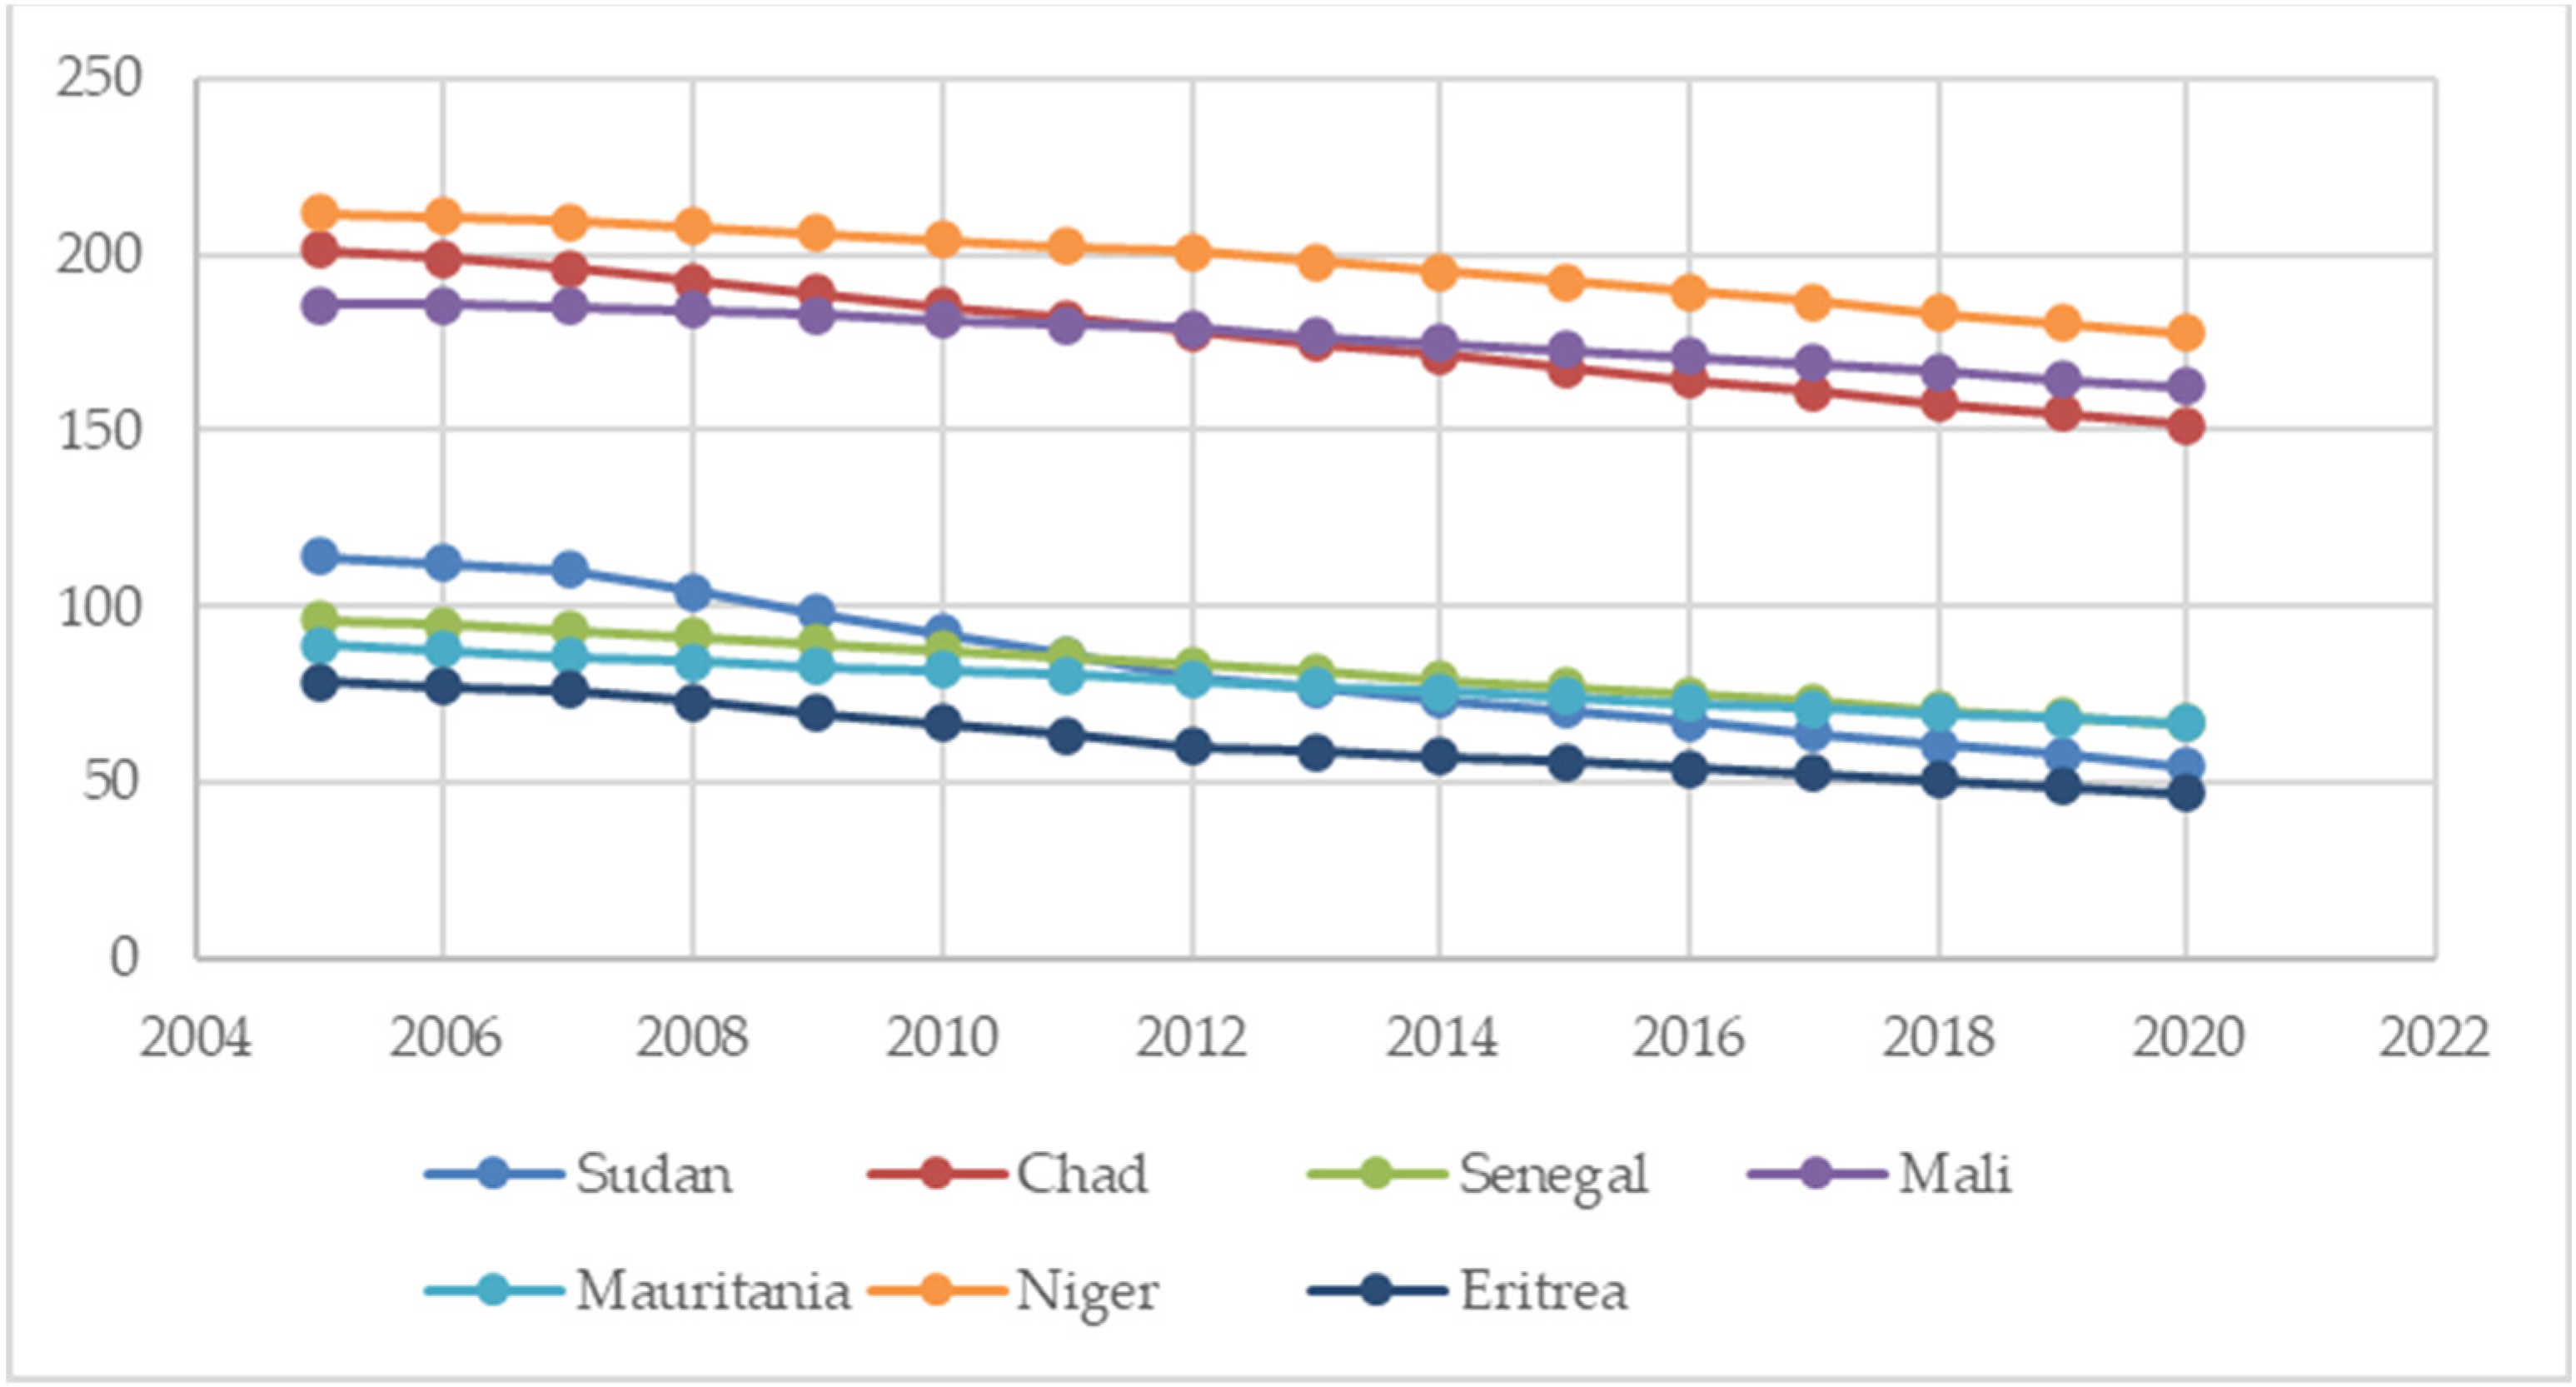
The second goal is defined as follows: “By 2030, end preventable deaths of newborns and children under 5 years of age, with all countries aiming to reduce neonatal mortality to at least as low as 12 per 1000 live births and under-5 mortality to at least as low as 25 per 1000 live births”.
The values of the indicators describing the achievement of this goal are presented in
Figure 4 and
Figure 5. Despite the fact that none of the surveyed countries managed to achieve the target values of the indicators, the trend indicates that there is a significant chance for the desired values to be reached by 2030. In all countries, the indicator values show a decreasing trend. For the “Mortality rate, under-5” indicator, the highest decrease, exceeding 58%, was observed in Senegal, while the smallest decrease, of nearly 35%, was recorded in Mauritania.
Regarding the “Mortality rate, neonatal” indicator, the largest decrease, close to 36%, was observed in Senegal, while the smallest decrease, of 18%, occurred in Chad.
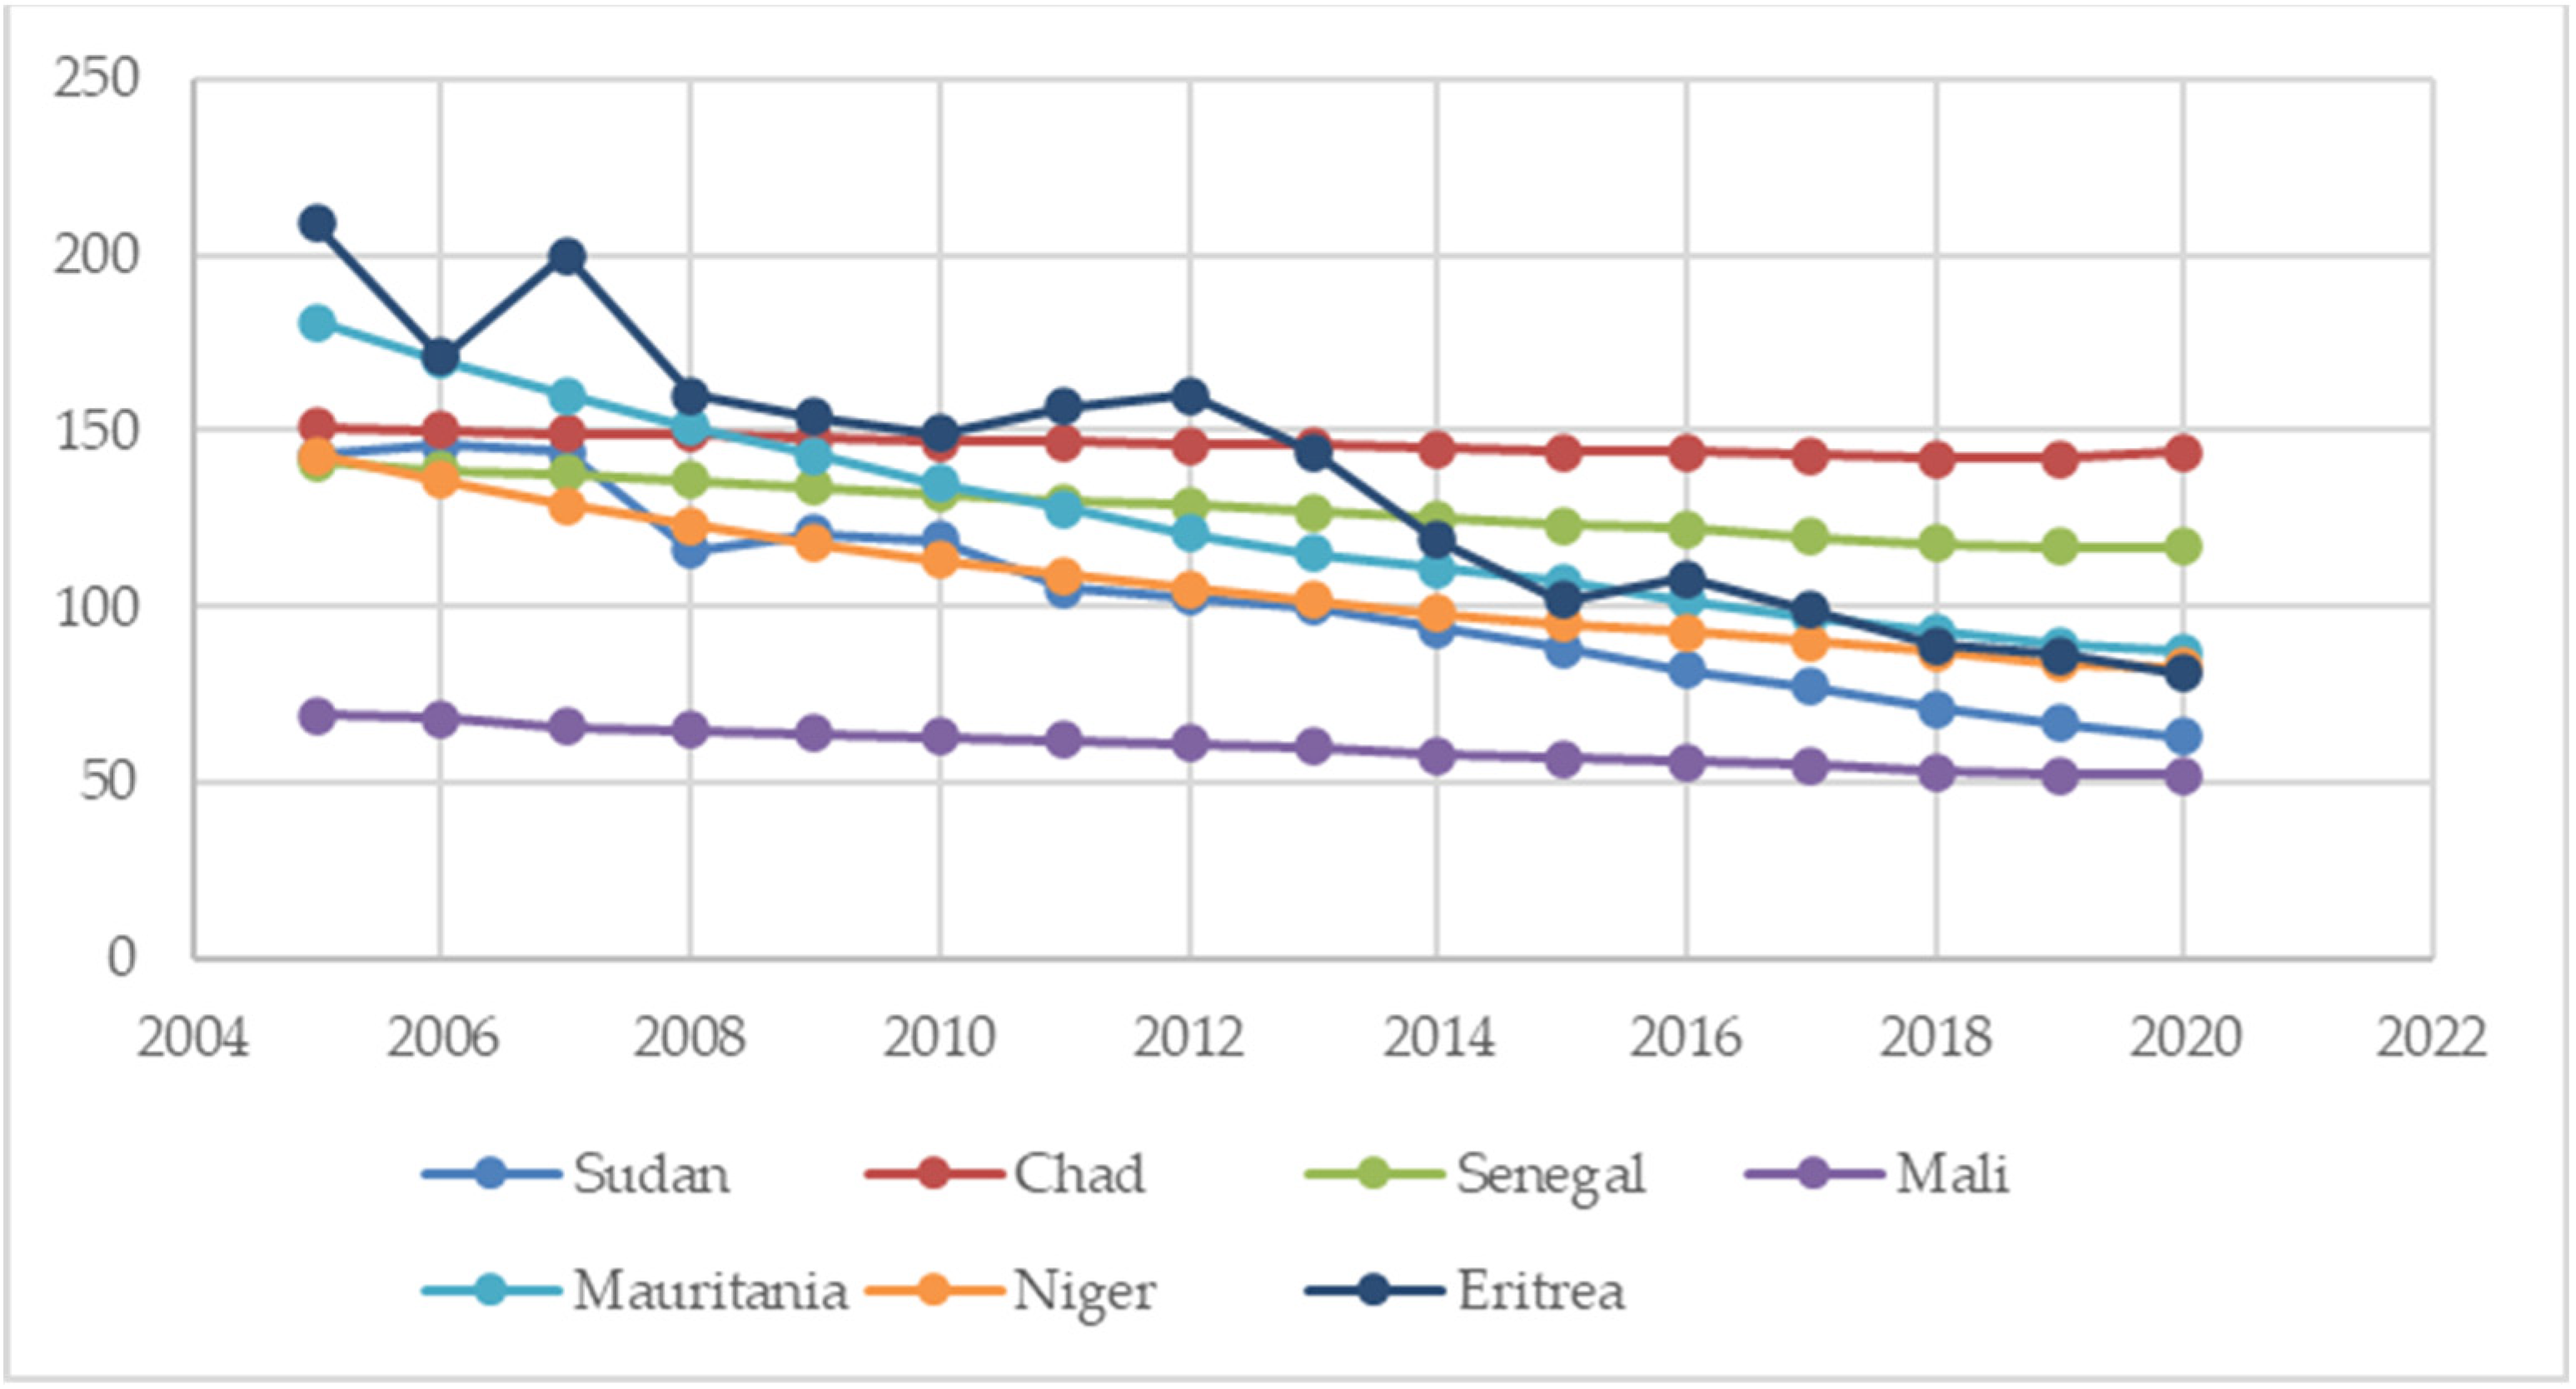
Another goal to achieve is defined as follows: “By 2030, end the epidemics of AIDS, tuberculosis, malaria, and neglected tropical diseases and combat hepatitis, water-borne diseases and other communicable diseases”. Its achievement is monitored through three indicators (
Figure 6,
Figure 7 and
Figure 8).
For the “HIV incidence” indicator, there were no data available for Mauritania. In the other surveyed countries, the situation improved significantly during the study period. The greatest improvement can be observed in Senegal, Eritrea, and Niger, where the indicator values decreased by over 82%. The smallest decrease, of just under 17%, occurred in Sudan.
In the case of the “Incidence of tuberculosis” indicator, its value decreased in all surveyed countries. In Sudan, its value decreased by over half. The smallest decrease, of only 4%, occurred in Chad.
Analyzing the value of the “Malaria incidence” indicator, it can be concluded that this disease is still a problem in African countries. Among the seven countries analyzed, three of them experienced an increase in this indicator value. The most challenging situation was in Eritrea, where the number of cases increased by over 350%. Sudan saw an increase of 34%, and Niger had a 5% increase. The largest decrease, nearly 65%, occurred in Mauritania, and the number of cases in Senegal decreased by almost 60%.
Another goal is to “by 2030, reduce by one third premature mortality from non-communicable diseases through prevention and treatment and promote mental health and well-being”. The achievement of this goal is monitored through two indicators.
The value of the “Mortality from CVD, cancer, diabetes, or CRD between the exact ages of 30 and 70” indicator decreased in all surveyed countries (
Figure 9). The average decrease was 8%. The highest decrease, 13%, was observed in Eritrea, while the smallest decrease, of 4%, occurred in Niger.
For the “Suicide mortality rate” indicator, there are slight decreases observed, with a decrease of just under 10% (
Figure 10). The most significant decrease of 17% was observed in Senegal and Eritrea. In Niger, the value remained at the same level.
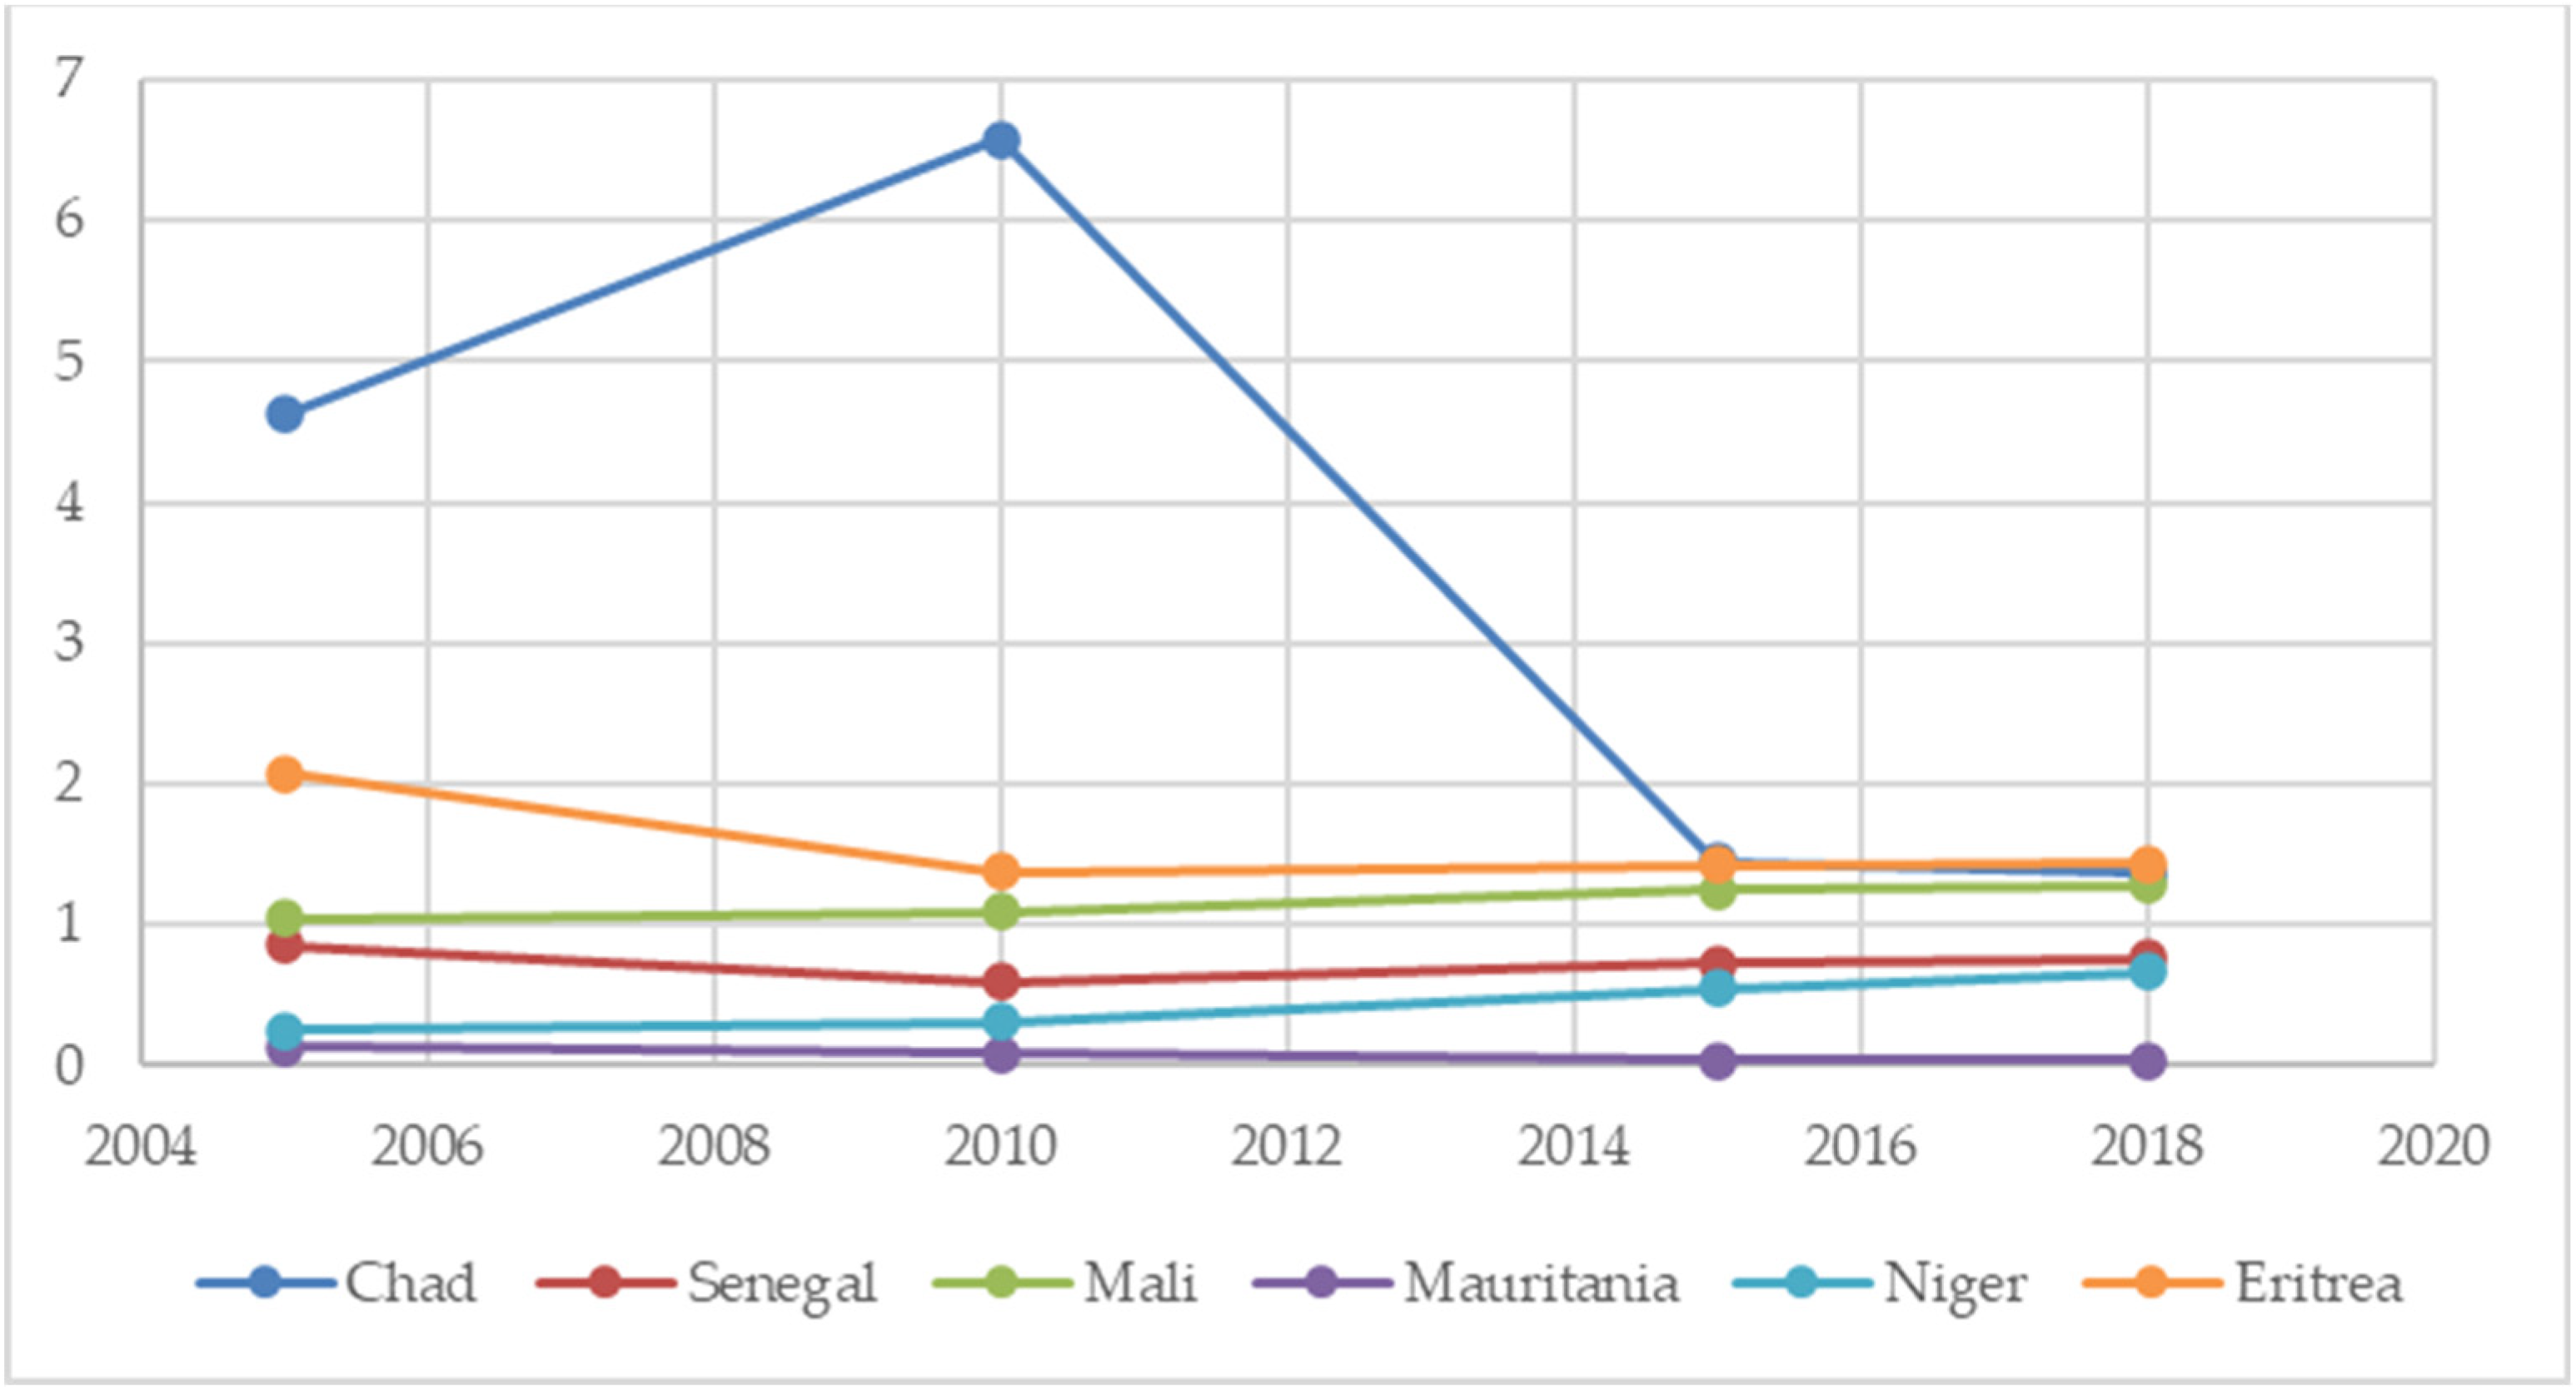
Another goal subject to monitoring is to “strengthen the prevention and treatment of substance abuse, including narcotic drug abuse and harmful use of alcohol” (
Figure 11). In this area, one indicator has been defined. Its values are available for the years 2005, 2010, 2015, and 2018. In all surveyed countries except Mali, the value of this indicator decreased in 2018 compared with 2005. Chad stands out among the other countries, where consumption was at its highest level.
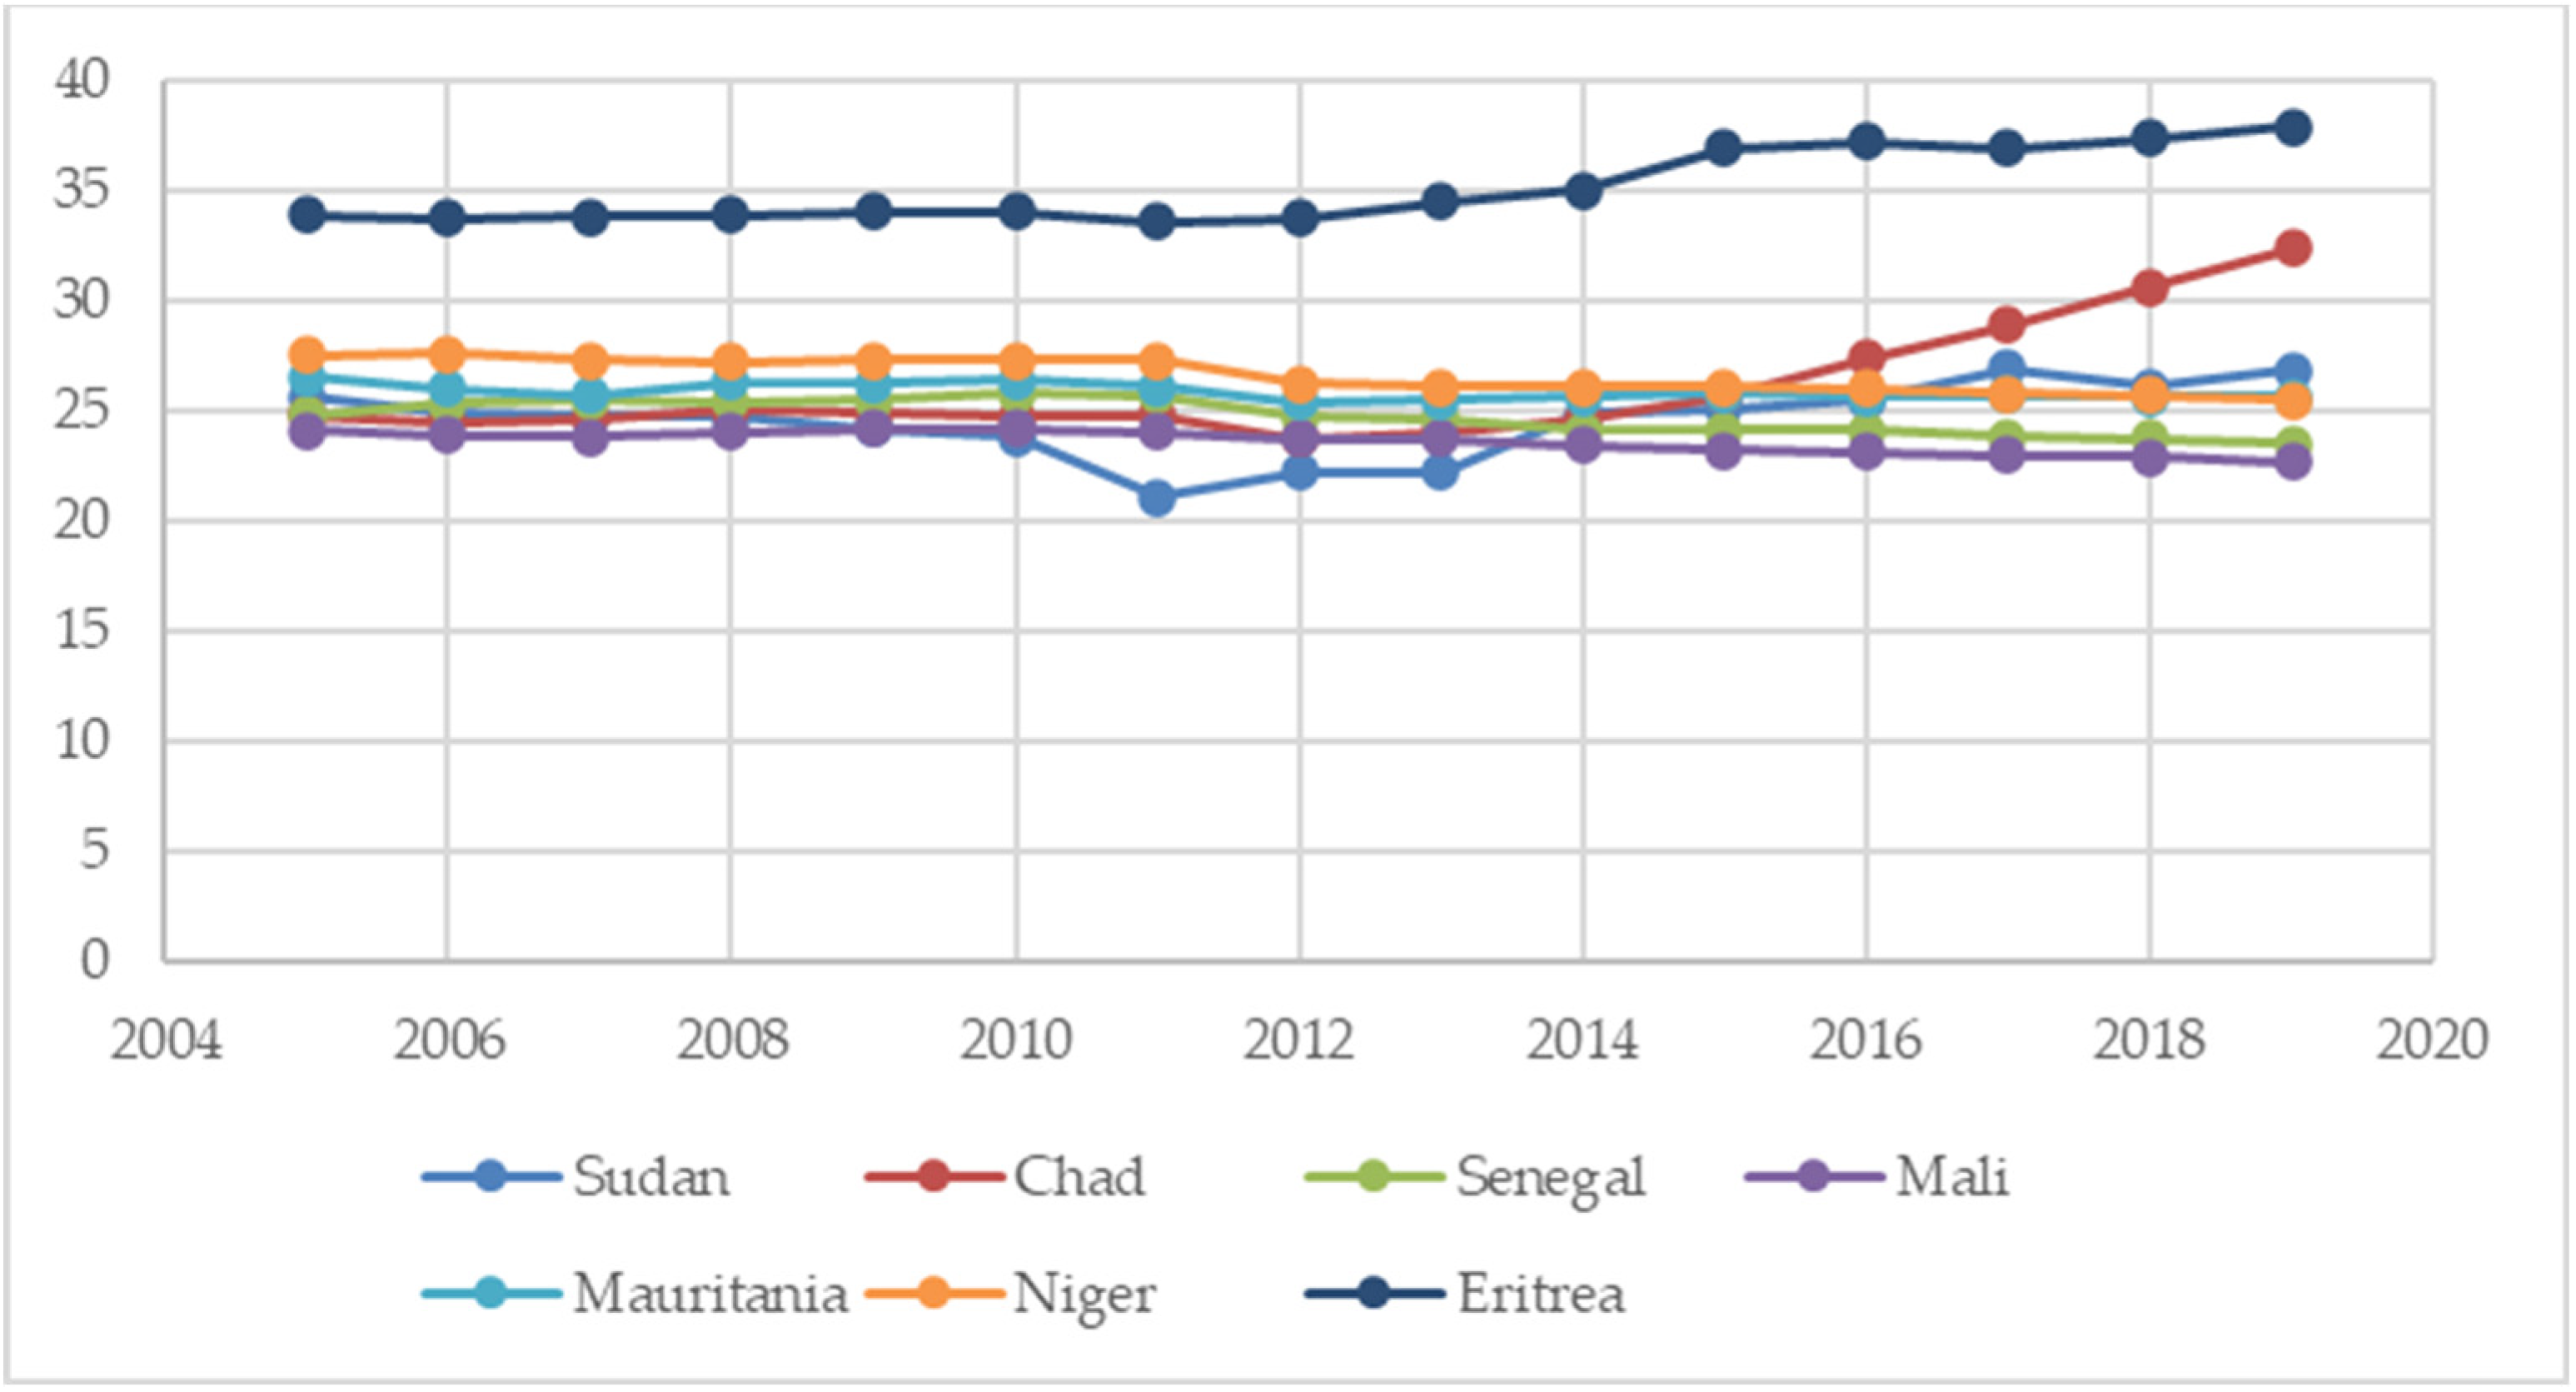
The next goal to achieve is the following: “By 2020, halve the number of global deaths and injuries from road traffic accidents”, which is monitored using the indicator “mortality caused by road traffic injury” (
Figure 12). In the case of this indicator, it can be noted that the surveyed countries faced significant challenges in achieving its intended value. In fact, in three of the surveyed countries (Sudan, Chad, Eritrea), its value increased. A particularly concerning situation can be observed in Eritrea, where its value was significantly higher than in the other countries. In three countries, the value of the indicator decreased, but this decrease ranged from 6% to 8%.
The goal “By 2030, ensure universal access to sexual and reproductive healthcare services, including for family planning, information and education, and the integration of reproductive health into national strategies and programs” is monitored through two indicators. However, for the first of these indicators, “Women making their own informed decisions regarding sexual relations, contraceptive use and reproductive health care (% of women age 15–49)”, only single data points are available, making any analysis impossible.
In the case of the indicator “Adolescent fertility rate (births per 1000 women ages 15–19)” (
Figure 13), its value decreased in all analyzed countries in 2020 compared with 2005. The largest decrease, exceeding 50%, was observed in Sudan, while the smallest decrease, of 12%, occurred in Mali.
The goal “By 2030, substantially reduce the number of deaths and illnesses from hazardous chemicals and air, water, and soil pollution and contamination” is monitored using the indicator “Mortality rate attributed to unintentional poisoning” (
Figure 14). Its value decreased in all the countries under study. The average decrease was 22%. The largest decrease, of nearly 35%, was observed in Sudan, while the smallest decrease, of 6%, occurred in Mauritania.
For the indicator “Mortality rate attributed to unsafe water, unsafe sanitation and lack of hygiene (per 100,000 population)” and “Mortality rate attributed to household and ambient air pollution, age-standardized (per 100,000 population)”, data were only available for the year 2016 (
Table 5).
From the presented data, it can be concluded that mortality due to air pollution is a greater problem than the lack of access to water. In the subsequent part of the study, an attempt was made to analyze the level of sustainable development in the area of “Ensure healthy lives and promote well-being for all at all ages” in the countries of the African Sahel region from a dynamic perspective.
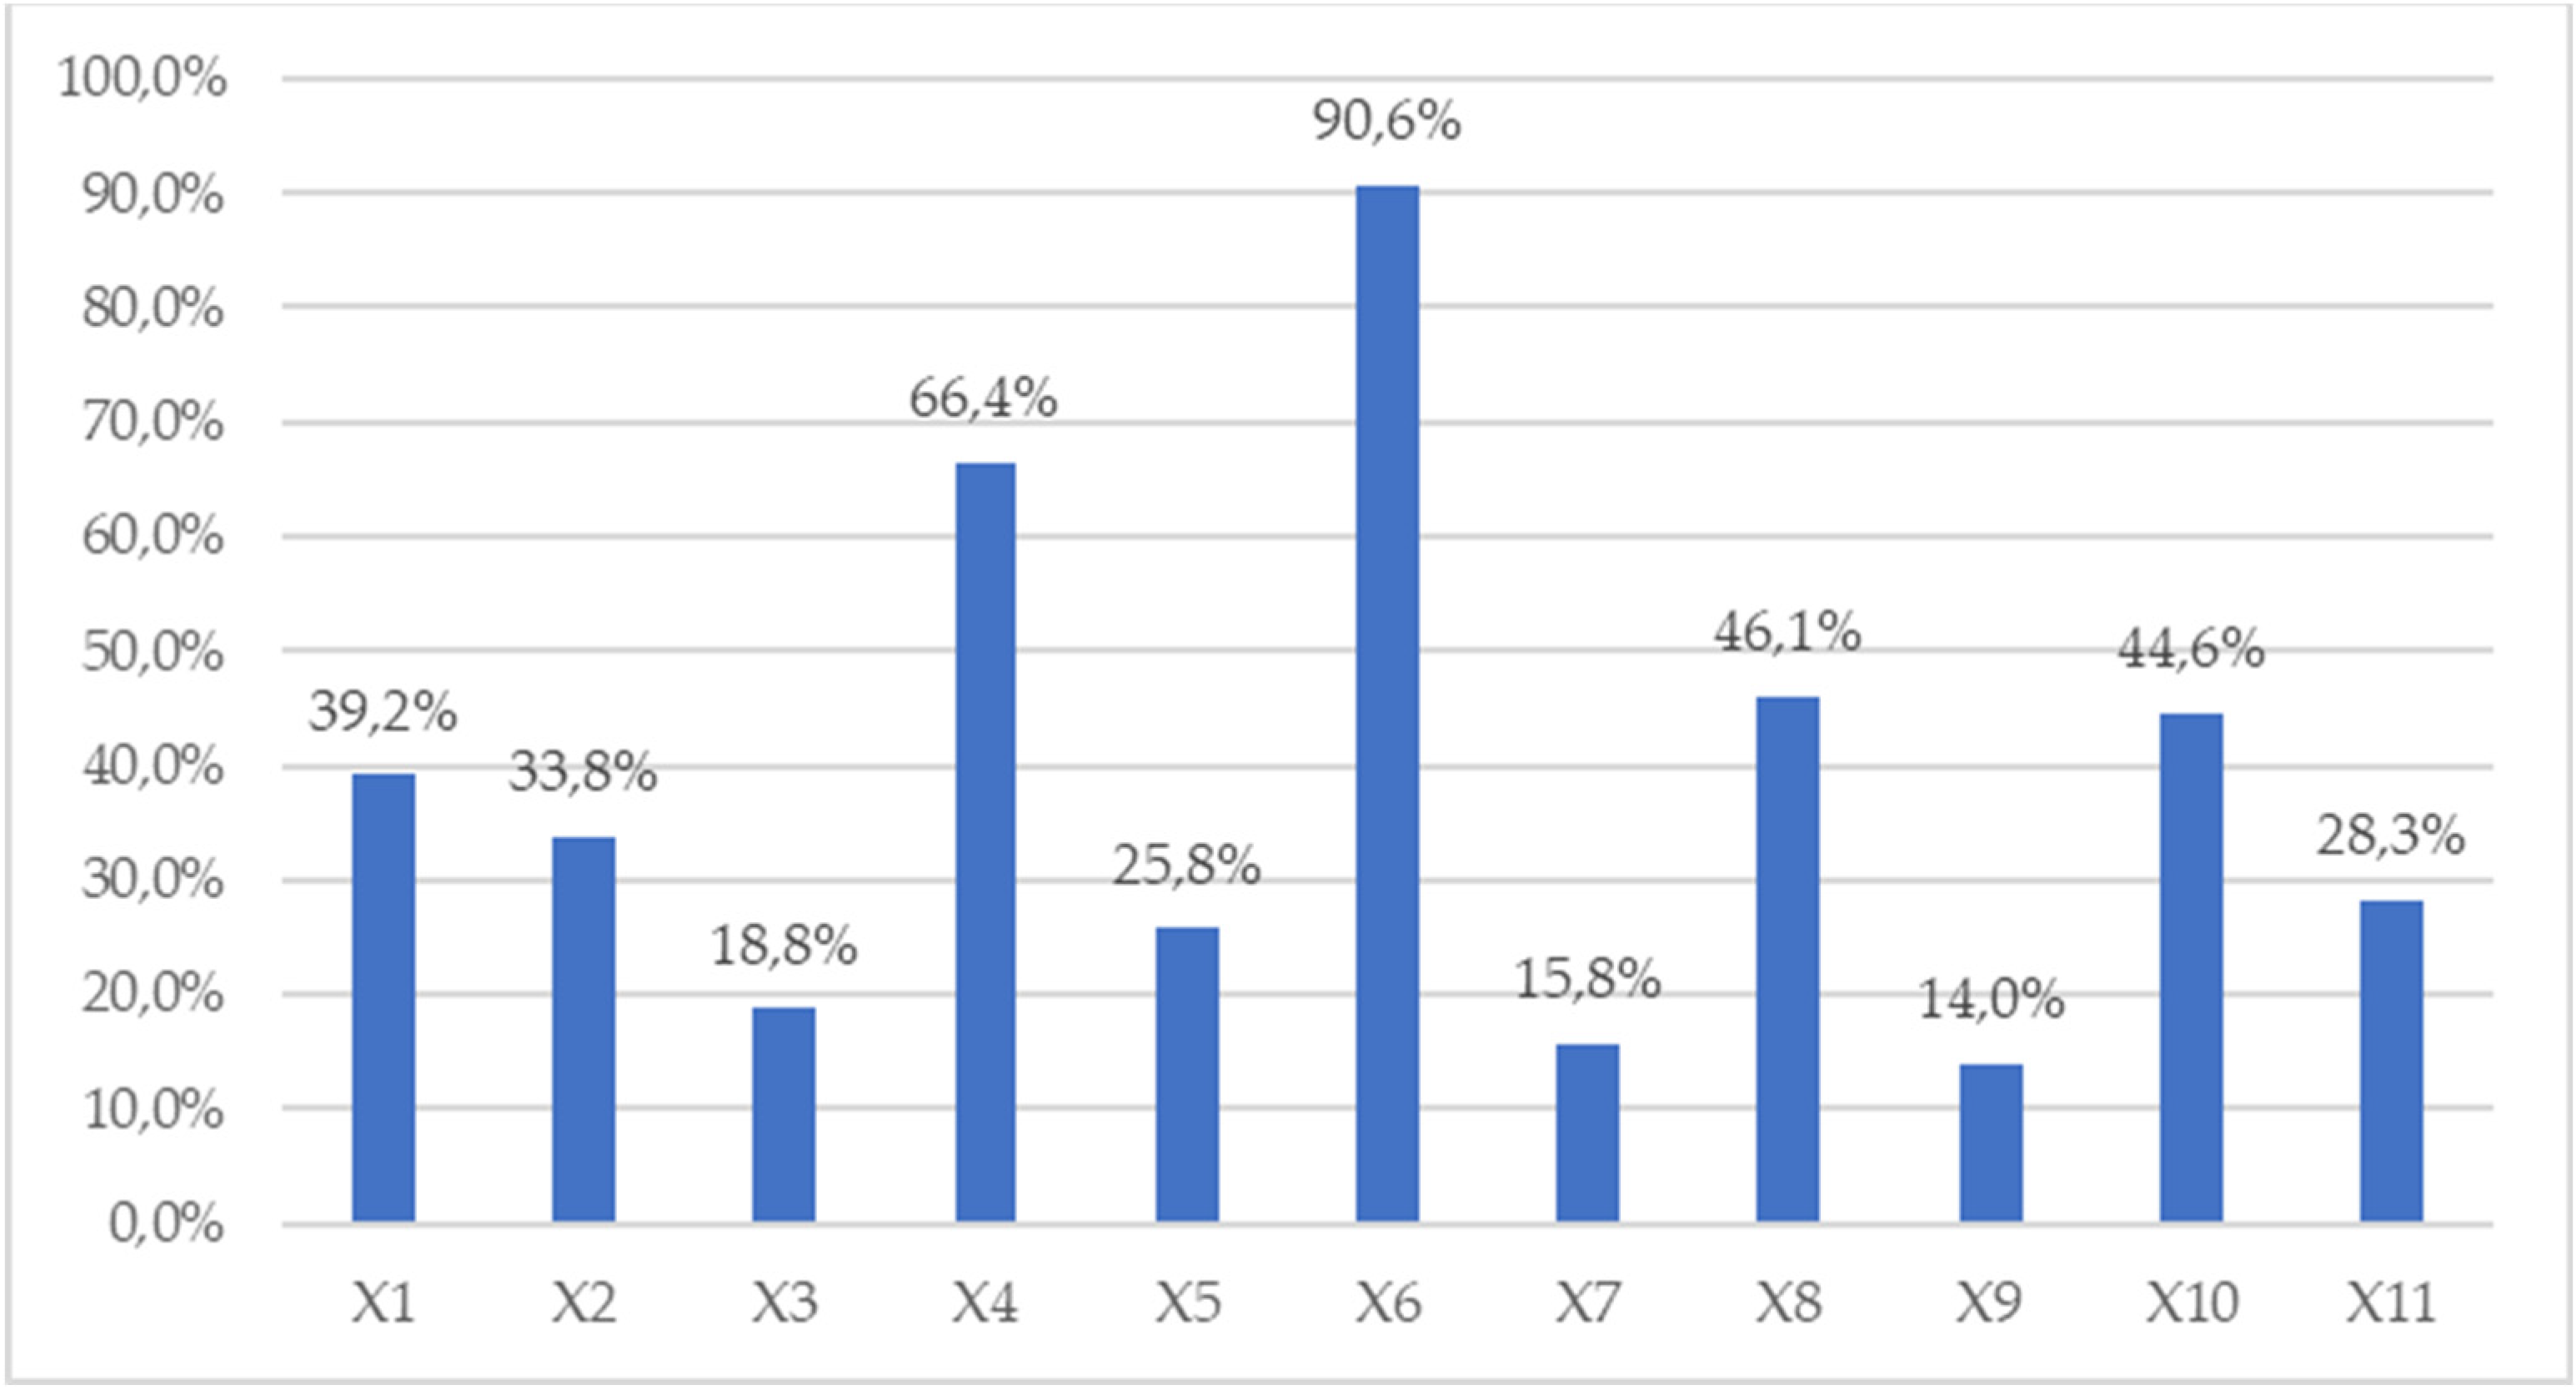
Figure 15 presents the coefficient-of-variation values for 11 indicators in the “Ensure healthy lives and promote well-being for all at all ages” area for the years 2005–2020, and
Figure 16 shows their average values. The greatest variation was observed in the case of X6: Incidence of malaria (per 1000 population at risk). Significant variation can also be observed in the case of the indicator X4: Incidence of HIV, ages 15–49 (per 1000 uninfected population aged 15–49). The average coefficient of variation for these indicators in the years 2005–2020 was 90.6% and 66.4%, respectively. In both cases, the variation showed an increasing trend. The countries examined showed the least average variation in X7: Mortality from CVD, cancer, diabetes, or CRD between the exact ages of 30 and 70 (%) and X9: Mortality caused by road traffic injury (per 100,000 population). The average variations were 15.8% and 14.0%, respectively. However, in the case of the first indicator, a noticeable trend of further decreasing disparities between countries can be observed, while in the case of the second indicator, the variation between countries increased.
It is worth noting that only in the case of two indicators, X7: Mortality from CVD, cancer, diabetes, or CRD between the exact ages of 30 and 70 (%) and X8: Suicide mortality rate (per 100,000 population), a decreasing trend in the variation of the examined countries was observed. For the rest of the indicators, the trend was increasing.
4. Discussion
For the purposes of the discussion, we will focus on the indicators first and then move on to the individual countries and the Sahel region.
Indicator 1. Maternal mortality ratio (modeled estimate, per 100,000 live births). The best performer in terms of improvement during the period 2005 to 2017 was Sudan, with a decrease of 44.2%. The worst performer was Mauritania, with a decrease of only 7.3% during the period 2005 to 2017. Sudan had the lowest mortality rate of 295 deaths per 100,000 live births in 2017. Chad had the highest mortality rate, with 1140 deaths per 100,000 live births in 2017.
At the current rates of progress, Sudan is on track to meet the SDG target in the year 2030 based on this indicator. However, Chad would only meet the target in 2090, although
Figure 3 shows Chad to be an outlier on this indicator. Therefore, the situation in the Sahel as a whole is much more positive than Chad’s experience would suggest. The coefficient of variation showed a steady increase during this period, rising from 32.4% in 2005 to 46.7% in 2017. This suggests that inequality is increasing within the Sahel with respect to the region’s ability to reduce maternal mortality and prevent the deaths women during or after pregnancy.
Indicator 2. Mortality rate, under-5 (per 1000 live births). The best performer is Senegal, both in absolute terms (38.1 mortalities per 1000 live births in 2020) and in terms of improvement (a decrease over the period 2005 to 2020 of 58.5%). The worst performer is Chad, both in absolute terms (110.0 mortalities per 1000 live births in 2020) and in terms of improvement (a decrease over the period 2005 to 2020 of 34.1%).
At the current rates of progress, Senegal would meet the SDG target in the year 2021 based on this indicator. However, Chad would only meet the target in 2041. The graph in
Figure 4 shows all Sahel countries making progress on this indicator, which is encouraging. The coefficient of variation remained in the range 32.3% to 35.6% during this period. This suggests a relatively low and stable level of inequality within the Sahel with respect to the region’s ability to prevent the deaths of children under 5 years of age.
Indicator 3. Mortality rate, neonatal (per 1000 live births). The best performer in terms of improvement during the period 2005 to 2020 was Senegal, with a decrease of 35.8%. The worst performer was Chad, with a decrease of only 17.8% during the period 2005 to 2020. Eritrea had the lowest mortality rate of 17.7 per 100,000 live births in 2020. Chad had the highest mortality rate with 32.8 deaths per 100,000 live births in 2020.
At the current rates of progress, Senegal would meet the SDG target in the year 2029 based on this indicator. However, Chad would only meet the target in 2064. The graph in
Figure 5 shows all Sahel countries making progress on this indicator which is encouraging. The coefficient of variation showed a steady increase during this period, rising from 16.4% in 2005 to 20.5% in 2020. This suggests a relatively low but steadily increasing level of inequality within the Sahel with respect to the region’s ability to reduce maternal mortality and prevent the deaths of newborns.
Indicator 4. Incidence of HIV, ages 15–49 (per 100,000 uninfected population aged 15–49). The best performer in terms of improvement during the period 2005 to 2020 was Senegal, with a decrease of 84.0%. The worst performer was Sudan, with a decrease of only 16.7% during the period 2005 to 2020. Niger had the lowest infection rate of 0.07 infections per 1000 uninfected population aged 15–49 in 2020. Chad had the highest infection rate of 0.34 infections per 1000 uninfected population aged 15–49 in 2020.
Figure 6 clearly shows that Chad and Mali had significantly higher levels of infection compared with Sudan, Senegal, Niger and Eritrea. Despite these differences in performance, the data suggest that all countries have a good chance of ending the HIV epidemics in the Sahel region. Hence, they will probably meet the SDG targets by 2030. The fairly high coefficient of variation suggests that quite a high level of inequality across the Sahel region existed during the period 2005 to 2020. However, although the CV value was 55.6% in 2005 and peaked at 74.0% in 2013, it dropped again to 58.8% in 2020. This suggests a return to a more equitable situation across the Sahel region with respect to the incidence of HIV.
Indicator 5. Incidence of TB (per 100,000 people). The best performer in absolute terms (52 cases in 2020) was Mali. Eritrea was the best performer in terms of improvement during the period 2005 to 2020 (a decrease of 61.2%). It should be noted that Chad was the worst performer (absolute level of 144 cases in 2020 and an improvement of only 4.6% during the period 2005 to 2020).
Figure 7 clearly shows that Mali had significantly lower levels of infection in 2005 compared with other countries in the Sahel region. However, although Mali remained the best performer in 2020, most countries outperformed Mali during the period 2005 to 2020. Only Chad experienced difficulty in significantly lowering its incidence of TB. The coefficient of variation remained in the range 27.0% to 32.6% during this period. This suggests a relatively low and stable level of inequality within the Sahel with respect to the region’s ability to prevent the incidence of TB. Despite these differences in performance, the data suggest that all countries have a good chance of ending the TB epidemics in the Sahel region by 2030 and, therefore, of meeting the SDG targets.
Indicator 6. Incidence of malaria (per 1000 population at risk). The best performer was Mauritania, with an incidence rate 30.0 per 1000 population at risk in 2020. Mauritania was also the best performer during the period 2005 to 2020, with a decrease in the incidence rate of 64.4%. Eritrea showed the worst performance during the period 2005 to 2020, with an increase in the incidence rate of 357.5%, although it started from a low level of incidence (9.8 per 1000 population at risk in 2005). Sudan and Niger also experienced increases in their incidence rates during the period 2005 to 2020. Mali had the worst incidence rate in 2020, with 357.5 per 1000 population at risk.
These data suggest that these countries have little chance of ending malaria epidemics in the Sahel region. Based on their current performance, Mauritania could prevent epidemics by 2029 and Senegal by 2031. However, at the current rate of progress, Mali will not be capable of achieving this until the year 2216. Since the situation is actually deteriorating in other Sahel countries, it is reasonable to conclude that the Sahel region will not meet the SDG targets by 2030 unless there is a significant change in policy. The data suggest that there are two groups of countries in terms of performance (see
Figure 8), with Sudan, Senegal, Mauritania and Eritrea significantly outperforming Mali, Niger, and Chad. This, in turn, suggests structural and/or economic differences that could be used to transfer best practice.
Figure 15 and
Figure 16 show a consistently high coefficient of variation (average 90.6%) during the period 2005 to 2020. This suggests a consistently high level of inequality across the Sahel with respect to the management of malaria epidemics.
Indicator 7. Mortality from CVD, cancer, diabetes or CRD between the exact ages of 30 and 70 (%). The target is to reduce premature mortality from non-communicable diseases by one third. Eritrea had the best performance during the period 2005 to 2019, with a decrease in the mortality rate of 13.0%. However, Eritrea also had the highest mortality rate in 2019 of 26.8%. Niger had the worst performance during the period 2005 to 2019, with a decrease in the mortality rate of 3.7%. The lowest mortality rate in 2019 was Mauritania with 16.1%.
The average decrease for the Sahel region from 2005 to 2019 was 7.7%. To reduce mortality from CVD, cancer, diabetes, or CRD between the exact ages of 30 and 70 by one third at the current rates of improvement, it will take until the year 2077 to achieve this goal across the Sahel region. The coefficient of variation (see
Figure 15 and
Figure 16) suggests that this problem is persistent in the Sahel region and affects all countries to a similar degree. These findings suggest that significant resources need to be available to meet the SGD target by 2030.
Indicator 8. Suicide mortality rate (per 100,000 population). The best performer in terms of improvement during the period 2005 to 2019 was Eritrea with a decrease of 16.8%. Nevertheless, Eritrea still had the highest suicide rate of 10.9 per 100,000 in 2019.
Figure 10 clearly shows that Eritrea was an outlier in the Sahel region with a significantly worse suicide rate than other Sahel countries. The worst performer during the period 2005 to 2019 was Niger with no change in its suicide rate. The lowest suicide rate was Mauritania with 3.1 suicides per 100,000 in 2019.
The average decrease for the Sahel region from 2005 to 2019 was 10.2%. To reduce mortality from suicide by one third at the current rates of improvement, it will take until the year 2055 to achieve this goal across the Sahel region. The coefficient of variation (see
Figure 15 and
Figure 16) showed a slight decrease during the period 2005 to 2019, dropping from 47.8% in 2005 to 42.6% in 2019. This suggests that inequality is decreasing slightly within the Sahel region with respect to its ability to reduce suicide mortality. Nevertheless, significant resources need to be available to meet the SGD target by 2030.
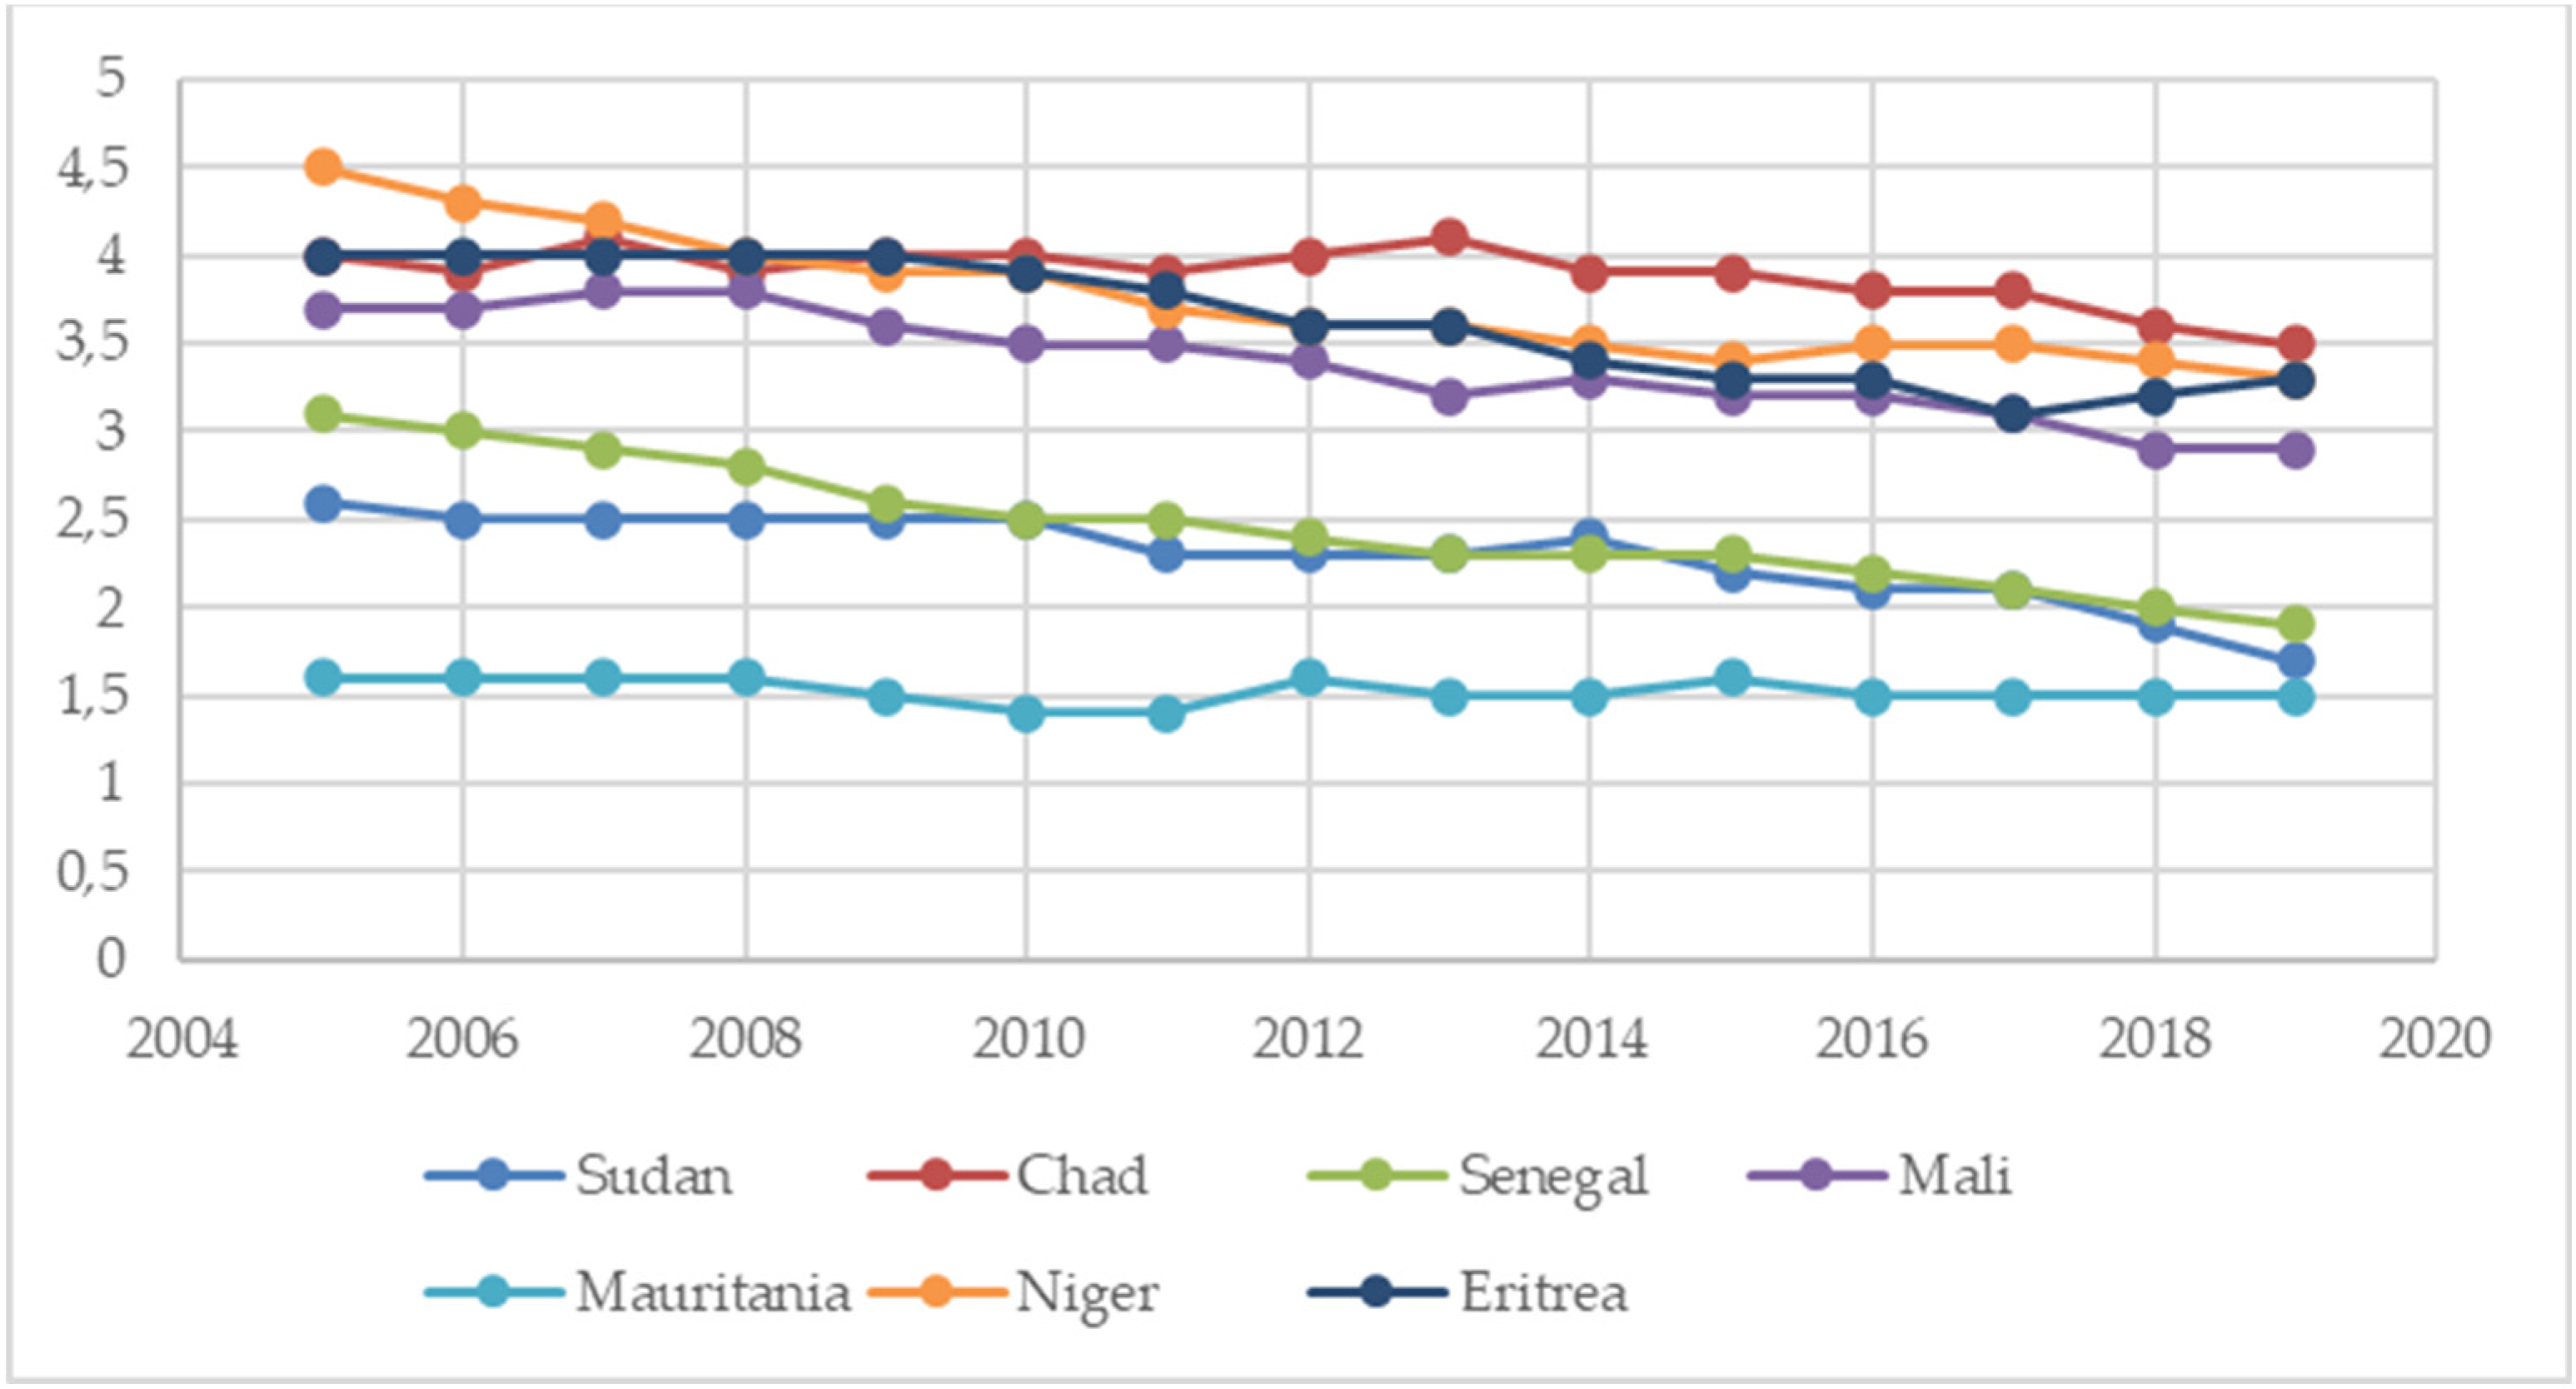
Indicator 9. Total alcohol consumption per capita (liters of pure alcohol per year, projected estimates, 15+ years of age). The best performer in terms of improvement during the period 2005 to 2018 was Mauritania with a decrease in alcohol consumption of 72.3%. The worst performer was Niger with an increase in alcohol consumption of 168.0% during the period 2005 to 2018. Eritrea had the highest rate of alcohol consumption per capita with 1.44 L in 2018. Mauritania had the lowest rate of alcohol consumption per capita with 0.04 L in 2018.
The objective is to strengthen the prevention and treatment of substance abuse.
Figure 11 shows Chad as an outlier for the period 2005 to 2010, with a significant improvement in its performance in 2015. The coefficient of variation showed very large values for the years 2005 (102.6%) and 2010 (133.6%), mainly due to Chad’s performance. For 2015 and 2018, the coefficient of variation was 57.0% and 53.5%, respectively. These data suggest that inequality with respect to alcohol consumption has improved across the Sahel region but still remains at a relatively high level.
Indicator 10. Mortality caused by road traffic injury (per 100,000 population). By 2020, the number of global deaths and injuries from road traffic accidents should have been halved. The best performers in terms of improvement during the period 2005 to 2019 were Senegal, Mali, Mauritania, and Niger, all with single figure decreases. The worst performance was by Chad, with an increase of 30.6% during the period 2005 to 2019. Eritrea had the highest rate of mortality caused by road traffic injury, with 37.9 mortalities per 100,000 in 2019. Mali had the lowest rate of mortality, with 22.7 mortalities per 100,000 in 2019.
All Sahel countries have significantly failed to meet the goal of halving the number of mortalities by 2020. An outlier in terms of performance is Eritrea, which has significantly higher levels of mortalities than the other Sahel countries. The coefficient of variation (see
Figure 15 and
Figure 16) is relatively low but shows a slight increase during the period 2005 to 2019, increasing from 11.6% in 2005 to 18.2% in 2019. This suggests that with respect to the Sahel region’s ability to reduce traffic mortality, inequality is relatively low but is increasing slightly within the region.
Indicator 11. Women making their own informed decisions regarding sexual relations, contraceptive use, and reproductive health care (% of women aged 15–49). The lack of data points for this indicator does not allow any significant conclusions to be drawn. However, from the few data points available, it can be observed that the situation is worsening, and the percentage of women reported is generally less than 10%, with the notable exception of Chad, which reported 27% in 2015.
Indicator 12. Adolescent fertility rate (births per 1000 women aged 15–19). The best performer in terms of improvement during the period 2005 to 2020 was Sudan, with a decrease of 52.4%. The worst performance was Mali, with a decrease of 12.6% during the period 2005 to 2020. Niger had the highest fertility rate, with 177.5 births per 1000 women aged 15–19 in 2020, and Eritrea had the lowest, with 47.0 births per 1000 women aged 15–19 in 2020.
These data suggest that access to sexual and reproductive healthcare services, including for family planning, information, and education, and the integration of reproductive health into national strategies and programs is improving and having a tangible effect. However, the graph in
Figure 13 also shows two distinctly different rates of development, with Sudan, Senegal, Mauritania, and Eritrea outperforming Chad, Mali, and Niger. The coefficient of variation (see
Figure 15) shows a steady increase during the period, rising from 38.3% in 2005 to 50.9% in 2020. This suggests that inequality is increasing for women in terms of access to family planning services, etc., across the Sahel region.
Indicator 13. Mortality rate attributed to household and ambient air pollution, age-standardized (per 100,000 population). For this indicator, data were only available for the year 2016 (see
Table 5). The best performer was Senegal, with 160.7 deaths per 100,000. The worst performer was Chad, with 280.1 per 100,000.
Indicator 14. Mortality rate attributed to unsafe water, unsafe sanitation, and lack of hygiene (per 100,000 population). For this indicator, data were only available for the year 2016 (see
Table 5). The best performer was Sudan, with 17.3 deaths per 100,000. The worst performer was Chad, with 101.0 per 100,000.
Indicator 15. Mortality rate attributed to unintentional poisoning (per 100,000 population). The best performer in terms of improvement during the period 2005 to 2019 was Senegal, with a decrease of 38.7%. The worst performance was Mauritania, with a decrease of 6.3% during the period 2005 to 2019. Chad had the highest mortality rate, with 3.5 deaths per 100,000 population in 2019, and Mauritania had the lowest, with 1.5 deaths per 100,000 population in 2019.
Figure 14 shows that all countries in the Sahel had reduced their rates of unintentional poisoning during the period 2005 to 2019. The average degree of improvement during the period 2005 to 2019 was 22.6%. This improvement can be described as ”substantial” and hence fulfills objective 9 (see
Table 4). The coefficient of variation showed a steady increase during that period, rising from 27.5% in 2005 to 30.6% in 2019. This suggests that when it comes to managing this objective across the Sahel region, the level of inequality is relatively low, but it had increased slightly during the period 2005 to 2020.
Coefficients of variation, CV (Figure 15 and Figure 16). The CV data show relatively stable levels of spatial diversification (i.e., inequality) for most indicators across the Sahel region during the period 2005 to 2020 (see
Figure 15). Two exceptions are the curves for HIV (X4) and malaria (X6), which increased to a maximum in the years 2012–13 and decreased again to a level in 2020 similar to that in 2005.
The CV data also show some significant differences in levels of inequality for a number of indicators across countries in the Sahel region (see
Figure 16). In general, the mortality indicators show relatively lower levels of inequality. However, specific diseases such as HIV (
Figure 16, X4) and malaria (
Figure 16, X6) show relatively high levels in inequality across the Sahel region.
Country level analysis. In order to assess the relative performance of countries in the Sahel region, the countries have been ranked on each indicator where the data sets allow. The results are shown in
Table 6,
Table 7 and
Table 8.
If we consider the rankings of performance improvement during the period 2005 to 2019, we observe that Senegal and Eritrea were the best performers, with Chad and Mauritania being the worst (see
Table 6). If we consider the rankings of average performance during the period 2005 to 2019, we observe that Sudan, Senegal, and Mauritania were the best performers, with Chad being the worst (see
Table 7). If we add together the points from
Table 6 and
Table 7, we can conclude that Senegal and Sudan were the best performers overall in the Sahel region. Mauritania performed relatively well during the period but was struggling to improve its situation. Chad was a consistently poor performer during the period (see
Table 8).
If we compare the findings in
Table 8 with the life expectancy data in
Table 2, we observe a reasonable correlation between the rankings of the two data sets. This suggests that there is a relatively high degree of construct validity between the indicators, objectives, and SDG 3 (Ensure healthy lives and promote well-being for all at all ages).
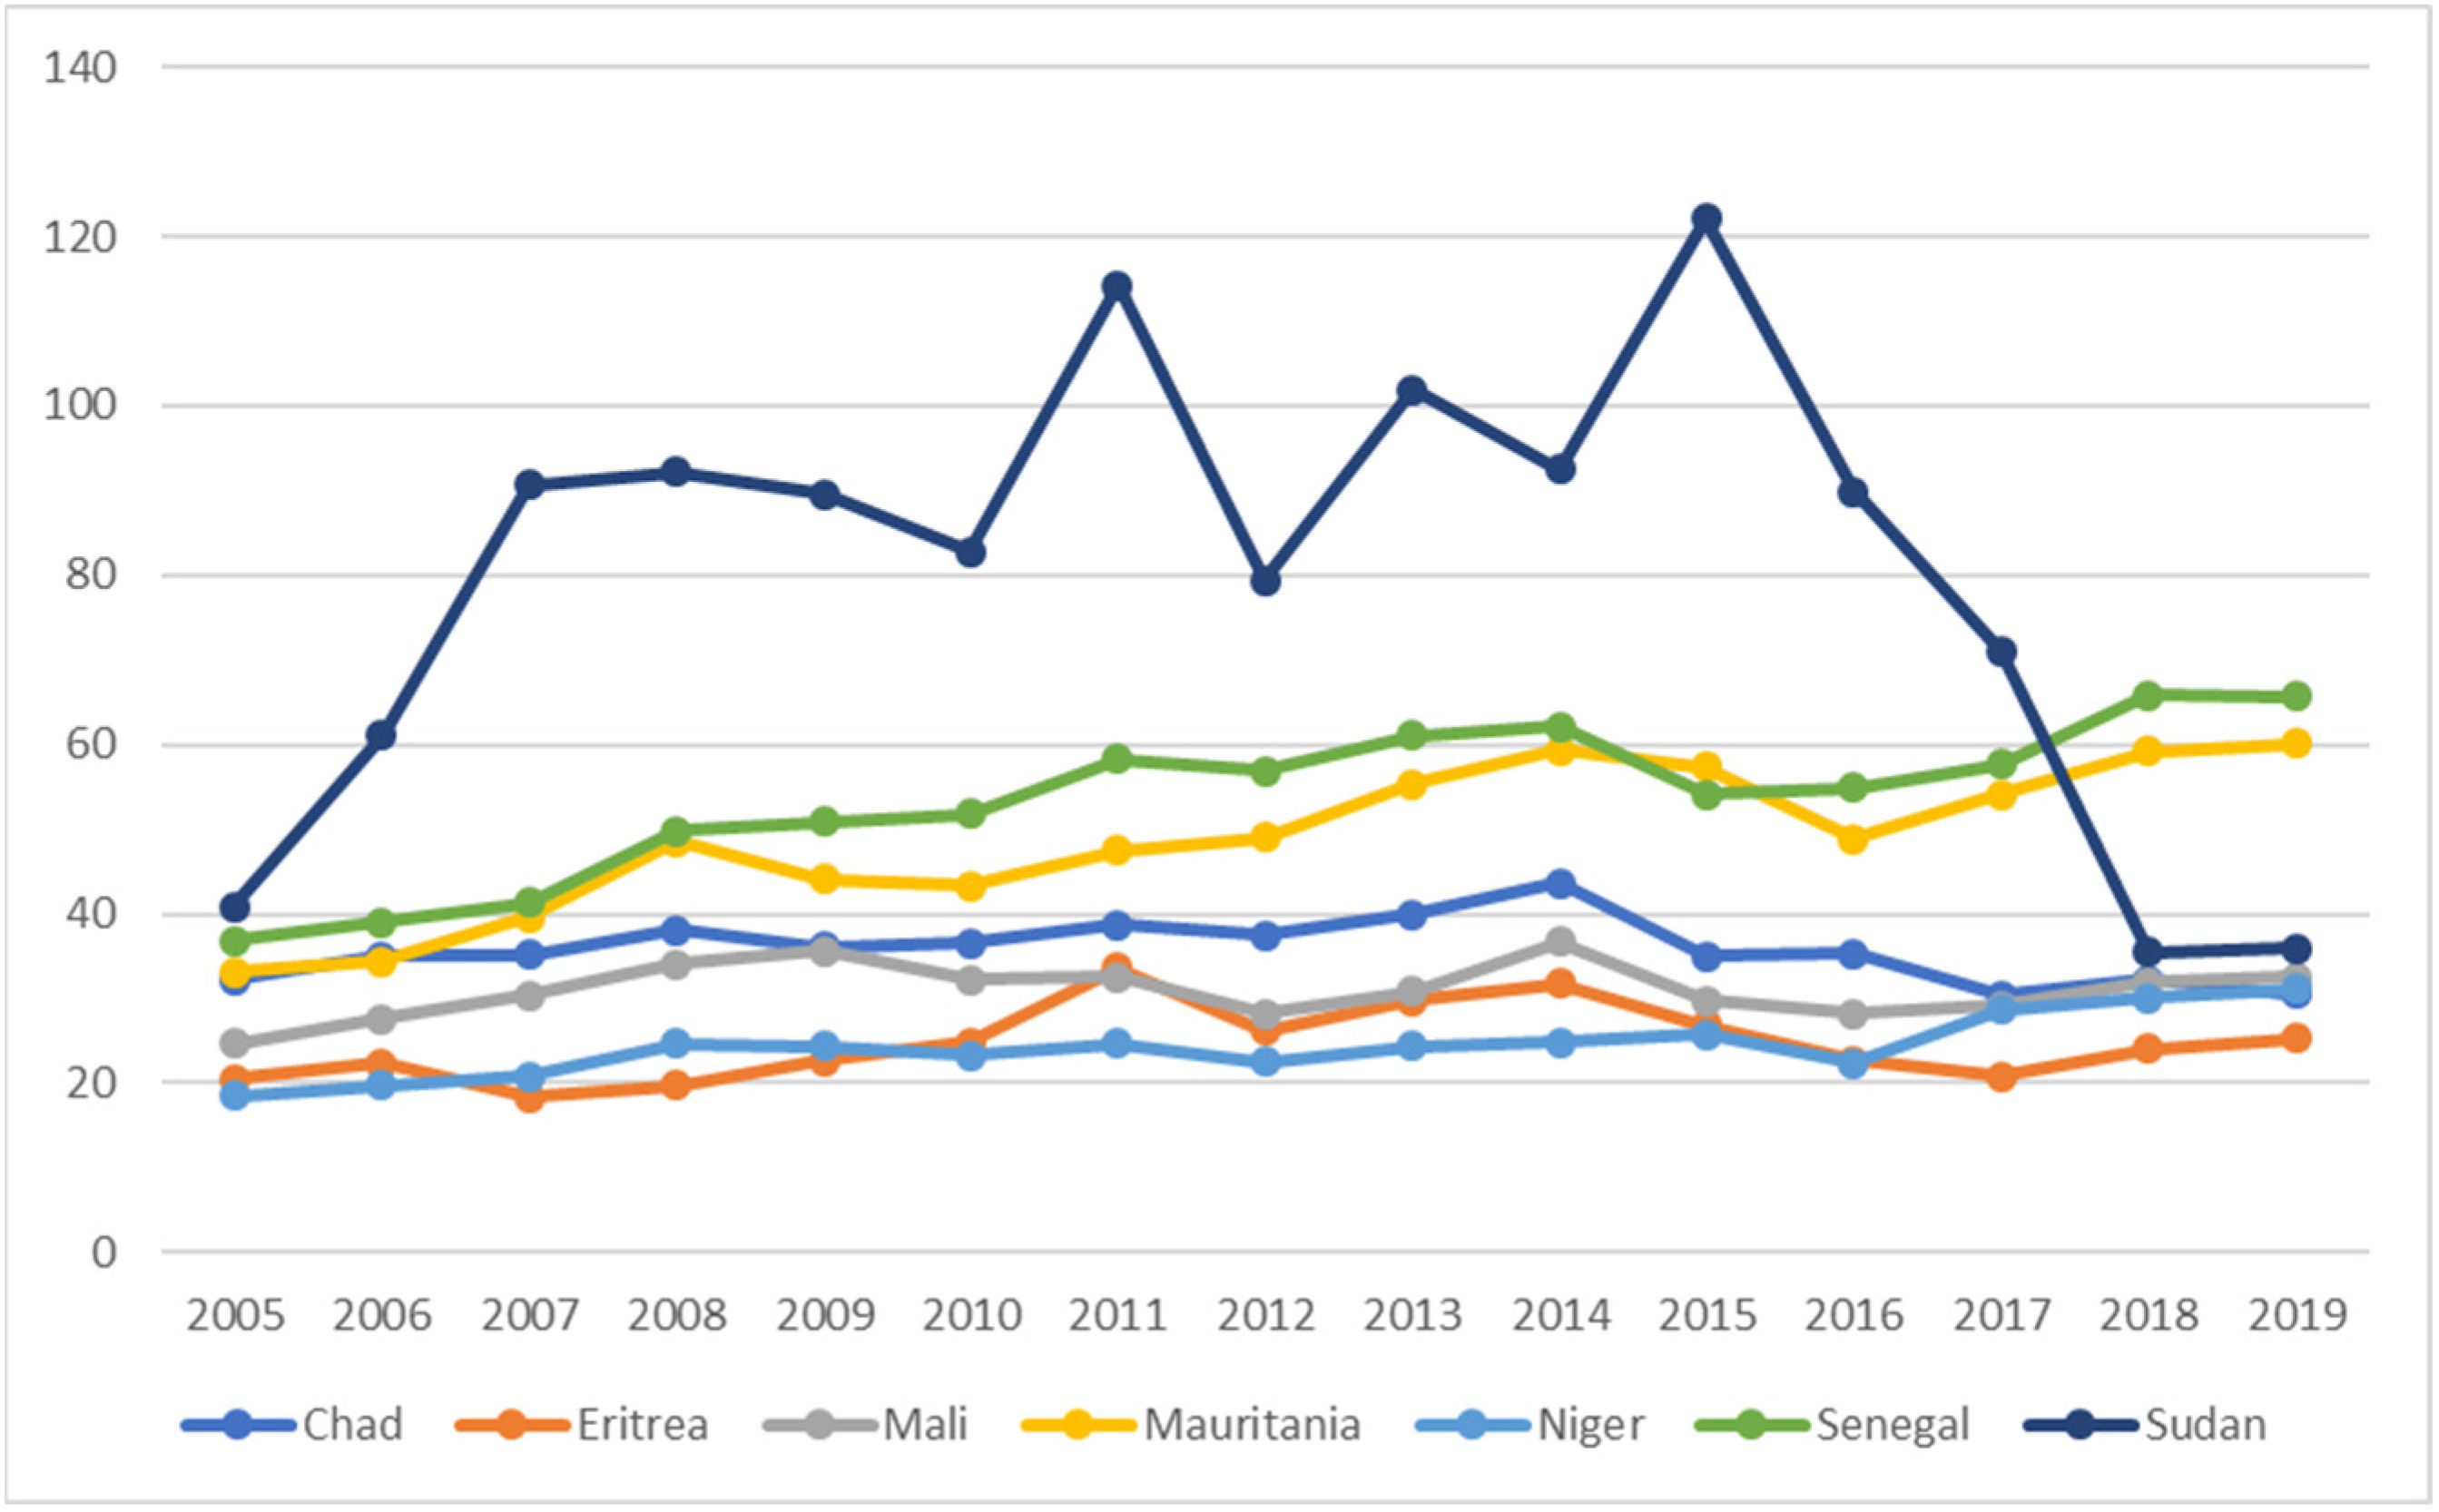
It is also instructive to consider per capita spending on healthcare personnel, systems, and infrastructure.
If we compare life expectancy (
Table 2) with per capita current health expenditure (
Figure 17), we can observe that Sudan did not have the highest life expectancy despite having more resources for healthcare than other countries in the Sahel. The star performer in the group is arguably Eritrea, which had the second lowest spending on healthcare (
Figure 17) but the second highest life expectancy (
Table 2) and the third highest SDG performance (
Table 8). This suggests that how Eritrean healthcare is organized and managed is more efficient and effective than other countries in the Sahel. That is, Eritrea can be considered an example of best practice. Worst practice is arguably in Chad, which had the fourth-highest spending on healthcare but by far the worst performance overall for SDG 3. Thus, we can conclude that healthcare spending in the Sahel region does not correlate with performance with regard to SDG 3. This general result should be of concern for policy makers, NGOs, and supra-national organizations such as the UN and WHO.
5. Conclusions
We will address the research questions in
Section 2 by first assessing the degree to which the SDG 3 Objectives have been achieved and then look at the coefficients of variation and the progress toward meeting SDG 3.
Objective 1. By 2030, reduce the global maternal mortality ratio to less than 70 per 100,000 live births. Only Sudan will meet the indicator 1 target by 2030. The situation in Chad is a cause for concern. Levels of inequality across the region are increasing.
Objective 2. By 2030, end preventable deaths of newborns and children under 5 years of age, with all countries aiming to reduce neonatal mortality to at least as low as 12 per 1000 live births and under-5 mortality to at least as low as 25 per 1000 live births. Taken together, indicators 2 and 3 suggest that only Senegal will meet the SDG target by 2030. Chad is a cause for concern. Inequality across the region is relatively low but increasing.
Objective 3. By 2030, end the epidemics of AIDS, tuberculosis, malaria, and neglected tropical diseases and combat hepatitis, water-borne diseases, and other communicable diseases. All countries in the Sahel appear to be working toward meeting this objective for HIV and TB. Malaria is problematic and presents a challenge, although Mauritania and Senegal appear to be for this. Chad is a cause for concern. Levels of inequality across the Sahel are particularly high for HIV and malaria.
Objective 4. By 2030, reduce by one third premature mortality from non-communicable diseases through prevention and treatment and promote mental health and well-being. The data for the Sahel region clearly show that it has no hope of achieving objective 4 by 2030. Eritrea and Niger are a cause for concern. Levels of inequality across the region are significant with a slightly decreasing trend.
Objective 5. Strengthen the prevention and treatment of substance abuse, including narcotic drug abuse and harmful use of alcohol. The data for the Sahel region show a mixed picture with respect to achieving objective 5 by 2030. Niger is a cause for concern with its increasing levels of alcohol consumption. Levels of inequality across the region are improving slowly from a relatively high level. It is noticeable that countries with significant Christian populations (i.e., Chad and Eritrea) have the highest levels of alcohol consumption. Muslim countries have the lowest levels for alcohol consumption.
Objective 6. By 2020, halve the number of global deaths and injuries from road traffic accidents. The Sahel region has significantly failed to meet the goal of halving the number of mortalities by 2020. Eritrea and Chad are a cause for concern. Levels of inequality across the region are deteriorating slowly from a relatively low level. The average number of deaths per 100,000 in 2019 for the Sahel region was 27.8. This compares with 0.27 for the United Kingdom [
27], which represents a difference factor of 100.
Objective 7. By 2030, ensure universal access to sexual and reproductive healthcare services, including for family planning, information and education, and the integration of reproductive health into national strategies and programs. The data suggest that women continue to struggle to make their own informed decisions, although fertility rates are declining. Although fertility rates have dropped across the region, the Sahel has a long way to go to fulfill objective 6. Inequality experienced by women across the Sahel region is increasing in terms of access to family planning services, etc. The lack of data points was a problem for indicator 11. Clearly every effort should be made to institutionalize regular reporting given the importance of this indicator as a measure of sustainability.
Objective 8. Achieve universal health coverage, including financial risk protection, access to quality essential healthcare services, and access to safe, effective, quality, and affordable essential medicines and vaccines for all. No data were available from the United Nations SDG Indicators Database [
25] to use as a suitable proxy for objective 8. However,
Figure 17 shows the current per capita health expenditure in USD for the Sahel region. The average per capita health expenditure for the Sahel region is USD 40 for the year 2019. This figure is compared with the average per capita health spending in OECD countries, which was estimated to be more than USD 4000 for the year 2019 [
28]. The comparison (a factor of 100) gives some indication of the scale of the challenge the Sahel region is facing to attain objective 8 and, hence, SDG 3.
Objective 9. By 2030, substantially reduce the number of deaths and illnesses from hazardous chemicals and air, water, and soil pollution and contamination. Indicators 13 and 14 had too few data points to be of significance (see
Table 5). However, we can say that Chad performed poorly on both these indicators. Indicator 15 (
Figure 14) shows that all countries in the Sahel have reduced their rates of unintentional poisoning, with an improvement of 22.6%. This improvement can be described as ”substantial” and, hence, fulfills objective 9. The level of inequality is relatively low, but it has been increasing slightly.
To address questions relating to the degree of differentiation across countries in the Sahel region, we refer to the coefficients of variation, CV. Coefficients of variation can be used to highlight inequalities in economic, social, and ecological data. Taken as a whole, the CV data suggest there were no developments during the period 2005 to 2020 that have led to significant changes in the levels of inequality in the Sahel region with respect to the SDG “Ensure healthy lives and promote well-being for all at all ages”. Nevertheless, inequality is clearly present to varying degrees across the Sahel region, and the structural and natural causes behind these differences is of relevance for policy makers in supra-national organizations and governments.
Progress toward meeting Sustainable Development Goal (SDG) Goal 3: ”Ensure healthy lives and promote well-being for all at all ages”. Positive across the Sahel are the achievements relating to objectives 3 and 9. Also, the efforts of Senegal and Sudan should be mentioned as the leading countries in the Sahel with respect to SDG 3 performance. Eritrea should be highlighted for its efficient use of the limited resources it has available for healthcare. Finally, the performance of Chad during the period both in terms of achievement and inefficiency should give considerable cause for concern.
Overall, the results suggest that the Sahel region is not making any significant progress toward meeting SDG3 by 2030. There are a number of causal factors which influence the lack of progress, many of which are interrelated.
Figure 17 shows an increase in nominal healthcare expenditure over the Sahel region during the period 2005 to 2019. However, average inflation for Sub-Saharan Africa during the period was 5.43% [
5]. This means that real expenditure on healthcare in the Sahel was in significant decline during that period.
The geo-political situation in the region [
29,
30,
31] is another major factor behind the lack of progress toward SDG 3. For example, in 2020, as many as half a million children were displaced in the central Sahel countries of Mali and Niger [
30] which has had, inter alia, disastrous consequences for their education [
30]. Access to basic services including healthcare, food, drinking water, sanitation, hygiene, and social services have also been severely affected by these geo-political developments [
30].
Global climate change is also a major factor that has social and economic impacts [
32]. The Sahel has been identified as particularly vulnerable to the impacts of climate change [
33]. Agriculture and the food economy make up the overwhelming share of employment in the region [
32,
34]. The most vulnerable group are women since they make the largest contribution to agricultural production, processing, and distribution [
32]. Since women are the homemakers, with responsibility for kitchen gardens, cooking, cleaning, and washing, they require access to water and timber [
32]. Hence, when these resources become scarce because of climate change, it can affect the assets (time, security, money) required for women to perform these tasks [
32,
33]. The 2023 Intergovernmental Panel on Climate Change (IPCC) report identified the region (West, Central, and East Africa) as a “global hot spot” of high human vulnerability [
35].
Other relevant factors related to the geo-political situation and climate change are food insecurity [
36]; poor and inequitable access to education [
29,
31,
34,
36]; poor access for women to sexual and reproductive health (SRH) services [
31,
36]; gender-based violence (GBV) [
31,
36]; poor infrastructure [
29]; epidemics, including COVID [
31,
36]; institutional weaknesses [
34]; increased defense and security spending [
34]; and unfavorable population demographics [
29,
31].
To move forward on achieving SDG 3, the peoples of the Sahel require education and knowledge about basic healthcare, the causes of contracting infections, and the methods of prevention [
4], as well as significant investments in healthcare infrastructure. Furthermore, a number of issues must be addressed to enable the Sahel states to develop resilience and mitigation strategies.
The empowering of women and women’s organizations should be a top priority. It is well established that women are often best placed to understand their communities’ needs [
36]. A benchmark would be the Indian state of Kerala where women have played a fundamental role in building a sustainable society [
37]. Giving women a greater role in the economy through land rights, training in business skills, and enabling collective action are examples of initiatives that would improve the levels of inequality [
29,
36].
The environment for conducting business is not particularly attractive, with 5 Sahel countries ranked in the bottom 40 of the World Bank’s 2019 “Ease of doing business” index. Senegal (rank 123) and Niger (rank 132) are the best performers of the seven countries [
35]. The Sahel is the region in Africa that receives the highest levels of development assistance relative to the size of the economy (7% of GDP), and diaspora remittances are also high (6% of GDP) [
29]. However, the level of FDI is low, at less than 4% of GDP [
29]. Governments could increase tax revenues by reducing tax incentives for FDI and increasing taxes on extraction industries [
34].
Other policy areas that need to be addressed include tax policy, education and social services, agricultural policy, climate change resilience, and inclusive governance [
34].
The Sahel clearly needs continued support from the international community, although, currently, it is not clear how donors can support the work of organizations at the local, regional, and national levels [
36]. Nevertheless, it is to be welcomed that “the overarching goal of the UN Support Plan for the Sahel is to scale up efforts to accelerate shared prosperity and lasting peace in the Sahel countries and the region at-large by implementing priorities to achieve the 2030 Agenda for sustainable development….” [
38].
It is beyond doubt that the lack of stability in the region should make the European Union, especially, more motivated to have a much greater involvement in the processes taking place in the countries of the African Sahel. The instability in the region might result in many unpredictable consequences not only for Sahelian citizens but also might produce different political and social problems in Europe. Along with the subsequent coups in different countries (Mali, 2020 and 2021; Chad, 2021; Burkina Faso, 2022; Niger, 2023), the European Parliament has introduced a number of resolutions concerning security and development in the region. On 13 September 2023, the European Commission President—Ursula von der Leyen—declared the European Union does not tend to step back from the field but will rethink its active involvement in the region, and in Africa as whole. It seems that the most urgent recommendations for European policy makers concerning Sahel should consider strengthening such areas as mutual responsibility; state institutions and basic services in all areas; trust between governments, which include the European Union and populations; the eradication of terrorism and illegal armed groups; the reduction of cross-border trafficking and organized crimes; and security reform insurance, with obvious support from the European Union mission in the region.


