Article

Nutrient Variability Mapping and Demarcating Management Zones by Employing Fuzzy Clustering in Southern Coastal Region of Tamil Nadu, India

by
Arunkumar Venugopal
1,*,
Balaji Kannan
2,
Patil Santosh Ganapati
2,
Ananthi Krishnan
1,
Kaniyaiah Manikandan
3,
Vijayakumar Mathiyazhagan
4 and
Somasundaram Jayaraman
5
1
Department of Soil Science and Agricultural Chemistry, Agricultural College and Research Institute, Tiruvannamalai 606753, India
2
Agricultural Engineering College and Research Institute, Tamil Nadu Agricultural University, Coimbatore 641003, India
3
Tamil Nadu Rice Research Institute, Aduthurai 612101, India
4
Agricultural College and Research Institute, Kudumiyanmalai 622104, India
5
ICAR-Indian Institute of Soil and Water Conservation, Research Centre, Fernhill, Udhagamandalam 643004, India
*
Author to whom correspondence should be addressed.
Sustainability 2024, 16(5), 2095; https://doi.org/10.3390/su16052095
Submission received: 25 November 2023 / Revised: 17 February 2024 / Accepted: 26 February 2024 / Published: 2 March 2024

Abstract

:
Precise nutrient management for enhancing crop yield is possible through delineating soil management zones. Generally, the fertilizer recommendations followed use a blanket application for a larger area without considering the soil spatial variability. This may lead to low fertilizer application in pockets of less nutrient content and vice versa. Therefore, this study aims to develop soil management zones (MZs) adopting geostatistical and fuzzy clustering techniques in the Alwarthirunagiri block of the Thoothukudi district in Southern India. One hundred and seventy-one surface samples were collected from a study area of 2760 ha. The collected soils were processed and characterized by available macronutrients and micronutrients. The coefficient of variation of the soils varied from low (9.72%) to high (74.60%). Ordinary kriging and semivariogram analysis showed wide variation in the soil characteristics within the study site, with a spatial dependence ranging from moderate to strong. Four management zones were demarcated based on fuzzy performance index and normalized classification entropy using PCA and fuzzy K-means clustering. The study results indicated that the soil properties differed significantly under different management zones and provided potential site-specific fertilizer management options. The management zone map could be useful to the farmers to adopt precise management of nutrients for different zones.

1. Introduction

Declining soil organic carbon, inappropriate, imbalanced fertilizer application and intensive cropping patterns without replenishing soil nutrients has led to soil degradation and environmental contamination in various agroecosystems, which has led to a negative impact on humans, animals and aquatic ecosystem [1]. It has also led to diminishing soil fertility and crop productivity loss across the entire Indian geography [2]. The soils thus exhibit multi-nutrient deficiencies [3]. Being fertile alluvial land with sufficient moisture availability under a tropical climate, extensive cultivation of a more intensive nature is common in the Tamirabarani River basin of Southern India where the study area is located. Intensive cultivation without appropriate management as per site condition leads to soil fertility imbalance and deficiency of nutrients which, in turn, causes crop yield decline. Therefore, understanding the state of the soil is vital for sustainable agricultural production. Soil nutrient variability is one of the prime factors affecting crop growth and yield of crop. Soil surveys facilitate implementing appropriate management practices by providing holistic information on soil characteristics. Soil-specific management practices enhance land productivity and sustain environmental health.
Soil nutrient status is highly variable due to topography, soil type, vegetation, climate and different cultivation practices. Neglecting this variation, fertilizer is often applied in a blanket application that may lead to excessive or insufficient input application. Excess fertilizer application should be avoided to improve the crop yield with a less detrimental environmental impact. Hence, to manage the spatial variability, fertilizer dosage for a desired targeted yield has to be calibrated [4,5]. Therefore, facts about the distribution of nutrients are essential for efficient nutrient management and to achieve sustainable crop production [6,7]. An efficient technique for proper understanding of the variations in soil properties assigned within fields for designating homogeneous management zones should be established [8]. Delineating management zones with homogenous soil properties is the most identified technique for precise soil fertility management. However, to demarcate homogenous soil zones, assessment of the inherent soil nutrient status of an area is vital, as this aids sustainable management of crops. Several researchers utilized soil nutrient data to identify management zones [9,10,11,12].
Numerous techniques and tools were employed to define the management zones. Typically, low-cost sensing data—such as electrical conductivity data [13] and remotely sensed data [14]—and digital elevation models [15,16], topographical and soil maps [17], crop yield [18,19], nutrient index methods [20] and geostatistics-based nutrient management zone methodology [21] were used conventionally for demarcating management zones for appropriate management. These methods help to identify critical nutrients that limit crop productivity [22]. To divide a land into potential zones for crop management, Speranza et al. [23] employed yield data, whereas Shukla and Sharma [24] used fuzzy clustering of soil parameters.
Principal component analysis (PCA) minimizes the data redundancy and aids in grouping data through clustering process [25,26]. Amongst other approaches, fuzzy clustering was utilized by several researchers to identify alike management zones [27,28,29]. These are the two major steps involved in demarcating soil management zones.
However, information on the soil characteristics variation in Southern India is still limited. At present, the majority of the farmers adopt general fertilizer recommendations, which could cause soil degradation due to excessive or insufficient input application. The present study divided the field into zones in which the soil properties had very low variability. Thus, this research work was executed (i) to assess the soil nutrient status of the Alwarthirunagiri block of the Thoothukudi district of Tamil Nadu, India, by utilizing geostatistics and (ii) to determine the possible management zones according to nutrient availability by utilizing fuzzy clustering for site-specific management.

2. Material and Methods
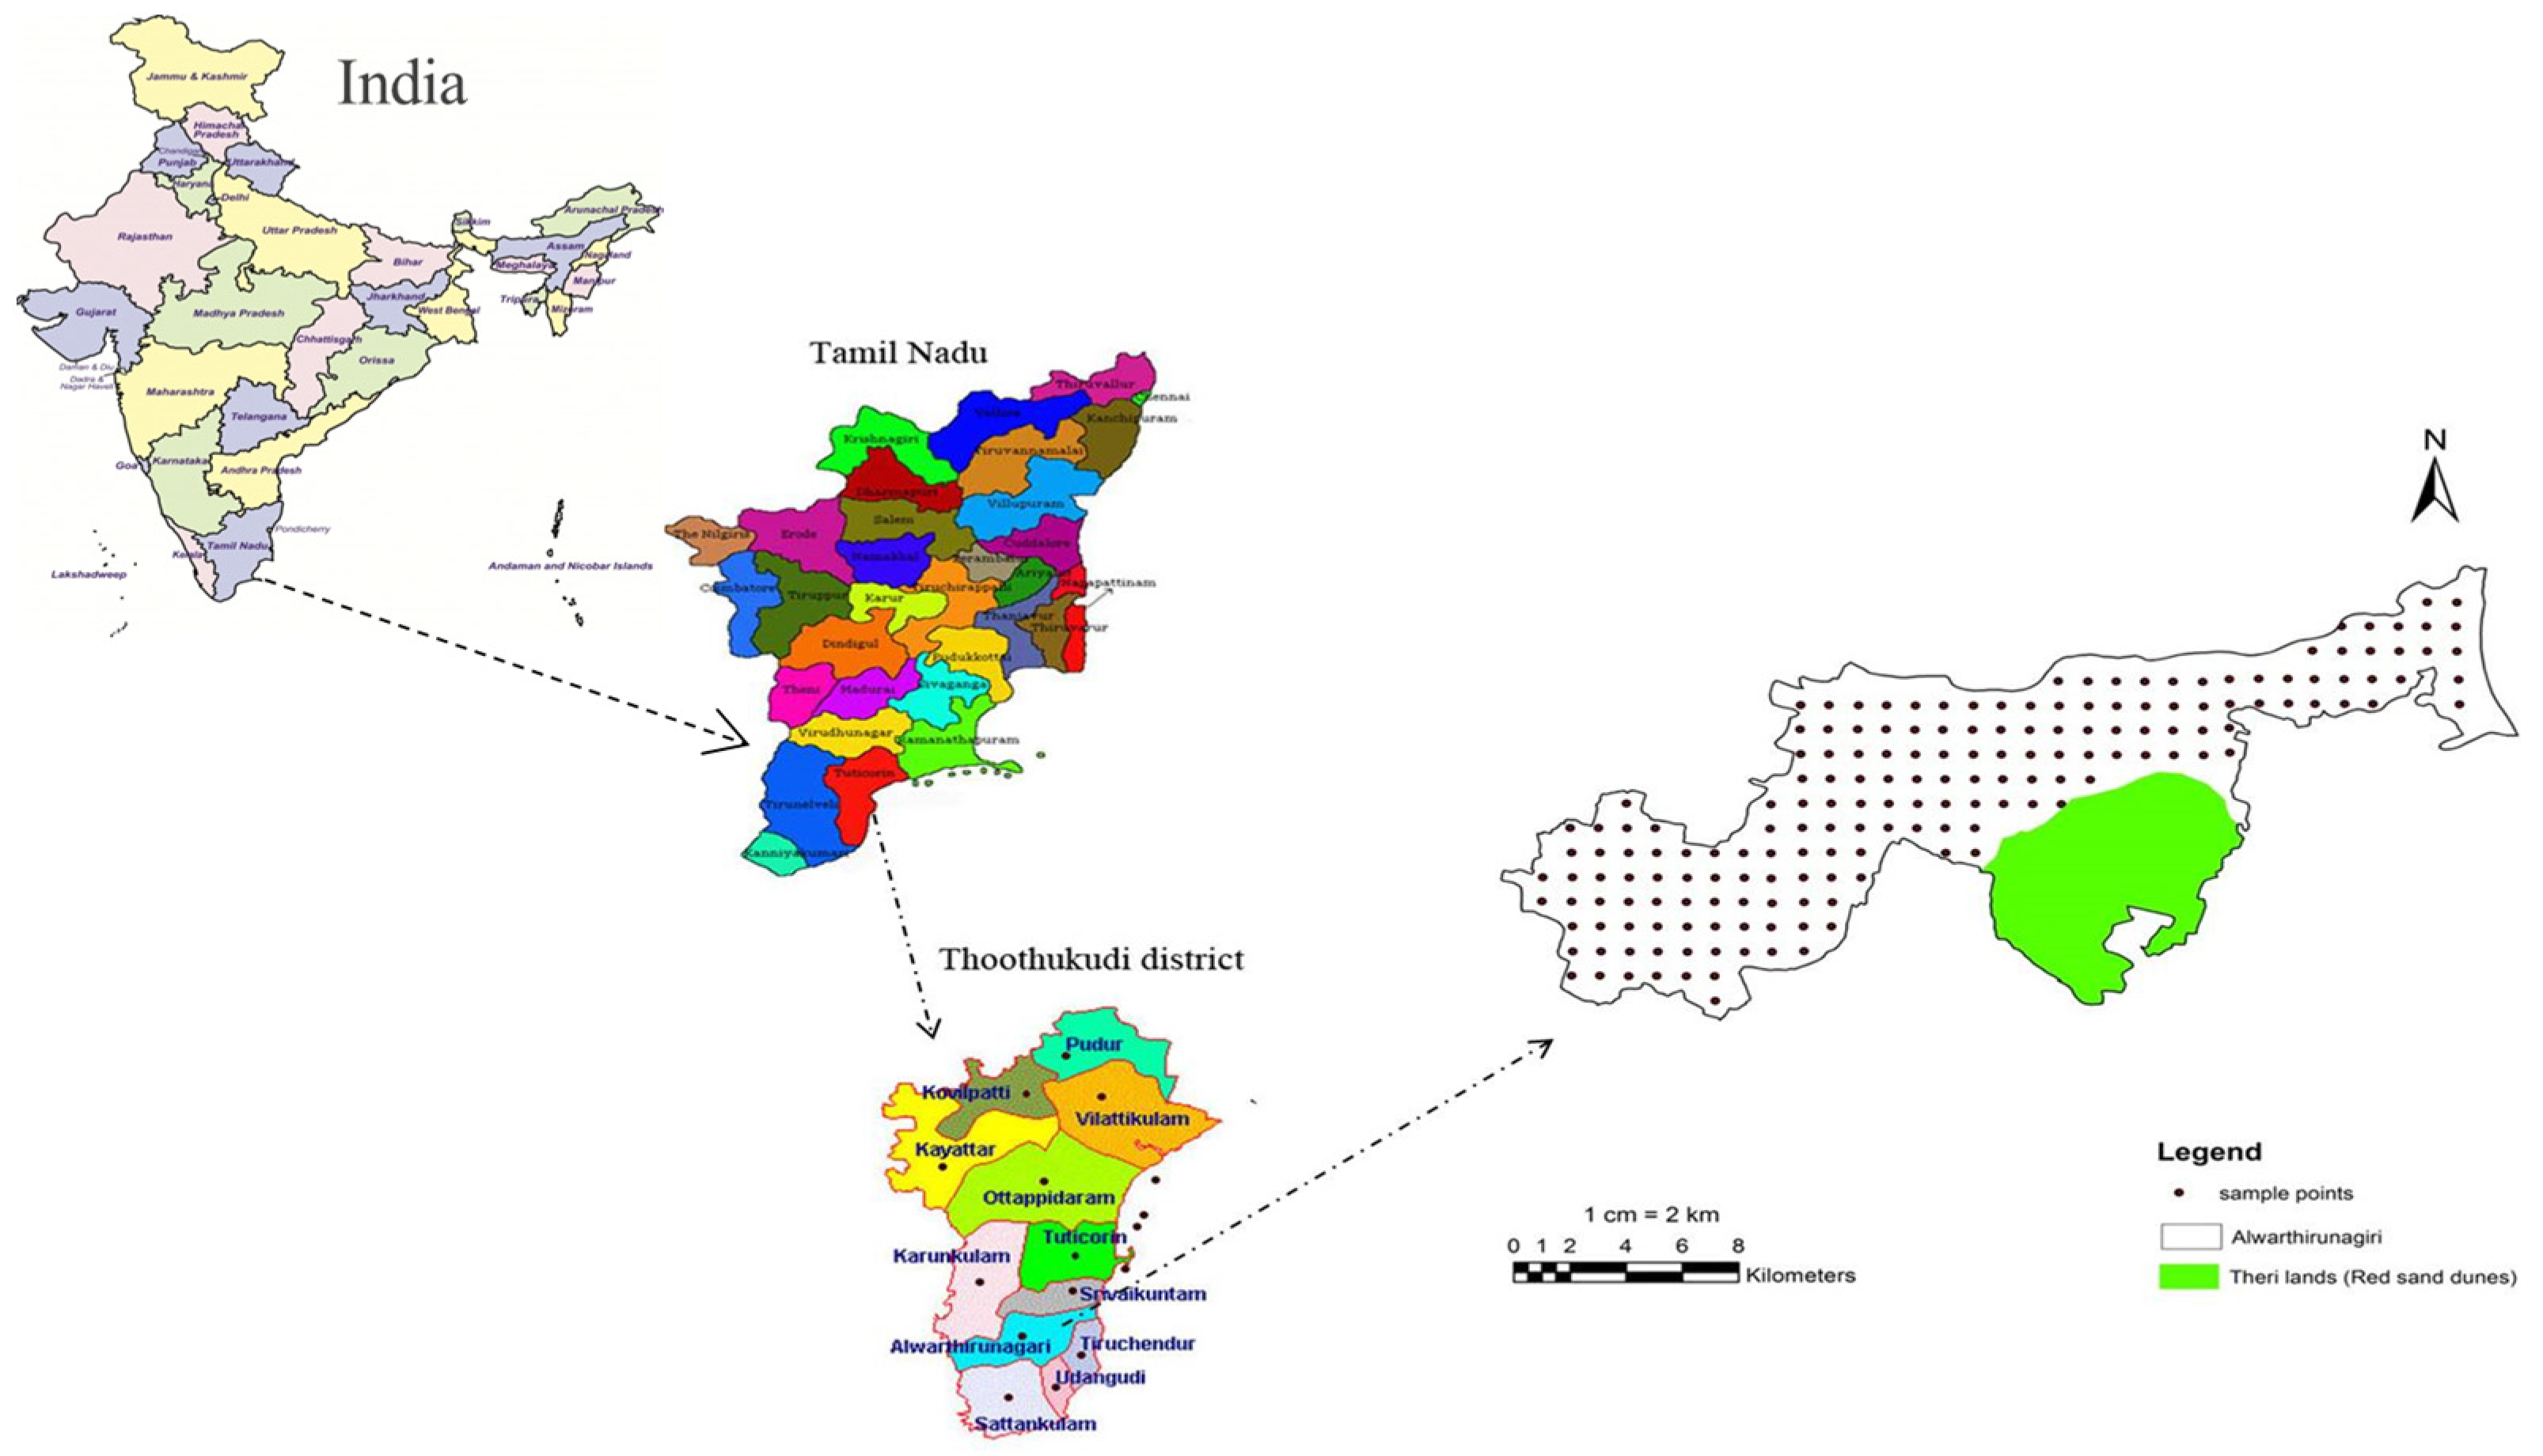
2.1. Study Sites

Study region is spread around the 30 village panchayats falling under Alwarthirunagari block, Thoothukudi district of Tamil Nadu (Figure 1). The extent of study site ranges between 8°24′ to 8°39′ N and 77°48′ to 78°07′ E. The total geographical area is 2760 ha. The climate of the study area is humid and receives an annual rainfall of 700 mm, mostly during the monsoon period (October to December). The physiography of the study area falls under flat alluvial plain. The soil consists of coastal sands and alluvium derived from the black soil of the quaternary period [30] and some forest areas covered by Theri lands, red sand dunes locally known as ‘Theri’. Major soil orders of the study area are Entisols, Inceptisols and Vertisols, and the soil texture varies from coarse loamy to clayey. Agriculture is the predominant land use, mainly with a rice–rice cropping pattern. The banana crop is also common in this area.

2.2. Sampling and Characterization of Soils

The grid sampling, with a grid size of 1 km, was used to collect the soil samples [27,31] from the study site, considering uniform underlying geology and lesser soil variability. The soils in the Theri sand complex are red sand dunes and are uniform where cashew trees are cultivated (Figure 1). A total of 171 geocoded soil samples were collected at 0–15 cm depth during the summer season of May 2022 and before planting of the paddy crops. The collected samples were dried naturally under the shade, sieved (2 mm size) and then characterized by soil fertility status (available macro- and micronutrients) in addition to soil reaction and electrical conductivity.
Soil reaction and electrical conductivity were determined from the suspension prepared from soil and water in the ratio of 1:2 through pH and conductivity meters [32]. Soil-available nitrogen, phosphorous, potassium and organic carbon were quantified by adopting standard procedures, viz., Walkley and Black method [33], alkaline KMnO4method [34], Olsen method [35] and NH4OAC method [36]. DTPA extractant was used for extracting soil-available micronutrients [37] and was analysed using atomic absorption spectrophotometer (Varian Spectr AA 55B).

2.3. Statistical Procedures

By adopting SPSS 19 software, statistical variables, viz., standard deviation, coefficient of variation, mean, skewness and kurtosis, were computed. The relationship between different soil properties was envisaged utilizing Pearson’s correlation coefficient [38].

2.4. Geostatistical Analysis

Geostatistical study of soil properties was carried out using ArcGIS 9.1 software for semivariogram modelling and for attaining a suitable semivariogram model. Logarithm transformation was applied to skewed soil properties to determine normally distributed data before geostatistical study. Data was interpreted after back transformation of soil data. Spherical and exponential variogram models were exploited to the empirical semi-variance. The residual sum of squares and coefficient of determination were used to choose semivariogram models. The fitted models were utilized to estimate various attributes of non-sampled locations through interpolation of data for mapping using ordinary kriging technique [39]. Results obtained were validated to assess the bias and kriging accuracy. A spatial domain’s measured points are individually removed, and kriging estimates are made as if they are present [40]. In this approach, the estimated and real values for each sample location can be compared.

2.5. Principal Component Analysis

PCA reduces voluminous information without losing necessary information that uses correlated attributes to identify the best linear combination of the characteristics. Data on soil characteristics were inputted for PCA. Large number of principal components (PC) variables were extracted in this study. Principal components (PC) with eigen values (>1) would serve as the best representation of the field’s characteristics [40] and explain the maximum variability; these were utilized for constructing ideal management zones for precise nutrient management.

2.6. Fuzzy Clustering Algorithm

Experimental site was grouped into different management regions by utilizing fuzzy c-mean values. In general, fuzzy clustering decreases variability within a group and vice versa. A sample with various characteristics in fuzzy clustering may belong to multiple groups simultaneously when assigning membership to them, which might lessen the impact of outliers on the sample’s overall results. Using the R programming language, the field was divided into 2–7 cluster groups by means of applying unsupervised continuous classification methodology i.e., fuzzy c-mean [41]. In this analysis, 7 clusters were identified to be the most practicable management zones following the procedure outlined by [42]. A repetitive grouping process was used to identify membership in each cluster, for which random cluster mean was used for starting this process. The closest of these means was chosen for each observation. For every cluster, new means were produced as per the difference between the observation and the cluster mean. The Euclidean distance was used to compute the difference between data points and cluster centre points.
The normalised classification entropy (NCE) and the fuzzy performance index (FPI) [43,44] were employed to calculate the optimal cluster number [45], as detailed below:
FPI = 1 C C 1 1 i = 1 c k = 1 n ( μ i k ) 2 n
NCE = 1 n n C 1 k = 1 n i = 1 c μ i k log a ( μ i k ) n
where C is the number of clusters, and n is the number of observations, and μik is the fuzzy membership. The extent of fuzziness caused by a specific is determined by the FPI, which ranged between 0 and 1. Values near 0 indicated differing classes, i.e., least relationship with other clusters, whereas value 1 suggested that members within this cluster had high relationships with each other. NCE determines the level of disarray brought about by a given number of classes. Optimal cluster number arrived when the index value was low for each computed index (FPI) and most organisation (NCE) due to clustering [46]. The variance analysis was used to show how various MZs differed from one another.

3. Results

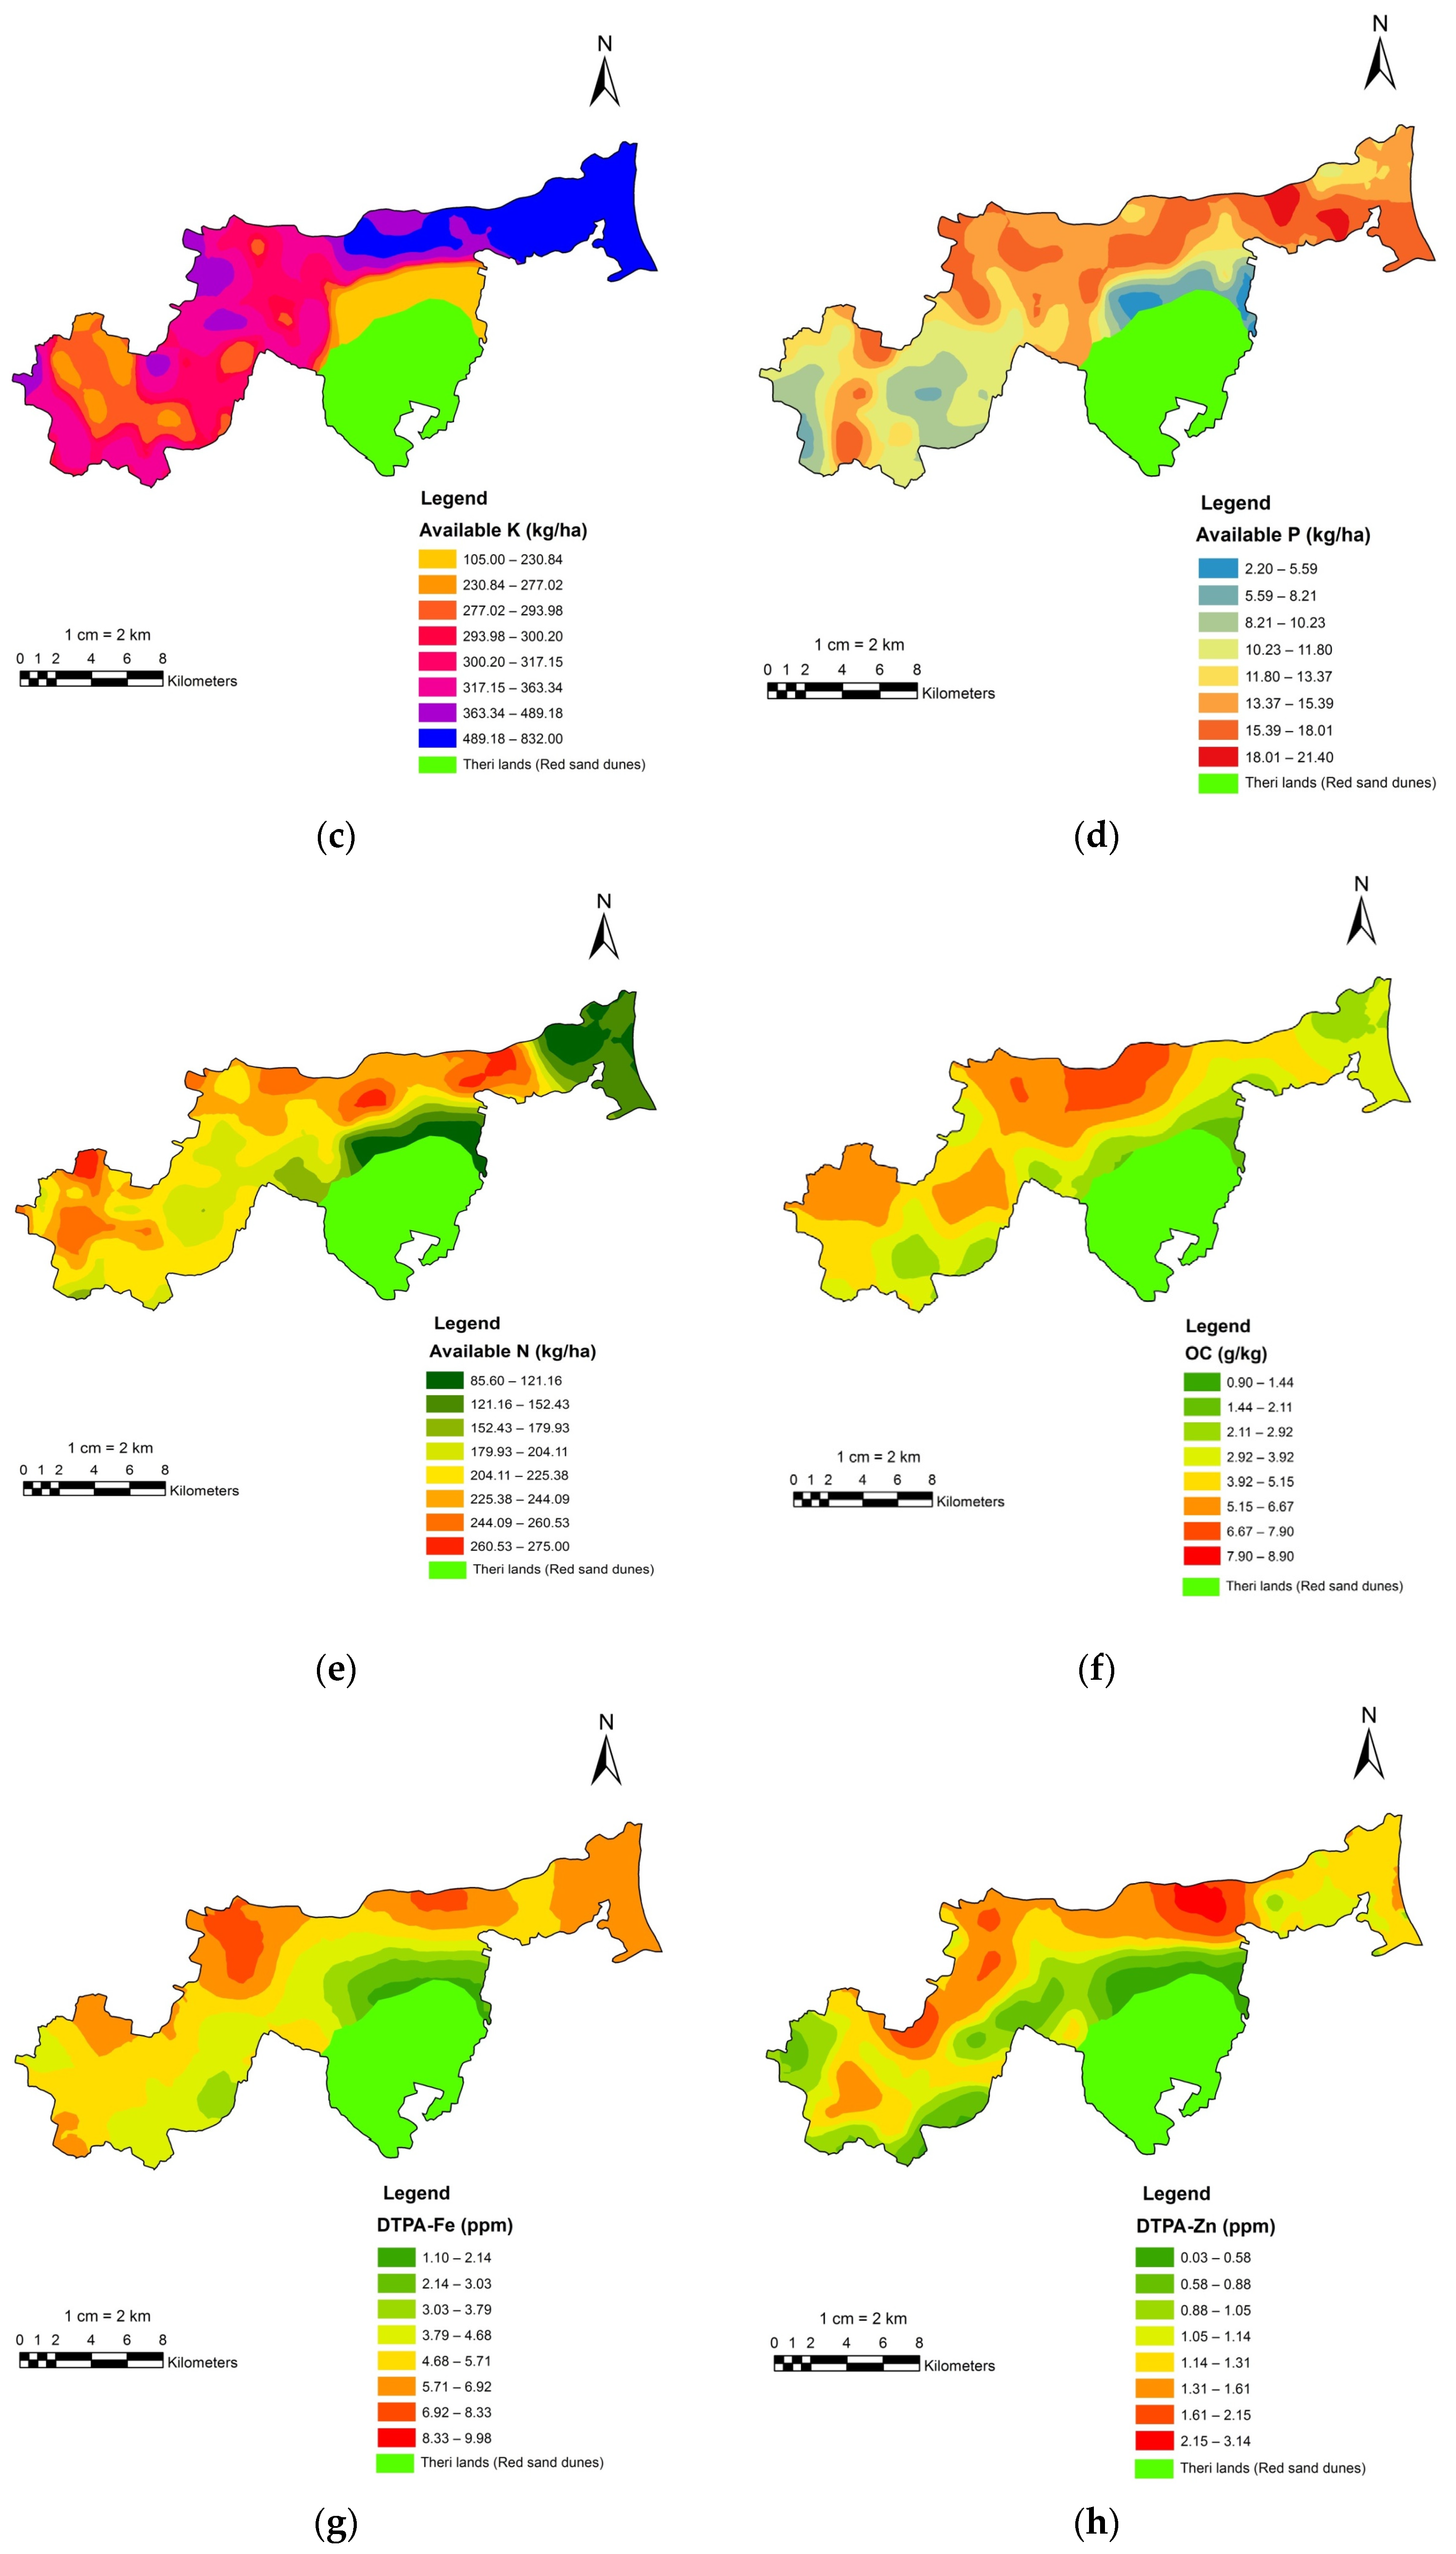
3.1. Soil Characteristics Variation

The soil reactions varied between mildly acidic (6.2) and alkaline (8.9) (Table 1). The soil EC (1:2.5) exhibited considerable variation, with a very high coefficient of variation (74.60%). The available K content ranged from 105 kg ha−1 to 832 kg ha−1, with a moderate CV (41.40%). The mean p value was 12.8 kg ha−1 (ranging from 2.2 to 21.4 kg ha−1) falls under the low to medium category. The mean available nitrogen was 210 kg ha−1. The mean SOC content (ranging from 0.09 to 0.9%) was 0.45%.

3.2. Association between Soil Characteristics and Available Nutrients

Table 2 displays the extent of association among different soil parameters. With a few exceptions, practically all of the attributes had a substantial positive and negative correlation with one another. The correlation coefficient (−0.277) showed a negative relationship between pH and soil Mn. The P, N, Fe and Cu were positively correlated with SOC.
With the exception of K and Mn, all of the parameters were skewed slightly (skewness < 1), and their medians were near to their means (Table 1).

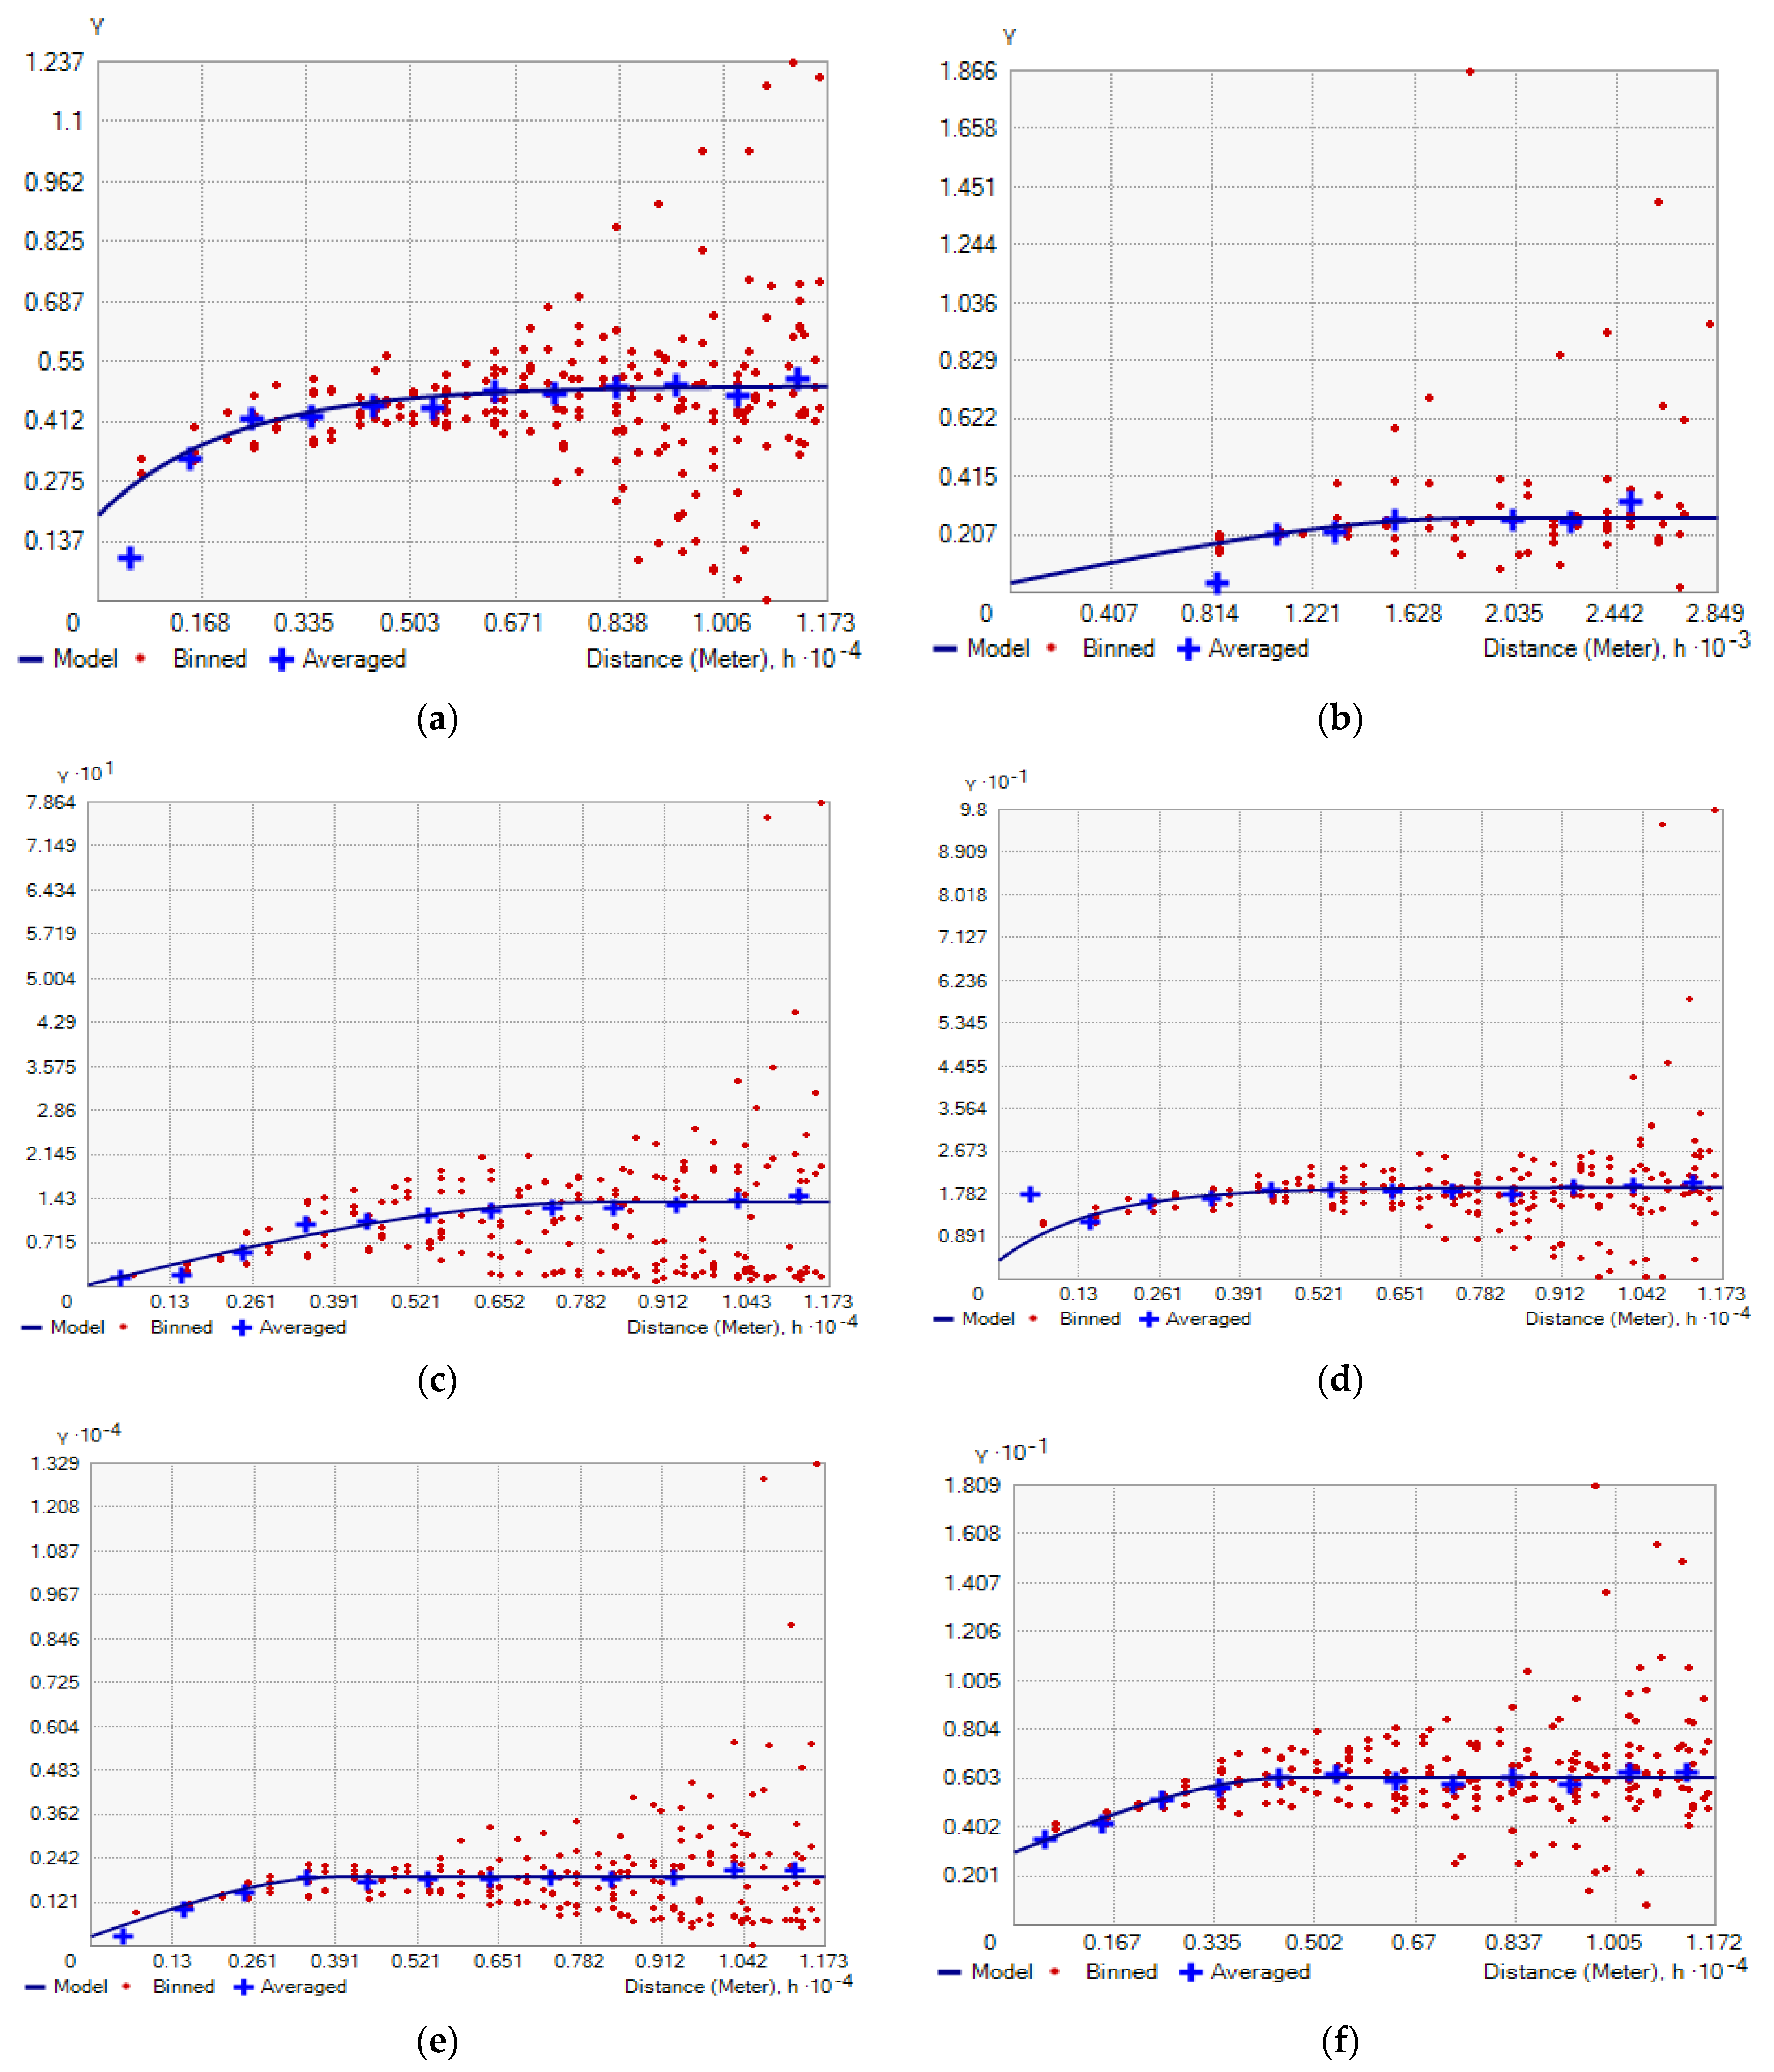
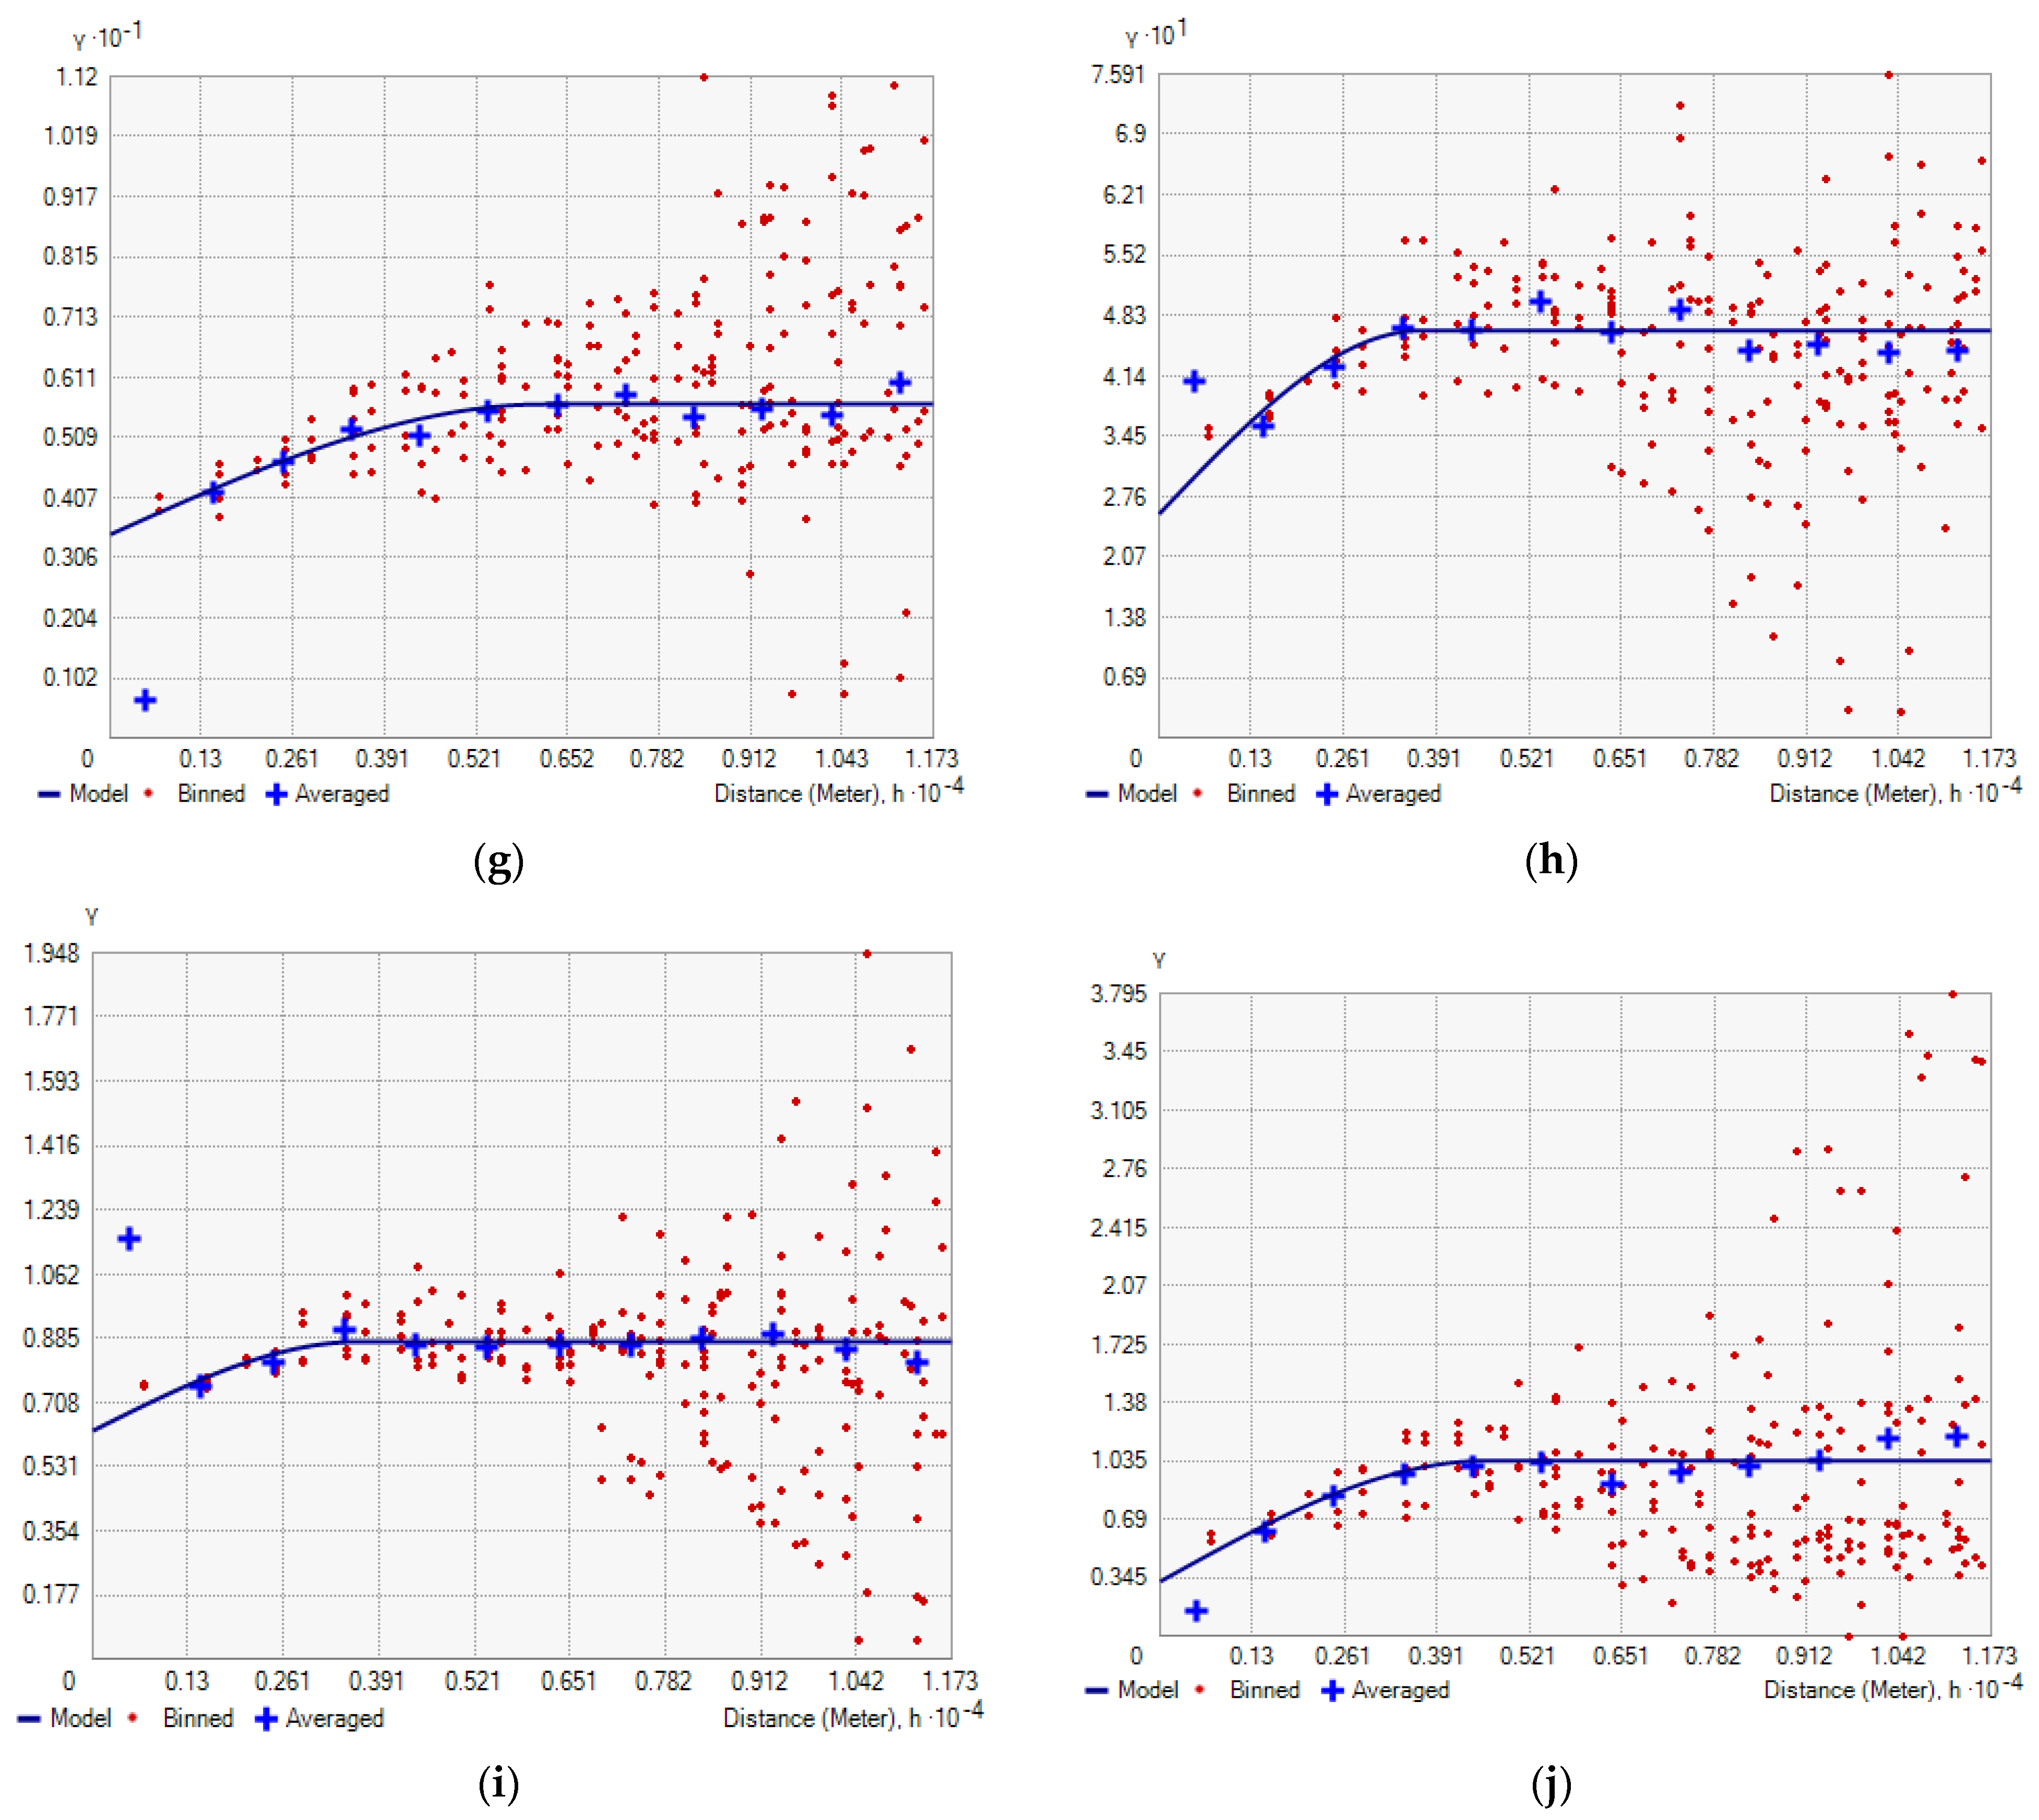
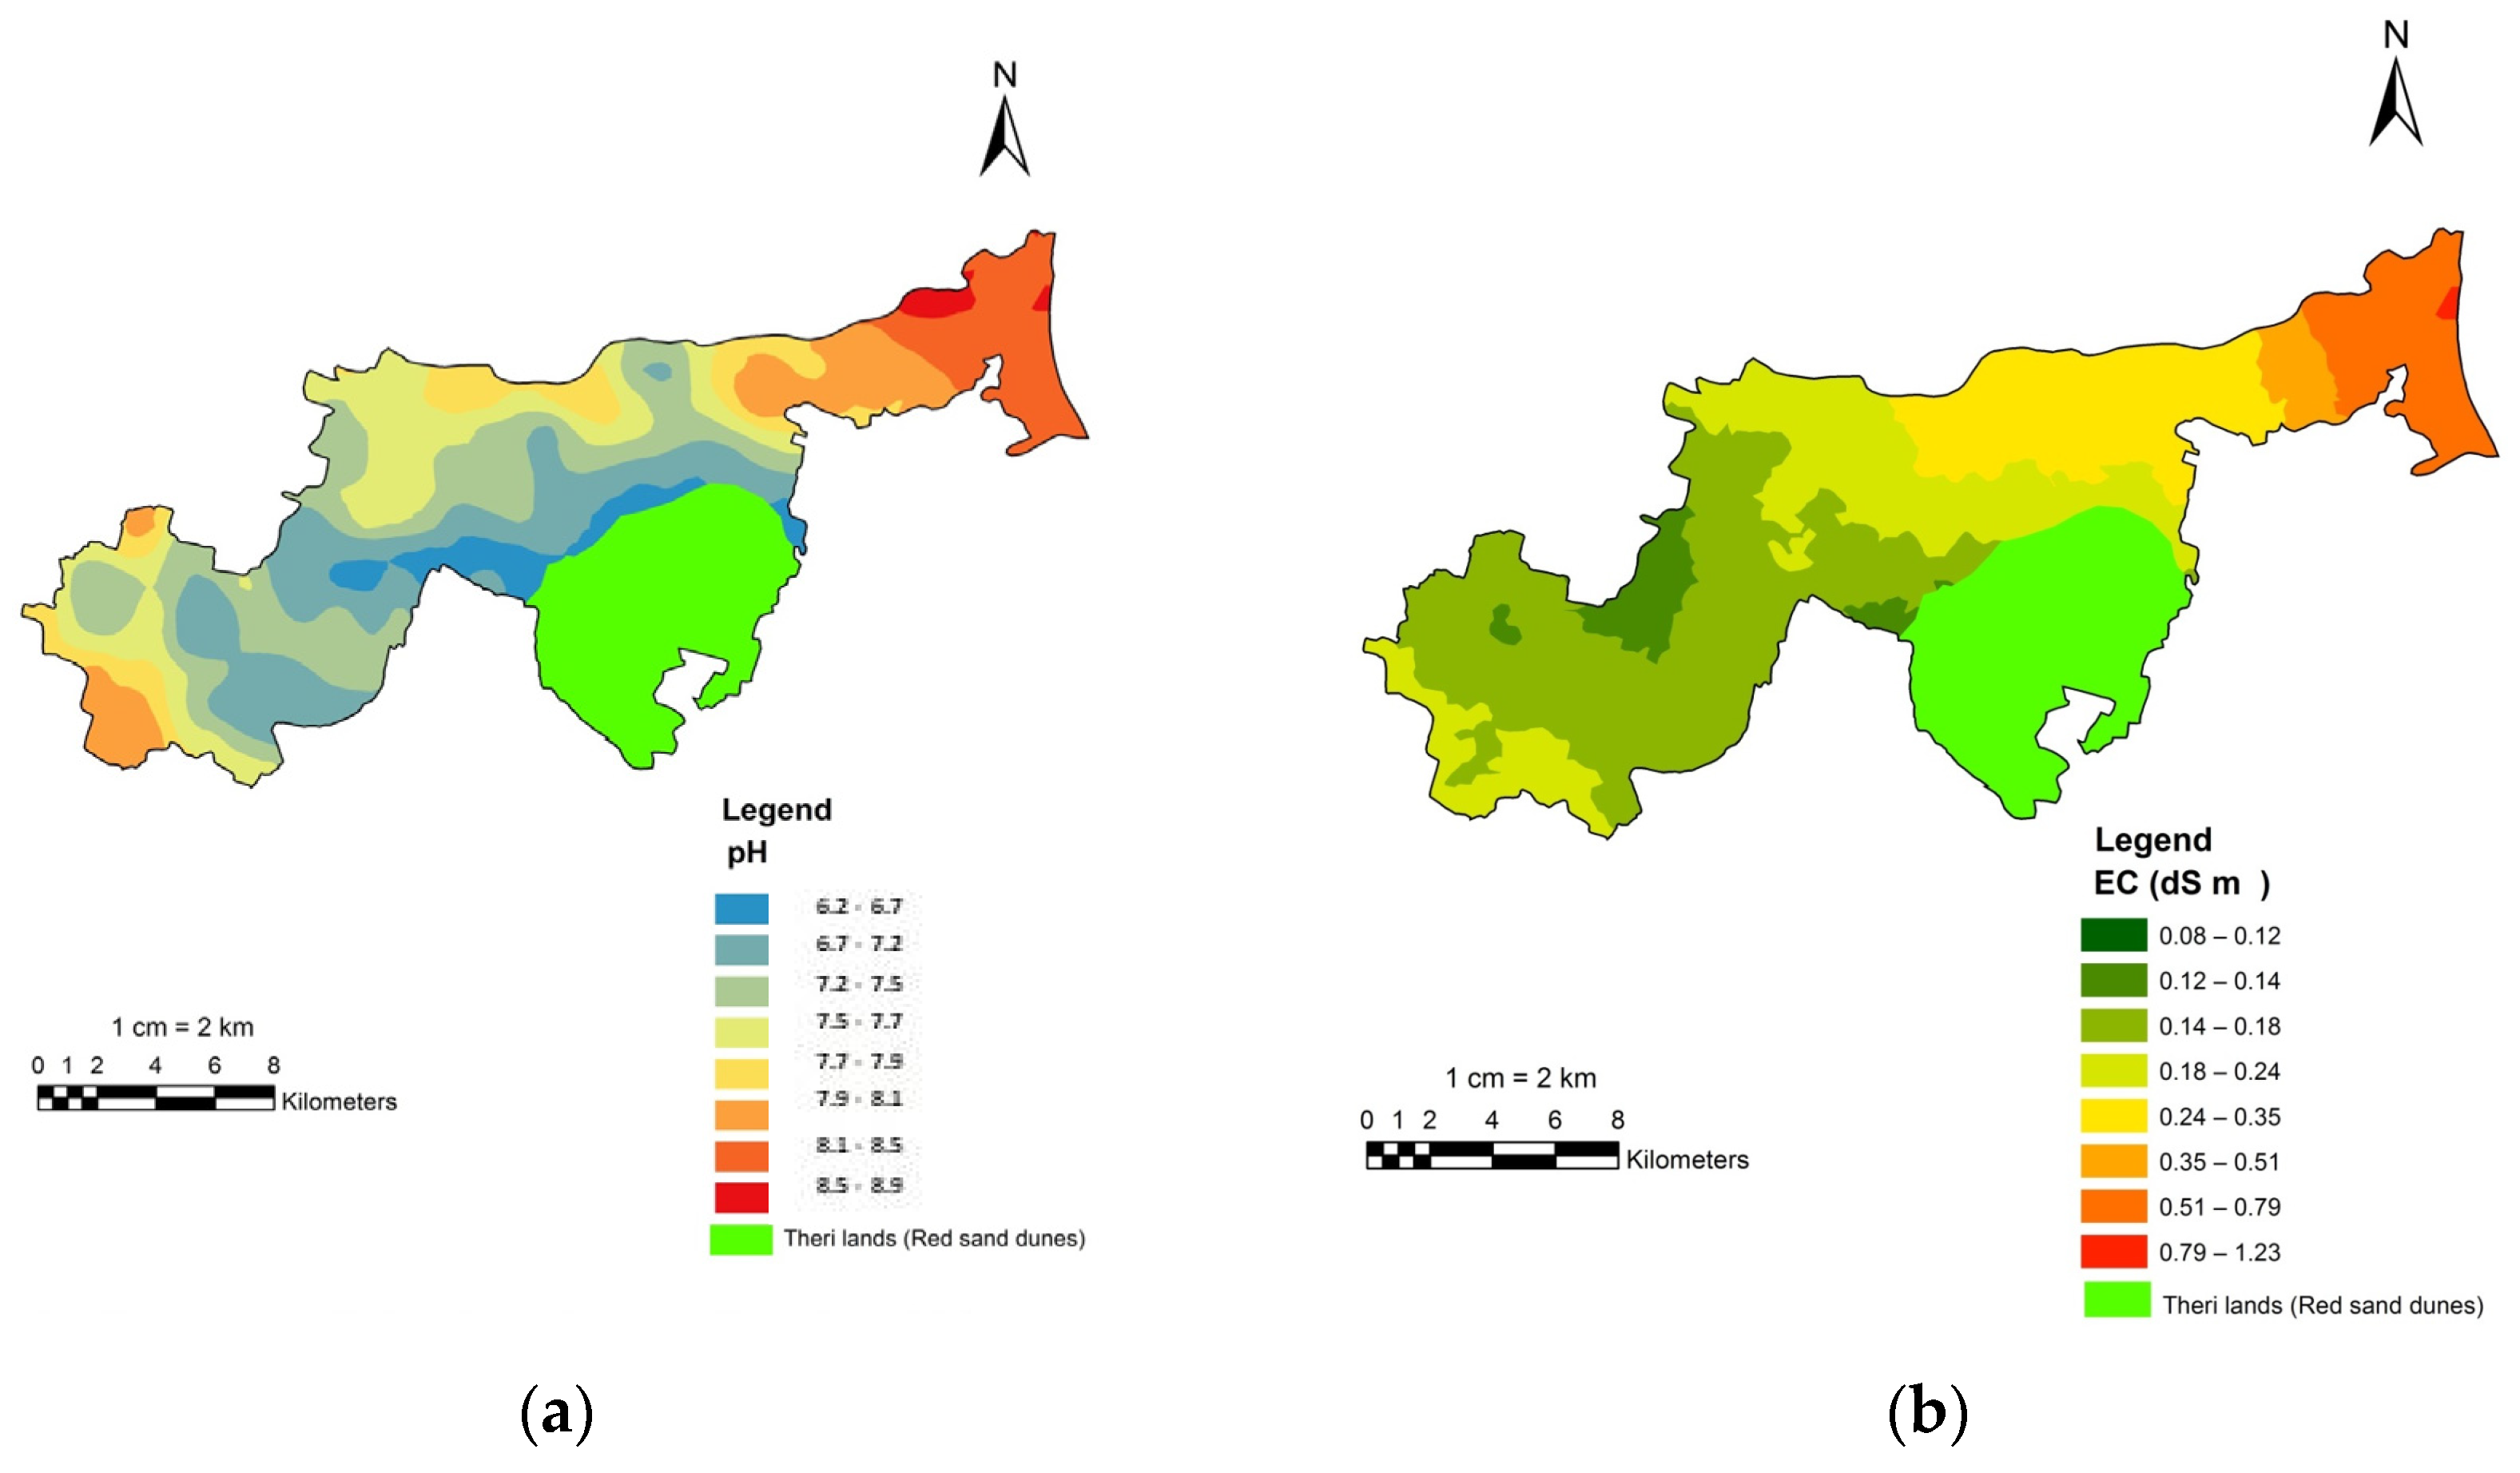
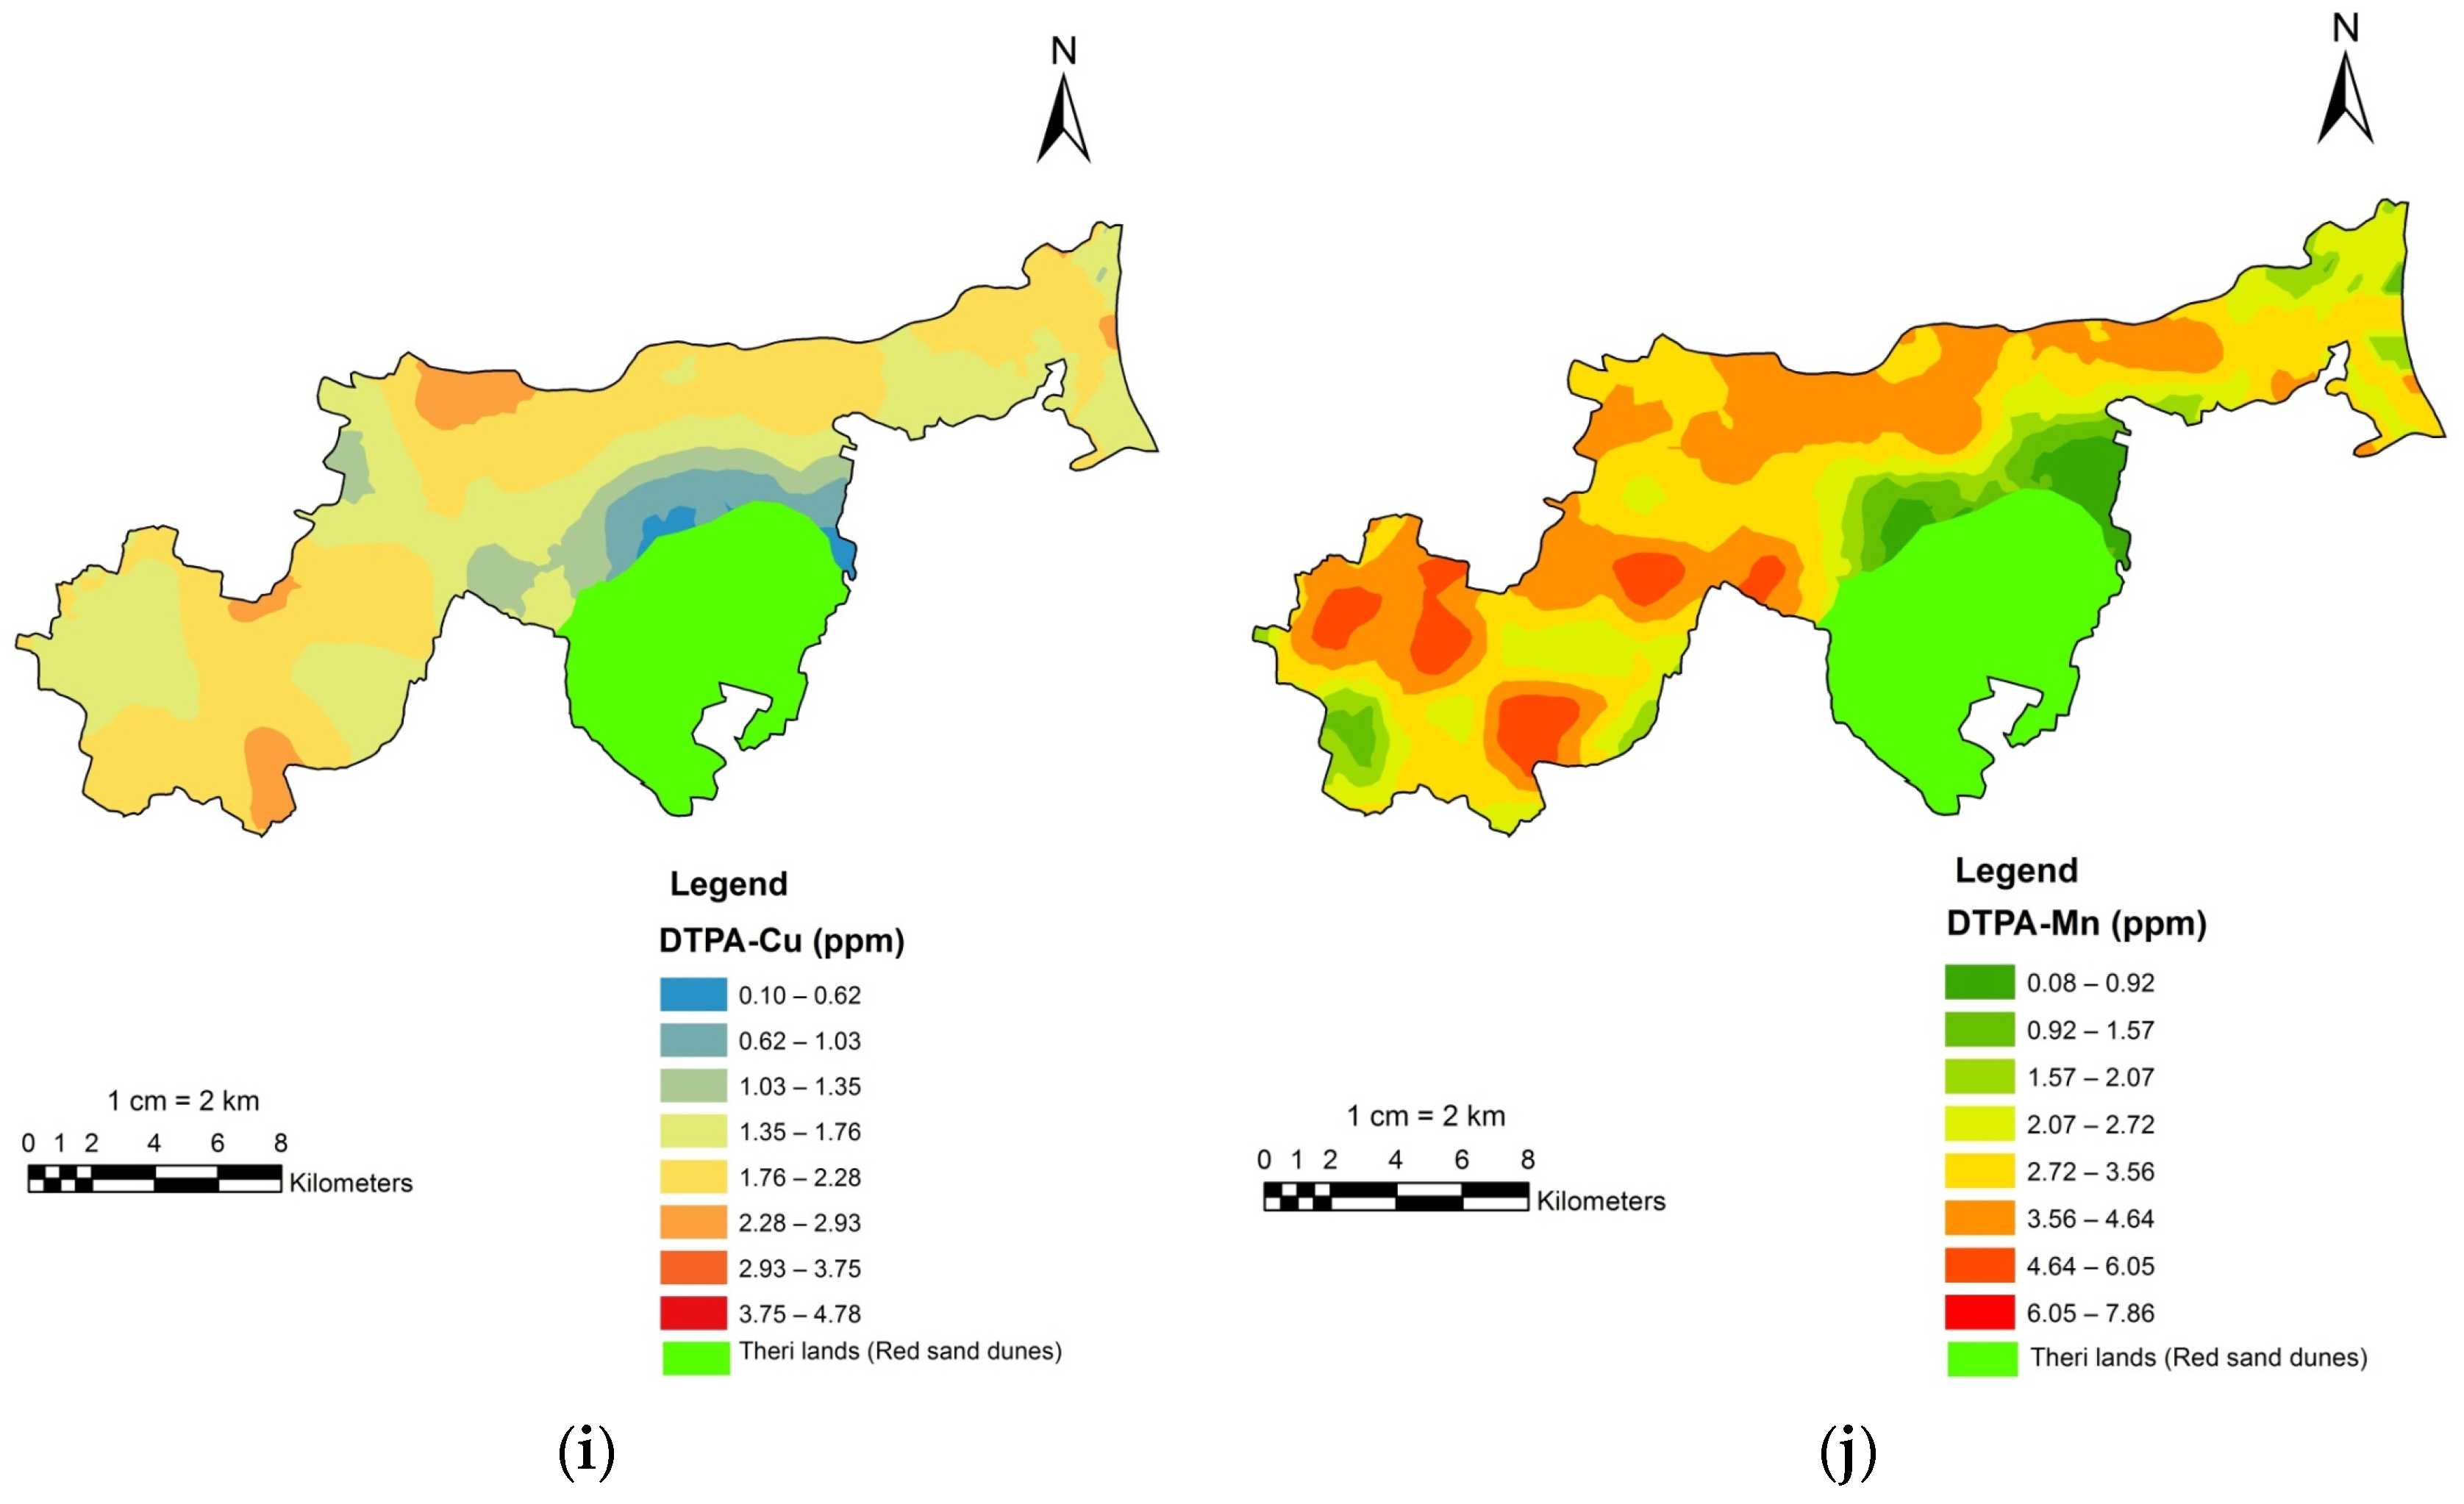
3.3. Spatial Nature of Soil Parameters

Semivariograms were computed, and the best models were determined for different soil properties, as shown in Figure 2. Table 3 exhibits the output of the semivariogram analysis. Spherical theoretical models showed the best fit for most soil attributes except for pH and available phosphorous where exponential models were fitted. The soil properties pH, EC, K, and Cu showed lower (<1.0) RMSE values, and other soil properties exhibited higher (>1.0) RMSE values.
For soil factors, the nugget/sill ratio was evaluated (Table 3). The geographical dependence of the soil characteristics is exemplified by the nugget/sill ratio [47]. A ratio of >75%, 25–75% and <25% indicates severe, moderate and light spatial dependency, respectively. Within the study site, electrical conductivity, K, P and N recorded sound spatial dependence, whereas pH, SOC, Fe, Zn, Cu and Mn recorded moderate spatial dependence.
The strong spatial correlation was exhibited by P (per cent nugget of 20 and range of 4634 m; exponential model), N (per cent nugget of 14% and range of 4050 m; spherical model), electrical conductivity (per cent nugget of 12% and range of 1911 m; spherical model) and K (per cent nugget of 2% and range of 8170 m; spherical model). The properties, viz., pH, SOC, Cu, Mn, Fe and Zn, had moderate per cent nugget (31–72%) with varied ranges (3461–6378 m) (Table 3).
Figure 3 displays maps showing the spatial distribution of the soil parameters. A heterogenous pattern was observed for different soil parameters. The available soil K was low surrounding the Theri land area and in the northwest of the study region. The low values of K were due to prolonged extensive rice farming without applying K fertilizer around the Theri soil area due to coarse-textured soils [48]. Soil P was low-to-medium and was low around the fringe of Theri lands and northwest of the block. The low soil-available nitrogen in the study site was due to continuous cropping with imbalanced fertilization and tropical climatic conditions. Soil N was very low in the eastern part of the block and along the Theri land area because of coarse-textured soil. The low content and varied distribution of SOC owed to the tropical weather and adopted land use, in addition to differing biological properties during the cultivation and decomposition of litter [49]. The distribution of available nitrogen, as shown in Figure 3e, was similar to the SOC distribution pattern shown in Figure 3f. The maps provided valuable details regarding the variation in nutrient content across the study.

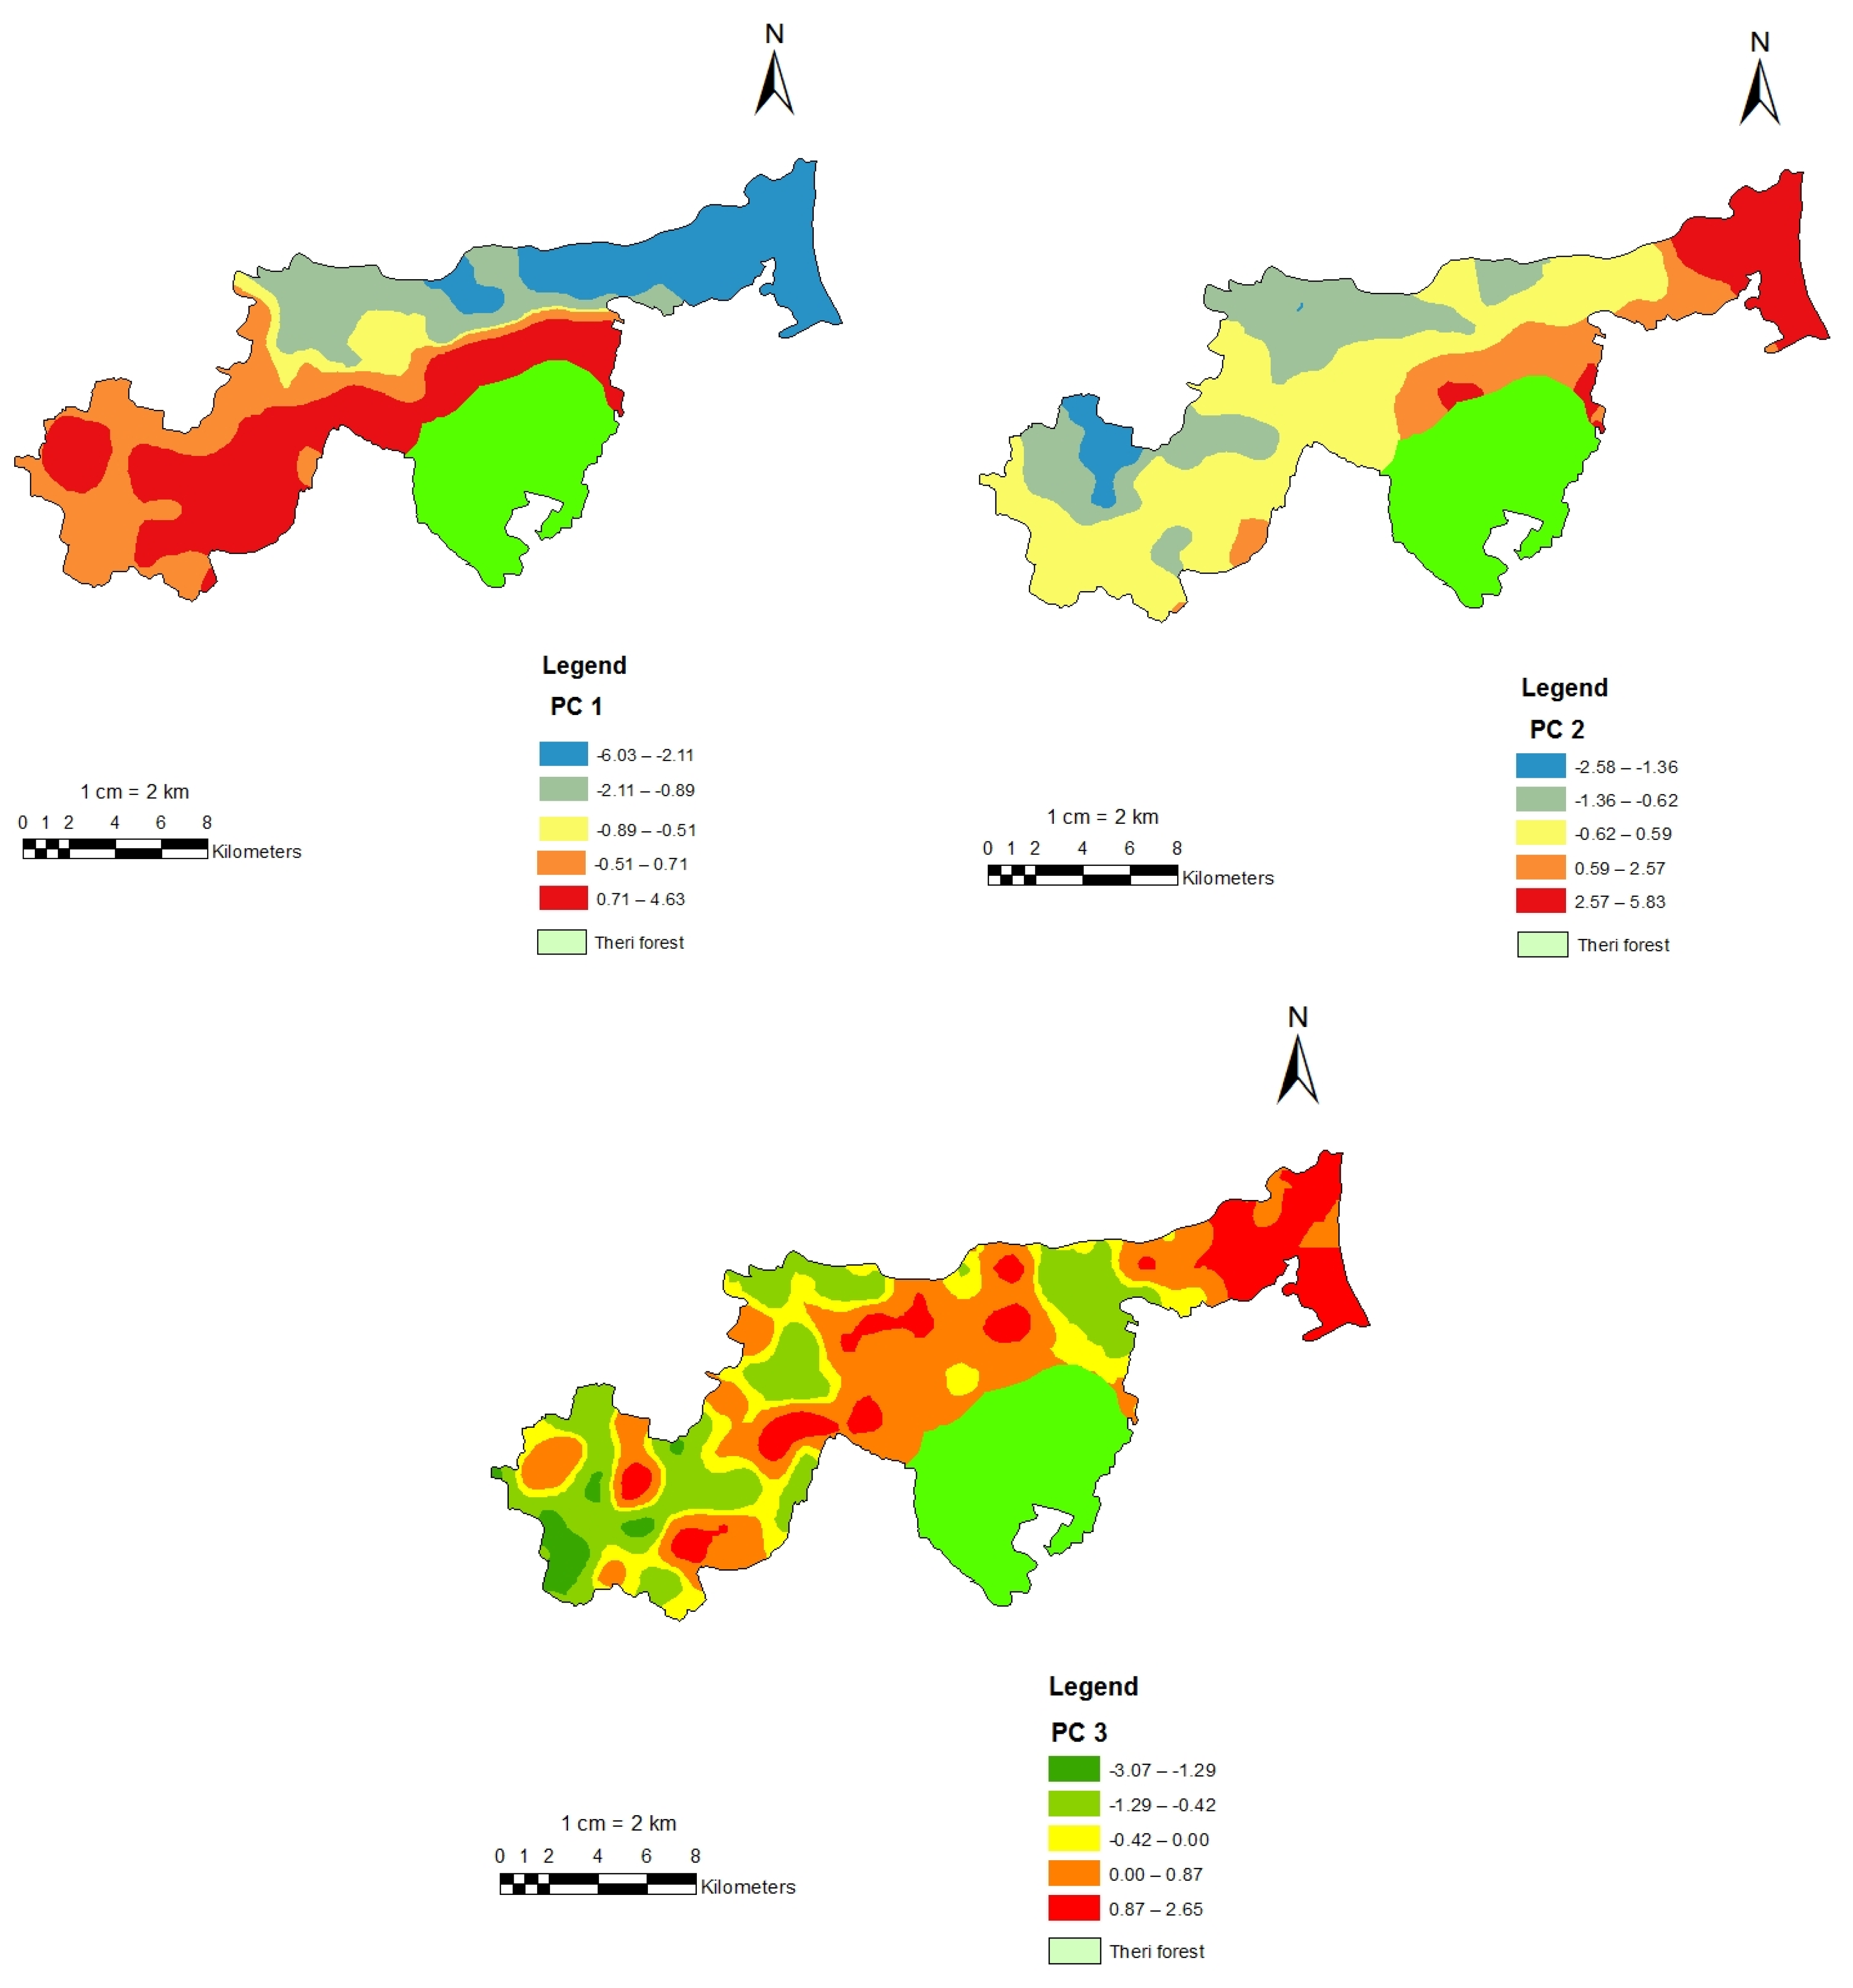
3.4. Principal Component Analysis

Significant correlations existed between most of the soil parameters. The variability in the soil parameters was compiled and summarised using PCA. Three principal components (with >1 eigen values) explaining 58.41 percent variability were considered for the final analysis. The variance exhibited by PC1, PC2 and PC3 were 29, 18.9 and 10.4%, respectively (Table 4).
The variables that had the biggest effects on PC1 were pH, P, K, Fe and Zn (Table 5). The contribution of SOC was more in PC2, whereas the Mn contribution was more in PC3. Consequently, the distribution map of pH and P was similar to the map of PC1 (Figure 4). The PC2 maps were identical for available N, as shown in Figure 3e, and SOC (Figure 3f). PC3 map was found to be similar to the map of Mn. Hence, the PCA aggregated ten variables into three PCs in order to account for the geographical variation of the soil parameters.

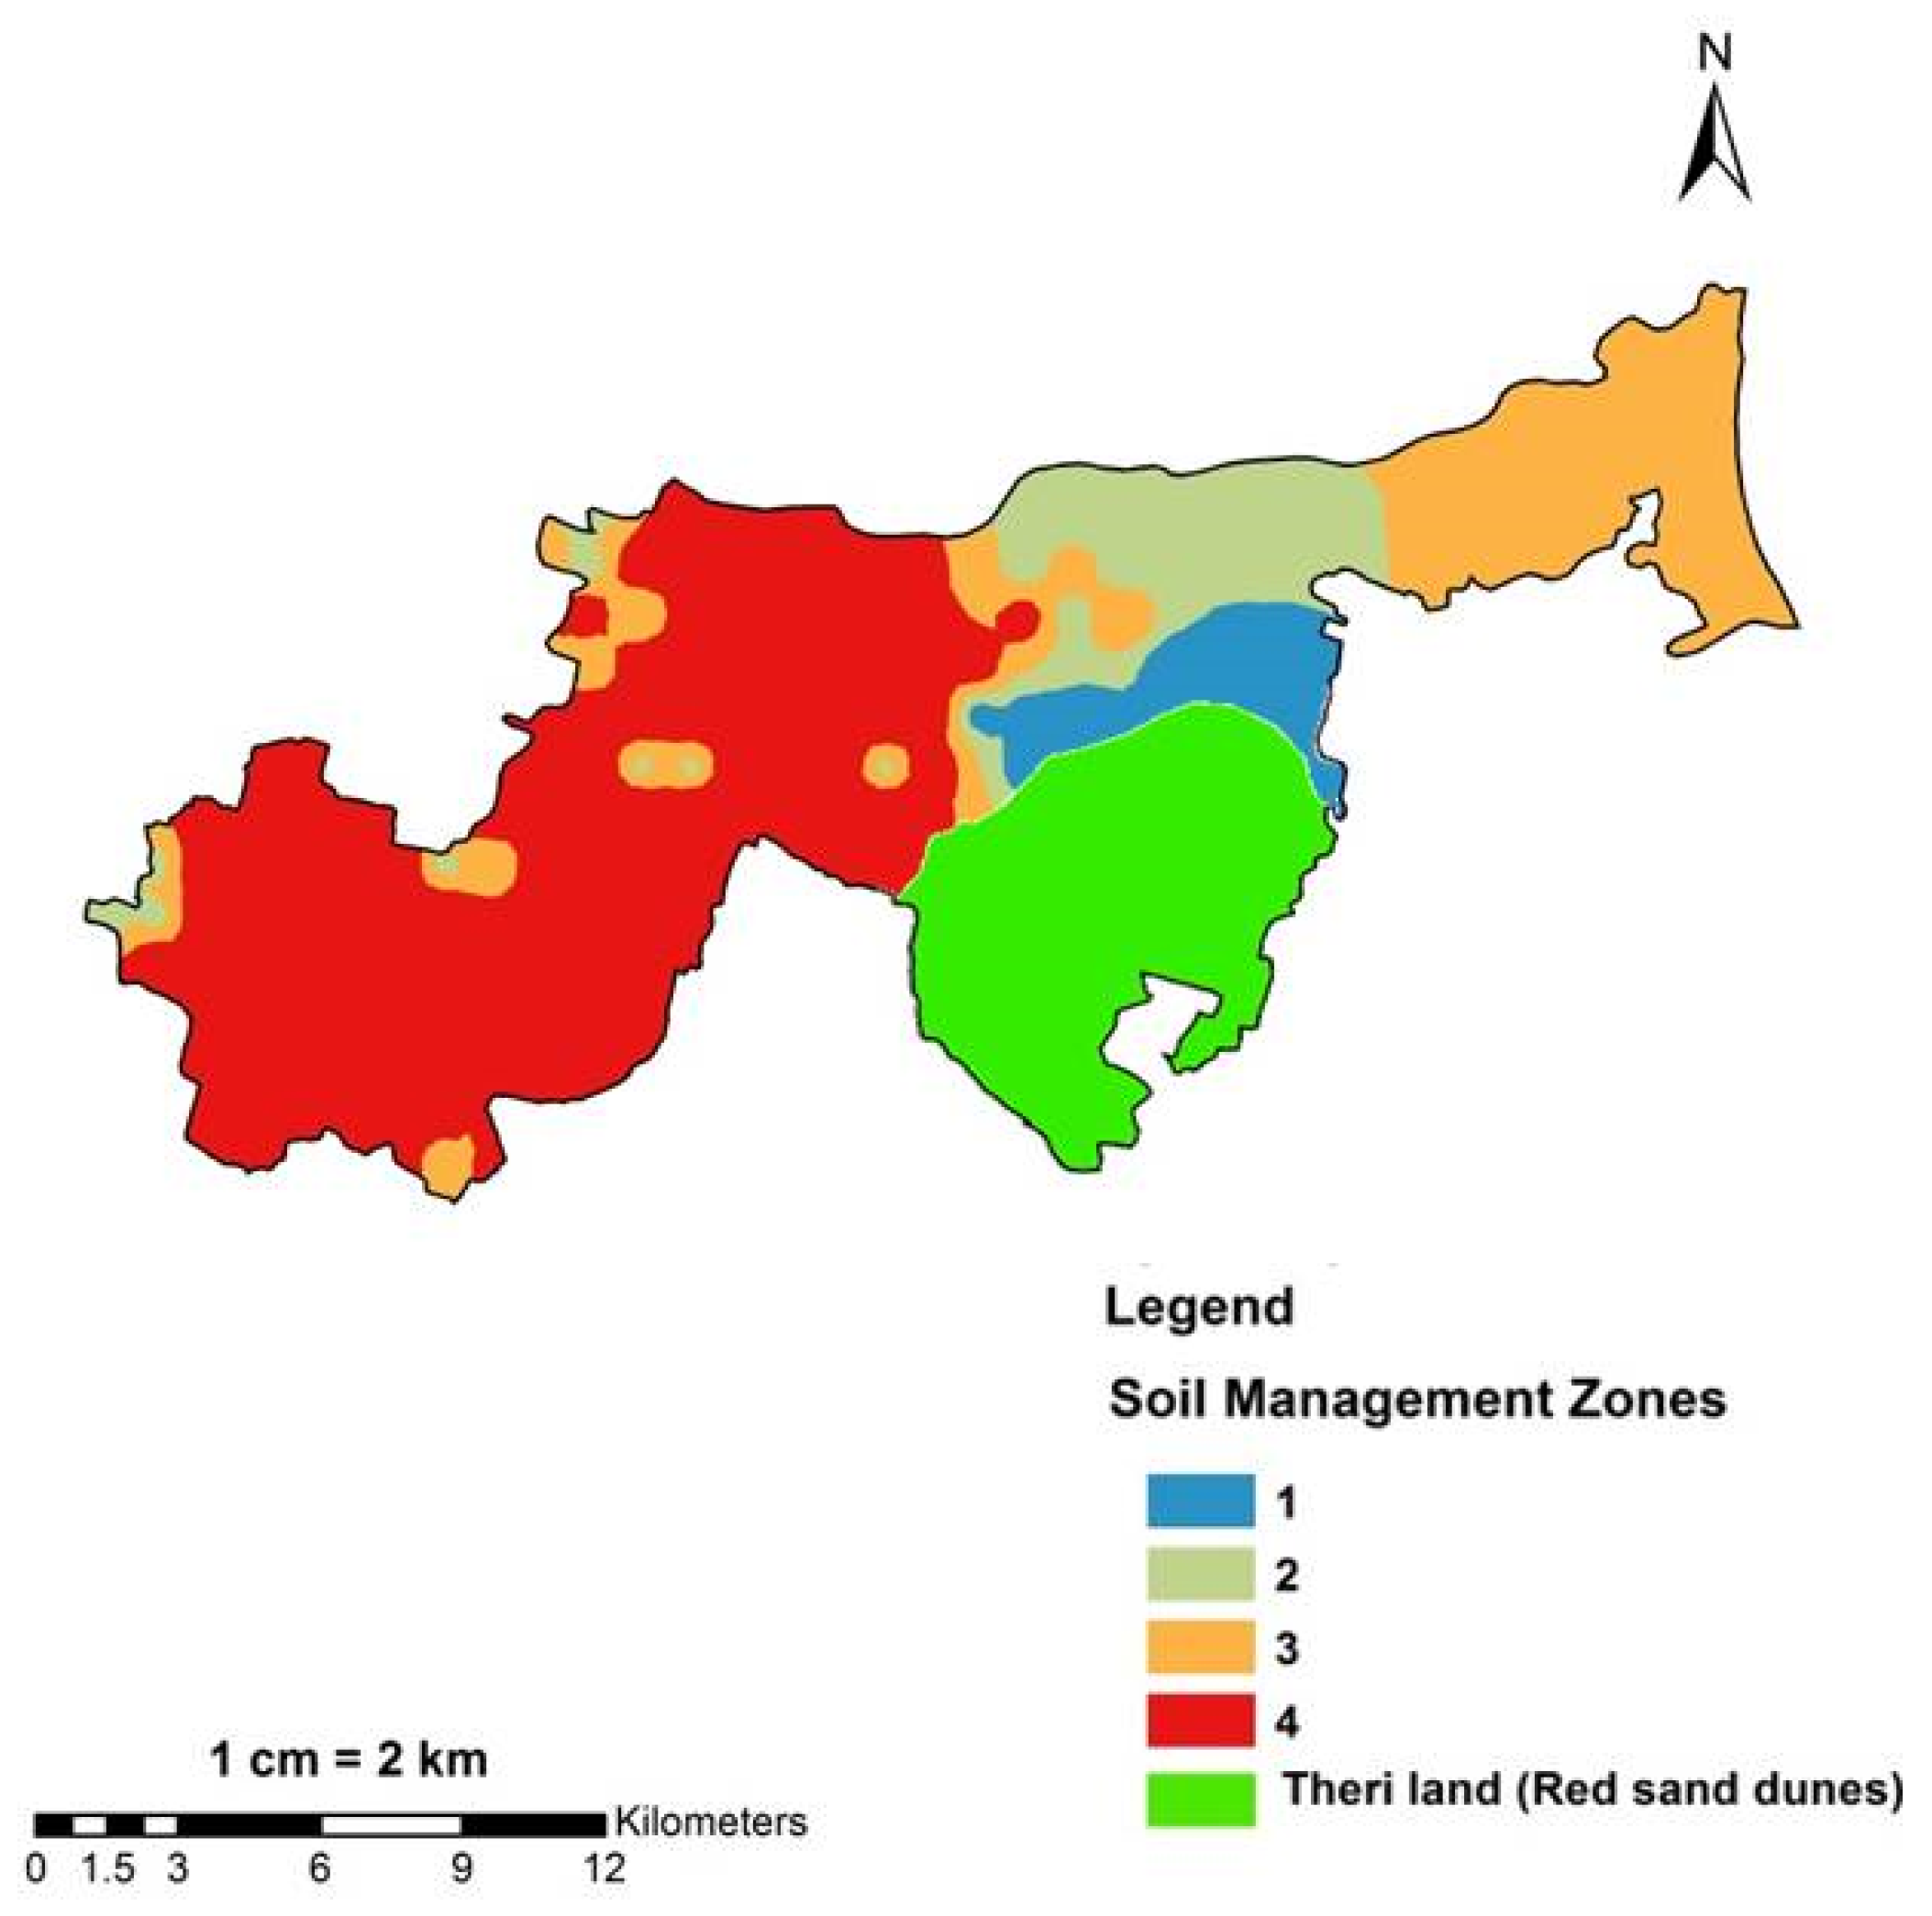
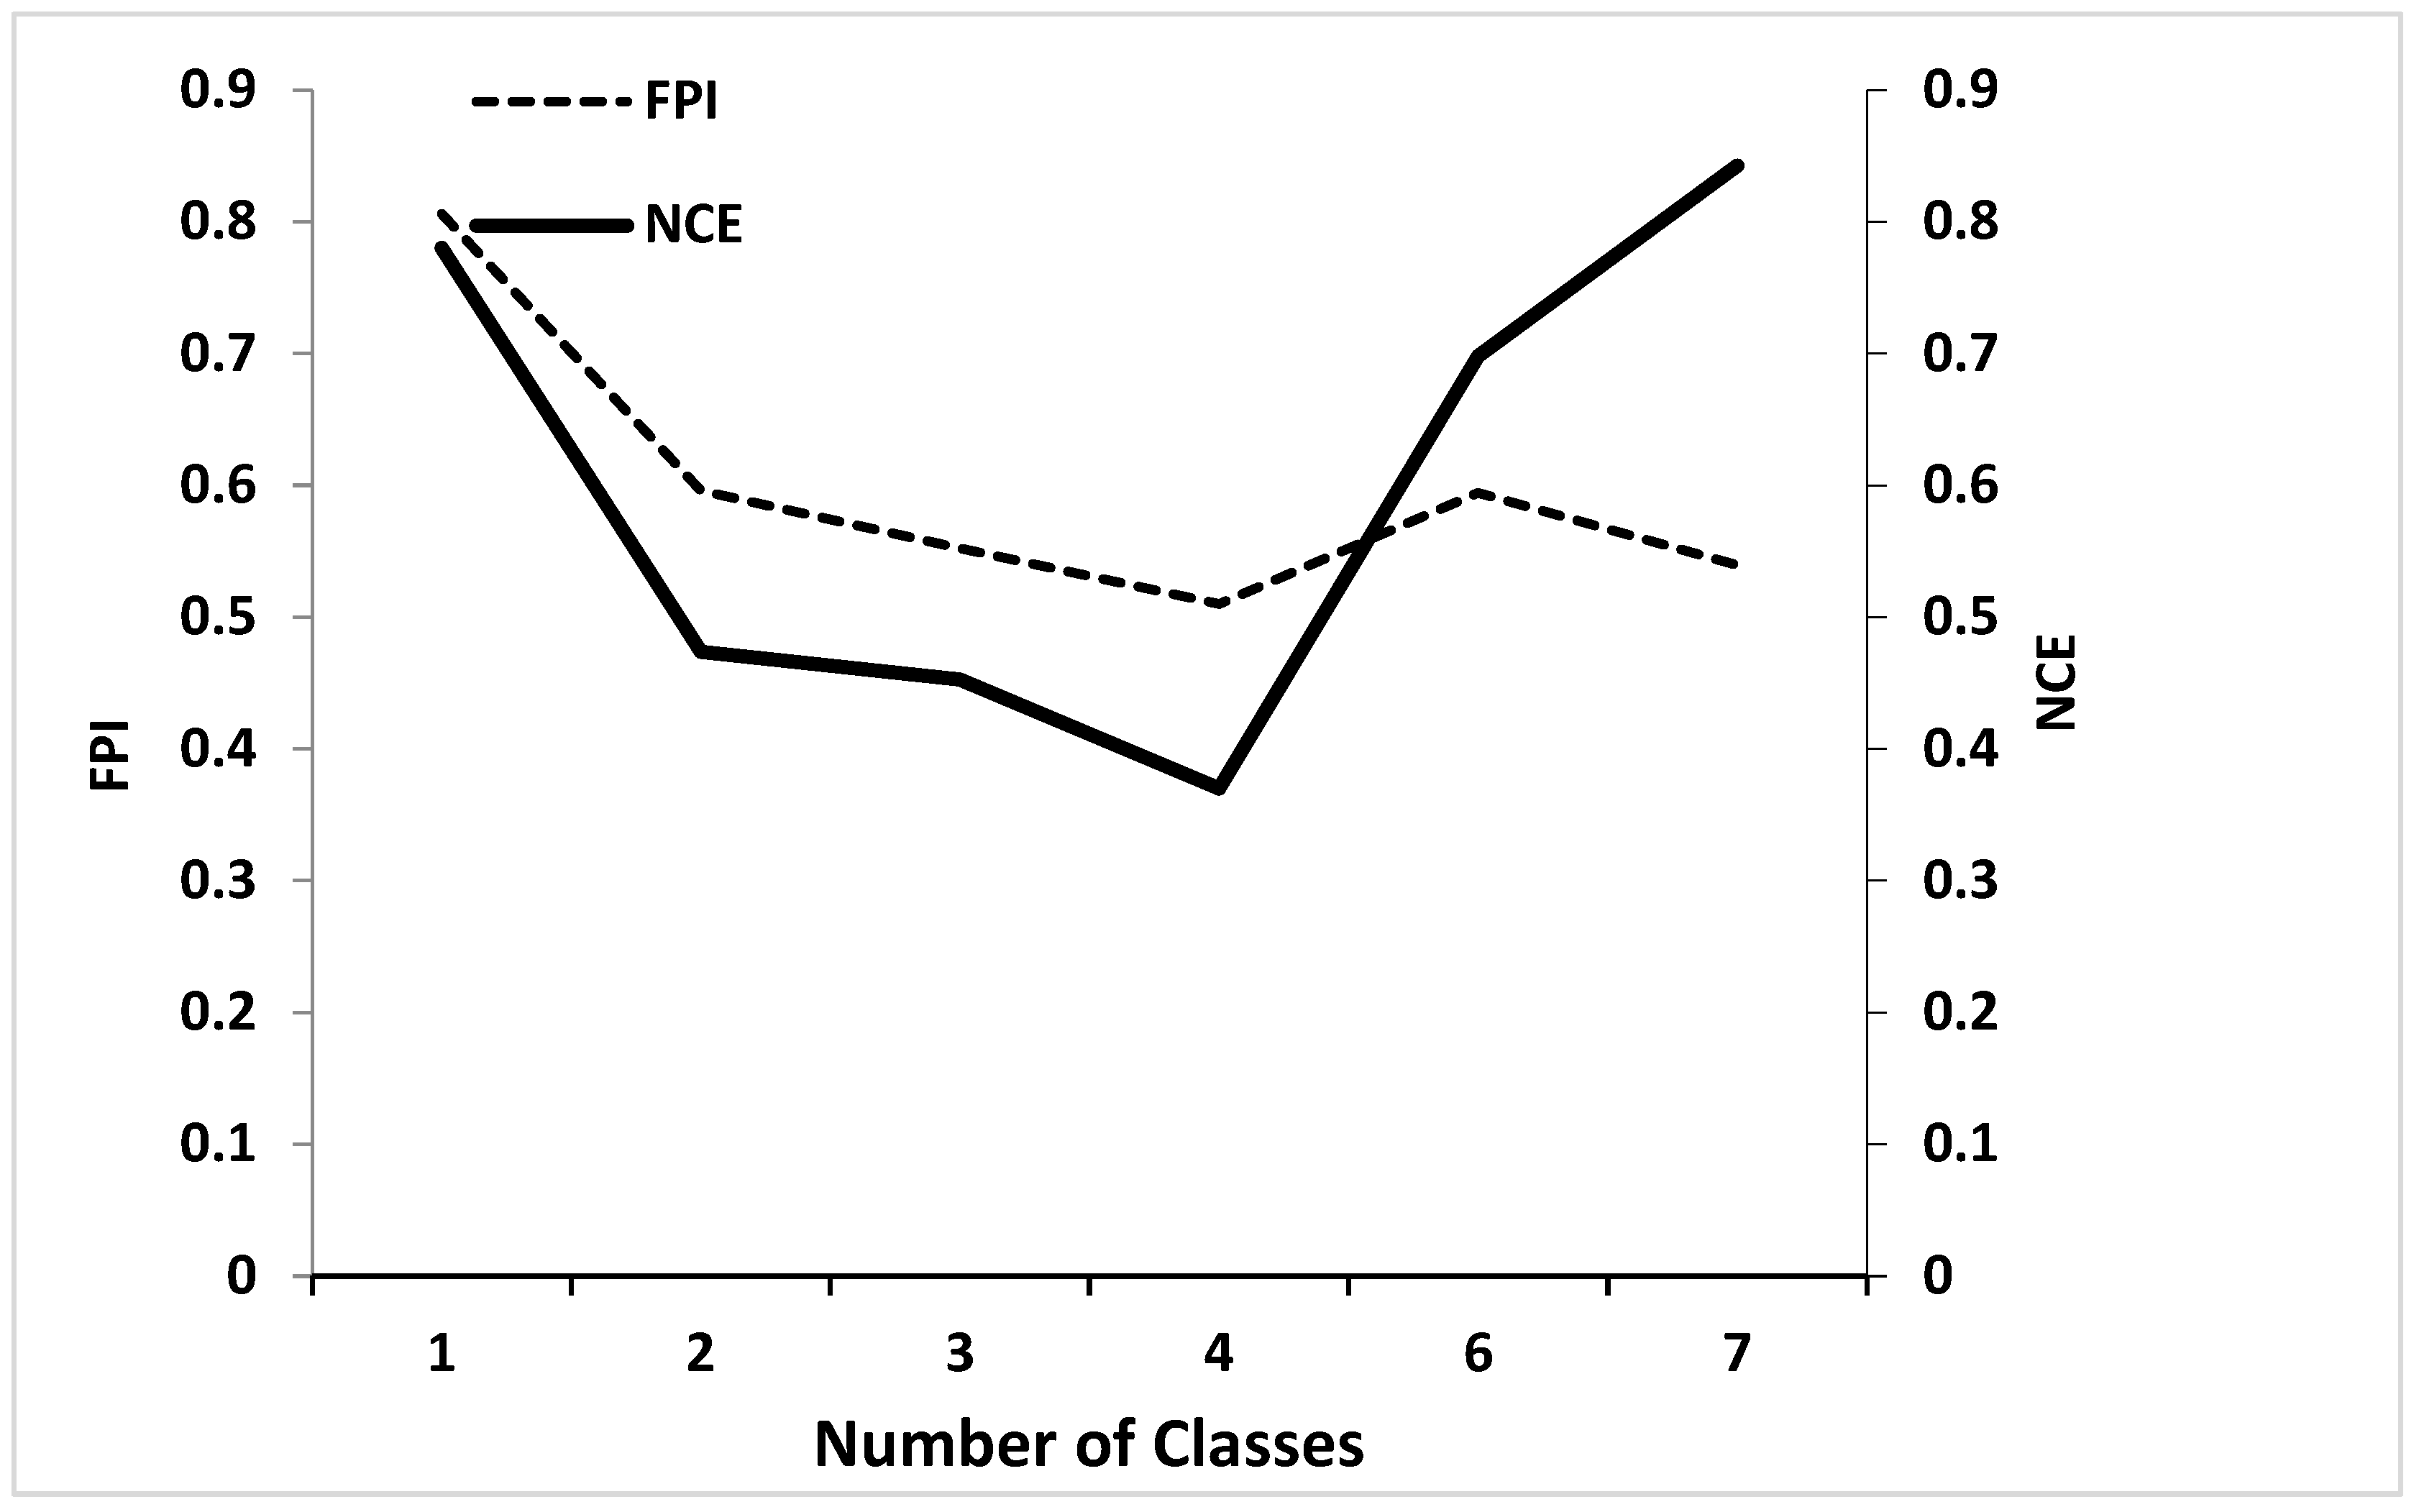
3.5. Demarcating Management Zones

The first three principal component values were used as inputs for management zone analysis in the R programming environment to carry out a fuzzy c-means cluster algorithm to segregate the three PCs into management zones. The FPI and NCE cluster validity indices were plotted against the number of classes, as shown in Figure 5. The ideal number of clusters was calculated when each index reached minimum, which corresponded to the minimum membership sharing (FPI) or maximum organization (NCE) [46]. In this research, four management zones was identified as the optimum number of management zones. To delineate different management zones, the fuzzy cluster technique and PCA were utilized, and the combined effectiveness was assessed using analysis of variance.
The analysis of variance (Table 6) showed significant variation in chemical characteristics among the four delineated management zones. Among these management zones, there was a significant variation (p < 0.05) for each soil property. The soils of management zone 1, with lower K, P, N, Fe, Zn, Cu and Mn values, showed lower fertility potential than the others.

4. Discussion

Among the soil properties, the CV values for available Zn, Cu, Mn, SOC and EC were greater than those for available K, P, N and Fe content. High variations in soil micronutrients may be attributed to the depletion of micronutrients as a result of nutrient mining [50]. The soil parameters showed high spatial variation within the study region and the need for appropriate nutrient management, according to spatial variability, to optimize crop management. Significant correlations existed between the majority of the soil properties. The SOC is considered as an important property that influences availability of nutrients. Metwally et al. [51] reported positive correlation between SOC and N and P. Correlation studies on soil properties revealed that PCA is the ideal tool for figuring out the primary causes of variability in data.
The best-fit semivariogram model was spherical. Additionally, researchers observed that spherical models are well suited to represent major soil parameters [31,52]. The spatial variability map of soil properties pH, EC, K and Cu were highly accurate as compared to other soil properties. The finding demonstrated that there is spatial autocorrelation in the soil parameters. It is attributed to environmental factors such as closeness to the river Tamirabarani, farming systems, fertilization and management practices implemented for farming [53]. pH, SOC, Fe, Zn, Cu and Mn had modest geographical dependence, but EC, K, P and N recorded large geographical dependence. Strong spatial dependency for EC, N, P and K is attributed to closeness to the sea coast and prevailing climatic conditions, whereas moderate spatial dependence of the soil properties is ascribed to the intrinsic soil characteristics, differences in farming techniques and soil fertilization. The spatial distribution maps showed high variations of soil nutrients, which are ascribed to land use and management. The PCA aggregated ten variables into three PCs to account for gross spatial variability in these properties. The technique used to delineate management zones solely considered the available nutrients and spatial information in the PCA.
The management zone map indicates four fertility management zones, as shown in Figure 6. ANOVA was performed to evaluate the combined effect of PCA and the fuzzy cluster algorithm in delineating management zones. The four MZs that were produced were distinct from one another. A similar approach was adopted by other researchers [25,28]. The low status of N may be ascribed to the mining of nutrients due to the continuous cultivation of paddy without replenishing it with organic matter. The eastern study area is affected by seawater intrusion through the Bay of Bengal and may supplement the soil with K. Except MZ1, K deficiency was less widespread in the research area [31].
Poor SOC in all four zones can be attributed to the fact that extremely little or nearly no organic residues get incorporated into soils. MZ3 had the highest soil pH value. K, P and N were extremely deficient in MZ1. The P was medium in MZ2, MZ3 and MZ4. The K was high in MZ2, MZ3 and MZ4. The SOC was very low in MZ2, MZ3 and MZ4. The SOC content has to be enhanced by various management techniques, including crop rotation with leguminous crops, organic manuring and conservation tillage. Available Fe, Zn, Mn and Cu were lower than the critical limit required for cultivation in MZ 1. The Fe, Zn, Cu and Mn values were moderate to support the crop production in the management zones (MZ2, MZ3 and MZ4), despite the high variability of these micronutrients. However, MZ2, MZ3 and MZ4 have the better innate soil fertility owing to greater nutrient reserves and high buffering capacity. Since the soil pH in the four MZs ranged from 6.72 to 8.21, the availability of P and other micronutrients is moderate. The homogenous management zone based on nutrient availability will result in competent and better scientific management of nutrients. This spatial variability study depicts the variation in soil properties. Farmers will be able to make decisions about nutrient management as per site conditions with the use of soil information in different management zones.

5. Conclusions

The geographical heterogeneity in soil characteristics and accessible nutrients is demonstrated by the current study as a potential strategy to delineate management zones in the Alwarthirunagiri block of the Thoothukudi district. In this area, site-specific nutrition management is necessary, as shown by the high correlation of soil parameters, which also revealed significant spatial variability. The soil properties were quantified and aggregated into four management zones using PCA and fuzzy clustering techniques. Significant variations in the assessed soil parameters between the several management zones were shown by a one-way analysis of variance. The soil fertility parameters assessed in the study identified that low amounts of organic carbon and available nitrogen are the biggest barriers of sustainable production. The application of fertilizers is therefore needed to maintain the crop yield at an optimum level. Consequently, the results reveal that fuzzy cluster analysis would reduce variability within the zone and would help in demarcating management zones that will allow farmers to develop nutrition management tailored to site variation. The mean values of the nutrients in each management zone can be used for variable rate fertilization. The input cost of every farmer has to be reduced to increase the profits in agriculture, thereby optimising the fertilizer use. The study’s findings will assist the farmer in selecting the best fertilizer combination for maximizing the yield and optimizing profits while simultaneously decreasing the fertilizer requirement. Combining the zonation map with the land use/cover layer will aid in determining the best locations for applying nutrients sparingly to grow vegetables, pulses and cereals.

Author Contributions

A.V. contributed to the conceptualization and analysis of the study, including writing the original draft manuscript. B.K. and P.S.G. carried out data analysis. A.K., K.M., V.M. and S.J. advised on data processing and interpretation of the results. Each author examined the manuscript and participated in the data analysis. All authors have read and agreed to the published version of the manuscript.

Funding

This research received no external funding.

Informed Consent Statement

Not applicable.

Data Availability Statement

The data and R scripts related to this study are available from the corresponding author upon request.

Acknowledgments

The authors acknowledge the support of the Agricultural College and Research Institute, Killikulam, for offering the research facilities during the course of this research.

Conflicts of Interest

The authors declare no conflicts of interest.

References

  1. Safari, A.; Kavian, A.; Parsakhoo, A.; Saleh Jordan, I.A. Impact of different parts of skid trails on runoff and soil erosion in the Hyrcanian forest (northern Iran). Geoderma 2016, 63, 161–167. [Google Scholar] [CrossRef]
  2. Lal, R. Restoring soil quality to mitigate soil degradation. Sustainability 2015, 7, 5875–5895. [Google Scholar] [CrossRef]
  3. Shukla, A.K.; Sinha, N.K.; Tiwari, P.K.; Prakash, C.; Behera, S.K.; Lenka, N.K.; Siddiqui, S. Spatial distribution and management zones for sulfur and micronutrients in Shiwalik Himalayan region of India. Land Degrad. Dev. 2017, 28, 959–969. [Google Scholar] [CrossRef]
  4. Page, T.; Haygarth, P.M.; Beven, K.J.; Joynes, A.; Butler, T.; Keeler, C.; Freer, J.; Owens, P.N.; Wood, G.A. The spatial variability of soil phosphorus in relation to topographic indices and important source areas: Samples to assess the risks to water quality. J. Environ. Qual. 2005, 34, 2263–2277. [Google Scholar] [CrossRef] [PubMed]
  5. Ruffo, M.L.; Bollero, G.A.; Hoeft, R.G. Bullock, Spatial variability of the Illinois soil nitrogen test: Implications for soil sampling. Agron. J. 2005, 97, 1485–1492. [Google Scholar] [CrossRef]
  6. Reza, S.K.; Nayak, D.C.; Chattopadhyay, T.; Mukhopadhyay, S.; Singh, S.K.; Srinivasan, R. Spatial distribution of soil physical properties of alluvial soils: A geostatistical approach. Arch. Agron. Soil Sci. 2016, 62, 972–981. [Google Scholar] [CrossRef]
  7. Fathi, H.; Fathi, H.; Moradi, H. Spatial variability of soil characteristic for evaluation of agricultural potential in Iran. Merit Res. J. Agric. Sci. Soil Sci. 2014, 2, 24–31. [Google Scholar]
  8. Peralta, N.R.; Costa, J.L. Delineation of management zones with soil apparent electrical conductivity to improve nutrient management. Comput. Electron. Agric. 2013, 99, 218–226. [Google Scholar] [CrossRef]
  9. Behera, S.K.; Mathur, R.K.; Shukla, A.K.; Suresh, K.; Prakash, C. Spatial variability of soil properties and delineation of soil management zones of oil palm plantations grown in a hot and humid tropical region of southern India. Catena 2018, 165, 251–259. [Google Scholar] [CrossRef]
  10. Shukla, A.K.; Sinha, N.K.; Tiwari, P.K.; Prakash, C.; Behera, S.K.; Surendra Babu, P.; Patnaik, M.C.; Somasundaram, J.; Singh, P.; Dwivedi, B.S.; et al. Evaluation of spatial distribution and regional zone delineation for micronutrients in a semi-arid deccan plateau region of India. Land Degrad. Dev. 2018, 29, 2449–2459. [Google Scholar] [CrossRef]
  11. Wang, Y.Q.; Zhang, X.C.; Huang, C.Q. Spatial variability of soil total nitrogen and soil total phosphorus under different land uses in a small watershed on the Loess Plateau, China. Geoderma 2009, 150, 141–149. [Google Scholar] [CrossRef]
  12. Yan, L.; Zhou, S.; Feng, L.; Hang Yi, L. Delineation site specific management zones using fuzzy clustering analysis in a coastal saline land. Comput. Electron. Agric. 2007, 56, 174–186. [Google Scholar]
  13. De Assis Silva, S.; Oliveirados Santos, R.; Marçalde Queiroz, D.; Soaresde Souza Lima, J.; FragaPajehú, L.; Car alho Medauar, C. Apparent soil electrical conductivity in the delineation of management zones for cocoa cultivation. Inf. Process. Agric. 2022, 9, 443–455. [Google Scholar] [CrossRef]
  14. Breunig, F.M.; Galvão, L.S.; Dalagnol, R.; Dauve, C.E.; Parraga, A.; Santi, A.L.; Della Flora, D.P.; Chen, S. Delineation of management zones in agricultural fields using cover–crop biomass estimates from PlanetScope data. Int. J. Appl. Earth Obs. Geoinf. 2020, 85, 102004. [Google Scholar] [CrossRef]
  15. Zeraatpisheh, M.; Bakhshandeh, E.; Emadi, M.; Li, T.; Xu, M. Integration of PCA and fuzzy clustering for delineation of soil management zones and cost-efficiency analysis in a citrus plantation. Sustainability 2020, 12, 5809. [Google Scholar] [CrossRef]
  16. Zeraatpisheh, M.; Bottega, E.L.; Bakhshandeh, E.; Owliaie, H.R.; Taghizadeh-Mehrjardi, R.; Kerry, R.; Scholten, T.; Xu, M. Spatial variability of soil quality within management zones: Homogeneity and purity of delineated zones. Catena 2022, 209, 105835. [Google Scholar] [CrossRef]
  17. Reyniers, M.; Maertens, K.; Vrindts, E.; De Baerdemaeker, J. Yield variability related to landscape properties of a loamy soil in central Belgium. Soil Tillage Res. 2006, 88, 262–273. [Google Scholar] [CrossRef]
  18. Flowers, M.; Weisz, R.; White, J.G. Yield-based management zones and grid sampling strategies: Describing soil test and nutrient availability. Agron. J. 2005, 97, 968–982. [Google Scholar] [CrossRef]
  19. Hornung, A.; Khosla, R.; Reich, R.; Inman, D.; Westfall, D.G. Comparison of site-specific management zones: Soil-color-based and yield-based. Agron. J. 2006, 98, 407–415. [Google Scholar] [CrossRef]
  20. Jena, R.K.; Duraisami, V.P.; Sivasamy, R.; Shanmugasundaram, R.; Krishnan, R.; Padua, S. Spatial variability of soil fertility parameters in Jirang Block of Ri-Bhoi District, Meghalaya. Clay Res. 2015, 34, 35–45. [Google Scholar]
  21. Moharana, P.C.; Jena, R.K.; Pradhan, U.K.; Nogiya, M.; Tailor, B.L.; Singh, R.S. Geostatistical and fuzzy clustering approach for delineation of site-specific management zones and yield-limiting factors in irrigated hot arid environment of India. Precis. Agric. 2020, 21, 426–448. [Google Scholar] [CrossRef]
  22. Jaynes, D.B.; Kaspar, T.C.; Colvin, T.S.; James, D.E. Cluster analysis of spatiotemporal corn yield patterns in an Iowa field. Agron. J. 2003, 95, 574–586. [Google Scholar] [CrossRef]
  23. Speranza, E.A.; Naime, J.D.; Vaz, C.M.; Santos, J.C.; Inamasu, R.Y.; Lopes, I.D.; Queirós, L.R.; Rabelo, L.M.; Jorge, L.A.; Chagas, S.D.; et al. Delineating Management Zones with Different Yield Potentials in Soybean–Corn and Soybean–Cotton Production Systems. AgriEngineering 2023, 5, 1481–1497. [Google Scholar] [CrossRef]
  24. Shukla, M.K.; Sharma, P. Fuzzy K-Means and Principal Component Analysis for Classifying Soil Properties for Efficient Farm Management and Maintaining Soil Health. Sustainability 2023, 15, 13144. [Google Scholar] [CrossRef]
  25. Maleki, S.; Karimi, A.; Mousavi, A.; Kerry, R. Delineation of Soil Management Zone Maps at the Regional Scale Using Machine Learning. Agronomy 2023, 13, 445. [Google Scholar] [CrossRef]
  26. Rodríguez, C.A.; Mancera, J.J. Viability Analysis of Tidal Turbine Installation Using Fuzzy Logic: Case Study and Design Considerations. Axioms 2023, 12, 778. [Google Scholar] [CrossRef]
  27. Jena, R.K.; Bandyopadhyay, S.; Pradhan, U.K.; Moharana, P.C.; Kumar, N.; Sharma, G.K.; Roy, P.D.; Ghosh, D.; Ray, S.P.; Padua, S.; et al. Geospatial Modelling for Delineation of Crop Management Zones Using Local Terrain Attributes and Soil Properties. Remote Sens. 2022, 14, 2101. [Google Scholar] [CrossRef]
  28. Lajili, A.; Cambouris, A.N.; Chokmani, K.; Duchemin, K.; Perron, M.; Zebarth, B.J.; Biswas, A.; Adamchuk, V.I. Analysis of Four Delineation Methods to Identify Potential Management Zones in a Commercial Potato Field in Eastern Canada. Agronomy 2021, 11, 432. [Google Scholar] [CrossRef]
  29. Shukla, A.K.; Behera, S.K.; Singh, V.K.; Prakash, C.; Sachan, A.K.; Dhaliwal, S.S. Premonsoon spatial distribution of available micronutrients and sulphur in surface soils and their management zones in Indian Indo-Gangetic Plain. PLoS ONE 2020, 15, e0234053. [Google Scholar] [CrossRef]
  30. Alagaiah Venu, U.; Velmayil, P. Texture, mineralogy and geochemistry of Teri sediments from the Kuthiraimozhi deposit, Southern Tamilnadu, India: Implications on provenance, weathering and palaeoclimate. Arab. J. Geosci. 2021, 14, 364. [Google Scholar] [CrossRef]
  31. Tripathi, R.; Nayak, A.K.; Shahid, M.; Lal, B.; Gautam, P.; Raja, R.; Mohanty, S.; Kumar, A.; Panda, B.B.; Sahoo, R.N. Delineation of soil management zones for a rice cultivated area in eastern India using fuzzy clustering. Catena 2015, 133, 128–136. [Google Scholar] [CrossRef]
  32. Jackson, M.L. Soil Chemical Analysis, Indian ed.; Prentice Hall of India: New Delhi, India, 1973. [Google Scholar]
  33. Walkley, A.J.; Black, I.A. An examination of the Degtjareff method for determining soil organic matter and a proposed modification of the chromic acid titration method. Soil Sci. 1934, 37, 29–38. [Google Scholar] [CrossRef]
  34. Subbiah, B.V.; Asija, C.L. A rapid procedure for the estimation of available nitrogen in soils. Curr. Sci. 1956, 25, 259–260. [Google Scholar]
  35. Olsen, S.R. Estimation of Available Phosphorus in Soils by Extraction with Sodium Bicarbonate. In Circular; United States Department of Agriculture: Washington, DC, USA, 1954; Volume 939, pp. 1–19. [Google Scholar]
  36. Stanford, S.; English, L. Use of flame photometer in rapid soil test of K and Ca. Agron. J. 1949, 41, 446–447. [Google Scholar] [CrossRef]
  37. Lindsay, W.L.; Norvell, W.A. Development of a DTPA soil test for zinc, iron, manganese and copper. Soil Sci. Soc. Am. J. 1978, 42, 421–448. [Google Scholar] [CrossRef]
  38. Gomez, K.A.; Gomez, A.A. Statistical Procedures for Agricultural Research, 2nd ed.; John & Wiley & Sons: New York, NY, USA, 1984; p. 680. [Google Scholar]
  39. Krig, D.G. Lognormal-de Wijsian Geostatistics for Ore Evaluation; Printpak (Cape) Ltd.: Johannesburg, South Africa, 1981. [Google Scholar]
  40. Schepers, A.R.; Shanaham, J.F.; Liebig, M.A.; Schepers, J.S.; Johnson, S.H.; Luchiari, J.A. Appropriateness of management zones for characterizing spatial variability of soil properties and irrigated corn yields across years. Agron. J. 2004, 96, 195–203. [Google Scholar] [CrossRef]
  41. De Gruijter, J.J.; Mc Bratney, A.B. A modified fuzzy K-means for predictive classification. In Classification and Related Methods of Data Analysis; Bock, H.H., Ed.; Elsevier Science: Amsterdam, The Netherlands, 1988; pp. 97–104. [Google Scholar]
  42. Xin-Zhang, W.; Guo-Shun, L.; Hong-Chao, H.; Zhen-Hai, W.; Qing-Hua, L.; Xu-Feng, L.; Wai Hang, H.; Yan-Tao, L. Determination of management zones for a tobacco field based on soil fertility. Comput. Electron. Agric. 2009, 65, 168–175. [Google Scholar] [CrossRef]
  43. Boydell, B.; Mc Bratney, A.B. Identifying potential within field management zones from cotton yield estimates. In Precision Agriculture, Proceedings of the 2nd European Conference on Precision Agriculture, Odense, Denmark, 11–15 July 1999; Stafford, J.V., Ed.; SCI: London, UK, 1999; pp. 331–341. [Google Scholar]
  44. Mc Bratney, A.B.; Moore, A.W. Application of fuzzy sets to climatic classification. Agric. For. Meteorol. 1985, 35, 165–185. [Google Scholar] [CrossRef]
  45. Bezdek, J.C. Pattern Recognition with Fuzzy Objective Function Algorithms; Plenum: New York, NY, USA, 1981. [Google Scholar]
  46. Tong, T.; Mei, S.; Cao, C.; Legesse, N.; Chang, J.; Ying, C.; Ma, Y.; Wang, Q. Delineation of Productive Zones in Eastern China Based on Multiple Soil Properties. Agronomy 2023, 13, 2869. [Google Scholar] [CrossRef]
  47. Cambardella, C.A.; Moorman, T.B.; Novak, J.M.; Parkin, T.B.; Karlen, D.L.; Turco, R.F.; Konopka, A.E. Field-scale variability of soil properties in central Iowa soil. Soil Sci. Soc. Am. J. 1994, 58, 1501–1511. [Google Scholar] [CrossRef]
  48. Davatgar, N.; Neishabouri, M.R.; Sepaskhah, A.R. Delineation of site-specific nutrient management zones for a paddy cultivated area based on soil fertility using fuzzy clustering. Geoderma 2012, 173, 111–118. [Google Scholar] [CrossRef]
  49. Mao, D.H.; Wang, Z.M.; Li, L.; Miao, Z.H.; Ma, W.H.; Song, C.C.; Jia, M.M. Soil organic carbon in the Sanjiang plain of China: Storage, distribution and controlling factors. Biogeosciences 2015, 12, 1635–1645. [Google Scholar] [CrossRef]
  50. Sanyal, S.K.; Majumdar, K.; Singh, V.K. Nutrient Management in Indian Agriculture with Special Reference to Nutrient Mining—A Relook. J. Indian Soc. Soil Sci. 2014, 62, 307–325. [Google Scholar]
  51. Metwally, M.S.; Sameh Shaddad, M.; Liu, M.; Yao, R.J.; Abdo, A.I.; Li, P.; Jiao, J.; Chen, X. Soil Properties Spatial Variability and Delineation of Site-Specific Management Zones Based on Soil Fertility Using Fuzzy Clustering in a Hilly Field in Jianyang, Sichuan, China. Sustainability 2019, 11, 70–84. [Google Scholar] [CrossRef]
  52. Jiang, H.; Liu, G.; Wang, X.; Song, W.; Zhang, R.; Zhang, R.; Hu, H.; Li, L. Delineation of site-specific management zones based on soil properties for a hillside field in central China. Arch. Agron. Soil Sci. 2012, 58, 1075–1090. [Google Scholar] [CrossRef]
  53. Liu, G.S.; Wang, X.Z.; Zhang, Z.Y.; Zhang, C.H. Spatial variability of soil properties in a tobacco field of central China. Soil Sci. 2008, 173, 659–667. [Google Scholar]
Figure 1. Study region depicting soil-sampled locations.
Sustainability 16 02095 g001
Figure 2. Semivariograms of soil parameters (a) pH, (b) EC, (c) K, (d) P, (e) N, (f) SOC, (g) Fe, (h) Zn, (i) Cu and (j) Mn.
Sustainability 16 02095 g002aSustainability 16 02095 g002b
Figure 3. Spatial distribution map for soil properties (a) pH, (b) EC, (c) K, (d) P, (e) N, (f) OC, (g) Fe, (h) Zn, (i) Cu and (j) Mn.
Sustainability 16 02095 g003aSustainability 16 02095 g003bSustainability 16 02095 g003c
Figure 4. Kriged maps according to the three primary components.
Sustainability 16 02095 g004
Figure 5. Fuzzy performance index (FPI) and normalized classification entropy (NCE).
Sustainability 16 02095 g005
Figure 6. Management zones map for the study area.
Sustainability 16 02095 g006
Table 1. Descriptive data about the study area’s soil characteristics.
S.NoSoil PropertiesMinMaxSDMedianMeanCV (%)SkewnessKurtosis
1pH6.28.90.727.587.409.72−0.22−1.12
2EC (dS m−1)0.081.20.180.180.2474.602.538.51
3K (Kg ha−1)105832148.12310.00357.9041.401.442.30
4P (Kg ha−1)2.221.44.5012.2012.8035.000.04−0.40
5N (Kg ha−1)85.627546.16212.80210.0022.00−0.800.31
6SOC (%)0.090.90.240.450.4553.020.17−1.31
7Fe (mg kg−1)1.109.982.314.825.0046.500.33−0.80
8Zn (mg kg−1)0.033.140.701.091.1360.620.480.26
9Cu (mg kg−1)0.104.780.931.561.7453.320.46−0.22
10Mn (mg kg−1)0.087.862.142.913.2765.400.58−0.48
Table 2. Correlation matrix for soil properties in study area.
pHECAKAPANSOCFeZnCuMn
pH1
EC0.451 **1
K0.502 **0.622 **1
P0.179 *0.1260.411 **1
N0.196 *−0.173 *0.0990.342 **1
SOC0.082−0.0010.0560.297 **0.347 **1
Fe0.350 **0.170 *0.294 **0.225 **0.240 **0.193 *1
Zn0.325 **0.1090.273 **0.280 **0.359 **0.1110.371 **1
Cu0.0750.0580.157 *0.1480.289 **0.157 *0.1330.253 **1
Mn−0.277 **−0.154 *0.188 *0.234 **0.261 **0.0280.1130.0920.175 *1
** Correlation is significant at 0.01 level, * Correlation is significant at 0.05 level.
Table 3. Semivariogram models for soil parameters.
Soil PropertyModelPartial SillSillNuggetNugget/SillRange (m)RMSESpatial Dependence Class
pHExponential0.2960.4930.19840.1163780.57Moderate
ECSpherical0.2330.2670.03412.8119110.13Strong
KSpherical0.1340.1370.0032.1281700.90Strong
PExponential15.31219.1783.86620.1646343.65Strong
NSpherical1633.6251900.684267.05914.0540503.40Strong
SOCSpherical267.0596.0542.97049.0647002.05Moderate
FeSpherical2.2055.6533.44860.9961962.06Moderate
ZnSpherical0.2560.4650.25655.0536932.12Moderate
CuSpherical0.6290.8740.62971.9636410.61Moderate
MnSpherical0.3221.0350.32231.0846012.19Moderate
Table 4. Details of PCA for soil parameters.
Principal ComponentEigen ValueComponent Variability (%)Cumulative Loading %
PC12.90229.01729.017
PC21.89818.98047.998
PC31.04110.40858.406
PC40.9159.14667.551
PC50.8348.33775.889
PC60.7317.30883.197
PC70.5395.38788.584
PC80.5095.08793.670
PC90.3493.49397.163
PC100.2842.837100.000
Table 5. Principal component loading for soil parameters.
ParameterspHECKPNSOCFeZnCuMn
PC10.6390.4680.7140.6190.5210.3890.6100.6310.4000.171
PC2−0.480−0.672−0.4190.2440.5500.4270.0230.1230.2950.627
PC3−0.3090.3270.3480.392−0.2970.090−0.238−0.383−0.0690.510
Table 6. Soil nutrient properties in management zones.
Management ZonepHEC
(dS m−1)
K
(Kg ha−1)
P
(Kg ha−1)
N
(Kg ha−1)
SOC
(%)
Fe
(mg kg−1)
Zn
(mg kg−1)
Cu
(mg kg−1)
Mn
(mg kg−1)
16.72 d0.17 c111.68 d4.95 c103.89 d0.17 c1.54 b0.17 c0.39 b0.20 c
27.68 b0.26 b434.24 b14.07 a235.51 a0.50 a5.71 a1.50 a1.91 a3.27 a
38.21 a0.57 a739.88 a16.13 a180.01 c0.39 b5.73 a1.20 b1.76 a2.90 b
47.24 c0.20 c300.75 c12.59 b214.46 b0.46 ab4.87 a1.09 b1.81 a3.61 b
Means with the same letter are not significantly different at 0.05 probability level.
Disclaimer/Publisher’s Note: The statements, opinions and data contained in all publications are solely those of the individual author(s) and contributor(s) and not of MDPI and/or the editor(s). MDPI and/or the editor(s) disclaim responsibility for any injury to people or property resulting from any ideas, methods, instructions or products referred to in the content.

