Abstract
Low-impact development (LID) measures are crucial for solving water environment problems during sponge city construction. Optimizing LID measures to meet multi-objective demands is essential for achieving low-carbon and green operation of sponge cities under the goal of ‘dual carbon’. To select the optimal rain garden plants suitable for the construction of a coastal sponge low-carbon city, a set of AHP-TOPSIS applicability assessments was constructed. The assessment index system comprises three main categories of indices: economic cost, ecological benefit, and environmental adaptability. The hierarchical analysis method (AHP) was used to construct a plant evaluation system from three decision-making levels and eleven criterion levels. This system assigned weights to each index in the index system. Subsequently, the distance between the superior and inferior solutions (TOPSIS) was used to evaluate the overall performance of 14 tree species, 10 shrub species, and 12 herbaceous plant species commonly found in rain gardens in a coastal city in China, so as to identify the optimal plants to meet the target demand of low-carbon rain garden construction.
1. Introduction
China’s rapid urbanization has created serious water and environmental problems. To address these issues, the Chinese government launched a program in 2015 to build sponge cities, which can contribute to a more conducive and sustainable future. Implementing low-impact development measures is crucial in creating sustainable and resilient sponge cities by effectively managing stormwater, protecting water resources, improving water quality, enhancing urban biodiversity, and combating climate change [1]. Policy-makers, urban planners, and communities must recognize the importance of LID measures and prioritize them in their urban development strategies. While sponge city-building initiatives are attracting attention and spreading rapidly across the country, a number of challenges and risks remain. First, to curb global climate change, “carbon emission reduction” has become a major concern worldwide [2]. The Paris Agreement that came into effect in 2016 [3,4] and China’s “dual carbon” target in 2020 [5,6] indicate that global attention to low carbon development is increasing, and development is getting more and more attention. Carrying out sponge city construction based on low carbon is the focus of low-carbon ecological construction and the way to solve the risk of urban flooding. Secondly, the current focus of sponge city construction focuses on the perspective of gradually changing from pure hydrological processes to advocating the ecohydrological restoration of all-around multi-objective needs [7].
Based on the above background, multi-objective optimization is needed when developing LID measures. In addition to considering ecological benefits, economic and environmental benefits should be adequately considered [8]. Rain gardens are one of the LID measures that are designed and constructed through the design and construction of artificial gardens or landscapes, usually consisting of vegetation, permeable soils, and drainage facilities, with the aim of reducing stormwater runoff, improving water quality, increasing urban green space, and enhancing the resilience of urban ecosystems [9]. Current research on rain gardens focuses on hydrologic simulation studies [10], soil infiltration studies [11], pollutant retention capacity studies [12], hydrologic effects of different plant applications [13], and studies on low-carbon construction and application of rain gardens [14]. Due to the strong territoriality of rain garden plants, the current research on plant selection and design of rain gardens is weak, and there are few quantitative studies under multi-objective requirements. Therefore, this paper intends to apply the AHP (Analytic Hierarchy Process)-TOPSIS (Technique for Order Preference by Similarity to an Ideal Solution) method to optimally screen rain garden plants in a coastal city in China, and establish the ecological benefits, economic costs, and environmental adaptability for the three main indicators required by the method at the decision-making level. The objective is to provide technical support for the local government departments and enterprises of a coastal city in China to identify the appropriate plant species according to the multi-objective needs of regional rain gardens.
2. Methods and Techniques
Differences in the objective needs of trees, shrubs, and herbaceous plants lead to different emphases on different metrics. Both AHP and TOPSIS models are commonly used multi-criteria decision-making methods. Using these two models in combination can compensate for some of the deficiencies of a single model.
The AHP method assigns weights to the decision and criterion layers [15,16,17], relying on expert judgment to determine the weights of the criteria, which is somewhat subjective. The TOPSIS model, on the other hand, evaluates and ranks the programs, mainly considering the comprehensive performance of objective indicators. By combining the two models, both subjective and objective factors can be taken into account, thus better reflecting the will of decision makers and the actual situation, and thus establishing a more complete and accurate decision-making index system. Therefore, on the basis of AHP empowerment, in order to judge which specific plants can achieve the target demand of constructing low-carbon rain gardens, the TOPSIS method can be considered for further evaluation and assignment of the criterion layer [18,19].
2.1. Construction of the Assessment Indicator System
To optimize plants for rain gardens in coastal cities, we considered three aspects of the decision-making level of the evaluation index system. Firstly, the economic costs were considered, secondly the ecological benefits to the local area after the rain garden was constructed, and lastly, the environmental capacity of the plants to adapt to the climate and soil of the coastal city was also considered. At the same time, the social benefit level for the neighboring residents after the construction of the rain garden was not considered, such as the residents’ satisfaction with the designed landscape, the degree of ecological and environmental education awareness enhancement, and the aesthetic value of the design and other indicators. Because these indicators are often more subjective, it is difficult to transform them into quantitative indicators for evaluation. Therefore, taking into account the experts’ opinions, the construction of indicators at each level is as follows:
Economic cost level: Both the cost of purchasing the various types of plants at the beginning of the rain garden construction and the costs incurred during the maintenance process at a later stage should be taken into account.
Eco-efficiency level: Rain gardens are inherently a type of green infrastructure that utilizes plants and soil to treat and manage stormwater runoff, and therefore need to focus first on runoff control capabilities. Urban precipitation runoff pollutants are suspended solids (SS), total nitrogen (TN), total phosphorus (TP), and other pollutants, requiring plants to have a strong decontamination ability to achieve rapid decontamination in the process of water accumulation and infiltration [20]. In addition, rain garden plants can fully create carbon sink benefits, which is a very important carbon reduction facility for sponge city construction, so the carbon sink benefits from plant carbon sequestration also need to be considered. There are many ways to evaluate the carbon sink benefits of plants, and, in this study, by investigating the research literature related to the carbon sink capacity of common plants in southern China, especially in coastal cities, we used the amount of CO2 per year fixed by a single plant as an indicator for evaluating plant carbon sinks. In addition to the above indicators, the ecological benefits of ecological diversity and soil quality improvement are also worth considering. However, as the effects of ecological diversity and soil quality improvement require long-term field trials and studies, which are statistically difficult, the eco-efficiency of this study focuses only on the benefits of runoff control capacity, decontamination capacity, and carbon sink.
Environmental adaptability level: after a discussion of expert opinions, it was concluded that climatic factors and growing soil conditions influence important considerations for plant environmental adaptation, and therefore the screening of environmental adaptation indicators focused on these two aspects.
Coastal cities usually have a mild climate with few high- or low-temperature extremes, so cold or heat tolerance is not considered in this study. Coastal cities are often subjected to sea winds, so it should be taken into account that the plants need to have strong wind resistance, especially trees; coastal cities usually have high humidity, which requires the selection of plant species with good humidity tolerance, especially herbaceous plants. At the same time, drought tolerance should be considered, able to withstand the spring, fall, and winter micro-drought of China’s coastal cities with short-term waterlogging in the summer.
As infiltrative permeable rain gardens need to ensure groundwater recharge [21], the soil is required to have a high water permeability. This leads to a relatively poor ability to retain fertilizer and water, so plant materials need to have a certain ability to withstand barren conditions. Plant maintenance costs are also related to the ability to resist pests and diseases; strong resistance to pests and diseases of plants not only relates to environmental adaptability but also reduces the cost of maintenance. At the same time, coastal cities have a variety of soil types and are often subject to seawater erosion or saline and alkaline soils; acid and alkaline soils coexist, which requires that the plants have a certain degree of acid and alkali resistance.
The above indicators are summarized to form the following diagram of the evaluation indicator system at the goal, decision, and guideline levels (Table 1):

Table 1.
Evaluation index system for optimal rain garden plants.
2.2. Comprehensive Technology Performance Assessment
The two main models have certain application drawbacks: one is that the AHP model is subjective and requires experts or decision makers to provide subjective weights for the criteria and factors, and different experts may give different weights to the same criteria, which affects the final decision results. The TOPSIS model requires standardization of the evaluation indicators to ensure that the indicators have the same weights and metrics. However, different standardization methods may lead to different results with higher sensitivity.
To address these shortcomings, the AHP model, first, ensures representativeness and diversity and balances individual subjective bias, as much as possible, by inviting many experts from different industries to make joint decisions; second, it also uses consistency testing methods to exclude the influence of subjective factors and to improve the objectivity and consistency of the decision-making results. The indicators of the TOPSIS model adopt objective data as much as possible and use a hierarchical scoring system for the indicators for which objective data are temporarily unavailable, to ensure that the weighting of the indicators and the metrics will not have a large impact on the results.
2.2.1. AHP Construct
- (1)
- Establishment of a hierarchical structure: Based on the analysis of the problem, the factors included in the problem are clarified, the correlation and affiliation between the factors are identified, and the factors are divided into several levels, including the objective level, the decision-making level, and the guideline level, according to the common characteristics of the factors, as mentioned above.
- (2)
- Creation of a judgment matrix and calculation
Step 1: Construct the judgment matrix through the form of expert scoring. The number of experts should be large enough to ensure representativeness and diversity, while at the same time not being excessive, thereby complicating the decision-making process and leading to inefficiencies. So, we invited environmental professionals and scholars, experts from the environmental protection industry municipal design industry, landscape design industry, and plant ecological protection industry for decision-making, and the weights obtained from the scoring matrix obtained by the 9 experts were added and then averaged. The scale value of the comparison between the elements was determined, and the judgment matrix was established. We used MATLAB R2020a software to calculate the eigenvector, Wi, of the matrix and test the consistency of the matrix. Among them, the judgment matrix, A–B, between the target layer and the criterion layer, and the judgment matrix, B–C, between the criterion layer and the program layer, are shown in Table 2 (only the table of expert 1 is shown as an example, and the other 8 experts’ scoring tables are referred to in the Supplementary Materials (Tables S1–S8). The matrix can be calculated by:
Table 2.
Tree A–B, B–C judgment matrix (Expert 1, from the municipal design industry).
The dij in the judgment matrix is generally scaled on a nine-point scale (see Table 3 for details), and the values were determined by a combination of nine experts weighting the coastal city’s municipal government website, government work reports, statistics, and their own experience.
Table 3.
Nine-point scale and its definition.
Step 2: Solve the eigenvalues of A–B and B–C moments. From the formula, we have CI = (λmax − n)/(n − 1) and CR = CI/RI; the consistency test is performed on the matrix, the CR (stochastic consistency ratio) is computed, and we get CR = 0.0913 < 0.1. All of them pass the consistency test, which indicates that the judgment matrix has satisfactory consistency, and its eigenvectors can be used for the quantitative description of the weights. See the detailed relationships between n and RI in Table 4:
Table 4.
Average random consistency index query table.
- (3)
- Since the scoring matrices of the 9 experts passed the consistency test, indicating that each expert’s opinion is valid, the weights obtained from each expert’s scoring matrix are considered to be of equal importance. Therefore, the weights of the 9 experts’ scoring matrices (see Tables S9–S11 in the Supplementary Material) assigned by the AHP method are summed and averaged directly, and the formula is shown below.where WAi is the average weight of an item, i; and Wij is the weight given by the jth expert for a given item, i, j = 1,2,3,.… 9; the resulting average weights of the evaluation indicators for trees, shrubs, and herbaceous plants are as follows (Table 5):
Table 5. Mean values assigned to the judgment matrix of the best plant-type indicators.
Taken as a whole.
- ①
- From the feature vector of the decision-making layer to the target layer, the environmental adaptability weight > ecological benefit weight > economic benefit weight, indicating that for the construction of rain gardens in sponge cities, the environmental adaptability of the plants and the ecological benefits brought by the plants should be emphasized, and the economic cost is an indicator that should be weakened.
- ②
- In terms of the weighting of the guideline case layer to the decision-making layer:
At the economic cost level, the maintenance cost weights are all high, indicating that the main concern in the economic cost of rain garden plants is the expense associated with subsequent maintenance.
At the eco-efficiency level, for trees and shrubs, the focus needs to be on the carbon sink benefit and pollutant reduction capacity. For herbaceous plants, the focus needs to be first on runoff control capacity and second on carbon sink capacity.
For building sponge city rain gardens, the focus itself needs to be on runoff control capacity. Herbaceous communities have the simplest structure, the smallest plant volume, the weakest root system, and the least total amount of rainwater retained and absorbed. Plus, herbaceous plants are sparsely branched, making it difficult to slow down the impact of rainwater, which can easily lead to surface runoff and soil erosion. Therefore, the herbaceous community’s ability to retain rainwater is weak. The structure of tree and shrub communities is more complex, the plant volume is larger, and the root systems are more developed, which can effectively retain and absorb rainwater. In addition, the canopy and branches of trees and shrubs can shield and slow down the impact of rainwater, reducing the formation of surface runoff. Therefore, for herbaceous plants with weak runoff control ability, it is more important to focus on selecting species with better runoff control ability. Trees and shrubs generally have better runoff control, so the focus should be on carbon sink benefits and pollutant reduction.
At the environmental adaptation level, all the plants are weighted higher for moisture tolerance, and all need to be focused on.
For the indicator of environmental adaptability of the guideline layer, the priority of trees is wind resistance > moisture resistance > pest resistance > drought resistance > acid and alkali resistance > barrenness resistance; the priority of shrubs is barrenness resistance > moisture resistance > acid and alkali resistance > pest resistance > wind resistance > drought resistance; and the priority of herbaceous plants is moisture resistance > pest resistance > drought resistance > barrenness resistance > acid and alkali resistance > wind resistance. It can be seen that moisture tolerance is a priority for all plants. A coastal city always has a humid climate, so drought tolerance is not a major concern for rain garden plants. The wind resistance priority is trees > shrubs > herbs, which is related to the biomorphology, with taller plants being relatively more wind resistant. The highest weighting of wind resistance in the tree criterion layer is due to the consideration of the climatic characteristics of coastal cities, which have high perennial wind values.
Barrenness resistance was given the highest weight in the shrub criterion layer. Shrub plants have generally become the main vegetation type in some barren areas, which is due to the fact that shrub plants generally have the characteristics of a well-developed root system, fast growth, and strong adaptability, which gives them strong barrenness resistance. The above findings also reflect that maintenance costs should be emphasized when building rain gardens in low-carbon cities. Focusing on the barrenness resistance of shrubs can also reduce maintenance costs. For herbaceous plants, the growing environment at the soil surface is closer to the changes in the natural environment, so the growing environment is unstable and susceptible to mechanical damage and invasion by pathogenic bacteria. Disease-prone herbaceous plants not only fail to deliver ecological benefits properly but also increase maintenance costs. Therefore, the herbaceous plant guideline layer indicators need to focus on disease and pest resistance in addition to moisture tolerance.
2.2.2. TOPSIS Build
- (1)
- Since the indicators include very small indicators and very large indicators, it is necessary to convert all the technical indicators to very large indicators in a uniform manner, i.e., indicator normalization. The lower the value of a technical indicator, the better its performance, so if the indicator is a very small indicator, it needs to be converted into a very large indicator using the method of very small indicators (Table 6).where x is the converted very large value; xmax is the maximum value of the very small indicator; and xi is the value of the technical indicator.
Table 6. Explanation of the score assigned to each indicator.
- (2)
- Standardize the indicators after normalization to eliminate the effect of the scale between different indicators.where j is each technology; xij is the normalized value of each technology indicator; and zij is the normalized value of the technology indicator.
- (3)
- Construct the normalization matrix, Z, by combining the normalized values.
- (4)
- Solve for the positive ideal solution, Z+, and the negative ideal solution, Z−, of the normalized matrix.where m is the number of technologies; Z+ is the value of the indicator with the best technical performance among the technical indicators; and Z− is the value of the indicator with the worst technical performance among the technical indicators.
- (5)
- Combine the technical indicator weights and calculate the distance, Di+ and Di−, ofthe technique from the positive and negative ideal solutions.
- (5)
- Calculate the closeness of the technique to the ideal solution (Si) and normalize it to get .
Table 7, Table 8 and Table 9 show the comprehensive scores and rankings of trees, shrubs and herbs obtained through our final analysis of AHP-TOPSIS model.
Table 7.
Table of AHP-TOPSIS evaluation results for trees.
Table 8.
Shrubs: AHP-TOPSIS evaluation results table.
Table 9.
Table of results of AHP-TOPSIS evaluation of herbal plants.
In order to assess the effect of the plants optimized by the AHP-TOPSIS model on the low-carbon construction of rain gardens in this coastal city, a rain garden in a local residential area was selected as an example of the assessment of the enhancement effect after a field visit. As shown in Figure 1 (left), the area of the rain garden in this residential area is about 60 m2, and there are 6 kinds of plants in total, including 1 Bauhinia variegata L., 1 Chukrasia tabularis A. Juss, 5 Codiaeum variegatum var. pictum, 5 Allamanda cathartica Linnaeus, and about 400 herbaceous plants, including roughly 500 Axonopus compressus (Sw.) Beauv and 80 Monstera deliciosa Liebm. According to the previous optimization results, the herbaceous plants of Axonopus compressus (Sw.) Beauv and Monstera deliciosa Liebm have high scores, but the other plants are not ranked as high in the overall score. It is assumed that all the existing plants are replaced with the best plants, and the number of plants has not changed. As shown in Figure 1(right), the total number of plant types in the rain garden after optimization is also 6, including trees such as Ficus altissima Blume and Bischofia javanica B, shrubs such as Pittosporum tobira and Ficus microcarpa ‘Golden Leaves, and herbaceous plants such as Axonopus compressus (Sw.) Beauv and Philodendron bipinnatifidum Schott ex Endl.
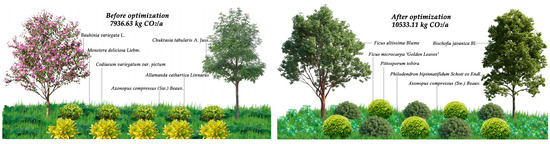
Figure 1.
Comparison of CO2 fixation before and after optimization of a rain garden in a community in the coastal city.
Using the carbon sink benefit data obtained from the previous statistics and the carbon sink calculation formula shown below, the initial total carbon sink was 7936.63 kg CO2/a, while the total carbon sink after the replacement was 10,533.11 kg CO2/a, an increase of 32.72% compared with the same period of the previous year. This indicates that the carbon sinks were significantly increased after most of the plants were replaced. It shows that increasing carbon sinks through plant species optimization not only shortens the time to neutralize the carbon impacts of rain garden construction but also improves the carbon reduction effect in a more long-term operation process. This example only analyzes the low-carbon emission reduction effect brought by the optimization, but the optimization has not yet taken into account the enhancement effect of pollution control ability, the environmental adaptability of plants, as well as biodiversity, the aesthetic value brought to society, and other aspects, which are also benefits that need to be considered in depth in the future research.
where CT is the total carbon sink, i.e., total fixed CO2 in CO2 kg/year; Ti is the total number of trees of species i; Bi is the amount of CO2 fixed per plant in kg CO2/a/plant for the ith trees; Sj is the total number of shrubs of species j; Bj is the amount of CO2 fixed per plant in kg CO2/year/plant for the jth shrubs; Hk is total number of herbaceous plants of species k; and Bk is the amount of CO2 fixed per plant in kg CO2/year/plant for the kth herbaceous plants.
3. Conclusions
In this paper, the AHP-TOPSIS model was used to construct an evaluation model to support plant selection for the construction of low-carbon rain gardens in a coastal city in China. In this paper, the investigated rain garden plants are classified into three major categories: trees, shrubs, and herbs: the top three best trees are Bischofia javanica Bl, Ficus altissima Blume, and Larch; the top three best shrubs are Pittosporum tobira, Ficus microcarpa ‘Golden Leaves, and Spider orchid; and the top three best herbs are Axonopus compressus (Sw.) Beauv, Philodendron bipinnatifidum Schott ex Endl, and Monstera deliciosa Liebm.
As mentioned above, the AHP-TOPSIS model can be somewhat subjective. For example, the pollutant reduction capacity of plants is evaluated more objectively using fieldwork data.
Therefore, in future research, on the one hand, we could consider intensifying fieldwork, such as conducting rain garden plant tracking surveys and plant physiological and ecological experiments, as well as the screening of wild native plants, to provide more objective data to support the selection of rain garden plants in China’s coastal areas. On the other hand, optimization of the model could be considered. For example, fuzzy theory can be introduced into the AHP model to take into account the uncertainty of the decision makers about the relationship between the guidelines and improve the ability to deal with more qualitative information, such as social benefits, so that the evaluation index system can be enriched. The TOPSIS model could also be extended to analyze the relevance of the evaluation index system, which could avoid the problem of distortion of the evaluation results under the influence of multiple indicators and improve the practicability of the evaluation model.
Supplementary Materials
The following supporting information can be downloaded at: https://www.mdpi.com/article/10.3390/su16052097/s1, Table S1: Tree A-B, B-C judgment matrix (Expert 2, Sscholar in the field of environment); Table S2: Tree A-B, B-C judgment matrix (Expert 3, Sscholar in the field of environment); Table S3: Tree A-B, B-C judgment matrix (Expert 4, from the environmental protection industry); Table S4: Tree A-B, B-C judgment matrix (Expert 5, from the environmental protection industry); Table S5: Tree A-B, B-C judgment matrix (Expert 6, from the landscape design industry); Table S6: Tree A-B, B-C judgment matrix (Expert 7, from the landscape design industry); Table S7: Tree A-B, B-C judgment matrix (Expert 8, from the plant ecological protection industry); Table S8: Tree A-B, B-C judgment matrix (Expert 9, from the plant ecological protection industry); Table S9: The final weight distribution of the ratings given by 9 experts to the tree matrix; Table S10: The final weight distribution of the ratings given by 9 experts to the shrub matrix; Table S11: The final weight distribution of the ratings given by 9 experts to the herbaceous plant matrix.
Author Contributions
Conceptualization, Z.Z. and S.H.; methodology, Z.Z.; software, J.C.; validation, L.D. and X.Z.; formal analysis, Z.Z.; investigation, J.C.; resources, X.L.; data curation, Z.Z.; writing—original draft preparation, Z.Z.; writing—review and editing, Z.Z.; visualization, J.C.; supervision, L.D.; project administration, X.L. and H.D.; funding acquisition, H.D. All authors have read and agreed to the published version of the manuscript.
Funding
This work was supported by the National Key R&D Program (No. 2019YFA0210404); National Natural Science Foundation of China Youth Fund Project (No. 22006040); Characteristic Innovative Research Project for Higher Education Teachers (No. 2022XJZZ02); and the Shantou National Sponge City Construction Demonstration City Technical Services Project (GDJC220116).
Institutional Review Board Statement
Not applicable.
Informed Consent Statement
Not applicable.
Data Availability Statement
The data are contained within the article.
Conflicts of Interest
Authors Jian Chen, Songlei Han, Lei Ding were employed by the company Shanghai Municipal Engineering Design Institute (Group) Co., Ltd. Author Xiaoqing Zhao was employed by the company Shantou Municipal Government Investment Project Agent Construction Management Center. The remaining authors declare that the research was conducted in the absence of any commercial or financial relationships that could be construed as a potential conflict of interest.
References
- Feng, J.; Yang, Y.; Li, J. Optimization of the Low-Impact Development Facility Area Based on a Surrogate Model. Water Resour. Manag. 2023, 37, 5789–5806. [Google Scholar] [CrossRef]
- Lu, H.; Wang, H.; Wu, Q.; Luo, H.; Zhao, Q.; Liu, B.; Si, Q.; Zheng, S.; Guo, W.; Ren, N. Automatic Control and Optimal Operation for Greenhouse Gas Mitigation in Sustainable Wastewater Treatment Plants: A Review. Sci. Total Environ. 2023, 855, 158849. [Google Scholar] [CrossRef]
- Suzuki, M.; Kanie, N.; Iguchi, M. New Approaches for Transitions to Low Fossil Carbon Societies: Promoting Opportunities for Effective Development, Diffusion and Implementation of Technologies, Policies and Strategies. J. Clean. Prod. 2016, 128, 1–5. [Google Scholar] [CrossRef]
- Zhao, L.; Mao, G.; Wang, Y.; Du, H.; Zou, H.; Zuo, J.; Liu, Y.; Huisingh, D. How to Achieve Low/No-Fossil Carbon Transformations: With a Special Focus upon Mechanisms, Technologies and Policies. J. Clean. Prod. 2017, 163, 15–23. [Google Scholar] [CrossRef]
- Zhuang, G.Y. Challenges and Countermeasures for Achieving China’s “Dual Carbon” Goals. People’s Trib. 2021, 50–53. [Google Scholar]
- Chi, H.; Wang, X. Construction of Dual-Carbon Goal Realization Path Based on Fractal Theory. E3S Web Conf. 2022, 358, 02007. [Google Scholar] [CrossRef]
- Zhao, Y.; Cai, T.; Sun, R.; Ni, Z.; Zhang, T. Review on sponge city research: From hydrological process to ecological restoration. Acta Ecol. Sin. 2019, 39, 4638–4646. [Google Scholar]
- Xing, Y.J.; Chen, T.L.; Gao, M.Y.; Pei, S.L.; Pan, W.B.; Chiang, P.C. Comprehensive Performance Evaluation of Green Infrastructure Practices for Urban Watersheds Using an Engineering-Environmental-Economic (3E) Model. Sustainability 2021, 13, 4678. [Google Scholar] [CrossRef]
- Morash, J.; Wright, A.; LeBleu, C.; Meder, A.; Kessler, R.; Brantley, E.; Howe, J. Increasing Sustainability of Residential Areas Using Rain Gardens to Improve Pollutant Capture, Biodiversity and Ecosystem Resilience. Sustainability 2019, 11, 3269. [Google Scholar] [CrossRef]
- Burszta-Adamiak, E.; Biniak-Pieróg, M.; Dąbek, P.B.; Sternik, A. Rain Garden Hydrological Performance–Responses to Real Rainfall Events. Sci. Total Environ. 2023, 887, 164153. [Google Scholar] [CrossRef]
- Johnston, M.R.; Balster, N.J.; Thompson, A.M. Vegetation Alters Soil Water Drainage and Retention of Replicate Rain Gardens. Water 2020, 12, 3151. [Google Scholar] [CrossRef]
- Zhang, Z.; Zhang, Y.; Li, J.; Sun, Y.; Liu, Z. Pollutant Accumulation and Microbial Community Evolution in Rain Gardens with Different Drainage Types at Field Scale. Sci. Rep. 2024, 14, 2. [Google Scholar] [CrossRef] [PubMed]
- Yuan, J.; Dunnett, N. Plant Selection for Rain Gardens: Response to Simulated Cyclical Flooding of 15 Perennial Species. Urban For. Urban Green. 2018, 35, 57–65. [Google Scholar] [CrossRef]
- Peng, Y.; Wang, Y.; Chen, H.; Wang, L.; Luo, B.; Tong, H.; Zou, Y.; Lei, Z.; Chen, S. Carbon Reduction Potential of a Rain Garden: A Cradle-to-Grave Life Cycle Carbon Footprint Assessment. J. Clean. Prod. 2024, 434, 139806. [Google Scholar] [CrossRef]
- Yang, Q.; Yu, X. Evaluation of Rural Water Environment Governance in Changzhou. IOP Conf. Ser. Earth Environ. Sci. 2021, 804, 042026. [Google Scholar] [CrossRef]
- Zorpas, A.A.; Pociovălişteanu, D.M.; Georgiadou, L.; Voukkali, I. Environmental and Technical Evaluation of the Use of Alternative Fuels through Multi-Criteria Analysis Model. Prog. Ind. Ecol. 2016, 10, 3. [Google Scholar] [CrossRef]
- Li, X.; Meng, X.M.; Hao, R.F.; Li, B.; Ji, X.D. Demonstration and Comprehensive Benefit Analysis of Slope Protection Project in Ecological and Clean Small-Watersheds in Changping District of Beijing. Acta Sci. Circumstantiae 2021, 41, 29–38. [Google Scholar]
- Anaokar, G.; Khambete, A.; Christian, R. Evaluation of a performance index for municipal wastewater treatment plant using MCDM–TOPSIS. Int. J. Eng. Technol. 2018, 4, 715–726. [Google Scholar] [CrossRef]
- Rashid, A.R.M.; Bhuiyan, M.A.; Pramanik, B.; Jayasuriya, N. A Comparison of Environmental Impacts between Rainwater Harvesting and Rain Garden Scenarios. Process Saf. Environ. 2022, 159, 198–212. [Google Scholar] [CrossRef]
- Venvik, G.; Boogaard, F. Infiltration Capacity of Rain Gardens Using Full-Scale Test Method: Effect of Infiltration System on Groundwater Levels in Bergen, Norway. Land 2020, 9, 520. [Google Scholar] [CrossRef]
- Chen, Y.H.; Liao, J.H.; Qin, S.N. Studies on Photosynthetic Characteristics and Carbon Fixation and Oxygen Release Capabilities of 19 Garden Plants in Changsha Area. J. Cent. South Univ. For. Technol. 2012, 10, 116–120. [Google Scholar]
- Zhu, Y.R.; Li, Q.Q.; Zhu, Z.L. Calculation of carbon sink benefits of tree species in residential areas and environmental optimization and improvement: Taking Dingjiazhuang, Nanjing as an example. J. Cent. South Univ. For. Technol. 2023, 43, 129–139. [Google Scholar]
- Ge, L.L.; Meng, Q.Q.; Lin, Y.; He, Z.M.; Qiu, L.J.; Hu, H.T. Carbon Storage and Its Allocation to Different Plantations in a Coastal Sandy Area Chinese. Chin. J. Appl. Environ. Biol. 2018, 24, 723–728. [Google Scholar]
- Xu, H.T.; Wang, L.Q.; Shen, J. Plant and Soil Organic Carbon Pools in a Constructed Wetland of Shatianhu River. Chin. J. Ecol. 2011, 30, 1083–1090. [Google Scholar]
- Chen, M.; Zhang, C.X.; Sun, X.L. A Study on the Carbon Sequestration Capacity of Eleven Aquatic Macrophytes. South Chn. Agri. 2018, 12, 14–17. [Google Scholar]
- Zhang, Q.Y.; Lv, W.Y.; Xu, B.Q. Study on the Calculation of Carbon Sequestration Capacity of Urban Green Space in North China. Environ. Prot. Sci. 2021, 40, 41–48. [Google Scholar]
- Tang, Y.; Tong, C.F.; Liu, M.Y. Seasonal Variations of Carbon, Nitrogen, Phosphorus Stoichiometry of Four Emergent Hydrophytes in Jinze Reservoir, Shanghai. Acta Ecol. Sin. 2020, 40, 4528–4537. [Google Scholar]
- Lei, X.J. Research on Technology of Carbon Reduction and Haze Elimination by Substituting Fossil Energy with Fast-Growing Herbaceous Plants. Environ. Eng. 2014, 151–156. [Google Scholar]
- Chen, M.; Liang, R.J.; Song, H.L.; Sang, B.; Chen, J. Analysis of Carbon Fixation Ability of Typical Vegetation in Wuhe Wetland. J. Anhui Agric. Sci. 2020, 48, 62–66. [Google Scholar]
- Chen, Y.; Yan, S.J.; Song, W.R.; Ma, Y.; Chen, X.J.; Lin, S.Z. Study on Carbon Storage and Carbon Sink Function of 4 Ornamental Grasses Planted in Urban Areas of Fujian. J. For. Environ. 2013, 33, 322–325. [Google Scholar]
- Gong, S.M. Net Carbon Sink and Economic Value of Common Garden Plants in Zhengzhou City. J. Henan For. Sci. Technol. 2019, 39, 21–25. [Google Scholar]
- Li, Z.Q.; Lin, W.; Qi, Y.Q.; Pan, Y.J.; Chen, Y.L. Dynamic Change of Vegetation and Carbon Sink Economic Value of People’s Park in Guangzhou from 2008 to 2018. South China For. Sci. 2020, 48, 28–32. [Google Scholar]
- Lin, W.; Bai, Q.; Chen, X.; Liang, D.; Chen, Y.; Xue, K.N.; He, B.X.; Wen, S.; Lian, H.; Tang, C. Construction of the Carbon Sink Capacity Evaluation System of Main Afforestation Tree Species in South China and Selection of the Fine Carbon Sink Species. J. Southwest For. Univ. 2020, 40, 28–37. [Google Scholar]
- Lin, X.; Lin, C.F.; Liu, S.Q.; Li, L.F. Carbon Fixation and Oxygen Release of 18 Shrub Greening Trees. Chin. J. Trop. Agri. 2014, 34, 30–34. [Google Scholar]
Disclaimer/Publisher’s Note: The statements, opinions and data contained in all publications are solely those of the individual author(s) and contributor(s) and not of MDPI and/or the editor(s). MDPI and/or the editor(s) disclaim responsibility for any injury to people or property resulting from any ideas, methods, instructions or products referred to in the content. |
© 2024 by the authors. Licensee MDPI, Basel, Switzerland. This article is an open access article distributed under the terms and conditions of the Creative Commons Attribution (CC BY) license (https://creativecommons.org/licenses/by/4.0/).