Article

Sustainability of the Food Industry: Ecological Efficiency and Influencing Mechanism of Carbon Emissions Trading Policy in China

School of Agriculture Economics and Rural Development, Renmin University of China, Beijing 100872, China
*
Author to whom correspondence should be addressed.
Sustainability 2024, 16(5), 2059; https://doi.org/10.3390/su16052059
Submission received: 17 January 2024 / Revised: 23 February 2024 / Accepted: 29 February 2024 / Published: 1 March 2024
(This article belongs to the Special Issue Sustainability in the Food Industry)

Abstract

:
As an important factor affecting ecological sustainability, the food industry’s ecological efficiency (EE) deserves great attention and control. In 2013, China implemented a carbon emissions trading policy (CETP) to limit carbon emissions from various industries to promote the optimization of the ecological environment. To explore the ecological sustainability of China’s food industry, identify the factors affecting the EE of the food industry, and study the influence heterogeneity and influencing mechanisms, the impact of the CETP on the food industry, which emits high volumes of greenhouse gasses, requires evaluation. Many scholars have studied the policy’s effect from the perspective of EE, but they have ignored the food industry, which is the main carbon emitting sector, and there is a lack of heterogeneity analyses of the influencing factors. This study reviewed the implementation process and characteristics of the CETP in the past decades. Using provincial panel data from 2003 to 2019, this study measured the EE in the food industry through the difference-in-difference model, evaluated the emission reduction and economic effects of the CETP on the food industry, characterized the heterogeneity of the policy’s effectiveness, and analysed its mechanism using three-stage mediating regression. The results showed that (1) the CETP significantly affected the food industry’s EE, which increased by 38.3% on average in experimental provinces compared with non-experimental provinces. (2) For the food industry, the policy’s effect was most significant in the food manufacturing and tobacco subsectors, and these subsectors in the experimental provinces increased by 66.0% and 39.7%, respectively; meanwhile, the policy’s effect was not significant in agriculture and subsidiary food processing and beverage manufacturing. By industrial area, the policy’s effects were significantly higher in the eastern region compared with the central and western regions. The influence on the food industry’s EE in the eastern region was close to 150%, while in the central and western regions, it was not significant. (3) The CETP promoted the food industry’s EE by improving energy consumption structure and technological innovation. The proportion of coal consumption decreased by 6.34% on average, and the technological innovation level increased by 25.1% on average in the experimental provinces’ food industries. The research findings indicate that the CEPT is a good practice and worth spreading. For food industry enterprises with high carbon emissions, attention should be paid to low-carbon transformation through technological upgrading and management optimization. For policymakers, targeted policies are needed to establish a national unified carbon trading market so that the national carbon emissions can be controlled, and the gap between regional carbon emissions can be narrowed.

1. Introduction

Since the mid-20th century, industrial production has discharged large amounts of carbon dioxide, which is the main cause of the greenhouse effect and extreme weather [1,2]. The Intergovernmental Panel on Climate Change has stated that if humans continue to discharge carbon dioxide unchecked, by 2100, the global temperature will be four degrees higher on average compared with the pre-industrial era, which would seriously impact human health and survival [3]. Climate change caused by excessive carbon emissions is a common challenge facing all of mankind; it not only affects human living environments and the ecosystem, but more importantly, ultimately affects human sustainable development. Therefore, intervening in various industries to control carbon emissions is important for human society.
As the world’s most populous country and one of the major agricultural products countries, reducing carbon emissions is of great importance for China. Specifically, for the food industry, the greenhouse gases generated by traditional food production in China can reach 17% of the world’s total [4]. On the one hand, in the production of food crops, China consumes 40% of the world’s fertilizer, making it the largest fertilizer user [5,6], and the excessive use of fertilizer will directly lead to excessive emissions of carbon dioxide [7]. On the other hand, since 1985, China’s output of livestock products has been the first in the world, and the average annual carbon emissions of China’s livestock industry are increasing at a rate of 2.2% [8]. China’s food industry activities account for 16–17% of China’s total greenhouse gas emissions, significantly higher than the global average of 13.5% [9]. To address the risk of excessive carbon emissions, the Chinese government solemnly pledged to adopt strong policies and measures to promote energy conservation and emission reduction, and strive to achieve the carbon dioxide emissions peak by 2030 and carbon neutrality by 2060 (“double carbon” goal) at the United Nations General Assembly [10]. Subsequently, the Chinese government implemented several policies, of which the most extensive and influential is the carbon emissions trading policy (CETP), which was first implemented in 2013. Through the CETP, the government scientifically sets the total allowable carbon emissions for a certain period and allots carbon emission rights to economic entities based on distribution criteria. Economic entities can reduce their own carbon emissions or buy allowances on the carbon emissions trading market (CETM) to meet their targets during the compliance period [11]. Approximately 20 industries and 3000 enterprises are included in the CETM across various regions, with a cumulative total of over 450 million Mg of carbon emissions traded and a turnover of over CNY 10 billion [12]. The CETP is expected to become an important tool for addressing environmental problems in China.
As the food industry is one of the largest industries, the impact of the CETP on this industry merits attention. From three aspects, the impact of the CETP on China’s food industry is worth researching. First, the food industry accounts for over one-third of the anthropogenic greenhouse gas emissions worldwide [13]. The food industry can be subdivided into four aspects: animal husbandry, crop production, land occupation and the production supply chain [14]. Among them, the highest carbon emissions are from livestock, accounting for up to 31% of all agricultural carbon emissions [15]; the methane released by ruminants through intestinal fermentation is the highest contributor compared to other greenhouse gases [16], with a Global Warming Potential (GWP) 25 times that of carbon dioxide [17]. Other carbon emissions involved in production include methane from crop production and nitrous oxide decomposition when nitrogen fertilizer is applied to farmland, as well as loss of carbon sequestration due to expansion or intensive treatment of farmland [18,19]. In addition, in the food production and supply stage, there is also a large amount of carbon associated with electricity and energy consumption, food waste, and refrigerant escape, among which the main compounds nitrous oxide and difluoromethane have 265 times and 1760 times the GWP of carbon dioxide [20]. Thus, the food industry has a greater potential for carbon reduction than other industries. Second, the food industry has a high degree of standardization. On the one hand, food production uses agricultural products as raw materials, and in order to ensure food safety, standardized planting and breeding have become the starting point of the food industry. Standardized planting and breeding need to consider the soil, air, water, fertilizer, labour force, etc. There have been many preliminary research foundations for input calculations for these production factors, which provide a reference for the carbon emissions calculation [21,22,23]. On the other hand, for the food industry, there are strict standards in the production process such as disinfection methods, the use of food additives and so on, which means that the output difference of enterprises will not be too large, that is, the carbon emissions are “calculable” [24]. Moreover, China’s food safety department also has specific regulations on food quality detection tools and detection processes and has a unified quantitative standard for each food product. Therefore, the food industry is easy to quantify and control, and the CETP effect is easier to measure. Finally, the impact of the food industry is widespread. The food industry not only affects people’s daily lives, but also ecosystems. People need to obtain material and energy from food through their diet to ensure the normal operation of life. Therefore, some scholars believe that food is the first factor in determining physical health [25]. The food web structure formed by the food relationship between humans and nature enables the food industry to connect people’s daily life with ecological resources such as solar energy, water, soil and air, thus creating a relationship with the sustainability of the ecosystem [26]. Therefore, studying the CETP’s effects and mechanisms in China’s food industry has great theoretical and practical significance.
There are many studies on carbon emissions in China, but few studies have empirically analysed the impact of the CETP on the food industry. First, most of the existing studies qualitatively discussed the carbon emission reduction of the food industry, and there is a scarcity of empirical data to examine the impact of one policy on the whole industry. Second, the study time span is short and cannot fully reflect the long-term trend of China’s CETP influence. In addition, the research methods are relatively simple. Many scholars only estimate and analyse the carbon emissions of the food industry using the factor method, do not use models to optimize the data results, rarely pay attention to the impact mechanism of policies, or only consider the carbon emission reduction results of specific regions, without focusing on specific industries.
Based on this, this study used China’s provincial panel data from 2003 to 2019 to specifically discuss the sustainability of the food industry in China. Referring to the ecological efficiency (EE) index calculation ideas given by the World Business Council for Sustainable Development (WBCSD), the impact of the CETP on the food industry was tested empirically, and the policy’s impact was discussed by subindustry. Then, the robustness test was used to further optimize the empirical results and strengthen the credibility of the analysis. Finally, the mechanism of the CETP’s impact on the EE of the food industry was analysed to evaluate the sustainability policy more effectively. Through the above analysis, this study aimed to achieve two research objectives: on the one hand, from a theoretical level, apply the classical policy evaluation methods in economics to the application of CETP in the food industry, and expand the application scenarios and boundaries of the theory; on the other hand, through heterogeneity and mechanism analyses, useful suggestions are provided for the food industry to improve its EE from the practical level.
This research mainly supplements the existing literature in two aspects: research perspective and research content. The first innovation is the research perspective. As a new perspective, this study used the economic–environment ratio method to measure the Chinese food industry’s EE at the provincial level, and comprehensively evaluated the economic effect and emission reduction effect of the CETP on the food industry. The second innovation is the research content. Previous studies on the CETP mostly focused on the policy’s effects, with few analyses of the impact mechanism. This research not only examined the degree of the CETP’s impact on the Chinese food industry’s EE, but also used the mediating effect model to investigate the impact mechanism of the CETP from the two perspectives of energy consumption structure and technological innovation. The internal conduction logic is explained.

2. Literature Review

2.1. Carbon Emissions Trading Policy

Carbon emission trading refers to the market trading of greenhouse gas emission quotas or credits for the purpose of controlling greenhouse gas emissions. In this process, the buyer obtains the corresponding carbon emission quota or credit by paying the seller so as to limit uncontrolled carbon emissions in a market. The implementation of carbon emission trading cannot be separated from the CETM.
The world’s first CETM was the European Union Emissions Trading System (EU-ETS) [27] that was launched in 2005. Subsequently, the United States, Japan, India and China established their own CETMs, and the number of CETMs worldwide is increasing. Currently, there are over 20 CETMs around the world, and the gross domestic product (GDP) of the regions they cover accounts for over one-third of the global GDP [28]. The CETMs have gradually become the major means of energy conservation and emission reduction. China’s CETM opened in 2013 with experimental projects in Beijing, Tianjin, Shanghai, Shenzhen, Chongqing, Guangdong and Hubei.
The CETMs in different regions of China differ in their enterprise thresholds, quotas, distribution methods and penalty mechanisms. However, they are based on the carbon emission trading method, the allocation of carbon emissions of each unit, and in the pilot process to constantly improve the carbon emission trading standards and provide experience for the establishment of a national carbon trading mechanism. Table 1 shows the regional CETM conditions.
There are different types of industries in a region, but they are affected by administrative power and resource allocation; when a strong policy is implemented, almost every industry in the region will be affected to a certain extent [29]. In this study, the CETP is a good example. When the experimental provinces carry out carbon emission trading, the food industry in the region will naturally be affected by it [30]. Moreover, among the experimental provinces in China in 2013, most were provinces with a large food industry (such as Guangdong and Tianjin), and the food industry accounted for a high proportion of their industrial output value [31]. Therefore, the effect of the CETP on the food industry is worthy of a focused analysis.

2.2. Carbon Emissions Trading Policy’s Effects

The current studies on the CETP’s effects have mainly focused on both emission reduction and ecological economic effects.

2.2.1. Emission Reduction Effect

The emission reduction effect is the CETP’s original purpose and the direct outcome of the policy. Researchers have proposed two main views on this effect.
One view is “reversed transmission emissions reduction”. Scholars posit that policy intervention can increase enterprises’ pollutant discharge costs and force them to improve production technology and reduce resource consumption, ultimately achieving the policy goal of reduced carbon emissions. Wang et al. (2022) argue that strict environmental regulations can effectively reduce resource consumption and carbon emissions, thereby improving environmental quality [32]. Zhang et al. (2021) constructed a computable general equilibrium (CGE) model to analyse the effect of carbon pricing policies and found that, under appropriate target constraints, carbon pricing policies can effectively reduce the carbon emission intensity and improve the environmental quality while promoting economic growth [33]. Chen and Lin (2020) used the synthetic control method to construct a virtual control group and found that the carbon emissions in the experimental areas were significantly lower than those in a virtual control group after CETP implementation, indicating that the policy has significant emission reduction effects [34].
The other view is the “green paradox”, in which scholars argue that implementing environmental policies will not have a significant effect but may instead exacerbate environmental problems. The green paradox, first proposed by Sinn (2008), refers to a situation in which implementing environmental policies will not only fail to achieve the expected goals but also accelerate fossil energy consumption in the short term, thereby exacerbating the greenhouse effect [35]. Some scholars argue design flaws in CETMs may lead to a green paradox for the CETP, that is, as an artificially designed and controlled market, CETMs have high regulatory costs and moral hazard. Due to the volatility of carbon prices, the financialization of carbon emission quotas makes it difficult for regions with insufficient financial risk supervision capacity to cope with unpredictable market behaviour, and the CETP effect is limited [36]. Werf and Maria (2012) found that imperfect environmental regulatory policies lead to a substantial short-term increase in carbon emissions [37]. Frederick (2013) argues that, although the CETP can promote green technology development, it also accelerates fossil fuel consumption [38]. In a study on the US Clean Air Act, Maria et al. (2014) find that implementing environmental policies caused a significant decline in coal prices, which led to an increase in coal consumption and had results opposite to the policy’s expected effect [39].

2.2.2. Ecological Economic Effects

The policy ecological economic effects included the “compliance costs” and “compensation for innovation” views.
The “compliance costs” view argues that CETP implementation will require enterprises to spend more money on pollution control, thereby making enterprises deviate from the “pareto optimum”, and some may reduce or stop production to meet their emission reduction targets [40], which affects economic growth. Chapple et al. (2013) used a residual income valuation model to compare the market value of Australian companies with high carbon emissions before and after CETP implementation and found that the cost of these firms complying with the policy led to an approximately one-tenth decrease in their market value [41]. Gerlagh et al. (2021) used a CGE model to find that the CETP has a negative economic impact while promoting energy conservation and emission reduction, and increased carbon prices will further exacerbate the CETP’s disincentive effect on the economy [36].
In the “compensation for innovation” view, environmental regulation policies (e.g., CETPs) can use cost pressure to force enterprises to carry out technological innovation, thereby improving productivity and promoting green, high-quality development. In a study of an environmental policy, Miao et al. (2020) found that the more enterprises invest in energy conservation and emission reduction, the more likely they are to generate technological gains, resulting in a win–win situation for economic benefits and environmental quality [42]. Simon et al. (2020) found that a CETP can improve technological innovation capacity in implementing regions and create a good innovation atmosphere for enterprises [43]. Wang and Wei (2020) analysed the costs and benefits of energy conservation and emission reduction implementation in Organisation for Economic Co-operation and Development countries and found that policies can cause short-term production losses but lead to long-term economic and environmental co-development through technological progress [44]. Yuan et al. (2020) evaluated the CETP’s effects in China and found that the policy can guide enterprises to increase green innovation investment and develop green technologies, which can promote green economic growth [45].

2.3. Ecological Efficiency

EE reflects the unity of economic efficiency and environmental benefits, and effectively integrates the sustainable development goals of enterprises into regional development planning, which has been recognized and accepted by many enterprises and has become an important reference for the relevant policymakers.

2.3.1. Calculation Method

The economic concept of EE, first proposed by Schaltegger (1990), is the ratio of the economic value of production to the environmental burden caused during a certain period [46]. Subsequently, the WBCSD proposed the following formula [47]: ecological efficiency = economic value/environmental load. In this formula, the economic value is the total output of economic activities in a region; the environmental load includes both resource and energy consumption and environmental pollution emissions, including resource consumption at the beginning of production and pollution emissions at the end. Resource consumption can be measured by the quantity of non-renewable energy or water resources used, while pollution emissions can be measured using factors such as carbon dioxide emissions, solid and liquid waste, and various pollutant emissions. This method is also called the economic–environmental ratio method. Compared with the ecological footprint, stochastic frontier analysis and data envelopment analysis methods, the economic–environmental ratio method can better reflect the relationship between economic development and the environment [48,49,50,51].
EE measures policies’ effects in terms of the relationship between economic value and environmental impact. This requires the adverse impact of economic activities on the ecological environment to be minimized while ensuring healthy economic development. The key to improving EE is correctly handling the relationships between economic output, resource input and pollution prevention. EE can comprehensively measure economic efficiency and environmental quality and is, therefore, widely used by scholars to measure environmental policies’ effects.

2.3.2. Influencing Factors

EE is a comprehensive index used to measure economic development and environmental quality, and its influencing factors have the following main aspects.
(1)
Economic development. The state of the environment is closely related to the economic development level, and EE depends on the relationship between economic development and environmental quality [52]. Environmental pollution follows a process from low to high and then low with increasing economic growth (Environmental Kuznets Curve).
(2)
Industrial structure. Resource consumption and pollutant emissions are both related to industrial development, and different types of industries have different degrees of ecological impact [53]. In general, secondary industries, which mainly comprise industrial manufacturing, have the greatest energy consumption and cause more serious environmental pollution; the higher the proportion of secondary industries in a region, the lower the EE will be [54]. In contrast, tertiary industries, which are dominated by the service industry, have the least impact on resources and the environment, and increasing the proportion of tertiary industries helps improve the EE [55].
(3)
Urbanization level. Scholars have used various models and datasets to empirically test the relationship between urbanization level and EE from different perspectives, and the findings are generally consistent: the relationship between urbanization level and regional EE is U-shaped [56,57,58]. The impact of urbanization on EE follows a process of decreasing and then increasing.
(4)
Ageing populations. The increasing prominence of population ageing has also constrained EE and economic development around the world. Some scholars argue that population ageing and EE do not share a substantial impact relationship [59]. Others argue that increased ageing negatively affects EE [60,61]. More scholars believe that population ageing has a catalytic effect on EE [62,63,64], because the deepening of population ageing means that the demographic dividend gradually disappears, prompting enterprises to invest more in human capital and technological innovation for industrial transformation. Thus, the proportion of labour-intensive industries gradually decreases, environmentally friendly industries are ultimately enhanced, and national EE improves.
(5)
Technological progress. Technological progress mainly affects EE in two respects: (1) progress increases enterprises’ production technology efficiency and reduces resource consumption [65], and (2) progress in environmental protection technology can promote low-carbon and green production and reduce environmental pollution, thereby improving EE [66,67].
(6)
Other factors. Some scholars have examined influencing factors of EE in terms of fiscal decentralization [68], environmental regulation [69], industrial agglomeration [70], infrastructure [71] and the digital economy [72].
Through the literature review on the effect of the CETP on EE, it can be found that most scholars evaluate the emission reduction effect and economic effect of the CETP separately, and few studies have comprehensively evaluated its impact on the economy and environment. As a bridge between economic development and environmental quality, EE can reflect both the emission reduction and economic effects of the CETP; however, relatively few studies have used EE as an evaluation indicator to examine the policy’s effects. Furthermore, previous studies have often used empirical models to test the CETP’s effects and lack a systematic analysis of its impact mechanisms. Research on the impact paths of the CETP can provide effective suggestions for the government to improve CETM development and for enterprises to respond to policy. In addition, from the perspective of the research object, most of the current studies on the effect of the CETP are conducted from the regional level, and few scholars have conducted studies from the perspective of industries, while economic development is based on various industries. Therefore, it is crucial to examine the effect of the CETP in specific industrial fields from the industries’ perspective.
This study adds two aspects of research to the existing literature. First, based on provincial panel data from 2003 to 2019 in China, the food industry’s EE in Chinese provinces was measured using the economic–environmental ratio method, and the CETP’s effects on the food industry were estimated using a difference-in-difference (DID) model. Second, using a mediating mechanism model, the impact mechanism of the CETP’s effects on the food industry’s EE was examined.

3. Methodology

3.1. Model

3.1.1. DID Model

The DID is widely used as an effective method to assess the impact of policies [73,74,75], and it effectively addresses the pseudo-correlation problem when comparing outcomes before and after policy implementation. In addition, the DID method can successfully solve the problem of interaction between the explained variable and the explanatory variable, thus alleviating the endogeneity problem. This study used a DID model to evaluate the effects of China’s CETP on the food industry. On the one hand, the DID model can be used to avoid endogeneity problems to a large extent. Because policies are generally exogenous relative to microeconomic agents, there is no problem of reverse causality. Moreover, the fixed effect estimation in the DID model can alleviate the missing variable bias problem to a certain extent. On the other hand, under the traditional method, the policy’s effect is evaluated mainly by setting a dummy variable of whether the policy occurs or not and then conducting regression. In contrast, the DID model constructs the “difference” statistic reflecting the policy’s effect by comparing the difference between the control group and the treatment group before and after the policy implementation, which is more scientific and can estimate the policy’s effect more accurately. For this study, there will be a “difference” whether it is the experimental province, and there also will be a “difference” before and after the implementation of the CETP, so that it can be applied to the structure of “difference in difference”. Therefore, the DID model can effectively identify causal relationships and obtain unbiased estimates of the policy’s effects through regression analyses.
This study considered China’s CETP implemented in 2013 as a quasi-natural experiment, defining the six experimental provinces as the experimental group and the provinces not affected by the policy as the control group, and compared the between-group differences before and after the policy shock to reflect the CETP’s effects. We propose a DID model represented by Formula (1):
Y i t = α 0 + α 1 t r e a t e d i + α 2 t i m e t + α 3 t r e a t e d i t i m e t + α j x j t + ε i t
In Formula (1), i represents the region, t represents the time, and Y i t represents the food industry’s annual EE in each province. t r e a t e d i represents a dummy variable of a province, and if it is 1, it represents the experimental group of the CETP; if it is 0, it represents the other provinces. t i m e t represents a dummy variable of time; if it is 1, it represents the year after the policy experiment; if it is 0, it represents the year before the policy experiment. x j t represents the control variable of number j ; α 1 , α 2 , α 3 , and α j represent the estimated coefficients, respectively; α 0 represents the intercept term; and ε i t represents the residual term.

3.1.2. Mediating Mechanism Model

To more deeply research the mechanisms through which the CETP affects EE in the food industry, we incorporated the mediating effects into our methodology. This approach not only deconstructs the underlying mechanisms, but also assesses the relative contributions of multiple intermediaries, thereby providing nuanced insights into sustainable development policy. We adopted the classical mediating effect model originally proposed by Baron and Kenny, focusing on the role of energy consumption structure and technological innovation in the policy influence process, and established the following model [76]:
Y i t = α 0 + α 1 t r e a t e d i + α 2 t i m e t + α 3 t r e a t e d i t i m e t + α j x j t + ε 1 i t
M i t = β 0 + β 1 t r e a t e d i + β 2 t i m e t + β 3 t r e a t e d i t i m e t + β j x j t + ε 2 i t
Y i t = γ 0 + γ 1 t r e a t e d i + γ 2 t i m e t + γ 3 t r e a t e d i t i m e t + γ 4 M i t + γ j x j t + ε 3 i t
where M i t represents the mediating variable, and the meanings of the other variables are consistent with those in Formula (1). First, the model tests the policy dummy variable ( t r e a t e d i t i m e t ) effect on Y i t in Formula (2). If the coefficient is significantly positive, the policy enhances the food industry’s EE. Second, in Formula (3), the model tests the policy on the mediating variable M i t . If the coefficient β 3 is significant, the CETP has a significant impact on two mediating variables. Formula (4) considers the policy and mediating variables, and the model tests their effects on Y i t . If the coefficients γ 3 and γ 4 are both significant, the mediating variables have a significant effect on the food industry’s EE, and an indirect effect exists. Finally, comparing β 3 * γ 4 and γ 3 , if the signs of both parts are the same, this indicates a partial mediating effect; otherwise, it indicates a suppressive effect.
According to the setting of the models and the research objectives of this study, the analysis logic of the CETP’s impact on China’s food industry’s EE is shown in Figure 1.

3.2. Variable

3.2.1. Explained Variable

The explained variable in this study is the food industry’s EE, measured using the economic–environmental ratio method. As this research focuses on the impact of the CETP, the EE is the environmental efficiency related to carbon emissions and does not include other pollutant indices.
We referred to the calculation method of EE proposed by the WBCSD, that is, the ratio relationship between economic effect and environmental effect. EE is measured from the perspectives of reducing energy consumption and environmental pollution and expressed as resource efficiency (R) and environmental efficiency (P) [47,77]. The formulas are as follows:
R = Gross Industrial Output Value of food industry/Energy consumption of food industry
P = Gross Industrial Output Value of food industry/Carbon emissions of food industry
Therefore, in this research, the EE formula can be expressed as:
E E = R 2 + P 2

3.2.2. Explanatory Variables

The explanatory variable is the DID, which is implementation or non-implementation of this policy. The policy dummy variable in the models is set as t r e a t e d i t i m e t . The policy dummy variable is 1 if the year is after 2013; otherwise, it is 0. The significance level of the coefficient of the policy dummy variable reflects the CETP’s effects on the food industry’s EE.

3.2.3. Control Variables

The control variables can address the endogeneity problem caused by omitted variables and selection bias. According to the above, the factors influencing EE also include economic growth, industrial structure, urbanization, demographic structure and technological innovation level. The GDP per capita was used to control for regional economic level; the proportion of secondary and tertiary industries in the GDP was used to control for regional industrial structure; the proportion of urban population in the resident population was used to control for regional urbanization level; the ratio in the total population of those aged 65 and above to those between the ages of 15 to 64 was used to control for the regional population ageing level; and the number of patent applications was used to control for the regional technology innovation level.

3.2.4. Mediating Variables

To examine the influencing mechanism of the CETP’s effects on the food industry’s EE, the energy consumption structure and technological innovation level were selected as mediating variables to test the mediating path. The measurement of energy consumption structure was based on the proportion of coal resources consumed by the food industry in its total energy consumption, and the technological innovation level was based on the food industry’s regional research and development (R&D) expenditure.

3.3. Data

To conduct the analysis of the influence of the CETP on China’s food industry and ensure data continuity and availability, this study established a panel dataset for 30 provinces and cities in China (excluding Tibet, Hong Kong, Macao, and Taiwan) from 2003 to 2019, which was obtained from the Carbon Emissions Accounts and Datasets (CEADs) of China, China Statistical Yearbook, China Industrial Statistical Yearbook, China Energy Statistical Yearbook, China Statistical Yearbook on Science and Technology and each province’s statistical yearbook. Carbon emission data for the food industry were obtained from the CEADs, which provide the most authoritative data on carbon accounting in China. Other macroeconomic data (e.g., urbanization rate, industrial structure, GDP by province) were obtained from various statistical yearbooks. Table 2 displays the descriptive statistics for the variables.
Figure 2 shows the comparison of the carbon emissions, environmental efficiency, resource efficiency, and the food industry’s EE differences between the experimental and non-experimental regions. The total carbon emissions of the food industry in both groups showed a decreasing trend, while environmental efficiency, resource efficiency, and EE showed increasing trends. After CETP implementation in 2013, the treatment resulted in significant between-group differences. According to the above, considering its comprehensive reflection of the sustainability of the food industry, we will further focus on the role of the CETP in EE.

4. Data Analysis and Results

4.1. The Carbon Emission Trading Policy’s Effects on the Food Industry in China

4.1.1. Baseline Regression

The CETP’s effects on EE in the food industry were assessed using DID models. In Table 3, the simplest baseline regression model is shown in column (1), which estimates only the effects of the policy dummy variables on the food industry’s EE. Models (2)–(5) progressively include control variables: GDP per capita, proportion of secondary and tertiary industries, number of patent applications, urbanization rate, and proportion of older adult population. As can be seen from the data at the 5% significance level in Table 3, there was a statistically significant positive correlation between the CETP and EE in China’s food industry. The policy’s effect resulted in an average EE increase of about 0.4 units, with a coefficient value of 0.383 after adding the control variables. This provides strong evidence that the adoption of the CETP has significantly improved the EE in China’s food industry. The policy dummy variable coefficient signs and significance levels did not change when the control variables were gradually added and remained significantly positive. Thus, the DID model results are robust, and the CETP can significantly improve the food industry’s EE.
The finding that the implementation of the CETP can make industrial enterprises more environmentally friendly and sustainable is consistent with the relevant research conclusions of previous scholars [78,79]. Moreover, it can be seen that the CETP had a stronger effect in the food industry, which is reflected in the baseline regression as a higher level of significance and a larger coefficient for the policy dummy variables. This conclusion provides the basis for the subsequent research in this paper. In the following, we will specifically discuss the differences in the policy’s impacts and the influencing mechanism.

4.1.2. Parallel Trend Test

The validity of the DID model must satisfy the parallel trend precondition, in that differences caused by other policies or factors should be excluded to ensure that the EE trend changes between the experimental and control groups before policy implementation are consistent [80]. The purpose of this part of the test is to compare the extent to which the parallel trend assumptions of local food enterprises apply to the impact of the CETP in provinces with and without experimental programs. Figure 3 shows the trend of the EE changes in the food industry between 2008 and 2019. The left side of the dashed line shows that the trend before policy implementation was basically the same; starting from the CETP’s implementation in 2013, the food industry’s EE in the experimental provinces significantly increased compared to that in the non-experimental provinces. As can be seen from the trends shown in Figure 3, the CETP has had a considerable impact. This suggests that the changes in the dependent variables in the experimental group and the control group followed a parallel trend before the implementation of the policy.

4.2. Robustness Tests

4.2.1. PSM-DID

The implementation of the CETP can be seen as a non-randomized experiment. Using the DID method to evaluate the policy’s effect will inevitably introduce sample selection bias [81]. In addition, this study sample covers 30 provinces across China, and differences in their economic conditions and locations result in the selection of the experimental regions for policy implementation not being completely random. The propensity score matching (PSM) method can be used to match the treatment group sample with a specific control sample, thus approximating a quasi-natural experiment with near randomization [82]. In order to improve the quality of the sample and support the reliability of the research results, this study used PSM-DID as the main research method for estimation robustness. This method is also widely used in the assessment of environmental policies and has been proven to be effective [82,83].
In the PSM process, CETP implementation is used as an explanatory variable, and the control variables are set as matching covariates. Samples in the control group with characteristics similar to those in the experimental group are selected using radius matching, and samples that differ too much from the experimental group are removed, with 211 samples ultimately retained. These samples are then used to estimate the DID model, and Table 4 shows the regression results. The regression results showed that the PSM-DID coefficients of the policy dummy variables were not significantly different from the baseline regression results, and the coefficients were all significantly positive when the control variables were gradually added, indicating that the CETP had a significant positive impact on the food industry’s EE and that the baseline regression results are robust.

4.2.2. Placebo Test

(1)
Change in Policy Time
The core of the placebo test is to estimate the virtual treatment group or virtual policy time [80]. If the regression results of the estimators under different virtual methods are still significant, it indicates that the original estimation results are likely to be biased. To ensure that the changes in the food industry’s EE in the experimental provinces are caused by CETP implementation, a falsifiable test was conducted by changing the time of policy implementation. As the policy time advanced, the regression coefficient was not significant, indicating that the policy is effective, which inversely verifies the robustness of the results. The sample data after policy implementation were excluded, and then the DID model was estimated assuming policy implementation in 2006, 2008, and 2010. The results in Table 5 show that the coefficients of the policy dummy variables were all significant but negative, indicating that no other policies significantly improved the food industry’s EE before CETP implementation in 2013, further supporting the robustness of the previous findings.
(2)
Virtual Processing Groups
The robustness test was carried out with a counterfactual hypothesis that the experimental group and the control group were randomly disrupted; the same number of groups were extracted as the new “experimental group” to analyse the effect of the CETP, so as to minimize the influence of other potential variables and accidental errors on the relationship between the DID and dependent variables, and the reliability analysis of the previous results could also be realized [84]. First, the experimental group was randomly selected among 30 provinces, with the others comprising the control group. Then, the DID model was used for estimations. This process was repeated 500 times. Table 6 shows the regression results. The policy dummy variable coefficients were not significant for models (1)–(3), which inversely supports that the placebo test was successful and the effects of the CETP obtained above are robust.

4.3. Heterogeneity Analysis

It can be seen from the results of the baseline regression analysis that the CETP can improve the EE in China’s food industry. However, due to the characteristics of different subsector types and the economic base and resource endowment of different regions, the effects of the CETP in different subsectors and different regions are different. Therefore, we further studied the CETP on EE in different subsectors and regions of China’s food industry.

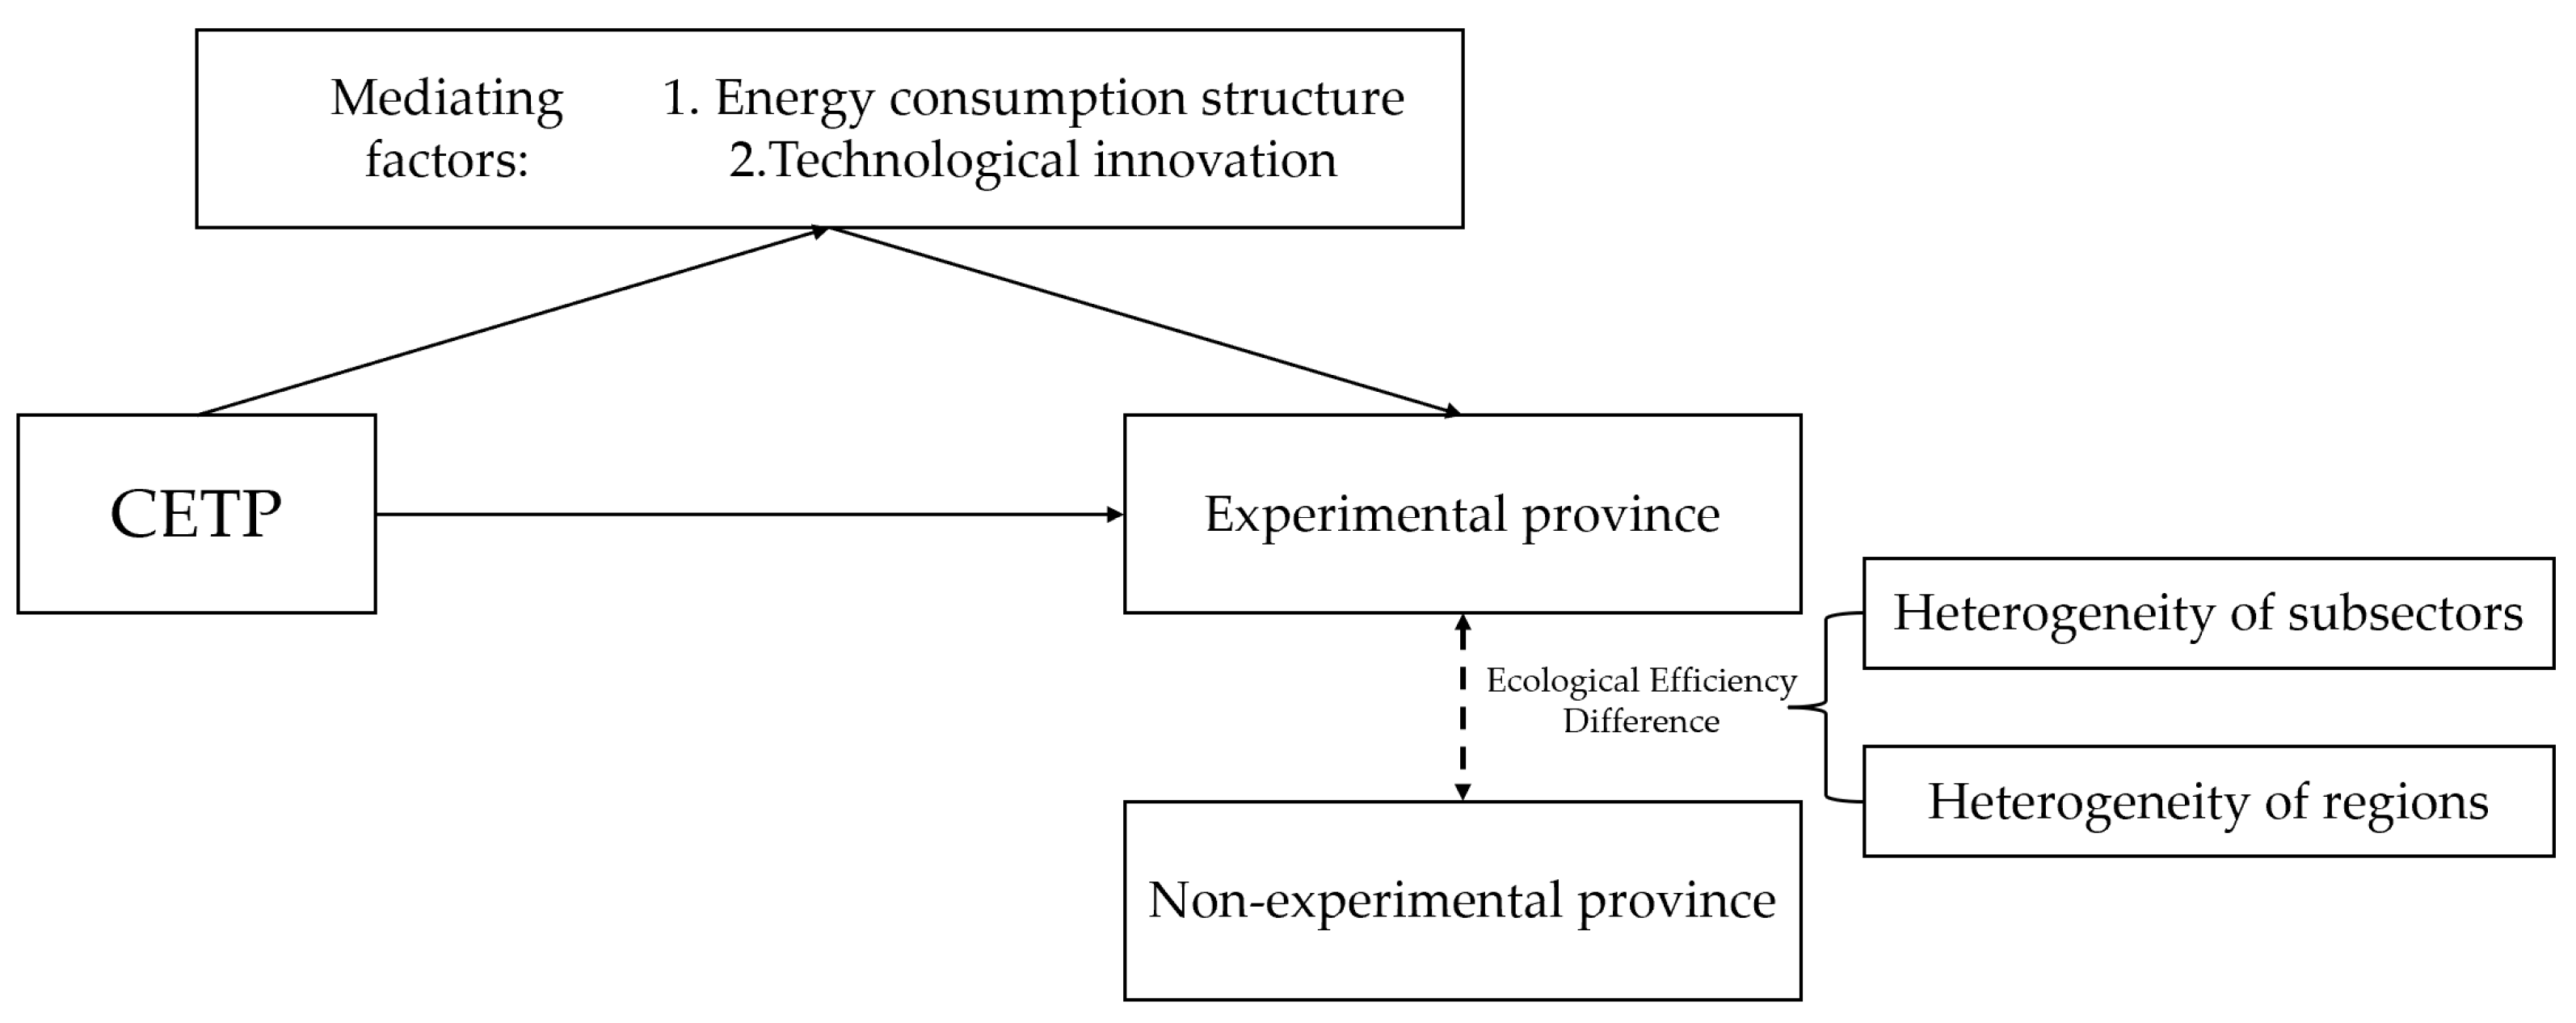
4.3.1. Heterogeneity of Subsectors

As we all know, different subsectors in the food industry have different carbon emission levels and degrees to which they are affected by policies. Based on this difference, the CETP may have different impacts on the EE of different food subsectors in China. According to the criteria of the China Statistical Yearbook, the food industry is subdivided into four categories: agricultural and subsidiary food processing, food manufacturing, beverage manufacturing, and tobacco. The CETP’s effects on the EE of these four subsectors were examined, and Table 7 shows the regression results.
Among the four food industry subsectors, the CETP had the greatest impact on the EE of food manufacturing, followed by tobacco, whereas the effects on agricultural and subsidiary food processing and beverage manufacturing were not significant. Several factors could explain this phenomenon, including differences in baseline carbon emissions of the different subsectors [85], differences in complexity of the production processes of the different subsectors [86], differences in sensitivity to policy changes/implementation [87], and different degrees of funding adequacy for technological innovation [88]. The food manufacturing industry was the most affected by the policy because it involves large-scale production and commodity circulation, which leads to a larger carbon emission baseline and circulation, and therefore, a better policy effect. Because the baseline amount and the amount of change are large, the marginal effect of the policy is more obvious, which has been previously confirmed by other scholars [89,90]. Further, tobacco is an industry that is strongly controlled by administrative forces in China; it has a close relationship with China’s tax revenue and is strictly controlled by the government [91], so its policy response is also relatively better. For other subsectors, the effect of the CETP was not significant.

4.3.2. Heterogeneity of Regions

China has significant regional differences in factors such as economic development, geography and environmental awareness. Thus, the CETP’s effects may vary, and the regional heterogeneity in the CETP’s impact on the food industry’s EE was examined.
The experimental provinces under investigation were divided into three distinct geographic regions: eastern, central and western. Among the experimental provinces, Guangdong, Shanghai, Tianjin, and Beijing are in the eastern region of China; Hubei is in the central region; and Chongqing is in the western region. The heterogeneity of regions analysis used the PSM-DID model to avoid selection bias [81]. Table 8 shows the regression results. The policy dummy variables for the eastern region were significantly positive, while those for the central and western regions were not significant, indicating that the CETP’s effects on the food industry’s EE were significantly better in the eastern region than in the central and western regions. In the more developed eastern regions of China, the advanced nature of the food industry and the rapid response to policy adjustments have once again been confirmed in our results. These results show that there are significant geographic differences in the relationships investigated.
These results could be due to several reasons. First, the food industry’s energy costs are highest in eastern China. To maximize profits, food enterprises will pay more attention to investing in low-carbon technological innovation, and the influence of technological spillover allows energy-efficient enterprises to sell their excess carbon emission quotas on the CETM, thereby improving the regional EE. The reduction in carbon emissions brought about by technology innovation has been confirmed by previous scholars [92,93], and this key factor will also become an important reference for our mechanism analysis in the following text. Second, the eastern region has a more developed economy and better human capital, and better employees can improve the efficiency of resource use and reduce production costs; thus, food enterprises are more willing to shift to clean energy consumption, which significantly improves the EE. Human capital is also an important factor that influences environmental policies’ effects. On the one hand, higher-quality human capital has better environmental awareness, which makes them pay more attention to their own behaviour in the production process [94]. On the other hand, higher-quality human capital also represents a higher level of technology, which is more efficient in making full use of resources [95]. Third, the central and western regions have many enterprises with declining resources, relatively high energy consumption levels and energy costs and a serious outflow of labour and capital, leading to a lack of investment for energy innovation and making it difficult for the CETP to significantly influence the EE. It has been confirmed by many scholars that resource-dominated food enterprises in central and western China cannot produce efficiently due to the consumption of resources [96].

4.4. Mediating Mechanism

The analysis showed that the CETP significantly affected the EE of the food industry in China. The impact mechanism of the CETP was further examined, and the CETP was found to affect the food industry’s EE in two main ways. We introduced energy consumption structure and technological innovation as mediating variables to understand the complex relationship between changes in industrial structure and ecological sustainability in modern economic development.

4.4.1. Energy Consumption Structure

Burning coal produces 1.6 times and 1.2 times more carbon dioxide than burning natural gas or oil, respectively, whereas clean energy sources (e.g., solar, wind) do not release carbon dioxide [97]. Theoretically, the higher the proportion of coal consumption to total energy consumption, the higher the carbon emissions and the lower the EE. China’s food industry has long used coal as its main energy source, resulting in high carbon emissions that have exacerbated environmental problems [5,6,7,98]. Thus, adjusting the energy consumption structure can reduce the food industry’s carbon emissions and improve its EE.
CETP implementation increased the cost of using high-carbon sources, forcing the food industry to accelerate energy consumption structure upgrades and increase the proportion of clean energy consumption to keep the total carbon emissions within the quotas. Therefore, the CETP can internalize environmental costs and force the food industry to improve its energy consumption structure and reduce its carbon emission intensity, thereby enhancing EE.
Table 9 shows the results of the mechanism analysis of the CETP through the energy consumption structure. Model (1) presents the baseline regression results, model (2) examines the CETP’s effects on the food industry’s energy consumption structure, and model (3) examines the mediating mechanism of the CETP’s effects on the food industry’s EE after adding energy consumption structure.
The regression results of model (2) show that the coal consumption proportion of the food industry in the experimental areas significantly decreased by 6.3% on average, indicating that the CETP can effectively improve the food industry’s energy consumption structure. In model (3), the results show that the energy consumption structure coefficient was significantly negative, indicating that consumption structure improvement is conducive to improving the food industry’s EE. Moreover, the policy dummy variable coefficient remained significantly positive, indicating a mediating effect. The regression results indicate that the CETP critically improved the energy consumption structure to increase the food industry’s EE.
This conclusion is similar to those of previous studies [99,100], that is, improvement of the energy consumption structure can reduce carbon emissions and help improve environmental quality. Therefore, the optimization and adjustment of the energy structure is not only an important task for China’s energy development, but also an important part of ensuring energy security and achieving a carbon peak and carbon neutrality. Adjusting the energy structure means reducing the demand for and consumption of fossil energy resources, reducing the proportion of coal electricity, and vigorously developing new and renewable energy sources.

4.4.2. Technological Innovation

In addition, we also analysed the impact of the CETP on technological innovation, and we will discuss the role of technological innovation in the improvement process of EE in China food enterprises below. The Porter hypothesis suggests that appropriate environmental policies can enhance technological innovation [101,102]. As a type of environmental regulation policy, the CETP can theoretically help improve enterprises’ technological innovation. Technological innovation can increase the productivity of the food industry, improve the efficiency of resource and energy usage, and reduce carbon emissions at the same output level [95]. Therefore, the CETP can enhance EE by improving technological innovation.
Table 10 shows the results of the mechanism analysis of the CETP through technological innovation. Model (1) presents the baseline regression results, model (2) examines the CETP’s effects on technological innovation in the food industry, and model (3) examines the mediating mechanism of the CETP on the food industry’s EE after adding technological innovation.
The regression results of model (2) show that technological innovation in the food industry in experimental regions significantly increased by 25.1% on average, indicating that the CETP can effectively improve technological innovation in the food industry. In model (3), the results show that the technological innovation coefficient was significantly positive, indicating that an increase in technological innovation is conducive to improving the food industry’s EE. Moreover, the policy dummy variable coefficient remained significantly positive, indicating a mediating effect. The regression results indicate that improvements in technological innovation resulting from the CETP are an important method for increasing the food industry’s EE.
Enterprises are the main participants in social carbon emissions. In, the process of promoting carbon emission reduction, the EU and Japan insisted on mobilizing the enthusiasm of enterprises to participate in low-carbon technology innovation and have achieved positive results [103,104]. Therefore, encouraging food industries to rely on their characteristics to allocate and integrate green resources and vigorously implement the sustainable development of technological innovation can achieve the goal of improving EE.

5. Discussion

According to the results obtained from the analysis in this study, using the provincial panel data of China’s CETP, we found some characteristics of the food industry that are different from those found in previous studies, thus providing some new implications for the further promotion of this policy, the transformation of the food industry and the research on sustainable development.
Firstly, there is no doubt that the CETP is an effective policy, which has been deeply confirmed in China’s food industry, but its industry heterogeneity and regional heterogeneity deserve our attention. In the process of future policy implementation, policymakers should think about how to design policies according to different subsectors or according to different regions (that is, different levels of economic development), so as to achieve better results and give full play to the effectiveness of policies.
Secondly, with the environmental changes and the pressures of policy, food industries will inevitably face industrial transformation. In the face of policy requirements, enterprises should pay attention to their own energy consumption structure, consume less coal, and use more renewable energy sources to reduce energy consumption. In addition, enterprises should actively realize technological innovation, the use of the internet and artificial intelligence, foreign cooperation and other new means or new ideas to expand their business model, which can help them not only better respond to the requirements of the CETP, but also gain technological advantages, improve productivity and occupy an advanced position in the market.
Finally, sustainable development is an eternal topic, and the same is true for the CETP. After more than ten years of the pilot project, we have found that the CETP is effective, but this policy is still in the pilot stage, and it is far from enough; making it more popularized is the goal so that more regions and more countries can join in, in order to make sustainable development possible.

6. Conclusions and Policy Recommendations

6.1. Conclusions

To ensure sustainability across industries, China has pledged to peak its carbon emissions by 2030 to combat global warming, especially in its food sector. To achieve this goal, China has implemented a series of measures. The CETP is China’s recently launched market-based energy trading system. At present, there are few studies on the CETP, most of which are focused on the advantages of the economic benefits and details of policy implementation. The purpose of this study was to investigate the effect of the CETP on the EE of the Chinese food industry and to clarify its potential mechanism.
This study evaluated the food industry’s EE based on panel data from 30 provinces in China between 2003 and 2019, examined the differences between the experimental and non-experimental regions, empirically analysed whether the CETP has promoted the EE of the food industry, and conducted several robustness tests. In addition, the CETP’s heterogeneity effects across subsectors and regions were examined, and mediating mechanism models were used to study the impact pathways of the CETP’s effects on the food industry’s EE. The main findings are as follows.
(1)
The CETP has had a significant effect on the EE of the food industry, resulting in an average increase of 38.3% in the experimental provinces compared with the non-experimental provinces. Moreover, these results remained consistent and robust even after a series of tests. Thus, China’s CETP has achieved preliminary success and provided experience for the construction of a national CETM.
(2)
The CETP’s effects on the food industry’s EE have significant sectoral and regional heterogeneity. Regarding subsectors, the policy’s impact on the EE was significant for the food manufacturing and tobacco subsectors but was not significant for agricultural and subsidiary food processing and beverage manufacturing. Furthermore, the policy impact was more significant in the eastern region than in the central and western regions.
(3)
In this study, a three-step mediating mechanism model was used to investigate the mediating role of energy consumption structure and technological innovation in China’s food industry. The CETP mainly promotes the food industry’s EE by upgrading its energy consumption structure and improving technological innovation. The results of the study showed that the implementation of the CETP had a significant impact on the optimization of the energy consumption structure by 6.3% and the promotion of technological innovation by 25.1%. CETP implementation increases the carbon emission costs of food enterprises and forces them to improve their energy consumption structure and reduce their coal consumption and carbon emissions. CETP implementation can also guide food enterprises to improve their technological innovation and promote the sustainable development of the food industry while reducing carbon emissions.
In summary, the implementation of the CETP as a pilot environmental regulatory policy has proven its effectiveness in contributing to the achievement of carbon reduction targets and improving the sustainability of China’s food industry.

6.2. Policy Recommendations

Based on the research conclusions, the following recommendations are proposed for promoting the CETP.
(1)
The government should classify and precisely implement policies for different regions. The differences in economic development, population structure, urbanization, technology levels and other factors should be fully considered. When distributing carbon quotas, historical cumulative carbon emissions and environmental endowments should be considered. In the central and western regions, where the impact of the CETP is less obvious, the government can take two approaches. First, it should strengthen the sustainability of food enterprises by strengthening the supervision of high carbon-emitting food enterprises, as well as improving the environmental awareness of enterprises, so that enterprises choose cleaner production methods. Second, governments can enhance sustainable development by introducing environmentally friendly innovative technologies, such as carbon recycling and carbon substitution with clean energy, and support initiatives such as clean energy infrastructure and low-carbon transport construction for food enterprises.
(2)
Technological innovation should be used as a driving force to promote the low-carbon transformation of the food industry. The mechanism analysis shows that the CETP can improve the EE of China’s food industry by promoting technological innovation. Therefore, CETP design should focus on stimulating food enterprises’ technological innovation vitality and reducing their emission costs through low-carbon technology, thereby enhancing the EE. Governments can reduce their dependence on fossil fuels by transforming the food industry, thereby changing their energy structure. We should also establish a technological innovation platform focusing on sustainability technologies to close the gap between traditional food industries and sustainable technologies, addressing issues such as overcapacity and inefficient use of resources. The continuous improvement and modernization of traditional industries should be promoted to gradually change the backward industrial model with high pollution levels. In terms of technology, the government should increase investment in scientific research and give policy support to environmental sustainability technologies such as carbon monitoring, carbon capture and storage, and carbon offset technologies.
(3)
The national CETM and multi-dimensional sustainable carbon emissions trading system need to be improved. China’s CETP is working well, with significant improvements made in the food industry’s EE in the experimental regions. Given the impact of the CETP on the EE of the food industry and its regional spillover effects, national strategies to promote carbon sustainability are critical. More regions and industries need to be included. In building a national CETM, the government should learn from the experiences of the experimental regions and improve the carbon trading mechanism, refine carbon quotas and control carbon prices by adjusting carbon quotas. Additionally, the regional environmental impact of the food industry should be promoted using financial incentives. These methods will promote the sustainability of the food industry and integrate the development goals of the food industry and regions.
The conclusions of this study provide evidence for the improvement of the food industry’s EE by the CETP, but there is still room for further research at the macro level. According to existing relevant studies, the CETP will cause pollution transfer to neighbouring regions in the short term, resulting in increased pressure on neighbouring regions to reduce their carbon emissions. This effect deserves specific consideration in future studies, so as to better sort out the “net effect” of the CETP. At the same time, the technology spillover effect will promote the high-quality development of the neighbouring regions’ food industries. Therefore, the balance of transfer of carbon emissions and the spillover effect of technology are worthy of investigation. In addition, considering the limitations of data acquisition, the provincial panel data of the food industry used in this research can also be further refined to obtain more accurate policy effects to guide the implementation of regional policies.

Author Contributions

Conceptualization, J.S.; Methodology, X.G.; Software, X.G. and Y.S.; Validation, X.G.; Formal analysis, X.G.; Investigation, X.G. and Y.S.; Resources, J.S.; Data curation, Y.S.; Writing—original draft, X.G. and Y.S.; Writing—review & editing, X.G.; Visualization, Y.S.; Supervision, J.S. and X.G. All authors have read and agreed to the published version of the manuscript.

Funding

This research received no external funding.

Institutional Review Board Statement

Not applicable.

Informed Consent Statement

Not applicable.

Data Availability Statement

No new data were created or analyzed in this study. Data sharing is not applicable to this article.

Conflicts of Interest

The authors declare no conflicts of interest.

References

  1. Sun, X.; Dong, Y.; Wang, Y.; Ren, J. Sources of greenhouse gas emission reductions in OECD countries: Composition or technique effects. Ecol. Econ. 2022, 193, 107288. [Google Scholar] [CrossRef]
  2. Wang, R.; Zhang, Y.; Zou, C. How does agricultural specialization affect carbon emissions in China? J. Clean. Prod. 2022, 370, 133463. [Google Scholar] [CrossRef]
  3. Xian, Y.; Lu, Y.; Liu, G. Is climate change threatening or beneficial to the habitat distribution of global pangolin species? Evidence from species distribution modeling. Sci. Total Environ. 2022, 811, 151385. [Google Scholar] [CrossRef]
  4. Yao, G. China’s food news going forward. Nat. Sustain. 2021, 4, 1019–1020. [Google Scholar] [CrossRef]
  5. Yu, X.; Li, H.; Doluschitz, R. Towards Sustainable Management of Mineral Fertilizers in China: An Integrative Analysis and Review. Sustainability 2020, 12, 7028. [Google Scholar] [CrossRef]
  6. Ludemann, C.I.; Gruere, A.; Heffer, P.; Dobermann, A. Global data on fertilizer use by crop and by country. Sci. Data 2022, 9, 501. [Google Scholar] [CrossRef]
  7. Zheng, W.; Luo, B.; Hu, X. The determinants of farmers’ fertilizers and pesticides use behavior in China: An explanation based on label effect. J. Clean. Prod. 2020, 272, 123054. [Google Scholar] [CrossRef]
  8. Shi, R.; Irfan, M.; Liu, G.; Yang, X.; Su, X. Analysis of the Impact of Livestock Structure on Carbon Emissions of Animal Husbandry: A Sustainable Way to Improving Public Health and Green Environment. Front. Public Health 2022, 10, 835210. [Google Scholar] [CrossRef] [PubMed]
  9. Zhang, H.; Xu, Y.; Lahr, M.L. The greenhouse gas footprints of China’s food production and consumption (1987–2017). J. Environ. Manag. 2022, 301, 113934. [Google Scholar] [CrossRef] [PubMed]
  10. Zhao, X.; Ma, X.; Chen, B.; Shao, Y.; Song, M. Challenges toward carbon neutrality in China: Strategies and countermeasures. Resour. Conserv. Recycl. 2022, 176, 105959. [Google Scholar] [CrossRef]
  11. Yu, Y.; Su, Y.; Qi, C. Comparing potential cost savings of energy quota trading and carbon emissions trading for China’s indus-trial sectors. Resour. Conserv. Recycl. 2022, 186, 106544. [Google Scholar] [CrossRef]
  12. The Cumulative Volume of Carbon Emission Allowances Was 179 million Tons. Available online: https://www.gov.cn/xinwen/2022-01/04/content_5666282.htm (accessed on 17 January 2024).
  13. Your Guide to Climate Action: Food. Available online: https://www.un.org/zh/actnow/food (accessed on 17 January 2024).
  14. Philip, B.; Anna, L.; Stefan, S. Sustainable supply chain management practices and dynamic capabilities in the food industry: A critical analysis of the literature. Int. J. Prod. Econ. 2014, 152, 131–143. [Google Scholar]
  15. New FAO Analysis Reveals Carbon Footprint of Agri-Food Supply Chain. Available online: https://news.un.org/en/story/2021/11/1105172 (accessed on 22 February 2024).
  16. Mottet, A.; Teillard, F.; Boettcher, P.; De’Besi, G.; Besbes, B. Review: Domestic herbivores and food security: Current contribution, trends and challenges for a sustainable development. Animal 2018, 12, s188–s198. [Google Scholar] [CrossRef]
  17. Mancebo, U.; Hettiaratchi, J.P.A.; Kumar, S.; Hurtado, O. The use of methanotrophic applications to control of fugitive methane emissions from the biodegradation of organic waste. Int. J. Environ. Technol. Manag. 2012, 15, 539–558. [Google Scholar] [CrossRef]
  18. Keel, S.G.; Anken, T.; Büchi, L.; Chervet, A.; Fliessbach, A.; Flisch, R.; Huguenin-Elie, O.; Mäder, P.; Mayer, J.; Sinaj, S.; et al. Loss of soil organic carbon in Swiss long-term agricultural experiments over a wide range of management practices. Agric. Ecosyst. Environ. 2019, 286, 106654. [Google Scholar] [CrossRef]
  19. Schipper, L.A.; Dodd, M.B.; Pronger, J.; Mudge, P.L.; Upsdell, M.; Moss, R.A. Decadal Changes in Soil Carbon and Nitrogen under a Range of Irrigation and Phosphorus Fertilizer Treatments. Soil Sci. Soc. Am. J. 2012, 77, 246–256. [Google Scholar] [CrossRef]
  20. Rhoderick, G.C.; Dorko, W.D. Standards development of global warming gas species: Methane, nitrous oxide, trichlorofluoromethane, and dichlorodifluoromethane. Environ. Sci. Technol. 2004, 38, 2685–2692. [Google Scholar] [CrossRef] [PubMed]
  21. Nelson, R.G.; Hellwinckel, C.M.; Brandt, C.C.; West, T.O. Energy use and carbon dioxide emissions from cropland production in the United States, 1990–2004. J. Environ. Qual. 2009, 38, 418–425. [Google Scholar] [CrossRef] [PubMed]
  22. Raymond, P.A.; Hartmann, J.; Lauerwald, R.; Sobek, S.; McDonald, C.; Hoover, M.; Butman, D.; Striegl, R.; Mayorga, E.; Humborg, C.; et al. Global carbon dioxide emissions from inland waters. Nature 2013, 503, 355–359. [Google Scholar] [CrossRef] [PubMed]
  23. Keel, S.G.; Leifeld, J.; Mayer, J.; Taghizadeh-Toosi, A.; Olesen, J.E. Large uncertainty in soil carbon modelling related to method of calculation of plant carbon input in agricultural systems. Eur. J. Soil Sci. 2017, 68, 953–963. [Google Scholar] [CrossRef]
  24. Renan, M.L.N.; Ricardo, A.A.P.; Miguel, B.; Bruno, J.R.A.; André, M.; Marília, I.S.F. Estimating 20-year land-use change and derived CO2 emissions associated with crops, pasture and forestry in Brazil and each of its 27 states. Glob. Change Biol. 2017, 23, 3716–3728. [Google Scholar]
  25. Popkin, B.M.; Duffey, K.; Gordon-Larsen, P. Environmental influences on food choice, physical activity and energy balance. Physiol. Behav. 2005, 86, 603–613. [Google Scholar] [CrossRef]
  26. Mcnaughton, S.J.; Oesterheld, M.; Frank, D.A.; Williams, K.J. Ecosystem-level patterns of primary productivity and herbivory in terrestrial habitats. Nature 1989, 341, 142–144. [Google Scholar] [CrossRef] [PubMed]
  27. Climate Action. Available online: https://commission.europa.eu/about-european-commission/departments-and-executive-agencies/climate-action_en (accessed on 17 January 2024).
  28. Lin, B.; Jia, Z. What will China’s carbon emission trading market affect with only electricity sector involvement? A CGE based study. Energy Econ. 2019, 78, 301–311. [Google Scholar] [CrossRef]
  29. Song, L.; Zhou, X. How does industrial policy affect manufacturing carbon emission? Evidence from Chinese provincial sub-sectoral data. Environ. Sci. Pollut. Res. 2021, 28, 61608–61622. [Google Scholar] [CrossRef]
  30. Zhang, Y.J.; Liang, T.; Jin, Y.L.; Shen, B. The impact of carbon trading on economic output and carbon emissions reduction in China’s industrial sectors. Appl. Energy 2020, 260, 114290. [Google Scholar] [CrossRef]
  31. China Industrial Statistics Yearbook. Available online: https://cnki.nbsti.net/CSYDMirror/trade/Yearbook/Single/N2022010304?z=Z012 (accessed on 22 February 2024).
  32. Wang, X.; Wang, S.; Zhang, Y. The Impact of Environmental Regulation and Carbon Emissions on Green Technology Innovation from the Perspective of Spatial Interaction: Empirical Evidence from Urban Agglomeration in China. Sustainability 2022, 14, 5381. [Google Scholar] [CrossRef]
  33. Zhang, W.W.; Zhao, B.; Ding, D.; Sharp, B.; Gu, Y.; Xu, S.C.; Xing, J.; Wang, S.X.; Liou, K.N.; Rao, L.L. Co-benefits of subnationally differentiated carbon pricing policies in China: Alleviation of heavy PM2.5 pollution and improvement in environmental equity. Energy Policy 2021, 149, 112060. [Google Scholar] [CrossRef]
  34. Chen, X.; Lin, B. Towards carbon neutrality by implementing carbon emissions trading scheme: Policy evaluation in China. Energy Policy 2021, 157, 112510. [Google Scholar] [CrossRef]
  35. Sinn, H.W. Public Policies Against Global Warming: A Supply Side Approach. Int. Tax Public Financ. 2008, 15, 360–394. [Google Scholar] [CrossRef]
  36. Gerlagh, R.; Heijmans, R.J.R.K.; Rosendahl, K.E. An endogenous emissions cap produces a green paradox. Econ. Policy 2021, 36, 485–522. [Google Scholar] [CrossRef]
  37. Werf, E.V.; Maria, C.D. Imperfect Environment Policy and Pollution Emission: The Green Paradox and Beyond. Int. Rev. Environ. Resour. Econ. 2012, 6, 153–194. [Google Scholar] [CrossRef]
  38. Frederick, V.D.P. Cumulative Carbon Emissions and the Green Paradox. Annu. Rev. Resour. Econ. 2013, 5, 281–300. [Google Scholar]
  39. Maria, C.D.; Lange, I.; Edwin, V. Should We Be Worried about the Green Paradox? Announcement Effects of the Acid Rain Program. Eur. Econ. Rev. 2014, 69, 143–162. [Google Scholar] [CrossRef]
  40. Petroni, G.; Bigliardi, B.; Galati, F. Rethinking the Porter Hypothesis: The Underappreciated Importance of Value Appropriation and Pollution Intensity. Rev. Policy Res. 2019, 36, 121–140. [Google Scholar] [CrossRef]
  41. Chapple, L.L.; Clarkson, P.M.; Gold, D.L. The Cost of Carbon: Capital Market Effects of the Proposed Emission Trading Scheme (ETS). Abacus 2013, 49, 1–33. [Google Scholar] [CrossRef]
  42. Miao, C.; Meng, X.; Duan, M.; Wu, X. Energy consumption, environmental pollution, and technological innovation efficiency: Taking industrial enterprises in China as empirical analysis object. Environ. Sci. Pollut. Res. 2020, 27, 34147–34157. [Google Scholar] [CrossRef]
  43. Simon, B.; Chiara, F.; Giovanni, M. Outward Foreign Direct Investment Patterns of Italian Firms in the European Union’s Emission Trading Scheme. Scand. J. Econ. 2020, 122, 219–256. [Google Scholar]
  44. Wang, H.; Wei, W. Coordinating technological progress and environmental regulation in CO2 mitigation: The optimal levels for OECD countries & emerging economies. Energy Econ. 2020, 87, 104510. [Google Scholar]
  45. Yuan, Y.; Duan, H.; Tsvetanov, T.G. Synergizing China’s energy and carbon mitigation goals: General equilibrium modeling and policy assessment. Energy Econ. 2020, 89, 104787. [Google Scholar] [CrossRef]
  46. Schaltegger, S.; Sturm, A. Ökologische Rationalität: Ansatzpunkte zur Ausgestaltung von Ökologieorientierten Management Instrumenten. Die Unternehm. 1990, 44, 273–290. [Google Scholar]
  47. WBCSD. Eco-Efficiency: Leadership for Improved Economic and Environmental Performance; WBCSD: Geneva, Switzerland, 1996; pp. 3–16. [Google Scholar]
  48. Aigner, D.; Lovell, C.; Schmidt, P. Formulation and Estimation of Stochastic Frontier Production Function Models. J. Econom. 1977, 6, 21–37. [Google Scholar] [CrossRef]
  49. Charnes, A.W.; Cooper, W.W.; Rhodes, E.L. Measuring Efficiency of Decision-Making Units. Eur. J. Oper. Res. 1979, 2, 429–444. [Google Scholar] [CrossRef]
  50. Rees, W.E. Ecological Footprints and Appropriated Carrying Capacity: What Urban Economics Leaves Out. Environ. Urban. 1992, 4, 121–130. [Google Scholar] [CrossRef]
  51. Wackernagel, M. Our Ecological Footprint: Reducing Human Impact on the Earth. Popul. Environ. 1995, 1, 171–174. [Google Scholar]
  52. He, J.; Wang, H. Economic structure, development policy and environmental quality: An empirical analysis of environmental Kuznets curves with Chinese municipal data. Ecol. Econ. 2012, 76, 49–59. [Google Scholar] [CrossRef]
  53. Tang, E.; Liu, F.; Zhang, J.; Yu, J. A model to analyze the environmental policy of resource reallocation and pollution control based on firms’ heterogeneity. Resour. Policy 2014, 39, 88–91. [Google Scholar] [CrossRef]
  54. Li, Y.; Qiao, Q.; Hu, X.; Zhao, R.; Su, Z.; Wan, S. Integrated assessment of process pollution prevention and end-of-pipe control in secondary lead smelting. Resour. Conserv. Recycl. 2017, 117, 1–11. [Google Scholar] [CrossRef]
  55. Zhang, B.; Meng, Z.; Zhang, L.; Sun, X.; Hayat, T.; Alsaedi, A.; Ahmad, B. Exergy-based systems account of national resource utilization: China 2012. Resour. Conserv. Recycl. 2018, 132, 324–338. [Google Scholar] [CrossRef]
  56. Dong, F.; Bian, Z.; Yu, B.; Wang, Y.; Zhang, S.; Li, J.; Su, B.; Long, R. Can land urbanization help to achieve CO2 intensity reduction target or hinder it? Evidence from China. Resour. Conserv. Recycl. 2018, 134, 206–215. [Google Scholar] [CrossRef]
  57. Du, W.; Yan, H.; Feng, Z.; Yang, Y.; Liu, F. The supply-consumption relationship of ecological resources under ecological civilization construction in China. Resour. Conserv. Recycl. 2021, 172, 105679. [Google Scholar] [CrossRef]
  58. Poumanyvong, P.; Kaneko, S. Does Urbanization Lead to Less Energy Use and Lower CO2 Emissions? A Cross-Country Analysis. Ecol. Econ. 2010, 70, 434–444. [Google Scholar] [CrossRef]
  59. Cole, M.A.; Neumayer, E. Examining the Impact of Demographic Factors on Air Pollution. Popul. Environ. 2004, 26, 5–21. [Google Scholar] [CrossRef]
  60. Powdthavee, N.; Oswald, A.J. Is there a link between air pollution and impaired memory? Evidence on 34,000 English citizens. Ecol. Econ. 2020, 169, 106485. [Google Scholar] [CrossRef]
  61. Zhou, Y.; Liu, Y. Does Population Have a Larger Impact on Carbon Dioxide Emissions than Income? Evidence from a Cross-regional Panel Analysis in China. Appl. Energy 2016, 180, 800–809. [Google Scholar] [CrossRef]
  62. Gerlagh, R.; van der Zwaan, B.C.C. The effects of ageing and an environmental trust fund in an overlapping generations model on carbon emission reductions. Ecol. Econ. 2001, 36, 311–326. [Google Scholar] [CrossRef]
  63. Mcdonald, G.W.; Forgie, V.E.; Macgregor, C. Treading lightly: Ecofootprints of New Zealand’s ageing population. Ecol. Econ. 2006, 56, 424–439. [Google Scholar] [CrossRef]
  64. Pottier, A.; Fleurbaey, M.; Méjean, A.; Zuber, S. Climate change and population: An assessment of mortality due to health impacts. Ecol. Econ. 2021, 183, 106967. [Google Scholar] [CrossRef]
  65. Miao, C.; Fang, D.; Sun, L.; Luo, Q. Natural resources utilization efficiency under the influence of green technological innovation. Resour. Conserv. Recycl. 2017, 126, 153–161. [Google Scholar] [CrossRef]
  66. Mohareb, E.A.; Kennedy, C.A. Scenarios of technology adoption towards low-carbon cities. Energy Policy 2014, 66, 685–693. [Google Scholar] [CrossRef]
  67. Sun, H. What are the roles of green technology innovation and ICT employment in lowering carbon intensity in China? A city-level analysis of the spatial effects. Resour. Conserv. Recycl. 2022, 186, 106550. [Google Scholar] [CrossRef]
  68. Gong, M.; You, Z.; Wang, L.; Cheng, J. Environmental Regulation, Trade Comparative Advantage, and the Manufacturing Industry’s Green Transformation and Upgrading. Int. J. Environ. Res. Public Health 2020, 17, 2823. [Google Scholar] [CrossRef]
  69. Beckenbach, F.; Daskalakis, M.; Hofmann, D. Agent-Based Analysis of Industrial Dynamics and Paths of Environmental Policy: The Case of Non-Renewable Energy Production in Germany. Comput. Econ. 2018, 52, 953–994. [Google Scholar] [CrossRef]
  70. Wu, K.; You, K.; Ren, H.; Gan, L. The impact of industrial agglomeration on ecological efficiency: An empirical analysis based on 244 Chinese cities. Environ. Impact Assess. Rev. 2022, 96, 106841. [Google Scholar] [CrossRef]
  71. Angelstam, P.; Barnes, G.; Elbakidze, M.; Marais, C.; Marsh, A.; Polonsky, S.; Richardson, D.M.; Rivers, N.; Shackleton, R.T.; Stafford, W. Collaborative learning to unlock investments for functional ecological infrastructure: Bridging barriers in social-ecological systems in South Africa. Ecosyst. Serv. 2017, 27, 291–304. [Google Scholar] [CrossRef]
  72. Pouri, M.J. Eight impacts of the digital sharing economy on resource consumption. Resour. Conserv. Recycl. 2021, 168, 105434. [Google Scholar] [CrossRef]
  73. Ashenfelter, O. Estimating the Effect of Training Programs on Earnings. Rev. Econ. Stat. 1978, 60, 47–57. [Google Scholar] [CrossRef]
  74. Zou, E.Y. Unwatched Pollution: The Effect of Intermittent Monitoring on Air Quality. Am. Econ. Rev. 2021, 111, 2101–2126. [Google Scholar] [CrossRef]
  75. Botosaru, I.; Gutierrez, F.H. Difference-in-differences when the treatment status is observed in only one period. J. Appl. Econ. 2018, 33, 73–90. [Google Scholar] [CrossRef]
  76. Baron, R.M.; Kenny, D.A. The Moderator-Mediator Variable Distinction in Social Psychological Research: Conceptual, Strategic, and Statistical Considerations. J. Personal. Soc. Psychol. 1986, 51, 1173–1182. [Google Scholar] [CrossRef]
  77. Asane, O.E. Competition policies and environmental quality: Empirical analysis of the electricity sector in OECD countries. Energy Policy 2016, 95, 212–223. [Google Scholar] [CrossRef]
  78. Alkaabneh, F.M.; Lee, J.; Miguel, I.; Gómez, M.I.; Gao, H.O. A systems approach to carbon policy for fruit supply chains: Carbon tax, technology innovation, or land sparing? Sci. Total Environ. 2020, 767, 144211. [Google Scholar] [CrossRef]
  79. Sugsaisakon, S.; Kittipongvises, S. Citywide Energy-Related CO 2 Emissions and Sustainability Assessment of the Development of Low-Carbon Policy in Chiang Mai, Thailand. Sustainability 2021, 13, 6789. [Google Scholar] [CrossRef]
  80. Yang, Z.; Shao, S.; Yang, L. Unintended consequences of carbon regulation on the performance of SOEs in China: The role of technical efficiency. Energy Econ. 2021, 94, 105072. [Google Scholar] [CrossRef]
  81. Chen, J.; Huang, S.; Shen, Z.; Song, M.; Zhu, Z. Impact of sulfur dioxide emissions trading pilot scheme on pollution emissions intensity: A study based on the synthetic control method. Energy Policy 2022, 161, 112730. [Google Scholar] [CrossRef]
  82. Li, Y.; Ding, L.; Yang, Y. Can the Introduction of an Environmental Target Assessment Policy Improve the TFP of Textile Enterprises? A Quasi-Natural Experiment Based on the Huai River Basin in China. Sustainability 2020, 12, 1696. [Google Scholar] [CrossRef]
  83. Zhang, Y.J.; Wang, W. How does China’s carbon emissions trading (CET) policy affect the investment of CET-covered enterprises? Energy Econ. 2021, 98, 105224. [Google Scholar] [CrossRef]
  84. Rodríguez-Planas, N. COVID-19, college academic performance, and the flexible grading policy: A longitudinal analysis. J. Public Econ. 2022, 207, 104606. [Google Scholar] [CrossRef]
  85. Tan, X.; Lai, H.; Gu, B.; Zeng, Y.; Li, H. Carbon emission and abatement potential outlook in China’s building sector through 2050. Energy Policy 2018, 118, 429–439. [Google Scholar] [CrossRef]
  86. Zhang, Y.; Yan, D.; Hu, S.; Guo, S. Modelling of energy consumption and carbon emission from the building construction sector in China, a process-based LCA approach. Energy Policy 2019, 134, 110949. [Google Scholar] [CrossRef]
  87. Jia, S.; Liu, X.; Yan, G. Effect of APCF policy on the haze pollution in China: A system dynamics approach. Energy Policy 2019, 125, 33–44. [Google Scholar] [CrossRef]
  88. Liu, Z.; Sun, H. Assessing the impact of emissions trading scheme on low-carbon technological innovation: Evidence from China. Environ. Impact Assess. Rev. 2021, 89, 106589. [Google Scholar] [CrossRef]
  89. Lien, D.; Zhang, J.; Yu, X. Effects of economic policy uncertainty: A regime switching connectedness approach. Econ. Model. 2022, 113, 105879. [Google Scholar] [CrossRef]
  90. Wen, Q.; Zhang, T. Economic policy uncertainty and industrial pollution: The role of environmental supervision by local governments. China Econ. Rev. 2022, 71, 101723. [Google Scholar] [CrossRef]
  91. Hu, T.W.; Mao, Z.; Shi, J. Recent tobacco tax rate adjustment and its potential impact on tobacco control in China. Tob. Control 2010, 19, 80–82. [Google Scholar] [CrossRef]
  92. Li, Z.; Lin, B.; Luan, R. Impact assessment of clean air action on total factor energy productivity: A three-dimensional analysis. Environ. Impact Assess. Rev. 2022, 93, 106745. [Google Scholar] [CrossRef]
  93. Wang, T.; Song, Z.; Zhou, J.; Sun, H.; Liu, F. Low-Carbon Transition and Green Innovation: Evidence from Pilot Cities in China. Sustainability 2022, 14, 7264. [Google Scholar] [CrossRef]
  94. Jung, H.; Song, S.; Song, C.K. Carbon Emission Regulation, Green Boards, and Corporate Environmental Responsibility. Sustainability 2021, 13, 4463. [Google Scholar] [CrossRef]
  95. Borissov, A.B.L. Carbon pricing, technology transition, and skill-based development. Eur. Econ. Rev. 2019, 118, 252–269. [Google Scholar] [CrossRef]
  96. Wu, Y.; Zheng, H.; Li, Y.; Delang, C.O.; Qian, J. Carbon Productivity and Mitigation: Evidence from Industrial Development and Urbanization in the Central and Western Regions of China. Sustainability 2021, 13, 9014. [Google Scholar] [CrossRef]
  97. Zhang, Z. Decoupling China’s Carbon Emissions Increase from Economic Growth: An Economic Analysis and Policy Implications. World Dev. 2000, 28, 23–35. [Google Scholar] [CrossRef]
  98. Xiang, X.; Zhang, Y.; Peng, L.; Lan, M.; Du, W.; Xue, S.; Jiang, T.; Jiang, X. Exploring the food-energy-water nexus in China’s national industries: Insights from network structure and production disturbances. Sustain. Prod. Consum. 2023, 43, 377–388. [Google Scholar] [CrossRef]
  99. Khan, M.B.; Saleem, H.; Shabbir, M.S.; Xie, H. The effects of globalization, energy consumption and economic growth on carbon dioxide emissions in South Asian countries. Energy Environ. 2022, 33, 107–134. [Google Scholar] [CrossRef]
  100. Liu, X.; Ji, Q.; Yu, J. Sustainable development goals and firm carbon emissions: Evidence from a quasi-natural experiment in China. Energy Econ. 2021, 103, 105627. [Google Scholar] [CrossRef]
  101. Porter, M.E. America’s Green Strategy. Sci. Am. 1991, 12, 193–246. [Google Scholar]
  102. Porter, M.E.; Linde, C. Toward a New Conception of the Environment Competitiveness Relationship. J. Econ. Perspect. 1995, 4, 97–118. [Google Scholar] [CrossRef]
  103. Henriques, C.; Viseu, C.; Trigo, A.; Gouveia, M.; Amaro, A. How Efficient Is the Cohesion Policy in Supporting Small and Mid-Sized Enterprises in the Transition to a Low-Carbon Economy? Sustainability 2022, 14, 5317. [Google Scholar] [CrossRef]
  104. Sadayuki, T.; Arimura, T.H. Do regional emission trading schemes lead to carbon leakage within firms? Evidence from Japan. Energy Econ. 2021, 104, 105664. [Google Scholar] [CrossRef]
Figure 1. Theoretical model diagram.
Sustainability 16 02059 g001
Figure 2. (a) Trends in carbon emissions of the food industry; (b) trends in environmental efficiency of the food industry; (c) trends in resource efficiency of the food industry; (d) trends in ecological efficiency of the food industry.
Sustainability 16 02059 g002aSustainability 16 02059 g002b
Figure 3. Parallel trend test.
Sustainability 16 02059 g003
Table 1. Regional carbon emissions trading market conditions.
RegionThreshold
(Per Year)
Quota MethodDistribution MethodPenalty
Shenzhen3000 Mg CO2Reference lineFree and paidRepay the excess emissions and pay a penalty equal to 3 times the carbon price
Beijing5000 Mg CO2Reference line
Historical intensity
Historical discharge
FreePay a penalty equal to 3–5 times the carbon price according to the excess carbon emissions
Shanghai20,000 Mg CO2Reference line
Historical intensity
Historical discharge
Free and paid biddingPay off the quota and impose a penalty of CNY 50,000–100,000
Guangdong20,000 Mg CO2 or
10,000 Mg standard coal
Reference line
Historical intensity
Historical discharge
Free and paid biddingAn amount twice that of the not fully paid quota will be deducted the next year, and a CNY 50,000 penalty will be imposed
Tianjin20,000 Mg CO2Reference line
Historical discharge
FreeAn amount twice the difference will be deducted from the quota distribution the next year
Hubei10,000 Mg standard coalReference line
Historical discharge
FreePay a penalty for the excess equal to 1–3 times the carbon price, but not more than CNY 150,000, and it shall be doubly deducted from the quota distribution the next year
Chongqing20,000 Mg CO2 or
10,000 Mg standard coal
Historical dischargeFreeThe penalty shall be 3 times the trading price of the quota price 1 month before the expiration of the settlement period
Data source: Public information from provincial ecology and environment bureaus and CETMs.
Table 2. Variables and descriptive statistics.
VariableMeaningUnitNumberAverageS.D.MinMax
Gross industrial output valueAnnual gross industrial output value of the food industryCNY 100 million 467212726309.68017,364
Carbon
emissions
Annual carbon emissions of food industryMegaton5101.5511.761013
Energy
consumption
Annual energy consumption of food industryMg of standard coal510241.6151.314.41744.2
GDP
per capita
GDP per capitaCNY51039,14127,3493603164,220
Proportion of secondary industryProportion of secondary industries in GDP%51045.738.33916.2061.50
Proportion of tertiary industryProportion of tertiary industries in GDP%51043.029.34928.6083.50
Urbanization rateProportion of urban population in resident population%51052.8214.2824.7789.60
Proportion of older adult populationProportion of population aged 65 and above in working-age population%51013.223.0077.44023.82
Number of
patents
Number of patent applicationsPcs51032,43060,52470527,390
Energy
structure
Proportion of coal resources consumed in total energy consumption%4820.4990.1890.0100.980
Technological innovation levelR&D expenditureCNY 100 million 5109.08315.420.00492.15
Table 3. Baseline regression.
Explained Variable: Food Industry’s EE
Explanatory Variable(1)(2)(3)(4)(5)
Policy dummy variables0.383 **
(0.164)
0.407 **
(0.161)
0.366 ***
(0.112)
0.370 **
(0.154)
0.383 **
(0.156)
GDP per capita −0.207 ***
(0.074)
0.113
(0.092)
−0.396 ***
(0.010)
−0.414 ***
(0.100)
Proportion of secondary industries in GDP 0.022 **
(0.009)
0.007
(0.010)
0.015
(0.009)
0.014
(0.009)
Proportion of tertiary industries in GDP 0.004
(0.009)
0.018 *
(0.009)
−0.002
(0.010)
−0.002
(0.010)
Number of patent applications 0.309 ***
(0.029)
0.127 ***
(0.028)
0.146 ***
(0.031)
Urbanization rate 0.003
(0.005)
0.004
(0.005)
Proportion of older population −0.018
(0.012)
Time0.431 ***
(0.088)
0.703 ***
(0.108)
0.360 ***
(0.091)
0.678 ***
(0.106)
0.695 ***
(0.106)
Treated−0.154 **
(0.073)
0.017
(0.085)
−0.561 ***
(0.089)
−0.054
(0.095)
−0.041
(0.096)
Sample number448448448448448
R20.1350.1810.5780.2120.216
Note: *, **, and *** indicate significance at the 10%, 5%, and 1% levels, respectively. Brackets indicate robust standard errors.
Table 4. Results of the PSM-DID.
Explained Variable: Food Industry’s EE
Explanatory Variable(1)(2)(3)(4)(5)
Policy dummy variables0.345 *
(0.195)
0.352 *
(0.197)
0.288 **
(0.138)
0.334 *
(0.187)
0.345 *
(0.180)
GDP per capita −0.063
(0.104)
0.120
(0.142)
−0.651 ***
(0.193)
−0.526 **
(0.204)
Proportion of secondary industries in GDP −0.003
(0.012)
0.022
(0.016)
−0.021 *
(0.012)
−0.021 *
(0.012)
Proportion of tertiary industries in GDP −0.027
(0.017)
0.027 *
(0.015)
−0.047 **
(0.018)
−0.044 **
(0.018)
Number of patent applications 0.332 ***
(0.053)
0.259 ***
(0.062)
0.253 ***
(0.064)
Urbanization rate 0.019 **
(0.008)
0.012
(0.008)
Proportion of older adult population −0.040 ***
(0.015)
Time0.591 ***
(0.107)
0.883 ***
(0.175)
0.424 ***
(0.125)
0.958 ***
(0.169)
0.972 ***
(0.163)
Treated−0.087
(0.099)
0.027
(0.097)
−0.277 ***
(0.106)
−0.031
(0.099)
−0.009
(0.103)
Sample number211211211211211
R20.2650.3060.6900.3730.393
Note: *, **, and *** indicate significance at the 10%, 5%, and 1% levels, respectively. Brackets indicate robust standard errors.
Table 5. Results of changing policy time.
Explained Variable: Food Industry’s EE
Explanatory Variable200620082010
Policy dummy variables−0.268 **
(0.109)
−0.381 ***
(0.126)
−0.525 ***
(0.180)
GDP per capita0.069
(0.133)
0.118
(0.150)
−0.417 ***
(0.118)
Proportion of secondary industries in GDP−0.012
(0.007)
−0.016 **
(0.008)
−0.006
(0.007)
Proportion of tertiary industries in GDP−0.023 ***
(0.009)
−0.026 ***
(0.009)
−0.021 **
(0.009)
Number of patent applications0.008
(0.035)
0.017
(0.035)
0.019
(0.033)
Urbanization rate0.002
(0.005)
0.001
(0.006)
0.017 ***
(0.005)
Proportion of older adult population−0.014
(0.014)
−0.021
(0.013)
−0.011
(0.013)
Time−0.166 **
(0.083)
−0.151
(0.099)
0.407 ***
(0.096)
Treated0.174 **
(0.086)
0.201 **
(0.082)
0.111
(0.083)
Sample number311311311
R20.0800.0930.121
Note: ** and *** indicate significance at the 5% and 1% levels, respectively. Brackets indicate robust standard errors.
Table 6. Results of virtual processing groups.
Explained Variable: Food Industry’s EE
Explanatory Variable(1)(2)(3)
Policy dummy variables−0.119
(0.239)
−0.016
(0.185)
0.117
(0.179)
GDP per capita−0.444 ***
(0.987)
−0.425 ***
(0.104)
−0.428 ***
(0.097)
Proportion of secondary industries in GDP0.015
(0.009)
0.016 *
(0.010)
0.015
(0.009)
Proportion of tertiary industries in GDP−0.001
(0.010)
0.004
(0.011)
0.006
(0.010)
Number of patent applications0.175 ***
(0.033)
0.152 ***
(0.034)
0.160 ***
(0.032)
Urbanization rate0.004
(0.004)
0.002
(0.005)
−0.001
(0.005)
Proportion of older adult population−0.010
(0.013)
−0.011
(0.014)
−0.016
(0.012)
Time0.763 ***
(0.093)
0.753 ***
(0.107)
0.744 ***
(0.106)
Treated−0.196 **
(0.079)
0.107
(0.086)
−0.254 ***
(0.090)
Sample number448448448
R20.2170.2050.211
Note: *, **, and *** indicate significance at the 10%, 5%, and 1% levels, respectively. Brackets indicate robust standard errors.
Table 7. Heterogeneity of the subsectors.
Explained Variable: EE of the Subsectors in the Food Industry
Explanatory VariableAgricultural and
Subsidiary Food Processing
Food
Manufacturing
Beverage
Manufacturing
Tobacco
Policy dummy variables0.133
(0.161)
0.660 ***
(0.211)
0.205
(0.207)
0.397 *
(0.219)
GDP per capita−0.301 *
(0.162)
−0.629 ***
(0.096)
−0.189 **
(0.092)
−0.213
(0.184)
Proportion of secondary industries in GDP−0.012
(0.008)
0.025 ***
(0.008)
−0.008
(0.009)
0.065 ***
(0.018)
Proportion of tertiary industries in GDP−0.028 ***
(0.010)
0.027 ***
(0.009)
−0.023 **
(0.011)
0.097 ***
(0.022)
Number of patent applications0.153 ***
(0.045)
0.195 ***
(0.037)
0.045
(0.034)
0.148 *
(0.076)
Urbanization rate0.010
(0.006)
0.004
(0.005)
−0.000
(0.006)
−0.023 **
(0.011)
Proportion of older adult population0.002
(0.014)
−0.067 ***
(0.016)
0.003
(0.016)
−0.080 ***
(0.024)
Time0.546 ***
(0.134)
0.606 ***
(0.099)
0.633 ***
(0.117)
0.154
(0.218)
Treated−0.131
(0.119)
−0.114
(0.120)
0.164
(0.105)
−0.453 ***
(0.149)
Sample number417439423168
R20.1510.2400.1380.216
Note: *, **, and *** indicate significance at the 10%, 5%, and 1% levels, respectively. Brackets indicate robust standard errors.
Table 8. Heterogeneity of the regions.
Explained Variable: Food Industry’s EE in Different Regions
Explanatory VariableEasternCentralWestern
Policy dummy variables1.497 **
(0.667)
0.344
(0.209)
−0.264
(0.205)
GDP per capita−0.401 ***
(0.104)
−0.861 ***
(0.265)
−0.745 ***
(0.226)
Proportion of secondary industries in GDP−0.597
(0.444)
−0.028
(0.024)
0.017
(0.012)
Proportion of tertiary industries in GDP−0.003
(0.034)
−0.075 **
(0.030)
0.022
(0.021)
Number of patent applications−0.022
(0.044)
0.426 ***
(0.102)
0.125 *
(0.073)
Urbanization rate0.368 ***
(0.092)
0.022 *
(0.012)
0.027 **
(0.011)
Proportion of older adult population−0.007
(0.028)
−0.033
(0.022)
−0.058 **
(0.025)
Time0.760 ***
(0.239)
1.353 ***
(0.171)
0.628 ***
(0.172)
Treated−0.470
(0.400)
0.277 **
(0.115)
0.036
(0.158)
Sample number48128124
R20.4450.5420.238
Note: *, **, and *** indicate significance at the 10%, 5%, and 1% levels, respectively. Brackets indicate robust standard errors.
Table 9. Mediating mechanism of energy consumption structure.
(1)(2)(3)
Explanatory VariableEE of Food IndustryEnergy Consumption StructureEE of Food Industry
Policy dummy variables0.383 **
(0.156)
−0.063 **
(0.028)
0.386 **
(0.162)
Energy consumption structure −0.325 *
(0.171)
Control variablesYYY
Time-fixed effectYYY
Region-fixed effectYYY
Sample number448510448
R20.2160.3930.187
Note: * and ** indicate significance at the 10% and 5% levels, respectively. Brackets indicate robust standard errors.
Table 10. Mediating mechanism of technological innovation.
(1)(2)(3)
Explanatory VariableEE of Food IndustryEnergy Consumption StructureEE of Food Industry
Policy dummy variables0.383 **
(0.156)
0.251 ***
(0.080)
0.367 **
(0.163)
Energy consumption structure 0.089 **
(0.035)
Control variablesYYY
Time-fixed effectYYY
Region-fixed effectYYY
Sample number448510448
R20.2160.9430.192
Note: ** and *** indicate significance at the 5% and 1% levels, respectively. Brackets indicate robust standard errors.
Disclaimer/Publisher’s Note: The statements, opinions and data contained in all publications are solely those of the individual author(s) and contributor(s) and not of MDPI and/or the editor(s). MDPI and/or the editor(s) disclaim responsibility for any injury to people or property resulting from any ideas, methods, instructions or products referred to in the content.

