Article

An Integrated Model for Risk Assessment of Urban Road Collapse Based on China Accident Data

1
Research Institute of Emergency Science, Chinese Institute of Coal Science (CICS), Beijing 100013, China
2
China Coal Technology & Engineering Group (CCTEG), Beijing 100013, China
*
Authors to whom correspondence should be addressed.
Sustainability 2024, 16(5), 2055; https://doi.org/10.3390/su16052055
Submission received: 25 January 2024 / Revised: 28 February 2024 / Accepted: 28 February 2024 / Published: 1 March 2024
(This article belongs to the Special Issue Risk and Resilience Analysis of Road Tunnels)

Abstract

:
With the deepening development and utilization of urban underground space, the risk of urban road collapse is becoming increasingly prominent, which is a serious threat to the safety of life and property. Therefore, the risk assessment of urban road collapse has vital significance for the safety management of cities. The main idea is to predict ongoing accidents by analyzing historical accident cases in depth. This paper explores the combination of Interpretative Structural Modeling (ISM) and Bayesian Networks (BNs) to construct a risk assessment model of road collapse. First, the main risk factors of road collapse and their coupling relationships are identified, which is used to increase the low reliability of complex systems. Then, the risk factors of road collapse are logically divided by ISM to obtain the BN hierarchy. Finally, the BN node probabilities are evaluated by the Expectation–Maximization (EM) algorithm using the collected 92 real road collapse accident cases. The model can be used to quantify the coupling strength and influence degree of each risk factor on the occurrence of road collapse accidents, which in turn can predict the probability of road collapse accidents in a given scenario. This study can provide a theoretical basis for urban safety management and reduce the risk of road collapse and potential loss of life and property, which is important for the sustainable development of societies.

1. Introduction

As the urbanization process continues to accelerate, the number of road infrastructure construction projects has been increasing year by year in China. A large amount of underground space is being utilized for the development and construction of public facilities such as rail transit, various urban lifelines, and urban comprehensive utility tunnels [1]. However, with the increasing level of utilization of urban underground space, the impact of human activities on the subsurface geological environment has been increasingly intensified, and the ensuing urban safety problems represented by road collapse have been more prominent. Ground collapse refers to a phenomenon or process in which the surface rock and soil bodies are affected by natural factors or human engineering activities to fall downward and form subsidence pits (holes) on the ground and cause disasters [2]. Due to the sudden, hidden, and destructive characteristics of road collapse [3], it will not only lead to property loss and affect normal production and life but also cause panic among the masses. Thus, road collapse risk assessment is important for accident early warning and early emergency response, which is important for promoting the sustainability of societies.
The occurrence of urban road collapse is the result of a combination of human and natural factors [1,2,3]. The first step in implementing the risk assessment of road collapse is to identify risk factors. Existing studies related to collapse risk assessment mainly focus on geological and environmental indicators, such as lithology and soil type [4,5], changes in river and groundwater levels [6], quantity of rainfall [7], fault zones [8], etc. Related studies on the influence of human factors on road collapse have mainly focused on vehicle loads [9,10], underground construction [11], etc., and have insufficient attention to management factors. Moreover, research on risk assessment of urban road collapse has a high degree of concentration on risk factor selection, focusing mainly on a few specific risk factors [12] and paying insufficient attention to the coupling effect among multiple risk factors, such as evaluating the probability of occurrence about urban road collapse based on pipeline ruptures [13,14,15], soil type [16] and rainfall [17], underground structures [18], etc. This type of approach analyzes in depth the influence mechanism of specific risk factors on road collapse accidents, but the coupling mechanism of multiple risk factors is not sufficiently explored. As a result, there is an urgent need to further improve the accuracy of the risk assessment model for road collapse based on the collection and analysis of accident case data and intensively study the comprehensive impact of multiple risk factors on urban road collapse accidents.
This paper aims to construct a risk assessment model for urban road collapse. Traditional risk assessment models have been widely used in collapse risk assessment. Existing research mainly incorporates risk factors represented by soil type and pipeline ruptures into road collapse risk assessment models and classifies and grades road collapse losses. Then, road collapse losses are categorized and rated, and semi-quantitative ground collapse risk assessment is realized through consequence prediction grading. The existing road collapse risk assessment model based on fuzzy comprehensive evaluation assumes that each risk factor is relatively independent, and insufficient consideration is given to the coupling relationship between each factor [7,19,20,21,22,23,24,25]. The accuracy of road collapse risk assessment models based on the analytic hierarchy process [1,26,27,28,29,30,31] and weighted arithmetic mean method [12,32,33,34,35,36] heavily depends on the level of expert knowledge with high subjectivity. Consequently, the validation of the assessment results based on accident cases is difficult to realize, and it is still necessary to build a quantitative risk assessment model for urban road collapse accidents based on the coupling relationship between road collapse risk factors. Machine learning models have been widely used in disaster risk assessment [37,38], and models such as Convolutional Neural Networks (CNNs) [39,40], Artificial Neural Networks (ANNs) [41,42], and Support Vector Machines (SVMs) [43,44] are beginning to be used in risk assessment for natural disasters with large amounts of monitoring data, such as earthquakes and floods. However, the process of modeling quantitative risk assessment for urban road collapse accidents is not yet directly applicable to the process of modeling natural hazard risk due to its characteristics of multiple risk factors and difficulty in capturing accident data.
This paper proposes a risk assessment model combining ISM and BN models to predict the probability of urban road collapse accidents. Risk factors are defined by limited case analysis and literature research. The selected risk factors of road collapse are not necessarily causally related to each other, and there is a more complex coupling relationship. Therefore, traditional causal inference methods are not applicable to constructing hierarchical structures among risk factors. The risk assessment model proposed in this paper integrates the coupling effect of each risk factor on road collapse accidents and can also predict the change in accident probability by changing the state of a single risk factor. In this paper, ISM is selected to sort out the hierarchical structure among risk factors of road collapse, learn parameters by BN, and determine the accident case data structure. The influence intensity of each factor on road collapse is quantitatively evaluated by how the probability of road collapse changes with the state of the risk factor by selecting the risk factors with the greatest influence on road collapse accidents for different scenarios, providing decision-making support for risk prevention and control departments. The ability of the constructed model to predict the probability of urban road collapse is verified with the real accident case. This study provides new ideas for identifying the risk factors of urban road collapse, predicting the probability of collapse, and improving urban safety management.

2. Methodology

In this paper, the risk assessment model of road collapse was constructed using the ISM and BN models. Urban road collapse accidents are the result of the combined effect of multiple risk factors. Therefore, the risk factors were identified, and their coupling relationship was sorted out to reveal the combined effects of each risk factor on road collapse, which can be used to assess and predict the collapse risk. In this paper, we established a risk assessment model for road collapse accidents by deducing the influence mechanism of each risk factor on road collapse accidents and verifying the feasibility of the model through real cases. The framework of methodology used in this paper is shown in Figure 1, which includes three phases.
Phase 1: determination of risk factors. The risk factors that cause road collapse are preliminarily identified through research and combing of literature. Selected 10 experts are invited to evaluate the relationships between the identified risk factors, and the consistency of the summarized experts’ opinions is tabulated.
Phase 2: construction of risk assessment models. Determining the relationship between the various risk factors on road collapse through ISM, the hierarchical division between the risk factors is determined. The BN structural framework is constructed based on the hierarchy of risk factors. Based on the EM algorithm, Bayesian parameters are learned from collected case data of road collapse accidents to establish the risk assessment model.
Phase 3: model application in risk assessment and decision support. The mechanism of each risk factor’s role in road collapse accidents and its degree of influence are sorted out by analyzing the influence change of single factor state on collapse probability. A real road collapse accident scenario is selected to verify the application of the proposed risk assessment model in risk assessment and decision support.

2.1. Interpretative Structural Modeling

Interpretive Structural Modeling (ISM) is a model method used to analyze the hierarchical structure of complex systems [45]. This method makes it possible to construct a hierarchical structural model of the elements in the system and visualize the overall structural relationships. It is often used to stratify the factors affecting the target variable. The exact process of the method is as follows.
1.
The adjacency matrix
The coupled logic diagram of the risk factors reflects the interactions between the factors. According to the logical relationship diagram of each risk factor of road collapse accidents, an adjacency matrix M with n rows and n columns can be constructed. n is the number of risk factors for road collapse accidents, and the values of the elements within the matrix are shown in Equation (1). If the factor F i has an effect on F j , the value of m i j is 1. Conversely, if the factor F i has no effect on F j , the value of m i j takes 0.
m i j = 1 :   ( w h e n   F i   h a s   a n   d i r e c t   e f f e c t   o n     F j ) 0   : ( w h e n   F i   h a s   n o   e f f e c t   o n     F j )
2.
The reachability matrix
R is the reachability matrix of the adjacency matrix M . ( M + I ) is the sum of the adjacency matrix A and the unit matrix I . Then, the exponentiation of the matrix ( M + I ) for the integer n is calculated using Equation (2).
R = ( M + I ) n + 1 = ( M + I ) n M + I 2 ( M + I )
The above exponentiation is obtained based on the Boolean algebra algorithm [45], and the matrix R is a reachable matrix. If the element r i j is 1, it denotes the risk factor F i can reach the factor F j . If the element r i j is 0, it denotes the risk factor F j is not reachable by the factor F i .
3.
The reachable set and the antecedent set
The reachable and current sets are obtained based on decomposing the reachable matrix. The reachable set S ( F i ) is the set sum of other factors that can be triggered by a risk factor through a certain path. The antecedent set A ( F i ) is the set sum of factors that this risk factor can reach. Intersection of reachable sets and antecedent sets L F i = R ( F i ) A ( F i ) .
4.
The hierarchical decomposition of the reachable matrix
Elements in a coupled system are usually disordered. Therefore, it is possible to sort out the logical relationship between risk factors by decomposing the reachability matrix. Moreover, it contributes to enhance the understanding of the coupled influence mechanism between risk factors, and further distinguish between direct and indirect influences between factors. The influencing factors can be extracted layer-by-layer by solving the reachable set S F i , the antecedent set A F i , and the intersection set L F i for each risk factor. The hierarchy of the urban road collapse system can be divided according to the extraction order.
5.
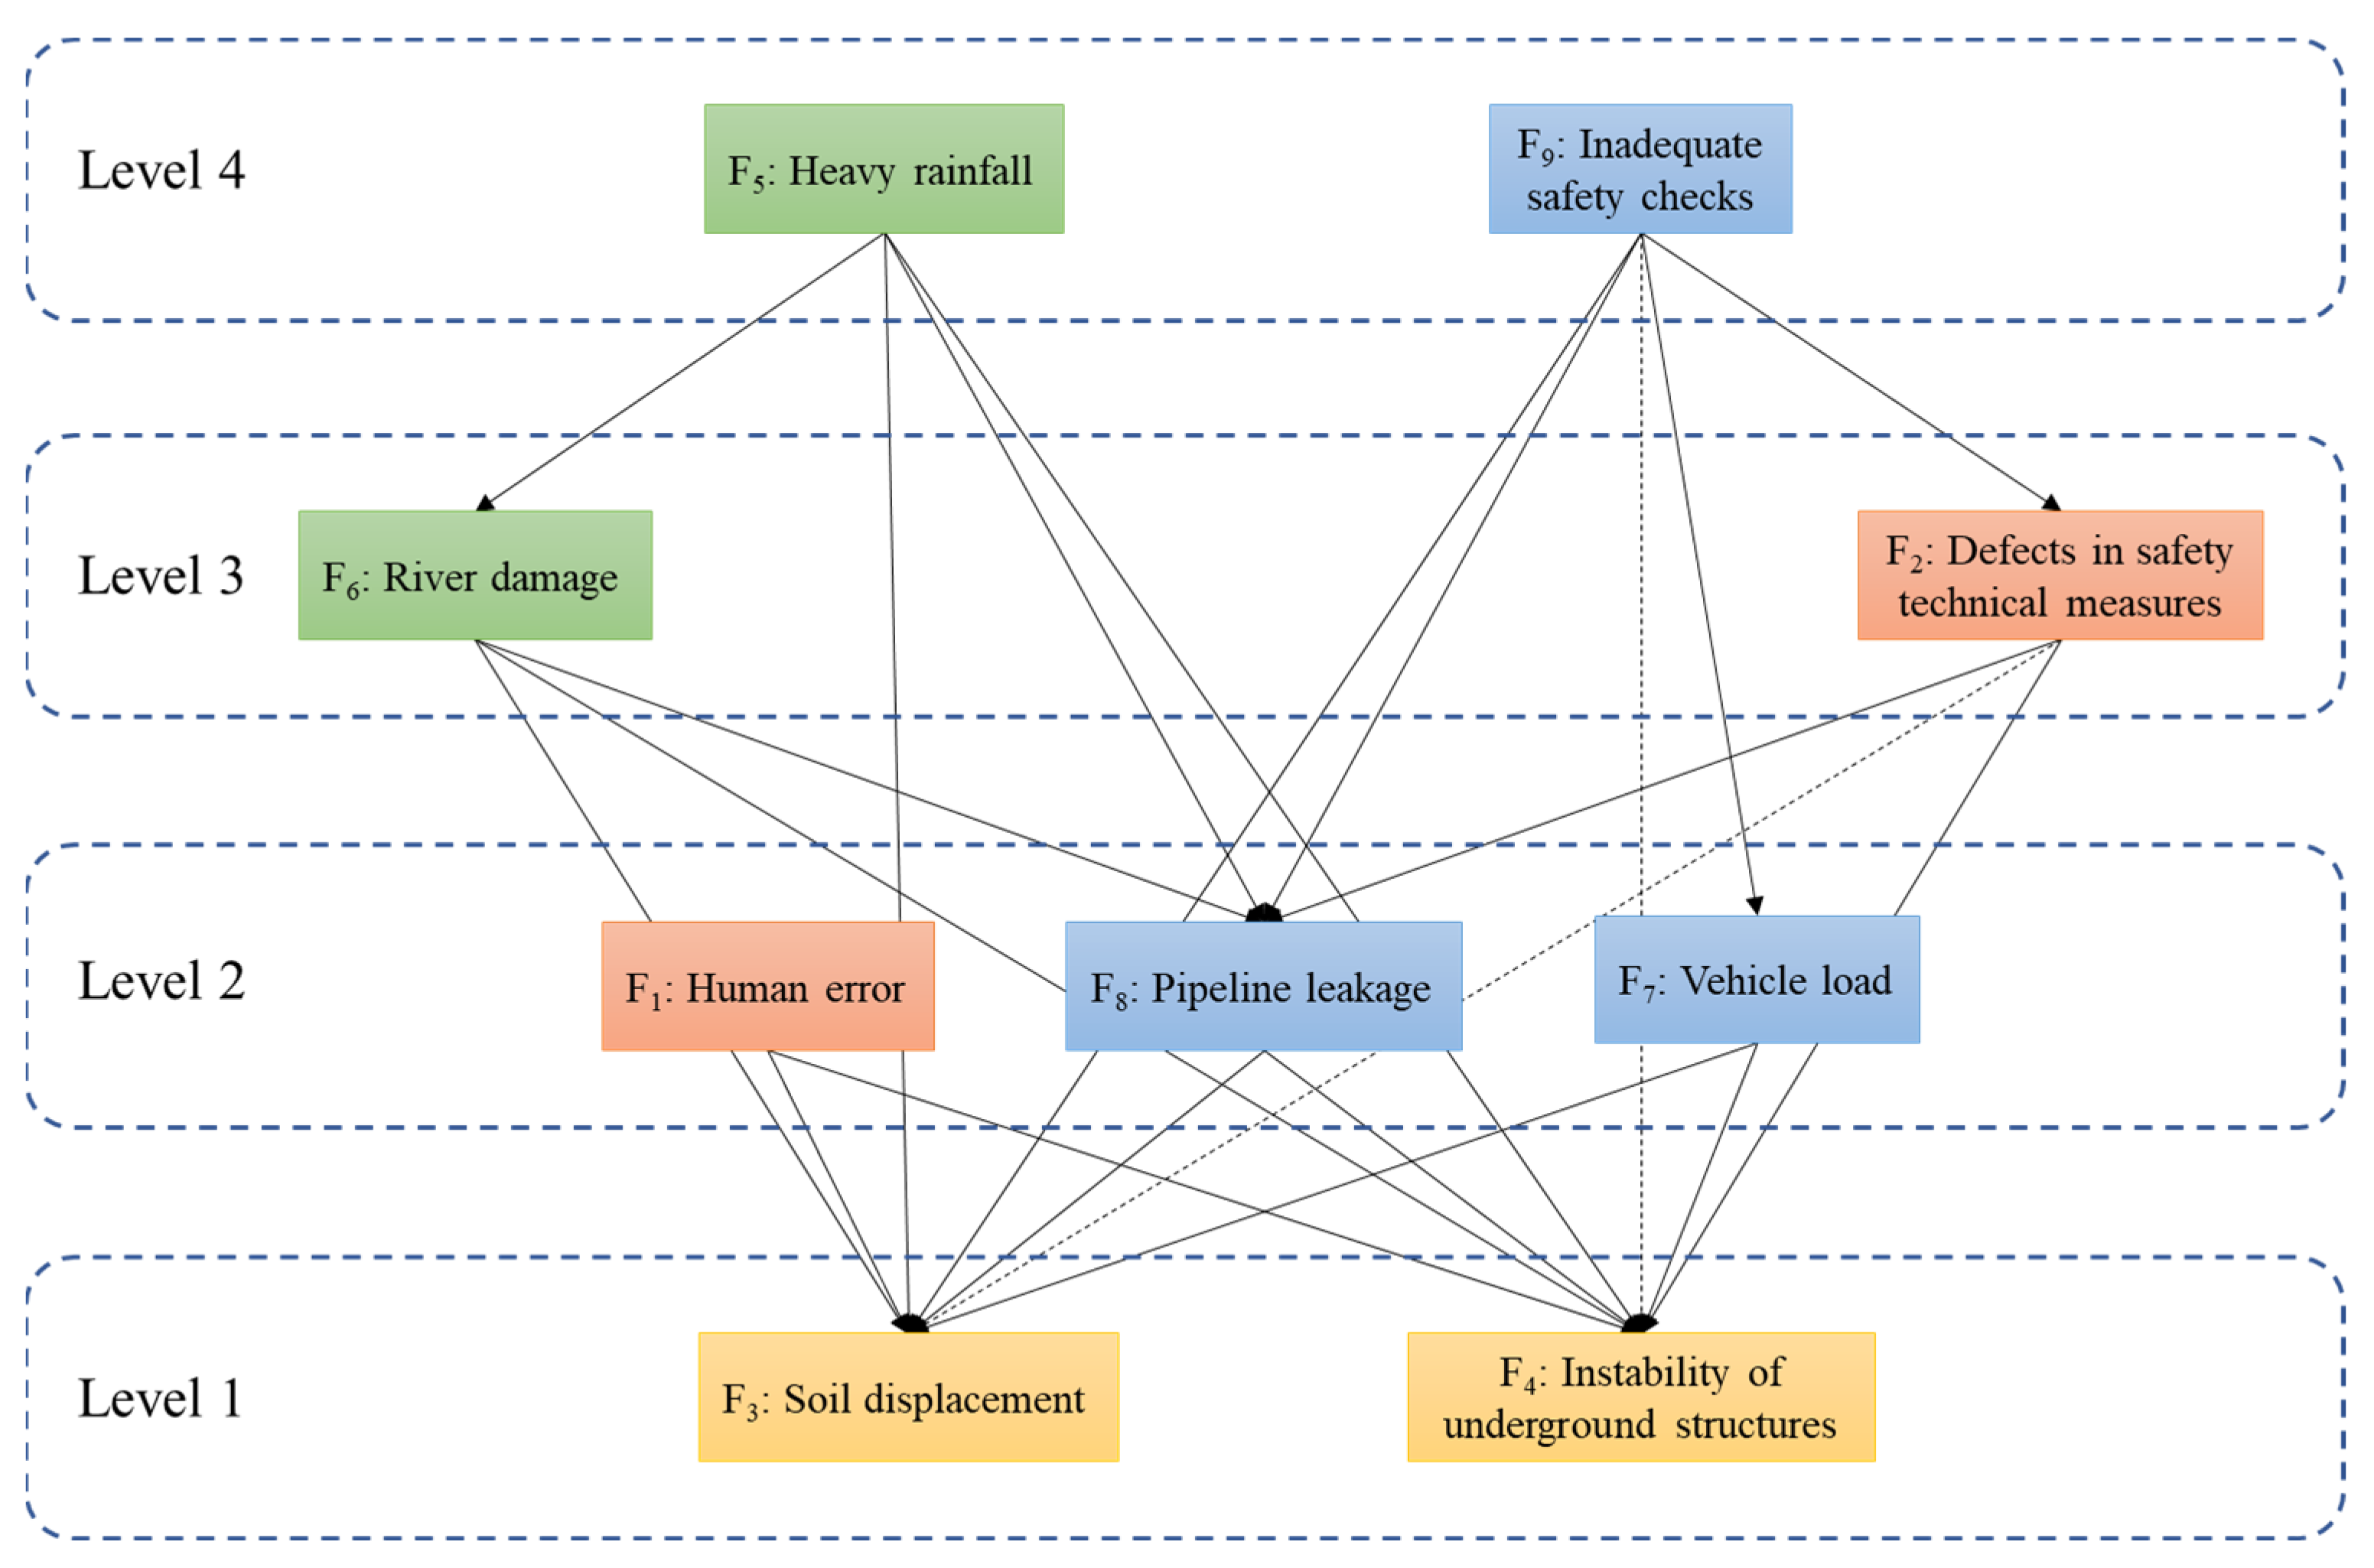
The hierarchical diagram of the risk factors
After the hierarchical decomposition, the hierarchical structure diagram is constructed based on the hierarchical results and the relationship between the risk factors.

2.2. Bayesian Network

Bayesian networks are based on Bayesian decision theory [46]. Combined with graph theory methods, the risk factors are expressed through nodes and the logical relationships between risk factors are expressed through directed connections between nodes and conditional probabilities between nodes. It is suitable for analyzing risk warning problems with complex development and evolution processes.
The Bayes’ theorem is the basis of Bayesian decision theory [47]. Bayes’ theorem is simplified as follows based on the decision problem, E = E 1 ,   E 2 ,   E i ,   E n , which is the set of possible events. P ( E i ) is the probability of occurrence of event E i , which is often referred to as the a priori probability, E i E j = ,     i j ,   i ,     j = 1 ,   2 ,   , n . P ( I ) is the probability of occurrence of event I , which occurs only if partial event E i occurs. When event I occurs only in the presence of a partial event E i , P ( I / E i ) is the occurrence probability of event I with given occurrence probability of event E i . Thus, given that event I has occurred, the conditional probability of event E r is
P E r / I = P E r P ( I / E r ) P ( I ) = P E r P ( I / E r ) j = 1 n ( E j ) P ( I / E j )
Bayes’ theorem is the theoretical basis of BN, which combines a priori cognition with actual observations, and uses new observations to continuously update our knowledge of the unknown parameters to obtain a new posteriori cognition. In this paper, the nodes in BN represent the variables (road collapse risk factors), the arcs represent the influence relationships between the nodes, and CPT (Conditional Probability Table) is used to quantify the strength of complex dependencies between random variables.

2.3. Expectation–Maximization Algorithm

The EM algorithm was first proposed in 1977 by Dempster et al. [48]. The idea is to group the data used for parameter estimation, estimate the parameters separately within each group, and regroup the data according to the new estimated parameters. The alternate iterations for data decomposition and parameter estimation are used to improve the quality of parameter estimation. The grouping results will eventually converge with the parameter likelihood increases. The algorithm is used to solve the estimation problem when the system parameters are missing. Now, it can be used to solve the problem of parameter estimation under a small amount of data through continuous improvement. The specific steps are as follows:
Inputs: observed variable data Y , latent variable data Z , joint distribution P ( Y ,   Z | θ ) , and conditional distribution P ( Z | Y , θ i ) ;
Output: model parameters θ .
(1)
Parameters are initialized and iteration starts.
(2)
Solve the expectation: θ i is the estimated value of θ at iteration step i . The expectation Q ( θ , θ i ) is calculated as follows:
Q θ , θ i = E Z [ log P Y , Z θ | Y , | θ i ] = Z log P Y , Z θ P ( Z | Y , θ i )
(3)
Expectation maximization: θ is obtained by maximizing Q ( θ , θ i ) . The value θ i + 1 of the next iteration at step ( i + 1 ) is calculated from Equation (5).
θ ( i + 1 ) = arg   max θ Q ( θ , θ i )
(4)
Repeat the expectation-solving step and the expectation-maximization step until convergence.

2.4. Construction of Risk Assessment Model

2.4.1. Identification of Risk Factors

Based on the safety system engineering theory, the risk factors of road collapse accidents are sorted out from four aspects: human, physical, environmental, and management factors. Through the comparative analysis of related literature, it can be summarized that there are certain similarities in the causes of urban road collapse accidents through the comparative analysis of the related literature [1,2,3]. The reports of major urban road collapse accidents in recent years are selected for a depth analysis, which is shown in Table 1; the risk factors are shown in Table 2.
Based on the analysis of 92 cases of urban road collapse accidents, this study focuses on analyzing the mechanism of human and management factors in ground collapse accidents. Although the environmental factors and physical factors are important risk factors, their influence mechanism on the road collapse accident is only used as a reference in this model. Because they have been taken into account in the initial stage of the design of the road and underground space, the natural environment risk factor is difficult to avoid. The 92 cases of road collapse accident data analyzed in this paper are mainly from the accident investigation report, which has a more adequate analysis and elaboration of human factors and management factors as the more common risk factors for road collapse accidents, human and management risks are easier to avoid than objective factors such as the environment. Moreover, human and management factor-related interventions can play an important role in preventing road collapse accidents [3].

2.4.2. Hierarchical Structure of Road Collapse

The construction of a Bayesian Network for urban road collapse accidents requires determining the structure of the network among risk factors and its parameters. This section analyzes the coupling relationship between risk factors for road collapse accidents and identifies their hierarchical structure. The interactions between risk factors of road collapse were evaluated by selected experts, whose opinions were obtained through questionnaires. First, 5 relevant experts were invited to complete the first round of the questionnaire, which consisted of 9 similar structured questions. The question format is: Please select the risk factor(s) that have an impact on XX factor(s). The options included the 8 factors in Table 2 in addition to the factor in question, and the response format was multiple choice. If all 5 experts agreed that there was an influential relationship between the two factors, the influence between two risk factors was defined. If at least 1 expert considered that there was no influence between the two factors, the question was left for the second round of the questionnaire. Three additional experts were invited to the second round of questionnaires, but the questionnaires only addressed impact relationships that were not specified in the previous round. Influence relationships that were all confirmed by the interviewed experts in the second-round questionnaires were added to the coupling relationships, and other influence relationships were not established. The establishment of the coupling relationship between the factors helps to further optimize the initial risk factor structure, which can be used as the basis for eliminating the independent factors, merging the overlapping factors, and finally obtaining the coupling relationship between the risk factors of the urban road collapse accident.
The resulting coupling relationships between risk factors need to be hierarchically structured before they can be mapped into a Bayesian Network structure. The ISM was used to classify the risk factors into multiple levels. The adjacency matrix was extracted from the coupling relations, as shown in Table 3, which is the initial input matrix of the ISM. The reachable matrix is shown in Table 4. It can be obtained through the matrix calculation, which indicates there is a certain influence path between two factors.
The reachable set S and the antecedent set A are separated from the reachable matrix and set L is their intersection. Their specifics are shown in Table 5. The risk factor decomposition can be realized by using the intersection L , as shown in Table 6. The 9 risk factors were organized into 4 levels. F3 (Soil displacement) and F4 (Instability of underground structures) were on the first level. F1 (Human error), F7 (Vehicle load), and F8 (Pipeline leakage) were on the second level. F2 (Defects in safety technical measures) and F6 (River damage) were on the third level. F5 (Heavy rainfall) and F9 (Inadequate safety checks) were on the fourth level.
At this point, the initial hierarchical relationship graph between road collapse risk factors was further optimized to obtain a hierarchical network. Two other experts were invited to verify the initial hierarchical relationships of the road collapse risk factors, which mainly consisted of eliminating redundant relationships between the risk factors and checking their compatibility with the BN structure. The invited experts considered the initial hierarchical relationships to be compatible with the BN structure and identified some of the redundant influence relationships that could be eliminated. Figure 2 illustrates the optimized influence relationships between risk factors, with the dashed line showing the deleted redundant relationships. For example, the effect of F9 (Inadequate safety checks) on F4 (Instability of underground structure), F9 mainly affects F4 by influencing F8 (Vehicle load) and F7 (Pipeline leakage), so the direct influence between F9 and F4 can be deleted as a redundant relationship. Similarly, the influence relationship between F2 (Defects in safety technical measures) and F3 (Soil displacement) was also deleted. Then, the optimized hierarchical network was mapped onto the BN structure, as shown in Figure 3.

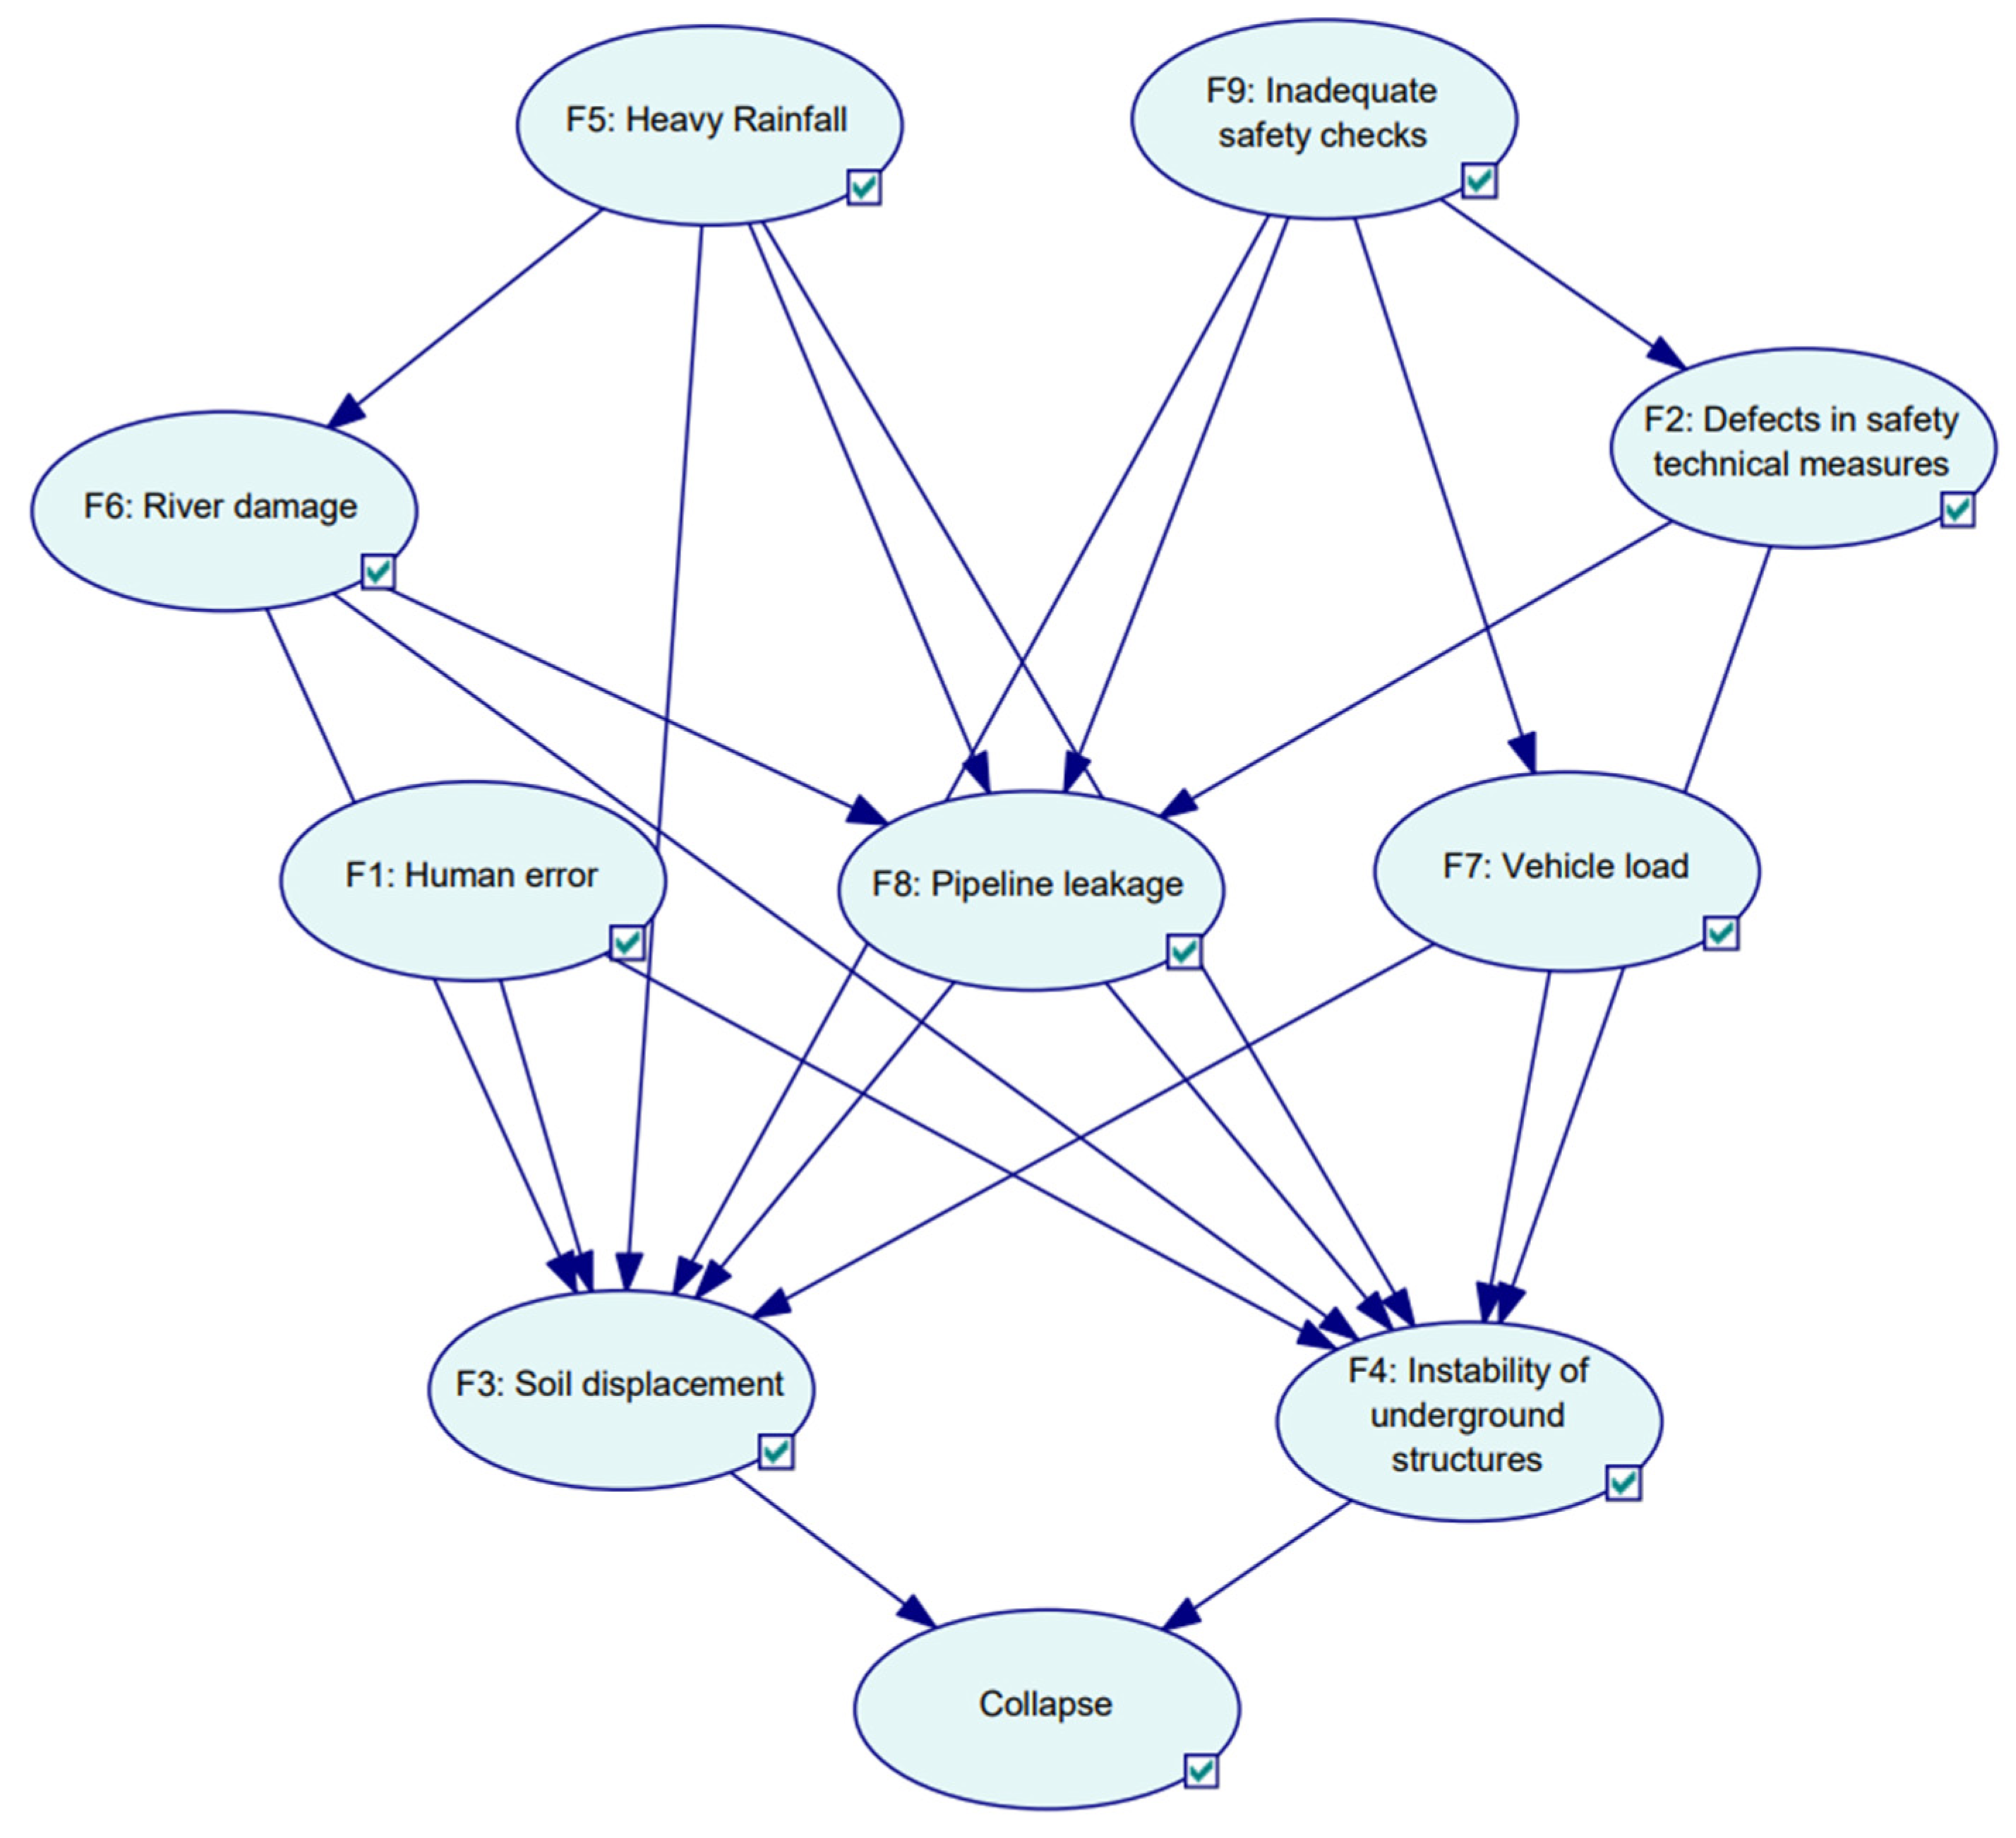
2.4.3. Construction of BN Model

The coupling strength between risk factors was quantified through the BN model to determine the main path of road collapse accidents. Then, the top node “Collapse” was added to the optimized hierarchical network. The risk factor hierarchical network was mapped to the BN structure through GeNIe 4.1, as shown in Figure 3. The status of each node was defined before parameter learning and the value of each factor was divided. The status of the risk factors in this paper was set to “yes/no”, depending on the actual status. For example, for the node F1 (Human error), human error was set as “yes” or “no” based on whether it occurred or not.
a.
BN structure
The implementation of the inference function about the BN structure needed to be combined with corresponding probability parameters. The prior probability needed to be determined for the edge node in the BN structure, and CPT needed to be determined for the non-edge node. The parameter values of all nodes were determined by the EM algorithm, except the “Collapse” node. The parameter values of the “Collapse” node were determined by expert assignment. The determination process of the CPT of the “Collapse” node is shown in Table 7.
b.
Parameter learning
Data learning was used to calculate the parameters of other nodes with the EM algorithm. There are three steps in this process, including case data collection, data standardization, and EM algorithm learning.
Step 1 case data collection
This paper collects data related to urban road collapse accidents through official websites of emergency management departments, WeChat official accounts, and official news. A complete accident investigation report is required for the collected road collapse cases. The case study presented in this paper is primarily based on the investigation report of road collapse accidents. A total of 93 typical road collapse accidents and their corresponding accident investigation reports are collected as required. Then, 92 of these accidents were used as input datasets in the parameter learning of the EM algorithm; 1 additional accident was used as a test case for the collapse risk assessment model.
Step 2 data standardization
Case data from road collapse accident investigation reports need to be standardized before they can be used as a collection of learning data inputs to the EM algorithm. Until then, a data standardization criterion needs to be established for road collapse investigation reports. This criterion is mainly reflected in setting the nodes in the BN structure to the corresponding status values. The standardization of node F1 (Human error) is taken as an example, as shown in Table 8. When an expression similar to “illegal construction”, “unprofessional operation”, “dangerous operation”, etc. appears in the report, the status of F1 is defined as “yes” at this point; otherwise, it is “no”. Then, the standardized dataset can be built to input into GeNIe 4.1 by the space part of the standardized dataset, as shown in Table 9.
Step 3 Parameter learning based on EM algorithm
Finally, the standardized dataset was imported into the BN model for road collapse accidents using GeNIe 4.1. The probability of each node in the BN structure was calculated using the EM algorithm. The probability of urban road collapse can be predicted after parameterizing the BN, which is presented in the next section.

3. Results and Discussion

3.1. Action Mechanism of Risk Factors

In the hierarchical network, F5 (Heavy rainfall) and F9 (Inadequate safety checks) comprised the underlying risk factors. They only had a one-way impact on other risk factors but were not affected by other risk factors. These risk factors are defined as basic risk factors or potential risk factors. The impact of these risk factors on road collapse accidents is indirect and important, although it may not seem obvious. In contrast to this, F3 (Soil displacement) and F4 (Instability of underground structures) were the top factors in the hierarchical network. They were only influenced by other risk factors in one direction but did not affect other risk factors. These risk factors are defined as direct factors, which are the more direct causes of road collapse accidents. Moreover, the other risk factors are defined as independent risk factors, such as F1 (Human error), F2 (Defects in safety technical measures), F6 (River damage), F7 (Vehicle load), and F8 (Pipeline leakage). These risk factors serve as a connecting link between the preceding and the following in the hierarchical network. They may not only be influenced by other factors but also have an impact on them. The accident investigation report focuses more on identifying indirect risk factors that cause road collapse. In this risk assessment model, the basic risk factors play a role in the development of accidents by influencing other factors. The indirect risk factors play a role by influencing the direct factors, which often directly lead to road collapse.

3.2. Influence Intensity of Individual Risk Factor

It is possible to gain a deeper understanding of the role of each factor in road collapse accidents by analyzing the mechanism of different risk factors. For the safety management of the relevant sectors, the impact of risk factors should be eliminated as far as possible by taking into account the overall relevant safety. Managers should not only focus on the prevention and resolution of direct risk factors but also take effective measures to avoid the impact of indirect and potential factors.
Risk assessment models for road collapse accidents focus on decision support for safety managers. The status of each node (risk factors) within the model is changed by the effective application of some security management measures. For example, the node status of F9 (Inadequate safety checks) can be changed from a “yes” status to a “no” status through rational planning of inspection cycles and effective implementation of daily inspections. The effectiveness of the measures taken to prevent the occurrence of accidents is reflected in how the state of the nodes can be changed to avoid the occurrence of road collapse accidents. It can be assessed by the extent to which a single factor influences a road collapse accident. Therefore, it is significant for decision support by analyzing the influence intensity of a single risk factor on road collapse accidents. During the calculation process, when the status or probability distribution of a node changes, it can be simply evaluated by the change in probability of the top nodes, each of which is ranked by the strength of its influence. For example, when the status of node F4 (Instability of underground structures) changed from “Yes” to “No”, the probability of road collapse decreased from 67% to 23%, a decrease of 44%, which indicates that maintaining the stability of underground structures plays a key role in reducing the risk of road collapse. This paper does not consider the normalization of different risk factors and focuses mainly on reducing the risk of urban road collapse accidents by changing the status of risk factor combinations. The influence intensity of each risk factor on road collapse accidents is shown in Table 10.
The influence intensity of each risk factor can be obtained by comparing the differences in probability changes. The order of influence intensity from highest to lowest was: F4 (Instability of underground structures) > F3 (Soil displacement) > F1 (Human error) > F9 (Inadequate safety checks) > F6 (River damage) > F5 (Heavy rainfall) > F8 (Pipeline leakage) > F2 (Defects in safety technical measures) > F7 (Vehicle load). It can be seen that “Instability of underground structures” and “Soil displacement” had a greater impact on urban road collapse, accounting for about 40% of the total. “Defects in safety technical measures” and “Vehicle load” had a relatively small impact among the many risk factors. It is possible to plan a combination of decisions to reduce the overall risk by evaluating the effectiveness of each risk factor in reducing the risk of road collapse, especially if the sector concerned has limited risk control investment.

3.3. Case Study

3.3.1. Case Introduction

Risk prediction mainly refers to the estimation of the probability and impact of accidents through various scientific and technical means based on available data and known information. This paper is concerned with the probability prediction of urban road collapse accidents. The core idea is to set the relevant node status based on the known risk factor information and estimate the status situation of other nodes through BN inference. The risk prediction process in this section is based on a real case of an urban road collapse accident, which was not added as a learning case to the input dataset.
The real collapse accident case for validation of the risk assessment model was the “20220818” urban road collapse accident in Longhua Street, Shenzhen City, Guangdong Province. The case scenario was set up as follows. City A has a sewer pipeline leakage that needs rehabilitation operations. The contractor for the rehabilitation operations is B, the contracting company is C, and the supervisory company for the project is D. After winning the bid, Company C subcontracted the labor for the pipeline rehabilitation to Company E. The following conditions are known: (1) the specific construction personnel in Company E did not provide the foundation pit support during excavation; (2) the relevant technicians in Company C were not present to perform their duties during construction, and had neglectful management and oversight in the operation process; (3) Company D did not fulfill its supervisory duties; (4) the construction purpose was pipeline rehabilitation to the sewage pipe; and (5) displacement of unsupported soil in the pit.

3.3.2. Risk Prediction of Road Collapse

Based on the scenario setup above, the status of the five nodes with known information can be determined, as shown in Figure 4. For example, the status of node F9 (Inadequate safety checks) was set to “Yes”, and the status of node F5 (Heavy rainfall) was set to “No”. Therefore, the probability of a road collapse accident in this case was 98% through BN deduction. In this paper, the risk of road collapse accidents was categorized into three levels based on the probability: below 33% as low risk, 33–67% as medium risk, and more than 67% as high risk. It can be seen that the probability of road collapse accidents in the simulation scenario was very high, and timely measures must be taken to avoid them. In the real accident case, the road collapse was precisely due to the construction workers not providing support in the excavation pit, and the collapse accident caused the death of the excavation operation workers. The prediction results are in good agreement with the actual results of the accident.
The prevention and control of road collapse accidents are mainly aimed at human factors and management factors. The states of risk factors F1 (Human error), F2 (Defects in safety technical measures), F8 (Pipeline leakage), and F9 (Inadequate safety checks) in this case were changed to predict the road collapse result. When the state of F1 changed from “yes” to “no” and the states of other risk factors remained unchanged, the model predicted a 57% probability of road collapse accidents. When the state of F2 changed from “yes” to “no”, the model predicted a 29% probability of road collapse accidents. When the state of F8 changes from “yes” to “no”, the model predicts a 61% probability of road collapse accidents. When the state of F9 changed from “yes” to “no”, the model predicted a 35% probability of road collapse accidents. It can be seen that F2 (Defects in safety technical measures) and F9 (Inadequate safety checks) were the two controllable risk factors that had the greatest impact on road collapse accidents in this case. This is consistent with the statement in the official accident investigation report that it “did not provide the foundation pit support during excavation” and “did not fulfill its supervisory duties”. The feasibility of the risk assessment model is verified by the collapse risk prediction of the real case.

4. Conclusions

In this paper, a risk assessment model for urban road collapse is constructed by combining ISM and BN. These include several key steps, risk factor identification of road collapse, coupling relationship analysis among risk factors, risk assessment of road collapse, and BN inference for supporting safety decisions. The main conclusions are as follows.
  • Based on risk factor identification and coupling relationship analysis, this research deepens our understanding of risk management for urban road collapse accidents. In response to some of the problems that exist in the qualitative study of road collapse accidents, this paper detects, through a limited number of case studies, that management factors and human factors are important causes of road collapse accidents in China. Thus, safety systems engineering theory (people, machines, environment, and management) is selected as the framework for risk factor composition. The process of determining the risk factors for road collapse accidents paid more attention to human and management factors from a safety management perspective (two human factors and three management factors are included in the nine risk factors).
  • The risk assessment model for urban road collapse is constructed based on BN, and the road collapse probability is quantitatively analyzed through real accident cases. The hierarchical network structure of road collapse incidents is mapped to BN using GeNIe 4.1. Ninety-two cases of Chinese urban road collapse accidents are collected from various online sources, and their accident reports are compiled into an accident dataset. After normalizing and organizing the accident data, the EM algorithm is used to determine the parameters of each node of the accident. The model can be used to quantify the influence intensity of each risk factor on road collapse accidents and to predict the probability of urban road collapse. Risk prediction results based on datasets constructed from real accidents can provide valuable references for safety decision-making in relevant departments.
  • The proposed risk assessment model for road collapse can be used to support safety management decisions in relevant departments. Scenario deduction based on real accident scenarios verifies the reasonableness of the established risk assessment models for road collapse. Substituting the accident scenarios into the established risk assessment model, the deduced occurrence probability of road collapse is high and consistent with real accident cases. Furthermore, the deduction process of the risk assessment model can intuitively obtain the probability change of each node, which helps the relevant departments to make corresponding safety decisions more efficiently and accurately.
This study can provide a theoretical basis for the prevention and emergency response of urban road collapse accidents. The effectiveness of each risk factor in reducing the risk of road collapse has been assessed by analyzing the action mechanism and influence intensity of each risk factor on collapse accidents. It can support the relevant departments in making targeted safety decisions, especially when their capacity is limited. In addition, the model has certain reference significance for risk prediction of urban road collapse accidents, which contributes to the further improvement of the predictability and accuracy of risk assessment for road collapse accidents.
In the face of the severe situation of frequent urban road collapse accidents, this study can help the relevant departments to optimize resource allocation in the case of limited capacity and avoid the greater risk of road collapse accidents at a lower cost. Risk prediction models can be used to assess the probability of urban road collapse under specific scenarios, provide early warning of collapse accidents, and suggest targeted safety decisions. It is also hoped that the results of this research will contribute to urban safety management in China.
In addition, due to the limitations of this study, the risk assessment model of urban road collapse in this paper is only a preliminary model that needs to be improved in the future. First, the data source of urban road collapse accident cases is relatively single, and the learning results of model parameters will be limited by the number of accident cases. In the future, further case data about urban road collapse accidents can be accumulated over time, and the case dataset can be continuously enriched. In addition, analyzed cases validated with relevant scenarios can be added to the value dataset to further improve the proposed risk assessment model. The continuous enhancement of the case dataset will lead to better learning, which can further improve the accuracy of the model. Meanwhile, with the increasing and standardized data on real road collapse accidents, an attempt can be made to construct a database of urban road collapse accidents in China. The continuous enrichment and improvement of the database will lay the research foundation for risk management of urban road collapse accidents. In addition, with the continuous accumulation of case data, the individual states of road collapse risk factors can be further refined, which will have a positive effect on improving the accuracy of risk prediction with the proposed model.

Author Contributions

Conceptualization, Z.Z.; methodology, Z.Z. and J.Y.; supervision, Q.Q. and J.Y.; visualization, Z.Z. and Y.C.; writing—original draft, Z.Z.; writing—review and editing, D.C. and J.Y.; funding acquisition, Q.Q. and J.Y. All authors have read and agreed to the published version of the manuscript.

Funding

This research was funded by the Innovation and Entrepreneurship Science and Technology Project of China Coal Technology and Engineering Group (No. 2022-2-MS003) and the Innovation and Entrepreneurship Science and Technology Project of Chinese Institute of Coal Science (No. 2021-JSYF-006).

Data Availability Statement

Data are contained within the article.

Conflicts of Interest

All Authors are employed by the company China Coal Technology & Engineering Group (CCTEG), The remaining authors declare that the research was conducted in the absence of any commercial or financial relationships that could be construed as a potential conflict of interest.

References

  1. Chen, Y.A.; Tang, R.; Fang, J.; Kong, F. Analysis on spatio-temporal law and causation of urban road collapse in China from 2014 to 2018. Water Resour. Hydropower Eng. 2020, 51, 108–116. [Google Scholar]
  2. Shi, Q.H.; Wei, H.L.; Tan, F.; Zhou, J.W.; Zhu, J.H. Analyzing the characteristics and reason for the ground collapse hazard in Shenzhen. Bull. Geol. Sci. Technol. 2022, 41, 123–129. [Google Scholar]
  3. Wang, X.W.; Xu, Y.S. Investigation on the phenomena and influence factors of urban ground collapse in China. Nat. Hazards 2022, 113, 1–33. [Google Scholar] [CrossRef]
  4. Papadopoulou-Vrynioti, K.; Bathrellos, G.D.; Skilodimou, H.D.; Kaviris, G.; Makropoulos, K. Karst collapse susceptibility mapping considering peak ground acceleration in a rapidly growing urban area. Eng. Geol. 2013, 158, 77–88. [Google Scholar] [CrossRef]
  5. Li, Y.Y.; Sheng, Y.F.; Chai, B.; Zhang, W.; Zhang, T.L.; Wang, J.J. Collapse susceptibility assessment using a support vector machine compared with back-propagation and radial basis function neural networks. Geomat. Nat. Hazards Risk 2020, 11, 510–534. [Google Scholar] [CrossRef]
  6. Cui, L.Y.; Huang, J.J.; Wu, X.; Chen, J.H.; Jiang, G.Q.; Xu, S.Y. The control of the formation of karst collapse through the ancient Yellow River Fault zone in Xuzhou, China. Carbonates Evaporites 2019, 34, 1–10. [Google Scholar] [CrossRef]
  7. Yan, J.L.; Cheng, Y.; Zhang, A.H.; Zhao, Y.G. The evaluation of highway collapse hazard based on the fuzzy comprehensive evaluation method. Appl. Mech. Mater. 2013, 253, 1593–1597. [Google Scholar]
  8. Liu, Y.J.; Tan, F.; Jiao, Y.Y.; Wang, J.; Wang, W.Y. Risk assessment of ground collapse based on finite interval cloud mode. Saf. Environ. Eng. 2021, 28, 115–120+138. [Google Scholar]
  9. Baylot, E.A.; Mason, G.L.; Green, J.G.; Berney, E.S. Predicting the stability of low volume road embankments in contingency areas. J. Terramech. 2012, 49, 95–101. [Google Scholar] [CrossRef]
  10. Wang, Y.X.; Shi, G.; Tian, X.W.; Li, C.Y.; Cheng, H.Y. Experimental study on city road collapse under vibrating load. Shock. Vib. 2020, 2020, 6074658. [Google Scholar] [CrossRef]
  11. Yao, Q.; Di, H.; Ji, C.; Zhou, S. Ground collapse caused by shield tunneling in sandy cobble stratum and its control measures. Bull. Eng. Geol. Environ. 2020, 79, 5599–5614. [Google Scholar] [CrossRef]
  12. Wang, K.; Zhang, J.W.; Gao, G.Q.; Qiu, J.L.; Zhong, Y.J.; Guo, C.X.; Zhao, W.C.; Tang, K.J.; Su, X.L. Causes, risk analysis, and countermeasures of urban road collapse in China from 2019 to 2020. J. Perform. Constr. Facil. 2022, 36, 04022054. [Google Scholar] [CrossRef]
  13. Zhang, C.; Yue, Y.; Wang, M. Influence of pipeline leakage on ground collapse and its control during adjacent tunnelling. China Civ. Eng. J. 2015, 48, 351–356. [Google Scholar]
  14. Lee, O.S.; Choi, S.S. Effect of circular cavity on maximum equivalent stress and stress intensity factor at a crack in buried pipeline. KSME Int. J. 1999, 13, 350–357. [Google Scholar] [CrossRef]
  15. Yu, K. Research on comprehensive assessment and prevention strategy of drainage system operation risk in a district of Shanghai. Water Wastewater Eng. 2023, 59, 138–144. [Google Scholar]
  16. De Giorgi, L.; Leucci, G. Detection of hazardous cavities below a road using combined geophysical methods. Surv. Geophys. 2014, 35, 1003–1021. [Google Scholar] [CrossRef]
  17. Xiao, W.; Tian, W.P. Hazard assessment and zoning of collapse along highways in China based on backward cloud algorithm. Geomat. Nat. Hazards Risk 2019, 10, 1227–1241. [Google Scholar] [CrossRef]
  18. Zhang, C.P.; Zhang, D.L.; Wang, M.S.; Li, Q.Q.; Liu, S.C. Catastrophe mechanism and control technology of ground collapse induced by urban tunneling. Rock Soil Mech. 2010, 31, 303–309. [Google Scholar]
  19. He, K.Q.; Jia, Y.Y.; Chen, W.G.; Wang, R.L.; Luo, H.L. Evaluation of karst collapse risks induced by over-pumping and karst groundwater resource protection in Zaozhuang region, China. Environ. Earth Sci. 2014, 71, 3443–3454. [Google Scholar] [CrossRef]
  20. Zhang, K.; Zheng, W.B.; Liao, Z.Y.; Xie, H.P.; Zhou, C.T.; Chen, S.G.; Zhu, J.B. Risk assessment of ground collapse along tunnels in karst terrain by using an improved extension evaluation method. Tunn. Undergr. Space Technol. 2022, 129, 104669. [Google Scholar] [CrossRef]
  21. Zhang, B.; Zhang, L.Z.; Yang, H.L.; Zhang, Z.J.; Tao, J.L. Subsidence prediction and susceptibility zonation for collapse above goaf with thick alluvial cover: A case study of the Yongcheng coalfield, Henan Province, China. Bull. Eng. Geol. Environ. 2016, 75, 1117–1132. [Google Scholar] [CrossRef]
  22. Xiang, L.Z.; Yang, W.M.; Shi, J.S.; Zhang, C.S. Fuzzy comprehensive evaluation of land collapse risk in the Xishan mining area, Beijing, China. Geol. Bull. China 2008, 27, 1862–1869. [Google Scholar]
  23. Ruan, Y.F.; Zhang, Q.; Yan, M.; Guo, Y.H.; Cai, L. Karst collapse risk assessment base on AHP-EWM-FT. Saf. Environ. Eng. 2022, 22, 2986–2993. [Google Scholar]
  24. Wu, C.; Guo, Y.; Su, L. Risk assessment of geological disasters in Nyingchi, Tibet. Open Geosci. 2021, 13, 219–232. [Google Scholar] [CrossRef]
  25. Ding, H.H.; Wu, Q.; Zhao, D.K.; Mu, W.P.; Yu, S. Risk assessment of karst collapse using an integrated fuzzy analytic hierarchy process and grey relational analysis model. Geomech. Eng. 2019, 18, 515. [Google Scholar]
  26. Guo, L.F.; Chai, S.Q.; Dong, J.Y.; Xiao, Z.T.; Yu, Q.Z. A statistical analysis of urban road collapse accidents in China. J. Eng. Manag. 2020, 34, 49–54. [Google Scholar]
  27. Wei, A.H.; Li, D.; Zhou, Y.H.; Deng, Q.H.; Yan, L.D. A novel combination approach for karst collapse susceptibility assessment using the analytic hierarchy process, catastrophe, and entropy model. Nat. Hazards 2021, 105, 405–430. [Google Scholar] [CrossRef]
  28. Zeng, B.; Yang, M.Y.; Shao, C.J.; Chen, Z.H.; Peng, D.M. Susceptibility assessment of karst collapse of Hangchang expressway projects based on analytic hierarchy process. Saf. Environ. Eng. 2018, 25, 29–38. [Google Scholar]
  29. Chen, J.Y.; Zhu, B.; Peng, S.X.; Shan, H.M. Assessment of susceptibility to karst collapse in mining area based on AHP and GIS: A case study in Lindai karst mining area in Guizhou. J. Nat. Disasters 2021, 30, 226–236. [Google Scholar]
  30. Zhou, Z.Y.; Shi, H.Y.; Dong, Y.L.; Fan, W.W. Research on road collapse risk evaluation based on cloud model and AHP-EWM. J. Saf. Environ. 2023, 23, 1752–1761. [Google Scholar]
  31. Pan, J.; Zhou, S.; Lin, P.Y.; Ma, Y. Preliminary study of risks of karst collapse in Guangzhou Baiyun district. Rock Soil Mech. 2013, 34, 2589–2600. [Google Scholar]
  32. Kuliczkowska, E. The interaction between road traffic safety and the condition of sewers laid under roads. Transp. Res. Part D Transp. Environ. 2016, 48, 203–213. [Google Scholar] [CrossRef]
  33. Zhou, W.; Beck, B.F. Roadway construction in karst areas: Management of stormwater runoff and sinkhole risk assessment. Environ. Geol. 2005, 47, 1138–1149. [Google Scholar] [CrossRef]
  34. Zhou, Z.L.; Zhang, K.; Zhang, H.; Chen, S.G.; Gan, H.L. Risk assessment of surface subsidence in karst tunnels under attribute recognition theory. China Saf. Sci. J. 2022, 32, 105–112. [Google Scholar]
  35. Cui, Y.; Wang, G.; Li, Z. Risk assessment of karst collapse areas based on the improved fish bone model: An example of the Liuzhou area in Guangxi Province. Carsologica Sin. 2015, 34, 64–71. [Google Scholar]
  36. Chang, M.; Dou, X.Y.; Tang, L.L.; Xu, H.Z. Risk assessment of multi-disaster in Mining Area of Guizhou, China. Int. J. Disaster Risk Reduct. 2022, 78, 103128. [Google Scholar] [CrossRef]
  37. Bijelić, N.; Lin, T.; Deierlein, G.G. Efficient intensity measures and machine learning algorithms for collapse prediction of tall buildings informed by SCEC CyberShake ground motion simulations. Earthq. Spectra 2020, 36, 1188–1207. [Google Scholar] [CrossRef]
  38. Kourehpaz, P.; Molina Hutt, C. Machine learning for enhanced regional seismic risk assessments. J. Struct. Eng. 2022, 148, 04022126. [Google Scholar] [CrossRef]
  39. Jena, R.; Pradhan, B.; Beydoun, G.; Alamri, A.M.; Ardiansyah; Nizamuddin; Sofyan, H. Earthquake hazard and risk assessment using machine learning approaches at Palu, Indonesia. Sci. Total Environ. 2020, 749, 141582. [Google Scholar] [CrossRef]
  40. Kotaridis, I.; Lazaridou, M. Integration of convolutional neural networks for flood risk mapping in Tuscany, Italy. Nat. Hazards 2022, 114, 3409–3424. [Google Scholar] [CrossRef]
  41. Yariyan, P.; Zabihi, H.; Wolf, I.D.; Karami, M.; Amiriyan, S. Earthquake risk assessment using an integrated Fuzzy Analytic Hierarchy Process with Artificial Neural Networks based on GIS: A case study of Sanandaj in Iran. Int. J. Disaster Risk Reduct. 2020, 50, 101705. [Google Scholar] [CrossRef]
  42. Chen, N.C.; Yao, S.; Wang, C.; Du, W.Y. A method for urban flood risk assessment and zoning considering road environments and terrain. Sustainability 2019, 11, 2734. [Google Scholar] [CrossRef]
  43. Liu, Y.H.; Zhang, X.Y.; Liu, W.Y.; Lin, Y.; Su, F.; Cui, J.; Wei, B.Y.; Cheng, H.; Gross, L. Seismic vulnerability and risk assessment at the urban scale using support vector machine and GIScience technology: A case study of the Lixia District in Jinan City, China. Geomat. Nat. Hazards Risk 2023, 14, 2173663. [Google Scholar] [CrossRef]
  44. Thanh Son, N.; Thi Thu Trang, N.; Bui, X.T.; Chau, T.D. Remote sensing and GIS for urbanization and flood risk assessment in Phnom Penh, Cambodia. Geocarto Int. 2022, 37, 6625–6642. [Google Scholar] [CrossRef]
  45. Malone, D.W. An introduction to the application of interpretive structural modeling. Proc. IEEE 1975, 63, 397–404. [Google Scholar] [CrossRef]
  46. Friedman, N.; Koller, D. Being Bayesian about network structure. A Bayesian approach to structure discovery in Bayesian networks. Mach. Learn. 2003, 50, 95–125. [Google Scholar] [CrossRef]
  47. Mimović, P.; Stanković, J.; Janković Milić, V. Decision-making under uncertainty–the integrated approach of the AHP and Bayesian analysis. Econ. Res. Ekon. Istraživanja 2015, 28, 868–877. [Google Scholar] [CrossRef]
  48. Dempster, A.P.; Laird, N.M.; Rubin, D.B. Maximum likelihood from incomplete data via the EM algorithm. J. R. Stat. Soc. Ser. B Methodol. 1977, 39, 1–22. [Google Scholar] [CrossRef]
Figure 1. Framework of methodology in this paper.
Sustainability 16 02055 g001
Figure 2. Optimized influence relationships of risk factors.
Sustainability 16 02055 g002
Figure 3. Bayesian Network (BN) structure of urban road collapse.
Sustainability 16 02055 g003
Figure 4. Collapse risk prediction in case scenario.
Sustainability 16 02055 g004
Table 1. Summary of several typical road collapse accidents.
Accident CasesThe Immediate CausesThe Indirect Causes
“1·13” major road collapse accident in Xining, QinghaiSoil displacement of loess foundationInstability of underground structures (shelter)
Pipeline leakage
Inadequate safety checks
Vehicle load
“10·7” road collapse accident in Dazhou, SichuanInstability of underground structures (Collapse of stone culverts below the road)Heavy rainfall
Inadequate safety checks
Defects in safety technical measures
“2·7” major road collapse accident in Foshan, GuangzhouInstability of underground structures (tunnels)River damage
Inadequate safety checks
Defects in safety technical measures
Soil displacement
Human error
Table 2. Risk factors of urban road collapse in this paper.
CategoryRisk FactorsDetailed Description
Human factorsF1: Human errorIncomplete backfilling after open excavation of pipelines
F2: Defects in safety technical measuresImproper construction of underground excavation of pipelines and subway tunnels
Physical factorsF3: Soil displacementWeakening of soft soil leads to soil displacement
F4: Instability of underground structuresInstability of underground structures in extremely shallow buried layers, such as civil air defense construction
Environmental factorsF5: Heavy rainfallRainwater erosion of soil
F6: River damageDamage to river course and closed conduit
Management factorsF7: Vehicle loadExcessive road vehicle load
F8: Pipeline leakageDamage of rainwater, sewage, water supply, and other pipelines in extremely shallow buried layers
F9: Inadequate safety checksFailure to implement regular inspections, improper inspection cycles
Table 3. The elements in adjacency matrix.
F1F2F3F4F5F6F7F8F9
F1001100000
F2001100010
F3000000000
F4000000000
F5001101010
F6001100010
F7001100000
F8001100000
F9001100110
Table 4. The elements in reachable matrix.
F1F2F3F4F5F6F7F8F9
F1101100000
F2011100010
F3001000000
F4000100000
F5001111010
F6001101010
F7001100100
F8001100010
F9010100111
Table 5. Reachable and antecedent sets and their intersection.
Reachable SetsAntecedent SetsThe Intersection
F11, 3, 411
F22, 3, 4, 822
F331, 2, 3, 5, 6, 7, 8, 93
F441, 2, 4, 5, 6, 7, 8, 94
F53, 4, 5, 6, 855
F63, 4, 6, 86,76
F73, 4, 77,97
F83, 4, 82, 5, 6, 8, 98
F92, 4, 7, 8, 999
Table 6. Hierarchical division of risk factors.
HierarchicalRisk Factors
Level 1 (top level)F3, F4
Level 2F1, F7, F8
Level 3F2, F6
Level 4 (bottom level)F5, F9
Table 7. The CPT (Conditional Probability Table) of the top node “collapse”.
Instability of underground structuresYes No
Pipeline leakageYes No Yes No
Inadequate safety checksYesNoYesNoYesNoYesNo
Yes0.96770.61040.78650.46740.45530.12080.34870.0749
No0.03230.38960.21350.53260.54470.87920.65130.9251
Table 8. Standardization example of accident data (F1 Human error).
NodeNode StatusThe Statement Corresponding to the Accident Investigation Reports
Human errorYesillegal construction
unprofessional operation
dangerous operation
adventure homework
illegal command
illegal operation
violation of labor discipline
Nonone—description of “Yes”
Table 9. The normalized dataset in the GeNIe 4.1 (partial dataset as example).
No.F1F2F3F4F5F6F7F8F9Collapse
20230825YesNoYesNoNoNoYesNoYesYes
20230822NoNoYesNoNoNoYesYesYesYes
20230806NoNoYesNoNoNoYesYesYesYes
20230730NoNoYesYesYesNoNoNoNoYes
20230728NoNoYesNoYesYesYesNoNoYes
20230321YesNoYesNoNoNoNoNoNoYes
20210902YesNoNoNoNoNoYesNoNoYes
20210829YesNoNoNoNoNoYesYesYesYes
20210825NoNoYesNoNoNoYesYesYesYes
20230825YesNoYesNoNoNoYesNoYesYes
Table 10. The influence of risk factors on collapse probability.
Risk FactorsNode StatusProbability of Road Collapse (%)Change Value (%)
F1: Human errorYes5716
No41
F2: Defects in safety technical measuresYes567
No49
F3: Soil displacementYes6639
No27
F4: Instability of underground structuresYes6744
No23
F5: Heavy rainfallYes539
No44
F6: River damageYes5811
No47
F7: Vehicle loadYes526
No46
F8: Pipeline leakageYes598
No51
F9: Inadequate safety checksYes6113
No48
Disclaimer/Publisher’s Note: The statements, opinions and data contained in all publications are solely those of the individual author(s) and contributor(s) and not of MDPI and/or the editor(s). MDPI and/or the editor(s) disclaim responsibility for any injury to people or property resulting from any ideas, methods, instructions or products referred to in the content.

