Article

An Index Model for the Evaluation of the Performance of Lock Navigation Scheduling Rules Considering the Perspective of Stakeholders

1
School of Transportation and Logistics Engineering, Wuhan University of Technology, Wuhan 430063, China
2
College of Automobile, Zhejiang Institute of Communications, Hangzhou 311100, China
3
State Key Laboratory of Maritime Technology and Safety, Wuhan University of Technology, Wuhan 430062, China
*
Author to whom correspondence should be addressed.
Sustainability 2024, 16(5), 2054; https://doi.org/10.3390/su16052054
Submission received: 9 January 2024 / Revised: 20 February 2024 / Accepted: 27 February 2024 / Published: 1 March 2024

Abstract

:
The lock navigation scheduling problem involves multiple stakeholder groups. The game relationship between stakeholders directly affects the sustainable development of regional society and economy. Considering the objectivity and accuracy of social network analysis (SNA) for relationship identification, indicator screening, and system construction, it completes the stakeholder extraction and evaluation index system construction. Considering that the conditional probability of nodes in Bayesian networks (BN) can flexibly and intuitively characterize the direction and strength of the factors’ roles in a complex scenario, this study proposes an index model for the evaluation of the performance of lock navigation scheduling rules. Firstly, build the BN topology under the efficiency, safety, and fairness criteria. Subsequently, an improved composite index method is combined with the BN to determine the evaluation index from the stakeholder perspective. This study takes the Three Gorges locks maintenance scenario as an example. The index evaluation model can accurately identify the direction, trend, and magnitude of the performance of the scheduling rules on the efficiency, safety, and fairness criteria under navigational constraints, realizing the dynamic and quantitative evaluation of the performance of lock navigation scheduling rules during the observation period.

1. Introduction

Navigation may efficiently relieve the pressure on land transportation of bulk goods within the catchment due to its vast volume, excellent flexibility, and low transportation cost characteristics. As an essential navigational structure, locks play a role in channelization and flow regulation, which are widely used in the Yangtze River Basin in China [1,2], the Albert Canal in Belgium [3,4], the Mississippi River and its tributary Ohio River in the United States [5,6,7], and the Panama Canal [8], etc. The China Statistical Yearbook 2022 issued by the National Bureau of Statistics of China shows that, as of 2022, China’s inland waterway mileage totaled 127,600 km. China’s waterway freight turnover totaled 11,557.7 billion ton-km, which is 51.7% of the national freight turnover. Locks have a prominent position and role in today’s comprehensive transportation system. As an example, in 2022, the Three Gorges locks operated a total of 10,400 lockages, passing 40,600 vessels and 156 million tons of freight, a year-on-year increase of 6.78%. As control nodes on waterways, locks are also prone to behave as bottlenecks, restricting the transportation efficiency of the logistics network [
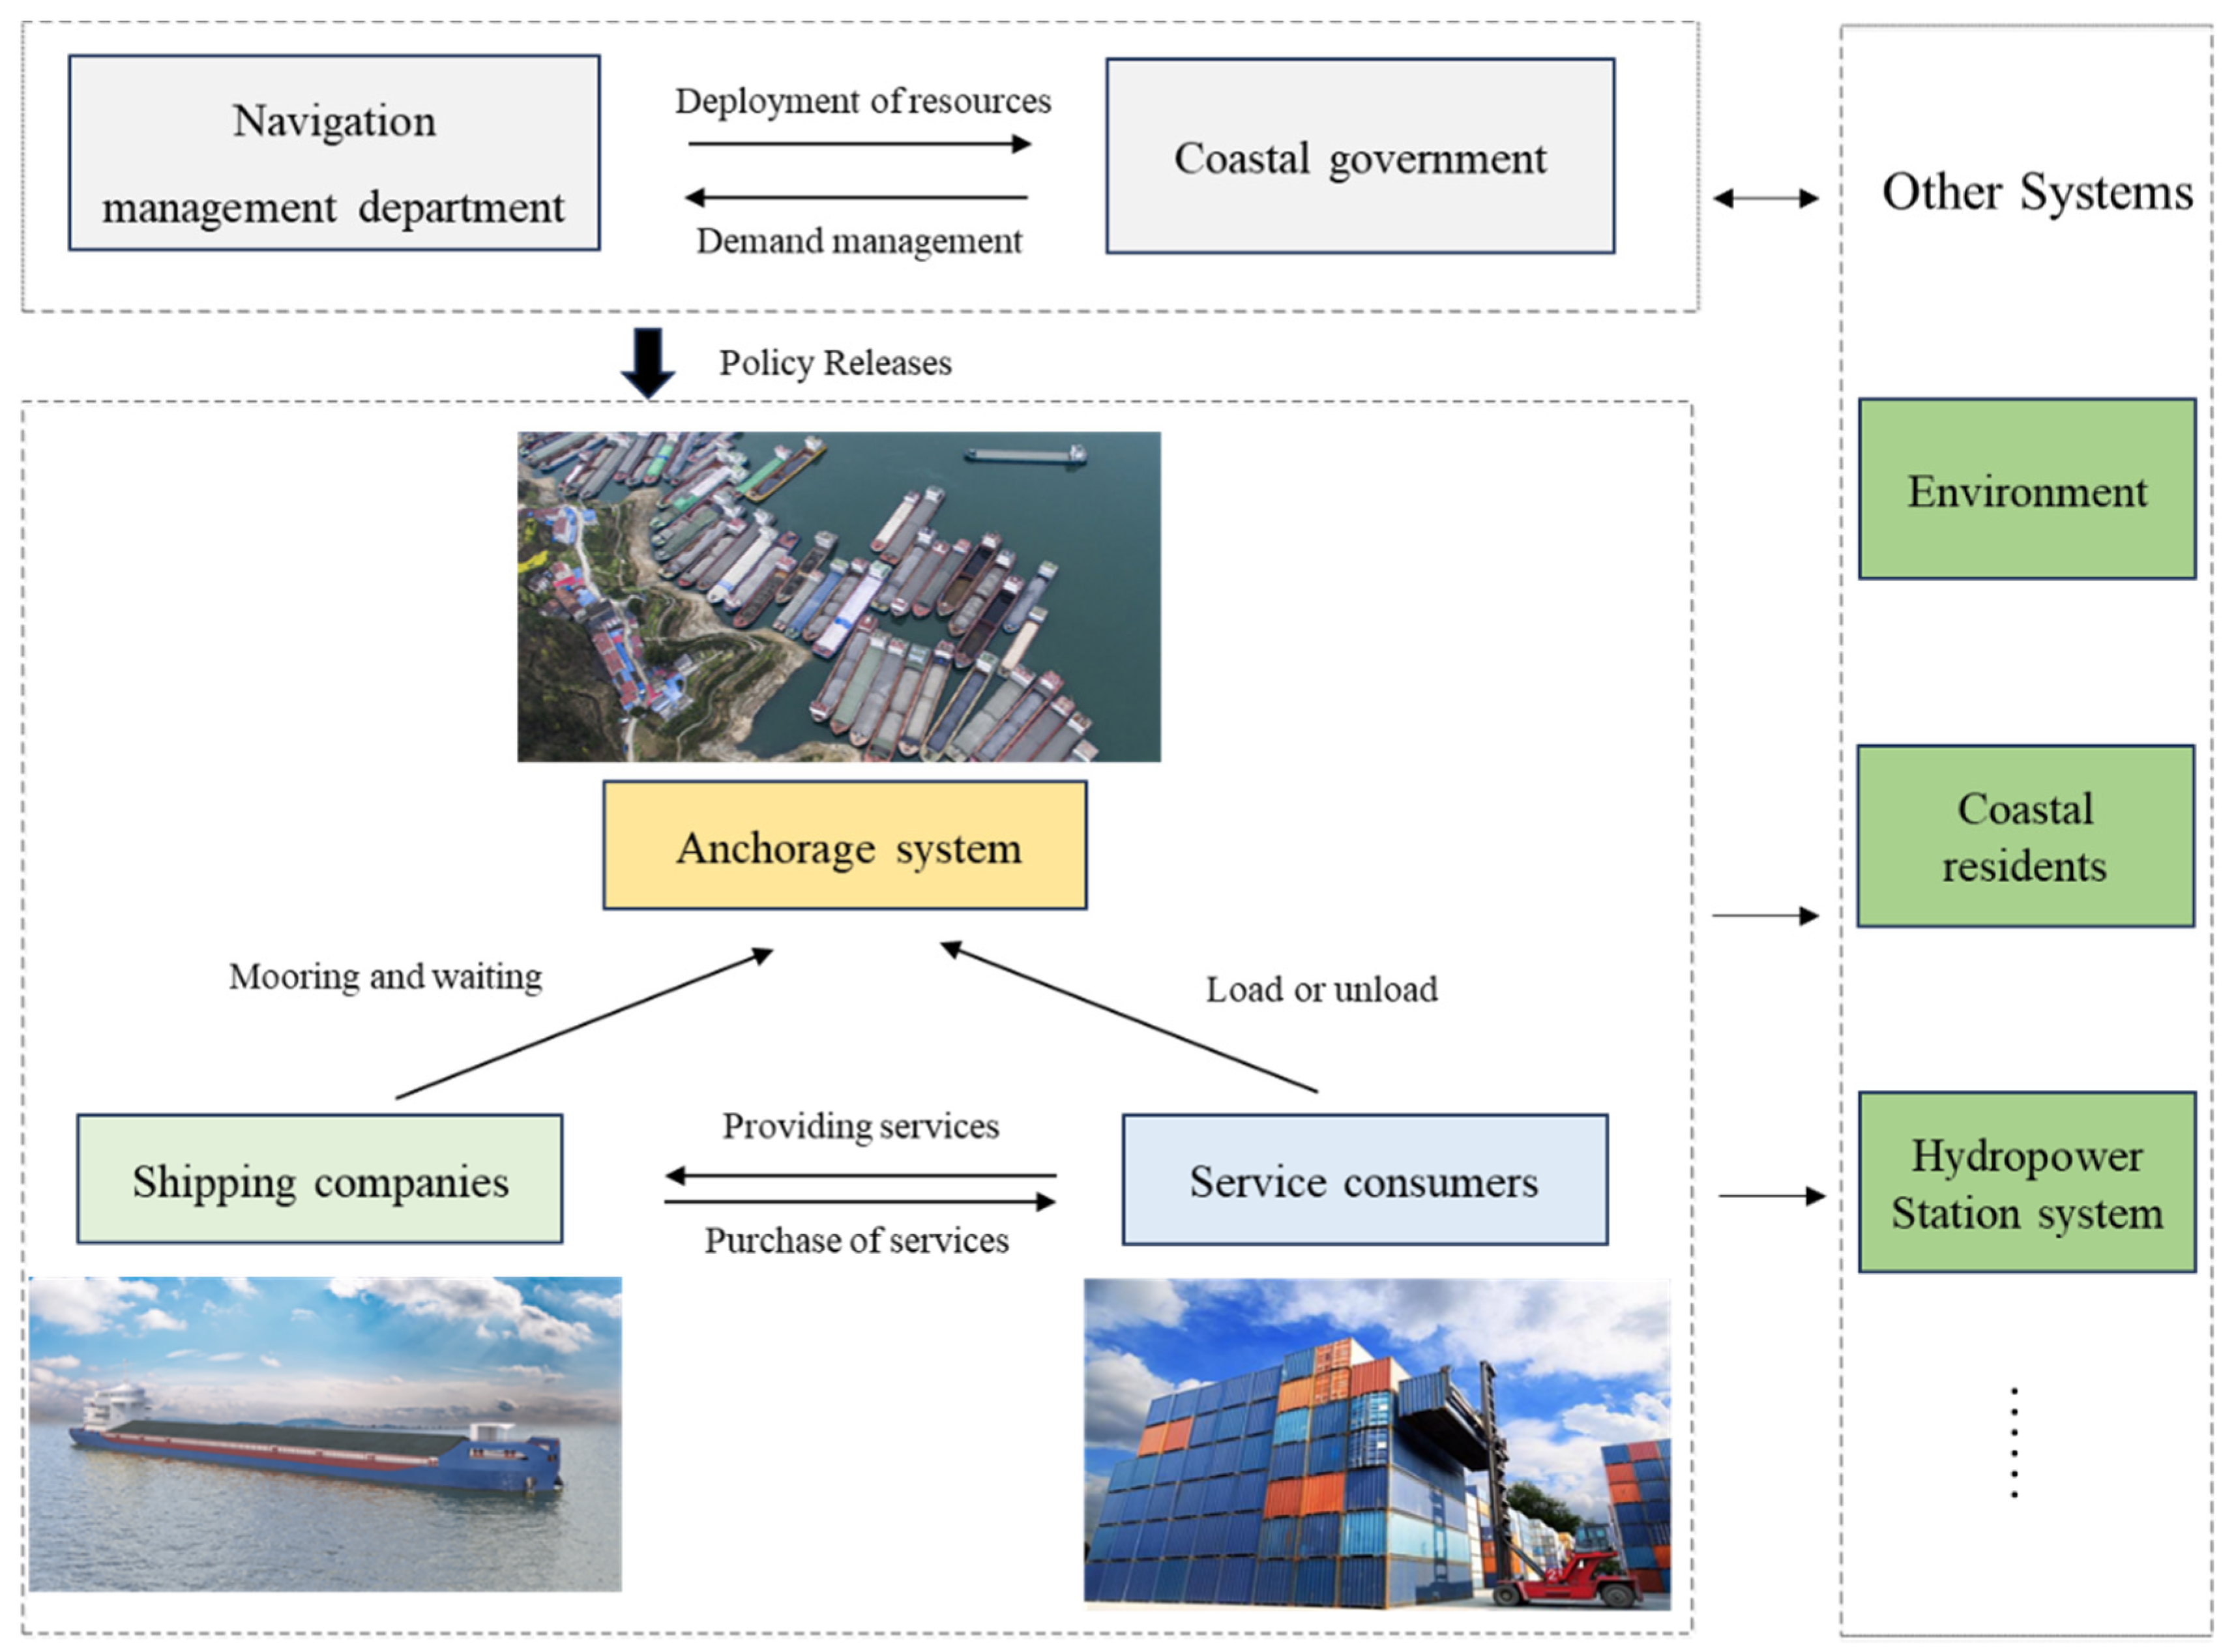
9]. Vessel navigation in the lock area is a complex system involving traffic management and service, lock operation, vessel operation, and freight organization. Many stakeholders are participating in the navigation process, including the authorities of maritime and lock operation management, shipping and logistics companies, shippers, and so on. The design and implementation of scheduling rules of lock navigation, which is conducted by the lock navigation authorities, should take the stakeholders into account and satisfy their concerns as much as possible.
For the evaluation of the performance of lock navigation scheduling rules, there is currently no comprehensive study that can address this issue. Reasonable rules should be selected to meet the demand of the vessels as much as possible to obtain a satisfactory scheduling performance. During the period of a relative surplus of vessels passing resources, the queuing rule based on FCFS (first come, first served) is usually adopted. Wilson [10] analyzed the applicability of different queuing models based on the capacity of the locks. The results of the study showed that waiting time is an essential indicator for evaluating the effectiveness of lock scheduling rules in queuing mode by drawing on the scheduling model of transportation systems such as urban bus scheduling and terminal collector card reservation scheduling in case of congestion [11,12]. The rules of determining the comprehensive priority of vessels and implementing the reservation of vessels for passing locks are added to provide exclusive rights of passage for vessels transporting essential materials, to alleviate the contradiction between the demand for vessels and the passing capacity of locks, and improve scheduling performance [13,14]. In cases where the adoption capacity cannot be improved, it is crucial to evaluate the performance of scheduling rules in terms of fairness and safety.
However, the existing research on navigation scheduling rules focuses on the optimization of lock navigation efficiency and energy saving and emission reduction while neglecting the social attributes of locks as public infrastructure. Ritika [15] provided a comprehensive definition of stakeholder theory in social services, and the study showed that stakeholders have a significant impact on the effectiveness and sustainability of public services. Locks are not a closed vessel navigation management system. A minor adjustment to the scheduling rule can have a significant impact on policymaking and implementation, coastal businesses and residents, and practitioners. Therefore, the attitudes of various stakeholders toward scheduling rules must be carefully considered, which is also lacking in existing research. The ultimate goal should be to play a role in the long-term development of society and economy through scientific and reasonable transportation modes. Therefore, the scientific evaluation of the performance of lock navigation scheduling rules will help to identify the appropriateness of the design and implementation of rules, discover the loopholes in scheduling management, and enhance the flexibility of the shipping network. The assessment also provides a more balanced and high-quality service to stakeholders. It promotes the orderly, healthy, and rational development of navigation.
The evaluation of the performance of lock navigation scheduling rules is jointly affected by multiple stakeholders based on the corresponding indicators. Therefore, it can be regarded as a typical multi-attribute group decision-making (MAGDM) problem. To rationalize the complex interactions among stakeholders and to avoid the subjective and ambiguous selection of indicators in the existing performance evaluation process, this study proposes an integrated social network analysis (SNA) and Bayesian network (BN) approach to construct an evaluation index system for the performance of lock navigation scheduling rules. Based on this, a composite index method based on the Bayesian network (BN) is proposed to solve the problem of evaluating the performance of lock navigation scheduling rules by expressing complex fuzzy information using the index value constructed based on the conditional probability of BN evidence nodes. The contribution of this study is as follows.
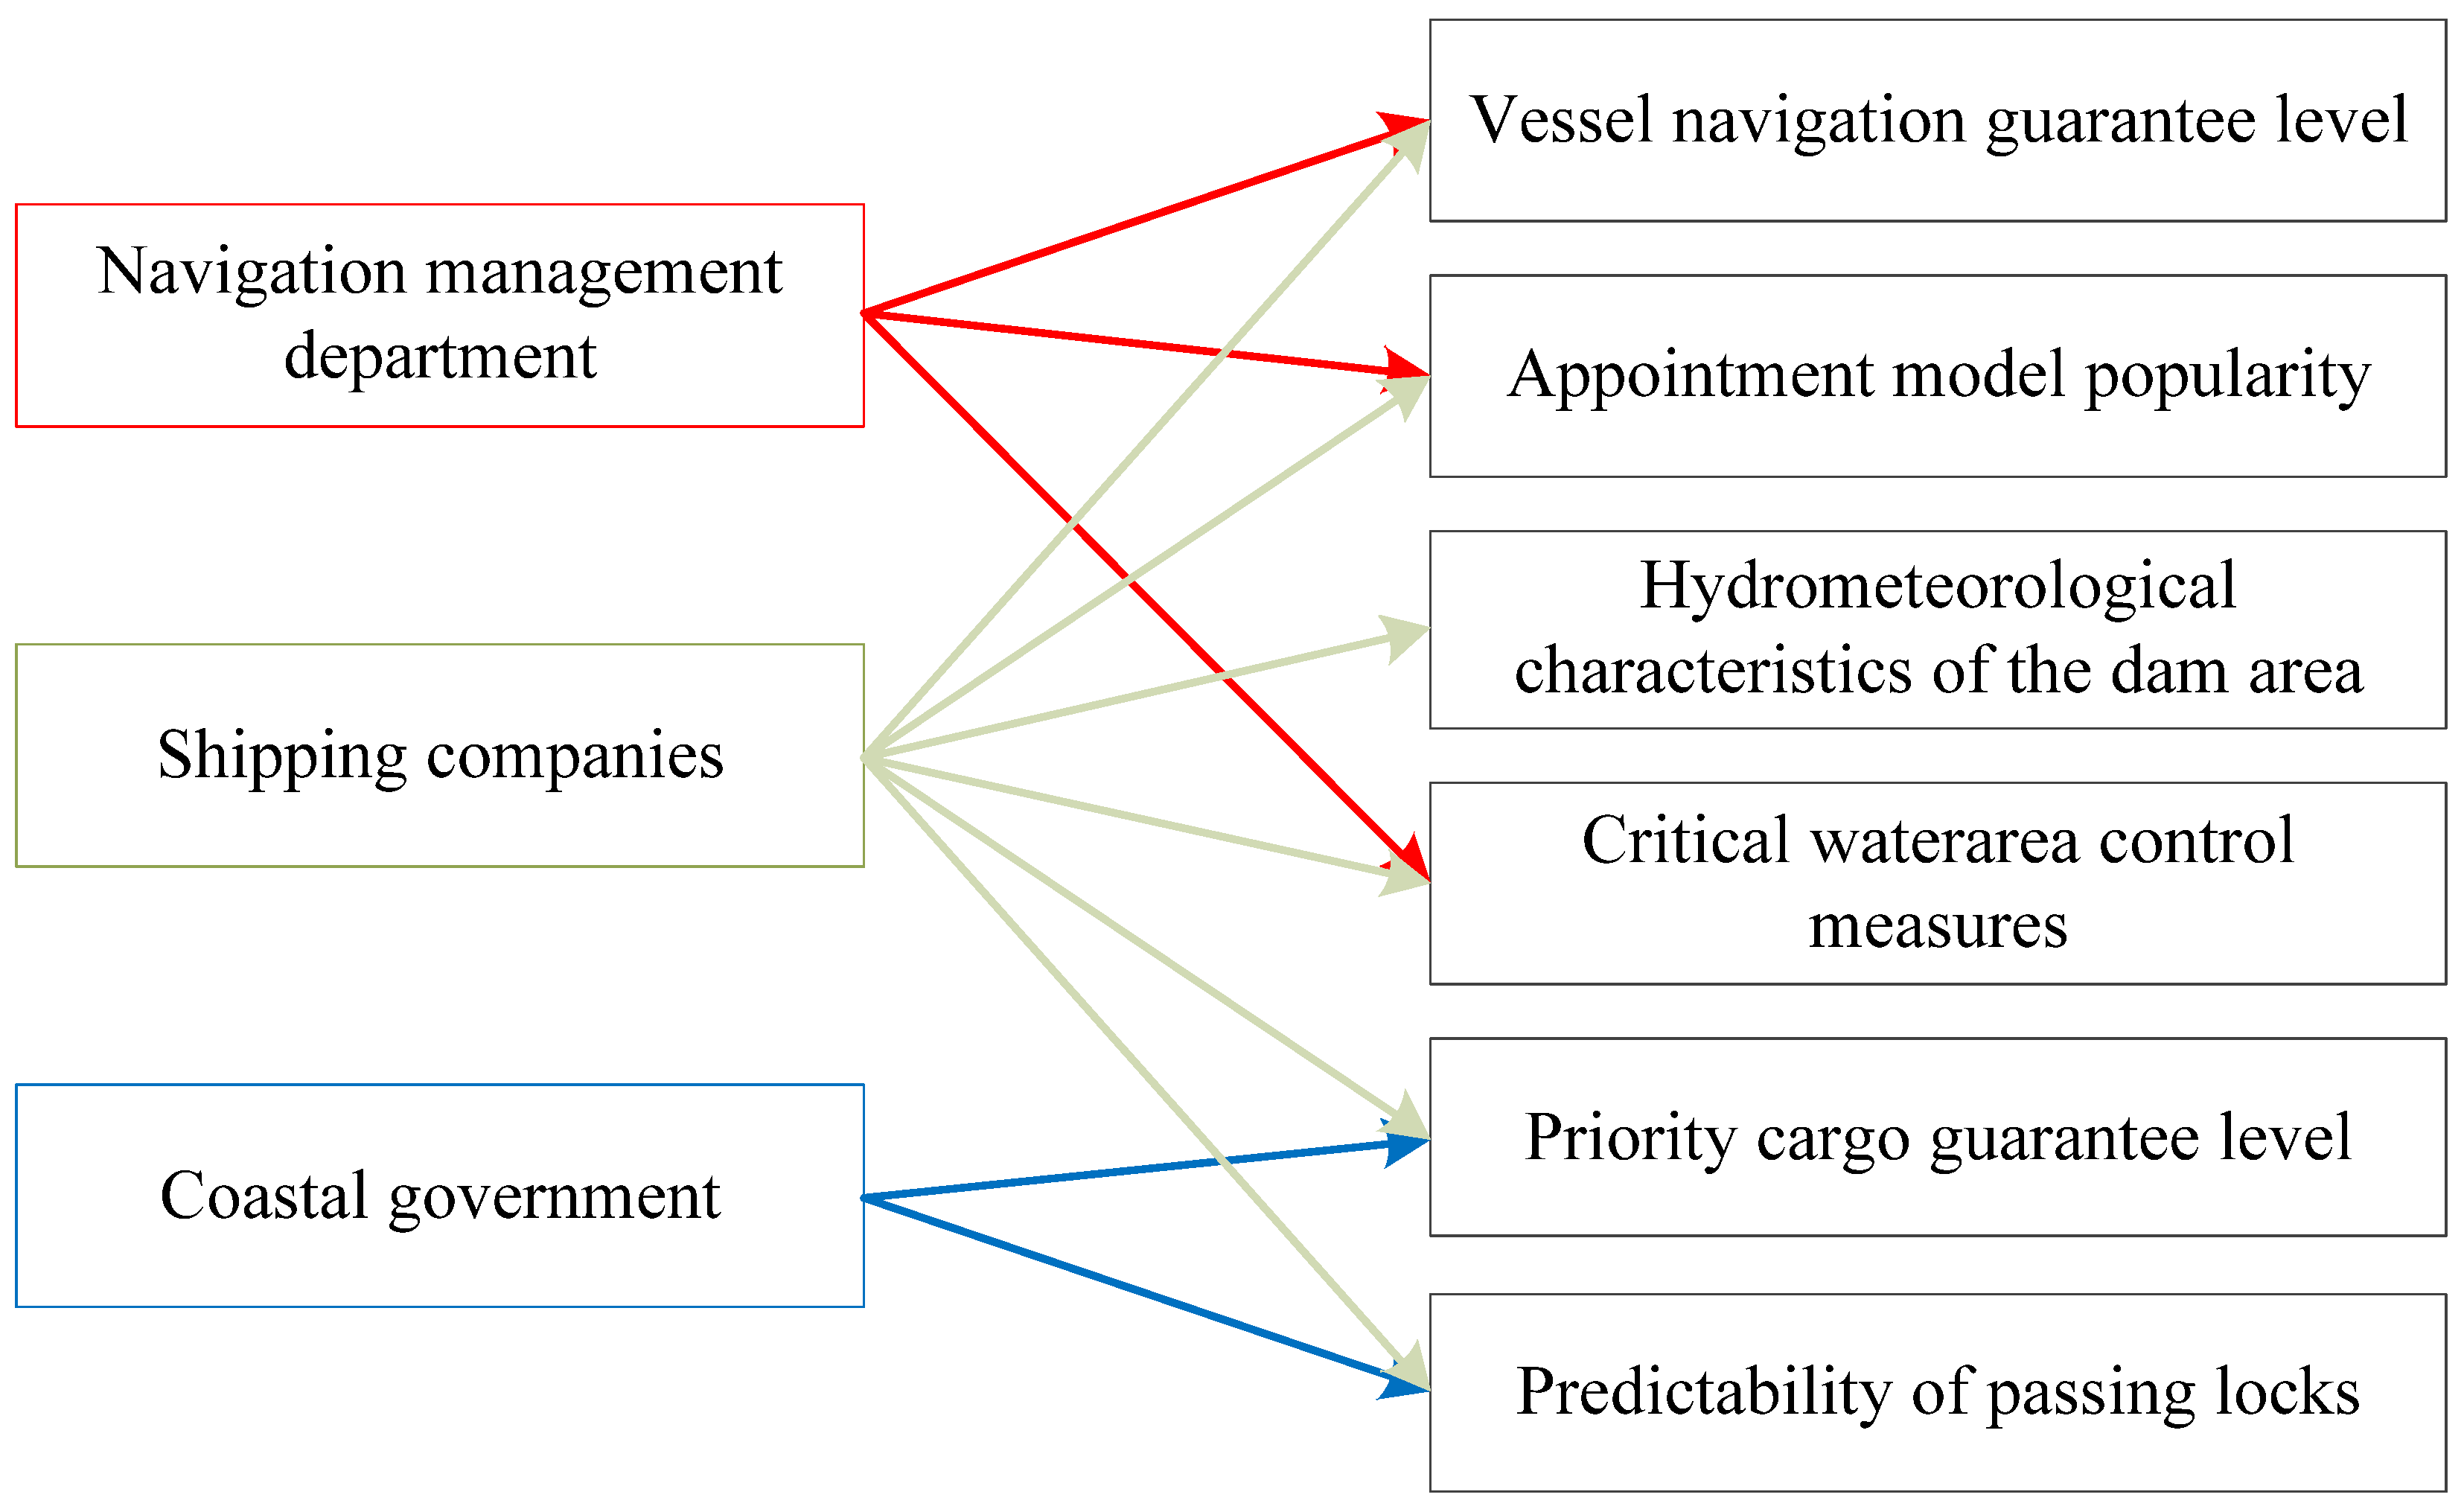
(1) Analyzing the business process of vessel passing locks by SNA’s relational orientation and positional orientation. Completion of the extraction of the three main stakeholders in the issue of lock scheduling: shipping companies, navigation management departments, and coastal governments. Identifying key factors affecting the performance of scheduling rules in conjunction with the focus of each stakeholder’s concerns.
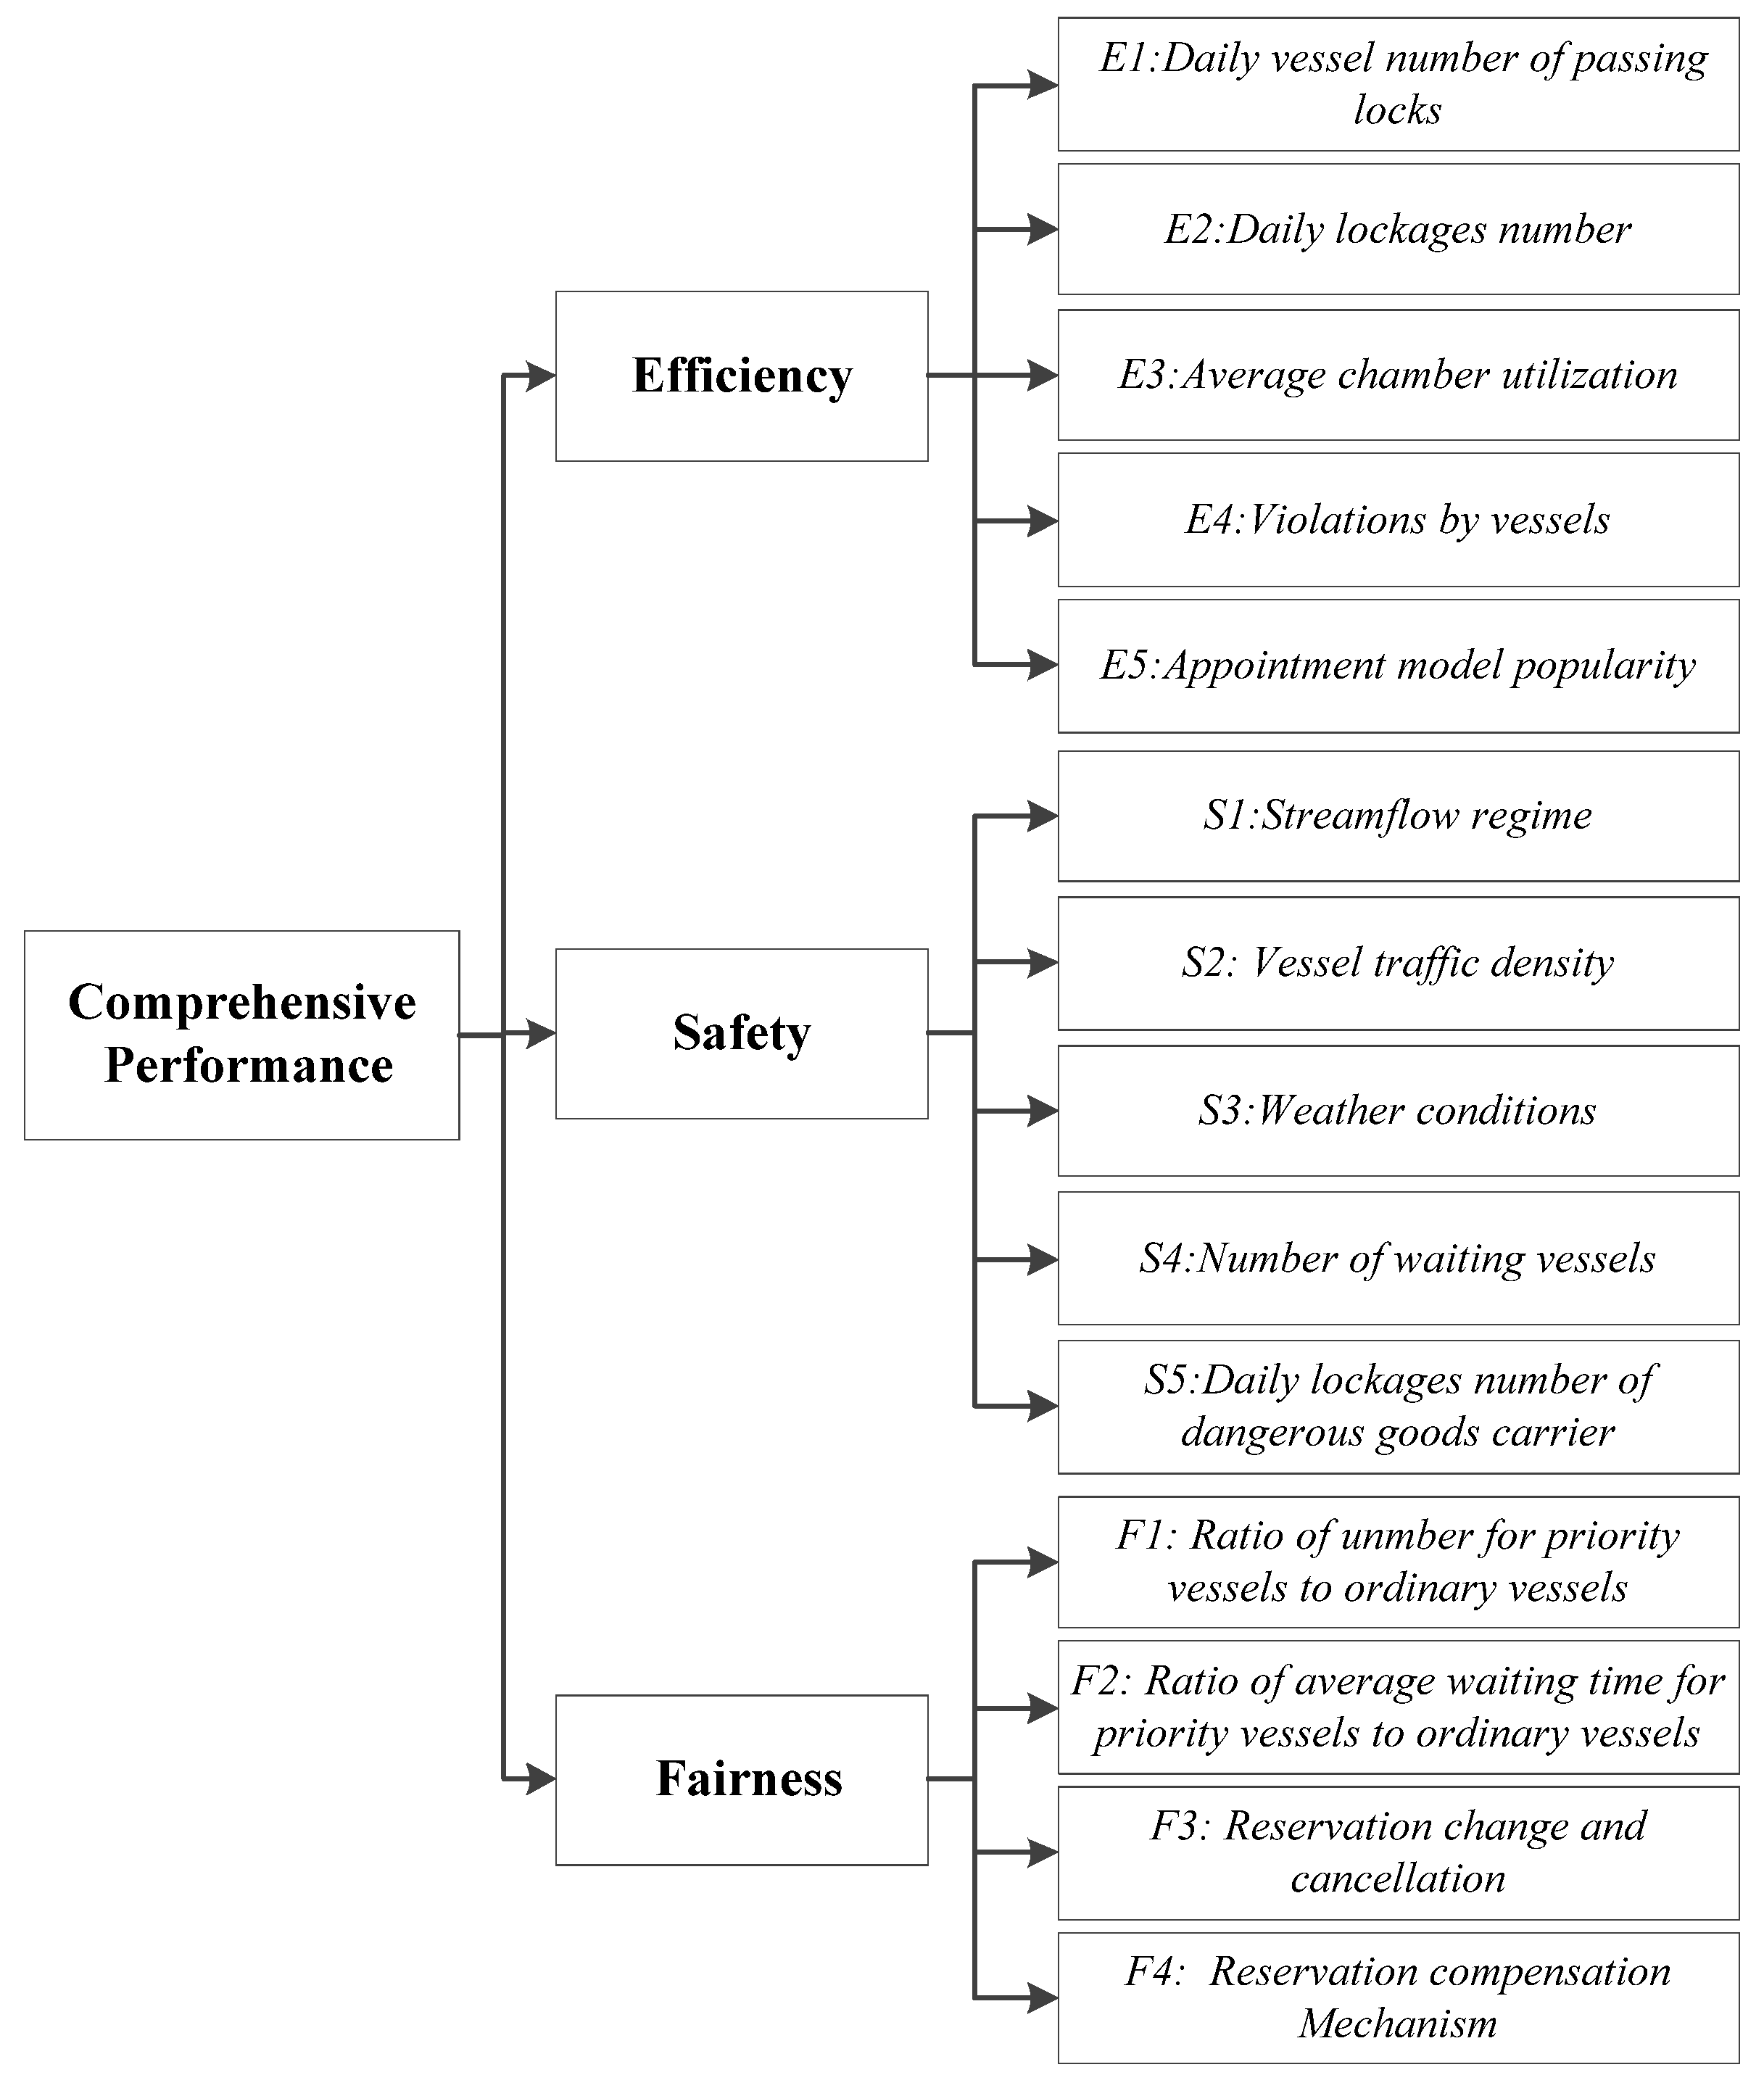
(2) This is based on the coupling that exists between SNA and BN within the fields of graph theory and probability theory. The key influencing factors under the stakeholder perspective are categorized according to the dimensions of efficiency, fairness, and safety to construct an evaluation index system of the performance of lock navigation scheduling rules. The conditional probabilities of the output of its nodes in the BN can reveal the direction and strength of the factor’s action under different criteria. The evaluation index system provides ideas and references for researchers and decision-makers to realize the quantitative characterization of multidimensional system impact states under the condition of complex factors acting together.
(3) In order to measure the resilience of the transportation system under uncertainty, we propose a MAGDM method that combines a modified composite index method with the BN. This method is applied for the first time to the evaluation of the performance of lock navigation scheduling rules. Under specific circumstances, such as lock maintenance, the index value can still reflect the operation of the lock system in a stable manner. This involves a continuous dynamic characterization of the performance of scheduling rules through criterion index values and composite index values, which effectively reduces the distortion of the evaluation and decision-making information.
The remainder of this paper is organized as follows. Section 2 presents a literature review, which mainly studies the stakeholder theory, the lock navigation scheduling rules, and the performance evaluation method. The identification of performance influence factors is described in Section 3. Section 4 presents a description of the index evaluation model for the performance of the lock navigation scheduling rules. Section 5 presents the case study based on the evaluation case of the Three Gorges locks. The proposed evaluation method is applied to evaluate and analyze the performance of the scheduling rules during the maintenance period to verify their feasibility and superiority. Section 6 presents the conclusions of this study.

2. Literature Review

2.1. Research on Stakeholder Theory

When advancing projects with significant socioeconomic or even political effects, the standpoint and views of stakeholders cannot be ignored. Yaylacı, E.D. et al. [16] stress the significance of including stakeholder feedback in the creation, evaluation, and process management of sustainable development systems. For analyzing stakeholder perceptions, Manjengwa et al. [17] investigated an interactive multivariate risk-driven methodology. Additionally, it suggests applying a quantitative Value Analysis Tree (VAT) indicator system for mining project evaluation that is based on the value drivers for stakeholders in mining investment projects. Hollebeek et al. [18] suggest that trajectory planning through the dynamic characterization of other stakeholders, such as staff, suppliers, etc., when conducting customer journey studies can improve stakeholder-firm relationship management and performance results. To give a thorough evaluation of sustainable tourism in Spain, Damian et al. [19] took stakeholder feedback into account when evaluating the boundaries and aims of the indicators. In research on smart city evaluation indicators, Zeng et al. [20] recommended that they not only be taken into account from an information technology standpoint but also that the indicators of people’s livelihood in the construction process should not be disregarded. In the framework of q-ROF, a unique multi-attribute evaluation approach for research involving various stakeholder groups is proposed. AL-Fadhali [21] considered seven stakeholder subjects, such as owners, suppliers, designers, etc., to assess the impact of construction project delivery performance in order to encourage government and construction companies to take responsibility for improving PDP. Similarly, lock navigation scheduling rules involve multiple stakeholder groups. Interaction of different stakeholder groups can optimize the decision to implement lock scheduling rules. The performance of scheduling rules will play a crucial role in influencing the production operations of shippers and logistics enterprises, regional economic development, and the orientation of national logistics strategy.

2.2. Research on the Lock Navigation Scheduling Rules

In the case of strong demand for vessels passing lock, locks are usually optimized in terms of vessel transportation organization and lock chamber arrangement to obtain a better scheduling performance. Ji et al. [2] optimized the layout method of vessels inside lock chambers and vessel sequences to improve the scheduling efficiency of locks by taking the interests of shippers and lock managers as two parallel objectives. Verstichel et al. [3] consider the three key subproblems of the lock scheduling rules—ship arrangement, lock chamber allocation, and lock operation—to be closely related to the two-dimensional crating problem, the allocation problem, and the parallel machine scheduling problem, respectively. They optimally design the rules for the three subproblems and propose a method to solve the generalized lock scheduling to optimize the passing efficiency. Deng et al. [22] proposed a congestion charging scheme and a mobile service window scheme to alleviate vessel delays in the dam area in response to the problem of lock congestion caused by the uneven temporal distribution of vessel traffic demand in waterways. Ting et al. [14] designed two prioritized scheduling modes, the shortest processing time first (SPF) and chamber packing without tow breaking (PAC), which were compared with the traditional FCFS scheduling mode. The results show that the priority scheduling model can effectively reduce ship delays and save fuel costs. Zhang et al. [23] proposed a model of cooperative scheduling of approach channels and locks to improve the efficiency during vessel passing lock. This shows that the efficiency indicator is an essential criterion for evaluating the performance of scheduling.
However, to prevent risky events at the societal level while pursuing efficiency gains, safety and fairness should not be overlooked. Bin [24] proposes a general model for the generalized serial-lock scheduling problem (GSLSP), innovatively from a multi-commodity network (MCN) perspective, considering the serial locks on the same channel as a multilevel lock system, reducing vessel waiting times and lock water usage with consideration of fairness objectives. Zheng et al. [13] used a discrete multi-objective artificial bee colony algorithm to investigate the cooperative scheduling problem of the Three Gorges locks and vessel lifts to reduce the energy consumption of vessel operation and improve the efficiency of vessel passage given the situation that the Three Gorges Cascade Hub have reached the limit of passage capacity. Yuan et al. [25] considered water–land transshipment as a new efficient way to share the pressure of the lock for ships passing a dam and established a co-scheduling model of a single lock and different kinds of water–land transshipment docks mixed transportation system for ships passing a lock, which takes into account both fairness of the ships and efficiency of the lock.

2.3. Research on Performance Evaluation Method

Existing research on problems related to locks mainly focuses on the contents of lock chamber planning based on simulation modeling methods, multi-lane lock scheduling, and complex system problem solving using optimization algorithms, and there is no relevant research on evaluating the performance of the lock navigation scheduling rules for the time being. In other transportation systems, Latifi et al. [26] investigated the problem of evaluating energy harvesting in water distribution networks, using an integrated Stakeholders’ analysis (SA) and social network analysis (SNA) approach, which assessed the cooperation between stakeholders and their roles in the social network using four centrality indicators. Li et al. [27] evaluated the implementation of traffic control policies in Beijing from the perspectives of traffic effect, environmental effect, motor vehicle development, urban road development, public transportation development, supply and demand balance, etc., and proposed the strategy of coordination between traffic control policies and traffic demand management policies.
Due to interactions among stakeholders, the task of evaluating the scheduling performance is complicated and ambiguous, and Bayesian networks (BN) are ideal for dealing with complexity and uncertainty in project management. Guinhouya [28] provides a review of how the BN models are used in project management practice, showing that the BN has advantages in the field of performing risk prediction and evaluation analysis for construction and infrastructure. Hasanpour et al. [29] applied the BN to assess the interference risk of shielded tunnel shields in unfavorable ground conditions, such as extruded foundations, and indicated that the BN model works well even when the nature of the system is incomplete. Grzegorczyk [30] proposed a Bayesian Model Averaging (BMA) approach for structural inference of the BN from data with missing values to enable system evaluation in complex scenarios. The composite index method is a frequent method for quantifying system uncertainty and vulnerability, using weights and index values for system evaluation [31]. Das et al. [32] used the composite index method and fuzzy hierarchical analysis to calculate the wetland health index for the valuation of ecosystem services. Zhang et al. [33] established an improved constrained composite index model based on the positive and negative factors affecting the natural, environmental, and socioeconomic conditions of the coastal zone and evaluated the comprehensive utilization pattern of the Bohai Rim coast in terms of the type of shoreline utilization and spatial aggregation characteristics. In this study, an index evaluation model is proposed based on the advantages of the Bayesian network and composite index method in the field of systematic evaluation. The conditional probabilities of Bayesian networks can be an objective and accurate source of data in the model of the composite index method. The composite index method can also make up for the lack of intuition in characterizing the results of Bayesian networks in terms of conditional probabilities.

3. Identification of Performance Influence Factors of Lock Navigation Scheduling Rules Considering Stakeholder Concerns

Before modeling the evaluation of the performance of lock navigation scheduling rules, it is necessary to identify the main stakeholders of the lock scheduling and the key factors affecting the scheduling performance. Subsequently, the influencing factors were categorized according to the criteria of different dimensions to form the evaluation index system.

3.1. Lock Navigation Stakeholder Analysis and Main Concerns

To accurately identify the stakeholder groups of the lock scheduling problem and their different attitudes and perspectives on the lock navigation scheduling problem. This study adopts the social network analysis method for research. Social network analysis (SNA) is a sociological research method that combines graph theory and probability theory [34,35]. Networks are considered to be a set of social connections or social relations connecting actors. Relational and positional orientations are the two basic perspectives of social network analysis, with research focusing on the interactions of social systems and the role of social contexts. This study extracts the stakeholders involved in the scheduling problem of locks from the business process of passing locks [36].
Vessels serve as the locks’ service object and scheduling core. Based on the dynamic process of vessel navigation within the scheduling range of locks. The location orientation is mainly reflected in the static order of waterways, ports, anchorages, and locks. The relational orientation focuses on the interaction with the outside world in terms of the natural navigation and operational aspects of the vessel during the different phases of passing lock. Figure 1 displays the stakeholder network. In this case, the supply of resources correlates more with the demand of service consumers like shippers and passengers. The lock navigation scheduling rule study will primarily focus on the claims of shipping companies as carriers. The navigation management department has the authority to manage the locks, channels, and anchorage system. The coastal government is responsible for the economic development, livelihood of residents, and environmental protection of the area. To summarize, shipping companies, navigation management departments, and coastal government are the key stakeholders in lock scheduling issues.
Stakeholder demands and initiatives in lock management, waterway management, ship navigation, and other issues must be sorted out after the completion of stakeholder extraction. Stakeholder focus can be obtained, as shown in Figure 2. All stakeholders have the same attitude toward smooth passing through the locks. There is a situation where different stakeholders focus on the same key issue at the same time to obtain a better scheduling performance. The coastal government and navigation management department will consider the needs of shipping companies in scheduling management.

3.2. Analysis of Factors Affecting the Navigation of Lock and Construction of Evaluation Index System

Table 1 lists the factors influencing the performance of lock navigation scheduling rules based on stakeholder focus. However, based on the focus of various stakeholder viewpoints, the influencing factors under the same issue need to be thoroughly examined. For example, the Vessel navigation guarantee level, which is a common concern of navigation management departments and shipping companies, consists of five influencing factors: vessel type, daily vessel number of passing locks, average waiting time of vessel, Reservation Change and Cancellation, and satisfactory rate of safety check. For the shipping companies, the daily vessel number of passing locks is not crucial, directly affecting their production and operation of the waiting time is the most significant factor, while the navigation management department’s attitude toward the waiting time is out of the consideration of the daily efficiency of the vessel passing locks. It can be seen that the dimensions of the influencing factors are one-sided and require further analysis based on the key procedure of the passing lock operation.
According to the definition of China’s “overall design specification for ship locks JTJ 305-3001”. The passing capacity of locks should be analyzed and calculated according to the composition of ships predicted in the design level year as an indicator of the amount of freight that can pass through the locks, and it is desirable to express it in terms of unidirectional passing capacity. Lock as a navigational building, passing locks freight volume indicators can directly reflect the locks through the ability to meet the needs of the growth of freight [3]. At the same time, it can measure the management level of the business-related units. It can be seen that the efficiency of passing locks is a crucial principle used to judge the performance of lock navigation scheduling rules [10].
The navigation management department prioritizes ensuring the safety of vessels passing locks as its primary focus. The locks have become the throat part of the navigation channel after being built and used. The locks of the trunk waterways in some countries and regions have been in a state of high-load operation for a long time. At the same time, no lack of dangerous goods carriers need to pass through the channel regularly. When the lock area is congested, vessel collision accidents are prone to cause a chain reaction. The safety of the lock navigation must be taken into full consideration [37].
Some locks with full capacity are assigned priority-based scheduling rules to ensure the prioritization of crucial materials. This conflicts with the public’s perception of the FCFS principle for public facilities [14]. There is also a lack of basis for determining the criteria for prioritizing ships, which has caused some damage to the overall fairness of the system while achieving the desired results. Balancing fairness with other factors is a complex and realistic issue [23].
Therefore, this paper takes the performance of lock navigation scheduling rules as the evaluation goal and sets efficiency, safety, and fairness as three criterion nodes. The quantitative description of the criterion nodes is based on the average waiting time of vessels, the number of safety accidents, and the number of complaints about fairness, respectively. The influence factors were then categorized by criterion as model evidence nodes. Because lock navigation involves multiple stakeholders, the factors are characterized from different perspectives. To accurately identify their key influencing factors, this paper applies the SNA method to analyze the centrality of the factors [34]. As a result, the evaluation index system of the performance of lock navigation scheduling rules can be derived, as shown in Figure 3. Screening influencing factors through SNA centrality reduces, to some extent, the subjectivity of index system construction based on experts’ experience.

4. Formulation of Index Model for the Performance Evaluation of Lock Navigation Scheduling Rules

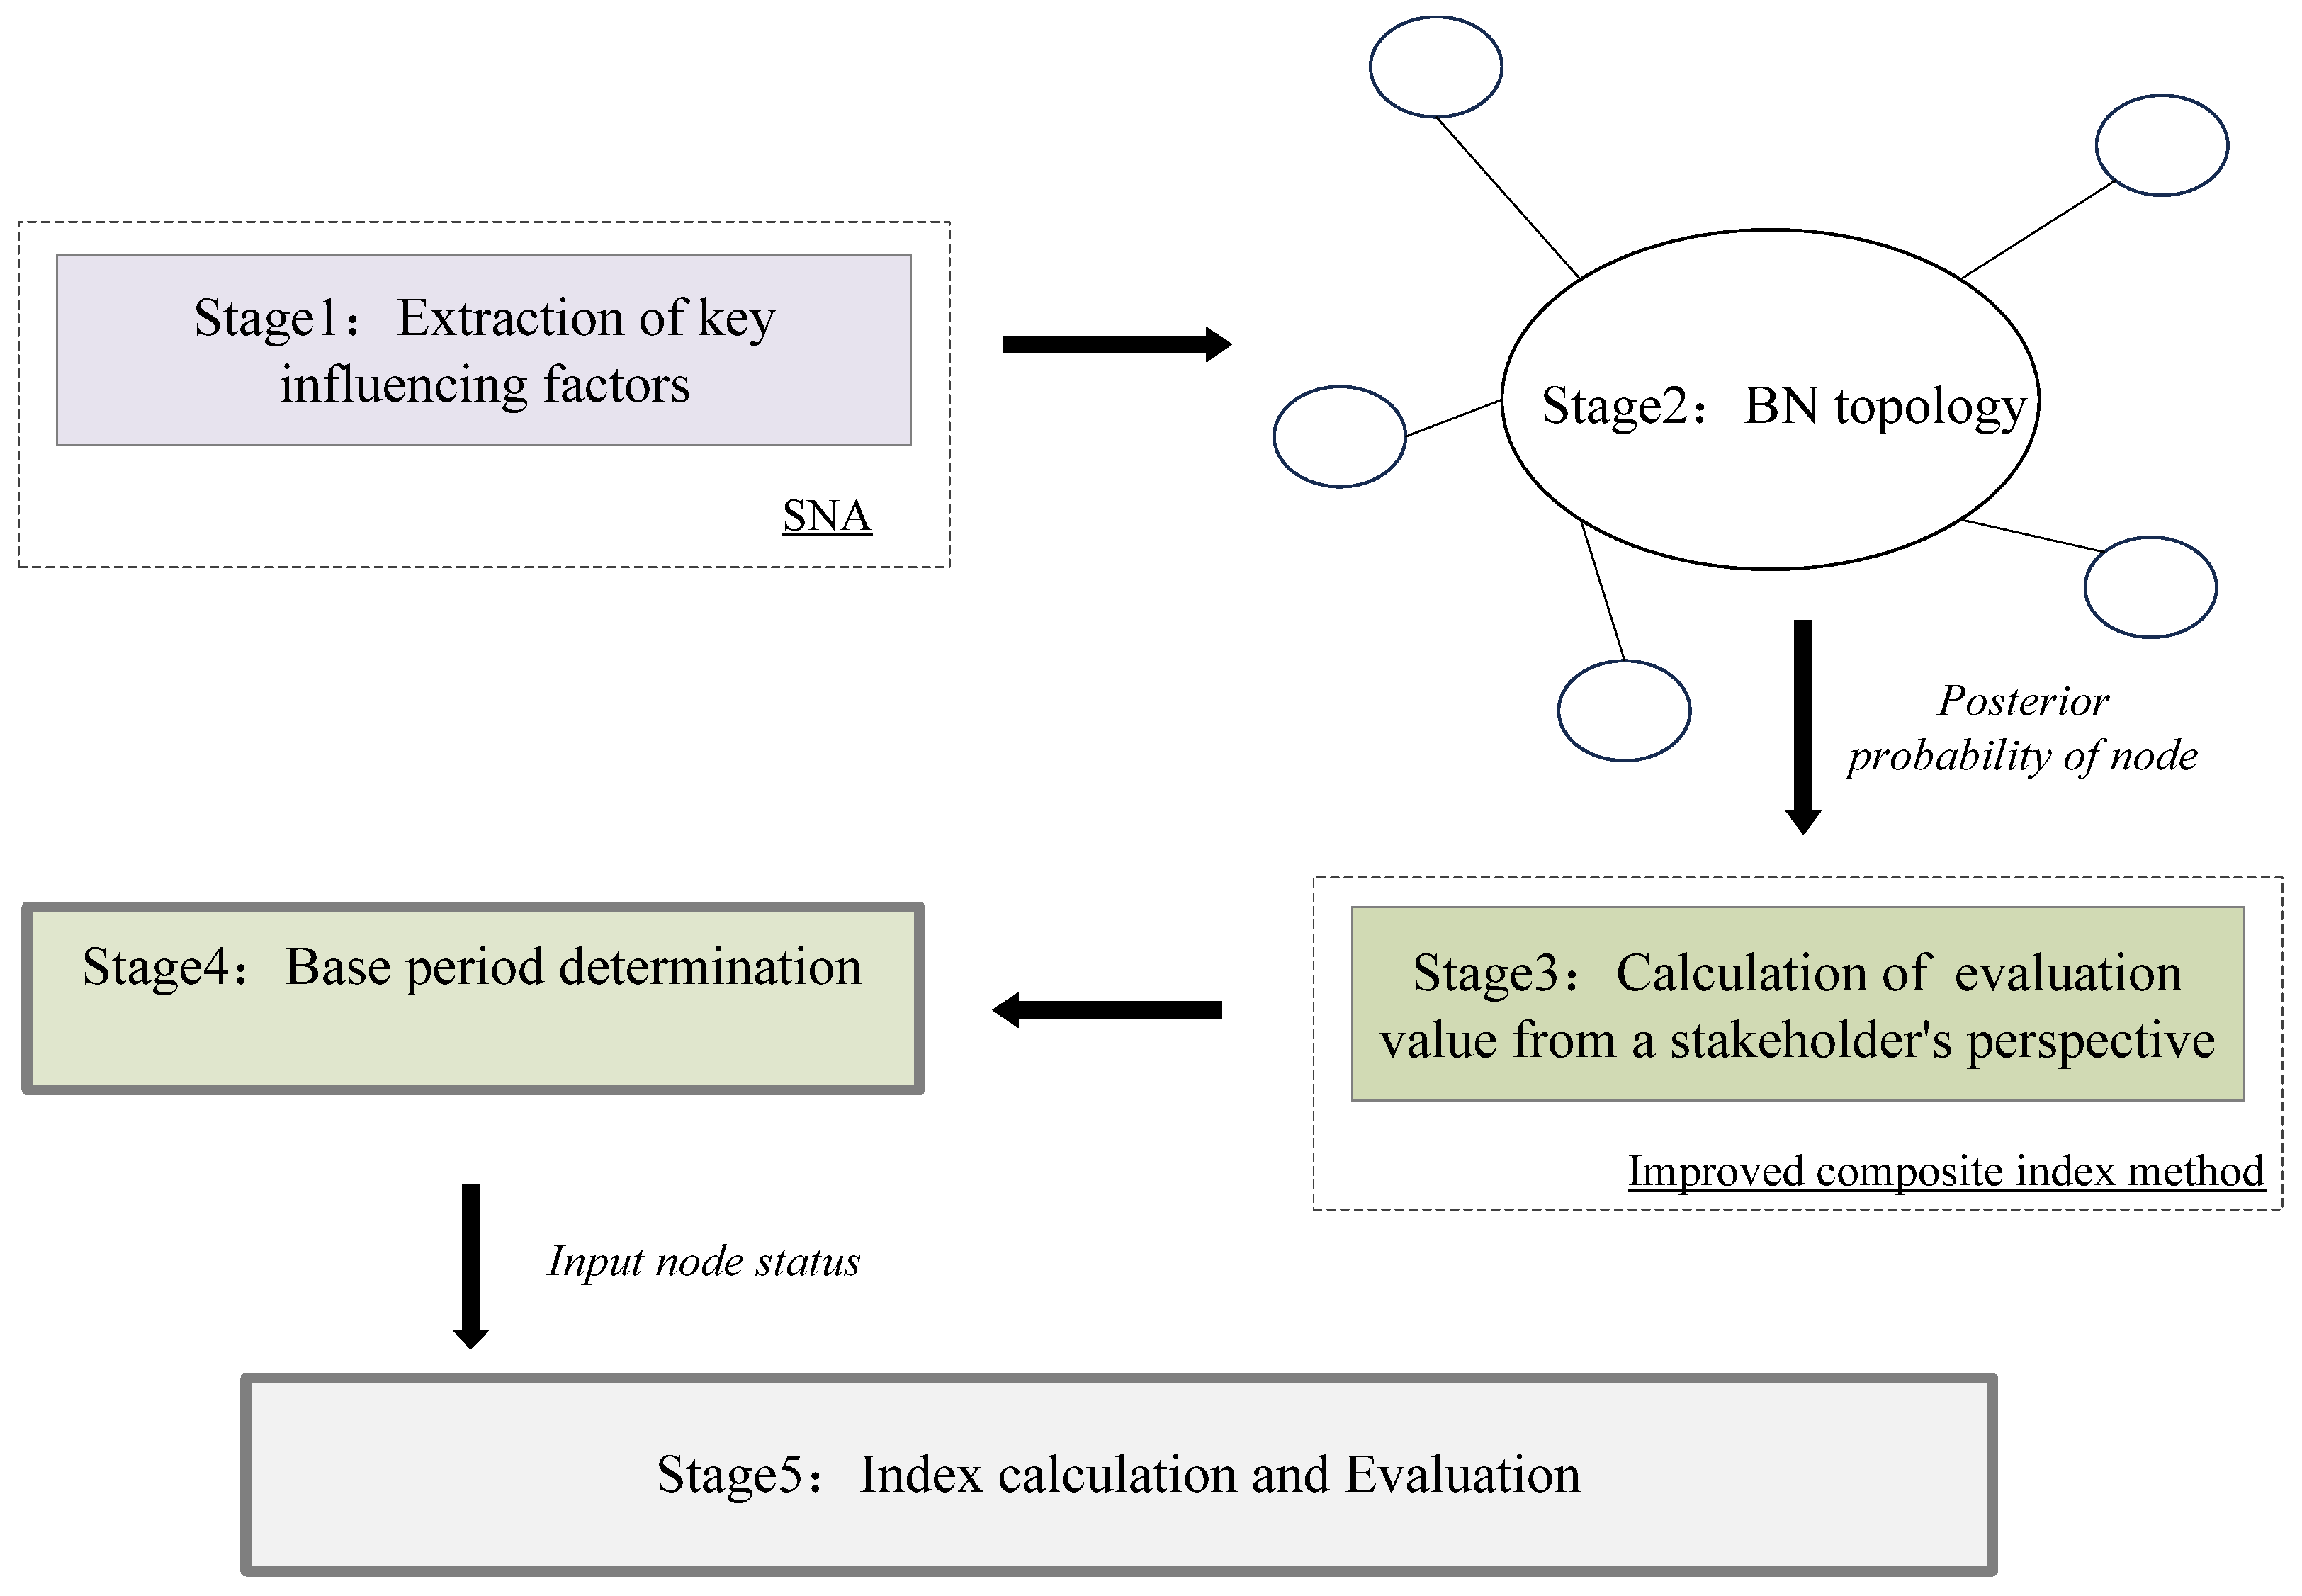
In order to assess the performance of lock navigation scheduling rules, this study uses a Bayesian network model to analyze the influencing factors. Then, the improved composite index method [37,38,39,40] is used to downscale the evaluation of different stakeholders on the performance of scheduling rules, combine the conditional probability of factors in the Bayesian network for the measurement of the performance value, and construct an index-type evaluation model of the performance of lock navigation scheduling rules by the relationship between the base period of the lock navigation scheduling system and the performance value in the observation period. Meanwhile, the index contains an overall index and criterion node index, which can reflect the comprehensive operation performance of the model as well as describe the operation performance of the model under the criterion of efficiency, fairness, and safety. The evaluation process is shown in Figure 4.

4.1. Bayesian Network Structure for Lock Navigation Performance Evaluation

The performance of lock navigation scheduling rules is the result of the joint action of multiple factors under the principles of efficiency, safety, and fairness, which fits well with the idea of the Bayesian network to influence the probability of the state of factors as a consequence evaluation. The Bayesian network (BN) is a method of inference evaluation based on uncertainty probability [38,39]. In a Bayesian network, variables are represented as nodes, and directed edges between nodes represent causal or dependency relationships between variables. Nodes are linked with probability distributions that represent their conditional probability distribution based on their parent’s state.
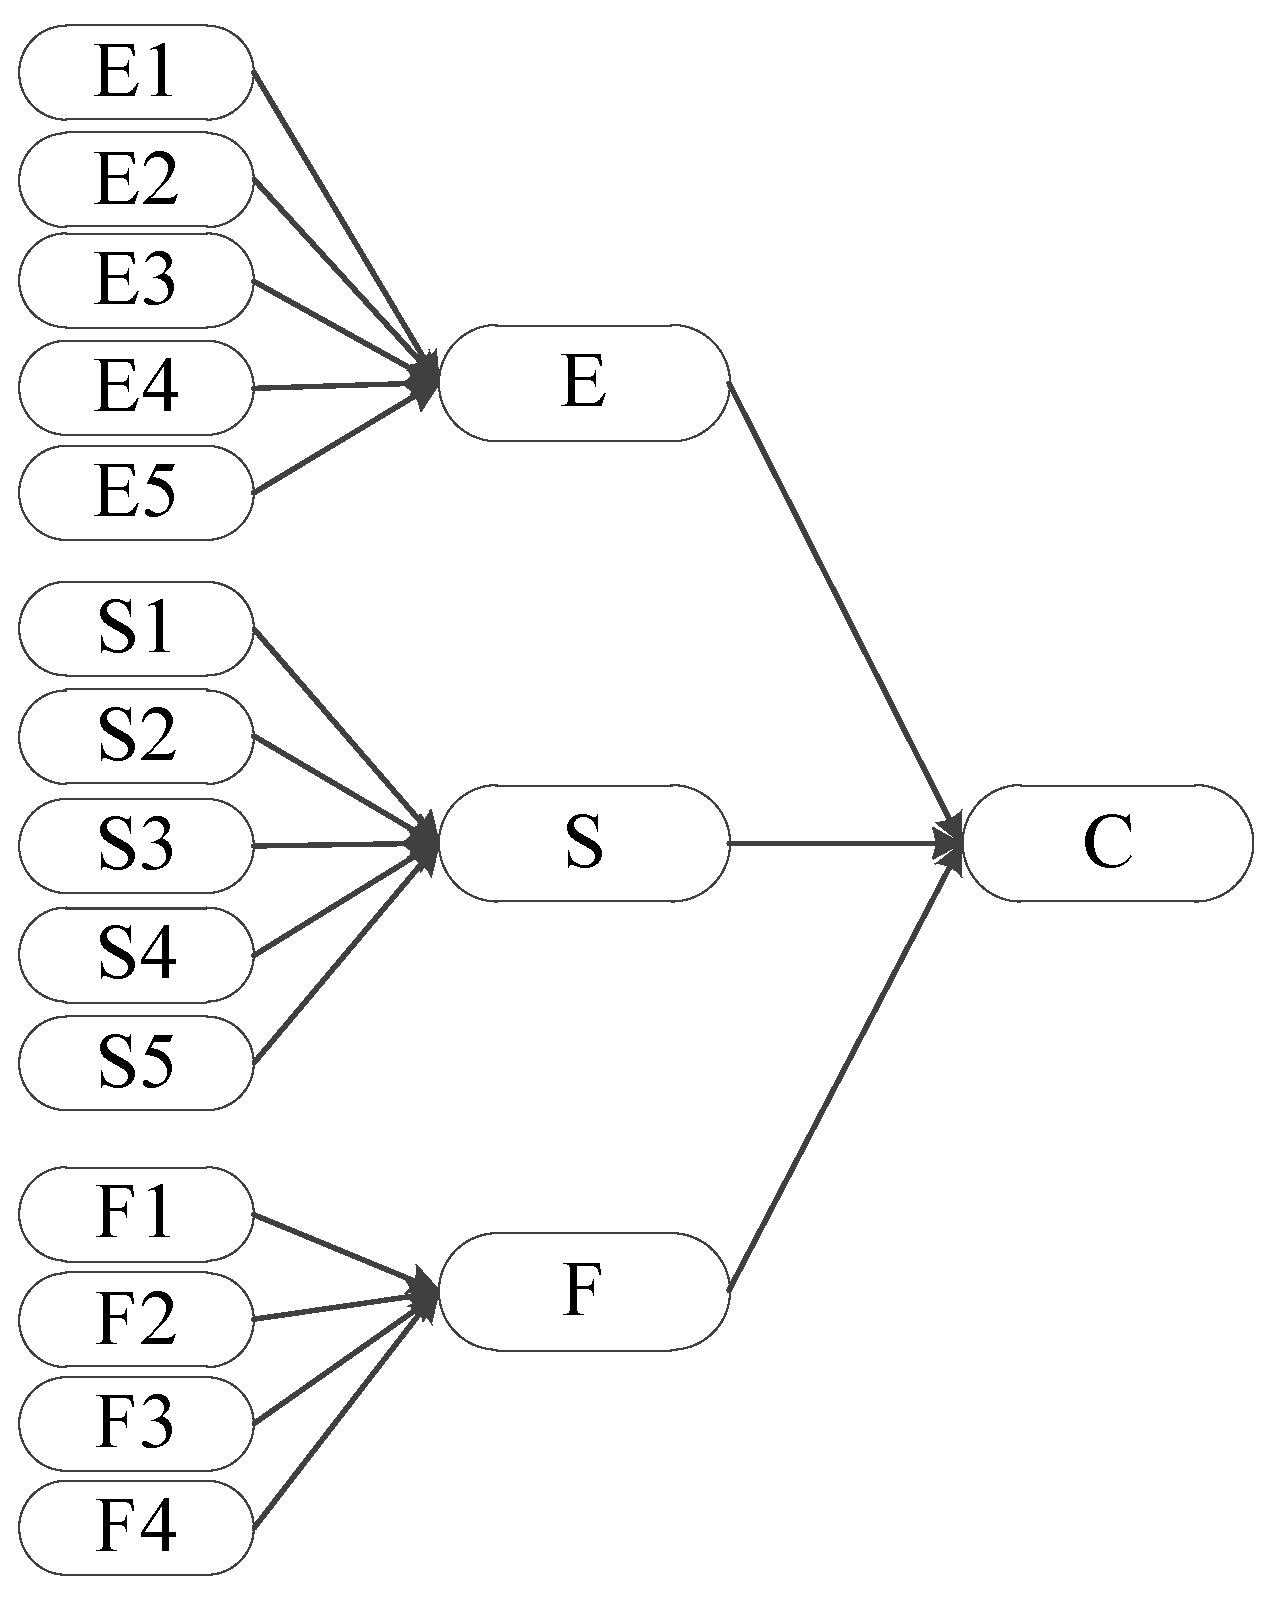
In the Bayesian network structure of a directed acyclic graph, determining the network nodes and their interactions is a key step in the construction of the structure, which can usually be achieved through data fitting for structure learning or based on the experience of experts to build a multilevel network structure. Since the evaluation index system of the performance of lock navigation scheduling rules fits well with the structure of the Bayesian network, this study transforms the three-layer index system according to the form of Bayesian network topology, as shown in Figure 5. This network structure can be widely applied to lock scheduling scenarios, and the use of the BN topology reduces the complexity of the network under the comprehensive performance of multiple factors.

4.2. Factor Node Conditional Probability Calculation

The basic model of Bayesian networks consists of two parts: the determination of the network topology and parameter learning. In the above, the conditional probability tables of all nodes are obtained by using a large amount of sample data to train the parameters of the nodes in the constructed network.
The state value domain of each evidence node needs to be determined before parameter training. There are two main types of nodes: binary-type nodes and numerical-type nodes. As shown in Figure 4, the weather condition node under security is a binary-type node, which exists in two states and can be defined as normal weather and special weather, respectively. The average daily number of vessels passing locks under efficiency is a numerical-type node, which exists in three states, and the boundary values can be determined according to the statistical data. For example, below 60 vessels is defined as state 1, above 70 vessels is defined as state 3, and between 60 and 70 vessels is defined as state 2.
For probability table preparation, this study uses maximum a posteriori estimation (MAP) for parameter learning; maximum a posteriori estimation is a method of Bayesian statistics to obtain point estimates of unknown parameters based on empirical data [39]. In simple terms, MAP is a maximum likelihood estimation (MLE) concerning a priori laws. Assuming a total of i parameters for this study, θ i is the unobserved parameter to be estimated, d i is the corresponding observed data, P ( θ i ) is the prior probability of parameter θ i , P ( d i | θ i ) is the likelihood probability of d i given parameter θ i , and P ( d i | θ i ) is the posterior probability of parameter A given the data d i . The maximum a posteriori estimate θ M A P of parameter θ i is as follows:
θ M A P = arg   max P ( θ i | d i ) = arg   max P ( d i | θ i ) × P ( θ i ) .
In this study, GeNIe 2.0 software is used as a development environment to build a graphical decision-theoretic model, which performs exact inference and parameter learning through a visualization window and outputs a posteriori probability tables under a static or dynamic model to characterize the contribution of each node under the efficiency, fairness, and safety criteria.

4.3. Calculation of Weights and Evaluation Values from Stakeholder Perspectives

To ensure the relevance of the index to the object of study, there are differences in the impact of different criteria on stakeholders. The weights of different criteria factors in the comprehensive evaluation need to be calculated. The judgment matrix is constructed using the 1–9 scale method. Noting that a i j is the ratio of factor i to factor j and n is the number of factors, the judgment matrix is obtained by comparing the judgment factors at each level of the indicator level with each other as follows:
A = ( a i j ) n × n ,   a i j > 0 , a j i = 1 / a i j .
Multiply the elements of each row of the judgment matrix A corresponding to the level to be computed to obtain a new vector m i . w ¯ i is the n th root of m i . Normalize the resulting vector to obtain the corresponding weight values w i .
m i = j = 1 n a i j ,   w ¯ i = m i n ,   w i = w ¯ i / i = 1 n w ¯ i .
The set of stakeholders is S t = s t 1 , s t 2 , s t 3 , of which s t 1 is the navigation management department, s t 2 is the shipping companies, and s t 3 is the coastal government. This leads to the weights W of the efficiency factor w E , safety factor w S , and equity factor w F in the comprehensive evaluation of performance and the weights W e , W s , W f of each stakeholder for efficiency, safety, and equity.
Let B 1 , B 2 , , B m be a total of m stakeholders that form a set B = B 1 , B 2 , , B m . The judgment indicator X 1 , X 2 , , X m of each stakeholder form a set X = X 1 , X 2 , , X n , and the corresponding judgment indicator is denoted as X i j = ( i = 1 , 2 , , m ;   j = 1 , 2 , , n ) , where X i j denotes the j th judgment indicator in the i th stakeholder. Then the judgment matrix B is as follows:
B = ( X i j ) m × n .
The fuzzy evaluation indicators are shown in Table 2.
The composite index method can transform the indicators into individual indices of the same measure [32] to understand and analyze the trends and changes in the data. The fuzzy composite evaluation value c under each criterion of efficiency, safety, and equity is the product of the weighted judgment matrix B and the fuzzy number vector α , where α = ( 0.9 0.7 0.5 0.3 0.1 ) T .
c = ( i = 1 m W i B )     α .

4.4. Base Period Determination and Index Calculation for Lock Navigation Performance Evaluation

In order to make the index of the performance of the lock navigation scheduling rules intuitively and accurately reflect the trend and magnitude of changes in different index states, a stable and comparable benchmark state should be selected based on the nodes of the network model. The index value corresponding to this state should be taken as the benchmark period index of the model.
Considering the occurrence probability of each node state and the impact on stakeholders, multiplying the occurrence probability of the criterion nodes with the criterion evaluation value can obtain the criterion performance value E V of the lock navigation scheduling rules:
E V = i = 1 n p i c i , n = 3 ,
The conditional probability of the composite performance value T E V node is the weight value of the criterion node. The composite performance index T E V is the weighted sum of the three sub-indices of efficiency, safety, and equity:
T E V = i = 1 n w i × E V i , n = 3 ,
The lock navigation scheduling rule performance index E I is a dynamic variable reflecting the actual operation performance of locks, reflecting the degree of recognition of each stakeholder under the three criteria of efficiency, safety, and fairness, which is calculated by the following formula:
E I = i = 1 n p 1 i c i i = 1 n p 0 i c i .
where p is the probability of the occurrence of the factor state, c is the evaluation value under different guidelines, subscript 0 represents the base period, 1 represents the observation period, and i indicates different criterion states. In this paper, the performance index of the base period is set at 1, which is convenient for observing the trend and magnitude of the change in the performance status. For instance, the performance index of the observation period is 1.2, indicating that the comprehensive performance of the observation period is 20% better than that of the base period.

5. Case Study

In this paper, model validation is carried out with the relevant operation data of Three Gorges locks, which is a double-line five-stage ship lock, the largest ship lock in the world, which can pass through a fleet of 10,000-ton ships and is designed to have an annual passing capacity of 50 million tons in one direction. In 2011, the amount of freight passing through the Three Gorges locks exceeded 100 million tons, reaching the design throughput capacity 19 years ahead of schedule, and the amount of freight passing through the locks exceeded 156 million tons in 2022. To alleviate the problem of the normalization of the backlog of ships in the dam area caused by the serious imbalance between supply and demand, it is necessary to analyze and evaluate the performance of the Three Gorges locks scheduling rules.

5.1. Sample Data and Node State Value Domain Determination

The sample data used in this paper is a combination of actual vessel crossing data and simulation data. Since the reservation rule has not yet been implemented in the Three Gorges locks, this study simulates the reservation mode by imposing the constraints of the reservation rule and utilizing the JAVA platform to simulate the reservation mode for vessels passing through the locks in 2021. Data from 91,489 upstream and downstream vessels passing through the locks can be obtained for statistical analysis. Due to the relevant navigation regulations, there are quantitative requirements on daily lockage number, daily vessel number of passing locks, and other indicators. For example, daily lockage numbers should reach at least 14 lockages to avoid the congestion of vessels in the dam area. Therefore, it is necessary to refer to the opinions of navigation management experts to divide the node state value domain.
In this study, a total of five engineers who have been engaged in navigation management, professors who have researched navigation management topics in universities, and captains with rich experience were invited to divide the state value domains of each node according to the characteristics of the daily data and the requirements of the regulations on navigation management, as shown in Table 3.
In this study, the vessel passing data of the Three Gorges in 2021 is inputted into the Java simulation system for optimizing the navigation mode, which can output the simulation data of vessel passing under the corresponding scheduling rules. Initial statistical data cannot be calculated directly, so according to the rules of the value domain division of each node, the upstream and downstream data were counted 37 noise data were removed respectively by day, and finally, 693 sample data were obtained as shown in Table 4.

5.2. Probability Table Calculation

The sample data are imported into the network model, and the state probabilities of efficiency, security, and fairness are estimated using MAP to obtain the posterior probabilities, as shown in Figure 6. At this time, the conditional probability of each node is derived, which will be used for the construction of the Three Gorges lock scheduling rule performance index. The risk likelihood for each node’s rule change can also be thought of in terms of its a posteriori probability value. As an example, consider the weather node under the security criterion. It can be seen that the probability of normal weather is 89% and the probability of abnormal weather is 11%, and if the probability of abnormal weather rises, the overall security decreases accordingly. By observing the probability values of different states of the factors, the risk profile of the rule change can also be reflected.

5.3. Calculation of Base Period Index

To quantify the attitude and importance of each stakeholder to efficiency, safety, and fairness. We conducted a questionnaire survey involving 15 professionals from the navigation management department, shipping companies, and coastal government. From the perspective of work, participants rated the importance of different criteria in five levels, and the total score was 1 under the same criteria. Through the results of the questionnaire survey, we can obtain the fuzzy comprehensive analysis table of the influence of each stakeholder, as shown in Table 5.
According to Formula (3), we can derive the weight W of the efficiency factor w E , safety factor w S , and fairness factor w F in the comprehensive evaluation of the performance and the weights of each stakeholder on the three criteria of efficiency, safety, and fairness, W e , W s , W f :
W = [ w E , w S , w F ] = [ 0.33 , 0.53 , 0.14 ] ;   W e = [ w s t 1 , w s t 2 , w s t 3 ] = [ 0.25 , 0.65 , 0.1 ] .   W s = [ w s t 1 , w s t 2 , w s t 3 ] = [ 0.63 , 0.08 , 0.29 ] ;   W f = [ w s t 1 , w s t 2 , w s t 3 ] = [ 0.17 , 0.75 , 0.08 ] .
Based on Equations (4) and (5), the evaluation matrix for efficiency B E is as follows:
B E = 0.66 0.23 0.11 0 0 0.52 0.26 0.13 0.08 0.01 0.1 0.11 0.36 0.23 0.2
Then c E = W e B E α = 0.7271 , and by the same token, security c S = 0.7958 and fairness c F = 0.7126 .
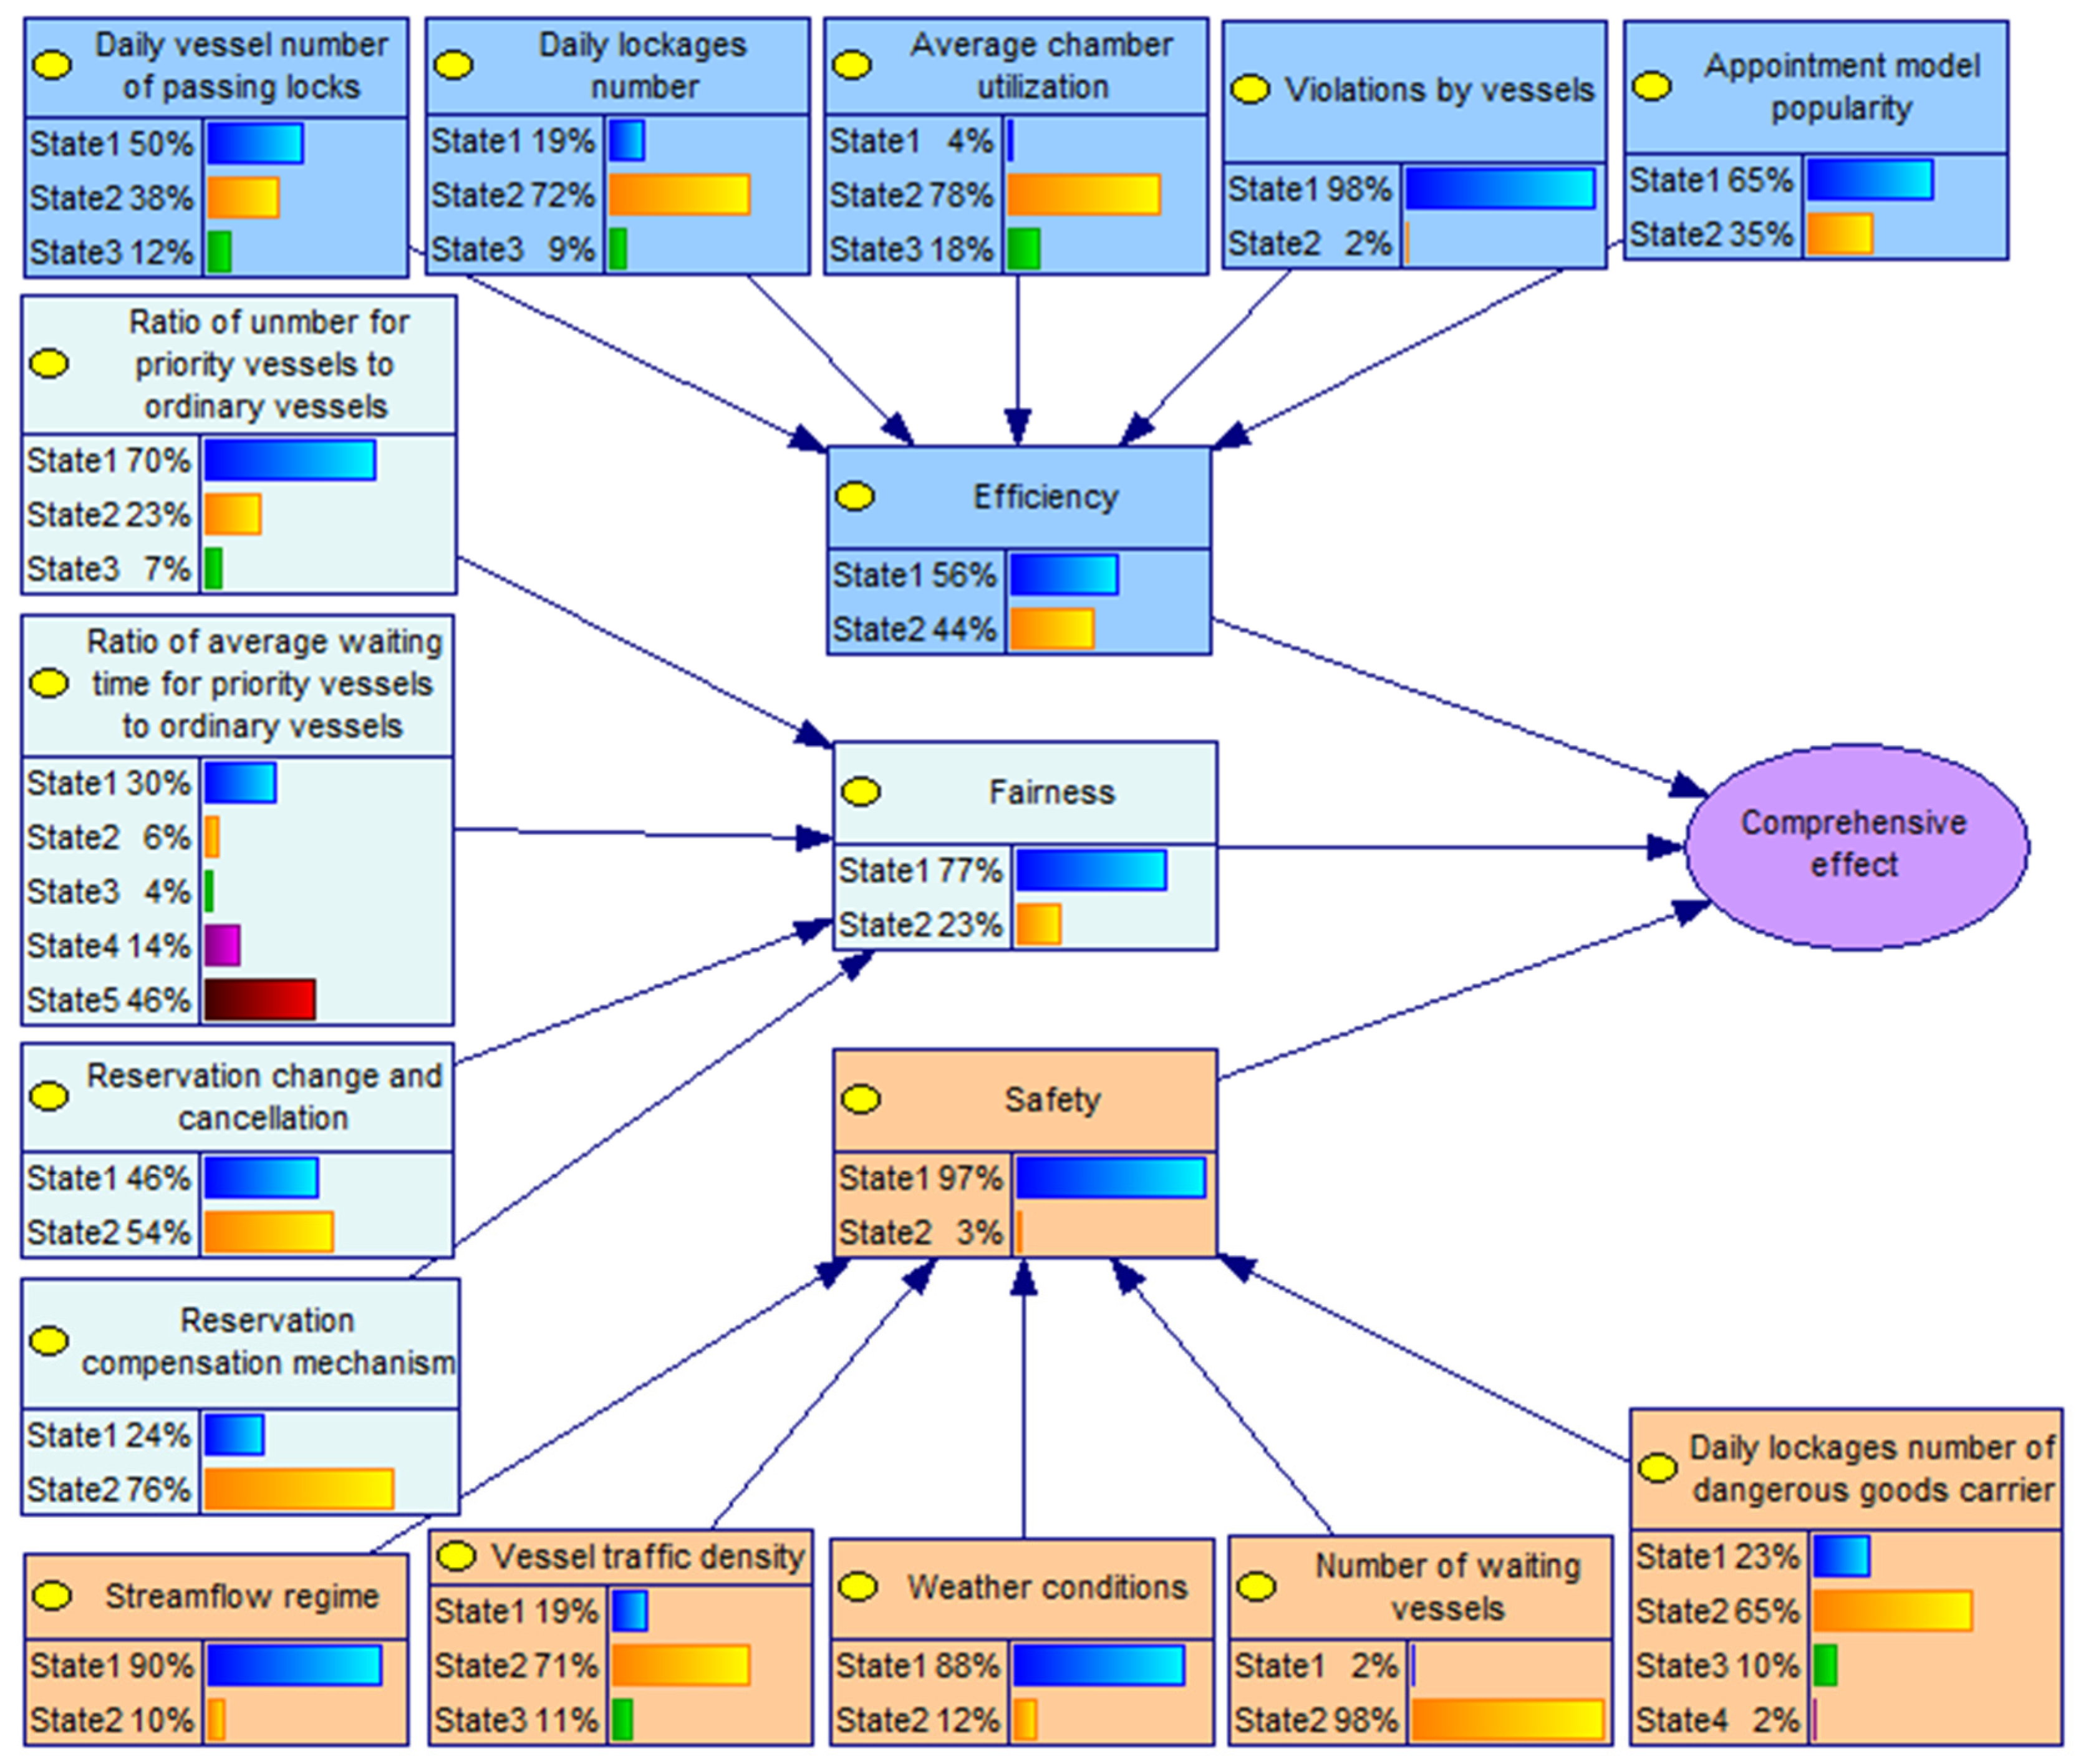
In addition to the actual navigation and scheduling situation, this study takes the most frequently occurring state of each node under normal navigation in the dam area as the benchmark state of that node. When the observation index is higher than the index of the base period, it indicates that the comprehensive performance is better than the benchmark state and vice versa. The base period evidence node situation is shown in Figure 7.
According to Equation (7), the conditional probability of the integrated performance value node is the weight value of the efficiency, safety, and fairness node. So, the integrated performance value of the Three Gorges locks scheduling rules can be derived, as shown in Table 6.
Subsequently, the parameter inputs can be made according to Equation (8) according to different observation scenarios to obtain the performance index of the implementation of the Three Gorges locks scheduling rules under the corresponding scenarios, and the locks overhauling is selected as a representative observation scenario for the validation of the performance index in this paper.

5.4. Index Validation for Lock Maintenance Period

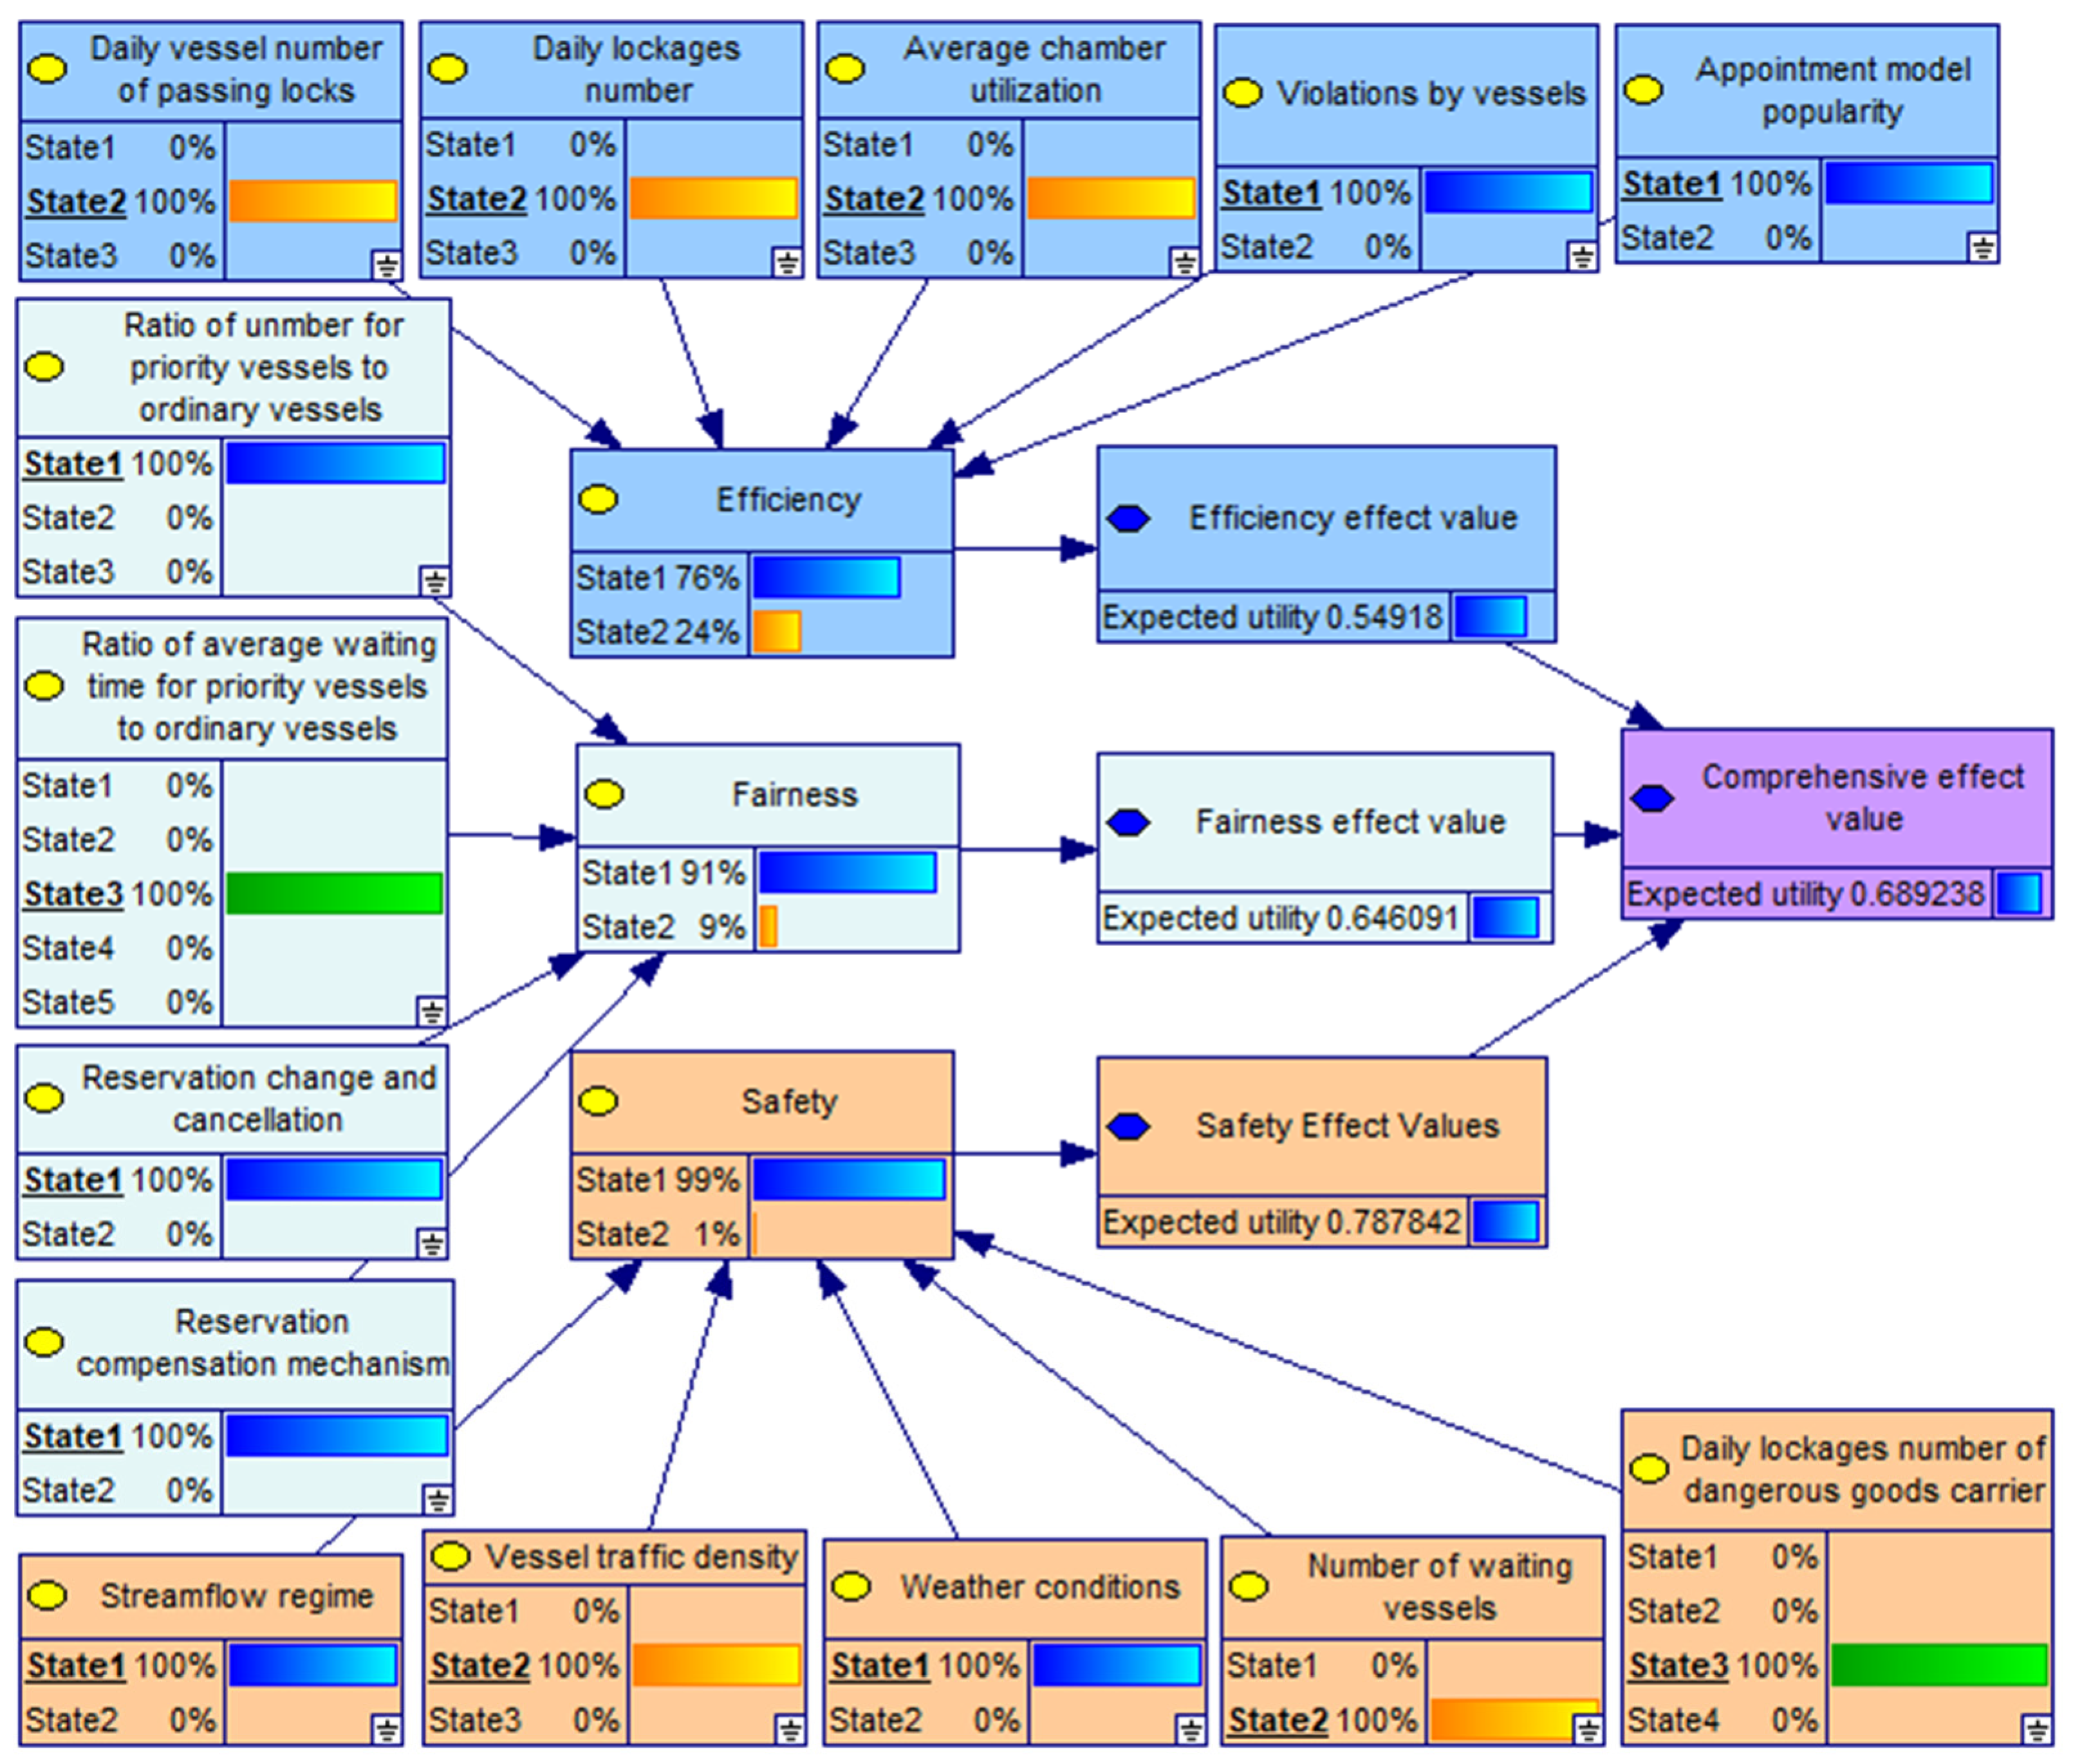
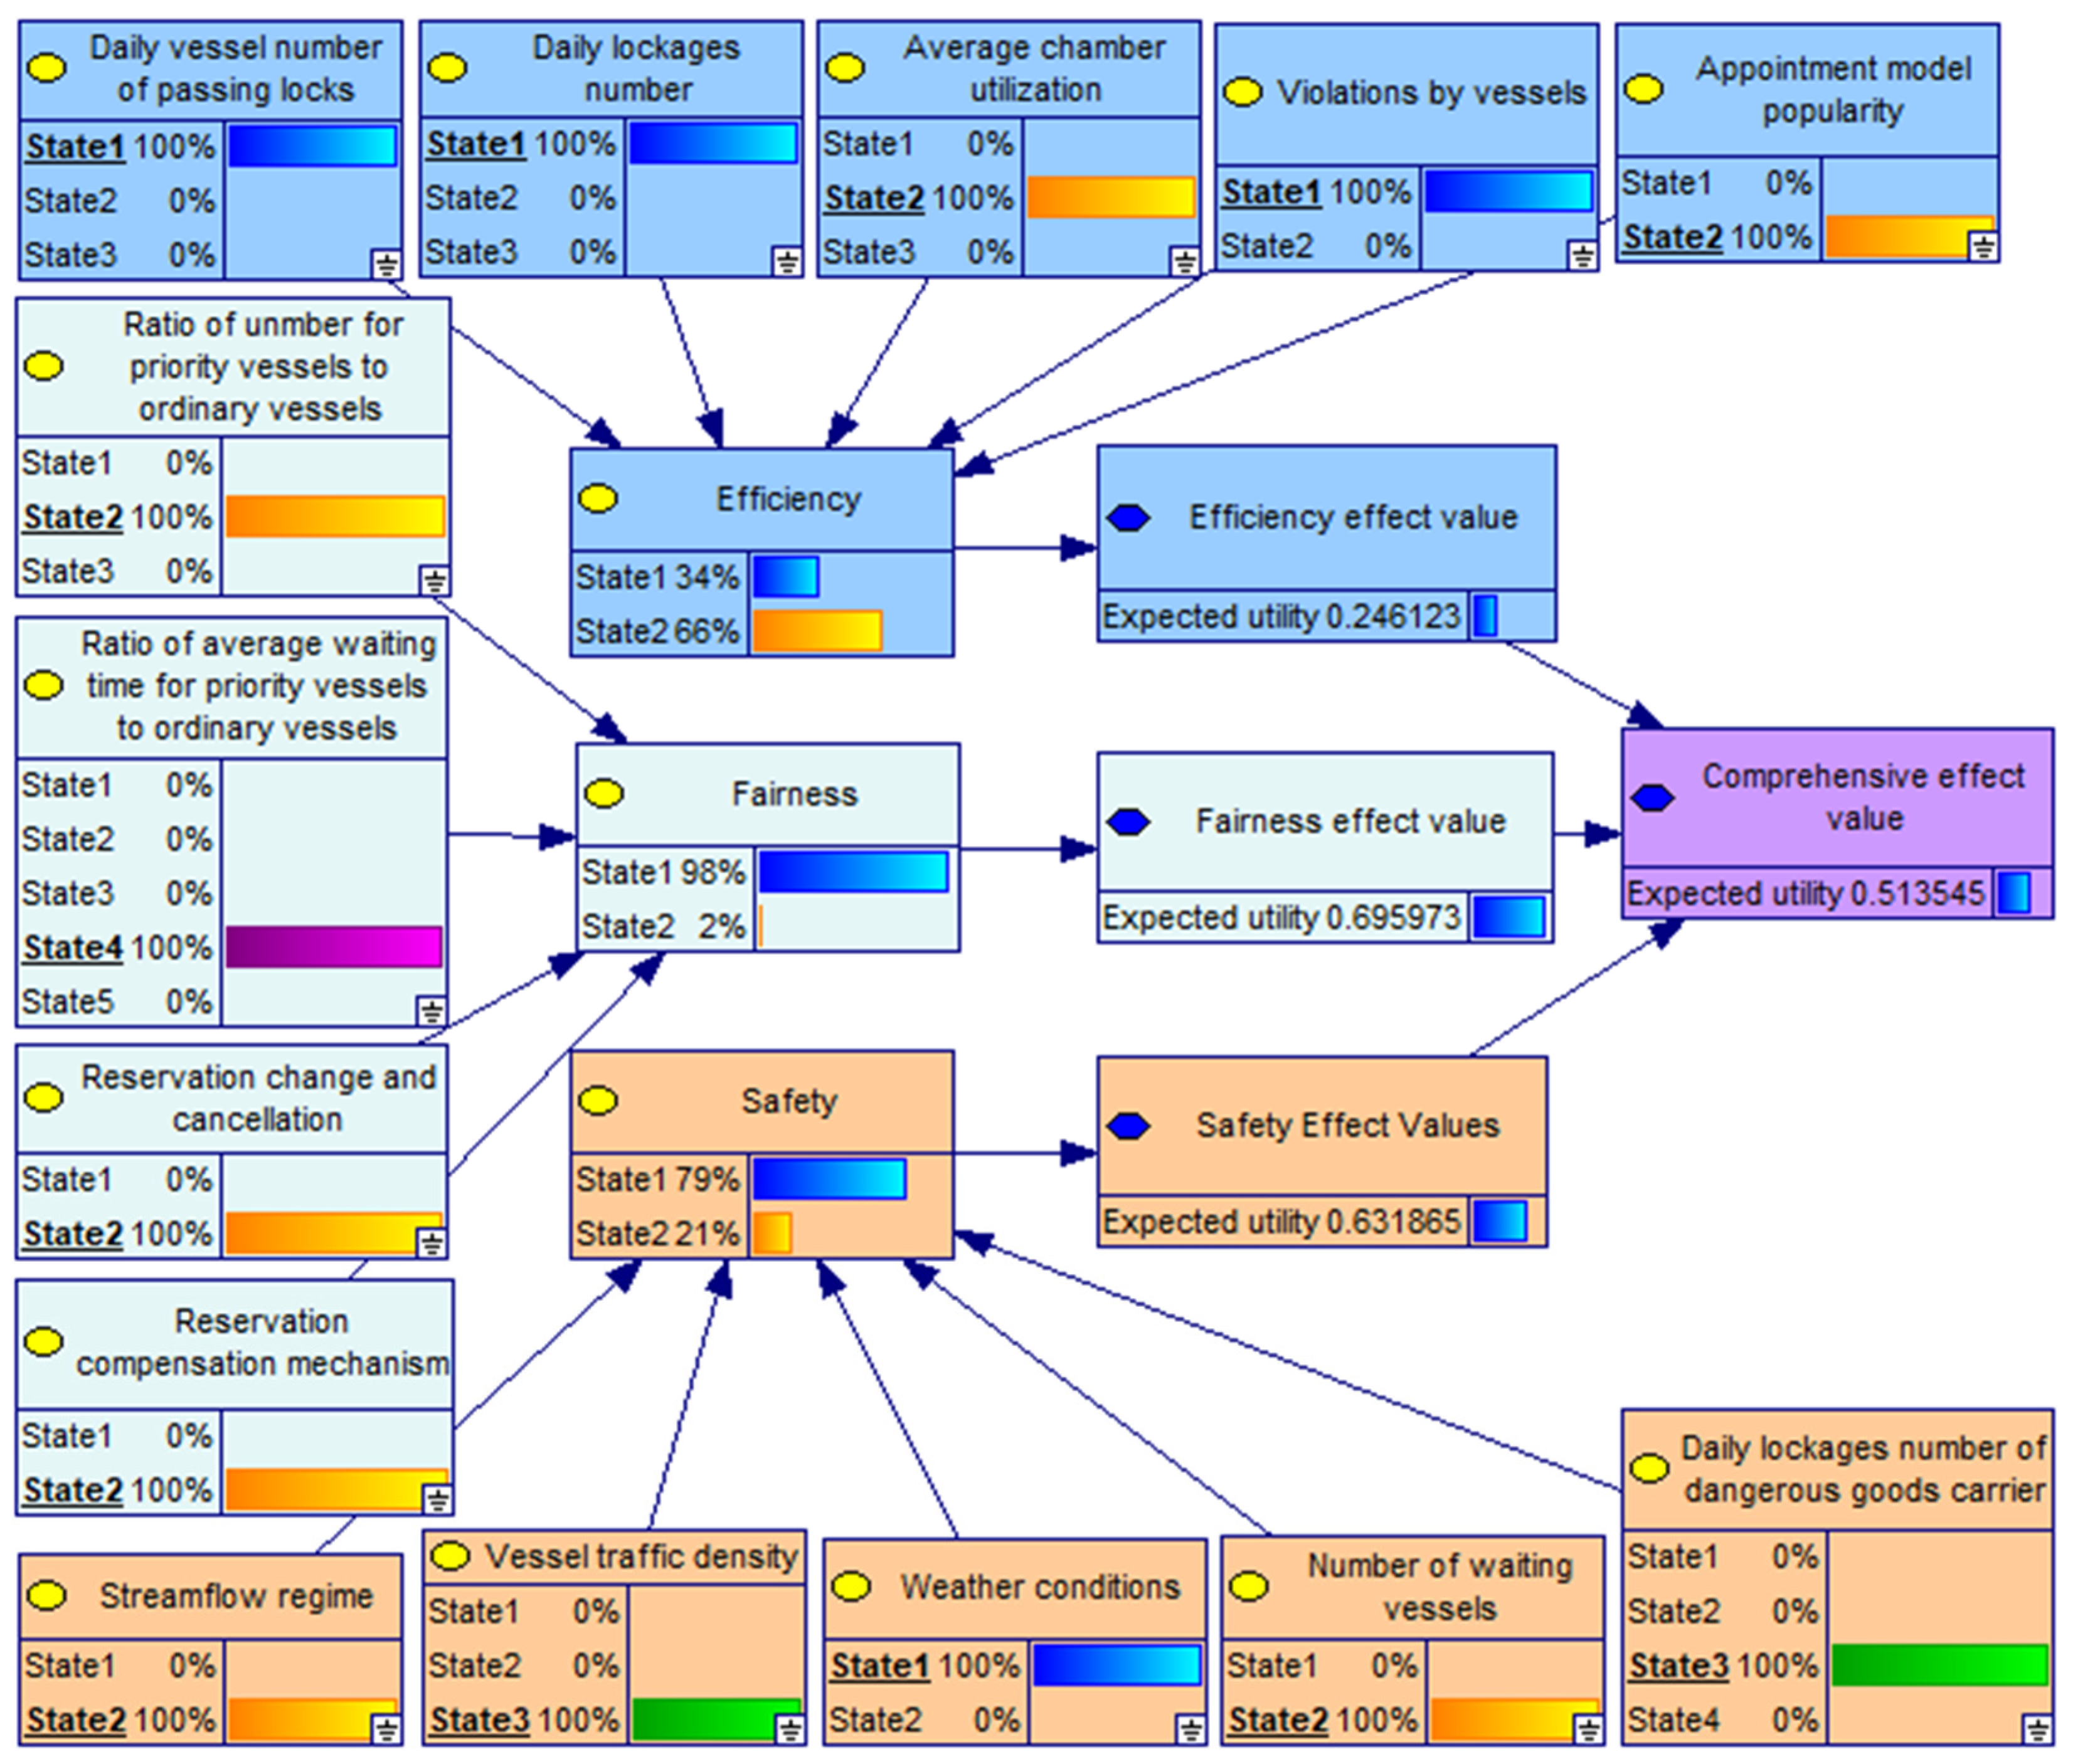
Take a day in 2022 when the Three Gorges locks are shut down for maintenance as an observation scenario. The Three Gorges South Line locks start to be shut down for the implementation of the planned maintenance construction, with a construction period of 30 days. During the suspension of navigation at the south line locks, the north line locks continued to operate. So the passing capacity of the Three Gorges locks was directly halved, i.e., the Parameter input status is as follows: the number of vessels passing locks was less than 60; the number of lockage was less than 14; the average gatehouse utilization rate was 68%; there were no violations by vessels on that day; because the demand for vessel passing locks is much higher than the capacity of the locks, the vessel passing through the locks declaration mode is adopted in the navigation scheduling operation without the use of the rules related to the reservation, and it is not possible to change the reservation, and no compensation for the reservation is given to the ordinary vessels; as a result of the adoption of the declaration system, the ratio of the number of priority vessels to the number of ordinary vessels and the ratio of the waiting time has leveled off; weather conditions are sunny to cloudy; the locks are overhauled for special current conditions; and the density of vessel traffic flow is congested, there are special chambers for dangerous goods, and the number of vessels waiting for the locks is 192. The above information is converted into network model node values according to the factor state value domain division rule and imported into GeNIe 2.0 software, and the results are shown in Figure 8.
According to Equations (6)–(8), the comprehensive performance index and the index of each criterion of the Three Gorges lock maintenance period, as the observation period and the base period, are shown in Table 7. It can be seen that compared with the base period, the comprehensive performance of navigation deteriorated by 25.4% on that day. It was not possible to provide regular ship transportation services across the dam. The efficiency index deteriorated by 55.2% compared with the base period, which also coincided with the situation that the south line locks were out of service and could not operate. The increase in the number of waiting vessels and the congested flow of vessel traffic in the waters were the main reasons for the deterioration of the safety index by 19.8%. For the fairness index, there is an improvement of 7.7% compared to the base period, which is mainly due to the manual scheduling mode adopted by the navigation management department, blurring the distinction between priority ships and ordinary ships in extreme cases and tending to the principle of fairness in scheduling to avoid public opinion incidents. This case can provide some evidence that the performance index evaluation model can correctly reflect the navigational situation in a specific period and how it affects the various stakeholders.

6. Conclusions

The construction of locks can overcome the impact of natural restrictions on ship navigation, such as flow rate and water depth. The implementation of scientific and reasonable scheduling rules can effectively improve the navigable condition of the waterway and promote the development of the logistics industry along the route. Considering the stakeholder perspective to evaluate the performance of the lock navigation scheduling rules is conducive to alleviating the congestion of vessels in the dam area, facilitating the navigational management department to find out the deficiencies of the current scheduling rules and improve them, and more conducive to promoting the coastal government to introduce the policy of capacity restructuring of the waterway. This aims to fill the gaps in the research field of evaluation of the performance of lock navigation scheduling rules as well as the complexity and uncertainty of the evaluation process, while the general evaluation method has the limitation of being highly subjective. This study proposes an index model based on the BN to solve the problem of evaluating the performance of lock navigation scheduling rules. The results in Table 7 show that the observation scenario is the suspension and maintenance period of the Three Gorges locks. The comprehensive performance of the lock scheduling decreases only by 25.4%, while the efficiency and safety criterion performance decreases by 55.2% and 19.8%, respectively, and the fairness criterion performance improves by 7.7%. It shows that the relationship between the comprehensive performance of scheduling rule implementation and the passage capacity is not linear. The index evaluation model can take into account the demands of the coastal government, navigation management department, and shipping companies and balance their interests in the comprehensive evaluation, which is feasible to a certain extent.
This study can be summarized as follows. In order to conduct the performance evaluation accurately, we extracted three main stakeholders and key influencing factors. In terms of modeling, we consider that the node conditional probabilities of the BN can characterize the direction and strength of the factors’ performance under different criteria more flexibly and intuitively than existing tools in view of the objectivity and accuracy of the SNA method for indicator screening and system construction. We first fused the two based on the structural coupling between the SNA indicator system and the BN and proposed the SNA-BN evaluation model. Second, we considered that the multi-attribute evaluation method could make up for the lack of different stakeholders’ concerned perspectives on the same scenario. This study expands the improved composite index method to the BN, adopting the index value to establish causal links with node states dynamically and realizing the characterization of the performance of different criteria. Finally, the proposed index evaluation model is applied to the problem of evaluating the performance of the lock navigation scheduling rules, and the model is validated by the Three Gorges lock maintenance scenario.
It is worth noting that the index evaluation model proposed in this study has three limitations: (1) Lock scheduling rules can be viewed as different node states of the BN evidence nodes, and it is not possible to visualize the impact of rule changes on stakeholders when single or multiple node states are changed. (2) In conducting the calculation of the stakeholder evaluation value, this study sets the weights based on expert opinion, which is somewhat subjective. (3) The perspective of this study focuses on the transportation sector, with less consideration given to economic and environmental protection factors. In view of the above three limitations, future research will further propose an interactive evaluation model based on SNA-BN for highly sensitive dynamic evaluation.

Author Contributions

Conceptualization, R.L. and Q.L.; methodology, R.L., Q.L. and L.W.; software, R.L.; validation, R.L. and L.W.; formal analysis, R.L.; resources, R.L.; data curation, R.L.; writing—original draft preparation, R.L.; writing—review and editing, R.L., L.W. and Q.L.; supervision, Q.L.; project administration, Q.L. and L.W.; funding acquisition, Q.L. All authors have read and agreed to the published version of the manuscript.

Funding

This research was supported by the National Natural Science Foundation of China (Grant number: 51979214), the National Key Research and-Development Program of China (Grant number: 2021YFC3001500), and the research project from Changjiang River Administration of Navigational Affairs, MOT named “Study on the Optimization of Navigational Scheduling Rules for the Three Gorges—Gezhouba Project” (Grant number: 202302hx0043).

Institutional Review Board Statement

Not applicable.

Informed Consent Statement

Not applicable.

Data Availability Statement

The data presented in this study are available on request from the corresponding author.

Acknowledgments

The authors wish to express their special appreciation to all participants joining this study. We also thank the anonymous reviewers for their constructive comments on the manuscript of this paper.

Conflicts of Interest

The authors declare no conflicts of interest.

References

  1. Ji, B.; Zhang, D.; Zhang, Z.; Yu, S.S.; Van Woensel, T. The Generalized Serial-Lock Scheduling Problem on Inland Waterway: A Novel Decomposition-Based Solution Framework and Efficient Heuristic Approach. Transp. Res. Part E Logist. Transp. Rev. 2022, 168, 102935. [Google Scholar] [CrossRef]
  2. Ji, B.; Yuan, X.; Yuan, Y. Orthogonal Design-Based NSGA-III for the Optimal Lockage Co-Scheduling Problem. IEEE Trans. Intell. Transport. Syst. 2017, 18, 2085–2095. [Google Scholar] [CrossRef]
  3. Verstichel, J.; De Causmaecker, P.; Spieksma, F.; Vanden Berghe, G. The Generalized Lock Scheduling Problem: An Exact Approach. Transp. Res. Part E Logist. Transp. Rev. 2014, 65, 16–34. [Google Scholar] [CrossRef]
  4. Verstichel, J.; Kinable, J.; De Causmaecker, P.; Vanden Berghe, G. A Combinatorial Benders’ Decomposition for the Lock Scheduling Problem. Comput. Oper. Res. 2015, 54, 117–128. [Google Scholar] [CrossRef]
  5. Smith, L.D.; Nauss, R.M. Investigating Strategic Alternatives for Improving Service in an Inland Waterway Transportation System. Int. J. Strateg. Decis. Sci. 2010, 1, 62–81. [Google Scholar] [CrossRef]
  6. Campbell, J.F.; Smith, L.D.; Sweeney, D.C. A robust strategy for managing congestion at locks on the Upper Mississippi River. In Proceedings of the 42nd Hawaii International Conference on System Sciences, Waikoloa, HI, USA, 5–8 January 2009; pp. 1–10. [Google Scholar]
  7. Douglas Smith, L.; Nauss, R.M.; Mattfeld, D.C.; Li, J.; Ehmke, J.F.; Reindl, M. Scheduling Operations at System Choke Points with Sequence-Dependent Delays and Processing Times. Transp. Res. Part E Logist. Transp. Rev. 2011, 47, 669–680. [Google Scholar] [CrossRef]
  8. Kimball, R.L.; Shepard, J.R. Marine Traffic Control in the Panama Canal. J. Navig. 1962, 15, 52–61. [Google Scholar] [CrossRef]
  9. Liao, P. Improved Analytical Model for Estimating the Capacity of a Waterway Lock. J. Waterw. Port Coast. Ocean Eng. 2018, 144, 04018021. [Google Scholar] [CrossRef]
  10. Wilson, H.G. On the Applicability of Queueing Theory to Lock Capacity Analysis. Transp. Res. 1978, 12, 175–180. [Google Scholar] [CrossRef]
  11. Chen, X.; Lin, X.; Li, M.; He, F. Network-Level Control of Heterogeneous Automated Traffic Guaranteeing Bus Priority. Transp. Res. Part C Emerg. Technol. 2022, 140, 103671. [Google Scholar] [CrossRef]
  12. Azab, A.; Morita, H. The Block Relocation Problem with Appointment Scheduling. Eur. J. Oper. Res. 2022, 297, 680–694. [Google Scholar] [CrossRef]
  13. Zheng, Q.-Q.; Zhang, Y.; He, L.-J.; Tian, H.-W. Discrete Multi-Objective Artificial Bee Colony Algorithm for Green Co-Scheduling Problem of Ship Lift and Ship Lock. Adv. Eng. Inform. 2023, 55, 101897. [Google Scholar] [CrossRef]
  14. Ting, C.-J.; Schonfeld, P. Control Alternatives at a Waterway Lock. J. Waterw. Port Coast. Ocean Eng. 2001, 127, 89–96. [Google Scholar] [CrossRef]
  15. Mahajan, R.; Lim, W.M.; Sareen, M.; Kumar, S.; Panwar, R. Stakeholder Theory. J. Bus. Res. 2023, 166, 114104. [Google Scholar] [CrossRef]
  16. Yaylacı, E.D.; Düzgün, H.Ş. Evaluating the Mine Plan Alternatives with Respect to Bottom-up and Top-down Sustainability Criteria. J. Clean. Prod. 2017, 167, 837–849. [Google Scholar] [CrossRef]
  17. Manjengwa, E.R.; Dorfling, C.; Tadie, M. Development of a Conceptual Framework to Evaluate Factors That Affect Drivers for Stakeholder Engagement in Mine Waste Management. Resour. Policy 2023, 81, 103280. [Google Scholar] [CrossRef]
  18. Hollebeek, L.D.; Kumar, V.; Srivastava, R.K.; Clark, M.K. Moving the Stakeholder Journey Forward. J. Acad. Mark. Sci. 2023, 51, 23–49. [Google Scholar] [CrossRef]
  19. Damian, I.M.; Navarro-Jurado, E.; Ruiz, F. Involving Stakeholders in the Evaluation of the Sustainability of a Tourist Destination: A Novel Comprehensive Approach. J. Sustain. Tour. 2023, 31, 1631–1650. [Google Scholar] [CrossRef]
  20. Zeng, S.; Hu, Y.; Llopis-Albert, C. Stakeholder-Inclusive Multi-Criteria Development of Smart Cities. J. Bus. Res. 2023, 154, 113281. [Google Scholar] [CrossRef]
  21. AL-Fadhali, N. An AMOS-SEM approach to evaluating stakeholders’ influence on construction project delivery performance. Eng. Constr. Archit. Manag. 2022, 31, 638–661. [Google Scholar] [CrossRef]
  22. Deng, Y.; Sheng, D.; Liu, B. Managing Ship Lock Congestion in an Inland Waterway: A Bottleneck Model with a Service Time Window. Transp. Policy 2021, 112, 142–161. [Google Scholar] [CrossRef]
  23. Zhang, Y.; Zheng, Q.-Q.; He, L.-J.; Tian, H.-W. Ship Traffic Optimization Method for Solving the Approach Channel and Lock Co-Scheduling Problem of the Three Gorges Dam on the Yangzi River. Ocean Eng. 2023, 276, 114196. [Google Scholar] [CrossRef]
  24. Ji, B.; Zhang, D.; Yu, S.S.; Zhang, B. Optimally Solving the Generalized Serial-Lock Scheduling Problem from a Graph-Theory-Based Multi-Commodity Network Perspective. Eur. J. Oper. Res. 2021, 288, 47–62. [Google Scholar] [CrossRef]
  25. Yuan, X.; Ji, B.; Yuan, Y.; Wu, X.; Zhang, X. Co-Scheduling of Lock and Water–Land Transshipment for Ships Passing the Dam. Appl. Soft Comput. 2016, 45, 150–162. [Google Scholar] [CrossRef]
  26. Latifi, M.; Kerachian, R.; Beig Zali, R. Evaluating Energy Harvesting from Water Distribution Networks Using Combined Stakeholder and Social Network Analysis. Energy Strategy Rev. 2023, 49, 101158. [Google Scholar] [CrossRef]
  27. Li, X.; Mao, B.; Feng, X. Analysis on the Effect of Beijing’s Traffic Control Policies. Int. J. Technol. Manag. 2013, 93–97. [Google Scholar]
  28. Guinhouya, K.A. Bayesian Networks in Project Management: A Scoping Review. Expert Syst. Appl. 2023, 214, 119214. [Google Scholar] [CrossRef]
  29. Hasanpour, R.; Rostami, J.; Schmitt, J.; Ozcelik, Y.; Sohrabian, B. Prediction of TBM jamming risk in squeezing grounds using Bayesian and artificial neural networks. J. Rock Mech. Geotech. Eng. 2020, 12, 21–31. [Google Scholar] [CrossRef]
  30. Grzegorczyk, M. Being Bayesian about Learning Gaussian Bayesian Networks from Incomplete Data. Int. J. Approx. Reason. 2023, 160, 108954. [Google Scholar] [CrossRef]
  31. Wiréhn, L.; Danielsson, Å.; Neset, T.-S.S. Assessment of Composite Index Methods for Agricultural Vulnerability to Climate Change. J. Environ. Manag. 2015, 156, 70–80. [Google Scholar] [CrossRef]
  32. Das, S.; Adhikary, P.P.; Shit, P.K.; Bera, B. Assessment of Wetland Health Dynamics: Comparing Fuzzy-AHP and Composite Indexing Methods in an Urban Agglomeration in East India. Geocarto Int. 2022, 37, 16437–16461. [Google Scholar] [CrossRef]
  33. Zhang, Y.; Wu, T.; Ye, Y. Comprehensive Utilization Pattern of the Bohai Rim Coastline Using the Restrictive Composite Index Method. Complexity 2021, 2021, 3402516. [Google Scholar] [CrossRef]
  34. Rani, P.; Tayal, D.K.; Bhatia, M.P.S. Sociocentric SNA on Fuzzy Graph Social Network Model. Soft Comput. 2023, 27, 13201–13216. [Google Scholar] [CrossRef]
  35. Trach, R.; Khomenko, O.; Trach, Y.; Kulikov, O.; Druzhynin, M.; Kishchak, N.; Ryzhakova, G.; Petrenko, H.; Prykhodko, D.; Obodianska, O. Application of Fuzzy Logic and SNA Tools to Assessment of Communication Quality between Construction Project Participants. Sustainability 2023, 15, 5653. [Google Scholar] [CrossRef]
  36. Ozdemir, S.; Carlos Fernandez de Arroyabe, J.; Sena, V.; Gupta, S. Stakeholder Diversity and Collaborative Innovation: Integrating the Resource-Based View with Stakeholder Theory. J. Bus. Res. 2023, 164, 113955. [Google Scholar] [CrossRef]
  37. Wan, Z.; Li, Y.; Wang, X.; An, J.; Cheng, L.; Liao, Y. Effect of Ship-Lock-Induced Surges on Navigation Safety in a Branched Lower Approach Channel System. J. Hydroinform. 2022, 24, 481–496. [Google Scholar] [CrossRef]
  38. Atienza, D.; Bielza, C.; Larrañaga, P. Semiparametric Bayesian Networks. Inf. Sci. 2022, 584, 564–582. [Google Scholar] [CrossRef]
  39. Tronarp, F.; Särkkä, S.; Hennig, P. Bayesian ODE Solvers: The Maximum a Posteriori Estimate. Stat. Comput. 2021, 31, 23. [Google Scholar] [CrossRef]
  40. Sabouri, A.; Dadras, A.R.; Azari, M.; Saberi Kouchesfahani, A.; Taslimi, M.; Jalalifar, R. Screening of Rice Drought-Tolerant Lines by Introducing a New Composite Selection Index and Competitive with Multivariate Methods. Sci. Rep. 2022, 12, 2163. [Google Scholar] [CrossRef]
Figure 1. Lock navigation stakeholder network.
Sustainability 16 02054 g001
Figure 2. Stakeholder focus.
Sustainability 16 02054 g002
Figure 3. Evaluation index system of performance of lock navigation scheduling rules.
Sustainability 16 02054 g003
Figure 4. Index evaluation model workflow.
Sustainability 16 02054 g004
Figure 5. Bayesian network topology.
Sustainability 16 02054 g005
Figure 6. BN posterior probability.
Sustainability 16 02054 g006
Figure 7. Base period evidence node take and evaluation performance value.
Sustainability 16 02054 g007
Figure 8. Combined values of real-time status performance during the lock maintenance period.
Sustainability 16 02054 g008
Table 1. Factors influencing stakeholder focus.
Focus of AttentionFactorsFocus of AttentionFactors
Vessel navigation guarantee levelVessel type;Appointment model popularityRatio of number of priority vessels to ordinary vessels;
Daily vessel number of passing locks;Vessel reservation success rate;
Average waiting time of vessel;Reservation compensation mechanism
Reservation change and cancellation;Integrated vessel prioritization;
Satisfactory rate of safety check.Reservation synergy.
Hydrometeorological characteristics of the dam areaStreamflow regime;Critical water area control measuresViolations by vessels;
Changes in water level;Complexity of port anchorage control;
Vessel traffic density;Number of ports and berths.
Weather conditions.
Priority cargo guarantee levelTransportation cycle of passing lock;Predictability of passing locksAverage chamber utilization;
Ratio of average waiting time for priority vessels to ordinary vessels;Daily lockage number;
Daily lockage number of dangerous goods carrier;Number of waiting vessels;
Prioritization of key cargo vessels.Daily resource releases.
Table 2. Fuzzy evaluation values.
HighRelatively HighModerateRelatively LowLow
Fuzzy number value0.90.70.50.30.1
Table 3. Division of node state value domain.
A: EfficiencyB: Safety
A1: Daily vessel number of passing locksState1: <60
State2: 60–70
State3: >70
B1: Streamflow regimeState1: regular state
State2: special status
A2: Daily lockage numberState1: <14
State2: 14–16
State3: >16
B2: Vessel traffic densityState1: unobstructed
State2: ordinary
State3: congestion
A3: Average chamber utilizationState1: <60%
State2: 60%–75%
State3: >75%
B3: Weather conditionsState1: normal weather
State2: special weather
A4: Violations by vesselsState1: in compliance
State2: in violation
B4: Number of waiting vesselsState1: <100
State2: 100–150
State3: 150–200
State4: >200
A5: Appointment model popularityState1: adoption of the appointment model
State2: no appointment mode
B5: Daily lockage number of dangerous goods carrierState1: no dedicated chamber
State2: dedicated chamber
C: Fairness
C1: Ratio of unmber for priority vessels to ordinary vesselsState1: <0.08
State2: 0.08–0.12
State3: >0.12
C2: Ratio of average waiting time for priority vessels to ordinary vesselsState1: <0.3
State2: 0.3–0.5
State3: 0.5–0.6
State4: 0.6–0.8
State5: >0.8
C3: Reservation change and cancellationState1: adjustable
State2: no adjustable
C4: Reservation compensation MechanismState1: compensable
State2: uncompensated
Table 4. Results of statistical data processing.
SampleNode
AA1A2 B C
1State2State2State3 State1 State1
2State1State1State2 State1 State1
692State2State1State2 State2 State2
693State1State1State2 State2 State1
Table 5. Fuzzy Comprehensive Analysis of Stakeholder Impacts.
FactorsRating Levels
HighRelatively HighModerateRelatively LowLow
Efficiencynavigation management department0.660.230.1100
shipping companies0.520.260.130.080.01
coastal government0.10.110.360.230.2
Safetynavigation management department0.920.070.0100
shipping companies0.160.250.360.180.05
coastal government0.250.450.220.080
Fairnessnavigation management department0.080.180.320.390.03
shipping companies0.610.260.120.010
coastal government0.020.060.670.140.11
Table 6. Criteria Node Performance Values.
Efficiency
Performance Value
Safety
Performance Values
Fairness
Performance Value
Comprehensive
Performance Value
0.5490.7880.6460.689
Table 7. Composite performance Index and Variation of Three Gorges Lock maintenance period.
Comprehensive PerformanceEfficiencySafetyFairness
Base period index1111
Observation period index0.7640.4480.8021.077
change magnitude−25.4%−55.2%−19.8%7.7%
Disclaimer/Publisher’s Note: The statements, opinions and data contained in all publications are solely those of the individual author(s) and contributor(s) and not of MDPI and/or the editor(s). MDPI and/or the editor(s) disclaim responsibility for any injury to people or property resulting from any ideas, methods, instructions or products referred to in the content.

