
Sustainability-Driven Supplier Selection: Insights from Supplier Life Value and Z-Numbers

 , ,
, ,
Abstract
1. Introduction
- ▪
- Identification and Categorization of Crucial Sustainability Sub-Criteria and Supplier Life Cycle Value Calculation: This research pioneers in discerning and classifying pivotal sustainability sub-criteria while introducing a novel method for evaluating the life cycle value of suppliers. This significant advancement lays the foundation for a more comprehensive and nuanced understanding of supplier selection.
- ▪
- Introduction of a Novel Verbal Spectrum for Z-Number Utilizing Scholarly Literature: This study introduces a fresh approach in the form of a verbal spectrum for Z-Number application, drawing insights from rigorous scientific research. This innovation enhances the precision and applicability of Z-Numbers in the context of supplier selection, providing a more refined tool for decision making.
- ▪
- Application of Z-HBWM for Sustainability Sub-Criteria Weighting with Expert-Generated Questionnaires: The utilization of the Z-HBWM approach for weighting sustainability sub-criteria, facilitated by questionnaires crafted and validated by experts and professors, represents a significant stride forward. This method incorporates expert perspectives effectively and ensures a robust and data-driven assessment of the sub-criteria.
- ▪
- Employment of Z-PROMETHEE for Supplier Ranking via Expert-Generated Questionnaires: The article pioneers using the Z-PROMETHEE approach for supplier ranking, leveraging the insights gathered from meticulously crafted questionnaires administered by experts and professors. This methodological innovation adds a layer of objectivity and rigor to the supplier evaluation process, ensuring more accurate and reliable rankings.
- ▪
- Integration of Z-HBWM-PROMETHEE Combined Approach for Supplier Ranking with Consideration of Importance Weights: This study introduces a groundbreaking combined approach, merging the Z-HBWM and Z-PROMETHEE methodologies for supplier ranking. This innovation is marked by its incorporation of importance weights, providing a comprehensive framework that considers the relative significance of various criteria. This approach stands out as a robust and holistic method for supplier evaluation.
2. Literature Review
2.1. Supplier Selection & Importance
2.2. Supplier Selection by Decision Approach
- Identification and Categorization of Sustainability Sub-criteria: This study identifies, categorizes, and filters the sustainability sub-criteria specific to the zinc metal industry. This focused approach ensures that only relevant criteria are considered in the evaluation process.
- Consideration of Supplier Life Cycle Value Criteria: This study introduces and takes into account the value criteria associated with the life cycle of suppliers. This emphasizes the importance of establishing long-term partnerships with suppliers, aligning with sustainable practices.
- Weighting of Sustainable Life Cycle Value Sub-criteria: The Z-HBWM approach is utilized for weighting the sub-criteria related to sustainable life cycle value. This approach employs fuzzy-probabilistic Z-data gathered through expert questionnaires, providing a robust and comprehensive assessment.
- Supplier Ranking using Z-PROMETHEE Approach: This study employs the Z-PROMETHEE approach for ranking suppliers. This method utilizes fuzzy-probabilistic Z-data collected from relevant experts. It ensures a thorough evaluation of suppliers based on sustainability criteria.
- Integration of Z-Number Information in Decision Making: This study leverages Z-Number information in both the HBWM and PROMETHEE decision-making approaches. This integration brings the decision-making process closer to real-world conditions, enhancing the reliability of outcomes.
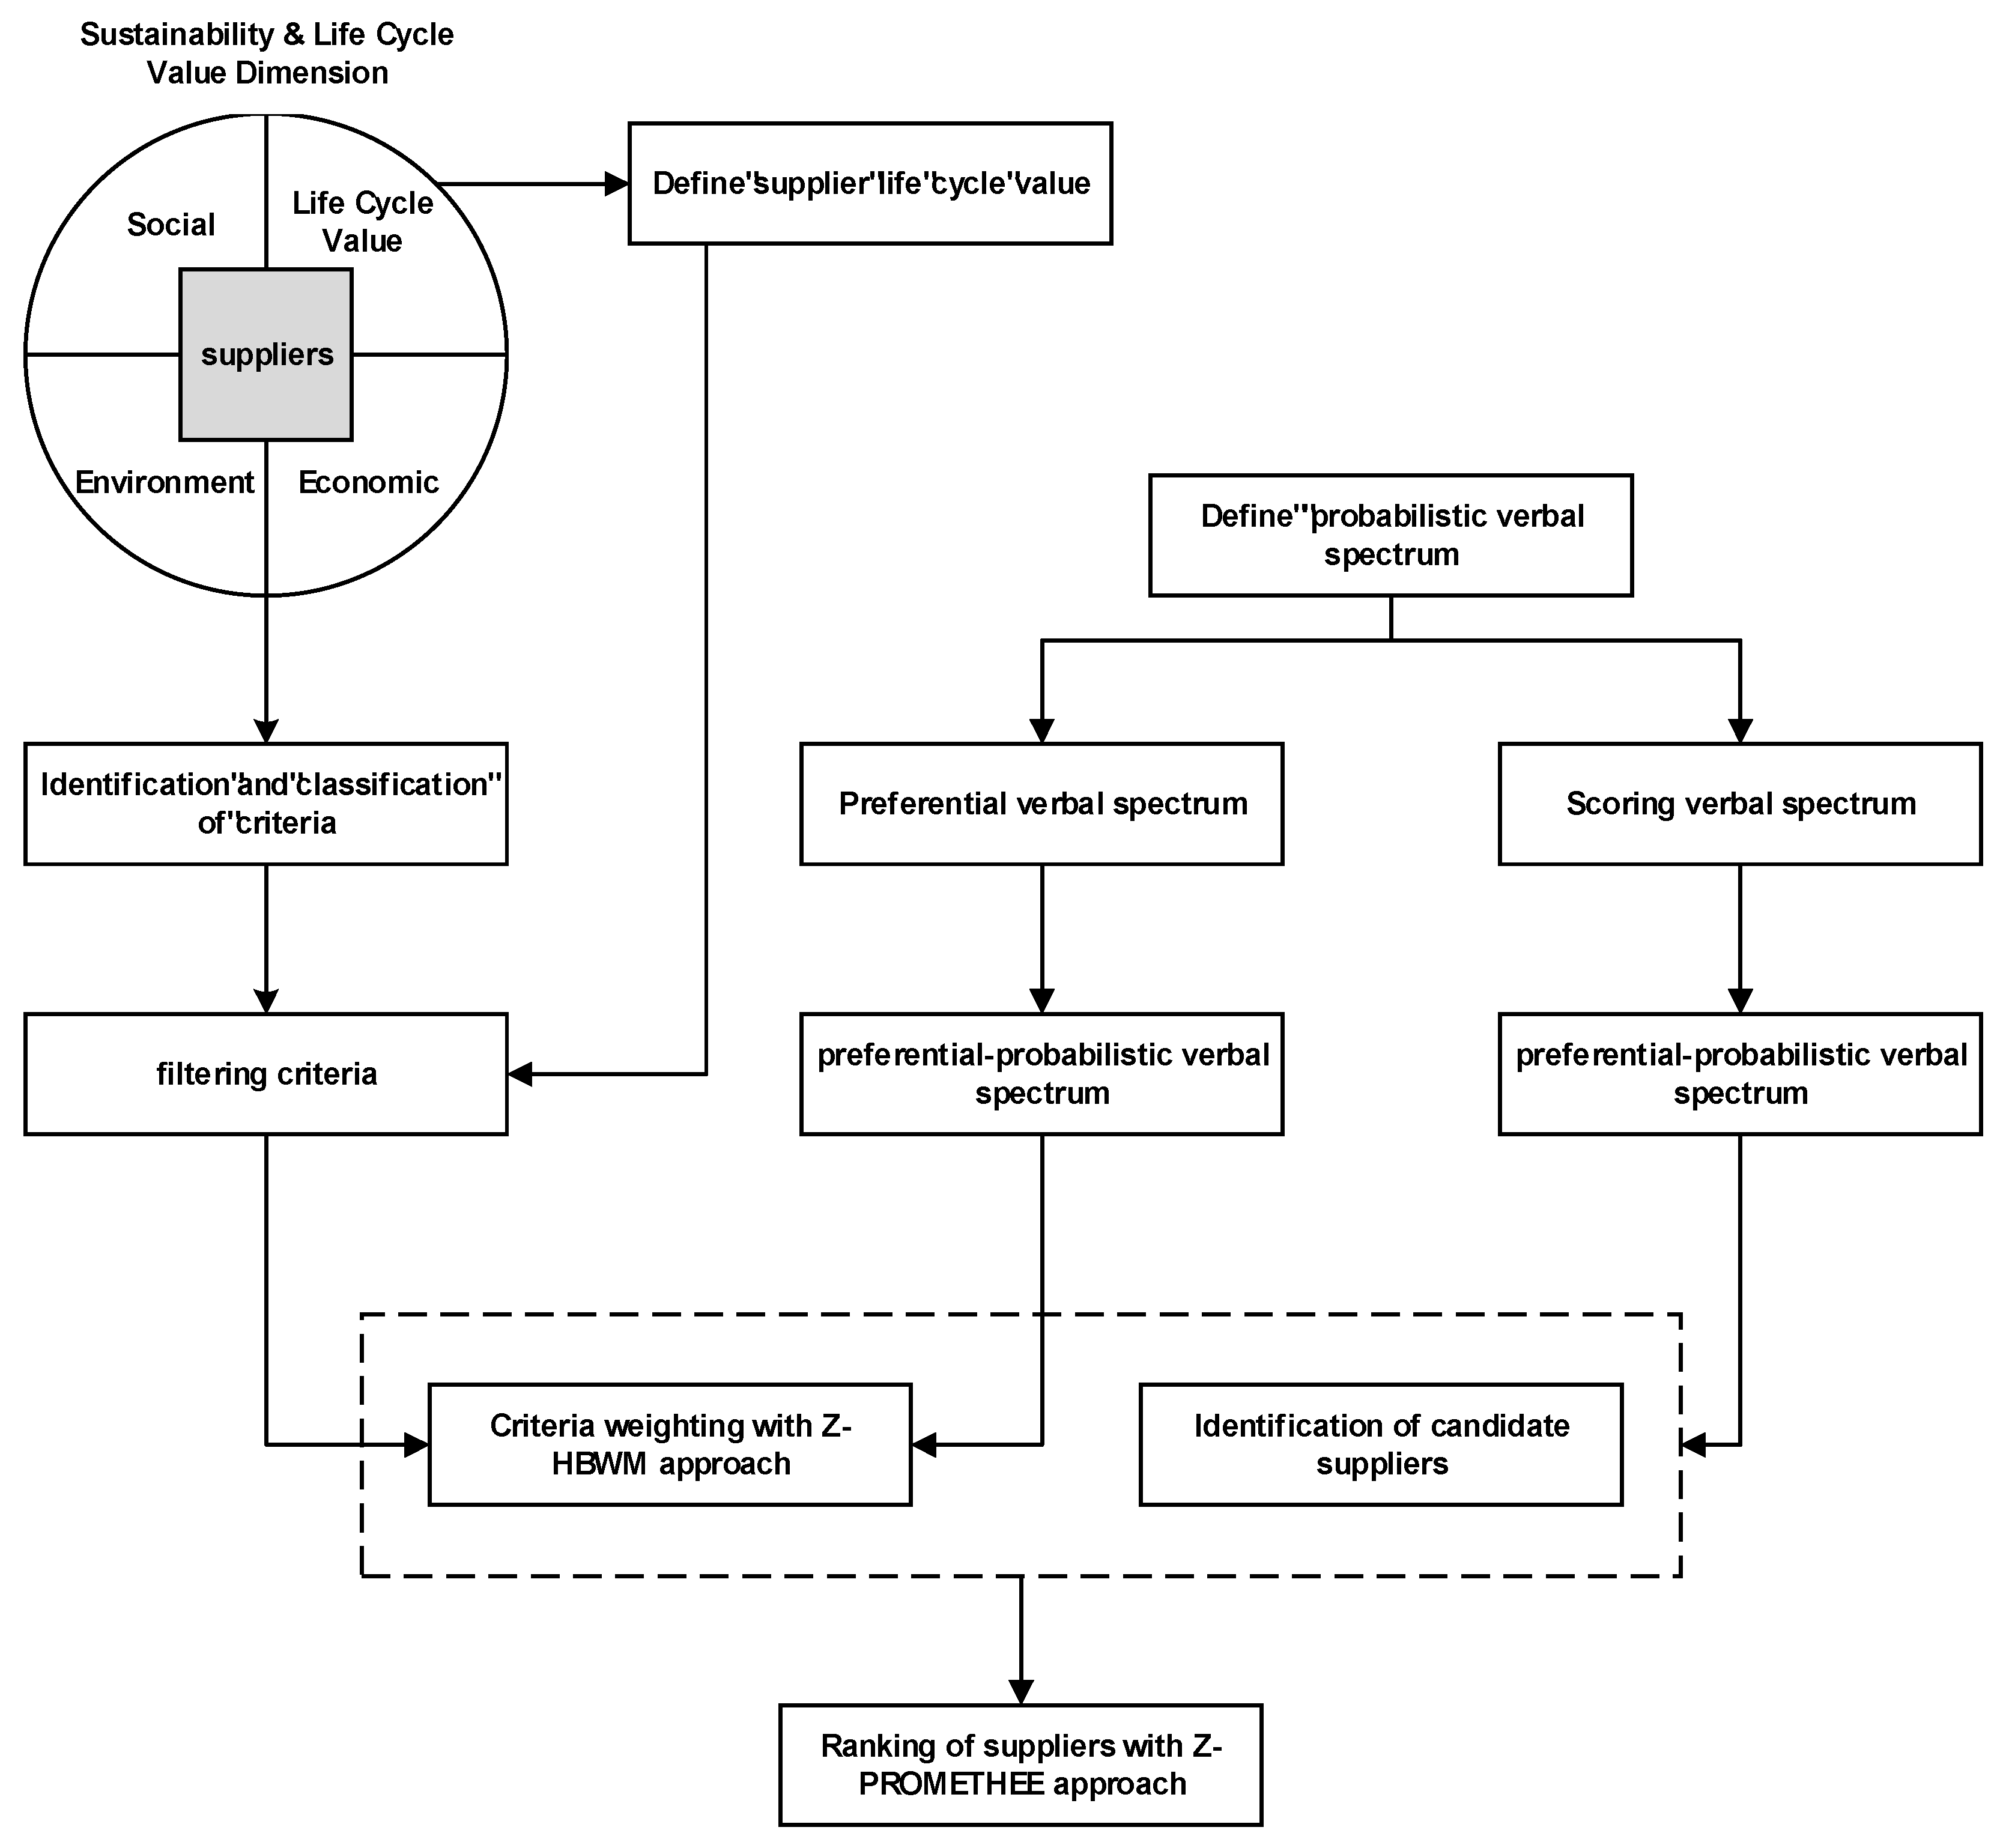
3. Methodology
- ▪
- Step 1: Identify, Categorize, and Filter Sustainability Criteria: This step focuses on identifying and organizing the key sustainability criteria that will be used to evaluate potential suppliers. The Fernandez Sanchez and Rodriguez Lopez approach is employed to systematically identify, categorize, and filter the sustainability criteria. This approach likely provides a structured framework for evaluating various aspects of supplier sustainability, such as environmental impact, social responsibility, and economic viability.
- ▪
- Step 2: Calculate Supplier’s Life Cycle Value: This step involves assessing the value of a supplier’s life cycle, which encompasses various stages from procurement to disposal. The calculation of the supplier’s life cycle value is conducted as a critical criterion in the supplier selection process. This metric likely involves analyzing factors like product quality, reliability, and total cost of ownership over the entire life cycle.
- ▪
- Step 3: Introduce the Z-HBWM Approach for Weighting Criteria: This step introduces the Z-HBWM (Z-Number Hierarchical Best Worst Method) approach to assign weights to the identified criteria. The Z-HBWM method involves using Z-Numbers, which are a specialized form of fuzzy numbers with additional probabilistic information. This approach likely enhances the ability to handle ambiguity and uncertainty in the weighting process. The introduction of a new lexical range for Z-Numbers suggests that specific linguistic terms or descriptors are used to define the degrees of membership and non-membership associated with the Z-Numbers.
- ▪
- Step 4: Introduce the Z-PROMETHEE Approach for Supplier Ranking: This step introduces the Z-PROMETHEE approach to rank sustainable suppliers based on the weighted criteria. The Z-PROMETHEE method likely leverages Z-Numbers to incorporate additional uncertainty and ambiguity considerations in the ranking process. Defining a new word spectrum for Z-Numbers suggests that specific linguistic terms or descriptors are used to assess the preferences and outranking relationships between suppliers.

3.1. Identifying, Categorizing, and Filtering Sustainability Sub-Criteria and Calculating Supplier Life Cycle Value
3.1.1. Steps of Filtering Sustainability Criteria to Select Suppliers
- ▪
- Step 1 Identifying Criteria: In the initial phase, a comprehensive review of studies pertaining to supplier selection criteria and criteria for evaluating supplier sustainability was conducted. This process yielded an initial list of criteria and criteria crucial for sustainability in supplier selection.
- ▪
- Step 2 Categorizing the Criteria: Subsequently, the criteria identified in the previous step were systematically classified. The table below illustrates the framework for sustainable assessment, which encompasses the three pillars of sustainability: economic, social, and environmental. Employing this same framework, the indices outlined in Table 2 were organized within the structure of sustainable assessment.
- ▪
- Step 3 Filtering Criteria and Seeking Expert Opinions: During this phase, the opinions and insights of experts are leveraged to scrutinize each of the identified criteria. This process aids in filtering out criteria that may be irrelevant or impractical for this study.

| Reference | Criteria | Dimensions |
|---|---|---|
| [47] | Quality of products | Economical |
| [48] | Sales price of products | |
| [49] | Delivery time | |
| [48] | Geographical location of the supplier | |
| [48] | Production capacity | |
| [50] | Supplier performance | |
| [51] | Supplier profitability | |
| [52] | Terms of payment | |
| [50] | Warranty and after-sales service | |
| [53] | Supplier inventory management | |
| [54] | Customer relation management | |
| [50] | Supplier risk and crisis management | |
| [47] | Experience and background | |
| [55] | Capacity and capability of e-commerce | |
| [56] | Variety of products | |
| [53] | Pay attention to social responsibilities | Social |
| [57] | Compliance of employment contracts with international and governmental laws | |
| [26] | Respect for government policies | |
| [58] | Occupational safety and health management systems | |
| [59] | Work methods and competencies | |
| [60] | Local shopping degree | |
| [58] | The level of attention paid to working children and participation in charitable activities | |
| [61] | Creating employment | |
| [26] | Employee benefits and rights | |
| [26] | Note the rights of stakeholders | |
| [53] | Green design of products and use of environmentally friendly materials | Environmental |
| [53] | Environmental protection policy | |
| [62] | Environmental competencies | |
| [26] | Green R&D | |
| [2] | Pollution rate and control | |
| [26] | Green product production | |
| [26] | Resource consumption and the use of non-renewable energy | |
| [26] | Electrical and electronic waste | |
| [63] | Product recyclability | |
| [26] | Green supply-chain management | |
| [53] | Green packaging |
3.1.2. Supplier Life-Cycle Value (SLV)
3.2. Z-Number and the Linguistic Scale with Probabilities
3.3. Z-HBWM
| Set | Criteria | |
| Sub-Criteria | ||
| Parameters | Fuzzy preferential preference of the best criterion over the j criterion | |
| Fuzzy preferential preference of the number one criterion over the worst criterion | ||
| Preferential fuzzy preference of the best sub-criterion on the k sub-criterion of the j criterion | ||
| The fuzzy preferred priority of the k sub-criterion over the worst sub-criterion of the j criterion | ||
| Variables | Weight of the best criteria | |
| Criterion weight j | ||
| Weight of the worst criteria | ||
| The weight of the best sub-criterion on the criterion j | ||
| The weight of the k sub-criterion on the j criterion | ||
| The weight of the worst sub-criterion on the criterion j | ||
| The total weight of the sub-criterion k for the criterion j |
3.4. Z-PROMETHEE
PROMETHEE Approach in Fuzzy and Z-NUMBER Conditions
4. Case Study
4.1. Filtering Sustainability Sub-Criteria and Identifying Final Subscales of Sustainable Life Cycle Value to Rank Suppliers
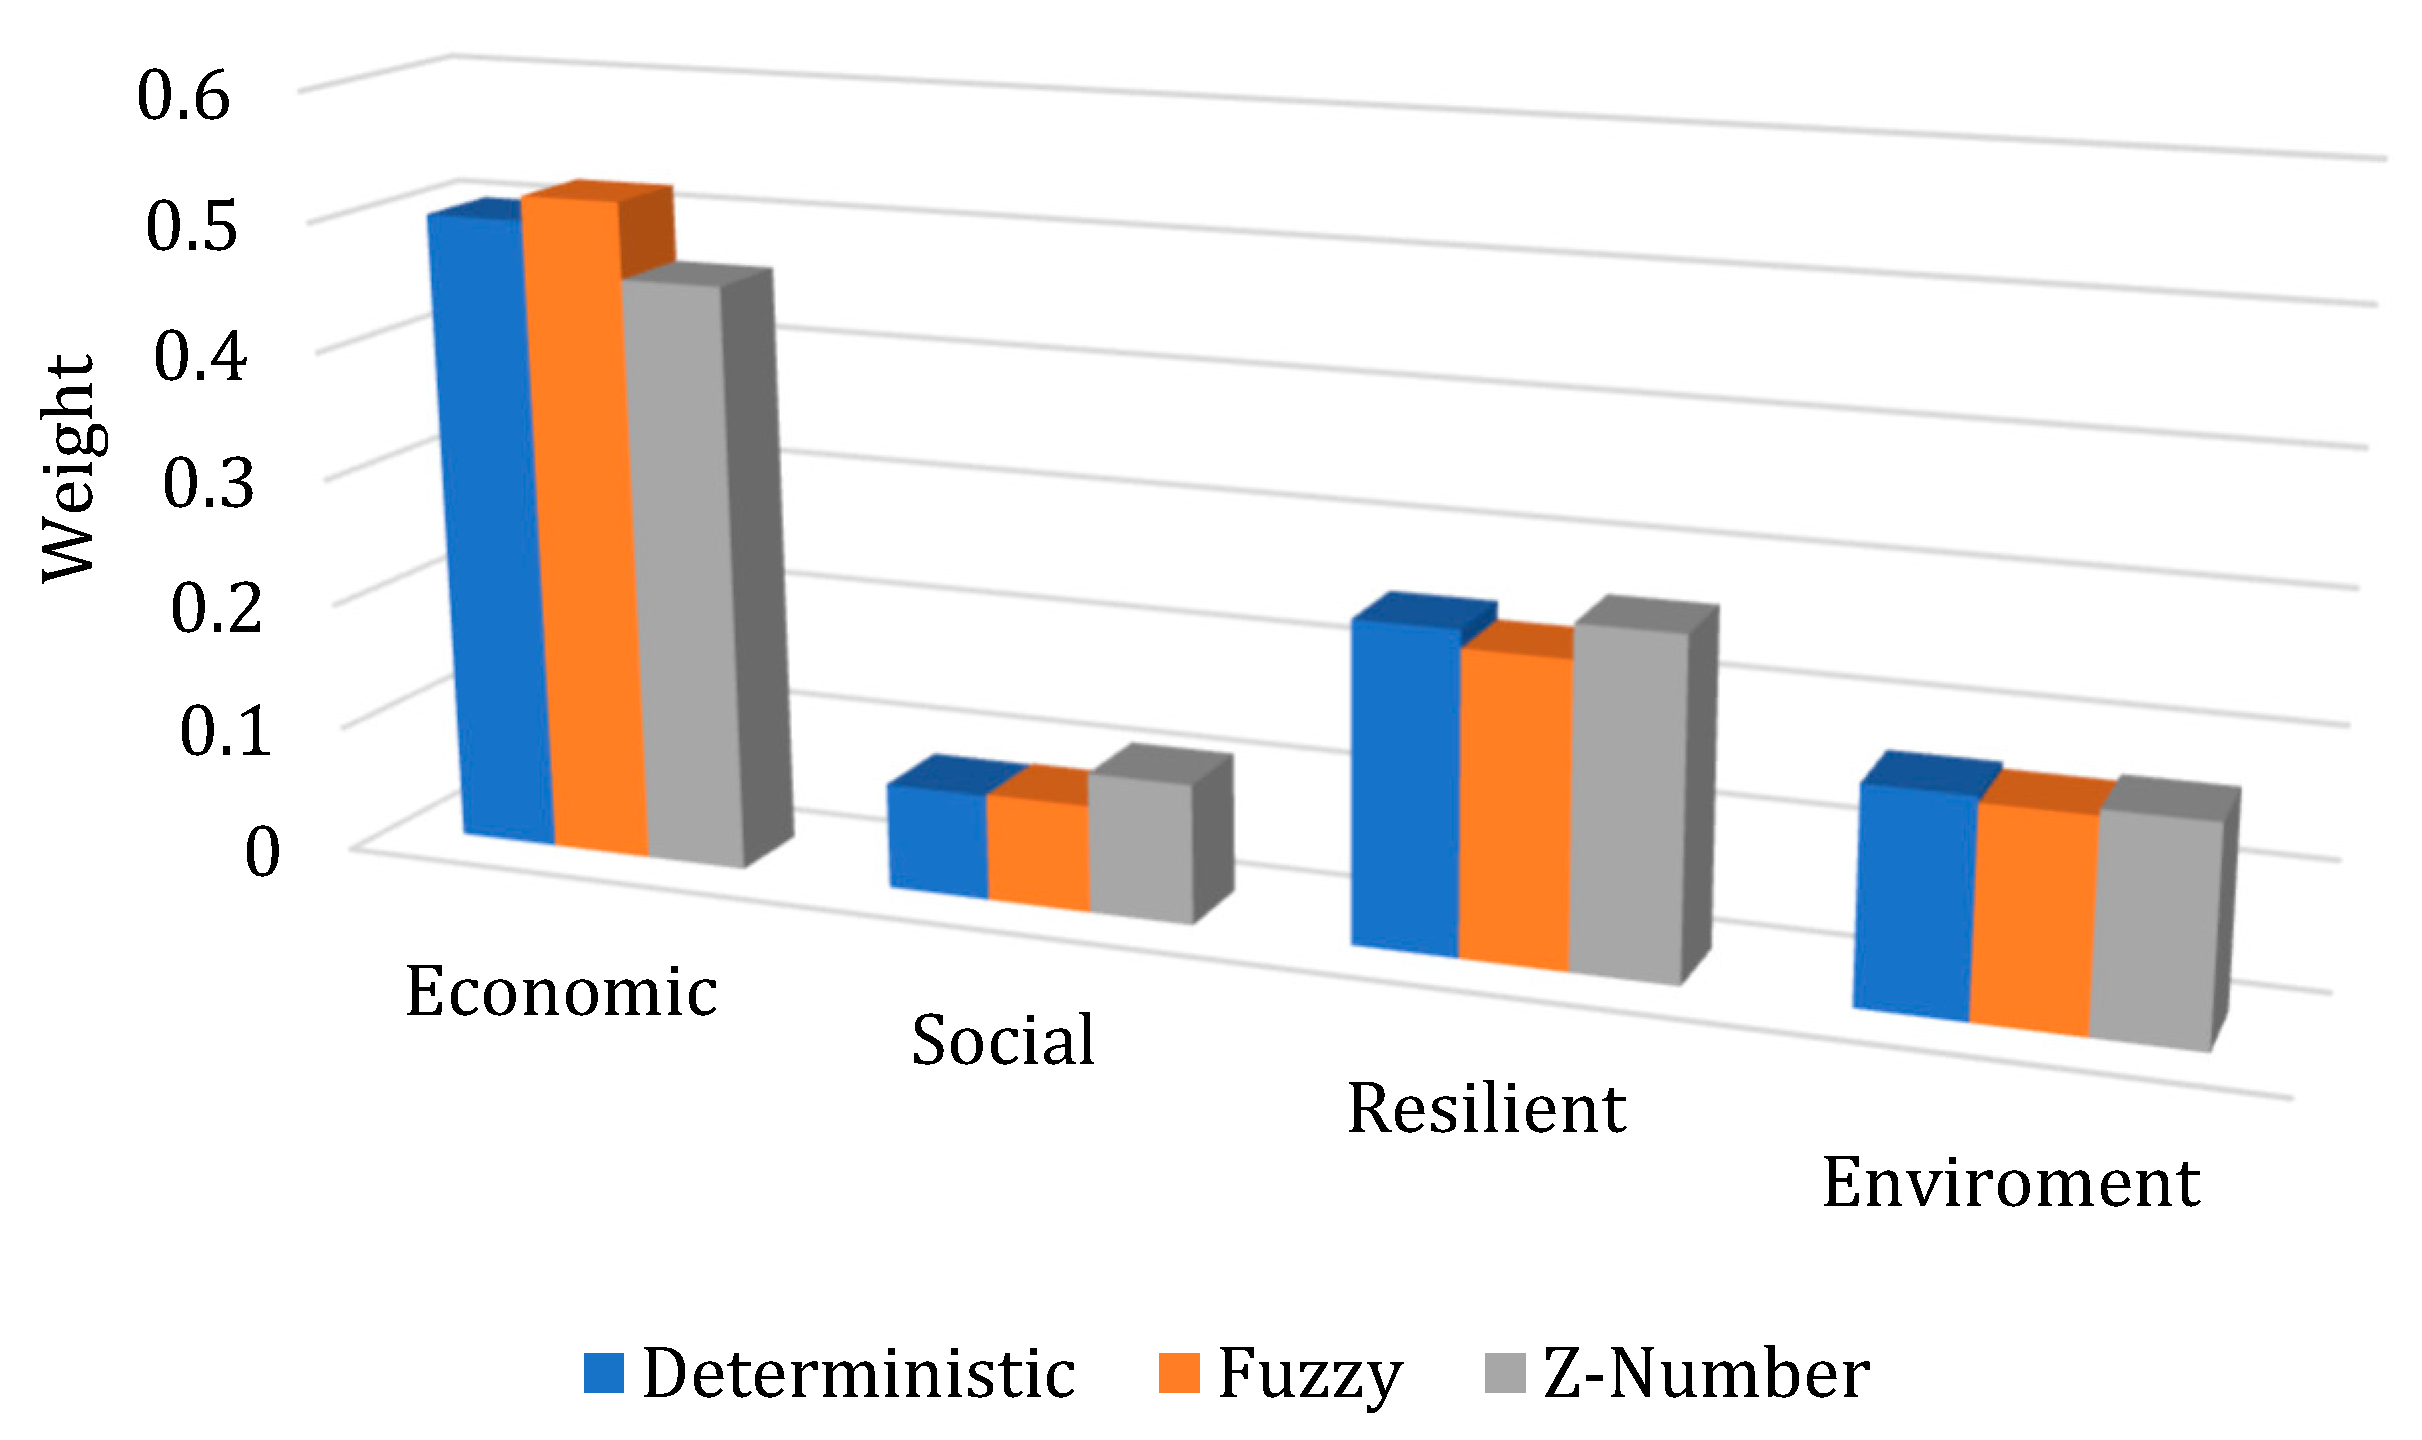
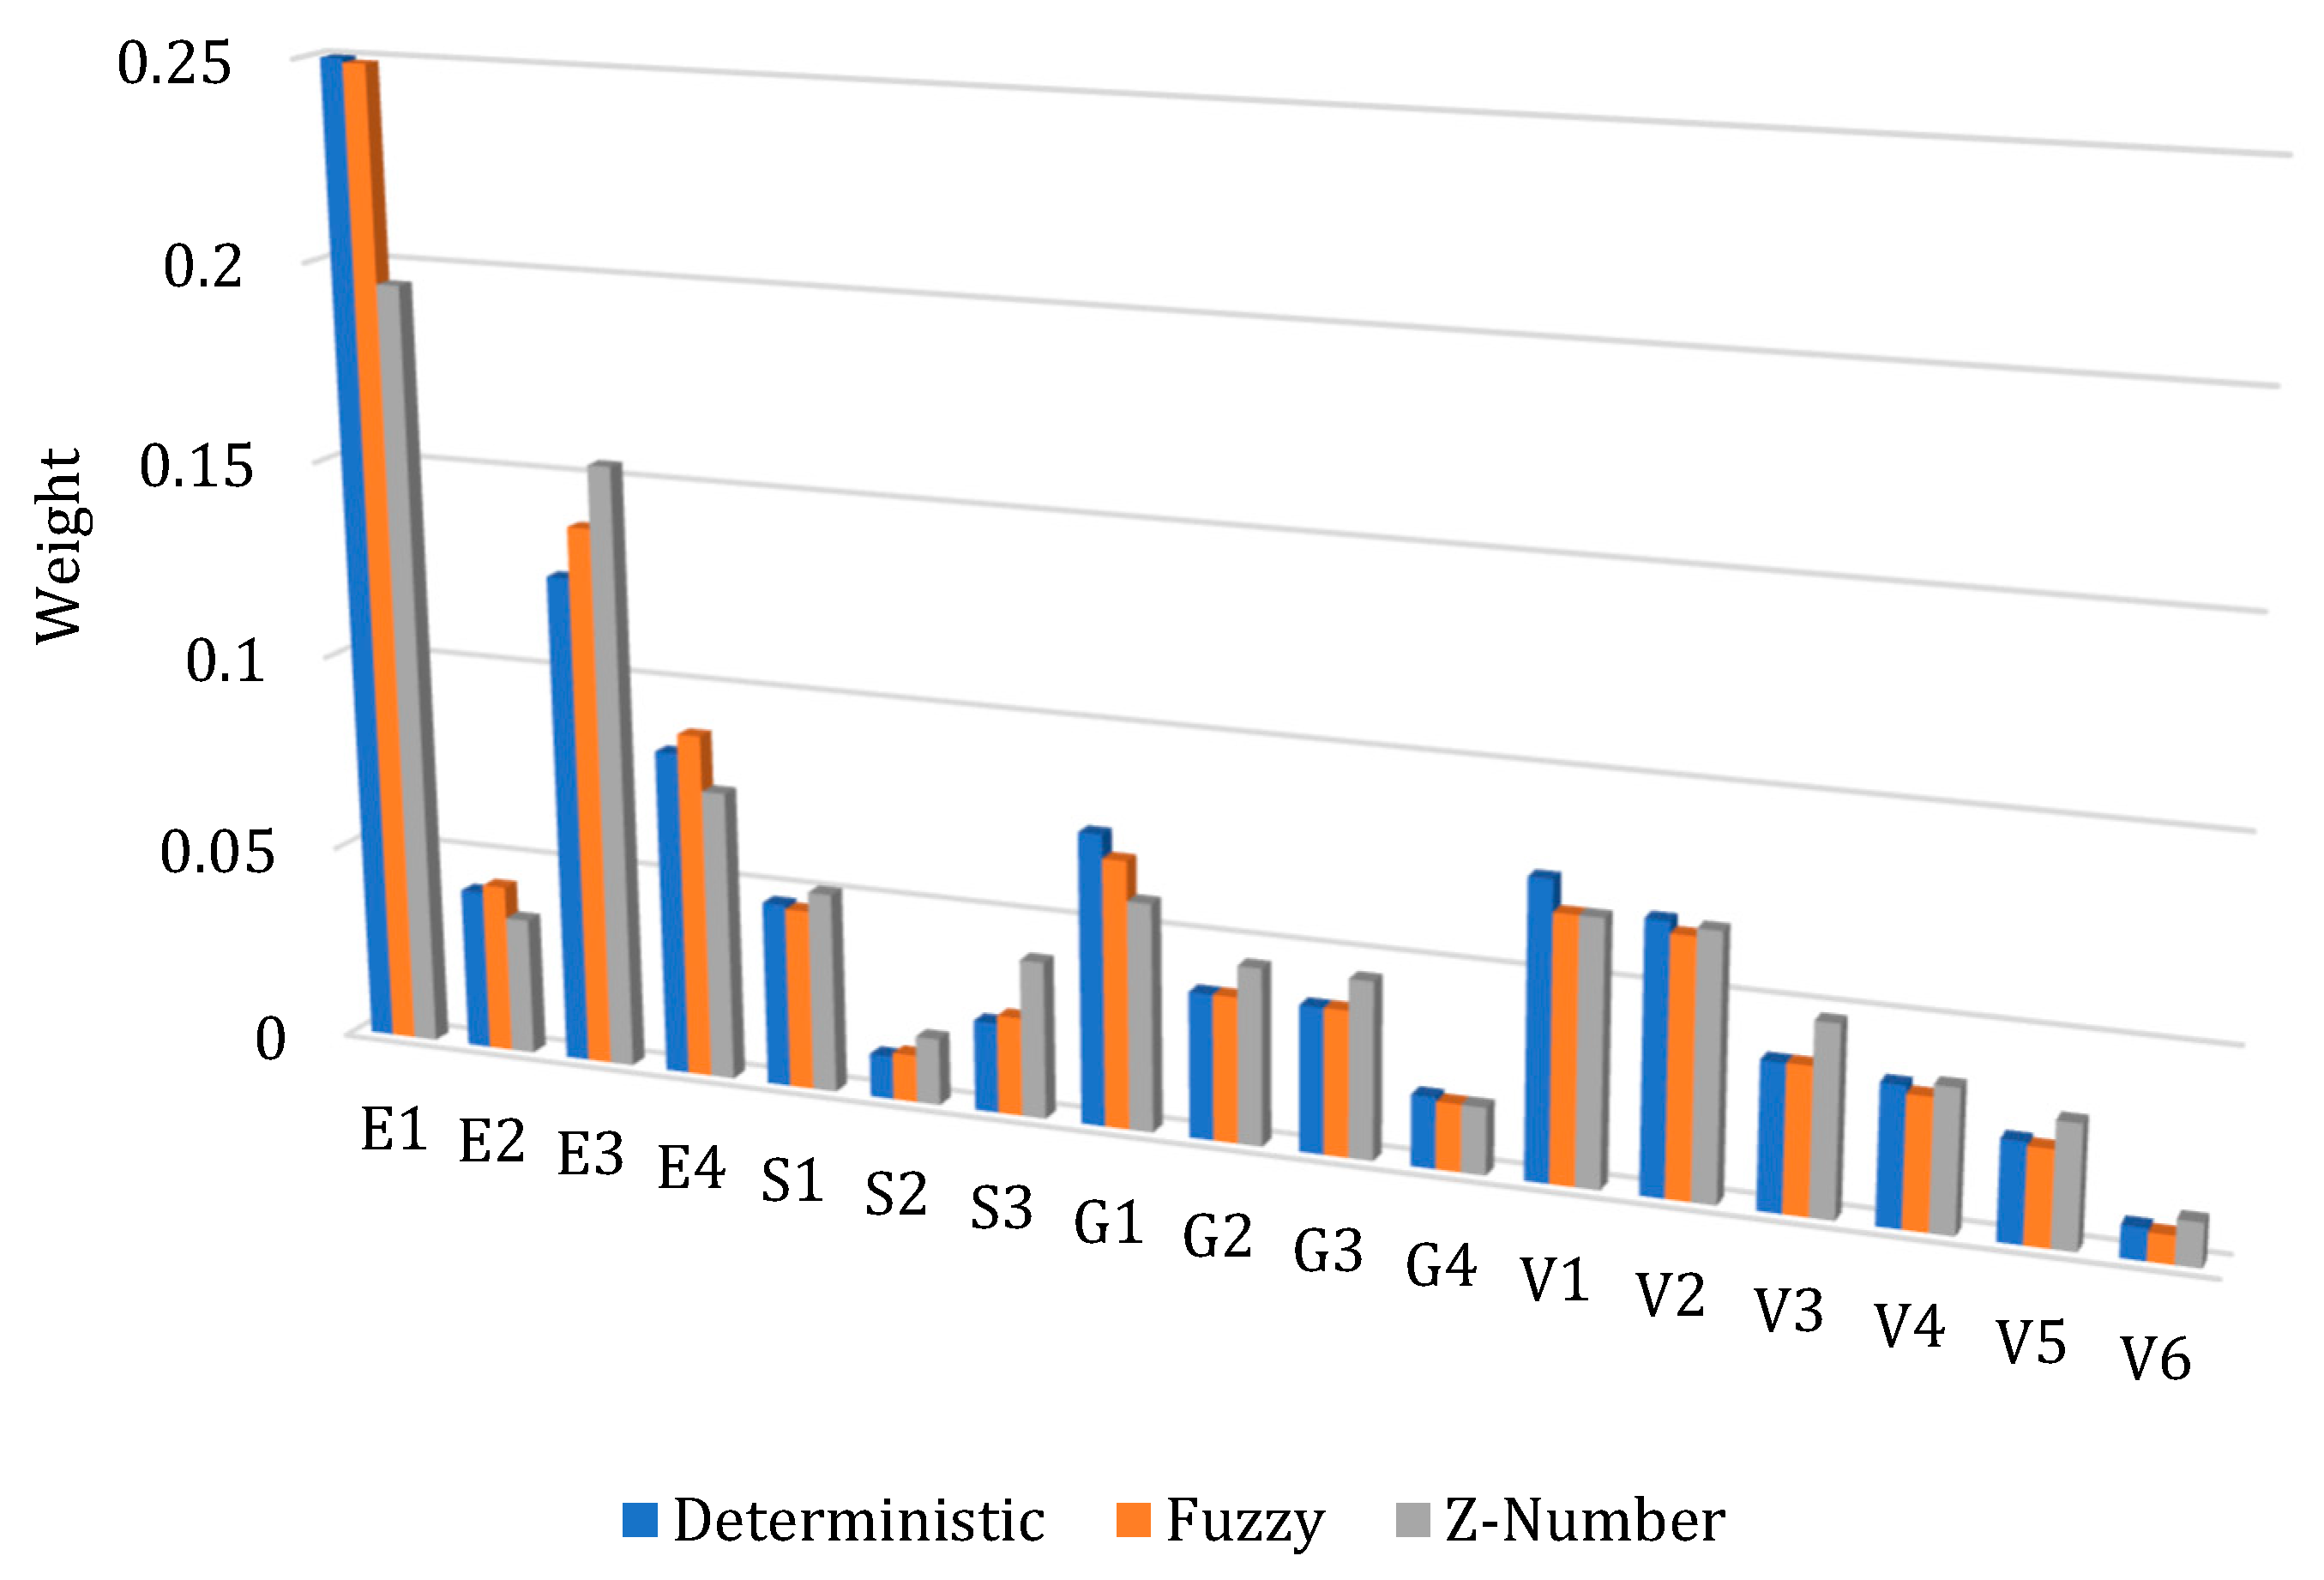
4.2. Results from HBWM Numerical Example in Terms of Certainty, Fuzzy, and Z-Number
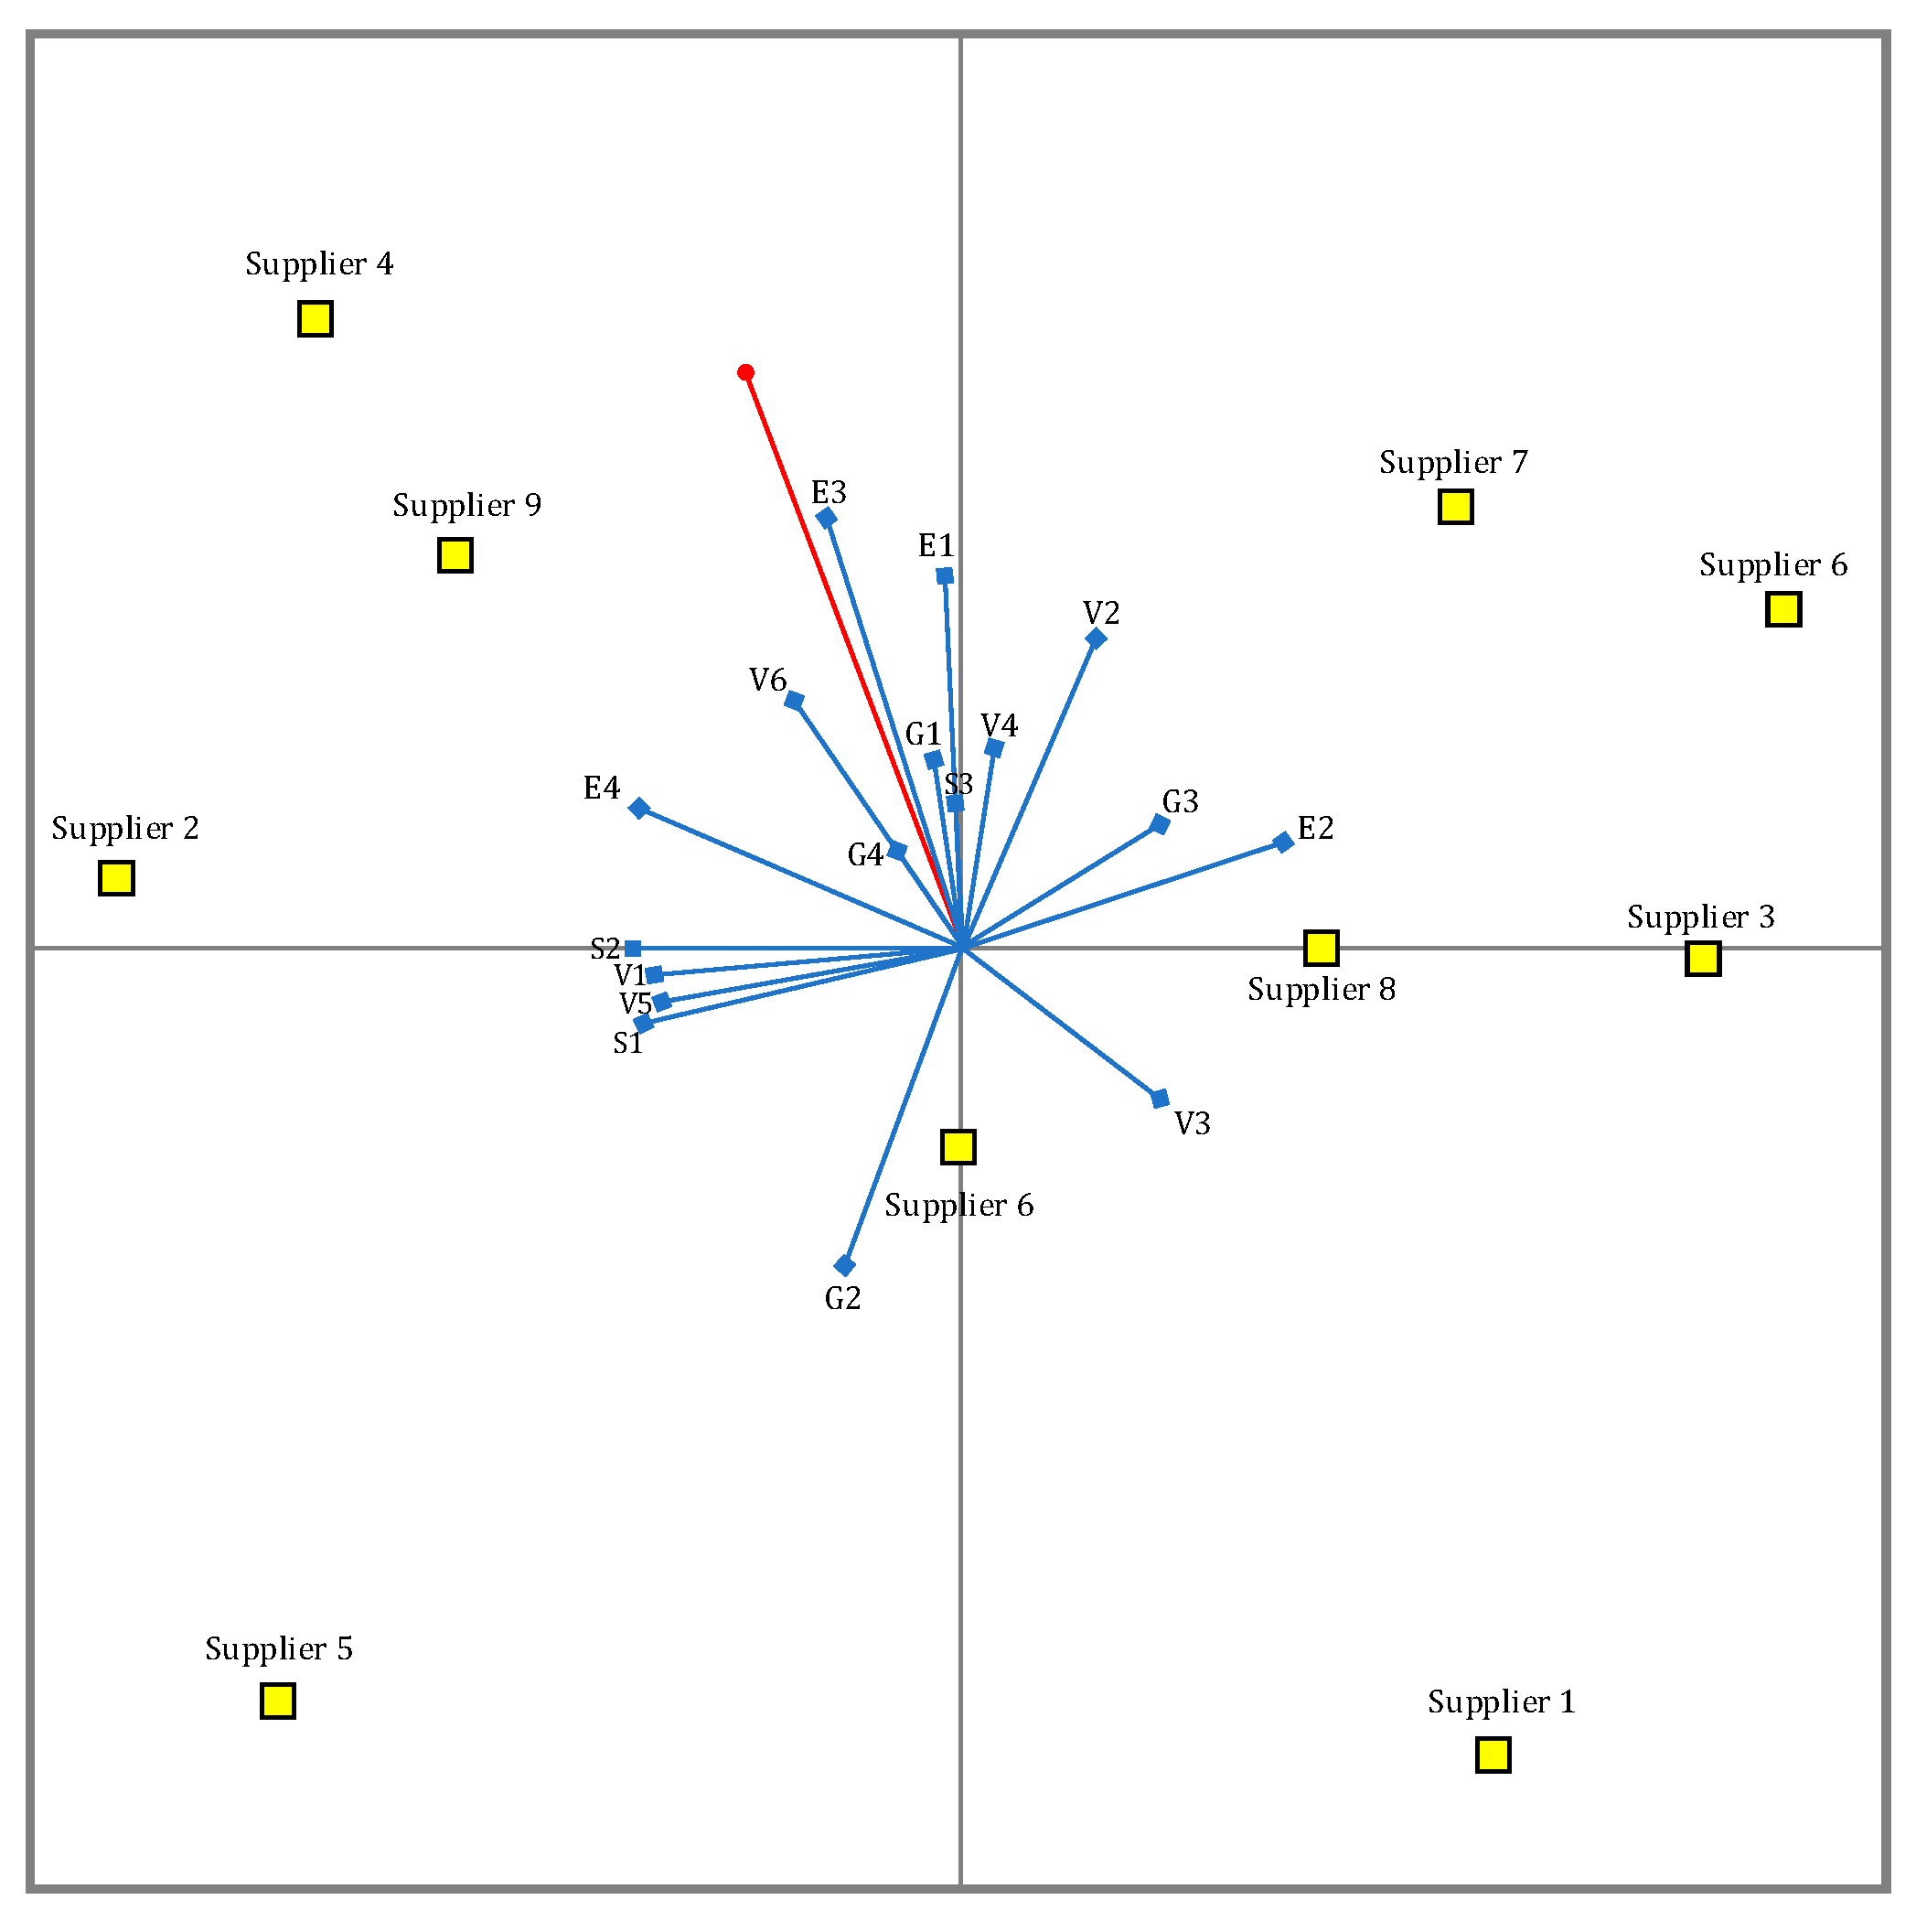
4.3. Results from PROMETHEE Numerical Example in Terms of Certainty, Fuzzy and Z-Number
5. Discussion
- ▪
- Uncertainty and Fuzzy Approaches: This study underscores the profound impact of uncertainties in expert judgments on the conclusions, decisions, and rankings of suppliers. To address this challenge, advocacy for fuzzy approaches is emphasized by providing a method to consider uncertainty in expert opinions. The incorporation of Z-Numbers is suggested, offering a valuable means to account for the reliability and probability of fuzzy numbers. The Z-HBWM-PROMETHEE method emerges as a reliable approach, particularly noted for its efficacy in real-world situations.
- ▪
- Preferential Threshold Parameter: This text highlights the influential role of the preferential threshold parameter in determining supplier rankings. The flexibility to adjust this parameter is acknowledged as a crucial factor that can lead to changes in how suppliers are ranked.
- ▪
- Decision-Making Criteria: This study emphasizes the critical role of selecting relevant criteria in decision making. Notably, the text highlights the observed variations in supplier rankings when sustainability criteria were considered compared to when criteria related to the supplier’s life cycle value were emphasized. This underscores the importance of aligning chosen criteria with the organization’s overall goals and objectives.
- ▪
- Significance of Supplier Life Cycle Value Criteria: The introduction of value indices related to a supplier’s life cycle emerges as a noteworthy contribution. These criteria, introduced as novel elements in the research, underscore the substantial importance companies place on considering the long-term vision and establishing enduring partnerships with their suppliers.
- ▪
- Tax incentives and green economy;
- ▪
- Supplier selection award procedure;
- ▪
- Sustainable development aligned with UN’s sustainable development goals;
- ▪
- Sustainable procurement and purchasing;
- ▪
- Boosting environmental sustainability.
6. Conclusions
Author Contributions
Funding
Institutional Review Board Statement
Informed Consent Statement
Data Availability Statement
Conflicts of Interest
References
- Mendoza, A.; Ventura, J.A. Analytical models for supplier selection and order quantity allocation. Appl. Math. Model. 2012, 36, 3826–3835. [Google Scholar] [CrossRef]
- Govindan, K.; Khodaverdi, R.; Jafarian, A. A fuzzy multi criteria approach for measuring sustainability performance of a supplier based on triple bottom line approach. J. Clean. Prod. 2013, 47, 345–354. [Google Scholar] [CrossRef]
- Seuring, S.; Müller, M. From a literature review to a conceptual framework for sustainable supply chain management. J. Clean. Prod. 2008, 16, 1699–1710. [Google Scholar] [CrossRef]
- Butnariu, A.; Avasilcai, S. The assessment of the companies’ sustainable development performance. Procedia Econ. Financ. 2015, 23, 1233–1238. [Google Scholar] [CrossRef]
- Huang, C.-C.; Chu, P.-Y.; Chiang, Y.-H. A fuzzy AHP application in government-sponsored R&D project selection. Omega 2008, 36, 1038–1052. [Google Scholar]
- Archer, N.; Ghasemzadeh, F. Project Portfolio Selection and Management; Morris, P., Pinto, J.K., Eds.; The Wiley Guide to Project, Program & Portfolio Management; John Wiley & Sons, Inc.: Hoboken, NJ, USA, 2007; pp. 94–112. [Google Scholar]
- Büyüközkan, G.; Çifçi, G. A novel hybrid MCDM approach based on fuzzy DEMATEL, fuzzy ANP and fuzzy TOPSIS to evaluate green suppliers. Expert Syst. Appl. 2012, 39, 3000–3011. [Google Scholar] [CrossRef]
- Prascevic, N.; Prascevic, Z. Application of fuzzy AHP for ranking and selection of alternatives in construction project management. J. Civ. Eng. Manag. 2017, 23, 1123–1135. [Google Scholar] [CrossRef]
- Ho, W.; Xu, X.; Dey, P.K. Multi-criteria decision making approaches for supplier evaluation and selection: A literature review. Eur. J. Oper. Res. 2010, 202, 16–24. [Google Scholar] [CrossRef]
- Kang, B.; Zhang, P.; Gao, Z.; Chhipi-Shrestha, G.; Hewalge, K.; Sadiq, R. Environmental assessment under uncertainty using Dempster–Shafer theory and Z-numbers. J. Ambient. Intell. Humaniz. Comput. 2020, 11, 2041–2060. [Google Scholar] [CrossRef]
- Chen, Z.; Yang, W. A new multiple criteria decision making method based on intuitionistic fuzzy information. Expert Syst. Appl. 2012, 39, 4328–4334. [Google Scholar] [CrossRef]
- Qiao, D.; Shen, K.-W.; Wang, J.-Q.; Wang, T.-L. Multi-criteria PROMETHEE method based on possibility degree with Z-numbers under uncertain linguistic environment. J. Ambient. Intell. Humaniz. Comput. 2020, 11, 2187–2201. [Google Scholar] [CrossRef]
- Hendiani, S.; Bagherpour, M. Development of sustainability index using Z-numbers: A new possibilistic hierarchical model in the context of Z-information. Environ. Dev. Sustain. 2020, 22, 6077–6109. [Google Scholar] [CrossRef]
- Rezaei, J.; Nispeling, T.; Sarkis, J.; Tavasszy, L. A supplier selection life cycle approach integrating traditional and environmental criteria using the best worst method. J. Clean. Prod. 2016, 135, 577–588. [Google Scholar] [CrossRef]
- Cheraghalipour, A.; Paydar, M.M.; Keshteli, M.H. Applying a hybrid BWM-VIKOR approach to supplier selection: A case study in the Iranian agricultural implements industry. Int. J. Appl. Decis. Sci. 2018, 11, 274–301. [Google Scholar] [CrossRef]
- Wu, Q.; Zhou, L.; Chen, Y.; Chen, H. An integrated approach to green supplier selection based on the interval type-2 fuzzy best-worst and extended VIKOR methods. Inf. Sci. 2019, 502, 394–417. [Google Scholar] [CrossRef]
- Ciliberti, F.; Pontrandolfo, P.; Scozzi, B. Logistics Social Responsibility: Standard adoption and practices in Italian companies. Int. J. Prod. Econ. 2008, 113, 88–106. [Google Scholar] [CrossRef]
- Chen, C.-T. Extensions of the TOPSIS for group decision-making under fuzzy environment. Fuzzy Sets Syst. 2000, 114, 1–9. [Google Scholar] [CrossRef]
- Senvar, O.; Tuzkaya, G.; Kahraman, C. Multi Criteria Supplier Selection Using Fuzzy Promethee Method. In Supply Chain Management under Fuzziness; Recent Developments and Techniques; Springer Nature: Berlin/Heidelberg, Germany, 2014; pp. 21–34. [Google Scholar]
- Rezaei, J.; Wang, J.; Tavasszy, L. Linking supplier development to supplier segmentation using Best Worst Method. Expert Syst. Appl. 2015, 42, 9152–9164. [Google Scholar] [CrossRef]
- Liu, H.-C.; Quan, M.-Y.; Li, Z.; Wang, Z.-L. A new integrated MCDM model for sustainable supplier selection under interval-valued intuitionistic uncertain linguistic environment. Inf. Sci. 2019, 486, 254–270. [Google Scholar] [CrossRef]
- Gupta, H.; Barua, M.K. Supplier selection among SMEs on the basis of their green innovation ability using BWM and fuzzy TOPSIS. J. Clean. Prod. 2017, 152, 242–258. [Google Scholar] [CrossRef]
- Zolfani, S.H.; Chatterjee, P.; Yazdani, M. A Structured Framework for Sustainable Supplier Selection Using a Combined BWM-CoCoSo Model. In Proceedings of the International Scientific Conference in Business, Management and Economics Engineering, Vilnius, Lithuania, 9–10 May 2019. [Google Scholar]
- Javad, M.O.M.; Darvishi, M.; Javad, A.O.M. Green supplier selection for the steel industry using BWM and fuzzy TOPSIS: A case study of Khouzestan steel company. Sustain. Futures 2020, 2, 100012. [Google Scholar] [CrossRef]
- Genovese, A.; Koh, S.L.; Bruno, G.; Bruno, P. Green Supplier Selection: A Literature Review and a Critical Perspective. In Proceedings of the 2010 8th International Conference on Supply Chain Management and Information, Cambridge, UK, 25–27 March 2010. [Google Scholar]
- Amindoust, A.; Ahmed, S.; Saghafinia, A.; Bahreininejad, A. Sustainable supplier selection: A ranking model based on fuzzy inference system. Appl. Soft Comput. 2012, 12, 1668–1677. [Google Scholar] [CrossRef]
- Erol, I.; Sencer, S.; Sari, R. A new fuzzy multi-criteria framework for measuring sustainability performance of a supply chain. Ecol. Econ. 2011, 70, 1088–1100. [Google Scholar] [CrossRef]
- Chen, C.-T.; Pai, P.-F.; Hung, W.-Z. An integrated methodology using linguistic PROMETHEE and maximum deviation method for third-party logistics supplier selection. Int. J. Comput. Intell. Syst. 2010, 3, 438–451. [Google Scholar]
- Sari, T.; Timor, M. Integrated supplier selection model using ANP, Taguchi loss function and PROMETHEE methods. J. Appl. Quant. Methods 2016, 11, 19–34. [Google Scholar]
- Agakishiyev, E. Supplier selection problem under Z-information. Procedia Comput. Sci. 2016, 102, 418–425. [Google Scholar] [CrossRef]
- Lo, H.W.; Liou, J.J.; Wang, H.S.; Tsai, Y.S. An integrated model for solving problems in green supplier selection and order allocation. J. Clean. Prod. 2018, 190, 339–352. [Google Scholar] [CrossRef]
- Jabbarova, A.I. Application of Z-number concept to supplier selection problem. Procedia Comput. Sci. 2017, 120, 473–477. [Google Scholar] [CrossRef]
- Kumar, A.; Jain, V.; Kumar, S. A comprehensive environment friendly approach for supplier selection. Omega 2014, 42, 109–123. [Google Scholar] [CrossRef]
- Tian, Z.-P.; Zhang, H.-Y.; Wang, J.-Q.; Wang, T.-L. Green supplier selection using improved TOPSIS and best-worst method under intuitionistic fuzzy environment. Informatica 2018, 29, 773–800. [Google Scholar] [CrossRef]
- Badi, I.; Ballem, M. Supplier selection using the rough BWM-MAIRCA model: A case study in pharmaceutical supplying in Libya. Decis. Mak. Appl. Manag. Eng. 2018, 1, 16–33. [Google Scholar] [CrossRef]
- Aboutorab, H.; Saberi, M.; Asadabadi, M.R.; Hussain, O.; Chang, E. ZBWM: The Z-number extension of Best Worst Method and its application for supplier development. Expert Syst. Appl. 2018, 107, 115–125. [Google Scholar] [CrossRef]
- Wu, Z.; Zhang, S.; Liu, X.; Wu, J. Best-worst multi-attribute decision making method based on new possibility degree with probabilistic linguistic information. IEEE Access 2019, 7, 133900–133913. [Google Scholar] [CrossRef]
- Hoseini, A.R.; Ghannadpour, S.F.; Ghamari, R. Sustainable supplier selection by a new possibilistic hierarchical model in the context of Z-information. J. Ambient. Intell. Humaniz. Comput. 2020, 11, 4827–4853. [Google Scholar] [CrossRef]
- Tavana, M.; Shaabani, A.; Santos-Arteaga, F.J.; Valaei, N. An integrated fuzzy sustainable supplier evaluation and selection framework for green supply chains in reverse logistics. Environ. Sci. Pollut. Res. 2021, 28, 53953–53982. [Google Scholar] [CrossRef] [PubMed]
- Masoomi, B.; Sahebi, I.G.; Fathi, M.; Yıldırım, F.; Ghorbani, S. Strategic supplier selection for renewable energy supply chain under green capabilities (fuzzy BWM-WASPAS-COPRAS approach). Energy Strategy Rev. 2022, 40, 100815. [Google Scholar] [CrossRef]
- Shang, Z.; Yang, X.; Barnes, D.; Wu, C. Supplier selection in sustainable supply chains: Using the integrated BWM, fuzzy Shannon entropy, and fuzzy MULTIMOORA methods. Expert Syst. Appl. 2022, 195, 116567. [Google Scholar] [CrossRef]
- Tong, L.Z.; Wang, J.; Pu, Z. Sustainable supplier selection for SMEs based on an extended PROMETHEE Ⅱ approach. J. Clean. Prod. 2022, 330, 129830. [Google Scholar] [CrossRef]
- Nazari-Shirkouhi, S.; Tavakoli, M.; Govindaln, K.; Mousakhani, S. A hybrid approach using Z-number DEA model and Artificial Neural Network for Resilient supplier Selection. Expert Syst. Appl. 2023, 222, 119746. [Google Scholar] [CrossRef]
- Krishankumar, R.; Ravichandran, K.; Saeid, A.B. A new extension to PROMETHEE under intuitionistic fuzzy environment for solving supplier selection problem with linguistic preferences. Appl. Soft Comput. 2017, 60, 564–576. [Google Scholar]
- Blackhurst, J.; Dunn, K.S.; Craighead, C.W. An empirically derived framework of global supply resiliency. J. Bus. Logist. 2011, 32, 374–391. [Google Scholar] [CrossRef]
- Fernández-Sánchez, G.; Rodríguez-López, F. A methodology to identify sustainability indicators in construction project management—Application to infrastructure projects in Spain. Ecol. Indic. 2010, 10, 1193–1201. [Google Scholar] [CrossRef]
- Organ, A. Bulanık Dematel Yöntemiyle Makine Seçimini Etkileyen Kriterlerin Değerlendirilmesi. ÇÜ Sosyal Bilimler Enstitüsü Dergisi 2013, 22, 157–172. [Google Scholar]
- Dargi, A.; Anjomshoae, A.; Galankashi, M.R.; Memari, A.; Tap, M.B.M. Supplier selection: A fuzzy-ANP approach. Procedia Comput. Sci. 2014, 31, 691–700. [Google Scholar] [CrossRef]
- Safa, M.; Shahi, A.; Haas, C.T.; Hipel, K.W. Supplier selection process in an integrated construction materials management model. Autom. Constr. 2014, 48, 64–73. [Google Scholar] [CrossRef]
- Igoulalene, I.; Benyoucef, L.; Tiwari, M.K. Novel fuzzy hybrid multi-criteria group decision making approaches for the strategic supplier selection problem. Expert Syst. Appl. 2015, 42, 3342–3356. [Google Scholar] [CrossRef]
- Chen, T.-Y. An ELECTRE-based outranking method for multiple criteria group decision making using interval type-2 fuzzy sets. Inf. Sci. 2014, 263, 1–21. [Google Scholar] [CrossRef]
- Scott, J.A.; Ho, W.; Dey, P.K. Strategic sourcing in the UK bioenergy industry. Int. J. Prod. Econ. 2013, 146, 478–490. [Google Scholar] [CrossRef]
- Kannan, D.; De Sousa Jabbour, A.B.L.; Jabbour, C.J.C. Selecting green suppliers based on GSCM practices: Using fuzzy TOPSIS applied to a Brazilian electronics company. Eur. J. Oper. Res. 2014, 233, 432–447. [Google Scholar] [CrossRef]
- Karsak, E.E.; Dursun, M. An integrated supplier selection methodology incorporating QFD and DEA with imprecise data. Expert Syst. Appl. 2014, 41, 6995–7004. [Google Scholar] [CrossRef]
- Kar, A.K. Revisiting the supplier selection problem: An integrated approach for group decision support. Expert Syst. Appl. 2014, 41, 2762–2771. [Google Scholar] [CrossRef]
- Lee, J.; Cho, H.; Kim, Y.S. Assessing business impacts of agility criterion and order allocation strategy in multi-criteria supplier selection. Expert Syst. Appl. 2015, 42, 1136–1148. [Google Scholar] [CrossRef]
- Lintukangas, K.; Hallikas, J.; Kähkönen, A. The role of green supply management in the development of sustainable supply chain. Corp. Soc. Responsib. Environ. Manag. 2015, 22, 321–333. [Google Scholar] [CrossRef]
- Jia, P.; Govindan, K.; Choi, T.-M.; Rajendran, S. Supplier selection problems in fashion business operations with sustainability considerations. Sustainability 2015, 7, 1603–1619. [Google Scholar] [CrossRef]
- Dolgui, A.; Sasiadek, J.; Zaremba, M.; Gold, S.; Awasthi, A. 15th IFAC Symposium on Information Control Problems in manufacturing sustainable global supplier selection extended towards sustainability risks from (1 + n) the tier suppliers using a fuzzy AHP based approach. IFAC-Paper 2015, 48, 966–971. [Google Scholar]
- Gong, M.; Simpson, A.; Koh, L.; Tan, K.H. Inside out: The interrelationships of sustainable performance metrics and its effect on business decision making: Theory and practice. Resour. Conserv. Recycl. 2018, 128, 155–166. [Google Scholar] [CrossRef]
- Bai, C.; Sarkis, J. Integrating sustainability into supplier selection with grey system and rough set methodologies. Int. J. Prod. Econ. 2010, 124, 252–264. [Google Scholar] [CrossRef]
- Azadnia, A.H.; Saman, M.Z.M.; Wong, K.Y.; Ghadimi, P.; Zakuan, N. Sustainable supplier selection based on self-organizing map neural network and multi criteria decision making approaches. Procedia-Soc. Behav. Sci. 2012, 65, 879–884. [Google Scholar] [CrossRef]
- Shi, P.; Yan, B.; Shi, S.; Ke, C. A decision support system to select suppliers for a sustainable supply chain based on a systematic DEA approach. Inf. Technol. Manag. 2015, 16, 39–49. [Google Scholar] [CrossRef]
- Güçdemir, H.; Selim, H. Integrating multi-criteria decision making and clustering for business customer segmentation. Ind. Manag. Data Syst. 2015, 115, 1022–1040. [Google Scholar] [CrossRef]
- Leonidou, L.C.; Palihawadana, D.; Theodosiou, M. An integrated model of the behavioural dimensions of industrial buyer-seller relationships. Eur. J. Mark. 2006, 40, 145–173. [Google Scholar] [CrossRef]
- Lau, H.; Nakandala, D.; Samaranayake, P.; Shum, P. A hybrid multi-criteria decision model for supporting customer-focused profitability analysis. Ind. Manag. Data Syst. 2016, 116, 1105–1130. [Google Scholar] [CrossRef]
- Zadeh, L.A. A note on Z-numbers. Inf. Sci. 2011, 181, 2923–2932. [Google Scholar] [CrossRef]
- Kang, B.; Deng, Y.; Sadiq, R. Total utility of Z-number. Appl. Intell. 2018, 48, 703–729. [Google Scholar] [CrossRef]
- Cheng, R.; Kang, B.; Zhang, J. A method of converting Z-number to classical fuzzy number. J. Inf. Comput. Sci. 2012, 9, 703–709. [Google Scholar]
- Rezaei, J. Best-worst multi-criteria decision-making method. Omega 2015, 53, 49–57. [Google Scholar] [CrossRef]
- Guo, S.; Zhao, H. Fuzzy best-worst multi-criteria decision-making method and its applications. Knowl. -Based Syst. 2017, 121, 23–31. [Google Scholar] [CrossRef]
- Sirisawat, P.; Kiatcharoenpol, T. Fuzzy AHP-TOPSIS approaches to prioritizing solutions for reverse logistics barriers. Comput. Ind. Eng. 2018, 117, 303–318. [Google Scholar] [CrossRef]
- Jiménez, M.; Arenas, M.; Bilbao, A.; Rodriguez, M.V. Linear programming with fuzzy parameters: An interactive method resolution. Eur. J. Oper. Res. 2007, 177, 1599–1609. [Google Scholar] [CrossRef]
- Han, H.; Trimi, S. A fuzzy TOPSIS method for performance evaluation of reverse logistics in social commerce platforms. Expert Syst. Appl. 2018, 103, 133–145. [Google Scholar] [CrossRef]
| Reference | Selection Criteria | Uncertainty | Weighting Approach | Ranking Approach | ||||||||||||||||||||||
|---|---|---|---|---|---|---|---|---|---|---|---|---|---|---|---|---|---|---|---|---|---|---|---|---|---|---|
| Economic | Social | Environment | Supplier Life Value | Triangle Fuzzy | Intuitionistic Fuzzy Set | Fuzzy Type 2 | ROUGH Number | Z-Number | Maximum Deviation Method | Shannon Entropy | ANP | Best Worst Method | Hierachial Best Worst Method | CoCoSo | COPRAS | WASPAS | MULTIMOORA | AQM | MAIRCA | VIKOR | TOPSIS | hierarchical Model: Z-Number | DEA | PROMETHEE | PROMETHEE-GAIA | |
| [28] | √ | √ | √ | √ | ||||||||||||||||||||||
| [19] | √ | √ | √ | √ | ||||||||||||||||||||||
| [20] | √ | √ | ||||||||||||||||||||||||
| [14] | √ | |||||||||||||||||||||||||
| [29] | √ | √ | √ | |||||||||||||||||||||||
| [30] | √ | |||||||||||||||||||||||||
| [21] | √ | √ | √ | √ | ||||||||||||||||||||||
| [32] | √ | √ | √ | |||||||||||||||||||||||
| [22] | √ | √ | √ | √ | ||||||||||||||||||||||
| [44] | √ | √ | ||||||||||||||||||||||||
| [15] | √ | √ | √ | |||||||||||||||||||||||
| [34] | √ | √ | √ | √ | √ | |||||||||||||||||||||
| [35] | √ | √ | √ | √ | ||||||||||||||||||||||
| [45] | √ | √ | √ | √ | ||||||||||||||||||||||
| [21] | √ | √ | √ | √ | ||||||||||||||||||||||
| [23] | √ | √ | √ | √ | √ | |||||||||||||||||||||
| [16] | √ | √ | √ | √ | ||||||||||||||||||||||
| [24] | √ | √ | √ | √ | √ | √ | ||||||||||||||||||||
| [38] | √ | √ | √ | √ | √ | |||||||||||||||||||||
| [39] | √ | √ | √ | √ | √ | √ | ||||||||||||||||||||
| [40] | √ | √ | √ | √ | √ | |||||||||||||||||||||
| [41] | √ | √ | √ | √ | √ | √ | √ | |||||||||||||||||||
| [42] | √ | √ | ||||||||||||||||||||||||
| [43] | √ | √ | √ | |||||||||||||||||||||||
| paper | √ | √ | √ | √ | √ | √ | √ | |||||||||||||||||||
| Time | Reference | Definition | Index Name |
|---|---|---|---|
| Retrospective | [64] | A loyal supplier pertains to those who have consistently furnished raw materials to the organization over an extended period, demonstrating a willingness to accommodate any sacrifices, costs, or limitations necessitated by the partnership for the sake of maintaining a long-term affiliation with the organization. Additionally, they refrain from favoring competitors of the organization when fulfilling supply commitments. | The level of supplier loyalty |
| [65] | Employee satisfaction is a favorable internal sentiment that reflects the degree to which an organization’s anticipations regarding performance, financial aspects, behavioral conduct, and other relevant factors in the employment partnership have been fulfilled. This assessment is based on the experience gained from the supplier. | Satisfaction of the supplier | |
| [66] | The level of discord, divergence in ideas, misalignment of values, and objectives in the professional association between the supplier and buyer is referred to as “relationship conflict”. When there is a discrepancy in goals and values, it can lead one party to obstruct the other’s access to resources or impede a crucial activity for the sake of its own advancement. | Disagreement on goals and values | |
| [64] | The supplier’s collaboration with the organization in adhering to the workflow results in expedited operations. Consequently, if the supplier is unwilling to cooperate with the organization, it can lead to delays in addressing tasks and related issues. | The willingness of the supplier to work with the organization | |
| [66] | The frequency of disputes with the supplier and the tensions arising from factors like having unrealistic expectations can be quantified as “conflict incidents”. As the number of such incidents escalates between the supplier and the buyer, it intensifies the overall stress levels within their professional relationship. | Number of times arguing with the supplier | |
| futuristic | [64] | This indicates a prospect of sustained collaboration with the supplier in the foreseeable future. Anticipations for enduring cooperation with the supplier can be rooted in the supplier’s demonstrated loyalty through numerous past collaborations, particularly the most recent one. | The potential for long-term communication in the future |
| [64] | The anticipated profit margin from the acquisition (taking into account the purchase price, potential supplier-provided discounts, etc.) and the volume of future raw material purchases from the supplier are crucial factors to consider. | Expected profitability of the supplier’s lifetime in the future | |
| [64] | The proportionate expenses projected to be borne by the supplier in the future are a significant consideration. These costs encompass various elements such as expenses related to faulty items and wastage, shipping costs contingent on the supplier’s location, and costs stemming from delayed supply, including potential losses in opportunities, diminished credibility with the organization’s customers, and decreased organizational efficiency. Additionally, there are costs linked to the process of identifying and onboarding new suppliers if the current supplier lacks the potential for a sustained long-term relationship in the future. | Expected cost of the supplier’s lifetime |
| Linguistic Variable | Corresponding Probabilities | ||
|---|---|---|---|
| Unlikely | (0.1, 0.2, 0.3) | 0.2 | 0.45 |
| Fairly Impossible | (0.3, 0.4, 0.5) | 0.4 | 0.63 |
| Weak | (0.4, 0.5, 0.6) | 0.5 | 0.71 |
| Maybe | (0.5, 0.6, 0.7) | 0.6 | 0.77 |
| Likely | (0.7, 0.8, 0.9) | 0.8 | 0.89 |
| Most Likely | (0.8, 0.9, 1) | 0.9 | 0.95 |
| Certainly | (1, 1, 1) | 1 | 1 |
| Linguistic | Acronym | Fuzzy Number | Scale of Fuzzy Number |
|---|---|---|---|
| Perfect | (P) | (8, 9, 10) | |
| Absolute | (A) | (7, 8, 9) | |
| Very Good | (VG) | (6, 7, 8) | |
| Fairly Good | (FG) | (5, 6, 7) | |
| Good | (G) | (4, 5, 6) | |
| Preferable | (P) | (3, 4, 5) | |
| Not Bad | (NB) | (2, 3, 4) | |
| Weak Advantage | (WA) | (1, 2, 3) | |
| Equal | (E) | (1, 1, 1) |
| Linguistic Phrase | Acronym | Certainty | Fuzzy Number | Z-Number |
|---|---|---|---|---|
| Perfect-Certainly | (PE-C) | (8, 9, 10) | (8.000, 9.000, 10.000) | |
| Absolute-Certainly | (A-C) | (7, 8, 9) | (7.000, 8.000, 9.000) | |
| Very Good-Certainly | (VG-C) | (6, 7, 8) | (6.000, 7.000, 8.000) | |
| Fairly Good-Certainly | (FG-C) | (5, 6, 7) | (5.000, 6.000, 7.000) | |
| Good-Certainly | (G-C) | (4, 5, 6) | (4.000, 5.000, 6.000) | |
| Preferable-Certainly | (P-C) | (3, 4, 5) | (3.000, 4.000, 5.000) | |
| Not Bad-Certainly | (NB-C) | (2, 3, 4) | (2.000, 3.000, 4.000) | |
| Weak Advantage-Certainly | (WA-C) | (1, 2, 3) | (1.000, 2.000, 3.000) | |
| Equal-Certainly | (E-C) | (1, 1, 1) | (1.000, 1.000, 1.000) | |
| Perfect-Most Likely | (PE-ML) | (8, 9, 10) | (7.584, 8.532, 9.480) | |
| Absolute-Most Likely | (A-ML) | (7, 8, 9) | (6.636, 7.584, 8.532) | |
| Very Good-Most Likely | (VG-ML) | (6, 7, 8) | (5.688, 6.636, 7.584) | |
| Fairly Good-Most Likely | (FG-ML) | (5, 6, 7) | (4.740, 5.688, 6.636) | |
| Good-Most Likely | (G-ML) | (4, 5, 6) | (3.792, 4.740, 5.688) | |
| Preferable-Most Likely | (P-ML) | (3, 4, 5) | (2.844, 3.792, 4.740) | |
| Not Bad-Most Likely | (NB-ML) | (2, 3, 4) | (1.896, 2.844, 3.792) | |
| Weak Advantage-Most Likely | (WA-ML) | (1, 2, 3) | (0.948, 1.896, 2.844) | |
| Equal-Most Likely | (E-ML) | (1, 1, 1) | (0.948, 0.948, 0.948) | |
| Perfect-Likely | (PE-L) | (8, 9, 10) | (7.152, 8.046, 8.940) | |
| Absolute-Likely | (A-L) | (7, 8, 9) | (6.258, 7.152, 8.046) | |
| Very Good-Likely | (VG-L) | (6, 7, 8) | (5.364, 6.258, 7.152) | |
| Fairly Good-Likely | (FG-L) | (5, 6, 7) | (4.470, 5.364, 6.258) | |
| Good-Likely | (G-L) | (4, 5, 6) | (3.576, 4.470, 5.364) | |
| Preferable-Likely | (P-L) | (3, 4, 5) | (2.682, 3.576, 4.470) | |
| Not Bad-Likely | (NB-L) | (2, 3, 4) | (1.788, 2.682, 3.576) | |
| Weak Advantage-Likely | (WA-L) | (1, 2, 3) | (0.894, 1.788, 2.682) | |
| Equal-Likely | (E-L) | (1, 1, 1) | (0.894, 0.894, 0.894) | |
| Perfect-Maybe | (PE-M) | (8, 9, 10) | (6.192, 6.966, 7.740) | |
| Absolute-Maybe | (A-M) | (7, 8, 9) | (5.418, 6.192, 6.966) | |
| Very Good-Maybe | (VG-M) | (6, 7, 8) | (4.644, 5.418, 6.192) | |
| Fairly Good-Maybe | (FG-M) | (5, 6, 7) | (3.870, 4.644, 5.418) | |
| Good-Maybe | (G-M) | (4, 5, 6) | (3.096, 3.870, 4.644) | |
| Preferable-Maybe | (P-M) | (3, 4, 5) | (2.322, 3.096, 3.870) | |
| Not Bad-Maybe | (NB-M) | (2, 3, 4) | (1.548, 2.322, 3.096) | |
| Weak Advantage-Maybe | (WA-M) | (1, 2, 3) | (0.774, 1.548, 2.322) | |
| Equal-Maybe | (E-M) | (1, 1, 1) | (0.774, 0.774, 0.774) | |
| Perfect-Weak | (PE-W) | (8, 9, 10) | (5.656, 6.363, 7.070) | |
| Absolute-Weak | (A-W) | (7, 8, 9) | (4.949, 5.656, 6.363) | |
| Very Good-Weak | (VG-W) | (6, 7, 8) | (4.242, 4.949, 5.656) | |
| Fairly Good-Weak | (FG-W) | (5, 6, 7) | (3.535, 4.242, 4.949) | |
| Good-Weak | (G-W) | (4, 5, 6) | (2.828, 3.535, 4.242) | |
| Preferable-Weak | (P-W) | (3, 4, 5) | (2.121, 2.828, 3.535) | |
| Not Bad-Weak | (NB-W) | (2, 3, 4) | (1.414, 2.121, 2.828) | |
| Weak Advantage-Weak | (WA-W) | (1, 2, 3) | (0.707, 1.414, 2.121) | |
| Equal-Weak | (E-W) | (1, 1, 1) | (0.707, 0.707, 0.707) | |
| Perfect-Fairly Impossible | (PE-FI) | (8, 9, 10) | (5.056, 5.688, 6.320) | |
| Absolute-Fairly Impossible | (A-FI) | (7, 8, 9) | (4.424, 5.056, 5.688) | |
| Very Good-Fairly Impossible | (VG-FI) | (6, 7, 8) | (3.792, 4.424, 5.056) | |
| Fairly Good-Fairly Impossible | (FG-FI) | (5, 6, 7) | (3.160, 3.792, 4.424) | |
| Good-Fairly Impossible | (G-FI) | (4, 5, 6) | (2.528, 3.160, 3.792) | |
| Preferable-Fairly Impossible | (P-FI) | (3, 4, 5) | (1.896, 2.528, 3.160) | |
| Not Bad-Fairly Impossible | (NB-FI) | (2, 3, 4) | (1.264, 1.896, 2.528) | |
| Weak Advantage-Fairly Impossible | (WA-FI) | (1, 2, 3) | (0.632, 1.264, 1.896) | |
| Equal-Fairly Impossible | (E- FI) | (1, 1, 1) | (0.632, 0.632, 0.632) | |
| Perfect-Unlikely | (PE-U) | (8, 9, 10) | (3.576, 4.023, 4.470) | |
| Absolute-Unlikely | (A-U) | (7, 8, 9) | (3.129, 3.576, 4.023) | |
| Very Good-Unlikely | (VG-U) | (6, 7, 8) | (2.682, 3.129, 3.576) | |
| Fairly Good-Unlikely | (FG-U) | (5, 6, 7) | (2.235, 2.682, 3.129) | |
| Good-Unlikely | (G-U) | (4, 5, 6) | (1.788, 2.235, 2.682) | |
| Preferable-Unlikely | (P-U) | (3, 4, 5) | (1.341, 1.788,2.235) | |
| Not Bad-Unlikely | (NB-U) | (2, 3, 4) | (0.894, 1.341, 1.788) | |
| Weak Advantage-Unlikely | (WA-U) | (1, 2, 3) | (0.447, 0.894, 1.341) | |
| Equal-Unlikely | (E-U) | (1, 1, 1) | (0.447, 0.447, 0.447) |
| Type and Parameters | Function | The Shape | Description |
|---|---|---|---|
| PROMOTHEE Ι (Normal criteria) Parameter: ---- |  | If the values of the two options are equal, there will be no difference between them. | |
| PROMETHE II (U-shaped criterion) Parameter: | 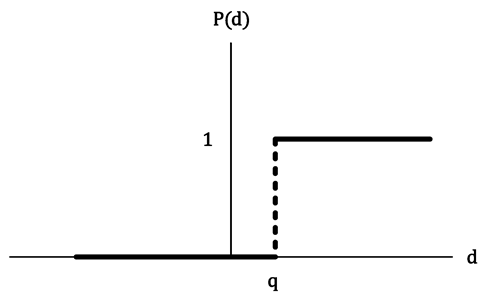 | If the values of the two options are in the range d ≤ q, there will be no difference between them. | |
| PROMETHEE III (V-shaped criterion) Parameter: |  | Priority by changing values in the range changes linearly. If the difference is greater than p, an alternative option is considered. | |
| PROMETHEE IV (Surface criteria) Parameters: | 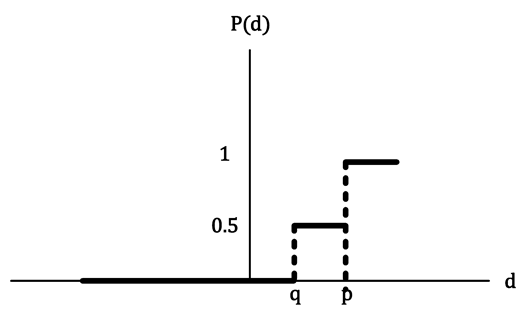 | If the values of the two options are in the range d ≤ q, there will be no difference between them. If the scores of the two options are in the range q < d ≤ p, there will be a relative advantage between them. If the scores of the two options are in the range d > p, there will be an advantage between them. | |
| PROMETHEE V (Linear criteria) Parameters: | 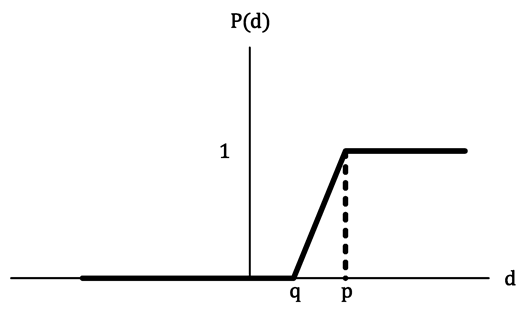 | If the values of the two options are in the range d ≤ q, there will be no difference between them. If the values of the two options are in the range q < d ≤ p, there will be a linear advantage between them. If the scores of the two options are in the range d > p, there will be an advantage between them. | |
| PROMETHEE VI (Gaussian criterion) parameter | 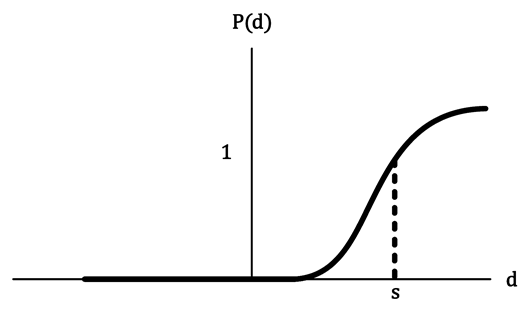 | Priority based on the equation increases with the difference between the options. |
| Linguistic Phrase | Acronym | Fuzzy Number | Scale of Fuzzy Number |
|---|---|---|---|
| Very High | (VH) | (7, 9, 9) | |
| High | (H) | (5, 7, 9) | |
| Medium | (M) | (3, 5, 7) | |
| Low | (L) | (1, 3, 5) | |
| Very Low | (VL) | (1, 1, 3) |
| Linguistic Phrase | Acronym | Deterministic | Fuzzy Number | Z-Number |
|---|---|---|---|---|
| Very High-Certainly | (VH-C) | (7, 9, 9) | (7.000, 9.000, 9.000) | |
| High-Certainly | (H-C) | (5, 7, 9) | (5.000, 7.000, 9.000) | |
| Medium-Certainly | (M-C) | (3, 5, 7) | (3.000, 5.000, 7.000) | |
| Low-Certainly | (L-C) | (1, 3, 5) | (1.000, 3.000, 5.000) | |
| Very Low-Certainly | (VL-C) | (1, 1, 3) | (1.000, 1.000, 3.000) | |
| Very High-Most Likely | (VH-ML) | (7, 9, 9) | (6.636, 8.532, 8.532) | |
| High-Most Likely | (H-ML) | (5, 7, 9) | (4.740, 6.636, 8.532) | |
| Medium-Most Likely | (M-ML) | (3, 5, 7) | (2.844, 4.740, 6.636) | |
| Low-Most Likely | (L-ML) | (1, 3, 5) | (0.948, 2.844, 4.740) | |
| Very Low-Most Likely | (VL-ML) | (1, 1, 3) | (0.948, 0.948, 2.844) | |
| Very High-Likely | (VH-L) | (7, 9, 9) | (6.258, 8.046, 8.046) | |
| High-Likely | (H-L) | (5, 7, 9) | (4.470, 6.258, 8.046) | |
| Medium-Likely | (M-L) | (3, 5, 7) | (2.682, 4.470, 6.258) | |
| Low-Likely | (L-L) | (1, 3, 5) | (0.894, 2.682, 4.470) | |
| Very Low-Likely | (VL-L) | (1, 1, 3) | (0.894, 0.894, 2.682) | |
| Very High-Maybe | (VH-M) | (7, 9, 9) | (5.418, 6.966, 6.966) | |
| High-Maybe | (H-M) | (5, 7, 9) | (3.870, 5.418, 6.966) | |
| Medium-Maybe | (M-M) | (3, 5, 7) | (2.322, 3.870, 5.418) | |
| Low-Maybe | (L-M) | (1, 3, 5) | (0.774, 2.322, 3.870) | |
| Very Low-Maybe | (VL-M) | (1, 1, 3) | (0.774, 0.774, 2.322) | |
| Very High-Weak | (VH-W) | (7, 9, 9) | (4.949, 6.363, 6.363) | |
| High-Weak | (H-W) | (5, 7, 9) | (3.535, 4.949, 6.363) | |
| Medium-Weak | (M-W) | (3, 5, 7) | (2.121, 3.535, 4.949) | |
| Low-Weak | (L-W) | (1, 3, 5) | (0.707, 2.121, 3.535) | |
| Very Low-Weak | (VL-W) | (1, 1, 3) | (0.707, 0.707, 2.121) | |
| Very High-Fairly Impossible | (VH-FI) | (7, 9, 9) | (4.424, 5.688, 5.688) | |
| High-Fairly Impossible | (H-FI) | (5, 7, 9) | (3.160, 4.424, 5.688) | |
| Medium-Fairly Impossible | (M-FI) | (3, 5, 7) | (1.896, 3.160, 4.424) | |
| Low-Fairly Impossible | (L-FI) | (1, 3, 5) | (0.632, 1.896, 3.160) | |
| Very Low-Fairly Impossible | (VL-FI) | (1, 1, 3) | (0.632, 0.632, 1.896) | |
| Very High-Unlikely | (VH-U) | (7, 9, 9) | (3.129, 4.023, 4.023) | |
| High-Unlikely | (H-U) | (5, 7, 9) | (2.235, 3.129, 4.023) | |
| Medium-Unlikely | (M-U) | (3, 5, 7) | (1.341, 2.235, 3.129) | |
| Low-Unlikely | (L-U) | (1, 3, 5) | (0.447, 1.341, 2.235) | |
| Very Low-Unlikely | (VL-U) | (1, 1, 3) | (0.447, 0.447, 1.341) |
| Sustainability Dimension | Code | Sustainability Index | Explanation |
|---|---|---|---|
| Economical | E1 | Product selling price | The product cost, inclusive of VAT and applicable taxes. |
| E2 | Delivery time | The lead time for the product to reach the customer or consumer. | |
| E3 | Product quality | Meet the customer’s requirements for product quality and efficiency. | |
| E4 | Warranty and after-sales service | Provide customers with assurance through product warranties and guarantees. | |
| Social | S1 | Customer Orientation | Ensuring customer satisfaction to enhance loyalty levels. |
| S2 | Pay attention to the human rights of employees | Upholding employees’ rights, promoting freedom of expression, and preventing discrimination. | |
| S3 | Participate in charitable activities | Organizing and hosting public and charitable events. | |
| Environmental | G1 | Pollution generation rate | The origin of pollution lies in emissions from industries and factories, agricultural practices, the combustion of fossil fuels, mining activities, and similar sources. These give rise to various forms of pollution including air pollution, water pollution, land pollution, and others. |
| G2 | Ability to recycle product components | Employing alternatives to plastic that are recyclable or biodegradable, such as paper, etc. | |
| G3 | Use of environmentally friendly materials | Utilizing environmentally-friendly materials that do not cause harm to the environment. | |
| G4 | The rate of use of non-renewable energy | Minimize the reliance on non-renewable energy sources like fossil fuels and groundwater, considering their prolonged production or replacement process, and the imperative to conserve for future needs. | |
| Life-Cycle Value | V1 | The potential for long-term relationships in the future | This implies establishing a sustained partnership with the supplier in the years ahead. Anticipating long-term collaboration with the supplier is grounded in their demonstrated loyalty through a substantial history of collaborations, particularly the most recent one. |
| V2 | Expected profitability of the supplier’s lifetime in the future | The projected profit margin from the purchase, taking into account factors like the purchase price, anticipated discounts from the supplier, etc., along with the volume of raw material to be procured from the supplier in the future. | |
| V3 | The cost of waiting for a supplier in the future | The proportionate expenses we anticipate the supplier will incur in the future encompass various aspects. These may comprise the expenses related to defective items and waste, shipping costs contingent on the supplier’s location, costs arising from untimely supply, including potential losses in opportunities, diminished credibility with our customers, and decreased organizational efficiency. Additionally, there are costs associated with the process of identifying and onboarding new suppliers if the current supplier lacks the potential for a sustained long-term relationship in the future. | |
| V4 | The level of supplier loyalty | A loyal supplier pertains to those who have consistently supplied raw materials to the organization over an extended period. They demonstrate a willingness to accommodate any sacrifices, costs, or limitations necessitated by the relationship in order to maintain a long-term affiliation with the organization. Additionally, when fulfilling supply commitments, they refrain from favoring the organization’s competitors over the organization itself. | |
| V5 | Satisfaction of the supplier | Employee satisfaction is an internal sentiment that reflects the degree to which an organization’s expectations regarding performance, financial matters, behavioral conduct, and other relevant aspects in the employment relationship have been met. This assessment is based on the experience gained from the supplier. | |
| V6 | The willingness of the supplier to work with the organization | The supplier’s collaboration with the organization in adhering to the process results in expedited work. Consequently, if the supplier is unwilling to cooperate with the organization, it can lead to delays in handling matters and similar challenges. |
| Dimension | Best | Worse |
|---|---|---|
| Economic | (E-C) | (FG-M) |
| Social | (FG-W) | (E-C) |
| Environment | (NB-ML) | (WA-W) |
| SLV | (WA-M) | (NB-M) |
| Relative to Economic | Best | Worse |
|---|---|---|
| Product selling price | (E-C) | (A-W) |
| Delivery time | (FG-ML) | (E-C) |
| Product quality | (WA-W) | (NB-M) |
| Warranty and after-sales service | (NB-ML) | (WA-W) |
| Relative to SLV | Best | Worse |
|---|---|---|
| The potential for long-term relationships in the future | (E-C) | (PE-W) |
| Expected profitability of the supplier’s lifetime in the future | (E-C) | (A-M) |
| The cost of waiting for a supplier in the future | (WA-M) | (G-ML) |
| The level of supplier loyalty | (WA-M) | (P-W) |
| Satisfaction of the supplier | (NB-M) | (NB-M) |
| The willingness of the supplier to work with the organization | (PE-W) | (E-C) |
| Relative to Social | Best | Worse |
|---|---|---|
| Customer Orientation | (E-C) | (P-M) |
| Pay attention to the human rights of employees | (P-M) | (E-C) |
| Participate in charitable activities | (WA-W) | (WA-L) |
| Relative to Environment | Best | Worse |
|---|---|---|
| Pollution generation rate | (E-C) | (P-ML) |
| Recyclability | (WA-W) | (WA-M) |
| Use of environmentally friendly materials | (WA-W) | (WA-ML) |
| The rate of use of non-renewable energy | (P-L) | (E-C) |
| Resilient Sustainable Dimension | Z-Number | Resilient Sustainable Criteria | Z-Number | Z-Number towards the Goal |
|---|---|---|---|---|
| Economic | 0.460 | E1 | 0.426 | 0.195 |
| E2 | 0.078 | 0.035 | ||
| E3 | 0.335 | 0.154 | ||
| E4 | 0.161 | 0.074 | ||
| Social | 0.110 | S1 | 0.470 | 0.051 |
| S2 | 0.160 | 0.017 | ||
| S3 | 0.370 | 0.040 | ||
| Environment | 0.167 | G1 | 0.349 | 0.058 |
| G2 | 0.274 | 0.045 | ||
| G3 | 0.274 | 0.045 | ||
| G4 | 0.103 | 0.017 | ||
| SLV | 0.263 | V1 | 0.258 | 0.067 |
| V2 | 0.258 | 0.067 | ||
| V3 | 0.185 | 0.048 | ||
| V4 | 0.139 | 0.036 | ||
| V5 | 0.118 | 0.031 | ||
| V6 | 0.042 | 0.011 |
| Supplier | Economic | Social | Environment | SLV | |||||||||||||
|---|---|---|---|---|---|---|---|---|---|---|---|---|---|---|---|---|---|
| E1 | E2 | E3 | E4 | S1 | S2 | S3 | G1 | G2 | G3 | G4 | V1 | V2 | V3 | V4 | V5 | V6 | |
| SU (1) | C | C | VL-ML | L-L | L-ML | L-L | L-L | H-ML | H-C | L-L | M-ML | M-L | L-C | VL-L | VL-W | L-L | L-W |
| SU (2) | C | C | H-L | H-ML | M-ML | H-ML | VH-ML | VH-C | M-ML | L-L | VL-L | H-L | L-ML | M-ML | L-ML | H-L | M-L |
| SU (3) | C | C | VL-ML | VL-L | L-L | VL-L | H-L | M-C | L-L | M-C | VH-L | VL-ML | L-ML | M-L | M-L | L-ML | M-L |
| SU (4) | C | C | VH-L | M-ML | H-ML | H-L | L-L | M-L | M-C | L-ML | H-L | H-ML | H-L | H-C | VH-W | L-ML | H-C |
| SU (5) | C | C | VL-L | M-L | H-L | H-ML | VL-L | M-ML | VH-C | M-W | M-L | VH-C | VL-L | VH-ML | H-L | M-ML | L-W |
| SU (6) | C | C | M-L | L-ML | L-L | VL-L | VL-L | H-L | VL-L | VH-W | L-ML | M-ML | VH-L | H-L | VH-W | VL-C | VL-ML |
| SU (7) | C | C | H-L | L-ML | M-L | VH-L | VH-L | VL-ML | VH-L | M-L | L-W | L-C | H-W | VH-W | VH-L | VL-W | M-L |
| SU (8) | C | C | L-L | M-L | M-L | H-L | H-ML | VH-L | H-L | M-L | H-W | VH-L | VH-L | M-ML | M-ML | L-L | H-L |
| SU (9) | C | C | H-L | H-L | L-ML | H-L | L-ML | VL-C | M-L | L-C | M-L | VH-L | M-W | H-C | L-L | VH-C | M-L |
| SU (10) | C | C | M-L | H-L | M-ML | M-L | M-ML | L-W | VH-L | VH-L | H-ML | M-ML | L-C | M-L | H-ML | M-L | M-L |
| Supplier | Rank | ||||
|---|---|---|---|---|---|
| SU (1) | (0.004, 0.052, 0.17) | (0.049, 0.231, 0.471) | (−0.045, −0.178, −0.3) | 10 | −0.157 |
| SU (2) | (0.022, 0.143, 0.357) | (0.015, 0.105, 0.301) | (0.0069, 0.0381, 0.0557) | 4 | 0.077 |
| SU (3) | (0.02, 0.094, 0.287) | (0.046, 0.227, 0.414) | (−0.025, −0.132, −0.127) | 9 | −0.107 |
| SU (4) | (0.043, 0.207, 0.456) | (0.006, 0.07, 0.231) | (0.0362, 0.1368, 0.2249) | 1 | 0.140 |
| SU (5) | (0.009, 0.088, 0.234) | (0.045, 0.183, 0.36) | (−0.036, −0.095, −0.125) | 8 | −0.091 |
| SU (6) | (0.02, 0.114, 0.274) | (0.018, 0.152, 0.346) | (0.0022, −0.037, −0.071) | 7 | −0.049 |
| SU (7) | (0.038, 0.201, 0.407) | (0.009, 0.097, 0.288) | (0.0295, 0.1045, 0.1194) | 3 | 0.079 |
| SU (8) | (0.022, 0.123, 0.285) | (0.021, 0.128, 0.331) | (0.0013, −0.005, −0.046) | 6 | −0.027 |
| SU (9) | (0.037, 0.223, 0.459) | (0.008, 0.074, 0.255) | (0.0297, 0.1488, 0.2036) | 2 | 0.086 |
| SU (10) | (0.01, 0.128, 0.366) | (0.008, 0.106, 0.297) | (0.0016, 0.0217, 0.0681) | 5 | 0.051 |
| Resilient Sustainable Dimension | Deterministic | Fuzzy | Z-Number | Resilient Sustainable Criteria | Deterministic | Fuzzy | Z-Number | Definite towards the Goal | Fuzzy towards the Goal | Z-Number towards the Goal |
|---|---|---|---|---|---|---|---|---|---|---|
| Economic | 0.5 | 0.519 | 0.460 | E1 | 0.5 | 0.48 | 0.426 | 0.25 | 0.249 | 0.195 |
| E2 | 0.083 | 0.083 | 0.078 | 0.041 | 0.043 | 0.035 | ||||
| E3 | 0.25 | 0.266 | 0.335 | 0.125 | 0.138 | 0.154 | ||||
| E4 | 0.167 | 0.171 | 0.161 | 0.083 | 0.088 | 0.074 | ||||
| Social | 0.083 | 0.084 | 0.110 | S1 | 0.571 | 0.55 | 0.470 | 0.047 | 0.046 | 0.051 |
| S2 | 0.143 | 0.145 | 0.160 | 0.011 | 0.012 | 0.017 | ||||
| S3 | 0.286 | 0.305 | 0.370 | 0.023 | 0.025 | 0.040 | ||||
| Environment | 0.167 | 0.162 | 0.167 | G1 | 0.444 | 0.421 | 0.349 | 0.074 | 0.068 | 0.058 |
| G2 | 0.222 | 0.234 | 0.274 | 0.037 | 0.037 | 0.045 | ||||
| G3 | 0.222 | 0.234 | 0.274 | 0.037 | 0.037 | 0.045 | ||||
| G4 | 0.111 | 0.111 | 0.103 | 0.018 | 0.017 | 0.017 | ||||
| SLV | 0.25 | 0.236 | 0.263 | V1 | 0.3 | 0.286 | 0.258 | 0.075 | 0.067 | 0.067 |
| V2 | 0.274 | 0.276 | 0.258 | 0.068 | 0.065 | 0.067 | ||||
| V3 | 0.15 | 0.159 | 0.185 | 0.037 | 0.037 | 0.048 | ||||
| V4 | 0.143 | 0.144 | 0.139 | 0.035 | 0.033 | 0.036 | ||||
| V5 | 0.1 | 0.102 | 0.118 | 0.025 | 0.024 | 0.031 | ||||
| V6 | 0.033 | 0.033 | 0.042 | 0.008 | 0.007 | 0.011 |
| Supplier | Scenario: Definitive | Scenario: Fuzzy | Scenario: Z-Number | |||
|---|---|---|---|---|---|---|
| Rank | Rank | Rank | ||||
| SU (1) | −0.20635 | 10 | −0.176 | 10 | −0.157 | 10 |
| SU (2) | 0.042404 | 4 | 0.035 | 4 | 0.077 | 4 |
| SU (3) | −0.11631 | 9 | −0.105 | 9 | −0.107 | 9 |
| SU (4) | 0.163403 | 2 | 0.134 | 1 | 0.140 | 1 |
| SU (5) | −0.10964 | 8 | −0.088 | 8 | −0.091 | 8 |
| SU (6) | −0.04694 | 7 | −0.036 | 7 | −0.049 | 7 |
| SU (7) | 0.102206 | 3 | 0.090 | 3 | 0.079 | 3 |
| SU (8) | −0.01798 | 6 | −0.014 | 6 | −0.027 | 6 |
| SU (9) | 0.168086 | 1 | 0.133 | 2 | 0.086 | 2 |
| SU (10) | 0.021126 | 5 | 0.028 | 5 | 0.051 | 5 |
| Supplier | ||||||
|---|---|---|---|---|---|---|
| Rank | Rank | Rank | ||||
| SU (1) | −0.157 | 10 | −0.091 | 9 | −0.0279 | 7 |
| SU (2) | 0.077 | 4 | 0.066 | 2 | 0.048 | 1 |
| SU (3) | −0.107 | 9 | −0.099 | 10 | −0.054 | 10 |
| SU (4) | 0.140 | 1 | 0.084 | 1 | 0.047 | 2 |
| SU (5) | −0.091 | 8 | −0.053 | 8 | −0.029 | 8 |
| SU (6) | −0.049 | 7 | −0.047 | 7 | −0.033 | 9 |
| SU (7) | 0.079 | 3 | 0.066 | 3 | 0.017 | 5 |
| SU (8) | −0.027 | 6 | −0.006 | 6 | −0.017 | 6 |
| SU (9) | 0.086 | 2 | 0.049 | 4 | 0.022 | 4 |
| SU (10) | 0.051 | 5 | 0.031 | 5 | 0.026 | 3 |
| Supplier | Scenario: Z-Number Criteria: Sustainable Life Cycle Value | Scenario: Z-Number Criteria: Sustainability | Scenario: Z-Number Criteria: Life Cycle Value | |||
|---|---|---|---|---|---|---|
| Rank | Rank | Rank | ||||
| SU (1) | −0.157 | 10 | −0.147 | 10 | −0.010 | 8 |
| SU (2) | 0.077 | 4 | 0.079 | 3 | −0.002 | 6 |
| SU (3) | −0.107 | 9 | −0.055 | 6 | −0.003 | 7 |
| SU (4) | 0.140 | 1 | 0.117 | 1 | −0.052 | 10 |
| SU (5) | −0.091 | 8 | −0.091 | 9 | 0.022 | 2 |
| SU (6) | −0.049 | 7 | −0.061 | 7 | −0.001 | 5 |
| SU (7) | 0.079 | 3 | 0.099 | 2 | 0.012 | 4 |
| SU (8) | −0.027 | 6 | −0.063 | 8 | −0.020 | 9 |
| SU (9) | 0.086 | 2 | 0.070 | 4 | 0.036 | 1 |
| SU (10) | 0.051 | 5 | 0.053 | 5 | 0.016 | 3 |
Disclaimer/Publisher’s Note: The statements, opinions and data contained in all publications are solely those of the individual author(s) and contributor(s) and not of MDPI and/or the editor(s). MDPI and/or the editor(s) disclaim responsibility for any injury to people or property resulting from any ideas, methods, instructions or products referred to in the content. |
© 2024 by the authors. Licensee MDPI, Basel, Switzerland. This article is an open access article distributed under the terms and conditions of the Creative Commons Attribution (CC BY) license (https://creativecommons.org/licenses/by/4.0/).
Share and Cite
Tohidi, M.; Homayoun, S.; RezaHoseini, A.; Ehsani, R.; Bagherpour, M. Sustainability-Driven Supplier Selection: Insights from Supplier Life Value and Z-Numbers. Sustainability 2024, 16, 2046. https://doi.org/10.3390/su16052046
Tohidi M, Homayoun S, RezaHoseini A, Ehsani R, Bagherpour M. Sustainability-Driven Supplier Selection: Insights from Supplier Life Value and Z-Numbers. Sustainability. 2024; 16(5):2046. https://doi.org/10.3390/su16052046
Chicago/Turabian StyleTohidi, Mehran, Saeid Homayoun, Ali RezaHoseini, Razieh Ehsani, and Morteza Bagherpour. 2024. "Sustainability-Driven Supplier Selection: Insights from Supplier Life Value and Z-Numbers" Sustainability 16, no. 5: 2046. https://doi.org/10.3390/su16052046
APA StyleTohidi, M., Homayoun, S., RezaHoseini, A., Ehsani, R., & Bagherpour, M. (2024). Sustainability-Driven Supplier Selection: Insights from Supplier Life Value and Z-Numbers. Sustainability, 16(5), 2046. https://doi.org/10.3390/su16052046