Article

Landscape Drivers Influence the Efficiency of Management of Aquatic Invasive Alien Rodents in Western France

1
BIODIVAG, Université d’Angers, Campus Belle Beille, 2 Bd Lavoisier, F-49045 Angers, France
2
REHABS International Research Laboratory, CNRS-Université Lyon 1-Nelson Mandela University, George Campus, George 6615, South Africa
3
Department of Life Sciences and Systems Biology, University of Turin, Via Accademia Albertina 13, 10123 Torino, Italy
4
EPTB Sèvre Nantaise, F-44190 Clisson, France
5
FDGDON 49, 23 rue Georges Morel, F-49070 Beaucouzé, France
*
Author to whom correspondence should be addressed.
Sustainability 2024, 16(5), 1970; https://doi.org/10.3390/su16051970
Submission received: 2 January 2024 / Revised: 11 February 2024 / Accepted: 23 February 2024 / Published: 27 February 2024
(This article belongs to the Section Sustainability, Biodiversity and Conservation)

Abstract

:
Managing invasive alien species (IAS) is a critical issue for many countries to preserve native biodiversity, ecosystem services and human well-being. In western France, we analyzed data of captures of aquatic invasive alien rodents (AIARs), the coypu and muskrat, by the local permanent control program from 2007 to 2022 across 26 municipalities encompassing 631 km2. We found that control activities removed up to 10.3 AIARs per km2 annually. The number of coypus removed per trapper per year increased by 220%, whereas it decreased by 85% for muskrats. The number of trappers increased from 2007 to 2014, peaking at 70, and then decreased by 50% in 2022. The number of AIARs captured per trapper per year increased with the density of ponds. The number of coypus captured per year decreased with an increasing amount of woodland per municipality, whereas it increased with road density. Finally, other tested landscape variables did not affect the number of AIARs removed per trapper per year. Our results are discussed in the context of control activities implemented against IAS in other countries. We advocate for stakeholders to assess whether control activities against AIARs effectively mitigate the impacts on social-ecological systems in France.

1. Introduction

While habitat loss remains the foremost threat to biodiversity, invasion by invasive alien species (IAS), defined as introduced non-native species that threaten ecosystems, habitats and species, has been reported to degrade ecosystems [1], affecting the economy, food and water security, and human health [2]. Due to globalization and international trade, many countries have experienced the establishment of many IAS [3]. Biodiversity losses resulting from invasions are well documented [4] and thought to be driven by species competition, predation, grazing and other ecological mechanisms [5]. In this context, managing IAS invasion has thus become a pivotal issue for many countries to preserve native biodiversity, ecosystem services and human well-being [6].
Like many other ecosystems, wetlands have been affected by IAS [7]. Among the numerous IAS colonizing wetlands, (semi)aquatic invasive alien rodents (AIARs), the coypu (Myocastor coypus) and muskrat (Ondatra zibethicus) are listed in the Union Concern list (EU Regulation No 1143/2014). These species have been reported to trigger extensive damage with important economic [8], human health [9] and environmental [10] impacts. For instance, the estimated worldwide costs of damage for coypu are approximately USD 19 billion [11]. By digging burrows, both coypu and muskrat affect riverbank stability, drainage structures and water flow and quality [12,13]. They are important carriers and vectors of infectious diseases and parasites to humans, livestock, pets and wildlife [14]. Although the number of studies quantifying their impacts on ecosystems is still limited, AIARs have been shown to negatively affect native biodiversity [10,15,16,17,18]. Furthermore, the effects of AIARs on ecosystems are exacerbated, as their populations are not regulated by efficient natural top-down or bottom-up controls, although possible local regulation from predators [19] or very low temperatures [20] have been suggested.
Strategies to mitigate the negative impacts of IAS on social-ecological systems have been proposed, encompassing prevention, the eradication of newly established species, spatial containment and population control [21]. The coypu was successfully eradicated in Britain [22] and, more recently, from a territory of 1.7 M ha in the Delmarva Peninsula, USA [23]. However, in cases where an IAS is widespread with no possibility of eradication, implementing a permanent control program in areas where their impacts need to be reduced is considered an alternative approach [24]. This is, for instance, the case for coypu and muskrat populations in several European countries, including France [25].
A sustainable management strategy should be cost-effective, meaning it should reduce the damage produced by IAS to biodiversity or human activities with an effort that can be sustained in the long term. Securing funding and implementing and maintaining control activities against IAS pose considerable challenges (see [26] for the case of AIARs in France). The engagement of volunteers as field operators has become pivotal in IAS control efforts [27,28]. Indeed, volunteer salaries are not covered, which helps to reduce costs associated with control activities. Motivation among volunteers can be heightened by implementing a monetary reward system within the control program [29,30,31], as they may perceive reward as a fundamental contribution to their involvement [26]. However, a bounty scheme alone is not sufficient to ensure an effective control of IAS populations [29].
In this context, the evaluation of control effectiveness becomes crucial in convincing decision-makers and funders to support ongoing control activities [32]. Studies investigating control efforts against invasive coypus and/or muskrats have been conducted in various regions, including the Netherlands [33,34], Great Britain [22], Italy [12,35], South Korea [31], the Delmarva Peninsula in the USA [23] and France [25]. However, few studies have delved into the long-term variation in the number of removed individuals, the sustained engagement of volunteers over time and whether captures are influenced by landscape drivers.
Several landscape drivers may influence the presence and spread of IAS in ecosystems [36,37,38,39], as well as the success of control activities. For instance, the coypu has been identified as a typical lowland species in Italy using the hydrographic network for dispersion. It is more likely to be found in areas producing rice and is seldom observed in regions with a high percentage of woodlands, human settlements, other crops, shrubs and tree plantations [40]. In northeast France, coypus and muskrats are commonly observed in various riparian habitats, and their occurrence appears to be independent of watercourse width, bank height or bank slope [41]. In its native South American distribution range, coypus are less frequent in urban and semi-urban landscapes, with denser populations in wetlands surrounded by grasslands [42,43]. Although muskrats in their native North American distribution range are more likely to occur in areas with large lakes and high amounts of forage biomass [44], where they affect plant communities [45], the occurrence of invasive muskrats in Sweden was successfully predicted by the percentage cover of swamps, meadows and lakeshore meadows [46].
This study examines data of captures of AIARs by a permanent control program across 26 municipalities encompassing 631 km2 in western France during the last fifteen years. The AIAR populations were managed by the One Health local entity against pest species. We investigated the variation in the number of coypus and muskrats removed per trapper per year from 2007 to 2022, as well as the annual engagement of volunteer trappers in control activities. Subsequently, we tested the effects of several landscape drivers on the number of coypus and muskrats removed per trapper per year. The landscape drivers were assessed per municipality and included the density of ponds, water infrastructures, riparian vegetation, watercourses and roads, and the amount (i.e., the proportion of land cover) of human-settled areas, cereal, woodland, pond surface and pasture. From a population ecology standpoint, we expected that trappers would remove more individuals (coypus and muskrats) in municipalities with a high density of ponds, watercourses, riparian vegetation and pasture, which provide good conditions for the species to survive and reproduce. Conversely, trappers operating in municipalities with a high density of human settlement, roads, and woodlands would not capture many individuals. Alternatively, from a socio-economic perspective, we hypothesized that trappers would capture more individuals in municipalities characterized by high densities of roads and/or human settlements if they choose trapping sites with easy access and/or close to their homes. Additionally, we anticipated more captures in municipalities with a high density of water infrastructures if trappers strategically set their traps in proximity to at-risk/vulnerable infrastructures. We finally discussed the relevance of our results in light of studies examining control activities against AIARs in other countries.

2. Materials and Methods

2.1. Ethics Statement

Although the authors of the study were not directly involved in the captures, we would like to address some ethical considerations related to the data analyzed in the current article. This study examines data collected by the permanent control program against AIARs managed by FDGDON 49, which is the One Health entity responsible for pest species in the French department of “Maine-et-Loire”. FDGDON 49 is the local entity recognized by the French Ministry of Agriculture and Fisheries and the French Ministry of Ecology and Sustainable Development, according to the decree of 6 April 2007. Public and private landowners granted permission to trappers to remove AIARs on their property. All trappers involved in control activities received an official permit with an individual number or an official agreement to trap from a decree of the local authority, namely the Prefecture of the “Maine-et-Loire” (Decrees n° 2019/SEE/2194, n° DAPI-BCC 2007–1179, n° 2019308-001C of 4 February 2019, n° 07/DDAF/263 of 16 July 2007 or decree of 17 February 2016). The trapping procedure complied with the current laws in France (Decree of the French Ministry of Ecology and Sustainable Development of 29 January 2007 pursuant to Article L. 427–8 and 2 September 2016 pursuant to Article R. 427–6 from the French Environmental Code). Invasive rodents were legally killed, and the methods complied with the current laws of the French Penal Code pursuant to Article 521–1 et R. 654–1. Although ethical approval from an Ethical Committee is not required for these control activities, all procedures complied with the ethical standards of the relevant national and European regulations on the care and use of animals (French authority Decision 6 April 2007 and Directive 2010/63/EC). This study did not involve endangered or protected species.

2.2. Study Area

The study area encompassed 26 municipalities covering 631 km2 within the department of “Maine-et-Loire” in the “Pays de la Loire” Region of western France (Figure 1). Among the 26 municipalities, 23 are part of the same watershed, “Sèvre Nantaise”, while the remaining three are not (PUI, VIL and MAC, Figure 1). Characterized by a typical oceanic climate, the average annual temperature is 11.5 °C, and rainfall is 750 mm. The study area comprises a dense network of rivers and wetlands, including ponds. The terrain is rather flat, consisting mainly of plains with few steep valleys, and the highest point reaches 216 m. Given that agriculture is the primary economic activity in the department of “Maine-et-Loire”, the landscape is predominantly a bocage landscape in which meadows and crops are separated by networks of hedgerows and ditches.

2.3. Control Activities

In the study area, FDGDON 49 serves as the local coordinating entity, playing a pivotal role by (i) coordinating groups of volunteer trappers in each municipality (namely, GDON), (ii) training and recruiting new volunteer trappers, (iii) rewarding captures, (iv) providing technical and legal support, and (v) managing AIAR carcasses. The regional government watershed agency for the study area (namely, EPTB SN) provides financial support to local entities for conducting control activities within its territory.
GDON is responsible for managing field activities in each municipality. Trappers in the study area are mostly volunteers, with their numbers varying from 33 to 70 and from one to tens per municipality over the last fifteen years. Trappers primarily employ one-door cage traps (45 × 45 × 90 cm), conibear traps or two-door cage traps to capture coypus and muskrats. The number of cages per trapper ranges from one to ten but may occasionally be higher. Trappers must check their traps before midday, and this requirement serves as the main constraint limiting the number of cages set per trapper. Baited traps are strategically placed on active tracks used by animals near banks of rivers, channels, ponds, ditches, marshes, lakes, collinear restraints or dams. To cover their municipalities effectively, trappers move their traps to different areas, especially when the number of trappers in a municipality is low. Control activities are carried out throughout the year, excluding the summer vacation period (July and August), when they are temporarily suspended to avoid interactions with recreational activities involving people and tourists.

2.4. Capture Data

Volunteer trappers involved in control activities are required to report the number of coypus and muskrats they have removed in their municipality twice a year through local meetings with FDGDON 49. It should be noted that the data on captures from control activities are assessed and communicated at a municipality level. In this article, we analyzed data that were compiled from the permanent control program from 2007 to 2022 (Table S1). Data from 2020 were excluded from the analyses due to the significant impact of the Coronavirus COVID-19 lockdown on control activities in France. For instance, in the study area, the number of AIARs removed per trapper per year was 77.32 individuals in 2019 (the year preceding the lockdown), 45.7 in 2020 (the year of the lockdown), and 84.6 in 2021 (the year after), indicating a substantial 44% decrease of captures in 2020.
Assessing the trapping efforts is crucial in understanding the variation in captures. Unfortunately, local authorities did not initially mandate trappers to document and communicate their trap-setting strategies and operational periods during which traps were active in the field. The only available data to assess the trapping effort are the number of trappers acting per municipality, enabling the evaluation of the number of animals removed per year within a municipality. We acknowledge that trappers who captured many animals might suggest either a high trapping effort or a high local population density of AIARs. However, based on the local coordinators’ knowledge of control activities (i.e., FDGDON 49), we understand that trappers’ practices remained largely consistent between years, and the number of traps they set on the field did not vary annually. Therefore, we believe that the overall number of animals removed per trapper per year is a reasonable index for examining interannual variation in captures in our study area.

2.5. Landscape Data

We used several data sources to characterize the landscape in each municipality. Administrative boundaries for the 26 municipalities in the study area were extracted from the government authority repository [47]. The surfaces of the municipalities were calculated to standardize all landscape variables by municipality area. River networks and pond data were extracted from the SYSMA database of regional government watershed agencies [48] and the IGN BD TOPO® [49]. From these databases, we assessed the length of rivers (linear features in meters) and the number and surface of ponds per municipality. Densities of rivers and ponds were then calculated as the length of rivers and the number of ponds, respectively, divided by the surface area of the municipalities. The CORINE Land Cover 2018 database provided by the European Union’s Copernicus Land Monitoring Service information [50] allowed us to extract the information on the surface area of human settlements, woodland and the two main agricultural land covers, namely pasture and cereal. The amount of each land cover type was calculated as its respective surface divided by the surface area of the municipalities. The density of riparian vegetation was calculated per municipality as the length of hedgerows contained within a buffer of 20 m from the river divided by the surface area of the given buffer. The water infrastructures, including dams, were extracted from the SYSMA database. Public roads and tracks (linear features) were extracted from the government authority repository [47]. The density of roads/tracks was calculated as the length (in meters) divided by the surface area of the municipalities. We used QGIS version 3.34 [51] for mapping and calculating landscape variables.

2.6. Data Analysis

Over the time period from 2007 to 2022, we used generalized additive models (GAMs) to model the changes in the total number of coypus and muskrats removed by trappers. GAMs are well-suited for analyzing nonlinear trends in animal populations [52]. We included ‘year’ as a predictor, assuming a negative binomial error distribution and log link function. We assumed a cubic B-spline covariance structure with a cubic difference penalty on the B-spline coefficients using the ‘gam’ function in the ‘mgcv’ R package version 1.9-1 [53]. For the GAMs, the significance of the model smooth term (i.e., ‘year’ in our study) is assessed with a Chi-square (χ2) test with its estimated degree of freedom (est.df) [54]. This test offers an approximate p-value for the null hypothesis [55] since, for gams, the likelihood ratio statistic does not follow a Chi-square distribution [56]. To ensure the clarity of significant trends over time, 95% confidence intervals (CIs) around predicted values were calculated and plotted. The procedure was applied using as dependent variables the total number of trappers active per year, the total number of animals (distinguishing coypus and muskrats) removed per year and the total number of animals (distinguishing coypus and muskrats) removed per trapper per year.
We used linear regressions (LMs) to assess the effects of landscape drivers on the number of alien invasive aquatic rodents (AIARs) removed per trapper in 2018, distinguishing coypus and muskrats. Data from 2018 were chosen for analysis as they correspond to the most recent update of the CORINE Land Cover data. We examined the impact of various landscape variables, calculated per municipality, corresponding to the surface of the municipality (ha), the density of ponds (No./100 ha), water infrastructures (No./ha), riparian vegetation (m/ha), watercourses (m/ha) and roads (m/ha), the amount of human-settled areas (%), cereal (%), woodland (%), pond surface (%) and pasture (%). Given that the high number of potential predictors did not allow us to run a fully comprehensive model, we ran distinct models for each landscape variable. Recognizing that relationships between landscape drivers and the number of captures might exhibit nonlinear patterns, we tested linear, curvilinear and exponential relationships. The best fitting models are presented, including Fisher and p-values and adjusted R squared (R2). Additionally, due to the uncommonly high woodland percentage in the NUA municipality (55%), models were run both including and excluding this municipality to address its potential skewing effect on the distribution of the ‘density of woodland’ variable.
Statistical analyses were performed using R 4.3.0 [57] with the ‘nlme’ package version 3.1-164 [58].

3. Results

3.1. Temporal Trends of Captures and Volunteer Engagement

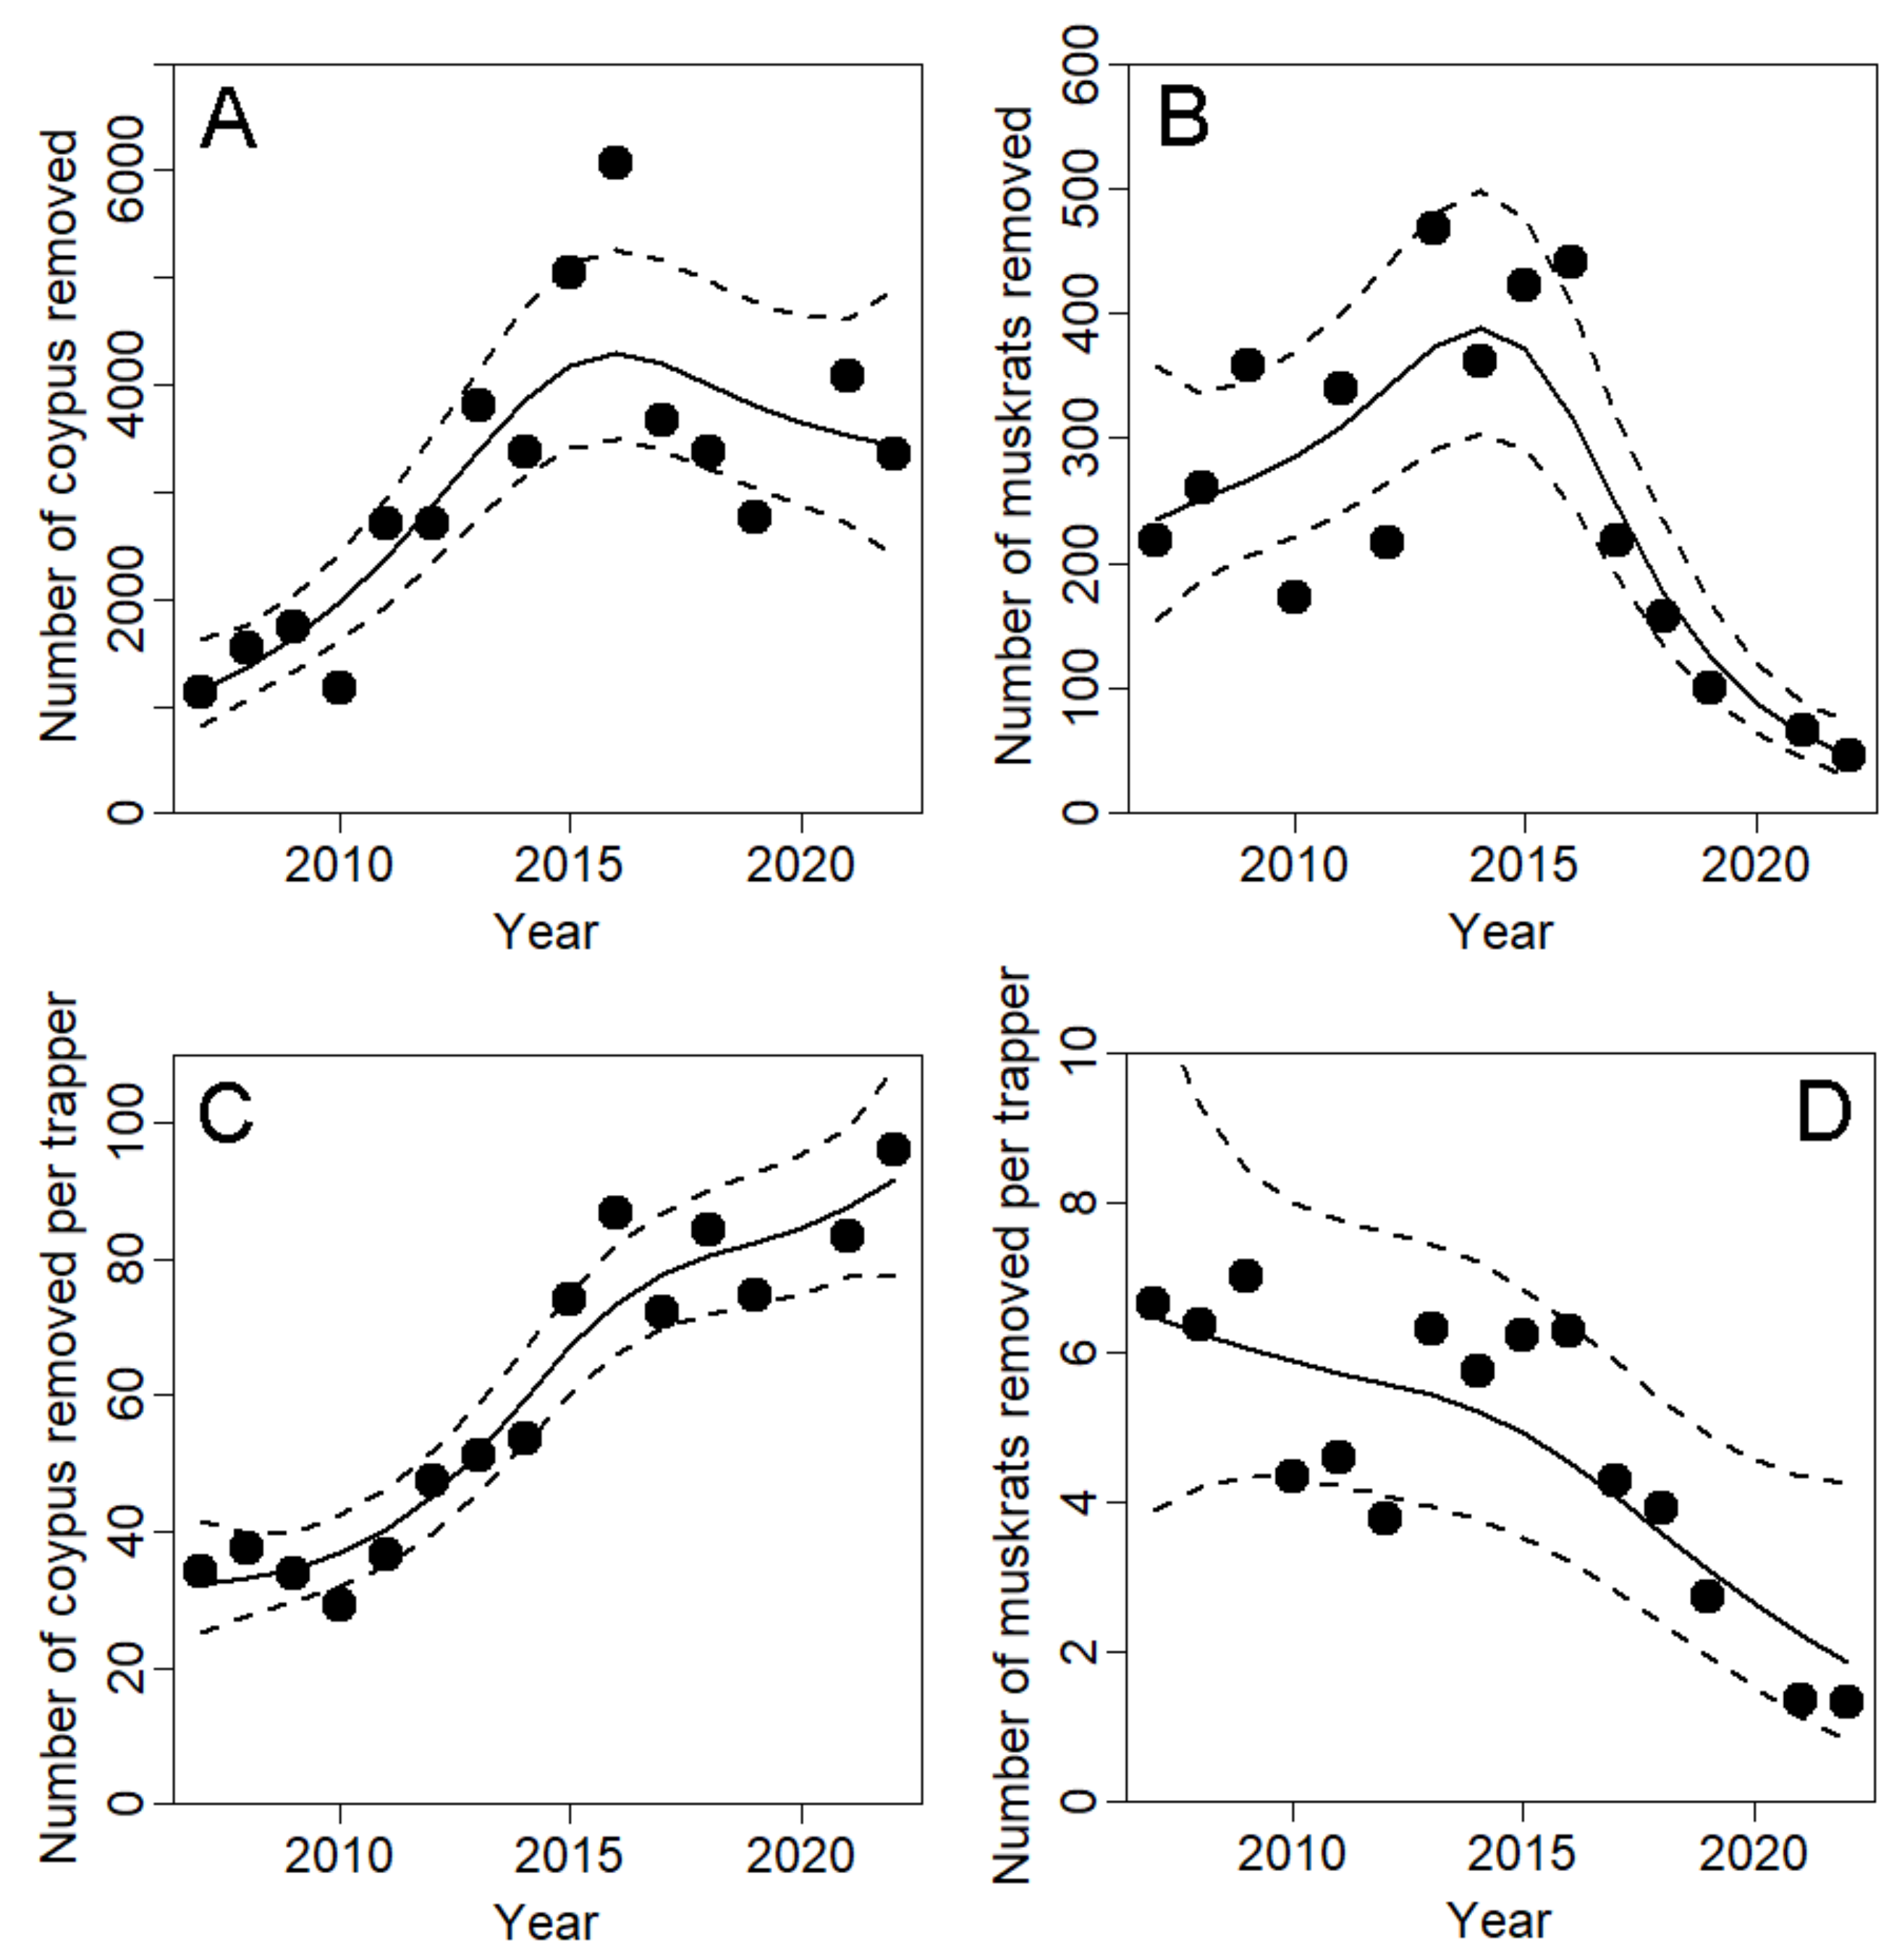
Across the 26 municipalities, the annual total of coypus removed increased from 1124 individuals in 2007 to 6068 in 2016, with a slight decrease after reaching 3356 individuals in 2022 (Table 1 and Figure 2A). Similarly, the number of muskrats removed per year exhibited a comparable pattern, rising from 19 individuals in 2007 to 468 in 2014 and sharply decreasing after 2015 to reach 47 individuals in 2022 (Table 1 and Figure 2B). Over this time period, the number of trappers increased from 33 in 2007 to a peak of 70 in 2014, then declined by 50% to reach 35 trappers in 2022 (Table 1 and Figure 3). Notably, the number of coypus removed per trapper per year increased by 220% from 2007 to 2022, climbing from 30 to 96 individuals, respectively (Table 1 and Figure 2C). Conversely, the number of muskrats removed per trapper per year continuously decreased by 85% from 2007 to 2022, dropping from 7 to 1.3 individuals (Table 1 and Figure 2D).

3.2. Effect of Landscape Drivers on Captures

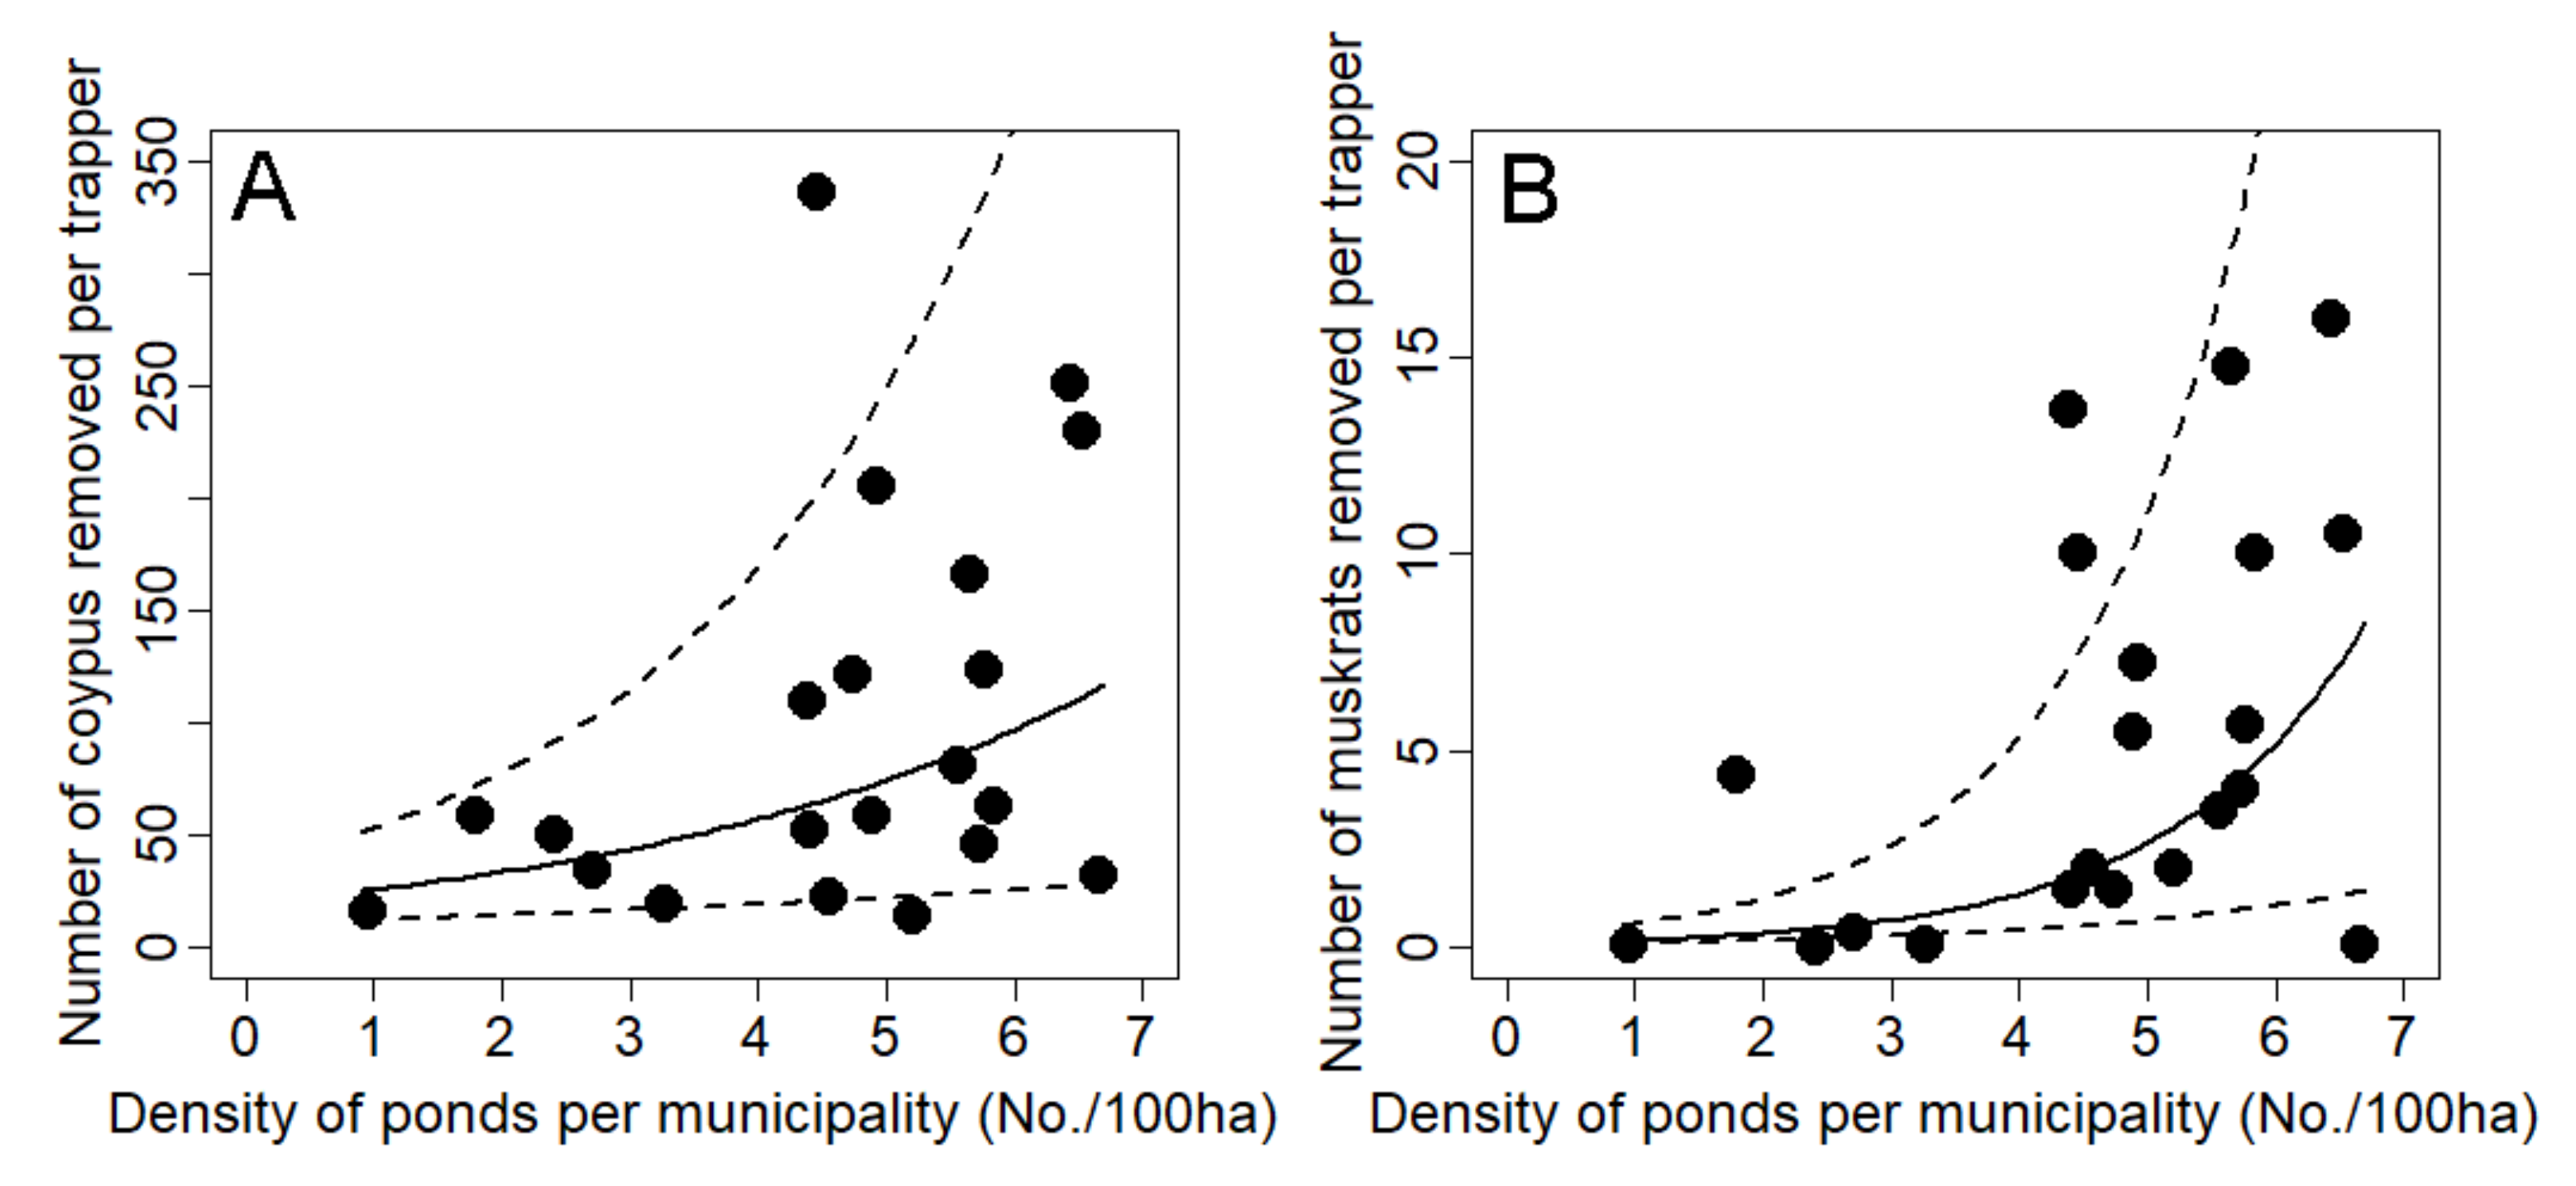
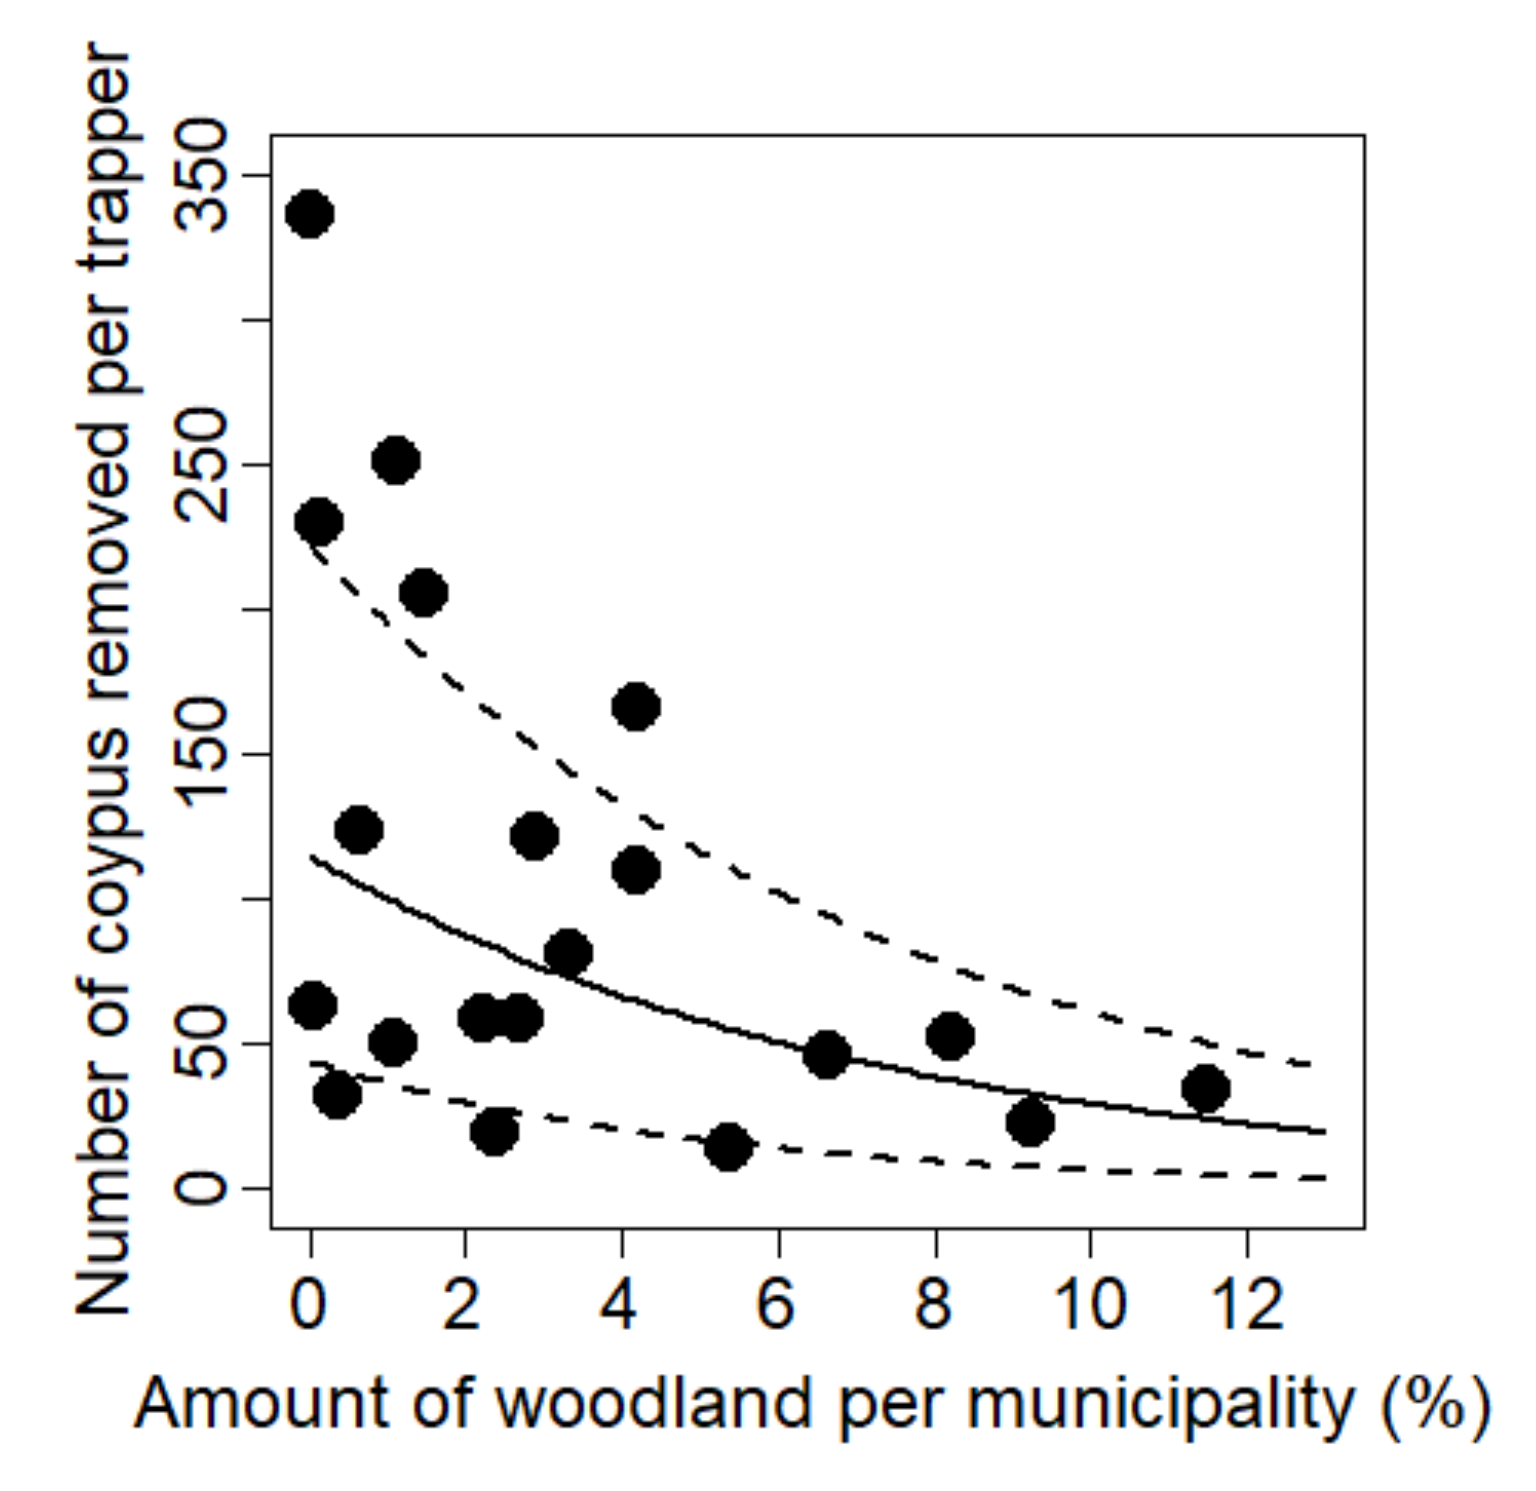
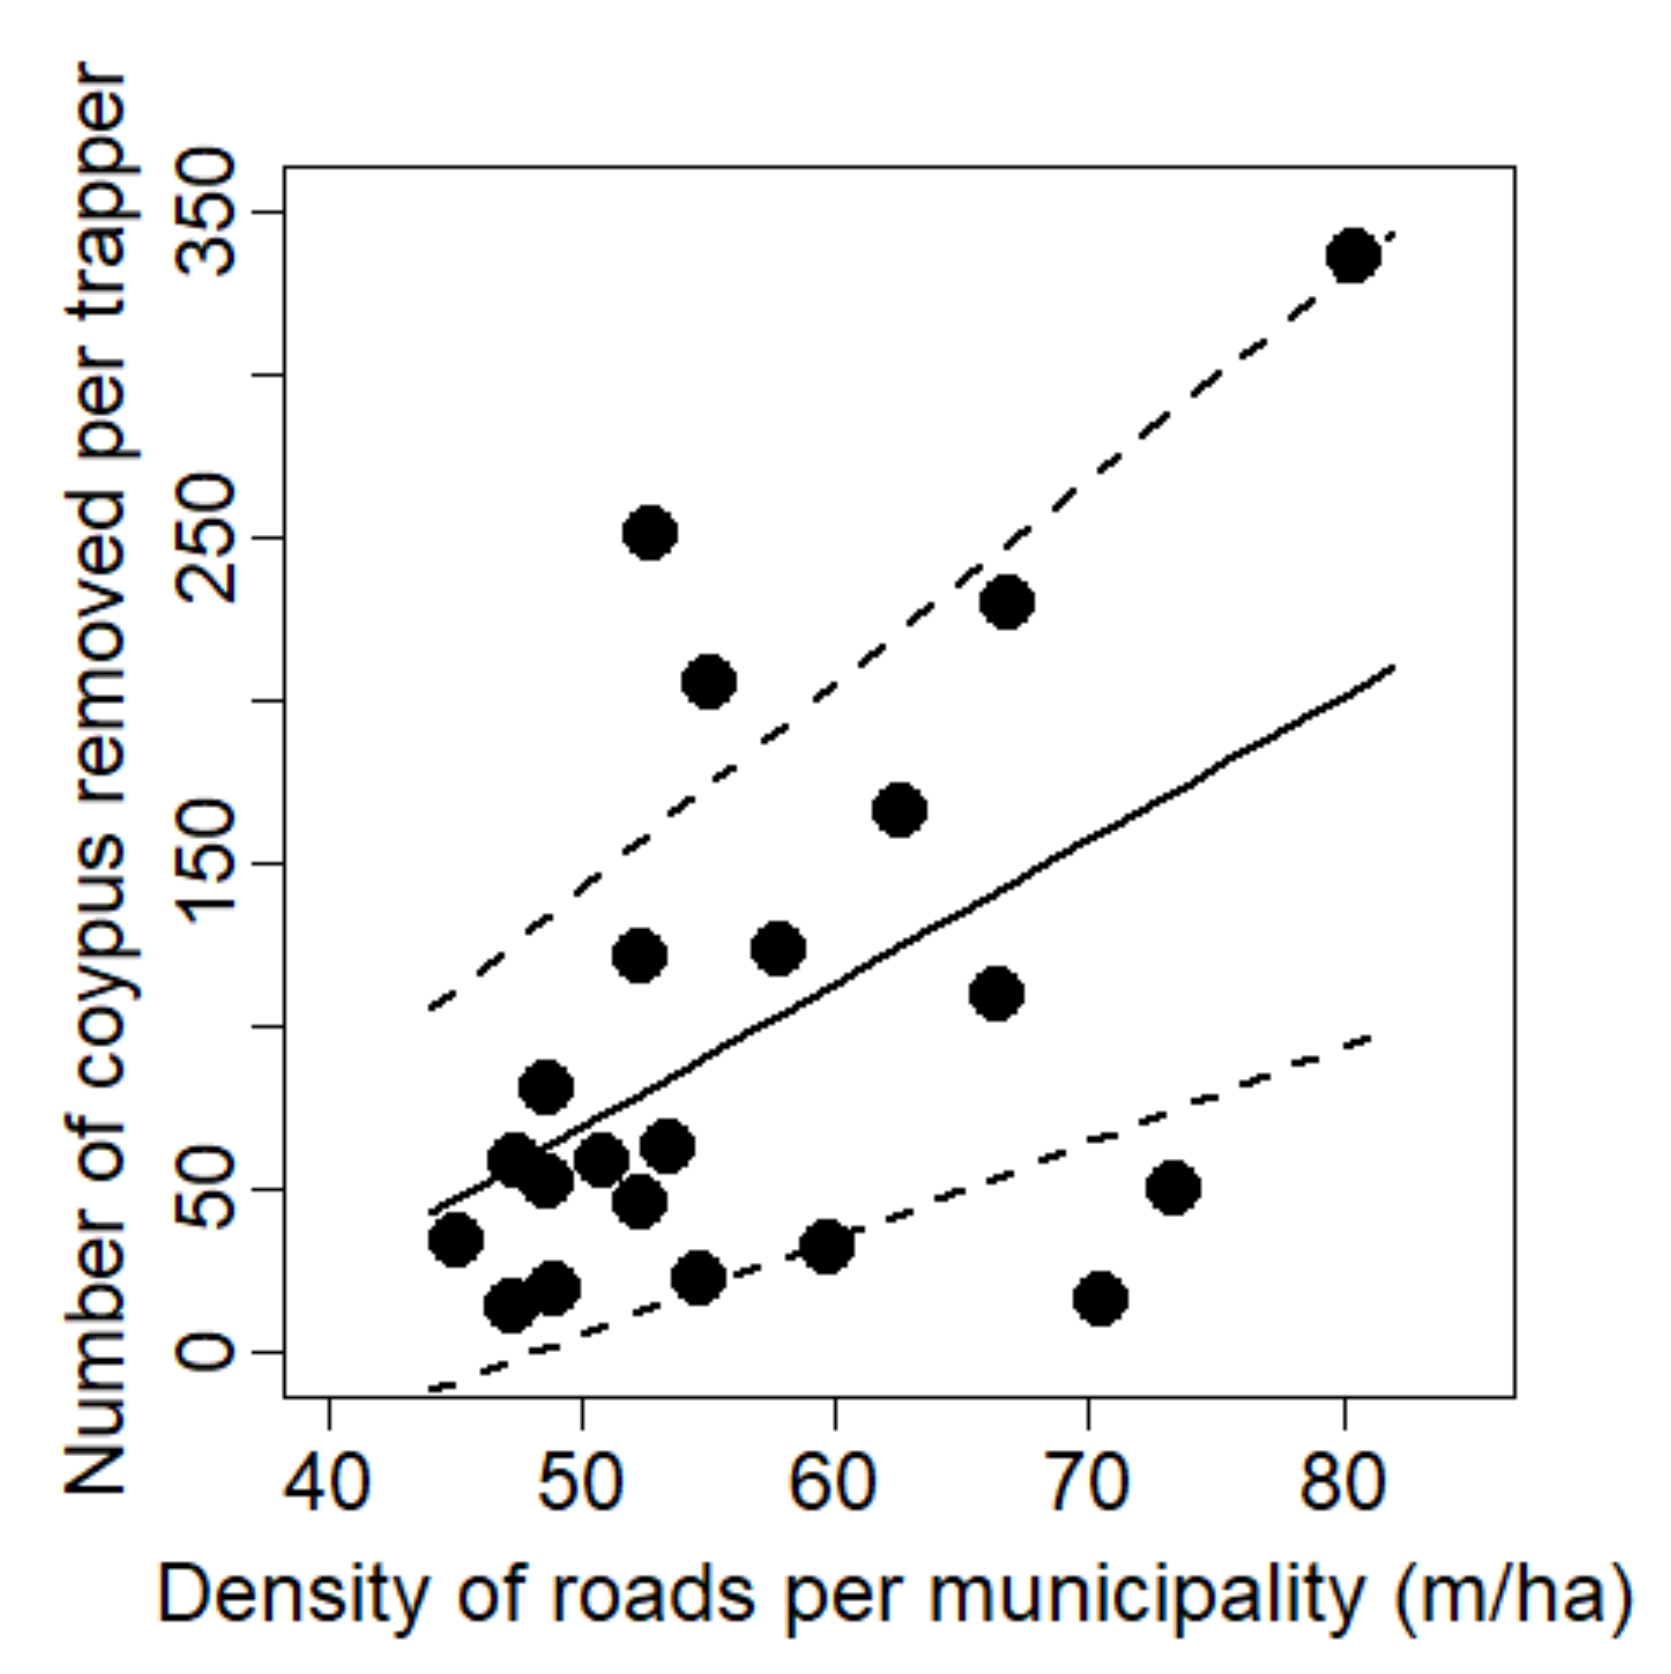
The number of individuals removed per trapper per year, regardless of species (coypu and muskrat), exhibited no variation with the surface of the municipality (Table 2). This indicates that trappers did not capture more AIARs in larger municipalities. However, the number of coypus and muskrats captured per trapper per year increased with the density of ponds (Table 2). Indeed, the numbers of coypus and muskrats removed per trapper per year in municipalities with a number of ponds per 100 ha below four were, on average (±SE), 40.39 ± 8.74 and 1.23 ± 1.06, respectively. Conversely, in municipalities with a number of ponds per 100 hectares above four, the numbers were 119.60 ± 23.49 and 6.75 ± 1.29 above four ponds per 100 ha. The increase in variability in capture in areas with more than four ponds per 100 hectares could be attributed to higher environmental variability and, consequently, larger fluctuations in rodent densities, both spatially and temporally. In municipalities with seven ponds per 100 ha, trappers removed 251 coypus (Figure 4A) and 16 muskrats (Figure 4B) annually. For muskrats only, the number of individuals removed a year increased with the amount of pond surface (Table 2). On the other hand, for coypus, the number of individuals captured a year decreased when the amount of woodland per municipality increased (Table 2). In municipalities with woodland cover exceeding 10%, trappers captured approximately four times fewer individuals (Figure 5). Moreover, for coypus, the number of individuals captured a year increased when the density of roads in municipalities increased (Table 2), reaching its maximum in municipalities with at least 80 m of roads per ha (Figure 6).
Finally, neither the density of watercourses, riparian vegetation and water infrastructure nor the number of human settlement areas, cereal and pasture per municipality affected the number of individuals removed per trapper per year for both species (Table 2).

4. Discussion

Our study reveals that control activities carried out over a 631 km2 area spanning 26 municipalities in western France resulted in the removal of up to 6508 AIARs in 2016, making it the year with the highest number of captures from the period 2007–2022. This translates into a local density of captures reaching 10.3 AIARs per km2 in that year. In comparison, control activities of AIARs in other countries achieved lower capture densities, with approximately 0.24 coypus per km2 per year in South Korea [31], 1.55 coypus per km2 per year in Italy [12] and up to 2.19 muskrats per km waterway per year in the Netherlands [34]. The density of animals removed in these countries was notably lower compared with France. Removing a substantial number of animals may create the perception among local administration and stakeholders that control interventions are successful. Nevertheless, many removed animals may not necessarily indicate successful control. Additional data are essential to assess the effectiveness of species management accurately. Specifically, information on trapping effort is crucial as variations in trapping intensity can influence the number of animals removed. Moreover, if trapping proves effective, an initial surge in the number of animals removed due to improved removal operations should be followed by a decline in trapping efficiency, indicating a reduction in population density. This nuanced perspective, which considers both the number of animals removed and the trapping effort over time, is crucial for a comprehensive evaluation of the efficacy of control programs [35].
The number of trappers engaged in AIAR control increased from 33 in 2007 to 70 trappers in 2014 (i.e., reaching one trapper per 10 km2) and then decreased by 50% to reach 35 trappers in 2022. This recent reduction has resulted in a 47% decrease in the total number of AIARs removed in 2022, with variations observed in the removal trends for coypu and muskrat. Over the last fifteen years, the number of coypus removed per trapper increased by 220%, reaching 100 individuals per trapper in 2022. Although the variation of captures over time should be examined considering the number of trap nights [35,59], this information has yet to be collected by the local entity managing control activities in our study area (see the Materials and Methods section). However, this substantial increase in coypus removed per trapper did not correspond to a drastic decrease in total catches. The overall trend in coypu removed exhibits a similar pattern, with a substantial increase until 2015, followed by a subsequent slight decrease. This suggests that the decline in the number of volunteer trappers was compensated by an increased number of animals removed per trapper.
The observed increase in coypu removal could also be related to one of the drawbacks of a bounty system. There is a general perception that a controlled population might even become locally extinct, with sufficient incentive for trappers, although the success of this approach depends significantly on the type of incentive in place [60]. Under a bounty scheme, it is reasonable to expect trappers to be motivated to maximize their earnings. Indeed, the efficacy of culling tends to decrease as the population size is reduced. In such a situation, fewer animals per unit area are available to be caught, and the remaining individuals may become increasingly trap-shy, making them more challenging to capture. Consequently, due to a decrease in trapping success, trappers are likely to relocate traps to areas with a higher animal density, aiming to capture as many as possible. While this may enable trappers to accumulate more animals, it could also easily lead to reproductive compensation in areas where captures are suspended. Unfortunately, the available data do not enable us to test this hypothesis. On the contrary, to ensure the effectiveness of control efforts, it is imperative to maintain control activities in areas showing a decline in animal captures and potentially in local population density [35]. Therefore, to enhance effectiveness, we suggest implementing a payment-by-result scheme not solely based on the number of animals removed [29,60,61] but also considering the measurement of achieved outcomes regarding population reduction and impacts on the social-ecological system.
The drastic drop in muskrat removal after 2015 could be interpreted as an index of population crashes after intensive removal. In fact, contrary to what happened for the coypu, the drastic decrease in the total number of muskrats removed is linked to a severe drop in the number of animals removed per trapper, which did not compensate for the lower number of trappers. The reverse trend observed in the number of coypus and muskrats removed per trapper over the years might be associated with a decrease in the muskrat population.
Our results raised questions about the drop in captures observed in muskrats over the past decade. The main potential explanation is that coypus dominate muskrat populations in many municipalities within our study area. Given that coypus and muskrats share similar ecological requirements [41], it is plausible that the two species might compete for food and space, particularly in areas with high densities and limited resources. Although no studies have investigated the ecological relationships between the two species in France, research conducted in the United States has suggested the possibility of interspecific competition [62,63]. Another potential explanation could be that trappers are shifting their activities towards coypus. Specifically, muskrat catches have consistently been limited (<10 animals/year), making them less profitable. Conversely, coypu catches have reached more than 100 animals annually, making them more attractive for trappers. In this context, trappers might set their traps in areas where previous catches of coypus (and not muskrats) had been successful. An interaction between these factors is also conceivable. Competition between the two species may have reduced the muskrat’s density, thereby diminishing the profitability of its catches. To disentangle the effects of these potential factors, further studies on both species and inquiries among trappers would be necessary.
Despite potential drawbacks, the engagement of volunteers as field operators is pivotal to conducting control activities, particularly when IAS are widespread and their eradication is not feasible. Compared with employing dedicated personnel, one of the major advantages of engaging volunteers is the significant reduction in costs associated with control activities. While volunteer involvement is a common practice in control efforts against IAS, for instance, against the American mink Neovison vison in Scotland [27], the pine Pinus elliottii in a coastal zone of southern Brazil [28] or other trees from the genera Acacia in a southern coastal zone of South Africa [64], the scale and duration of volunteer engagement in the permanent control program against AIARs in France make it a rather unique initiative (see [26] for more details).
Maintaining or increasing the number of volunteers is crucial for conducting efficient control activities against AIAR in France. Presently, in our study area, volunteers receive rewards from local entities for each AIAR trapped or shot when they bring back the tails of individuals. Across the 26 municipalities, the reward is approximately USD 2.2 per removed animal. This monetary reward system aimed at encouraging citizens to capture coypus [30,31] or other IAS [29] is also observed in other countries. While this system may seem attractive for volunteers, it is not the sole reason for citizens to engage in such programs. Further studies are needed to comprehensively understand their motivations [65]. Therefore, we suggest performing a survey to gain insights into the motivations of volunteers. Additionally, co-designing efficient control activities, sharing capture objectives with all stakeholders, improving local and scientific knowledge on the impacts of IAS on social-ecological systems, and ensuring that the results of control activities are easily accessible to volunteers and other stakeholders would contribute to a more effective and collaborative approach.
It remains to be determined whether the personnel effort invested in control activities effectively leads to a reduction in the target populations of AIARs. To enhance the success of AIAR control initiatives, we strongly advocate for local and national government agencies, particularly in France, to allocate funds for a comprehensive, long-term monitoring program. This program should encompass the assessment of AIAR population changes, as well as the monitoring of indicators reflecting ecological impacts on ecosystems and socio-economic impacts on human societies. Such a monitoring program is crucial for ensuring the effectiveness and sustainability of invasion management strategies.
The other main results of our study are the effects of landscape characteristics in municipalities on the number of AIARs removed per trapper. Our results partially support our initial hypothesis that the number of coypus and muskrats captured per trapper per year increases with the density of ponds, whereas trappers capture fewer coypus when the amount of woodland cover is high. This aligns with previous studies indicating that both species have colonized a wide range of riparian habitats in France [41], the coypu was more likely to be present in lowland areas in Italy [40] and muskrat occurrence in Sweden was successfully predicted by the percentage of swamp cover [46]. Our results also corroborate previous studies indicating that coypus are rarely observed in areas with a high percentage of woodlands [40]. Although some studies [40,46] suggested that AIARs are more present in areas with attractive food, we did not find any effect of the percentage of pasture and riparian vegetation covers on AIAR captures. This result might be potentially explained by (i) the widespread colonization of the species of any aquatic habitats in France [26,66], which might mask any landscape effects on a municipality scale, or (ii) a lack of heterogeneity of landscape composition between studied municipalities to highlight potential significant trends.
Water availability in ponds and other wetlands, along with the hydrological regime, could influence the densities and spatial dynamics of AIAR populations and the feasibility of controlling them [40]. Unfortunately, these data were unavailable for our study area, so we could not assess the effect of these variables on AIAR management. Collecting this information in the future will be crucial for better understanding the effects of water dynamics on populations and the control of AIARs. The number of coypus captured per trapper per year also increased with higher road density per municipality. While it is commonly reported that roads contribute to habitat loss and fragmentation, limiting animal movement and negatively affecting population dynamics in many animal species [67], some studies in small rodents have documented that population abundance was high in close vicinity to roads [68]. Roads may act as corridors that facilitate individual movement even though populations may experience some road mortality [69]. Such positive effects of roads might be observed in AIAR populations if the roads are associated with ditches and other drainage systems that can be colonized by AIARs. Another non-exclusive explanation, according to our second hypothesis, could be that trappers may prefer areas with roads and tracks, facilitating easier access to riverbanks, channels, ponds or dams for carrying and setting their traps.
Contrary to coypus, the number of muskrats removed was not affected by the percentage of woodland and the density of roads. From an ecological standpoint, we do not expect that landscape drivers would affect the occurrence of the two species with similar ecological requirements in our study area differently. Therefore, the difference in patterns of landscape drivers on the effectiveness of captures between the two species may stem from a larger variability observed in the muskrat dataset. Finally, as data on captures show between-year variations, it would be interesting to replicate this study in the future to test whether the same drivers continue to explain the effectiveness of control activities. If data on AIAR population densities become available in the future, further analyses on the relationship between local population densities, landscape features and trapping success would indeed be feasible.

5. Conclusions

Coypus and muskrats pose significant threats to wetlands and trigger an outstanding economic cost for society [11]. Despite this challenge, there is a lack of indicators to assess the effectiveness of the control program in France. Including volunteers in AIAR management has enabled the extension of control activities over a large area. However, for a management strategy to be sustainable in the long term, it should also be cost-effective. While volunteers contribute to reducing the cost of control, we could not evaluate their effectiveness due to a lack of data. We strongly encourage stakeholders to enhance strategies beyond offering rewards for recruiting and retaining new volunteers. Additionally, we advocate for funding a long-term scientific monitoring program on population dynamics and ecological indicators. This will help assess whether control activities effectively reduce the impacts of AIARs in priority areas. Our results emphasize the need for collaborative discussions among stakeholders, including local and regional governmental authorities, and scientists to enhance the strategic approach to AIAR management.

Supplementary Materials

The following supporting information can be downloaded at: https://www.mdpi.com/article/10.3390/su16051970/s1, Table S1: Data related to control activities from 2007 to 2022 over 26 municipalities in Western France. Data from 2020 were discarded because of the COVID lockdown (see methods); Table S2: Name and abbreviation of municipalities mentioned in the Figure 1.

Author Contributions

O.P. conceived the ideas and designed the methodology; E.M., M.B., A.G.-F. and C.H. compiled the database and prepared the data for the analyses; O.P. and E.M. analyzed the data; O.P. wrote the manuscript; all authors have improved the manuscript with significant comments. All authors have read and agreed to the published version of the manuscript.

Funding

This research received no external funding.

Institutional Review Board Statement

This study examines data of control activities collected by the permanent control program against the aquatic invasive alien rodents managed by FDGDON 49. FDGDON 49 is the One Health local entity responsible for pest species in the French department of “Maine-et-Loire” and recognized by the French Ministry of Agriculture and Fisheries and the French Ministry of Ecology and Sustainable Development, according to the decree of the 6 April 2007. Thus, ethical approval from an Ethical Committee is not required (see details of Ethics Statement in the Materials and Methods). All procedures complied with the ethical standards of the relevant national and European regulations on the care and use of animals (French authority Decision 6 April 2007 and Directive 2010/63/EC).

Informed Consent Statement

Not applicable.

Data Availability Statement

Publicly available datasets were analyzed in this study. These data can be found in the Table S1.

Acknowledgments

We would like to thank all local partners, including volunteers, who contributed to making this study possible.

Conflicts of Interest

FDGDON 49 provided support in terms of scholarship for EM and salary for AGF. EPTB SN provided support in terms of salary for XG. FDGDON 49 is the One Health local entity against pest species in the department “Maine-et-Loire” and is recognized by the French Ministry of Agriculture and Fisheries and the French Ministry of Ecology and Sustainable Development. Thus, FDGDON 49 has communicated all captures of trappers from 2007 to 2022. FDGDON 49 and EPTB SN did not have any additional roles in the study design, data analysis, decision to publish, or preparation of the manuscript. The specific roles of these authors are articulated in the author contributions section and do not alter to the adherence of journal policies on sharing data and materials. Authors have no relevant financial or non-financial interests to disclose.

References

  1. Doherty, T.S.; Glen, A.S.; Nimmo, D.G.; Ritchie, E.G.; Dickman, C.R. Invasive predators and global biodiversity loss. Proc. Natl. Acad. Sci. USA 2016, 113, 11261–11265. [Google Scholar] [CrossRef]
  2. IPBES. Summary for Policymakers of the Thematic Assessment Report on Invasive Alien Species and their Control of the Intergovernmental Science-Policy Platform on Biodiversity and Ecosystem Services; Roy, H.E., Pauchard, A., Stoett, P., Renard Truong, T., Bacher, S., Galil, B.S., Hulme, P.E., Ikeda, T., Sankaran, K.V., McGeoch, M.A., et al., Eds.; IPBES Secretariat: Bonn, Germany, 2023; 56p. [Google Scholar] [CrossRef]
  3. Keller, R.P.; Geist, J.; Jeschke, J.; Kühn, I. Invasive species in Europe: Ecology, status, and policy. Environ. Sci. Eur. 2011, 23, 23. [Google Scholar] [CrossRef]
  4. Bradley, B.A.; Laginhas, B.B.; Whitlock, R.; Allen, J.M.; Bates, A.E.; Bernatchez, G.; Diez, J.M.; Early, R.; Lenoir, J.; Vilà, M.; et al. Disentangling the abundance–impact relationship for invasive species. Proc. Natl. Acad. Sci. USA 2019, 116, 9919–9924. [Google Scholar] [CrossRef]
  5. Kettenring, K.M.; Adams, C.R. Lessons learned from invasive plant control experiments: A systematic review and meta-analysis. J. Appl. Ecol. 2011, 48, 970–979. [Google Scholar] [CrossRef]
  6. Bellard, C.; Cassey, P.; Blackburn, T.M. Alien species as a driver of recent extinctions. Biol. Lett. 2016, 12, 20150623. [Google Scholar] [CrossRef] [PubMed]
  7. Vilà, M.; Hulme, P.E. Non-native species, ecosystem services, and human well-being. In Impact of Biological Invasions on Ecosystem Services; Vilà, M., Hulme, P.E., Eds.; Springer International Publishing: Berlin, Germany; Cham, Switzerland, 2017; Volume 12, pp. 1–14. [Google Scholar] [CrossRef]
  8. Cuthbert, R.; Pattison, Z.; Taylor, N.; Verbrugge, L.; Diagne, C.; Ahmed, D.A.; Leroy, B.; Angulo, E.; Briski, E.; Capinha, C.; et al. Global economic costs of aquatic invasive alien species. Sci. Total Environ. 2021, 775, 145238. [Google Scholar] [CrossRef] [PubMed]
  9. Chinchio, E.; Crotta, M.; Romeo, C.; Drewe, J.A.; Guitian, J.; Ferrari, N. Invasive Alien Species and Disease Risk: An Open Challenge in Public and Animal Health. PLoS Pathog. 2020, 16, e1008922. [Google Scholar] [CrossRef]
  10. Bertolino, S.; Perrone, A.; Gola, L. Effectiveness of Coypu Control in Small Italian Wetland Areas. Wildl. Soc. Bull. 2005, 33, 714–720. [Google Scholar] [CrossRef]
  11. Diagne, C.; Leroy, B.; Gozlan, R.; Vaissière, A.C.; Assailly, C.; Nuninger, L.; Roiz, D.; Jourdain, F.; Jarić, I.; Courchamp, F. InvaCost, a Public Database of the Economic Costs of Biological Invasions Worldwide. Sci. Data 2020, 7, 277. [Google Scholar] [CrossRef] [PubMed]
  12. Panzacchi, M.; Cocchi, R.; Genovesi, P.; Bertolino, S. Population control of coypu Myocastor coypus in Italy compared to eradication in UK: A cost-benefit analysis. Wildl. Biol. 2007, 13, 159–171. [Google Scholar] [CrossRef]
  13. Sofia., G.; Masin, R.; Tarolli, P. Prospects for Crowdsourced Information on the Geomorphic ‘Engineering’ by the Invasive Coypu (Myocastor Coypus). Earth Surf. Process. Landf. 2017, 42, 365–377. [Google Scholar] [CrossRef]
  14. Ayral, F.; Kodjo, A.; Guédon, G.; Boué, F.; Richomme, C. Muskrats Are Greater Carriers of Pathogenic Leptospira than Coypus in Ecosystems with Temperate Climates. PLoS ONE 2020, 15, e0228577. [Google Scholar] [CrossRef] [PubMed]
  15. Boorman, L.A.; Fuller, R.M. The changing status of reedswamp in the Norfolk Broads, England, UK. J. Appl. Ecol. 1981, 18, 241–269. [Google Scholar] [CrossRef]
  16. Bertolino, S.; Angelici, C.; Monaco, E.; Monaco, A.; Capizzi, D. Interactions between Coypu (Myocastor coypus) and Bird Nests in Three Mediterranean Wetlands of Central Italy. Hystrix Ital. J. Mamm. 2011, 22, 333–339. [Google Scholar] [CrossRef]
  17. Diggins, T.P.; Stewart, K.M. Evidence of large change in unionid mussel abundance from selective muskrat predation, as inferred by shell remains left on shore. Int. Rev. Hydrobiol. 2000, 85, 505–520. [Google Scholar] [CrossRef]
  18. Nagayama, S.; Kume, M.; Oota, M.; Mizushima, K.; Mori, S. Common Coypu Predation on Unionid Mussels and Terrestrial Plants in an Invaded Japanese River. Knowl. Manag. Aquat. Ecosyst. 2020, 421, 37. [Google Scholar] [CrossRef]
  19. Mori, E.; Andreoni, A.; Cecere, F.; Magi, M.; Lazzeri, L. Patterns of activity rhythms of invasive coypus Myocastor coypus inferred through camera-trapping. Mamm. Biol. 2020, 100, 591–599. [Google Scholar] [CrossRef]
  20. Gosling, L.M. Climatic determinants of spring littering by feral coypus, Myocastor coypus. J. Zool. 1981, 195, 281–288. [Google Scholar] [CrossRef]
  21. Simberloff, D.; Keitt, B.; Will, D.; Holmes, N.; Pickett, E.; Genovesi, P. Yes we can! Exciting progress and prospects for controlling invasives on islands and beyond. West. N. Am. Nat. 2018, 78, 942–958. [Google Scholar] [CrossRef]
  22. Gosling, L.M.; Baker, S.J. The eradication of muskrats and coypus from Britain. Biol. J. Linn. Soc. 1989, 38, 39–51. [Google Scholar] [CrossRef]
  23. Anderson, D.P.; Pepper, M.A.; Travers, S.; Michaels, T.A.; Sullivan, K.; Ramsey, D.S.L. Confirming the broadscale eradication success of nutria (Myocastor coypus) from the Delmarva Peninsula, USA. Biol. Invasions 2022, 24, 3509–3521. [Google Scholar] [CrossRef]
  24. Braysher, M. Managing Vertebrate Pests: Principles and Strategies; Bureau of Resource Sciences, Australian Government Publishing Service: Canberra, Australia, 1993; 50p.
  25. Bonnet, M.; Guédon, G.; Pondaven, M.; Bertolino, S.; Padiolleau, D.; Pénisson, V.; Gastinel, F.; Angot, F.; Renaud, P.C.; Frémy, A.; et al. Aquatic invasive alien rodents in Western France: Where do we stand today after decades of control? PLoS ONE 2021, 16, e0249904. [Google Scholar] [CrossRef] [PubMed]
  26. Bonnet, M.; Guédon, G.; Bertolino, S.; Harmange, C.; Pagano, A.; Picard, D.; Pays, O. Improving the management of aquatic invasive alien rodents in France: Appraisal and recommended actions. Manag. Biol. Invasions 2023, 14, 625–640. [Google Scholar] [CrossRef]
  27. Bryce, R.; Oliver, M.K.; Davies, L.; Gray, H.; Urquhart, J.; Lambin, X. Turning back the tide of American mink invasion at an unprecedented scale through community participation and adaptive management. Biol. Conserv. 2011, 144, 575–583. [Google Scholar] [CrossRef]
  28. de Sá Dechoum, M.; Giehl, E.L.H.; Sühs, B.G.R.; Silveira, T.C.L.; Ziller, S.R. Citizen engagement in the management of non-native invasive pines: Does it make a difference? Biol. Invasions 2019, 21, 175–188. [Google Scholar] [CrossRef]
  29. Sheail, J. The grey squirrel (Sciurus carolinensis)—A UK historical perspective on a vertebrate pest species. J. Environ. Manag. 1999, 55, 145–156. [Google Scholar] [CrossRef]
  30. Dedah, C.O.; Kazmierczak, R.F.; Walter, R.K. The role of bounties and human behavior on Louisiana nutria harvests. J. Agric. Appl. Econ. 2010, 42, 133–142. [Google Scholar] [CrossRef]
  31. Kim, Y.C.; Kim, A.; Lim, J.; Kim, T.S.; Park, S.G.; Kim, M.; Lee, J.H.; Lee, J.R.; Lee, D.H. Distribution and Management of Nutria (Myocastor coypus) Populations in South Korea. Sustainability 2019, 11, 4169. [Google Scholar] [CrossRef]
  32. Bradshaw, C.J.; Leroy, B.; Bellard, C.; Roiz, D.; Albert, C.; Fournier, A.; Barbet-Massin, M.; Salles, J.M.; Simard, F.; Courchamp, F. Massive yet grossly underestimated global costs of invasive insects. Nat. Commun. 2016, 7, 12986. [Google Scholar] [CrossRef]
  33. Van Loon, E.E.; Bos, D.; van Hellenberg Hubar, C.J.; Ydenberg, R.C. A historical perspective on the effects of trapping and controlling the muskrat (Ondatra zibethicus) in the Netherlands. Pest Manag. Sci. 2017, 73, 305–312. [Google Scholar] [CrossRef]
  34. Bos, D.; Kentie, R.; La Haye, M.; Ydenberg, R.C. Evidence for the effectiveness of controlling muskrat (Ondatra zibethicus L.) populations by trapping. Eur. J. Wildl. 2019, 65, 45. [Google Scholar] [CrossRef]
  35. Bertolino, S.; Viterbi, R. Long-Term Cost-Effectiveness of Coypu (Myocastor coypus) Control in Piedmont (Italy). Biol. Invasions 2010, 12, 2549–2558. [Google Scholar] [CrossRef]
  36. Higgins, S.; Richardson, D.; Cowling, R. Modeling invasive plant spread: The role of plant-environment interactions and model structure. Ecology 1996, 77, 2043–2054. [Google Scholar] [CrossRef]
  37. With, K.A. The Landscape Ecology of Invasive Spread. Conserv. Biol. 2002, 16, 1192–1203. [Google Scholar] [CrossRef]
  38. Rodewald, A.D.; Arcese, P. Direct and Indirect Interactions between Landscape Structure and Invasive or Overabundant Species. Curr. Landsc. Ecol. Rep. 2016, 1, 30–39. [Google Scholar] [CrossRef]
  39. Della Rocca, F.; Milanesi, P. The Spread of the Japanese Beetle in a European Human-Dominated Landscape: High Anthropization Favors Colonization of Popillia japonica. Diversity 2022, 14, 658. [Google Scholar] [CrossRef]
  40. Bertolino, S.; Ingegno, B. Modelling the distribution of an introduced species: The coypu Myocastor coypus (Mammalia, Rodentia) in Piedmont region. Ital. J. Zool. 2009, 76, 340–346. [Google Scholar] [CrossRef]
  41. Ruys, T.; Lorvelec, O.; Marre, A.; Bernez, I. River management and habitat characteristics of three sympatric aquatic rodents: Common muskrat, coypu and European beaver. Eur. J. Wildl. 2011, 57, 851–864. [Google Scholar] [CrossRef]
  42. Guichón, M.L.; Cassini, M.H. Local determinants of coypu distribution along the Luján River, eastcentral Argentina. J. Wildl. Manag. 1999, 63, 895–900. [Google Scholar] [CrossRef]
  43. Leggieri, L.R.; Guichón, M.L.; Cassini, M.H. Landscape correlates of the distribution of coypu Myocastor coypus (Rodentia, Mammalia) in Argentinean Pampas. Ital. J. Zool. 2011, 78, 124–129. [Google Scholar] [CrossRef]
  44. Turner, C.K.; Lantz, T.C.; Fisher, J.T. Muskrat distributions in a changing Arctic delta are explained by patch composition and configuration. Arct. Sci. 2020, 2, 77–94. [Google Scholar] [CrossRef]
  45. Kua, Z.X.; Stella, J.C.; Farrell, J.M. Local disturbance by muskrat, an ecosystem engineer, enhances plant diversity in regionally-altered wetlands. Ecosphere 2020, 11, e03256. [Google Scholar] [CrossRef]
  46. Ecke, F.; Henry, A.; Danell, K. Landscape-based prediction of the occurrence of the invasive muskrat (Ondatra zibethicus). Ann. Zool. Fenn. 2014, 51, 325–334. [Google Scholar] [CrossRef]
  47. Plateforme Ouverte des Données Publiques Françaises. Available online: https://data.gouv.fr/ (accessed on 1 May 2023).
  48. Sysma. Available online: https://sysma.io/ (accessed on 1 May 2023).
  49. IGN BD TOPO. Available online: https://geoservices.ign.fr/ (accessed on 1 May 2023).
  50. Copernicus Land Monitoring Service information. Available online: https://land.copernicus.eu/ (accessed on 1 May 2023).
  51. QGIS Development Team. QGIS Geographic Information System. Open-Source Geospatial Foundation Project. 2022. Available online: http://qgis.osgeo.org/en/site/ (accessed on 1 May 2023).
  52. Zuur, A.F.; Ieno, E.N.; Walker, N.J.; Saveliev, A.A.; Smith, G.M. Mixed Effects Models and Extensions in Ecology with R; Springer: New York, NY, USA, 2009; 574p. [Google Scholar] [CrossRef]
  53. Eilers, P.H.C.; Brian, D.M. Flexible smoothing with B-splines and penalties. Stat. Sci. 1996, 11, 89–121. [Google Scholar] [CrossRef]
  54. Wood, S.N. Generalized Additive Models: An Introduction with R; Chapman and Hall/CRC: New York, NY, USA, 2006; 410p. [Google Scholar]
  55. Wood, S.N. On p-values for smooth components of an extended generalized additive model. Biometrika 2013, 100, 221–228. [Google Scholar] [CrossRef]
  56. Hastie, T.J.; Tibshirani, R.J. Generalized Additive Models; Monographs on Statistics and Applied Probability 43; Chapman and Hall/CRC: New York, NY, USA, 1990; 352p. [Google Scholar]
  57. R Development Core Team. R: A Language and Environment for Statistical Computing. R Foundation for Statistical Computing, Vienna. Available online: http://www.R-project.org (accessed on 1 July 2023).
  58. Pinheiro, J.; Bates, D.; DebRoy, S.; Sarkar, D.; R Core Team. nlme: Linear and Nonlinear Mixed Effects Models. R Package Version 3. 1. 2019. Available online: https://svn.r-project.org/R-packages/trunk/nlme/ (accessed on 1 July 2023).
  59. Reggiani, G.; Boitani, L.; de Stefano, R. Population Dynamics and Regulation in the Coypu Myocastor coypus in Central Italy. Ecography 2006, 18, 138–146. [Google Scholar] [CrossRef]
  60. Baker, S. The eradication of coypus (Myocastor coypus) from Britain: The elements required for a successful campaign. In Assessment and Control of Biological Invasion Risks; Koike, F., Clout, M.N., Kawamichi, M., De Poorter, M., Iwatsuki, K., Eds.; Shoukadoh Book Sellers: Kyoto, Japan; IUCN: Gland, Switzerland, 2006; pp. 142–147. [Google Scholar]
  61. Gosling, L.M.; Baker, S.J. Planning and monitoring an attempt to eradicate coypus from Britain. Symp. Zool. Soc. Lond. 1987, 58, 99–113. [Google Scholar]
  62. Evans, J. About Nutria and Their Control; Resource Publication; United States Bureau of Sport Fisheries and Wildlife: Washington, DC, USA, 1970; Volume 86, 65p.
  63. Ahlers, A.A.; Heske, E.J. Empirical Evidence for Declines in Muskrat Populations Across the United States. J. Wildl. Manag. 2017, 81, 1408–1416. [Google Scholar] [CrossRef]
  64. Jubase, N.; Shackleton, R.T.; Measey, J. Motivations and contributions of volunteer groups in the management of invasive alien plants in South Africa’s Western Cape province. Bothalia 2021, 51, a3. [Google Scholar] [CrossRef]
  65. Anđelković, A.A.; Handley, L.L.; Marchante, E.; Adriaens, T.; Brown, P.M.; Tricarico, E.; Verbrugge, L.N. A review of volunteers’ motivations to monitor and control invasive alien species. NeoBiota 2022, 73, 153–175. [Google Scholar] [CrossRef]
  66. Schertler, A.; Rabitsch, W.; Moser, D.; Wessely, J.; Essl, F. The potential current distribution of the coypu (Myocastor coypus) in Europe and climate change included shifts in the near future. Neobiota 2020, 58, 129–160. [Google Scholar] [CrossRef]
  67. Fahrig, L.; Rytwinski, T. Effects of roads on animal abundance: An empirical review and synthesis. Ecol. Soc. 2009, 14, 21. [Google Scholar] [CrossRef]
  68. Ruiz-Capillas, P.; Estacio, C.M.; Malo, J.E. Road verges are refuges for small mammal populations in extensively managed Mediterranean landscapes. Biol. Conserv. 2013, 158, 223–229. [Google Scholar] [CrossRef]
  69. Galantinho, A.; Santos, S.; Eufrázio, S.; Silva, C.; Carvalho, F.; Alpizar-Jara, R.; Mira, A. Effects of roads on small-mammal movements: Opportunities and risks of vegetation management on roadsides. J. Environ. Manag. 2022, 316, 115272. [Google Scholar] [CrossRef]
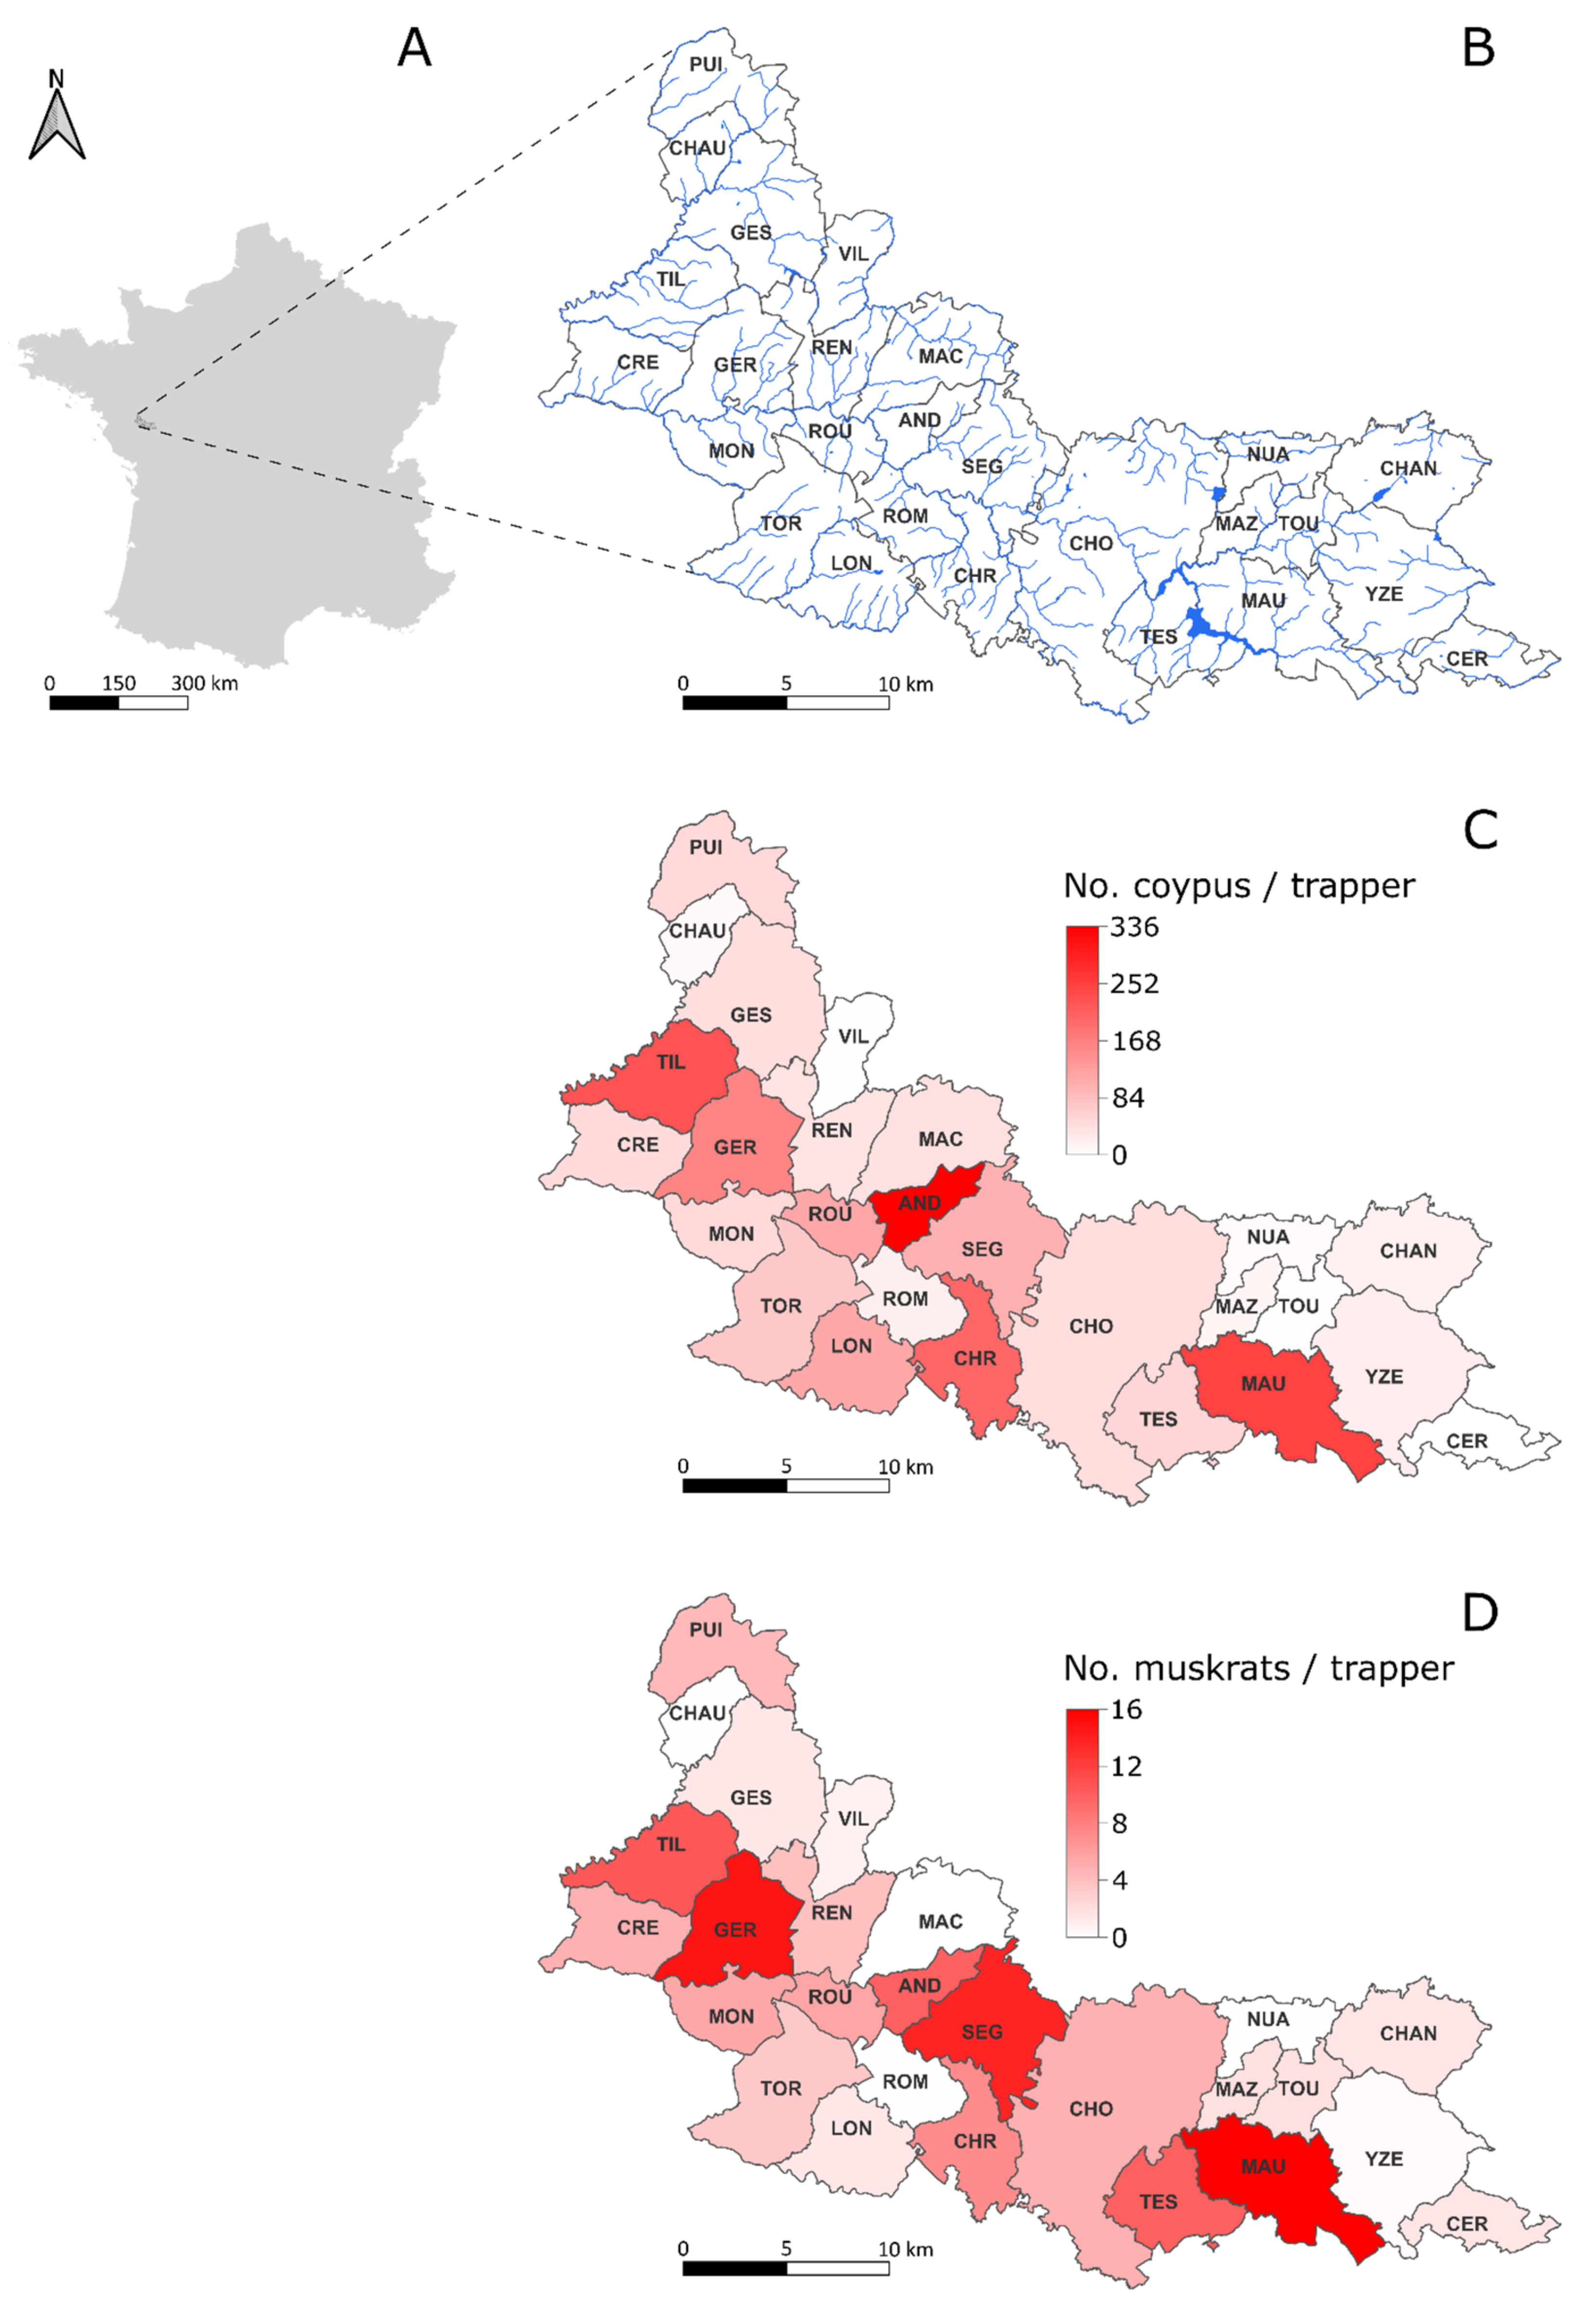
Figure 1. Location of the study area in western France (A), including 26 municipalities, 23 of which belong to the watershed “Sèvre Nantaise”. Main watercourses and lakes are indicated in blue and administrative boundaries of municipalities in black (B). The total number of coypus (C) and muskrats (D) removed per trapper per municipality in 2018 (used for the landscape analysis) are presented. For clarity, the name of each municipality has been reduced to three or four letters (see Table S2 for their full names).
Sustainability 16 01970 g001
Figure 2. Temporal dynamics of the total number of aquatic invasive alien rodents (AIARs) removed in the study area from 2007 to 2022. Variation over time in the total number of (A) coypus removed, (B) muskrats removed, (C) coypus removed per trapper and (D) muskrats removed per trapper. Solid lines represent predicted values extracted from generalized additive models (GAMs) (see Table 1 for details). Significant trends are presented with 95% confidence intervals (dashed lines).
Sustainability 16 01970 g002
Figure 3. Variation over time in the number of trappers engaged in the control activities against aquatic invasive alien rodents (AIARs) in the study area from 2002 to 2022. The solid line represents predicted values extracted from a generalized additive model (GAM) (see Table 1 for details). Significant trends are presented with 95% confidence intervals (dashed lines).
Sustainability 16 01970 g003
Figure 4. Effect of the density of ponds per municipality on the number of coypus (A) and muskrats (B) removed per trapper per year. The solid lines represent predicted values extracted from linear models (see Table 2 for details). The exponential relationships are presented with 95% confidence intervals (dashed lines).
Sustainability 16 01970 g004
Figure 5. Effect of the amount of woodland per municipality on the number of coypus removed per trapper per year. The solid line represents predicted values extracted from the linear model (see Table 2 for details). The exponential relationship is presented with 95% confidence intervals (dashed lines).
Sustainability 16 01970 g005
Figure 6. Effect of the density of road per municipality on the number of coypus removed per trapper per year. The solid line represents predicted values extracted from the linear model (see Table 2 for details). The linear relationship is presented with 95% confidence intervals (dashed lines).
Sustainability 16 01970 g006
Table 1. Statistics related to the smoothing effect of time (i.e., year) from 2007 to 2022 of generalized additive models (GAMs) on the total number of alien invasive aquatic rodents (AIARs) removed, distinguishing coypus and muskrats, number of trappers and AIARs removed per trapper. Each GAM is presented with the approximate χ2 value, the estimated degree of freedom (est.df), the p-value (p) and the deviance explained. Significant p-values are mentioned in bold.
Variablesχ2est.dfpDeviance Explained
Number of coypus removed48.882.952<0.00180.3
Number of muskrats removed71.493.488<0.00185.6
Number of trappers22.913.144<0.00170.7
Number of coypus removed per trapper107.31.741<0.00193.6
Number of muskrats removed per trapper6.1071.8910.05072.5
Table 2. Statistics from linear models (LMs) related to the effects of landscape variables (x) extracted in the 26 municipalities on the number of alien invasive aquatic rodents (AIARs) removed in 2018, distinguishing coypus (y1) and muskrats (y2). Three models, including linear, curvilinear and exponential relationships (i.e., on the log-transformed y), were tested, and the best-fitting model was presented. Each LM is presented with the Fisher value (F), p-value (p) and adjusted R squared (R2). The estimate and standard error (θ1 ± SE) are presented when the landscape variables (x) significantly affect y (p ≤ 0.05). The two degrees of freedom of the Fisher test are 1 and 24, respectively. For the amount of woodland, a considers all municipalities, whereas b does not consider NUA municipality with an uncommon value of 55%. Significant p-values are mentioned in bold.
Variables in the Municipality (x)Number of Coypus Removed per Trapper (y1)Number of Muskrats Removed per Trapper (y2)
Modelθ1 ± SE (x)FpR2Modelθ1 ± SE (x)FpR2
Surface of municipality (ha)Ln(y1) = θ0 + θ1.x 1.3970.2510.019y2 = θ0 + θ1.x 0.9380.3440.047
Density of watercourses (m/ha)Ln(y1) = θ0 + θ1.x 2.2840.1470.060y2 = θ0 + θ1.x 0.5700.4590.029
Amount of pond surface (%)Ln(y1) = θ0 + θ1.x 0.9560.3400.050y2 = θ0 + θ1.x 2.539 ± 1.2124.3860.0490.145
Density of ponds (nb/100 ha)Ln(y1) = θ0 + θ1.x 0.264 ± 0.1224.6420.0440.154Ln(y2) = θ0 + θ1.x 0.665 ± 0.2357.9720.0110.259
Density of water infrastructures (nb/ha)y1 = θ0 + θ1.x 0.2110.6500.008y2 = θ0 + θ1.x 1.2790.2720.013
Amount of human-settled areas (%)y1 = θ0 + θ1.x 3.6550.0710.117y2 = θ0 + θ1.x 0.7680.3910.038
Amount of cereal (%)y1 = θ0 + θ1.x 0.0010.9840.001Ln(y2) = θ0 + θ1.x 0.1430.7090.007
Amount of woodland aLn(y1) = θ0 + θ1.x −0.037 ± 0.0165.2930.0320.217Ln(y2) = θ0 + θ1.x 3.2030.0890.104
Amount of woodland bLn(y1) = θ0 + θ1.x −0.136 ± 0.0565.9890.0250.208Ln(y2) = θ0 + θ1.x 2.6410.1220.122
Amount of pasture (%)Ln(y1) = θ0 + θ1.x 0.9440.3430.047y2 = θ0 + θ1.x 0.0340.8540.002
Density of riparian vegetation (m/ha)y1 = θ0 + θ1.x 0.3110.5830.016Ln(y2) = θ0 + θ1.x 0.8980.3550.045
Density of roads (m/ha)y1 = θ0 + θ1.x4.402 ± 1.8675.5610.0290.226y2 = θ0 + θ1.x 1.5300.2310.074
Disclaimer/Publisher’s Note: The statements, opinions and data contained in all publications are solely those of the individual author(s) and contributor(s) and not of MDPI and/or the editor(s). MDPI and/or the editor(s) disclaim responsibility for any injury to people or property resulting from any ideas, methods, instructions or products referred to in the content.