Article

Research on the Key Influencing Goals for Visual Design Sustainability: A Dual Perspective

1
Department of Visual Communication Design, Huzhou University, Huzhou 313000, China
2
General Department, National and Kapodistrian University of Athens, GR-34400 Euripus Campus, 15772 Athens, Greece
3
Graduate School of Technological and Vocational Education, National Yunlin University of Science and Technology, Douliu 64002, Taiwan
4
Department of Cross Border E-Commerce, Ningbo Polytechnic, Ningbo 315000, China
5
Department of Tourism Management (China-Canada Cooperation), Ningbo Polytechnic, Ningbo 315000, China
*
Author to whom correspondence should be addressed.
Sustainability 2024, 16(5), 1885; https://doi.org/10.3390/su16051885
Submission received: 23 January 2024 / Revised: 14 February 2024 / Accepted: 21 February 2024 / Published: 25 February 2024

Abstract

:
The United Nations established 17 sustainable development goals (SDGs) in 2015, but research on these goals in the visual design industry remains limited. This study introduces a hybrid approach, combining fuzzy analytical hierarchy process (FAHP) and grey rational analysis (GRA) to assess sustainable factors from the perspectives of both service providers and consumers. In the FAHP model, consumers and visual design professionals had similar views on the ranking of dimensions and indicators. Both reported that the most important dimension for visual design sustainability is the environment. However, the perspective of consumers differed from that of visual design practitioners in the GRA model, as consumers argued that the social aspect has the greatest impact on visual design sustainability, while practitioners believed that the environmental aspect is the most important. The main contribution of the study is to emphasise that the hybrid multi-criteria decision-making (MCDM) mode can help the visual design industry align its services to consumer expectations. A systematic and objective model that presents practical insights relevant to industry is offered by this model. It also serves as a valuable reference for future research in similar areas.

1. Introduction

Visual design seeks to captivate, inspire, and encourage people to engage with messages in order to achieve positive outcomes. These outcomes are aligned with the objectives of the organisation commissioning the design, whether it is to reinforce brand identity or drive sales. Objectives may include changing behaviour, advocating messages, or disseminating information. The process of visual design involves strategic planning, incorporating market research, creativity, problem solving, and technical expertise in areas such as colour theory, layout, typography, and visual hierarchy. Visual designers communicate ideas and information through a variety of media, using both traditional tangible skills and strategic design thinking to establish credibility and effectively influence target audiences in design and marketing contexts [1,2,3]. In the meantime, Albadi et al. [4] and Martins et al. [5] reported that the concept of visual design encompasses a broader spectrum, including posters, typography, illustration, web design, packaging design, and visual identity design, all of which find application in various sectors within the creative industries. Also, Huang [6] presented new perspectives on the positioning and capability needs of the visual design industry in the post-epidemic era. She mentioned that visual design industry practitioners should continue to improve their cross-disciplinary skills, especially techniques related to achieving sustainable development goals, in order to meet new challenges and opportunities in the post-epidemic era.
In 2022, Li [7] addressed the overlooked perspective of employee perception in design’s impact on brand equity in 2022. This is one of the latest studies to explore the concept of green design from the perspective of employees in the post-epidemic era. It examined how green design concepts influence employee perceptions and behaviours. The results indicated that green design elements influence employee perceptions, which in turn promote positive behaviour and brand equity, mediated by green design concepts.
As global attention on caring for the health of the planet and ensuring shared prosperity for humanity continues to grow, the United Nations (UN) established a set of global goals [8]. These goals are known as the 17 Sustainable Development Goals (SDGs), which are further broken down into 169 specific targets that detail the content of each SDG [9]. Since then, much related research has been developed and published. For example, Zamora-Polo et al. [10,11] proposed some case studies on the application of the SDGs in higher education. They have found that higher education institutions can raise students’ awareness of the SDGs with the right pedagogical framework. Meanwhile, university students majoring in education and health-related disciplines are more attentive to the SDGs and perform better than students in other disciplines. Also, Nakamura et al. [12] proposed a case study in 2023 for the investigation of people’s willingness to participate in energy and environment-related policy issues in Japan and Taiwan through use of the Morality-as-Cooperation Questionnaire (MAC-Q). They mentioned that Taiwanese respondents had a better understanding of environmental issues and a greater willingness to engage in civil dialogue, a more positive attitude towards dialogue, and a broader scope of cooperation than Japanese respondents. The research work of Nakamura et al. [12] is one of the latest research results on the willingness of Japanese and Taiwanese people to participate in the SDGs. Moreover, Chang et al. [13] investigated the coverage of the SDGs in university course syllabi in Kaohsiung. They reported that the relationship between university curriculum syllabuses and SDGs depended on the subject characteristics and diversity of the university.
Furthermore, some scholars [14,15,16,17] explored the relationship between the service industry and SDGs from the perspective of service quality. Among them, Stamenkov et al. [14] used a sustainable service quality measurement model for the online service industry and contributed to the realisation of SDGs in the online service industry. Ozdemir et al. [15] proposed the concept of sustainable service quality in higher education by developing a set of measurement tools from the perspective of campus services. The views of Ozdemir et al. [15] were quite novel at the time and had a guiding role in the implementation of SDGs on higher education campuses. Johnson et al. [16] presented their opinions on improving the sustainable service competitiveness of Thai telecom operators. Enquist et al. [17] proposed a value-based sustainable service quality evaluation method for commercial services. They reported that the core values of a company play an important inspiring role in improving the sustainability of the company.
In addition, some scholars proposed relevant research results from the perspective of creative and design industries. For example, Tu [18] proposed sustainable approaches and suggestions of the product design industry. Clark et al. [19] discussed the sustainable trend of product design and development. They reported that ecological design factors will be an important indicator for the future industrial design industry to achieve SDGs. Goubran et al. [20] proposed a novel analytical drawing tool to help architectural designers achieve the SDGs, which can inform architectural practice in the private and public sectors and contribute to the theory and practice of sustainable building design. Fan et al. [21] utilised the Porter’s Diamond Model as a research tool to put forward strategies and suggestions for the sustainable development of China’s animation industry from multiple aspects such as production, demand, supply chain, corporate strategy, cultural factors, and government. Chen et al. [22] collaborated with designers to create a board game on the SDGs. Their findings are not only one of the most recent studies to introduce a design approach to the field of education in the post-coronavirus era, but also prove that games can be effective in promoting the SDGs, whether they are used in the classroom or played outside the classroom, by stimulating players’ interest in the SDGs.
Although the above research has provided relevant suggestions for achieving SDGs for many industries from many perspectives, unfortunately, the related research on sustainable development goals for the visual design industry is still insufficient. Most visual design practitioners do not know which SDGs are important to consumers. Accordingly, it is necessary to assess the priority of sustainable development goals to provide the decision-making suggestions for the sustainable development of the visual design industry in the future.
In view of this, this research attempts to analyse and rank SDGs from the dual perspective of service providers and consumers for the visual design industry. Subsequently, we compared the differing perspectives of visual design practitioners and consumers, thereby providing the related decision-making suggestions to the visual design industry for achieving SDGs.
Accordingly, this study establishes the framework for the prioritisation of sustainable development goals from expert questionnaires. Afterwards, the fuzzy analytic hierarchy process (FAHP) and grey rational analysis (GRA) were simultaneously implemented to assess and rank the SDGs from the perspective of visual design practitioners and consumers to achieve the above research objectives.

2. Literature Review

The issue is referred to as multi-criteria decision making (MCDM) when a decision-maker must assess numerous factors to select from various methodologies [23,24]. Li et al. [25] noted that a notable benefit of MCDM methods is that decision-makers can allocate significant emphasis to risk and profit while assigning minimal emphasis to other factors. Kou et al. [26] used methods for the examination and computation of limited samples. They illustrated the efficiency of MCDM technology in addressing various MCDM-related concerns.
Additionally, customer contentment stands out as one of the most prevalent terms in the corporate sphere. To ensure customer contentment, a methodical approach is essential to quantify consumer desires into data to fulfil customer needs.
Two MCDM methods, fuzzy analytic hierarchy process (FAHP) and grey rational analysis (GRA), were implemented by this study. Thus, the relevant content of these two approaches are explored and discussed in this chapter as follows:

2.1. Fuzzy Analytic Hierarchy Process

Analytic hierarchy process (AHP) was proposed by Saaty in 1980 [27]. It is one of the most complete techniques for solving MCDM issues in many areas and has been confirmed by many studies [28,29,30]. This method can better systematise complex issues, decomposing them at different levels to make a comprehensive evaluation after quantitative judgment [31,32,33].
Meanwhile, some scholars have applied AHP to the sustainable design field. For example, Arukala et al. [34] presented a case study of sustainability performance assessment of the built environment in India using AHP. They found that applying the AHP method to assess the sustainability performance of the built environment in developing countries is effective and feasible. Also, Dai et al. [35] proposed an integrated method of AHP and QFD from the perspective of sustainable development to provide relevant suggestions for suppliers to achieve sustainable development goals. Moreover, Tu et al. [36] utilised Theoria Resheneyva Isobretatelskehuh Zadach (TRIZ) and AHP to establish sustainable development rules for product design and to contribute to the realisation of sustainable development goals in the product design industry.
Although AHP can be used to address the above problems, unfortunately, it falls short when it comes to explaining problems that involve uncertain phenomena or imprecise solutions. Therefore, Chang [37] first proposed integrated techniques consisting of fuzzy theory and AHP in 1996, called Fuzzy AHP (FAHP), which is used to handle and calculate decision-making problems caused by imprecise phenomena. Since then, FAHP has been widely applied and proven as a highly reliable and valid research method on MCDM problems [38,39,40,41,42].
In the view of this, some scholars have applied FAHP to find answers to questions related to sustainable development within these decades. For example, Larimian et al. [43] developed a FAHP model for the evaluation of sustainable environment design factors in Tehran city. They discovered that factors related to environment design are the most vital scheme for promoting environmental sustainability by establishing a sense of ownership and responsibility in citizens. Rehman et al. [44] used FAHP as a research tool to put forward relevant strategies and suggestions for the manufacturing industry to achieve SDGs. Wang et al. [45] proposed a case study on the sitting of renewable energy power plants in Vietnam using a hybrid approach of FAHP, data envelopment analysis (DEA), and The Technique for Order of Preference by Similarity to Ideal Solution (TOPSIS). Mostafa et al. [46] evaluated the forest management plans by implementing FAHP. Alyamani et al. [47] utilised FAHP to assess and select a sustainable project. They found that the most important criterion to consider in sustainable project selection was project cost, followed by novelty and uncertainty. Pan [48] applied FAHP to the evaluation and selection of sustainable bridge engineering methods, demonstrating the feasibility of FAHP in solving problems in the field of sustainable engineering. Ashour et al. [49] applied FAHP to explore the obstacles that the interior design industry may encounter in achieving SDGs. They reported that sufficient sustainable design modules, effective design specifications, and client interest in SDGs are important factors for the interior design industry to remove obstacles and achieve SDGs.
The above research results demonstrated the feasibility of applying FAHP to the fields of sustainable design, engineering, energy, and business. In addition, it was a major inspiration for this study’s application of the FAHP method for the prioritisation of sustainable development goals in the visual design industry.

2.2. Grey Rational Analysis

Grey rational analysis (GRA) was proposed by Deng in 1982 [50]. Its primary focus lies in addressing system models characterised by uncertainty or incomplete information. This approach is adept at managing “uncertainty”, “multivariate input data”, or “discrete” information through techniques such as system correlation analysis, model development, predictive analysis, and decision making [51].
In the meantime, GRA finds necessary information from some known and unclear conditions through parameter correlation and then clarifies the interactive relationship between parameters. Afterwards, the degree of correlation between the two series is indicated by the degree of grey correlation [52]. Therefore, these features make GRA an effective method for solving MCDM problems with multiple attributes or with multiple scenarios [53,54,55,56].
Also, Hu et al. [57] and Javanmardi et al. [58] reported that GRA is very suitable in its application to solve sustainable development issues. Muhammad Muneeb et al. [59] proposed a case study of the Pakistan telecommunication industry for achieving SDGs using GRA. Liu et al. [60] implemented GRA to analyse and develop the general sustainability indicators for the Australian renewable energy industry. They found that their general indicators are suitable for the sustainability assessment of four systems with different combinations of grid, solar photovoltaic, and wind renewable energy.
Moreover, Bai et al. [61] evaluated the sustainability of the supplier chain using GRA. The main contribution of their research was to introduce an analysis and application of the method, as well as a clear assessment and insights into the sustainability attributes of the supply chain industry for providing relevant recommendations for the supply chain industry to achieve the SDGs. Manjunatheshwara et al. [62] proposed a decision-making model for the sustainable materials selection of tablet device enclosure based on GRA. Zheng et al. [63] applied GRA to evaluate the energy-saving performance of the building industry, demonstrating the feasibility of using GRA for the sustainable development of the building industry.
Furthermore, Gumus et al. [64] proposed a fuzzy-based hybrid approach of AHP and GRA for solving the problems of the energy-saving industry. Zhang et al. [65] proposed an algorithm to evaluate load balancing in a hybrid wireless environment using FAHP and GRA. Paul et al. [66] and Ilangkumaran et al. [67] applied the hybrid model of FAHP and GRA to mutual fund performance evaluation and wastewater treatment technology.

2.3. Summary

According to the chapter of the literature review, it is known that FAHP and GRA are effective techniques for solving MCDM problems in sustainability fields. Meanwhile, Chang et al. [68] reported that FAHP is a well-known MCDM method that incorporates fuzzy theory, addressing the uncertainty, complexity, and ambiguity inherent in the problem itself and in expert opinions, leading to a more realistic and reasonable identification of key influencing factors. FAHP avoids overly subjective and imprecise results from pairwise comparisons and is particularly useful when dealing with numerous decision factors, representing a fuzzy interval of collective expert judgement.
Also, Tang et al. [69] and Huang et al. [70] have highlighted five advantages of GRA: (1) it can serve as a non-functional sequence model, (2) its computational method is straightforward, (3) it does not require a large data set, (4) the data need not conform to a normal distribution, and (5) it does not produce conflicting results with quantitative analysis.
Moreover, the integrated approaches of FAHP and GRA contribute to interdisciplinary research. However, the main difference between the FAHP and GRA models is that the evaluation criteria in the FAHP model are obtained by integrating and analysing expert opinions. In view of this, the disadvantage of such models is that they rely on expert experience and are prone to subjective opinions.
Hence, many researchers [71,72,73] suggested the utilisation of GRA as another way to assess the importance of evaluation indicators, thus avoiding interference with the result by the subjective opinion of experts.
Accordingly, this research establishes an evaluation framework to prioritise the SDGs for the visual design industry based on the expert questionnaire. Afterwards, the perspectives of visual design practitioners and consumers were collected by questionnaires of pairwise comparison and direct rating. Finally, FAHP and GRA were implemented simultaneously to calculate and rank all SDGs for achieving the main research purposes.

3. Methods

In this study, a hybrid approach of FAHP and GRA was proposed for the prioritisation of sustainable development goals for the visual design industry. The research process is shown in Figure 1.

3.1. The Construction of the Hierarchy Structure

In this study, the problem is decomposed into evaluation dimensions and indicators in accordance with AHP. In addition, Tsai et al. [74] suggested that the description of dimensions and indicators should be revised through expert discussion. Therefore, this study used expert questionnaires to obtain expert opinions to revise dimensions and indicators according to experts’ suggestions to make the expression of evaluation criteria conform to the specificity of sustainable development goals for the visual design industry. Finally, we constructed a hierarchical structure of evaluation dimensions and indicators in accordance with the results of the expert questionnaire.

3.2. Questionnaire Development and Measurement

This research utilised the expert questionnaire method to obtain and gather research data for calculating the overall weight (OW) and grey rational grade (GRG) of each dimension and indicator in the hierarchy structure, according to FAHP and GRA methods. Therefore, there was a need for the consideration of validity before development in terms of questionnaire development. In the view of this, this study rewrote the questionnaire statement on the basis of expert advice and kept the original representation of dimensions and indicators in order to maintain high content validity [75]. In addition, this study conducted a pre-test and revised the statements according to the results of the pre-test to check whether the meaning of the questionnaire was clear.
As for the number of experts, F. J. Parenté and J. K. Anderson-Parenté [76] suggested that there should be at least ten experts or more. Interestingly, Darko et al. [77] mentioned that a large sample size may not be helpful, due to “cold-called” experts being able to profoundly affect the results of the consistency examination. Meanwhile, this study found that much of the research [78,79,80,81,82,83] utilised a small sample size of four to nine experts to obtain a valuable and reliable decision-making basis.
Accordingly, a total of 40 experts were selected by this research to avoid the influence of opinions from “cold-called” experts on the consistency evaluation results, thus achieving our main research objectives.

3.3. Fuzzy Analytic Hierarchy Process

3.3.1. Fuzzy Theory and Linguistic Variables

Herreva et al. [84] claimed that linguistic variables such as “very important”, “somewhat important”, and “not important” are commonly used to describe how people perceive the importance of a particular matter. However, Zimmermann [85] noted that these linguistic variables used to express the priority of human psychological perception are often imprecise. It is therefore necessary to incorporate fuzzy theory to provide a more accurate account of human perception of these issues.
Fuzzy theory was proposed by Dr. Lotfi Zadeh in 1965 [86]. It is an algorithm that works with fuzzy numbers, introducing a concept such as reasoning to discover the result that is closest to the variable of the human psychological perception.
Therefore, this research studied fuzzy numbers and found that fuzzy numbers are often expressed in mathematical way [87,88,89,90,91,92,93,94]. For example, triangular fuzzy number A can be defined as (l, m, u). The parameters l, m and u represent the smallest, the most promising, and the largest values, respectively. The triangular fuzzy number A (l, m, u) given by the following equation is shown in Figure 2.
μ A ˜ x = x l m l , l x m x u u m , m x u 0 , otherwise ,
Meanwhile, much research [87,88,89,90,91,92,93,94,95] mentioned that the most likely evaluation value of triangular fuzzy numbers is the crisp value. The crisp value of triangular fuzzy numbers is given by the following equation:
A a = l a , m a = m l a u m a + u ,
where a is index values.
Additionally, Buckley [96] pointed out that the attributes of triangular fuzzy numbers are advantageous in accurately representing human fuzzy psychological perception variables by converting fuzzy numbers into precise and pragmatic figures. Moreover, Pedrycz [97] has demonstrated that triangular fuzzy numbers are highly suitable for expressing the level of relative psychological perception and assessment of each criterion and alternative within the hierarchy and network structure. Consequently, triangular fuzzy numbers are employed to depict the linguistic variable scales in this study.
Furthermore, AHP employed a nine-point rating scale to signify the significance of each assessment criterion. As a result, we integrated the triangular fuzzy number and AHP assessment scale to evaluate and gauge human psychological true preferences for specific choices. The corresponding fuzzy numbers are detailed in Table 1.

3.3.2. Synthesising Opinions of All Experts

In this paper, the method of geometric mean was utilised to generalise the results of expert questionnaires, largely because Saaty [98] considered the fact that the geometric mean method is not easily affected by extreme values. Therefore, the consolidation result of all expert opinions is calculated by the following equation:
i = 1 n x i 1 n = x 1 x 2 x n n ,
where n is the number of experts.

3.3.3. Setting Up the Fuzzy Pairwise Comparison Matrix

In this step, a fuzzy pairwise comparison matrix is performed and presented as follows:
A k ˜ = a 11 k ˜ a 12 k ˜ a 1 n k ˜ a 21 k ˜ a 22 k ˜ a 2 n k ˜ a n 1 k ˜ a n 2 k ˜ a n n k ˜ ,
where A k ˜ represents the fuzzy pairwise comparison matrix and a n n k ˜ is the triangular fuzzy mean value for comparing priority pairs among elements.

3.3.4. The Calculation of Fuzzy Geometric Mean ( r ˜ i ) and Fuzzy Weight ( w ˜ i )

The calculation of fuzzy geometric mean and fuzzy weight is as follows:
r ˜ i = l 1 l 2 , , l i 1 i ,   m 1 m 2 , , m i 1 i ,   u 1 u 2 , , u i 1 i ,
w ˜ i = r ˜ i r ˜ 1 r ˜ 2 r ˜ n 1 = l w i ,   m w i ,   u w i ,
where lwi is the smallest value of triangular fuzzy weight, mwi is the median value of triangular fuzzy weight, and uwi is the largest value of triangular fuzzy weight.

3.3.5. Defuzzification

In terms of fuzzy decomposition, the “centre of area” (COA) method [99] is applied for defuzzification. The process of fuzzy decomposition is as follows:
w i = l w i + m w i + u w i 3 ,

3.3.6. Normalisation

Afterwards, the de-fuzzified weights (wi) are normalised using the following equation to obtain the weighted total as 1.
ω i = w i w i

3.3.7. Consistency Check

Saaty [100] proposed adopting the consistency index (C.I.) and consistency ratio (C.R.) to verify the consistency of the comparison matrix. The C.I. and C.R. are defined as follows:
C . I . = λ m a x n n 1 ,
where λ m a x is the maximum value of the matrix and n is the number of criteria.
C . R . = C . I . R . I . ,
Random index (R.I.) is a consistency index that is produced by positive reciprocal matrices of different orders. Table 2 shows the values of random index.
When C . I . 0.1 , it refers to the best acceptable error. When C . R . 0.1 , it means that the consistency of the matrix is satisfactory.

3.4. Grey Rational Analysis

3.4.1. The Definition of Evaluation Indicators and Data Treatment

In this research, the direct rating (with a rating from 1 to 9, with a higher value indicating better the ability) is implemented to measure all dimensions and indicators. Therefore, experts are asked to assign scores according to the importance degree of each dimension and indicator. In this way, the importance degree of each dimension and indicator in the hierarchy can be assessed.

3.4.2. The Calculation of Referential Series and Compared Series

The referential series (x0) with the number of indicators (n) is defined as follows:
x 0 = x 0 1 , x 0 2 , , x 0 n
The compared series (xi) is defined as follows:
x i = x i 1 , x i 2 , , x i n ,     i = 1 , 2 , , m

3.4.3. Normalisation

Afterwards, the data of referential series and compared series should be normalised in order to make them comparable. In this research, the larger the scores of all criteria, the better. Thus, the process of normalisation for referential series and compared series is expressed as follows [101]:
x i * k = x i k min k x i k max k x i k min k x i k ,
where max k x i k is the maximum value of k indicator and min k x i k represents the minimum value of k indicator.

3.4.4. Calculate the Difference between Referential Series and Compared Series

The series difference is calculated as follows:
Δ 0 i k = x 0 k x i k ,     k = 1 , 2 , , 18 ,
where x0 (k) is the referential series of 18 evaluation indicators and xi (k) represents the compared series of 18 evaluation indicators.

3.4.5. Calculating the Grey Rational Coefficient

The grey relational coefficient between the compared series (xi) and the referential series (x0) at the j t h indicator is defined as follows:
γ 0 i k = Δ min + ζ Δ max Δ 0 i k + ζ Δ max

3.4.6. The Calculation of the Grey Rational Grade

The grey rational grade (GRG) of a series (xi) is calculated as follows:
Γ 0 i = k = 1 n ω k γ 0 i k
Finally, the alternatives are prioritised based on the magnitude of GRG values ( Γ 0 i ). The alternative with the largest GRG value represents the best alternative, and so on.

4. Results

4.1. The Construction of Hierarchy Structure

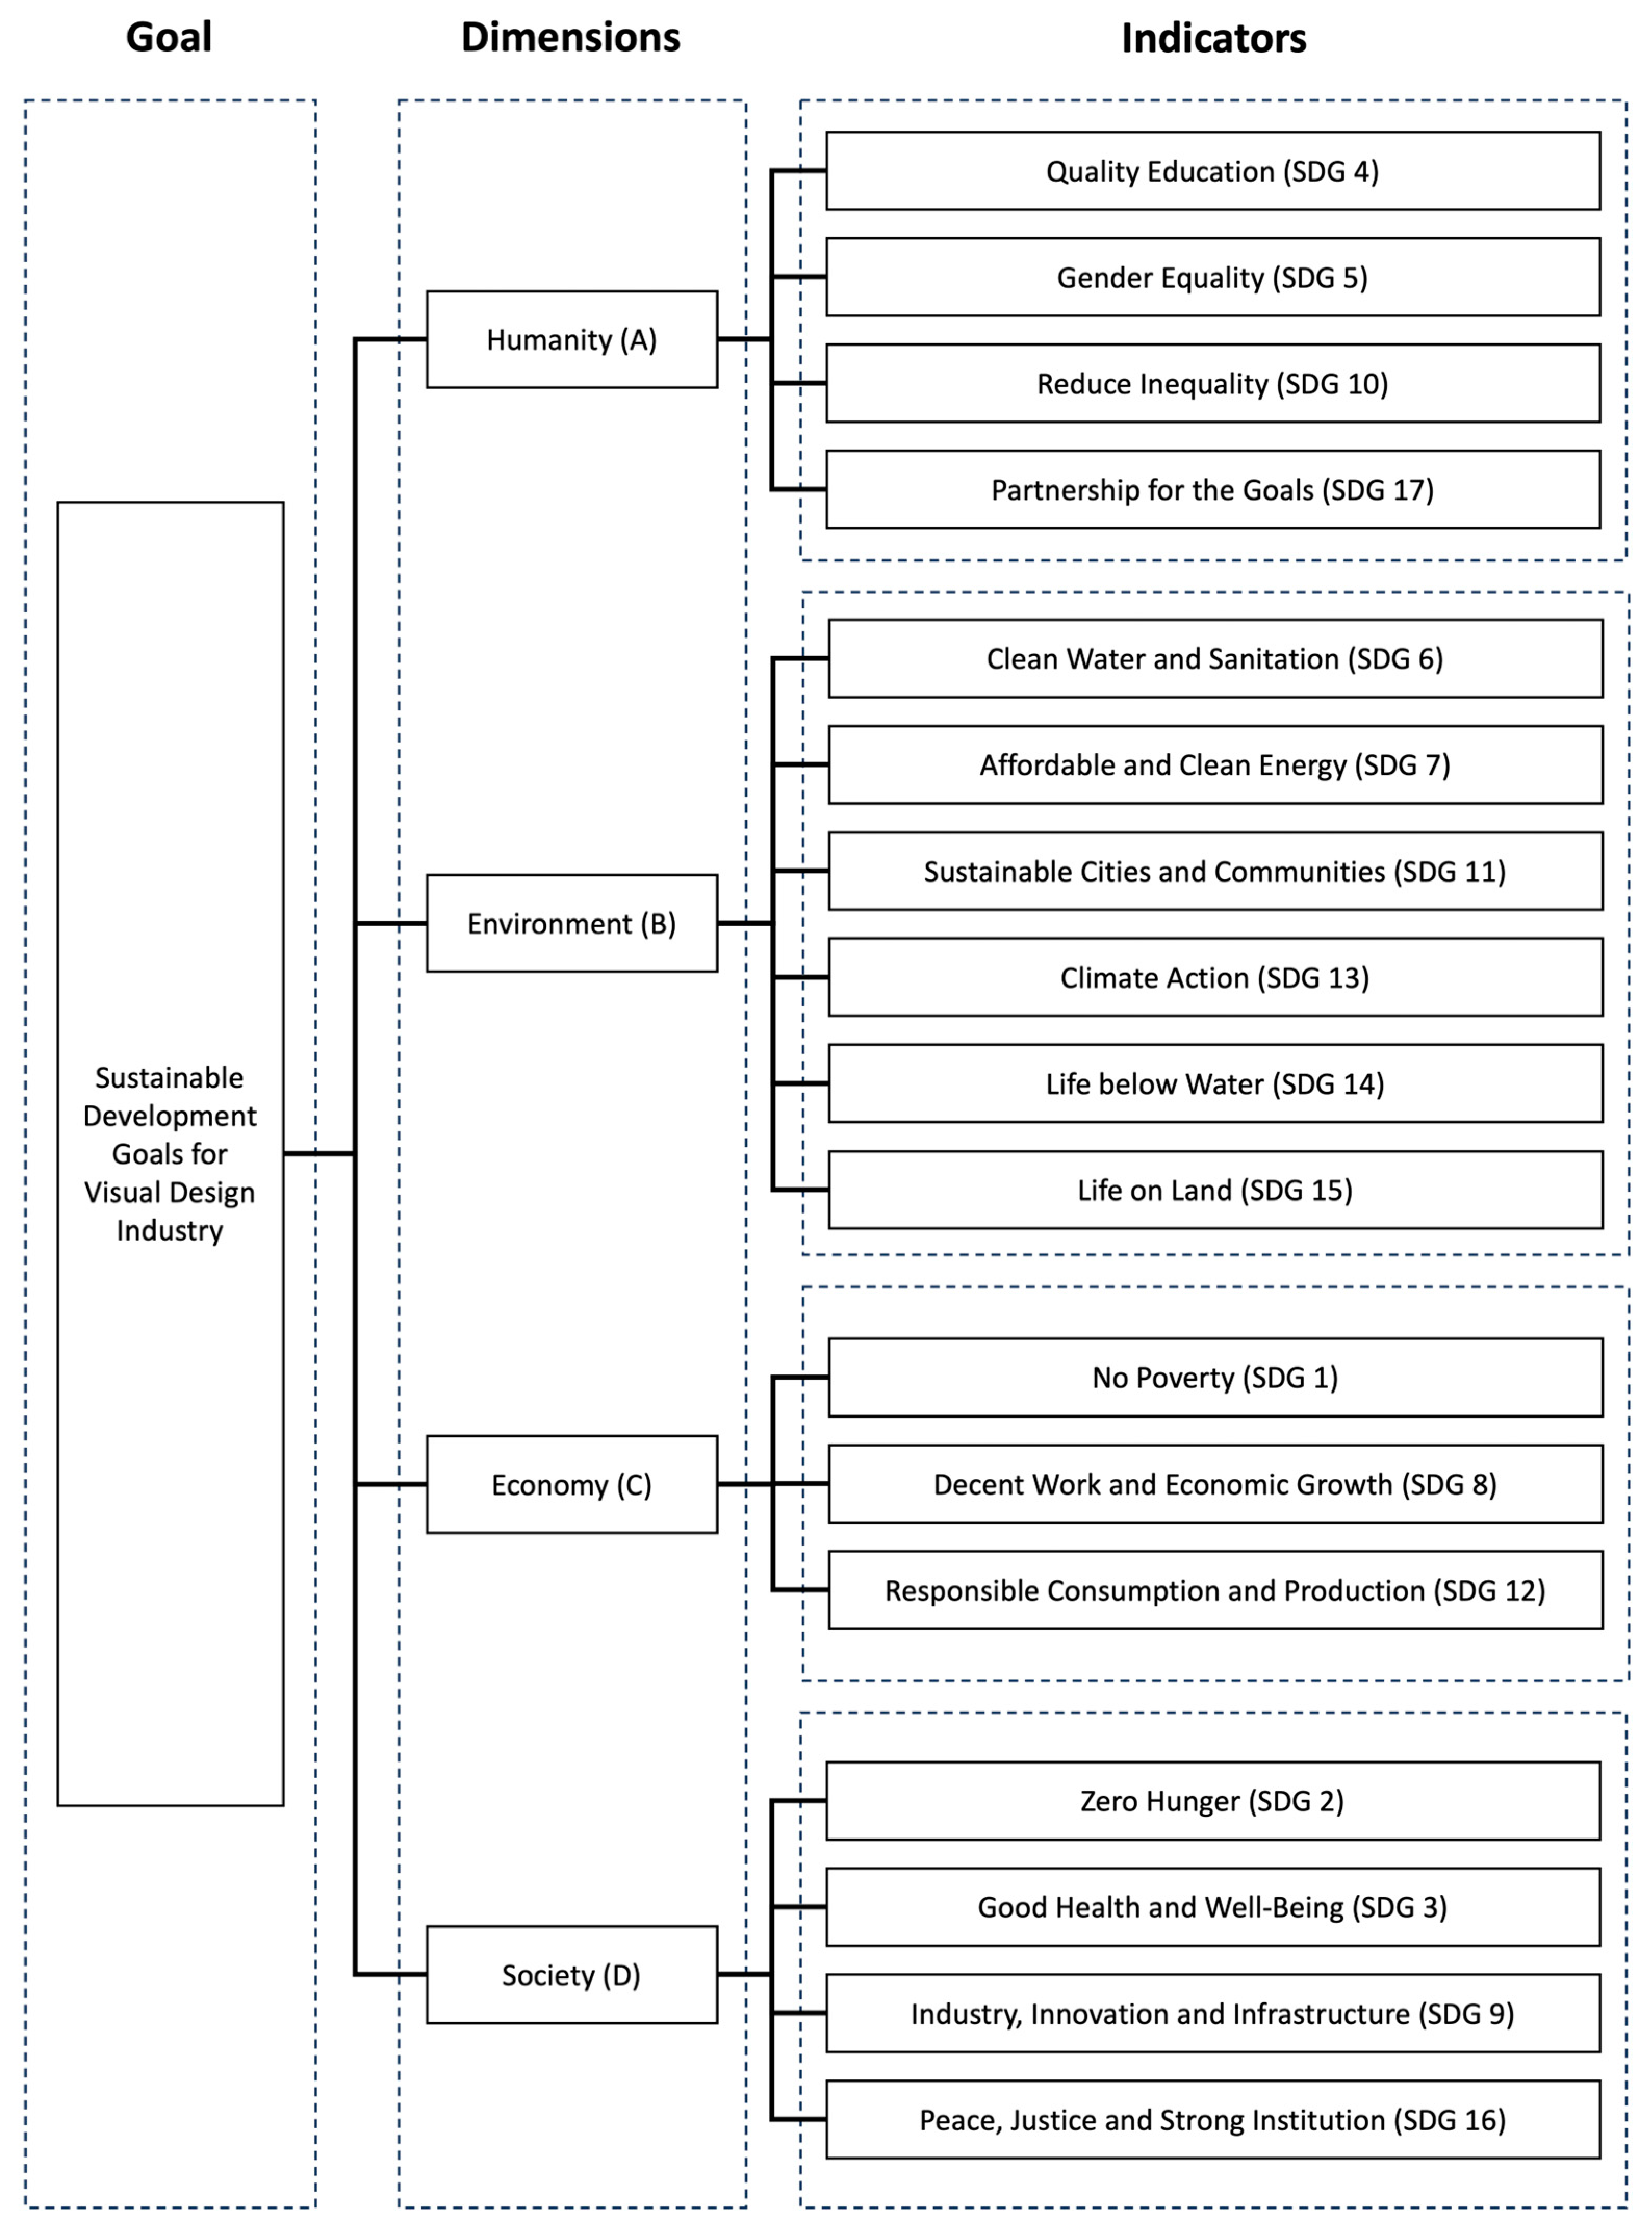
Firstly, a total of seven experts were invited to form a focus group for this research. Of these, two were senior managers in visual-design-related industries, three were senior creative directors, and the other two were senior visual designers. Next, the focus group members discussed the 17 UN SDGs based on their professional experiences. They then conducted an inductive analysis of the 17 UN SDGs and classified them into three main dimensions. Subsequently, focus group members summarised the 17 UN SDGs into evaluation sub-criteria of the above three aspects based on characteristics of SDGs to form the initial hierarchy structure of this research.
Despite the initial hierarchy structure, a pre-test was carried out to check and evaluate whether the semantic description and classification of the main aspects and sub-criteria were clear and appropriate. A total of 65 expert consultation questionnaires were issued, and a total of 38 valid questionnaires were returned. We found that most of those experts argued that the number of main dimensions in the preliminary hierarchy should be increased and that the classification of the sub-criteria should be adjusted. In addition, most respondents reported that economic and humanistic factors should be properly considered as they are more suitable as the main dimensions for assessing the sustainable development goals of the visual design industry.
Accordingly, this research invited another ten experts to revise the representation of the main dimensions in the hierarchy and the classification of the sub-criteria based on the results of the pre-test survey. For example, in the pre-test, some respondents had different views on the classification of SDGs, such as “gender equality” (SDG 5) and “good health and well-being” (SDG 3). As a result, ten experts examined each SDG one by one and discussed the differences between the SDGs based on the UN definition and their own professional experience. Subsequently, based on the UN definition of SDG 3 and SDG 5 and the description of the detailed indicators, more than half of the experts believed that SDG 3 requires the government, health units, and social institutions to invest resources to complete the task of this indicator. As for SDG 5, most experts argued that it actually requires everyone to work together. Therefore, experts believe that SDG 3 is more appropriate as a sub-criterion for assessing the society aspect, while SDG 5 is more appropriate as a sub-criterion for assessing the humanity dimension. Subsequently, the four main dimensions in the hierarchy were identified as humanity, environment, economy, and society based on the experts’ suggestions, while the classification of the sub-criteria was modified by the experts based on the characteristics of the 17 UN SDGs.
Subsequently, the evaluation structure of sustainable development goals for the visual design industry was constructed, including 4 main dimensions and 17 sub-criteria, as shown in Figure 3.

4.2. Questionnaire Development and Measurement

After the hierarchy structure was obtained, we inputted the evaluation dimensions and sub-criteria in the hierarchy structure into the Super Decision 3.2 to create a pairwise comparison questionnaire on a nine-point evaluation scale. The results of pairwise comparison questionnaires were analysed by fuzzy AHP. Meanwhile, a direct rating scale questionnaire was established in this study. The results of direct rating scale questionnaires were analysed by GRA.
In this study, a total of 100 expert consultation questionnaires, including 50 pairwise comparison questionnaires and 50 direct rating scale questionnaires, were issued from 9 February 2022 to 10 October 2022. The questionnaire respondents were divided into two groups, namely, the service provider group and the consumer group. Among them, the consumer group consisted of 50 consumers, and the service provider group consisted of 50 experts with rich visual design experience.
A total of 40 valid questionnaires were then recovered, including 20 valid paired comparison questionnaires and 20 valid direct rating scale questionnaires.

4.3. Numerical Analysis

4.3.1. Fuzzy Analytic Hierarchy Process

After collecting valid pairwise comparison questionnaires, the opinions of all respondents, including service providers and consumers, were integrated through use of Equation (3). Afterwards, the fuzzy pairwise comparison matrix for all criteria from the FAHP model was established using Equation (4).
The triangular fuzzy number matrix of the four main dimensions derived from the dual perspective of service providers and consumers is shown in Table 3.
The calculation of fuzzy geometric mean values for all dimensions from the perspectives of service providers and consumers using Equation (5) is shown in Table 4.
Equation (6) was then used to calculate the fuzzy weight ( w ˜ i ) of each dimension from the dual view of service providers and consumers, as shown in Table 5.
In terms of fuzzy decomposition, Equation (7) was used to calculate the de-fuzzified weight of each dimension from dual perspective of service providers and consumers during defuzzification, as shown in Table 6.
Afterwards, Equation (8) was used to calculate the normalised weights for all dimensions from the dual perspective of service providers and consumers, as shown in Table 7.
Since the number of main dimensions was four, we obtained n = 4 and R.I. = 0.90. Thus, consistency index (C.I.) and consistency ratio (C.R.) were calculated using Equations (9) and (10). The calculation processes of C.I. and C.R. were as follows:
λ m a x = 4.131 + 3.936 + 4.270 + 3.963 4 = 4.075
C . I . = λ m a x n n 1 = 4.075 4 4 1 = 0.025
C . R . = C . I . R . I . = 0.025 0.90 = 0.0278
Subsequently, Table 8 revealed the calculation results of the triangular fuzzy number matrix for each dimension from the perspectives of service providers and consumers, including normalised weights ( ω i ), consistency index (C.I.), and consistency ratio (C.R.).
The calculation process of the triangular fuzzy number matrix for the remaining criteria is analogous to the above calculation method. Finally, the calculation results of the triangular fuzzy number matrix for the remaining criteria from the dual perspective of service providers and consumers are shown in Table A1, Table A2, Table A3 and Table A4 (Appendix A). As shown in Table A1, Table A2, Table A3 and Table A4 (Appendix A), consistency index (C.I.) and consistency ratio (C.R.) for all criteria were less than 0.1. This means that the data in the pairwise comparison matrix were consistent.

4.3.2. Grey Rational Analysis

In this research, the larger the scores of all dimensions and indicators given by experts, the better. Thus, the largest value of each criterion was considered as a referential series (x0), and the values of all dimensions and indicators were considered as compared series (xi). The referential series (x0) and compared series (xi) of all dimensions and indicators from the dual perspective of service providers and consumers are shown in Table 9 and Table 10.
The normalised data of dimensions and indicators were then calculated using Equation (13). Afterwards, Equations (14) and (15) were utilised to calculate the deviation sequences and grey rational coefficient of all dimensions and indicators. Finally, the calculation results of the normalised data, deviation sequences, and the grey rational coefficient of all dimensions and indicators are shown in Table A5, Table A6, Table A7, Table A8, Table A9 and Table A10 (Appendix A).

4.4. Research Results

4.4.1. Fuzzy Analytic Hierarchy Process

In terms of the hierarchy of dimensions and indicators in the FAHP model, their ranking was determined by their overall weight (OW), not defuzzied weight. In this study, all data from the FAHP model were entered into Super Decisions software. This software was developed by Prof. Saaty [102], the inventor of the analytic hierarchy process (AHP), and is suitable for obtaining the OW of all criteria. The OW for all criteria was then derived from the dual perspective of service provider and consumer. Figure 4 and Figure 5 illustrated the OW and ranking of all dimensions and indicators from the dual perspective of service providers and consumers.
As shown in Figure 4, the comprehensive viewpoints of service providers prioritised the top three aspects as environment (0.506), society (0.294), and humanity (0.130). Meanwhile, from the all-encompassing standpoint of consumers, the utmost crucial dimension was the environment (0.521), trailed by humanity (0.280) and society (0.124). Intriguingly, both service providers and consumers shared the perspective that the dimension of the economy is relatively less significant.
As shown in Figure 5, the top three overall weights of indicators from the comprehensive opinions of service providers were “climate action” (SDG 13, 0.184), “good health and well-being” (SDG 3, 0.158), and “clean water and sanitation” (SDG 6, 0.13). In the comprehensive opinions of consumers, the overall weight of the indicator was highest for “climate action” (SDG 13, 0.227), followed by “reducing inequality” (SDG 10, 0.158) and “clean water and sanitation” (SDG 6, 0.095).
Subsequently, the overall weight of indicators ranked fourth to sixth from the comprehensive opinions of service providers were “sustainable cities and communities” (SDG 11, 0.075); “peace, justice and strong institution” (SDG 16, 0.071); and “reduce inequality” (SDG 10, 0.070). As for the overall weight of indicators ranked fourth to sixth from the perspective of consumers, they were “gender equality” (SDG 5, 0.064), “good health and well-being” (SDG 3, 0.063), and “sustainable cities and communities” (SDG 11, 0.059).

4.4.2. Grey Rational Analysis

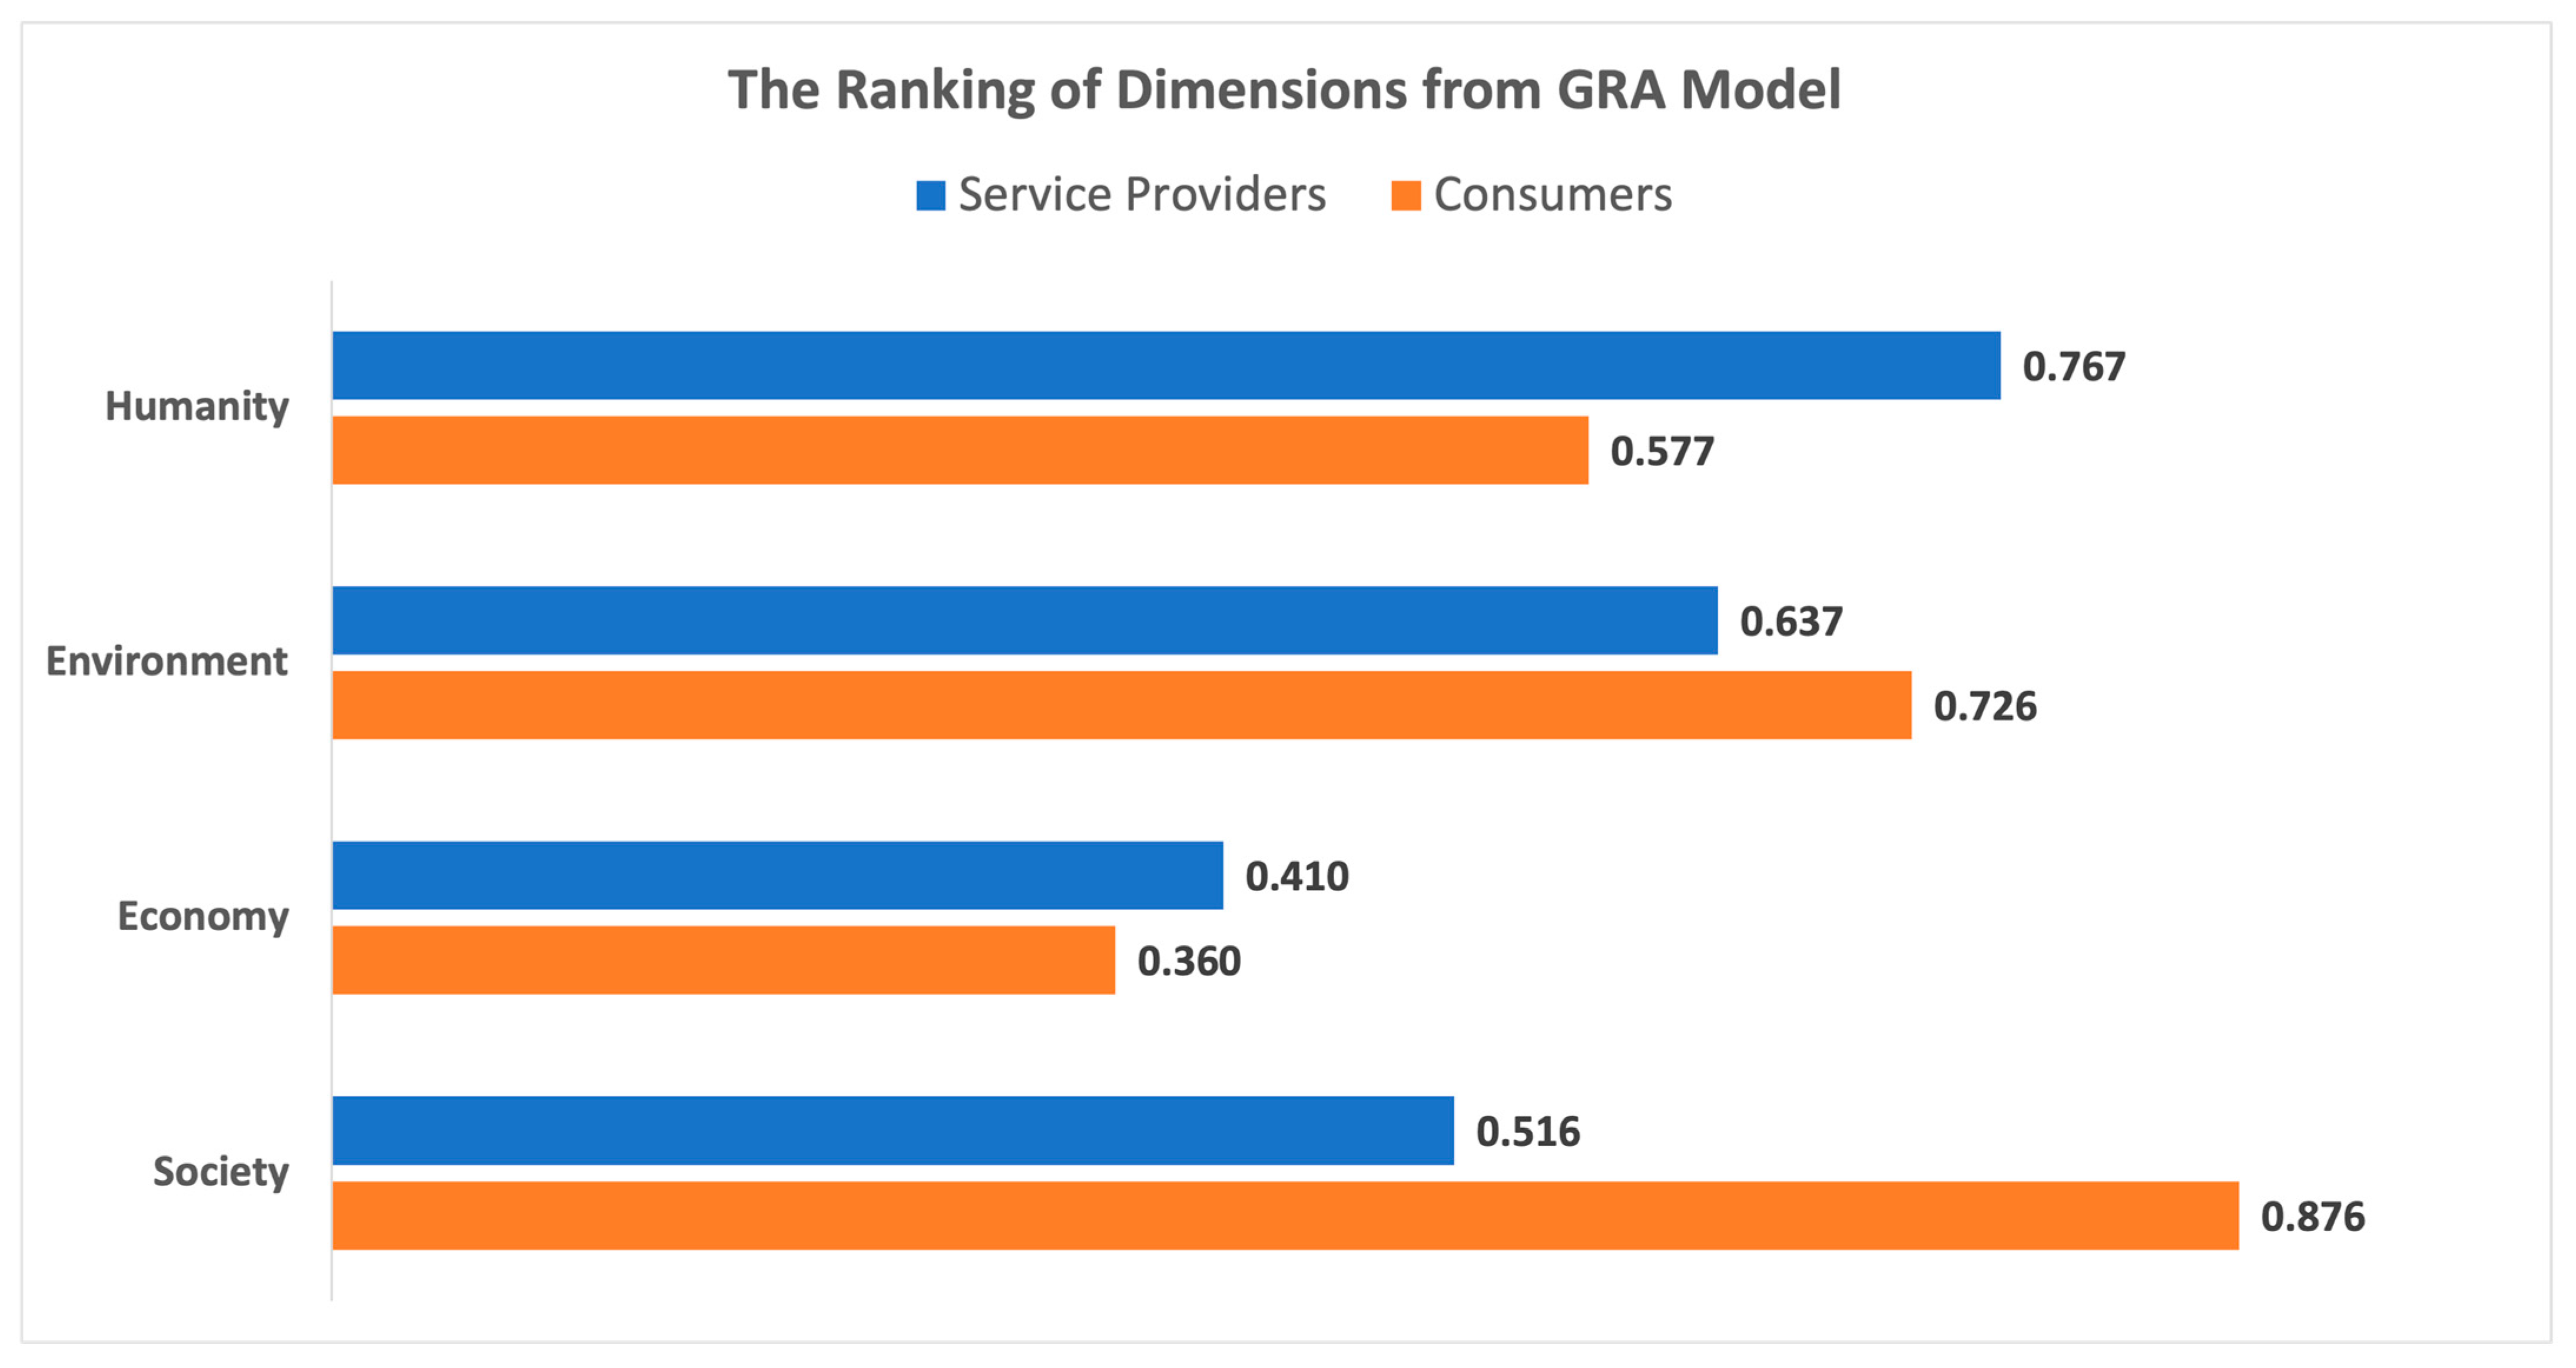
The importance of all dimensions and indicators was based on grey rational grade (GRG, Γ 0 i ). The calculation of the GRG for all dimensions and indicators from the dual perspective of service providers and consumers using Equation (16) is shown in Figure 6 and Figure 7.
As shown in Figure 6, based on the GRG, the ranking of all dimensions from the comprehensive opinions of service providers were humanity (0.767), environment (0.637), society (0.516), and economy (0.410). In the meantime, the most important dimension based on GRG from the comprehensive perspective of consumers was society (0.876), followed by environment (0.726), humanity (0.577), and economy (0.360).
As shown in Figure 7, the comprehensive perspective of service providers revealed that the three most important indicators were “reduce inequality” (SDG 10, 0.927), “life on land” (SDG 15, 0.732), and “quality education” (SDG 4, 0.702). Also, the comprehensive perspective of consumers illustrated that the top indicator was “good health and well-being” (SDG 3, 0.915), followed by “climate action” (SDG 13, 0.860) and “sustainable cities and communities” (SDG 11, 0.749).
Subsequently, the indicators ranked fourth to sixth from the comprehensive opinions of service providers were “clean water and sanitation” (SDG 6, 0.665), “life below water” (SDG 14, 0.634), and “gender equality” (SDG 5, 0.070). As for the indicators ranked fourth to sixth from the comprehensive perspective of consumers, they were “industry, innovation and infrastructure” (SDG 9, 0.715); “reduce inequality” (SDG 10, 0.587); and “responsible consumption and production” (SDG 12, 0.542).

5. Discussion, Suggestions, and Research Limitations

5.1. Discussion and Suggestions

In this research, an integrated method of FAHP and GRA was applied to evaluate and analyse the importance and prioritisation of the UN SDGs for the visual design industry. According to the FAHP model, both visual design practitioners and consumers agreed that environmental concerns are paramount to achieving sustainability for the visual design industry. However, the GRA model revealed slight discrepancies between the perspectives of visual design practitioners and consumers. While visual design practitioners emphasised the importance of the environmental dimension, consumers argued that the visual design practitioners should prioritise the societal dimension to for achieving the SDGs.
In terms of indicator ranking, the FAHP model showed a relatively consistent perspective among visual design practitioners and consumers. They collectively prioritised “climate action” (SDG 13) and “clean water and sanitation” (SDG 6) as the crucial indicators. Conversely, the GRA model revealed subtle differences in views. The visual design practitioners recognised the importance of “reduce inequality” (SDG 10), “life on land” (SDG 15), and “quality education” (SDG 4) for visual design sustainability, while consumers placed greater emphasis on “good health and well-being” (SDG 3), “climate action” (SDG 13), and “sustainable cities and communities” (SDG 11).
Matzler et al. [103] proposed factor structures of customer satisfaction in 2002, namely, basic factor, performance factor, and excitement factor. They considered that the basic needs of customers must be identified and fulfilled. In this study, environment and society were found to be the most two significant dimensions by analysing the comprehensive opinions in FAHP and GRA models. Meanwhile, the indicators in the order of OW and GRG in the environment and society dimensions were “climate action”; “clean water and sanitation”; “sustainable cities and communities”; “good health and well-being”; “industry, innovation and infrastructure”; and “peace, justice and strong institution”. In this context, basic consumer needs include measures to combat extreme climate, quality drinking water, the conditions for building sustainable cities, and action for good health and well-being.
Accordingly, this study suggests that visual design professionals should use their own strengths and technologies and use visual means to create engaging visual works, such as posters or illustrations, to raise people’s concern about the impact of extreme climate on the environment and the need for clean drinking water. Meanwhile, in the process of packaging design, visual design practitioners can choose environmentally friendly materials to reduce the environmental burden and create conditions for building a sustainable city. This study also suggests that visual design practitioners might attempt to form cross-industry alliances with educational and social institutions to make the public more aware of the detailed indicators of SDG 3 through cross-disciplinary lectures or design workshops to mobilise the public to actively participate for promoting measures and policies related to good health and well-being.

5.2. Research Limitation

This research method combined FAHP and GRA. In the pairwise comparison of the importance of the indicators, the value of C.I. and C.R. was used to verify their progression and consistency. In GRA models, experts evaluated the dimensions and indicators. The research results are based on the opinions of the experts. This is the limitation of this research and the research methods of FAHP and GRA, so this research was especially commissioned by richly experienced experts filling the questionnaire.
Meanwhile, over half of the experts who participated in filling out the questionnaire were Taiwanese professionals related to the visual design industry. Also, the age of the experts participating in the survey ranged from 35 to 55 years. Among them, 81.44% were male, and the rest were female. Hence, the results of this study are applicable to Taiwan’s visual design industry and can be used as an important reference and guide for Taiwan’s visual design industry to achieve the SDGs in the future.

6. Conclusions

In this study, the dual perspective of visual design service providers and consumers was analysed and evaluated using a hybrid MCDM approach.
In the FAHP model, consumers and visual design practitioners had basically the same views on the ranking of aspects and indicators. Both believed that the environment is the most important aspect for the visual design industry to achieve the SDGs. Meanwhile, SDG 13 and SDG 6 were unanimously recognised by consumers and visual design practitioners as having an important impact on the sustainability of visual design in the FAHP model.
In the GRA model, consumers and visual design professionals had different opinions on the ranking of dimensions and indicators. Consumers believed that society was the most important aspect, while visual design professionals argued that the environmental dimension was the most important for visual design sustainability. In addition, visual design service providers believed that the top three indicators were SDG 10, SDG 15, and SDG 4, while the consumers pointed out that SDG 3 was the most important indicator for them, followed by SDG 13 and SDG 11.
The scientific contribution of this work presents the usefulness of the proposed hybrid MCDM model and points out how such integrated methods (FAHP and GRA) can help to understand the dual perspective of service providers and consumers for achieving visual design sustainability. Practically, this study reveals that visual design practitioners can use the decision-making model of this study to meet sustainable needs to reduce risks and making informed decisions.
Overall, the integrated operations performed in this study were logically coherent, practical, and functional. In addition to establishing a systematic and objective general model of selection in the context of this study and reflecting the characteristics of the conditions to meet practical needs, it can also serve as a reference for future studies in similar fields.

Author Contributions

All authors contributed equally. All authors have read and agreed to the published version of the manuscript.

Funding

This research received no external funding.

Institutional Review Board Statement

Not applicable.

Informed Consent Statement

Not applicable.

Data Availability Statement

Data are contained within the article.

Conflicts of Interest

The authors declare no conflicts of interest.

Appendix A

Table A1. Triangular fuzzy number matrix for the humanity criteria.
PerspectiveService Providers
IndicatorsSDG 4SDG 5SDG 10SDG 17 ω i
SDG 4(1, 1, 1)(1/3, 1/2, 1)(2, 3, 4)(1/4, 1/3, 1/2)0.178
SDG 5(1, 2, 3)(1, 1, 1)(3, 4, 5)(1/3, 1/2, 1)0.293
SDG 10(1/4, 1/3, 1/2)(1/5, 1/4, 1/3)(1, 1, 1)(1/6, 1/5, 1/4)0.073
SDG 17(2, 3, 4)(1, 2, 3)(4, 5, 6)(1, 1, 1)0.457
Total1
λ m a x = 4.0511 ,   C . I . = 0.0181 ,   C . R . = 0.0202
PerspectiveConsumers
IndicatorsSDG 4SDG 5SDG 10SDG 17 ω i
SDG 4(1, 1, 1)(1, 2, 3)(2, 3, 4)(1/3, 1/2, 1)0.285
SDG 5(1/3, 1/2, 1)(1, 1, 1)(1, 2, 3)(1/5, 1/4, 1/3)0.154
SDG 10(1/4, 1/3, 1/2)(1/3, 1/2, 1)(1, 1, 1)(1/4, 1/3, 1/2)0.109
SDG 17(1, 2, 3)(3, 4, 5)(2, 3, 4)(1, 1, 1)0.451
Total1
λ m a x = 4.0101 ,   C . I . = 0.0337 ,   C . R . = 0.0374
Table A2. Triangular fuzzy number matrix for the environment criteria.
PerspectiveService Providers
IndicatorsSDG 6SDG 7SDG 11SDG 13SDG 14SDG 15 ω i
SDG 6(1, 1, 1)(1/5, 1/4, 1/3)(1/4, 1/3, 1/2)(1, 2, 3)(1/4, 1/3, 1/2)(1/4, 1/3, 1/2)0.073
SDG 7(3, 4, 5)(1, 1, 1)(2, 3, 4)(3, 4, 5)(1, 2, 3)(2, 3, 4)0.346
SDG 11(2, 3, 4)(1/4, 1/3, 1/2)(1, 1, 1)(3, 4, 5)(1/3, 1/2, 1)(1/4, 1/3, 1/2)0.133
SDG 13(1/3, 1/2, 1)(1/5, 1/4, 1/3)(1/5, 1/4, 1/3)(1, 1, 1)(1/5, 1/4, 1/3)(1/4, 1/3, 1/2)0.053
SDG 14(2, 3, 4)(1/3, 1/2, 1)(1, 2, 3)(3, 4, 5)(1, 1, 1)(1, 1, 1)0.203
SDG 15(2, 3, 4)(1/4, 1/3, 1/2)(2, 3, 4)(2, 3, 4)(1, 1, 1)(1, 1, 1)0.192
Total1
λ m a x = 6.3099 ,   C . I . = 0.062 ,   C . R . = 0.05
PerspectiveConsumers
IndicatorsSDG 6SDG 7SDG 11SDG 13SDG 14SDG 15 ω i
SDG 6(1, 1, 1)(1/4, 1/3, 1/2)(1, 1, 1)(2, 3, 4)(1/3, 1/2, 1)(1/4, 1/3, 1/2)0.109
SDG 7(2, 3, 4)(1, 1, 1)(1, 2, 3)(3, 4, 5)(2, 3, 4)(2, 3, 4)0.342
SDG 11(1, 1, 1)(1/3, 1/2, 1)(1, 1, 1)(4, 5, 6)(1, 1, 1)(1, 1, 1)0.165
SDG 13(1/4, 1/3, 1/2)(1/5, 1/4, 1/3)(1/6, 1/5, 1/4)(1, 1, 1)(1/6, 1/5, 1/4)(1/5, 1/4, 1/3)0.044
SDG 14(1, 2, 3)(1/4, 1/3, 1/2)(1, 1, 1)(4, 5, 6)(1, 1, 1)(1, 1, 1)0.167
SDG 15(2, 3, 4)(1/4, 1/3, 1/2)(1, 1, 1)(3, 4, 5)(1, 1, 1)(1, 1, 1)0.173
Total1
λ m a x = 6.2712 ,   C . I . = 0.0542 ,   C . R . = 0.0437
Table A3. Triangular fuzzy number matrix for the economy criteria.
PerspectiveService Providers
IndicatorsSDG 1SDG 8SDG 12 ω i
SDG 1(1, 1, 1)(1/4, 1/3, 1/2)(1/5, 1/4, 1/3)0.123
SDG 8(2, 3, 4)(1, 1, 1)(1/3, 1/2, 1)0.334
SDG 12(3, 4, 5)(1, 2, 3)(1, 1, 1)0.543
Total1
λ m a x = 3.0183 ,   C . I . = 0.0091 ,   C . R . = 0.0158
PerspectiveConsumers
IndicatorsSDG 1SDG 8SDG 12 ω i
SDG 1(1, 1, 1)(1, 2, 3)(4, 5, 6)0.555
SDG 8(1/3, 1/2, 1)(1, 1, 1)(3, 4, 5)0.348
SDG 12(1/6, 1/5, 1/4)(1/5, 1/4, 1/3)(1, 1, 1)0.097
Total1
λ m a x = 3.0246 ,   C . I . = 0.0123 ,   C . R . = 0.0212
Table A4. Triangular fuzzy number matrix for the society criteria.
PerspectiveService Providers
IndicatorsSDG 2SDG 3SDG 9SDG 16 ω i
SDG 2(1, 1, 1)(4, 5, 6)(2, 3, 4)(3, 4, 5)0.525
SDG 3(1/6, 1/5, 1/4)(1, 1, 1)(1/5, 1/4, 1/3)(1/4, 1/3, 1/2)0.070
SDG 9(1/4, 1/3, 1/2)(3, 4, 5)(1, 1, 1)(1, 2, 3)0.247
SDG 16(1/5, 1/4, 1/3)(2, 3, 4)(1/3, 1/2, 1)(1, 1, 1)0.158
Total1
λ m a x = 4.1176 ,   C . I . = 0.0399 ,   C . R . = 0.0443
PerspectiveConsumers
IndicatorsSDG 2SDG 3SDG 9SDG 16 ω i
SDG 2(1, 1, 1)(5, 6, 7)(4, 5, 6)(3, 4, 5)0.600
SDG 3(1/7, 1/6, 1/5)(1, 1, 1)(1/3, 1/2, 1)(1/5, 1/4, 1/3)0.074
SDG 9(1/6, 1/5, 1/4)(1, 2, 3)(1, 1, 1)(1, 1, 1)0.144
SDG 16(1/5, 1/4, 1/3)(3, 4, 5)(1, 1, 1)(1, 1, 1)0.182
Total1
λ m a x = 4.1107 ,   C . I . = 0.0380 ,   C . R . = 0.0422
Table A5. Normalised data of each dimension.
PerspectiveService Providers
Expert No.HumanityEnvironmentEconomySociety
11.0000.7500.0000.250
20.5001.0000.0000.750
30.5000.2500.0001.000
41.0000.5000.0000.750
50.0001.0000.0000.500
61.0000.6670.3330.000
71.0000.5000.0000.250
80.0000.5001.0000.000
91.0000.6670.0000.333
101.0000.6670.0000.333
PerspectiveConsumers
Expert No.HumanityEnvironmentEconomySociety
10.2000.6000.0001.000
20.6671.0000.6670.000
30.6670.6670.0001.000
40.5710.7140.0001.000
50.5000.8330.0001.000
60.5001.0000.0001.000
70.6000.8000.0001.000
80.3330.6670.0001.000
91.0000.6670.0000.333
100.7500.8750.0001.000
Table A6. Normalised data of each indicator.
PerspectiveService Providers
Expert No.SDG 1SDG 2SDG 3SDG 4SDG 5SDG 6SDG 7SDG 8SDG 9SDG 10SDG 11SDG 12SDG 13SDG 14SDG 15SDG 16SDG 17
10.5000.3751.0001.0000.8750.6250.5000.3750.2501.0000.8750.7500.8751.0000.8750.3750.000
20.5710.8571.0001.0000.8570.7140.5710.4290.2861.0000.8570.7141.0001.0000.8571.0000.000
30.1250.0000.6250.8751.0000.1250.2500.5000.0000.7500.8750.1250.7500.1250.2500.0000.000
40.1670.3330.8330.8330.6670.6670.5000.3330.0001.0000.8330.3330.6670.1670.1670.0000.000
50.1250.0000.7500.8750.8750.1250.1250.2500.3751.0000.7500.8750.5000.7500.6250.7500.375
60.0000.1250.3750.5000.1250.7500.6250.3751.0000.8750.0000.1250.0000.5000.8750.3750.000
70.0000.1430.0000.7140.2861.0000.5710.4291.0001.0000.0000.1430.7141.0001.0000.4290.000
80.0000.1430.2860.5710.2860.8570.7140.4290.0001.0000.0000.1430.0000.5711.0000.4290.000
90.2500.3750.1250.5000.3751.0000.6250.3751.0000.8750.2500.0000.3750.5000.8750.3750.000
100.0000.1250.2500.5000.2500.7500.6250.3750.3751.0000.2500.6250.5000.2500.8750.3750.000
PerspectiveConsumers
Expert No.SDG 1SDG 2SDG 3SDG 4SDG 5SDG 6SDG 7SDG 8SDG 9SDG 10SDG 11SDG 12SDG 13SDG 14SDG 15SDG 16SDG 17
10.1250.0001.0000.3750.2500.1250.0000.0000.8750.5000.6250.1250.7500.2500.1250.2500.000
20.7140.1431.0000.2861.0000.8570.7140.5711.0000.7141.0000.8570.7140.1430.0000.0000.143
30.3750.5001.0000.6250.7500.1250.1250.0001.0000.8751.0000.2501.0000.1250.1250.0000.000
40.1670.0001.0000.1670.0000.0000.3330.1670.8330.3330.6670.6670.5000.0000.0000.1670.333
50.0000.1250.8750.3750.3750.2500.1250.0001.0000.6251.0000.7501.0000.0000.0000.0000.000
60.0000.1251.0000.5000.1250.7500.6250.3750.0000.6250.0000.8751.0000.5000.8750.3750.000
70.0000.1251.0000.6250.2500.8750.5000.3750.1250.7500.6250.1250.8750.8750.8750.3750.000
80.0000.1251.0000.1250.2500.0000.6250.3750.2500.5000.7500.1251.0000.0000.0000.3750.000
90.3330.5000.8330.6670.1670.3330.8330.5001.0000.6670.8330.0001.0000.6670.1670.5000.000
100.0000.1670.6670.6670.6670.5000.8330.5000.5000.6671.0000.8331.0000.3330.1670.5000.000
Table A7. Deviation sequences of each dimension.
PerspectiveService Providers
Expert No.HumanityEnvironmentEconomySociety
10.0000.2501.0000.750
20.5000.0001.0000.250
30.5000.7501.0000.000
40.0000.5001.0000.250
51.0000.0001.0000.500
60.0000.3330.6671.000
70.0000.5001.0000.750
81.0000.5000.0001.000
90.0000.3331.0000.667
100.0000.3331.0000.667
PerspectiveConsumers
Expert No.HumanityEnvironmentEconomySociety
10.8000.4001.0000.000
20.3330.0000.3331.000
30.3330.3331.0000.000
40.4290.2861.0000.000
50.5000.1671.0000.000
60.5000.0001.0000.000
70.4000.2001.0000.000
80.6670.3331.0000.000
90.0000.3331.0000.667
100.2500.1251.0000.000
Table A8. Deviation sequences of each indicator.
PerspectiveService Providers
Expert No.SDG 1SDG 2SDG 3SDG 4SDG 5SDG 6SDG 7SDG 8SDG 9SDG 10SDG 11SDG 12SDG 13SDG 14SDG 15SDG 16SDG 17
10.5000.6250.0000.0000.1250.3750.5000.6250.7500.0000.1250.2500.1250.0000.1250.6251.000
20.4290.1430.0000.0000.1430.2860.4290.5710.7140.0000.1430.2860.0000.0000.1430.0001.000
30.8751.0000.3750.1250.0000.8750.7500.5001.0000.2500.1250.8750.2500.8750.7501.0001.000
40.8330.6670.1670.1670.3330.3330.5000.6671.0000.0000.1670.6670.3330.8330.8331.0001.000
50.8751.0000.2500.1250.1250.8750.8750.7500.6250.0000.2500.1250.5000.2500.3750.2500.625
61.0000.8750.6250.5000.8750.2500.3750.6250.0000.1251.0000.8751.0000.5000.1250.6251.000
71.0000.8571.0000.2860.7140.0000.4290.5710.0000.0001.0000.8570.2860.0000.0000.5711.000
81.0000.8570.7140.4290.7140.1430.2860.5711.0000.0001.0000.8571.0000.4290.0000.5711.000
90.7500.6250.8750.5000.6250.0000.3750.6250.0000.1250.7501.0000.6250.5000.1250.6251.000
101.0000.8750.7500.5000.7500.2500.3750.6250.6250.0000.7500.3750.5000.7500.1250.6251.000
PerspectiveConsumers
Expert No.SDG 1SDG 2SDG 3SDG 4SDG 5SDG 6SDG 7SDG 8SDG 9SDG 10SDG 11SDG 12SDG 13SDG 14SDG 15SDG 16SDG 17
10.8751.0000.0000.6250.7500.8751.0001.0000.1250.5000.3750.8750.2500.7500.8750.7501.000
20.2860.8570.0000.7140.0000.1430.2860.4290.0000.2860.0000.1430.2860.8571.0001.0000.857
30.6250.5000.0000.3750.2500.8750.8751.0000.0000.1250.0000.7500.0000.8750.8751.0001.000
40.8331.0000.0000.8331.0001.0000.6670.8330.1670.6670.3330.3330.5001.0001.0000.8330.667
51.0000.8750.1250.6250.6250.7500.8751.0000.0000.3750.0000.2500.0001.0001.0001.0001.000
61.0000.8750.0000.5000.8750.2500.3750.6251.0000.3751.0000.1250.0000.5000.1250.6251.000
71.0000.8750.0000.3750.7500.1250.5000.6250.8750.2500.3750.8750.1250.1250.1250.6251.000
81.0000.8750.0000.8750.7501.0000.3750.6250.7500.5000.2500.8750.0001.0001.0000.6251.000
90.6670.5000.1670.3330.8330.6670.1670.5000.0000.3330.1671.0000.0000.3330.8330.5001.000
101.0000.8330.3330.3330.3330.5000.1670.5000.5000.3330.0000.1670.0000.6670.8330.5001.000
Table A9. Grey rational coefficient of each dimension.
PerspectiveService Providers
Expert No.HumanityEnvironmentEconomySociety
11.0000.6670.3330.400
20.5001.0000.3330.667
30.5000.4000.3331.000
41.0000.5000.3330.667
50.3331.0000.3330.500
61.0000.6000.4290.333
71.0000.5000.3330.400
80.3330.5001.0000.333
91.0000.6000.3330.429
101.0000.6000.3330.429
PerspectiveConsumers
Expert No.HumanityEnvironmentEconomySociety
10.3850.5560.3331.000
20.6001.0000.6000.333
30.6000.6000.3331.000
40.5380.6360.3331.000
50.5000.7500.3331.000
60.5001.0000.3331.000
70.5560.7140.3331.000
80.4290.6000.3331.000
91.0000.6000.3330.429
100.6670.8000.3331.000
Table A10. Grey rational coefficient of each indicator.
PerspectiveService Providers
Expert No.SDG 1SDG 2SDG 3SDG 4SDG 5SDG 6SDG 7SDG 8SDG 9SDG 10SDG 11SDG 12SDG 13SDG 14SDG 15SDG 16SDG 17
10.5000.4441.0001.0000.8000.5710.5000.4440.4001.0000.8000.6670.8001.0000.8000.4440.333
20.5380.7781.0001.0000.7780.6360.5380.4670.4121.0000.7780.6361.0001.0000.7781.0000.333
30.3640.3330.5710.8001.0000.3640.4000.5000.3330.6670.8000.3640.6670.3640.4000.3330.333
40.3750.4290.7500.7500.6000.6000.5000.4290.3331.0000.7500.4290.6000.3750.3750.3330.333
50.3640.3330.6670.8000.8000.3640.3640.4000.4441.0000.6670.8000.5000.6670.5710.6670.444
60.3330.3640.4440.5000.3640.6670.5710.4441.0000.8000.3330.3640.3330.5000.8000.4440.333
70.3330.3680.3330.6360.4121.0000.5380.4671.0001.0000.3330.3680.6361.0001.0000.4670.333
80.3330.3680.4120.5380.4120.7780.6360.4670.3331.0000.3330.3680.3330.5381.0000.4670.333
90.4000.4440.3640.5000.4441.0000.5710.4441.0000.8000.4000.3330.4440.5000.8000.4440.333
100.3330.3640.4000.5000.4000.6670.5710.4440.4441.0000.4000.5710.5000.4000.8000.4440.333
PerspectiveConsumers
Expert No.SDG 1SDG 2SDG 3SDG 4SDG 5SDG 6SDG 7SDG 8SDG 9SDG 10SDG 11SDG 12SDG 13SDG 14SDG 15SDG 16SDG 17
10.3640.3331.0000.4440.4000.3640.3330.3330.8000.5000.5710.3640.6670.4000.3640.4000.333
20.6360.3681.0000.4121.0000.7780.6360.5381.0000.6361.0000.7780.6360.3680.3330.3330.368
30.4440.5001.0000.5710.6670.3640.3640.3331.0000.8001.0000.4001.0000.3640.3640.3330.333
40.3750.3331.0000.3750.3330.3330.4290.3750.7500.4290.6000.6000.5000.3330.3330.3750.429
50.3330.3640.8000.4440.4440.4000.3640.3331.0000.5711.0000.6671.0000.3330.3330.3330.333
60.3330.3641.0000.5000.3640.6670.5710.4440.3330.5710.3330.8001.0000.5000.8000.4440.333
70.3330.3641.0000.5710.4000.8000.5000.4440.3640.6670.5710.3640.8000.8000.8000.4440.333
80.3330.3641.0000.3640.4000.3330.5710.4440.4000.5000.6670.3641.0000.3330.3330.4440.333
90.4290.5000.7500.6000.3750.4290.7500.5001.0000.6000.7500.3331.0000.6000.3750.5000.333
100.3330.3750.6000.6000.6000.5000.7500.5000.5000.6001.0000.7501.0000.4290.3750.5000.333

References

  1. Brabham, D.C.; Guth, K.L. The Deliberative Politics of the Consultative Layer: Participation Hopes and Communication as Design Values of Civic Tech Founders. J. Commun. 2017, 67, 445–475. [Google Scholar] [CrossRef]
  2. Satria, H.W.; Tantuah, N.N.; Thoriq, M.A. The Role of a Graphic Designer in the Visual Marketing Team to Accelerate Awareness of Premium Content KumparanPLUS. Proceedings 2022, 83, 40. [Google Scholar] [CrossRef]
  3. Aakhus, M. Communication as Design. Commun. Monogr. 2007, 74, 112–117. [Google Scholar] [CrossRef]
  4. Albadi, N.; Zollinger, S.W. Dominant Learning Styles of Interior Design Students in Generation Z. J. Inter. Des. 2021, 46, 49–65. [Google Scholar] [CrossRef]
  5. Martins, N.; Raposo, D. (Eds.) Communication Design and Branding: A Multidisciplinary Approach; Springer Series in Design and Innovation; Springer Nature Switzerland: Cham, Switzerland, 2023; Volume 32, ISBN 978-3-031-35384-0. [Google Scholar]
  6. Huang, H.-L. Examining the Design Policies and Taiwan’s Visual Design Industry from the Design Ladder Perspective. Ph.D. Thesis, National Cheng Kung University, Tainan, Taiwan, 2021. [Google Scholar]
  7. Li, Y. Design Visual Elements and Brand-Based Equity: Mediating Role of Green Concept. Front. Psychol. 2022, 13, 888164. [Google Scholar] [CrossRef] [PubMed]
  8. United Nations. United Nations Transforming Our World: The 2030 Agenda for Sustainable Development; Resolution Adopted by the General Assembly on 25 September 2015; United Nations: New York, NY, USA, 2015. [Google Scholar]
  9. United Nations. 17 Goals to Transform Our World. 2015. Available online: https://www.un.org/sustainabledevelopment/ (accessed on 18 May 2022).
  10. Zamora-Polo, F.; Sánchez-Martín, J. Teaching for a Better World. Sustainability and Sustainable Development Goals in the Construction of a Change-Maker University. Sustainability 2019, 11, 4224. [Google Scholar] [CrossRef]
  11. Zamora-Polo, F.; Sánchez-Martín, J.; Corrales-Serrano, M.; Espejo-Antúnez, L. What Do University Students Know about Sustainable Development Goals? A Realistic Approach to the Reception of This UN Program Amongst the Youth Population. Sustainability 2019, 11, 3533. [Google Scholar] [CrossRef]
  12. Nakamura, H.; Chen, W.-L. Dialogue and Collaboration for Sustainable Development in Japan and Taiwan: Epistemic Foundation of Partnership toward Sustainable Development Goals. Environ. Sci. Policy 2023, 145, 238–249. [Google Scholar] [CrossRef]
  13. Chang, Y.-C.; Lien, H.-L. Mapping Course Sustainability by Embedding the SDGs Inventory into the University Curriculum: A Case Study from National University of Kaohsiung in Taiwan. Sustainability 2020, 12, 4274. [Google Scholar] [CrossRef]
  14. Stamenkov, G.; Dika, Z. A Sustainable E-Service Quality Model. J. Serv. Theory Pract. 2015, 25, 414–442. [Google Scholar] [CrossRef]
  15. Ozdemir, Y.; Kaya, S.K.; Turhan, E. A Scale to Measure Sustainable Campus Services in Higher Education: “Sustainable Service Quality”. J. Clean. Prod. 2020, 245, 118839. [Google Scholar] [CrossRef]
  16. Johnson, W.C.; Sirikit, A. Service Quality in the Thai Telecommunication Industry: A Tool for Achieving a Sustainable Competitive Advantage. Manag. Decis. 2002, 40, 693–701. [Google Scholar] [CrossRef]
  17. Enquist, B.; Edvardsson, B.; Petros Sebhatu, S. Values-based Service Quality for Sustainable Business. Manag. Serv. Qual. Int. J. 2007, 17, 385–403. [Google Scholar] [CrossRef]
  18. Tu, J.-C. Product Sustainable Design: Green Design in Theory and Practice; Asia-Pacific: Taipei, Taiwan, 2002; ISBN 978-986-7809-03-2. [Google Scholar]
  19. Clark, G.; Kosoris, J.; Hong, L.N.; Crul, M. Design for Sustainability: Current Trends in Sustainable Product Design and Development. Sustainability 2009, 1, 409–424. [Google Scholar] [CrossRef]
  20. Goubran, S.; Cucuzzella, C. Integrating the Sustainable Development Goals in Building Projects. J. Sustain. Res. 2019, 1, 1–43. [Google Scholar] [CrossRef]
  21. Fan, K.-K.; Feng, T.-T. Sustainable Development Strategy of Chinese Animation Industry. Sustainability 2021, 13, 7235. [Google Scholar] [CrossRef]
  22. Chen, F.-H.; Ho, S.-J. Designing a Board Game about the United Nations’ Sustainable Development Goals. Sustainability 2022, 14, 11197. [Google Scholar] [CrossRef]
  23. Kou, G.; Lu, Y.; Shi, Y. Evaluation of Classification Algorithms Using MCDM and Rank Correlation. Int. J. Inf. Technol. Decis. Mak. 2012, 11, 197–225. [Google Scholar] [CrossRef]
  24. Kou, G.; Lin, C.; Chen, Y. Pairwise Comparison Matrix in Multiple Criteria Decision Making. Technol. Econ. Dev. Econ. 2016, 22, 738–765. [Google Scholar] [CrossRef]
  25. Li, G.; Kou, G.; Peng, Y. A Group Decision Making Model for Integrating Heterogeneous Information. IEEE Trans. Syst. Man Cybern. Syst. 2018, 48, 982–992. [Google Scholar] [CrossRef]
  26. Kou, G.; Yang, P.; Peng, Y.; Xiao, F.; Chen, Y.; Alsaadi, F.E. Evaluation of Feature Selection Methods for Text Classification with Small Datasets Using Multiple Criteria Decision-Making Methods. Appl. Soft Comput. 2020, 86, 105836. [Google Scholar] [CrossRef]
  27. Saaty, T.L. The Analytic Hierarchy Process: Planning, Priority Setting, Resources Allocation; McGraw-Hill: New York, NY, USA, 1980. [Google Scholar]
  28. Tseng, H.-E.; Li, R.-K. Analytic Hierarchical Process for Design Alternative Selection. J. Des. 1998, 3, 43–54. [Google Scholar]
  29. Shahin, A.; Mahbod, M.A. Prioritization of Key Performance Indicators: An Integration of Analytical Hierarchy Process and Goal Setting. Int. J. Product. Perform. Manag. 2007, 56, 226–240. [Google Scholar] [CrossRef]
  30. Tu, J.-C.; Chang, Y.-C. Strategy of Sustainable Product Development by Applying Analytic Hierarchy Process (AHP). Kaohsiung Norm. Univ. J. 2006, 21, 139–153. [Google Scholar]
  31. Saaty, T.L. Decision Making for Leaders: The Analytic Hierarchy Process for Decisions in a Complex World; RWS publications: Pittsburgh, PA, USA, 1980. [Google Scholar]
  32. Lee, Y.-C.; Ho, M.-C. A Study on the Weighting of Indicators for Image Design. J. Des. 2011, 16, 41–64. [Google Scholar]
  33. Chen, W.-L.; Chen, T.-H. The Establishment and Analysis of Evaluation Index in Sportswear Design. J. Des. 2007, 12, 79–95. [Google Scholar]
  34. Arukala, S.R.; Pancharathi, R.K.; Pulukuri, A.R. Evaluation of Sustainable Performance Indicators for the Built Environment Using AHP Approach. J. Inst. Eng. India Ser. A 2019, 100, 619–631. [Google Scholar] [CrossRef]
  35. Dai, J.; Blackhurst, J. A Four-Phase AHP–QFD Approach for Supplier Assessment: A Sustainability Perspective. Int. J. Prod. Res. 2012, 50, 5474–5490. [Google Scholar] [CrossRef]
  36. Tu, J.-C.; Chen, H.-C.; Guan, S.-S. Development of Green Innovative Strategy by Applying the Triz Theory and AHP Method. J. Sci. Technol. 2015, 24, 71–83. [Google Scholar]
  37. Chang, D.-Y. Applications of the Extent Analysis Method on Fuzzy AHP. Eur. J. Oper. Res. 1996, 95, 649–655. [Google Scholar] [CrossRef]
  38. Hsu, Y.; Lee, C.; Kreng, V.B. The Application of Fuzzy Delphi Method and Fuzzy AHP in Lubricant Regenerative Technology Selection. Expert Syst. Appl. 2010, 37, 419–425. [Google Scholar] [CrossRef]
  39. Kaganski, S.; Majak, J.; Karjust, K. Fuzzy AHP as a Tool for Prioritization of Key Performance Indicators. Procedia CIRP 2018, 72, 1227–1232. [Google Scholar] [CrossRef]
  40. Kwong, C.K.; Bai, H. A Fuzzy AHP Approach to the Determination of Importance Weights of Customer Requirements in Quality Function Deployment. J. Intell. Manuf. 2002, 13, 367–377. [Google Scholar] [CrossRef]
  41. Lam, K.C.; Lam, M.C.K.; Wang, D. MBNQA–Oriented Self-Assessment Quality Management System for Contractors: Fuzzy AHP Approach. Constr. Manag. Econ. 2008, 26, 447–461. [Google Scholar] [CrossRef]
  42. Nguyen, P.-H. A Fuzzy Analytic Hierarchy Process (FAHP) Based on SERVQUAL for Hotel Service Quality Management: Evidence from Vietnam. J. Asian Financ. Econ. Bus. 2021, 8, 1101–1109. [Google Scholar]
  43. Larimian, T.; Zarabadi, Z.S.S.; Sadeghi, A. Developing a Fuzzy AHP Model to Evaluate Environmental Sustainability from the Perspective of Secured by Design Scheme—A Case Study. Sustain. Cities Soc. 2013, 7, 25–36. [Google Scholar] [CrossRef]
  44. Rehman, A.U.; Mian, S.H.; Umer, U.; Usmani, Y.S. Strategic Outcome Using Fuzzy-AHP-Based Decision Approach for Sustainable Manufacturing. Sustainability 2019, 11, 6040. [Google Scholar] [CrossRef]
  45. Wang, C.-N.; Nguyen, V.T.; Thai, H.T.N.; Duong, D.H. Multi-Criteria Decision Making (MCDM) Approaches for Solar Power Plant Location Selection in Viet Nam. Energies 2018, 11, 1504. [Google Scholar] [CrossRef]
  46. Mostafa, M.; Hatami, N.; Espahbodi, K.; Asadi, F. Fuzzy Analytic Hierarchy Process (FAHP) Applied to Evaluating the Forest Management Approaches. J. For. Sci. 2022, 68, 263–276. [Google Scholar] [CrossRef]
  47. Alyamani, R.; Long, S. The Application of Fuzzy Analytic Hierarchy Process in Sustainable Project Selection. Sustainability 2020, 12, 8314. [Google Scholar] [CrossRef]
  48. Pan, N.F. Fuzzy AHP Approach for Selecting the Suitable Bridge Construction Method. Autom. Constr. 2008, 17, 958–965. [Google Scholar] [CrossRef]
  49. Ashour, M.; Mahdiyar, A.; Haron, S.H.; Hanafi, M.H. Barriers to the Practice of Sustainable Interior Architecture and Design for Interior Renovations: A Parsimonious-Cybernetic Fuzzy AHP Approach. J. Clean. Prod. 2022, 366, 132958. [Google Scholar] [CrossRef]
  50. Deng, J.-L. Control Problems of Grey Systems. Syst. Control Lett. 1982, 1, 288–294. [Google Scholar] [CrossRef]
  51. Deng, J.-L. Introduction to Grey System. J. Grey Syst. 1989, 1, 1–24. [Google Scholar]
  52. Huang, S.-W.; Lin, Y.-C.; Liao, C.-H. Applying Analytic Hierarchy Process (AHP) and Grey Relational Analysis (GRA) to Purchase Factors of University Students for Smart Phones. J. Technol. 2016, 31, 193–208. [Google Scholar]
  53. Hinduja, A.; Pandey, M. Comparative Study of MCDM Methods under Different Levels of Uncertainty. Int. J. Inf. Decis. Sci. 2021, 13, 16–41. [Google Scholar] [CrossRef]
  54. Wang, Q.B.; Peng, A.H. Developing MCDM Approach Based on GRA and TOPSIS. Appl. Mech. Mater. 2010, 34–35, 1931–1935. [Google Scholar] [CrossRef]
  55. Asjad, M.; Talib, F. Selection of Optimal Machining Parameters Using Integrated MCDM Approaches. Int. J. Adv. Oper. Manag. 2018, 10, 109–129. [Google Scholar] [CrossRef]
  56. Esangbedo, M.O.; Xue, J.; Bai, S.; Esangbedo, C.O. Relaxed Rank Order Centroid Weighting MCDM Method With Improved Grey Relational Analysis for Subcontractor Selection: Photothermal Power Station Construction. IEEE Trans. Eng. Manag. 2022, 1–18. [Google Scholar] [CrossRef]
  57. Hu, M.; Liu, W. Grey System Theory in Sustainable Development Research—A Literature Review (2011−2021). Grey Syst. Theory Appl. 2022, 12, 785–803. [Google Scholar] [CrossRef]
  58. Javanmardi, E.; Liu, S.; Xie, N. Exploring Grey Systems Theory-Based Methods and Applications in Sustainability Studies: A Systematic Review Approach. Sustainability 2020, 12, 4437. [Google Scholar] [CrossRef]
  59. Muhammad Muneeb, F.; Karbassi Yazdi, A.; Wanke, P.; Yiyin, C.; Chughtai, M. Critical Success Factors for Sustainable Entrepreneurship in Pakistani Telecommunications Industry: A Hybrid Grey Systems Theory/ Best-Worst Method Approach. Manag. Decis. 2020, 58, 2565–2591. [Google Scholar] [CrossRef]
  60. Liu, G.; Baniyounes, A.M.; Rasul, M.G.; Amanullah, M.T.O.; Khan, M.M.K. General Sustainability Indicator of Renewable Energy System Based on Grey Relational Analysis. Int. J. Energy Res. 2013, 37, 1928–1936. [Google Scholar] [CrossRef]
  61. Bai, C.; Sarkis, J. Integrating Sustainability into Supplier Selection with Grey System and Rough Set Methodologies. Int. J. Prod. Econ. 2010, 124, 252–264. [Google Scholar] [CrossRef]
  62. Manjunatheshwara, K.J.; Vinodh, S. Grey-Based Decision-Making Method for Sustainable Material Selection of Tablet Device Enclosure. Clean Techn Env. Policy 2018, 20, 2345–2356. [Google Scholar] [CrossRef]
  63. Zheng, G.; Jing, Y.; Huang, H.; Gao, Y. Application of Improved Grey Relational Projection Method to Evaluate Sustainable Building Envelope Performance. Appl. Energy 2010, 87, 710–720. [Google Scholar] [CrossRef]
  64. Gumus, A.T.; Yayla, A.Y.; Çelik, E.; Yildiz, A. A Combined Fuzzy-AHP and Fuzzy-GRA Methodology for Hydrogen Energy Storage Method Selection in Turkey. Energies 2013, 6, 3017–3032. [Google Scholar] [CrossRef]
  65. Zhang, D.; Zhang, Y.; Lv, N.; He, Y. An Access Selection Algorithm Based on GRA Integrated with FAHP and Entropy Weight in Hybrid Wireless Environment. In Proceedings of the 2013 7th International Conference on Application of Information and Communication Technologies, Baku, Azerbaijan, 23–25 October 2013; pp. 1–5. [Google Scholar]
  66. Paul, T.K.; Pal, M.; Jana, C. Portfolio Selection as a Multicriteria Group Decision Making in Pythagorean Fuzzy Environment with GRA and FAHP Framework. Int. J. Intell. Syst. 2022, 37, 478–515. [Google Scholar] [CrossRef]
  67. Ilangkumaran, M.; Sakthivel, G.; Sasirekha, V. Waste Water Treatment Technology Selection Using FAHP and GRA Approaches. Int. J. Environ. Waste Manag. 2014, 14, 392–413. [Google Scholar] [CrossRef]
  68. Chang, W.-S.; Yin, M.-C. A Study on the Construction of Science Education Website Evaluation Indicators from the Perspective of Learning Strategy. Contemp. Educ. Res. Q. 2014, 22, 47–91. [Google Scholar]
  69. Tang, L.-L.; Fan, C.-H. The Application of Oversea Investment Evaluation with Grey Relational Analysis. Web J. Chin. Manag. Rev. 1999, 2, 1–14. [Google Scholar]
  70. Lin, S.-Y.; Huang, Z.-C. Prioritizing the Business Reputation in Software Industry by the Grey Relational Analysis. Manag. Sci. Res. 2005, 2, 17–33. [Google Scholar]
  71. Wang, T.-K.; Zhang, Q.; Chong, H.-Y.; Wang, X. Integrated Supplier Selection Framework in a Resilient Construction Supply Chain: An Approach via Analytic Hierarchy Process (AHP) and Grey Relational Analysis (GRA). Sustainability 2017, 9, 289. [Google Scholar] [CrossRef]
  72. Wang, C.-N.; Yang, C.-Y.; Cheng, H.-C. Fuzzy Multi-Criteria Decision-Making Model for Supplier Evaluation and Selection in a Wind Power Plant Project. Mathematics 2019, 7, 417. [Google Scholar] [CrossRef]
  73. Wan, J.; Lin, C.-L. Research on the Service Quality Index and Alternatives Evaluation and Ranking for Online Yue Kiln Celadon Art Education in Post COVID-19 Era. Mathematics 2023, 11, 1339. [Google Scholar] [CrossRef]
  74. Tsai, W.C.; Kung, P.T.; Wang, R.H.; Chang, Y.H.; Lee, S.Y. Applying the SERVQUAL Questionnaire to Establish Quality Indicators for Chinese Medicine. Taiwan J. Public Health 2008, 27, 309–319. [Google Scholar]
  75. Babakus, E.; Mangold, W.G. Adapting the SERVQUAL Scale to Hospital Services: An Empirical Investigation. Health Serv. Res. 1992, 22, 767–786. [Google Scholar]
  76. Parenté, F.J.; Anderson-Parenté, J.K. Delphi Inquiry Systems. Judgm. Forecast. 1987, 129–156. [Google Scholar]
  77. Darko, A.; Chan, A.; Ameyaw, E.; Owusu, E.; Pärn, E.; Edwards, D. Review of Application of Analytic Hierarchy Process (AHP) in Construction. Int. J. Constr. Manag. 2018, 19, 436–452. [Google Scholar] [CrossRef]
  78. Dalal, J.; Mohapatra, P.K.; Chandra, M.G. Prioritization of Rural Roads: AHP in Group Decision. Eng. Constr. Archit. Manag. 2010, 17, 135–158. [Google Scholar] [CrossRef]
  79. Zou, P.X.W.; Li, J. Risk Identification and Assessment in Subway Projects: Case Study of Nanjing Subway Line 2. Constr. Manag. Econ. 2010, 28, 1219–1238. [Google Scholar] [CrossRef]
  80. Li, J.; Zou, P.X.W. Fuzzy AHP-Based Risk Assessment Methodology for PPP Projects. J. Constr. Eng. Manag. 2011, 137, 1205–1209. [Google Scholar] [CrossRef]
  81. Pan, W.; Dainty, A.R.J.; Gibb, A.G.F. Establishing and Weighting Decision Criteria for Building System Selection in Housing Construction. J. Constr. Eng. Manag. 2012, 138, 1239–1250. [Google Scholar] [CrossRef]
  82. Akadiri, P.O.; Olomolaiye, P.O.; Chinyio, E.A. Multi-Criteria Evaluation Model for the Selection of Sustainable Materials for Building Projects. Autom. Constr. 2013, 30, 113–125. [Google Scholar] [CrossRef]
  83. Chou, J.; Pham, A.; Wang, H. Bidding Strategy to Support Decision-Making by Integrating Fuzzy AHP and Regression-Based Simulation. Autom. Constr. 2013, 35, 517–527. [Google Scholar] [CrossRef]
  84. Herrera, F.; Herrera-Viedma, E. Linguistic Decision Analysis: Steps for Solving Decision Problems under Linguistic Information. Fuzzy Sets Syst. 2000, 115, 67–82. [Google Scholar] [CrossRef]
  85. Zimmermann, H. Fuzzy Set Theory—And Its Applications, 2nd ed.; Kluwer Academic: Dordrecht, The Netherlands, 1992. [Google Scholar]
  86. Zadeh, L. Fuzzy Sets. Inf. Control 1965, 9, 338–353. [Google Scholar] [CrossRef]
  87. Lee, A.H.I. A Fuzzy Supplier Selection Model with the Consideration of Benefits, Opportunities, Costs and Risks. Expert. Syst. Appl. 2009, 36, 2879–2893. [Google Scholar] [CrossRef]
  88. Lee, A.H.I.; Kang, Y.H.; Hsu, C.F.; Hung, H.C. A Green Supplier Selection Model for High-Tech Industry. Expert. Syst. Appl. 2009, 36, 7917–7927. [Google Scholar] [CrossRef]
  89. Lee, A.H.I.; Kang, H.Y.; Chang, C.T. Fuzzy Multiple Goal Programming Applied to Tft-Lcd Supplier Selection by Downstream Manufacturers. Expert. Syst. Appl. 2009, 36, 6318–6325. [Google Scholar] [CrossRef]
  90. Lee, A.H.I.; Kang, H.Y.; Wang, W.P. Analysis of Priority Mix Planning for the Fabrication of Semiconductors under Uncertainty. Int. J. Adv. Manuf. Technol 2006, 28, 351–361. [Google Scholar] [CrossRef]
  91. Chang, C.H. Evaluating Weapon Systems Using Ranking Fuzzy Numbers. Fuzzy Sets Syst. 1999, 107, 25–35. [Google Scholar] [CrossRef]
  92. Lin, Y.-H. The Algorithm of Fuzzy Linguistic Numbers and Its Comparison of Scoring. J. Natl. Taichung Teach. Coll. 2003, 17, 279–304. [Google Scholar]
  93. Chen, D.-C. Evaluation and Inspection of Domestic Civil Aviation Safety Performance. Master’s Thesis, National Chiao Tung University, Hsinchu, Taiwan, 2003. [Google Scholar]
  94. Dehghani, M.; Esmaeilian, M.; Tavakkoli-Moghaddam, R. Employing Fuzzy Anp for Green Supplier Selection and Order Allocations: A Case Study. Int. J. Econ. Manag. Soc. Sci. 2013, 2, 565–575. [Google Scholar]
  95. Lin, C.-L.; Chen, J.-J.; Ma, Y.-Y. Ranking of Service Quality Solution for Blended Design Teaching Using Fuzzy ANP and TOPSIS in the Post-COVID-19 Era. Mathematics 2023, 11, 1255. [Google Scholar] [CrossRef]
  96. Buckley, J.J. Fuzzy Hierarchical Analysis. Fuzzy Sets Syst. 1985, 17, 233–247. [Google Scholar] [CrossRef]
  97. Pedrycz, W. Why Triangular Membership Functions? Fuzzy Sets Syst. 1994, 64, 21–30. [Google Scholar] [CrossRef]
  98. Saaty, T.L.; Vargas, L.G. Diagnosis with Dependent Symptoms: Bayes Theorem and the Analytic Hierarchy Process. Oper. Res. 1998, 46, 491–502. [Google Scholar] [CrossRef]
  99. Chou, S.-W.; Chang, Y.-C. The Implementation Factors That Influence the ERP (Enterprise Resource Planning) Benefits. Decis. Support Syst. 2008, 46, 149–157. [Google Scholar] [CrossRef]
  100. Saaty, T.L. How to Make a Decision: The Analytic Hierarchy Process. Eur. J. Oper. Res. 1990, 48, 9–26. [Google Scholar] [CrossRef]
  101. Wu, H.J.; Chen, C.B. An Alternative Form for Grey Relational Grades. J. Grey Syst. 1999, 11, 7–12. [Google Scholar]
  102. Saaty, T.L. The Analytic Hierarchy and Analytic Network Processes for the Measurement of Intangible Criteria and for Decision-Making. Mult. Criteria Decis. Anal. State Art Surv. 2016, 363–419. [Google Scholar]
  103. Matzler, K.; Sauerwein, E. The Factor Structure of Customer Satisfaction: An Empirical Test of the Importance Grid and the Penalty-reward-contrast Analysis. Int. J. Serv. Ind. Manag. 2002, 13, 314–332. [Google Scholar] [CrossRef]
Figure 1. The process of this research.
Sustainability 16 01885 g001
Figure 2. Fuzzy triangular numbers.
Sustainability 16 01885 g002
Figure 3. The evaluation hierarchy structure based on pre-test survey and expert advice.
Sustainability 16 01885 g003
Figure 4. The ranking of dimensions from the FAHP model.
Sustainability 16 01885 g004
Figure 5. The ranking of indicators from the FAHP model.
Sustainability 16 01885 g005
Figure 6. The ranking of dimensions from the GRA model.
Sustainability 16 01885 g006
Figure 7. The ranking of indicators from the GRA model.
Sustainability 16 01885 g007
Table 1. Fuzzy numbers and scales.
Linguistic VariablesFuzzy NumbersTriangular Fuzzy ScaleReversed Triangular Fuzzy Scale
Equally preferred 1 ˜ 111111
Intermediate 2 ˜ 1231/31/21
Moderately preferred 3 ˜ 2341/41/31/2
Intermediate 4 ˜ 3451/51/41/3
Strongly preferred 5 ˜ 4561/61/51/4
Intermediate 6 ˜ 5671/71/61/5
Very strongly preferred 7 ˜ 6781/81/71/6
Intermediate 8 ˜ 7891/91/81/7
Extremely preferred 9 ˜ 9991/91/91/9
Table 2. Random indexes (R.I.s).
The Order of Matrix123456789101112131415
R.I.--0.580.901.121.241.321.411.451.491.511.531.561.571.59
Table 3. The fuzzy number matrix for each dimension from the dual perspective.
PerspectiveService Providers
DimensionsHumanity (A)Environment (B)Economy (C)Society (D)
Humanity (A)(1, 1, 1)(4, 5, 6)(1/4, 1/3, 1/2)(2, 3, 4)
Environment (B)(1/6, 1/5, 1/4)(1, 1, 1)(1/6, 1/5, 1/4)(1/3, 1/2, 1)
Economy (C)(2, 3, 4)(4, 5, 6)(1, 1, 1)(3, 4, 5)
Society (D)(1/4, 1/3, 1/2)(1, 2, 3)(1/5, 1/4, 1/3)(1, 1, 1)
PerspectiveConsumers
DimensionsHumanity (A)Environment (B)Economy (C)Society (D)
Humanity (A)(1, 1, 1)(2, 3, 4)(1/4, 1/3, 1/2)(1/5, 1/4, 1/3)
Environment (B)(1/4, 1/3, 1/2)(1, 1, 1)(1/7, 1/6, 1/5)(1/4, 1/3, 1/2)
Economy (C)(2, 3, 4)(5, 6, 7)(1, 1, 1)(1, 2, 3)
Society (D)(3, 4, 5)(2, 3, 4)(1/3, 1/2, 1)(1, 1, 1)
Table 4. The calculation of geometric mean values.
PerspectiveService Providers
DimensionsComputation ProcessResults
Humanity (A) 1 × 4 × 1 / 4 × 2 1 4 , 1 × 5 × 1 / 3 × 3 1 4 , 1 × 6 × 1 / 2 × 4 1 4 1.1891.4951.861
Environment (B) 1 / 6 × 1 × 1 / 6 × 1 / 3 1 4 , 1 / 5 × 1 × 1 / 5 × 1 / 2 1 4 , 1 / 4 × 1 × 1 / 4 × 1 1 4 0.3100.3760.500
Economy (C) 2 × 4 × 1 × 3 1 4 , 3 × 5 × 1 × 5 1 4 , 4 × 6 × 1 × 5 1 4 2.2132.7833.310
Society (D) 1 / 4 × 1 × 1 / 5 × 1 1 4 , 1 / 3 × 2 × 1 / 4 × 1 1 4 , 1 / 2 × 3 × 1 / 3 × 1 1 4 0.4730.6390.841
Total4.1865.2946.512
PerspectiveConsumers
DimensionsComputation ProcessResults
Humanity (A) 1 × 2 × 1 / 4 × 1 / 5 1 4 , 1 × 3 × 1 / 3 × 1 / 4 1 4 , 1 × 4 × 1 / 2 × 1 / 3 1 4 0.5620.7070.904
Environment (B) 1 / 4 × 1 × 1 / 7 × 1 / 4 1 4 , 1 / 3 × 1 × 1 / 6 × 1 / 3 1 4 , 1 / 2 × 1 × 1 / 5 × 1 / 2 1 4 0.3070.3690.473
Economy (C) 2 × 5 × 1 × 1 1 4 , 3 × 6 × 1 × 2 1 4 , 4 × 7 × 1 × 3 1 4 1.7782.4493.027
Society (D) 3 × 2 × 1 / 3 × 1 1 4 , 4 × 3 × 1 / 2 × 1 1 4 , 5 × 4 × 1 × 1 1 4 1.1891.5652.115
Total3.8375.0916.519
Table 5. The calculation of the fuzzy weight for each dimension.
PerspectiveService Providers
DimensionsComputation ProcessResults
Humanity (A) 1.189 ,   1.495 ,   1.861 1 6.512 ,   1 5.294 ,   1 4.186 0.1830.2820.445
Environment (B) 0.310 ,   0.376 ,   0.500 1 6.512 ,   1 5.294 ,   1 4.186 0.0480.0710.119
Economy (C) 2.213 ,   2.783 ,   3.310 1 6.512 ,   1 5.294 ,   1 4.186 0.3400.5260.791
Society (D) 0.473 ,   0.639 ,   0.841 1 6.512 ,   1 5.294 ,   1 4.186 0.0730.1210.201
PerspectiveConsumers
DimensionsComputation ProcessResults
Humanity (A) 0.562 ,   0.707 ,   0.904 1 6.519 ,   1 5.091 ,   1 3.837 0.0860.1390.235
Environment (B) 0.307 ,   0.369 ,   0.473 1 6.519 ,   1 5.091 ,   1 3.837 0.0470.0720.123
Economy (C) 1.778 ,   2.449 ,   3.027 1 6.519 ,   1 5.091 ,   1 3.837 0.2730.4810.789
Society (D) 1.189 ,   1.565 ,   2.115 1 6.519 ,   1 5.091 ,   1 3.837 0.1820.3070.551
Table 6. De-fuzzified weight of each dimension.
PerspectiveService Providers
DimensionsComputation ProcessResults
Humanity (A) 0.183 + 0.282 + 0.445 3 0.303
Environment (B) 0.048 + 0.071 + 0.119 3 0.079
Economy (C) 0.340 + 0.526 + 0.791 3 0.552
Society (D) 0.073 + 0.121 + 0.201 3 0.131
Total1.066
PerspectiveConsumers
DimensionsComputation ProcessResults
Humanity (A) 0.086 + 0.139 + 0.235 3 0.154
Environment (B) 0.047 + 0.072 + 0.123 3 0.085
Economy (C) 0.273 + 0.481 + 0.789 3 0.514
Society (D) 0.182 + 0.307 + 0.551 3 0.367
Total1.096
Table 7. Normalised weight of each dimension.
PerspectiveService Providers
DimensionsComputation ProcessResults
Humanity (A) 0.303 1.066 0.284
Environment (B) 0.079 1.066 0.074
Economy (C) 0.552 1.066 0.518
Society (D) 0.131 1.066 0.123
Total1.000
PerspectiveConsumers
DimensionsComputation ProcessResults
Humanity (A) 0.154 1.096 0.140
Environment (B) 0.081 1.096 0.074
Economy (C) 0.514 1.096 0.469
Society (D) 0.347 1.096 0.317
Total1.000
Table 8. Triangular fuzzy number matrix for each dimension from the dual perspective.
PerspectiveService Providers
DimensionsHumanityEnvironmentEconomySociety ω i
Humanity (A)(1, 1, 1)(4, 5, 6)(1/4, 1/3, 1/2)(2, 3, 4)0.284
Environment (B)(1/6, 1/5, 1/4)(1, 1, 1)(1/6, 1/5, 1/4)(1/3, 1/2, 1)0.074
Economy (C)(2, 3, 4)(4, 5, 6)(1, 1, 1)(3, 4, 5)0.518
Society (D)(1/4, 1/3, 1/2)(1, 2, 3)(1/5, 1/4, 1/3)(1, 1, 1)0.123
Total1
λ m a x = 4.075 ,   C . I . = 0.025 ,   C . R . = 0.0278
PerspectiveConsumers
DimensionsHumanityEnvironmentEconomySociety ω i
Humanity (A)(1, 1, 1)(2, 3, 4)(1/4, 1/3, 1/2)(1/5, 1/4, 1/3)0.140
Environment (B)(1/4, 1/3, 1/2)(1, 1, 1)(1/7, 1/6, 1/5)(1/4, 1/3, 1/2)0.074
Economy (C)(2, 3, 4)(5, 6, 7)(1, 1, 1)(1, 2, 3)0.469
Society (D)(3, 4, 5)(2, 3, 4)(1/3, 1/2, 1)(1, 1, 1)0.317
Total1
λ m a x = 4.196 ,   C . I . = 0.0653 ,   C . R . = 0.0725
Table 9. Referential series and compared series of each dimension from the dual perspective.
PerspectiveService Providers
Expert No.Referential Series (x0)Compared Series (xi)
HumanityEnvironmentEconomySociety
188745
286847
397659
499758
597978
699876
799756
875675
977513
1077645
PerspectiveConsumers
Expert No.Referential Series (x0)Compared Series (xi)
HumanityEnvironmentEconomySociety
173527
298986
387758
496729
596839
698979
797849
886758
977513
1097819
Table 10. Referential series and compared series of each indicator from the dual perspective.
PerspectiveService Providers
Expert No.Referential Series
(x0)
Compared Series (xi)
SDG 1SDG 2SDG 3SDG 4SDG 5SDG 6SDG 7SDG 8SDG 9SDG 10SDG 11SDG 12SDG 13SDG 14SDG 15SDG 16SDG 17
1954998654398789841
2968998765498799892
3921689235178272311
4834776654287463322
5921788223497857674
6912452764981215841
7812163854881268841
8812353764181215841
9934254964983145841
10912353764493653841
PerspectiveConsumers
Expert No.Referential Series
(x0)
Compared Series (xi)
SDG 1SDG 2SDG 3SDG 4SDG 5SDG 6SDG 7SDG 8SDG 9SDG 10SDG 11SDG 12SDG 13SDG 14SDG 15SDG 16SDG 17
1921943211856273231
2862838765868762112
3945967221989392211
4721721132635541123
5912844321969791111
6912952764161895841
7912963854276288841
8912923164357291141
9734652364756175241
10712555464457673241
Disclaimer/Publisher’s Note: The statements, opinions and data contained in all publications are solely those of the individual author(s) and contributor(s) and not of MDPI and/or the editor(s). MDPI and/or the editor(s) disclaim responsibility for any injury to people or property resulting from any ideas, methods, instructions or products referred to in the content.

