Article

Design and Fabrication of Nondestructive Capacitive Sensors for the Moisture Measurement in Chickpeas and Mustard Seeds

1
Electrical Engineering Department, Jamia Millia Islamia, New Delhi 110025, India
2
Electrical Engineering Department, Tezpur Central University, Tezpur 784028, Assam, India
3
Department of Electrical Engineering Technology, College of Applied Industrial Technology, Jazan University, Jazan 45142, Saudi Arabia
*
Authors to whom correspondence should be addressed.
Sustainability 2024, 16(5), 1847; https://doi.org/10.3390/su16051847
Submission received: 24 December 2023 / Revised: 10 February 2024 / Accepted: 21 February 2024 / Published: 23 February 2024
(This article belongs to the Special Issue Advanced Research on Sustainable Smart City)

Abstract

:
Moisture in food grains, including chickpea and mustard seeds, plays a crucial role in their storage and processing, thus ensuring food quality. It helps in the improvement of preservation techniques. Moisture in these materials is an age-old problem; hence, it is important to monitor it in real time. The conventional gravimetric method is manual and time-consuming; some online electrical techniques are available in which grains are considered as a dielectric material, but they are relatively complex and costly. This present work describes a nondestructive concentric fringing field (CFF) capacitive sensor to detect moisture (4–33% by absolute weight) of chickpea grain and (12–30% by absolute weight) mustard seed. First, the proposed CFF sensor was modeled, and then three distinct concentric sensors were designed, simulated, fabricated, and experimentally validated to determine moisture in chickpea grains and mustard seeds. The capacitance values of all the sensors approximately linearly varied with the changes in the moisture of the grains. The average sensitivity of the most sensitive sensors was close to 20 fF/% wt for chickpeas and 31 fF/% wt for mustard seeds. The proposed sensor is sensitive, nondestructive, easy to use, inexpensive, and fast.

1. Introduction

Grain, especially chickpea grain and its products, is a very healthy food for people and is cultivated in abundance in the Indian subcontinent [1]. It is a primary source of protein, fiber, minerals, and beta-carotene source and has a high lipid fraction in unsaturated fatty acids. In this subcontinent, the relative humidity randomly changes over a wide range due to frequent climate change throughout the year. Moisture ingress is a major cause of grain damage. Therefore, measuring and monitoring chickpea grains’ moisture level is essential to maintain this important crop’s healthy condition [1].
Moisture content affects many parameters, such as transportation, harvesting, drying, storage, production, and food value. The important electrical parameters, such as the grain samples’ relative permittivity and electrical conductivity, are well associated with crop yield, quality, and food value. The electronic-type grain moisture meters detect the grain’s conductivity and dielectric properties and are calibrated to observe moisture content. Crop quality is monitored by measuring the changes in electrical properties due to moisture adsorption. A grain sample’s electrical properties help to develop instruments for the treatment of the grain, such as dielectric drying, electrostatic cleaning and sorting, and electrical stimulation [2]. Thus, instruments with improved accuracy, consistency, and reliability must be developed to quickly determine the moisture of hydrophilic grains such as chickpea and mustard. Generally, these instruments are based on two measurement methods: direct and indirect. The direct method is used to determine absolute moisture in grain. In the absolute method, moisture can be measured by gravimetrically measuring the weight of the grains before and after drying by an accurate and precise electronic balance. These methods give highly precise results but are time-consuming, inappropriate for online and on-site testing, dependent accuracy of the balance, and require costly equipment [3,4].
The indirect method is based on the measurement of the electrical parameters of the materials. These electrical parameters are measured in terms of the capacitance value, resistance value, or impedance value, and can be calibrated in terms of moisture content. Such an indirect method is convenient, and conducting online tests is speedy and user-friendly. The indirect method can be contact or noncontact type. The noncontact method is preferred due to reliability, durability, drift-free output, and convenience.
Readings of moisture measurement by the electrical methods are affected by many factors, so the sensor design and its optimization should be carried out carefully [5,6]. Most fabricated capacitive sensors have cylindrical, coaxial, parallel, or coplanar topologies [7,8]. Most of the capacitive sensors for moisture measurement are contact types that suffer from electrode contamination and drift in sensor output. The designed parameters, electrode shape, and electric field distribution substantially impact the capacitive sensors’ performance. Thus, choosing the suitable capacitive sensor geometry (cross-capacitive, interdigital, cylindrical, etc.) is essential to fulfilling an application’s requirement. A cross-capacitive sensor for metal debris detection [9], an interdigital sensor for liquid level and moisture of food products, and a cylindrical sensor for measuring the steady flow of materials in the pipeline, have been developed [10].
The fringing electric field sensor (interdigital) has the unique advantage of single-side sample testing. Therefore, fringing electric field sensors are extensively reported for testing dielectric materials. The applications include online moisture measurement of food products [11], pharmaceutical products [12], paper pulp [13], wood moisture, liquid level, etc. The nondestructive types of fringing field sensors can also be utilized for crop health monitoring and the quality of food products (edible oil, etc.) in smart agriculture [14,15,16]. Penetration depth is crucial in these sensors for bulk measurement of the medium under test. Other parameters, such as sensitivity, linearity, and signal strength, also affect the performance of the field sensors. Webster investigated the effect of electrodes on sensor output [17]. However, the research did not cover the penetration depth of the sensor and how sensor geometry affects it.
Along with the sensor’s geometry, the shape, size, temperature, and physical/chemical composition are also essential in the moisture measurement of the sample. The capacitive sensors for moisture measurement of seeds are reported, but there is little work on seed moisture measurement by interdigitated fringing field sensors, particularly for chickpea grains and mustard seeds. Compared to traditional interdigital sensors with rectangular electrodes, the concentric fringing field (CFF) capacitive sensor has rotational symmetry; therefore, the resulting capacitance is less sensitive to the relative orientation of the sensor and the material under test [18,19]. This configuration also possesses deeper penetration depth and better immunity to lift-off variations.
Therefore, this paper aimed to model, design, and fabricate a concentric planar fringing field capacitive sensor for moisture measurement of seeds (chickpea grains and mustard seeds). The paper is organized as follows: performance evaluation parameters for fringing field (FF) sensors are explained in Section 2. The design of the moisture measurement of grain and mustard seed using a concentric fringing field sensor is explained in Section 3. The diagram describes the schematic of the sensor geometry, the position of the sensing and driving electrode, the effect of the shielding electrode on penetration depth, and how to improve the sensor characteristics. Section 4 explains the modeling of the proposed sensor. Section 5 presents the simulation studies of the proposed sensor. Section 6 describes the fabrication process and validates the experimental results. Section 7 discusses the results with some important observations.

2. Performance Evaluation Parameters for Fringing Field (FF) Sensors

In order to accurately evaluate the performance of FF sensors, it is essential to consider the parameters of signal strength, measurement sensitivity, and penetration depth.

2.1. Signal Strength

Fringing field sensors are commonly constructed using metal strips, resulting in a relatively low capacitance value between adjacent strips and leading to a correspondingly low signal strength. Sensors can be designed with interdigitated periodic structures to boost the signal strength, as demonstrated in Figure 1. By incorporating additional “fingers” into a sensor, its signal strength can be further enhanced due to the formation of a multiparallel plate structure.
The signal strength of a FF sensor varies exponentially with its distance from the sample. For capacitive measurement, if the sample’s dielectric permittivity is greater than that of the medium, the signal strength will decrease as the distance to the sample increases. If the sensor is submerged in a medium with finite conductivity, its signal strength can either increase or decrease depending on the dielectric properties of the medium and the sample.

2.2. Measurement Sensitivity

Measurement sensitivity is the ratio between the change in sensor output and the change in the physical parameter being measured. It is a crucial aspect to consider when evaluating the accuracy and reliability of the sensor output. For FF sensors, the sensitivity is position-dependent due to the non-uniform electric field. This relationship is illustrated in Figure 2, where sensitivity decreases exponentially with increasing distance from the plane of the electrodes. Additionally, the electrode area significantly affects the sensitivity of the sensor. An increased electrode area can result in higher accuracy and reliability of sensor output if the spatial wavelength is fixed. However, it is important to note that increasing the electrode area can decrease the number of measurement channels in the case of multichannel sensors. Hence, it is crucial to carefully evaluate and select the appropriate sensor while considering all the parameters.

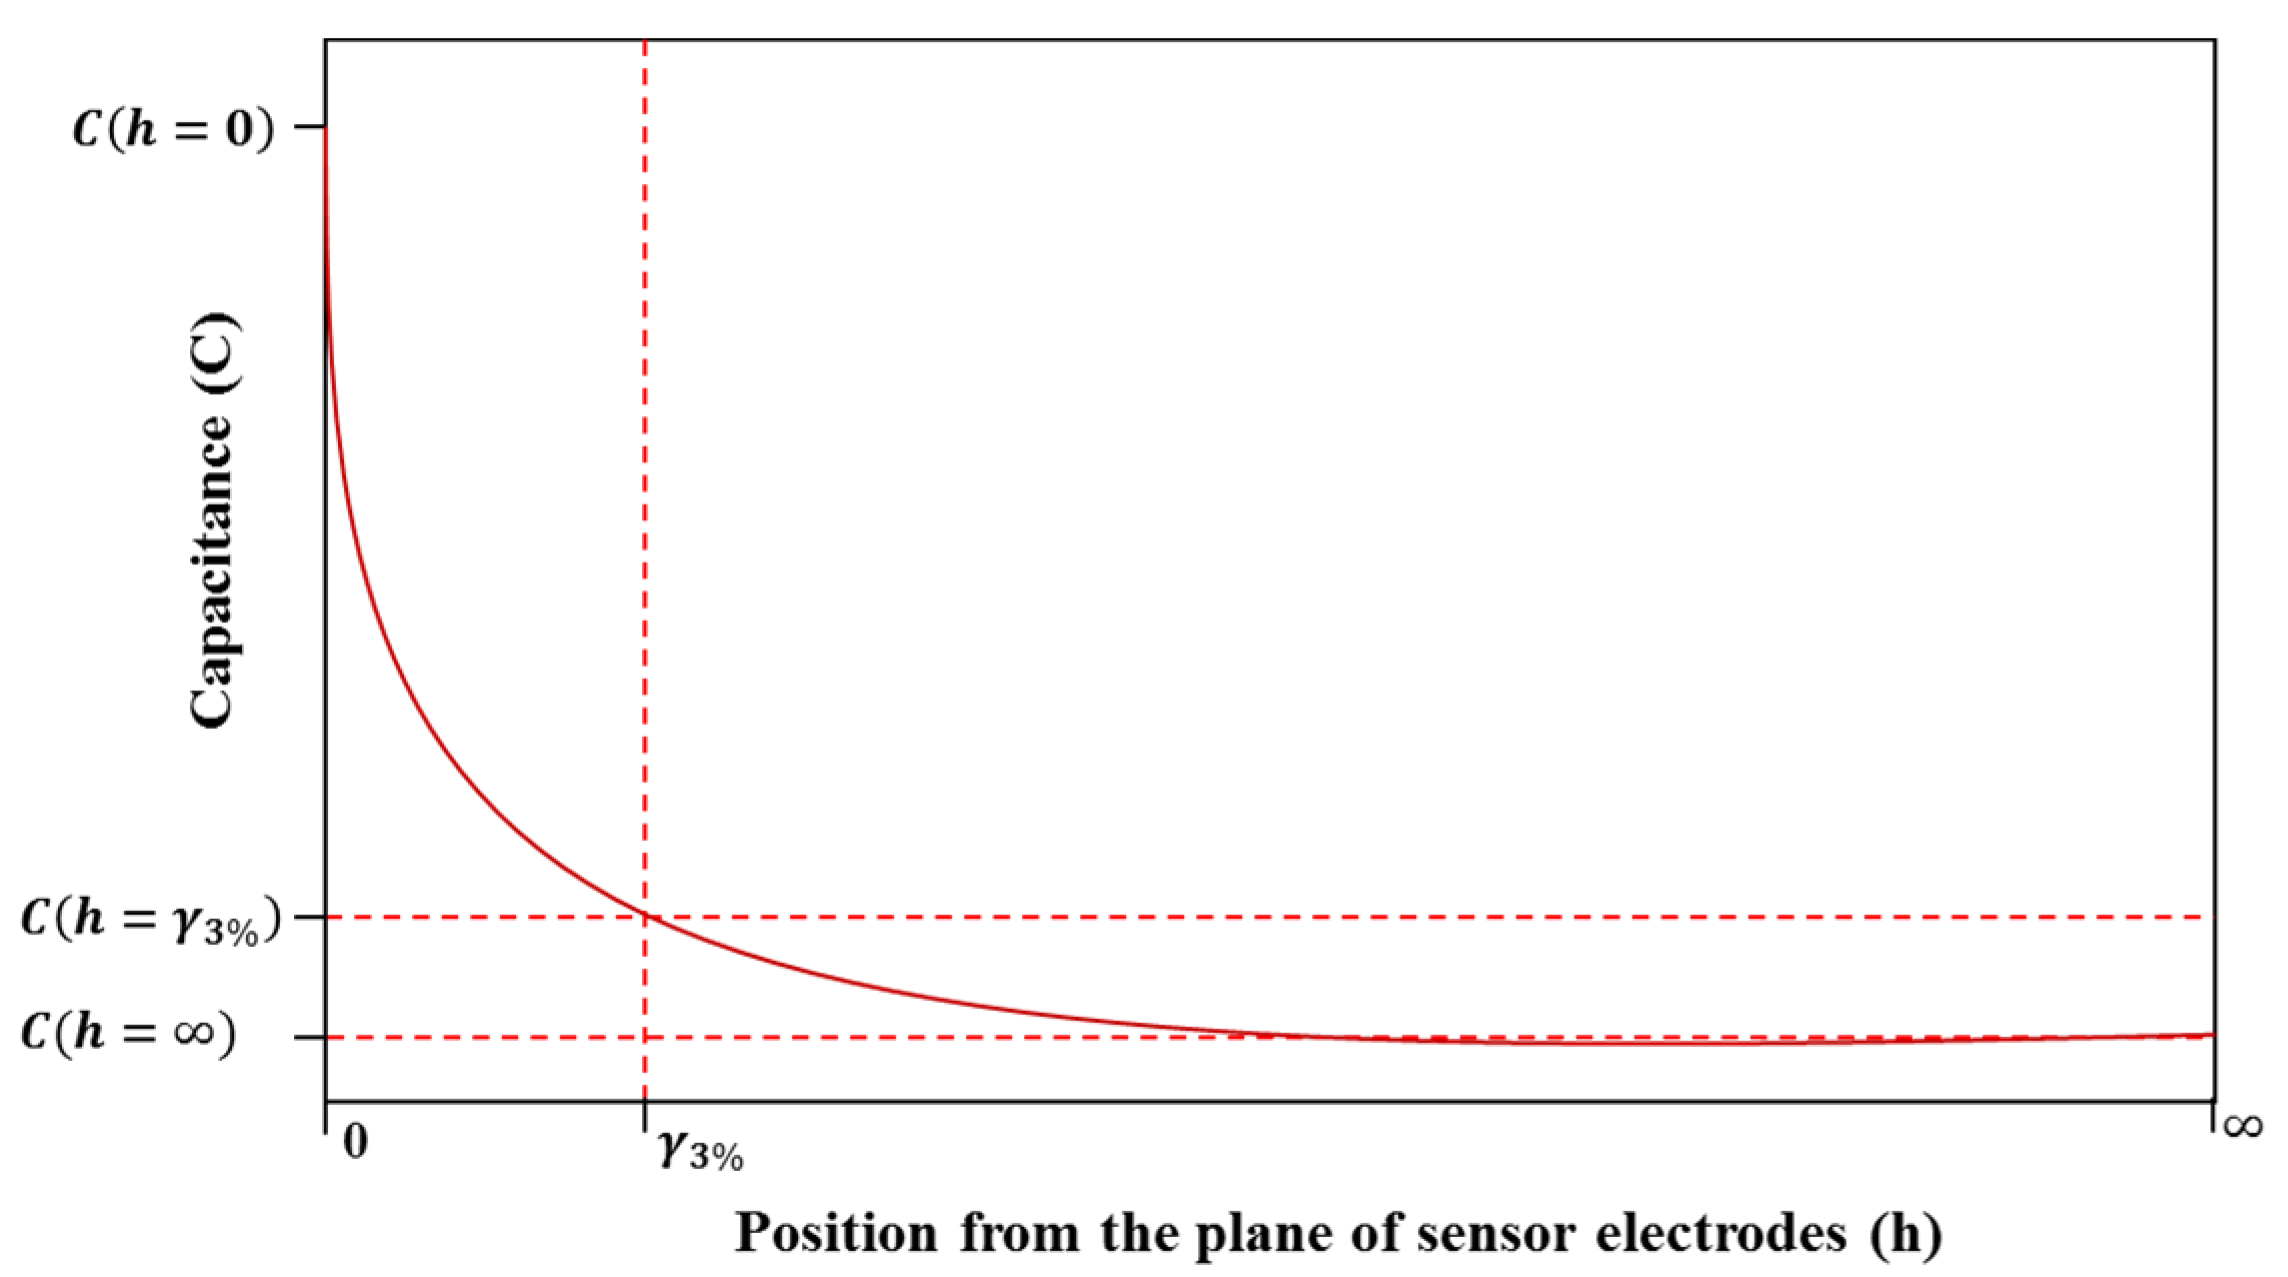
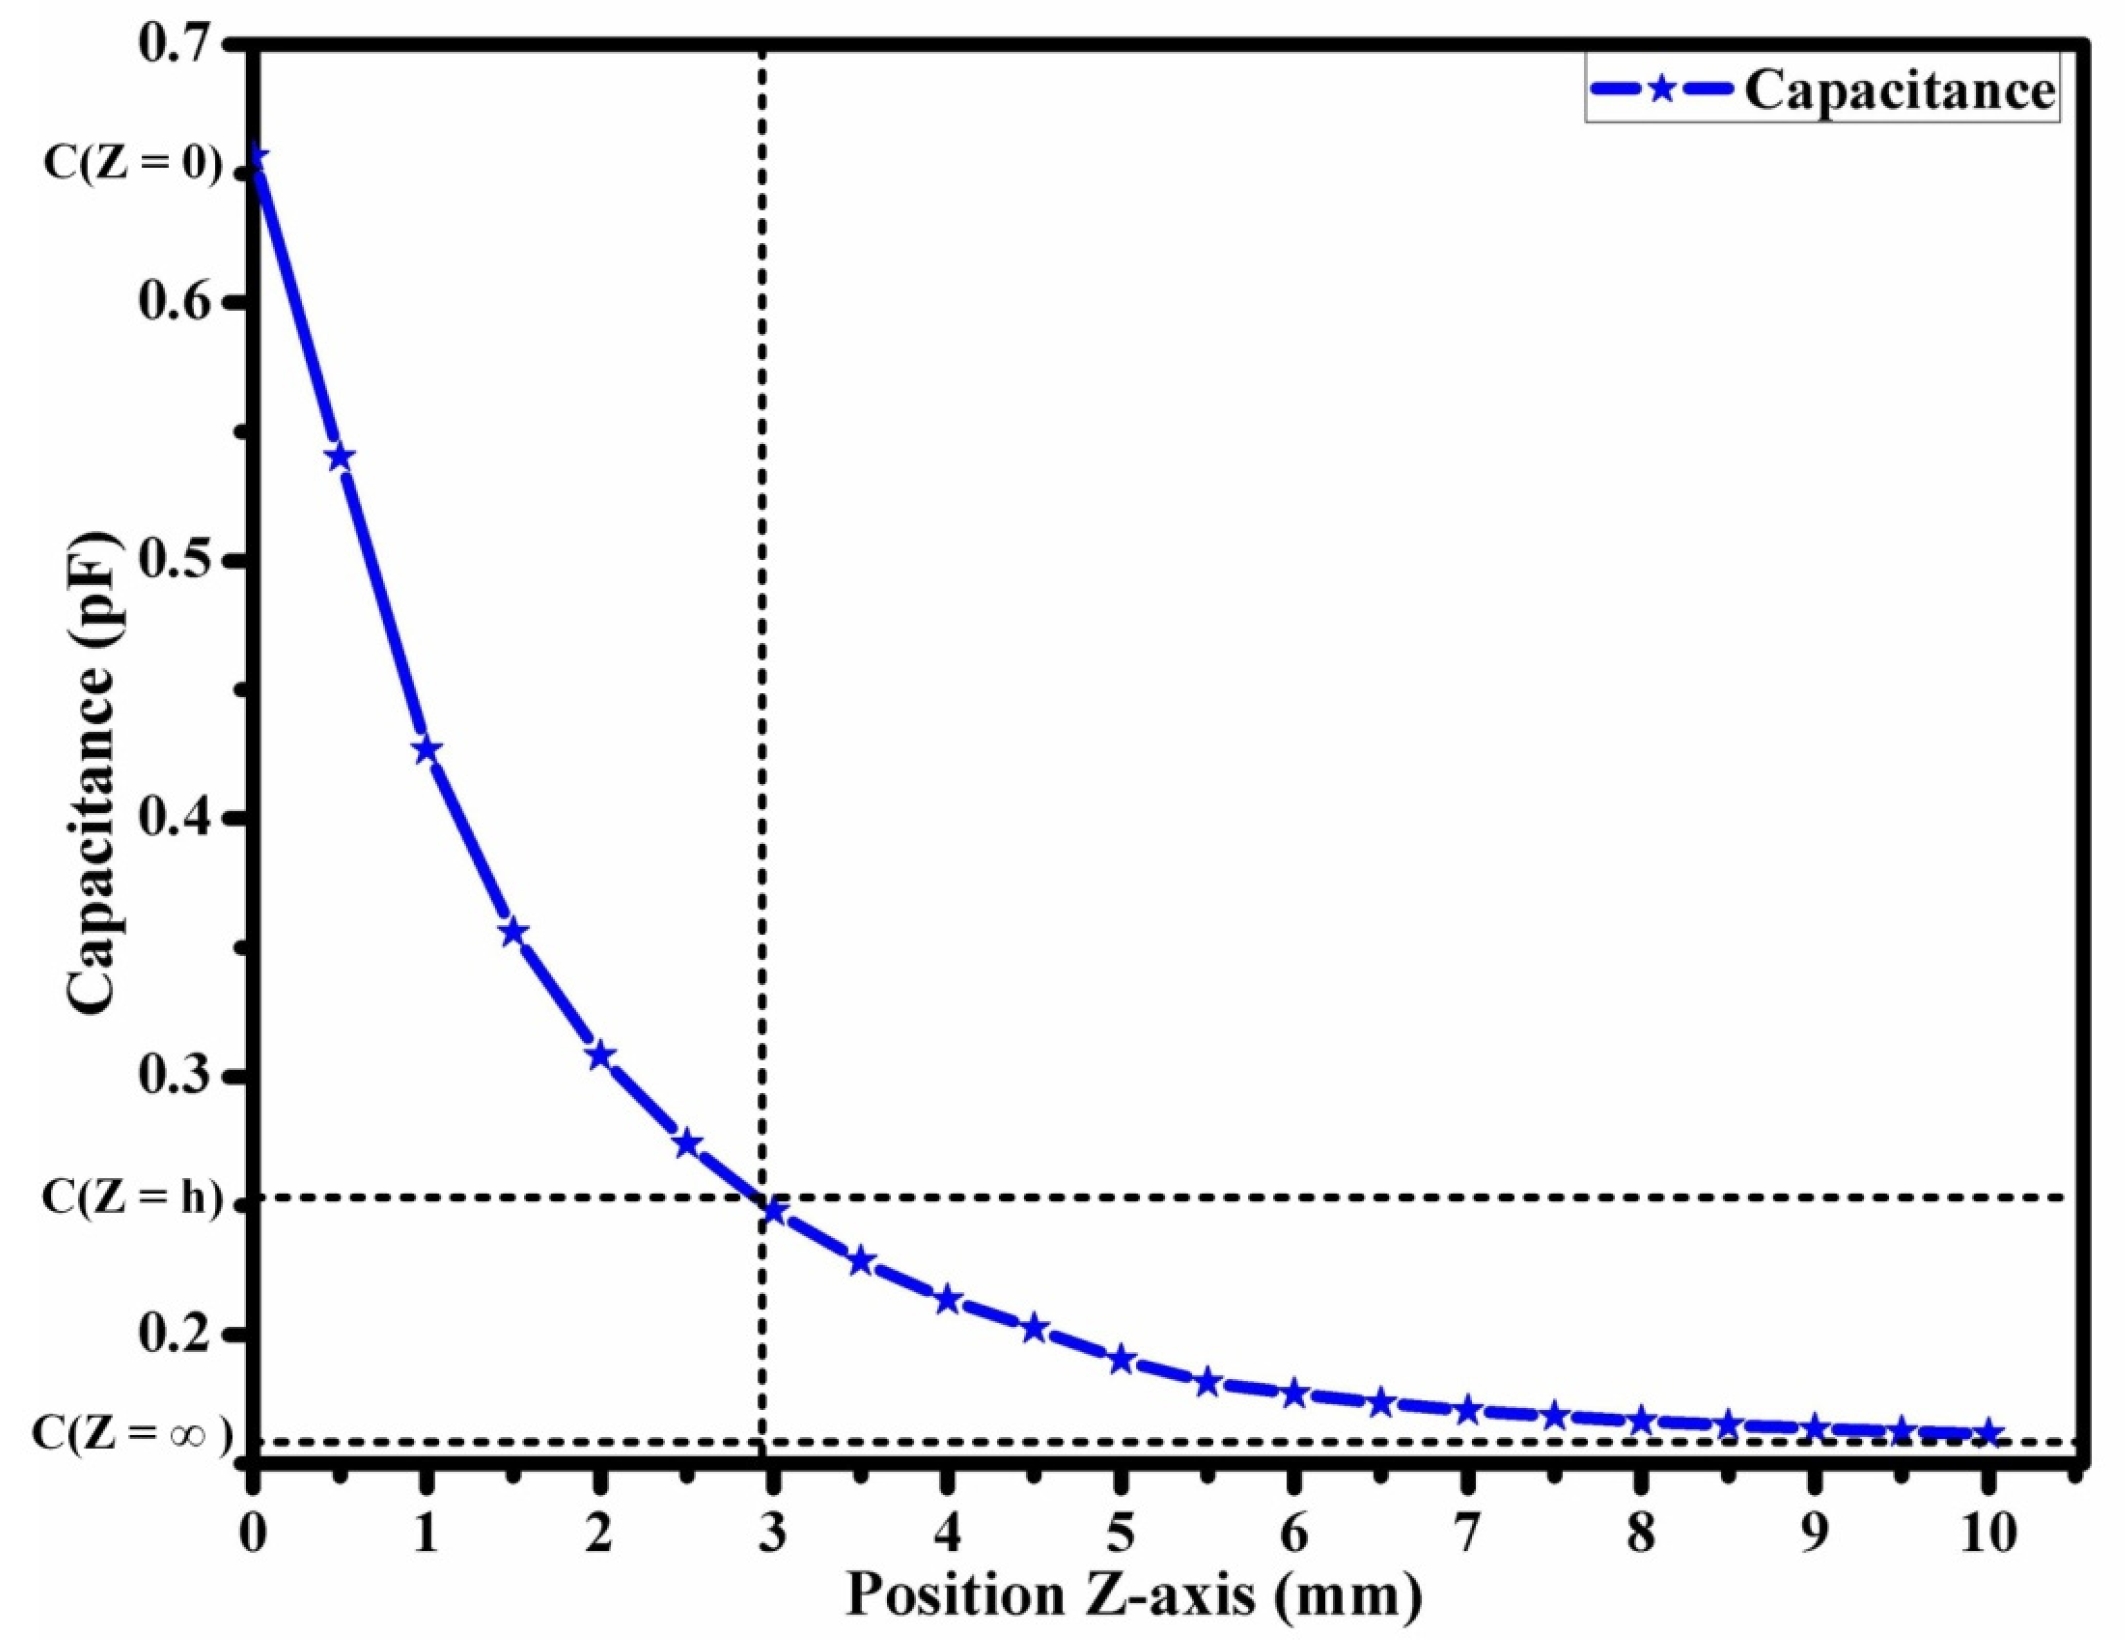
2.3. Penetration Depth

Penetration depth measures electric field intensity decay with distance from the sensor electrodes. Effective penetration depth can be evaluated by recording terminal capacitance while moving a sample away from the sensor head. The depth of penetration, C ( h = γ 3 % ) describes the precise point h at which the difference between the capacitance value at that specific point and the asymptotic capacitance of C h =   becomes equal to 3% of the difference between the highest and lowest values of the terminal impedance [20]. This process is demonstrated through the illustration presented in Equation (1) and Figure 2, where C h = 0 represents the capacitance value of the sensor terminal when it is in direct contact with the sample.
C h = γ 3 % C ( h = ) C h = 0 C ( h = ) × 100 % = 3 %
The interdigital sensor, illustrated in Figure 1, with a metallization ratio of 50% (i.e., the ratio of the surface area of the electrodes to the total surface area of the sensor), exhibits a penetration depth, denoted as γ 3 % , of approximately one-third of its spatial wavelength, [21]. The spatial wavelength herein refers to the distance between the centerlines of the neighboring electrodes of the same type, such as driving or sensing electrodes.

3. Concentric Fringing Field (CFF) Sensor for Moisture Measurement in Grain and Seed
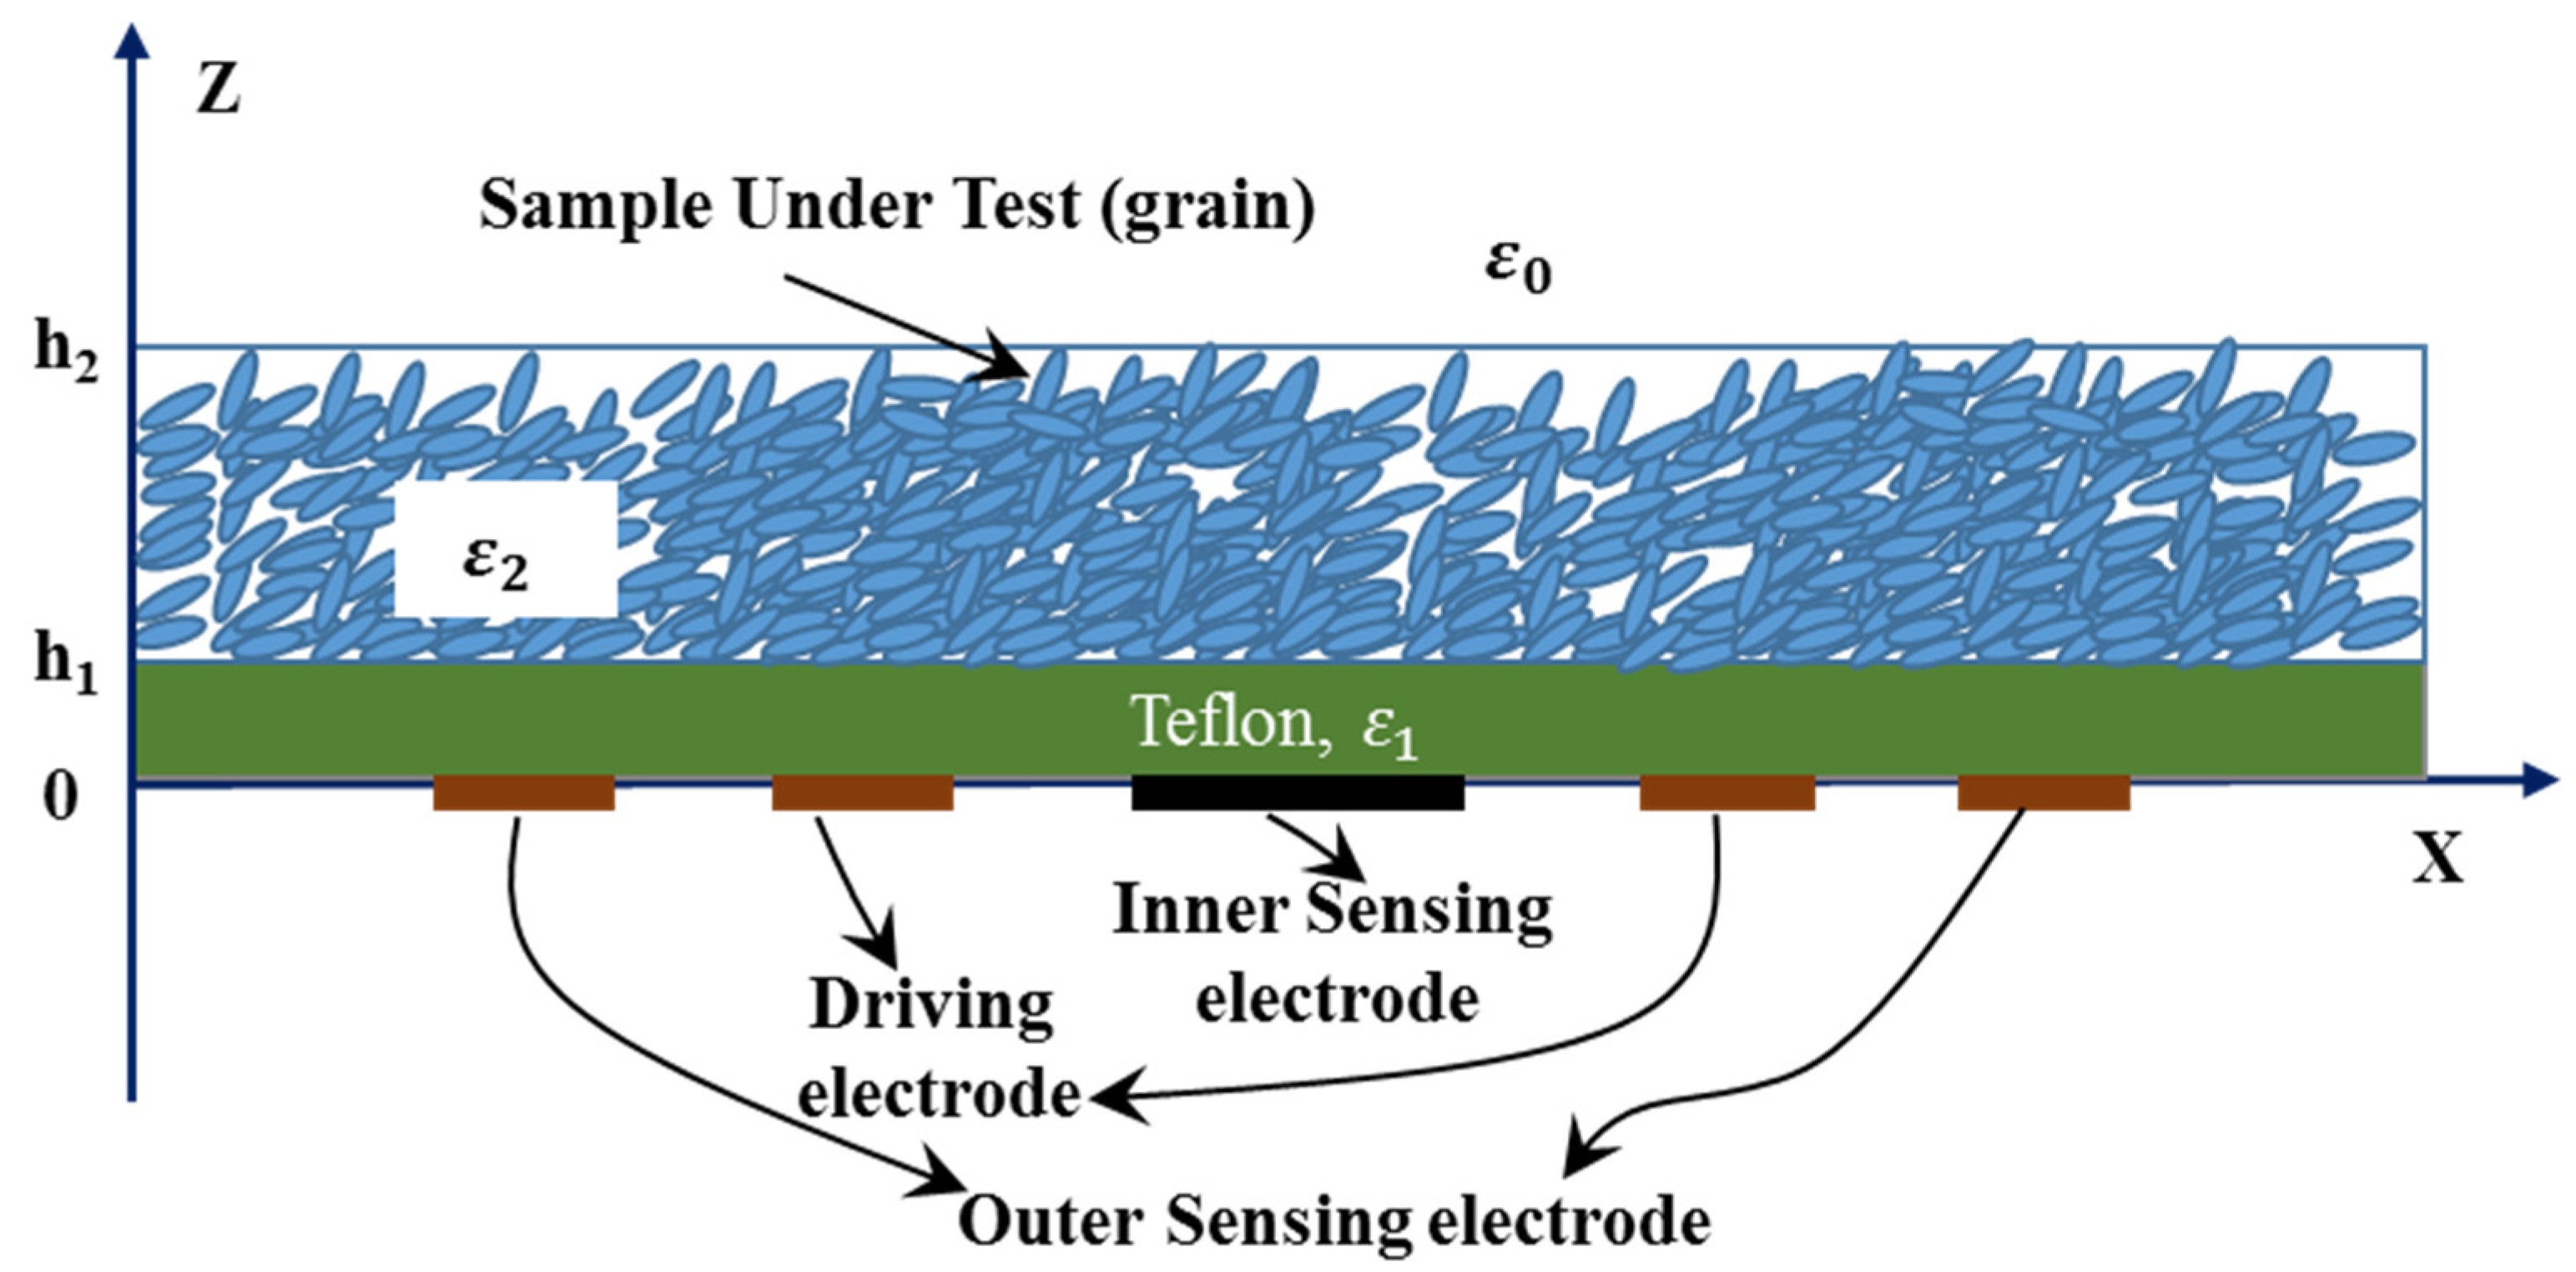
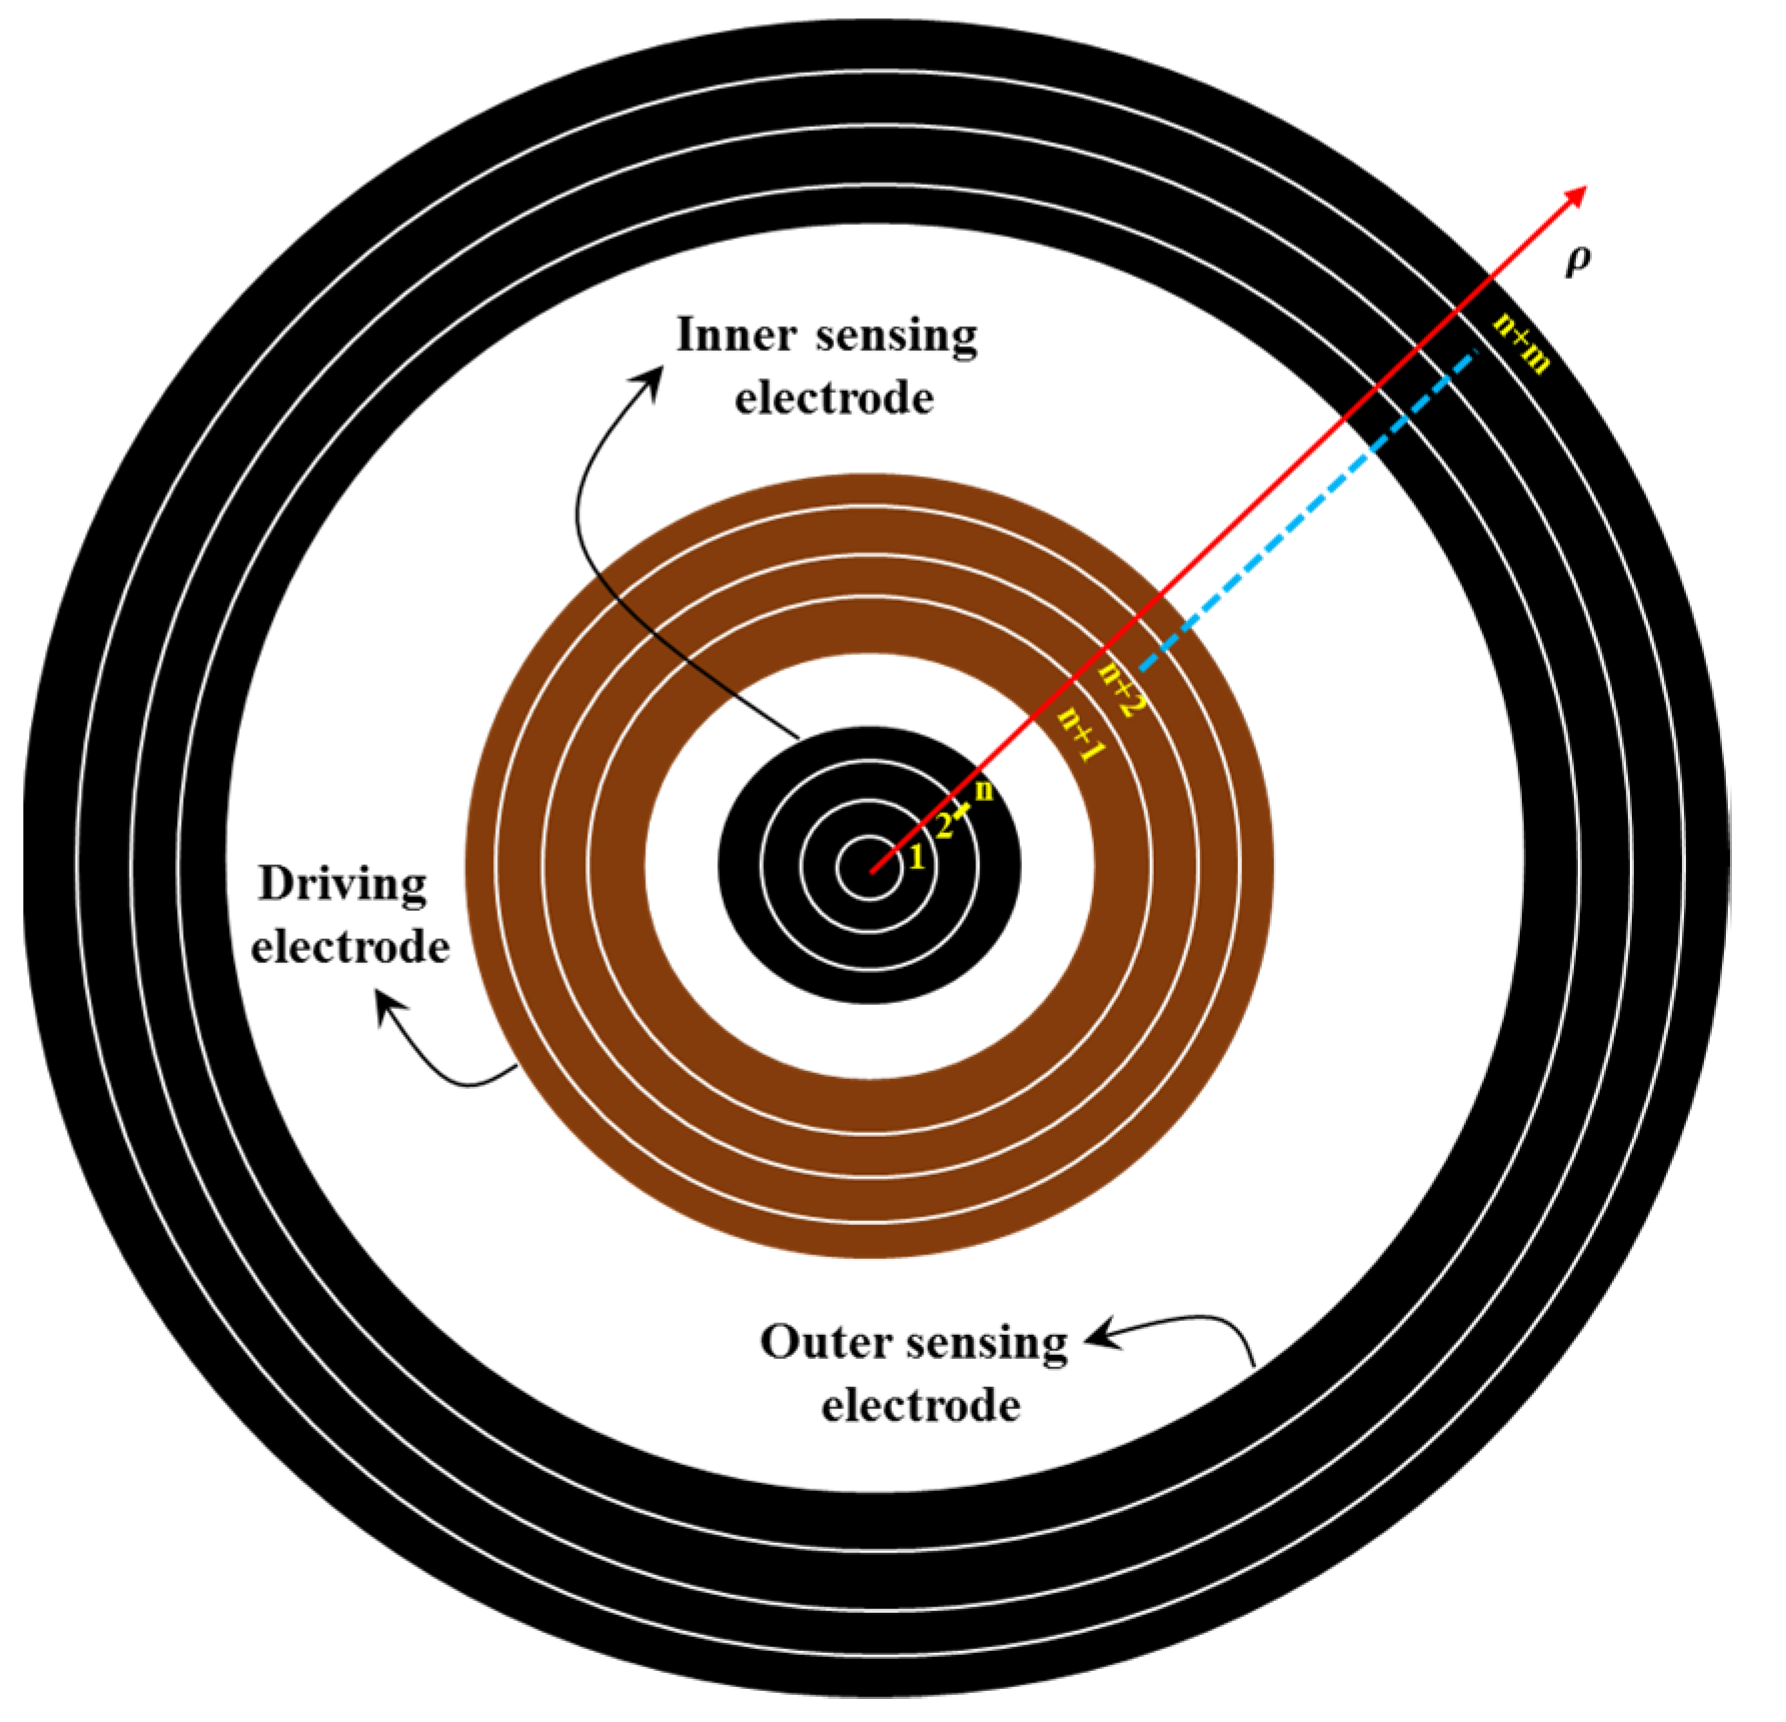
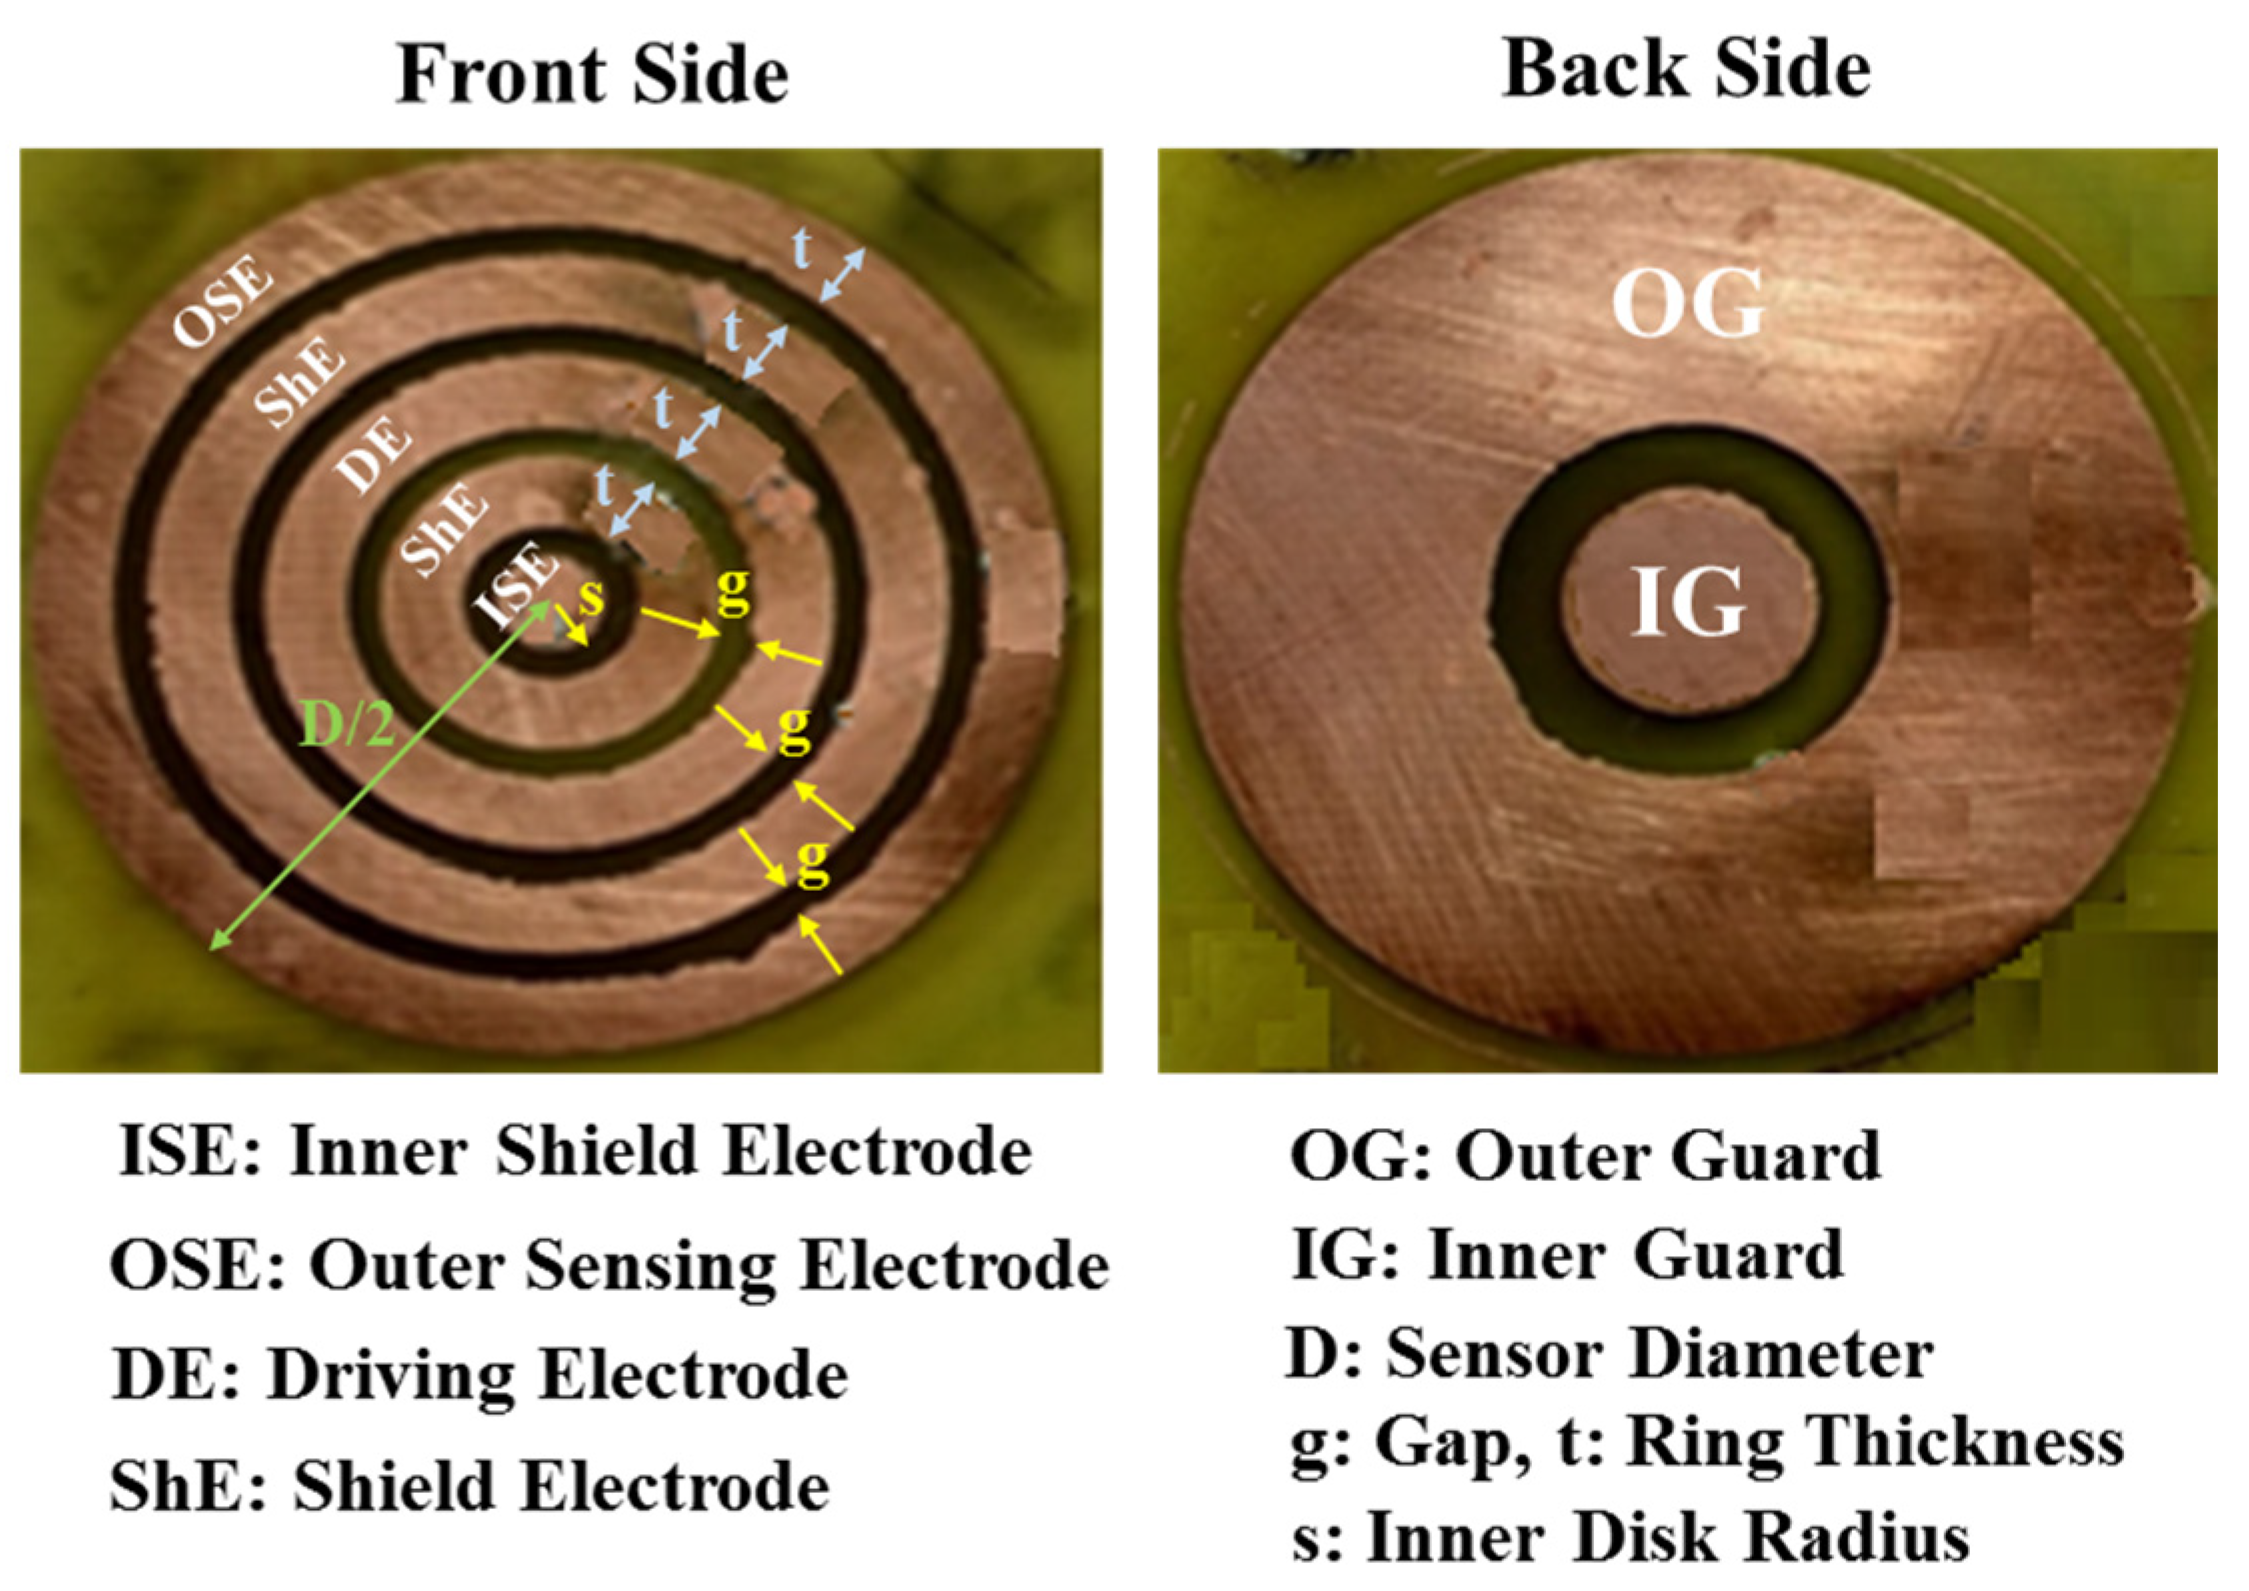
3.1. Sensor Design

The simplified diagram of the CFF sensor is presented in Figure 3a. The sensing electrodes consist of the innermost and outermost electrodes, with a driving electrode located in between them. These electrodes are insulated from one another by a small gap. The capacitance value of the sensor increases with a reduction in the gap between the electrodes [22]. The capacitive sensor also features guard electrodes positioned on the substrate’s back side for each sensing electrode. These guard electrodes protect the sensor from external parasitic effects and stray field effects. They absorb the downward field pattern, which increases the upward field pattern and, in turn, enhances the penetration depth of the electric field.
The CFF sensor, equipped with only two sensing electrodes, as shown in Figure 3a, has a limited spatial wavelength and penetration depth, making it inadequate for measuring a wide range of food products. To overcome this issue, shielding electrodes must be introduced between the sensing and driving electrodes to enhance the penetration depth.
Furthermore, the shielding electrodes maintaining the same voltage as their neighboring sensing electrodes is crucial. The elaborated design, incorporating shielding electrodes, is presented in Figure 3b. The viability of using such sensors for food quality monitoring is reported in [11,23]. The electrodes have been patterned on an insulating substrate shown by white color in Figure 3.
Adding shielding electrodes increases the penetration depth of the sensor by pushing the electric field lines upwards, which counters the downward force of the backplane electrode. This is demonstrated in Figure 4.
The effectiveness of capacitive sensors can be improved by utilizing shielding and guarding mechanisms. These mechanisms help to enhance the sensor’s sensitivity, penetration depth, and field strength while also compensating for any extraneous factors. By integrating these mechanisms, capacitive sensors can be elevated to the forefront of cutting-edge technology, providing outstanding performance and reliability.

3.2. Surface Contact between the Sensors and Sample Materials

When measuring solid materials through contact, the quality of surface contact between the sensors and sample materials, such as grain and seeds, is a crucial factor contributing to uncertainty. An air gap between the sample and electrode leads to a series of capacitances with the sample, resulting in an inaccurate estimation of the sample capacitance and impedance values. Determining the value of air capacitance is challenging since it depends on the roughness of the sample surface and electrodes. Silver paint forms electrodes to improve the contact quality between the sensor and the sample. Another effective technique to enhance the contact condition is to coat the sensors with gel. For example, in the clinical application of tomography, saline gel is applied to the patient’s skin to augment contact quality with electrodes [17].

3.3. Effect of Sensor Substrate and Backplane Electrode

The thickness of the sensor substrate primarily determines the distance between the driving electrodes and the backplane electrode. When the backplane and substrate are in close proximity, the field distribution sample can be affected, ultimately impacting the signal strength and penetration depth. Therefore, it is crucial to implement proper geometry design and backplane positioning to enhance the sensor results.
Moreover, the thickness of the substrate is a critical factor that affects the output characteristics of sensors. If the backplane is closer to the driving electrode, the signal strength decreases while the penetration depth increases. Conversely, a thicker substrate is preferred for a consistent response, although it may reduce the sensor’s penetration depth. These findings are supported by [23].

4. Modeling

To model the CFF capacitive sensor shown in Figure 5, we first derive Green’s function from a charged sensor over a two-layer (Teflon + SUT) half-space dielectric [24]. The Green’s function is then utilized in later MoM calculations of the sensor capacitance C [25]. Our theoretical analysis assumes infinite horizontal dimensions of the test pieces and infinitesimally thin sensor electrodes to facilitate mathematical modeling and analytical solutions.
The electrostatic potential Ψ in a cylindrical coordinate system is
2 ρ 2 + 1 ρ ρ + 2 z 2 Ψ j ρ , z = 0
where for a top two-layer configuration j = 0, 1, 2, and Ψ j ρ , z   represents the electrostatic potential in medium j. The potential is independent of azimuthal angle ϕ .
The zero-order Hankel transform (HT) f ~ k   of any function f ρ can be expressed as
f ~ k = 0 f ρ J 0 k ρ ρ d ρ
Apply the zero-order HT (2), making use of the following identity [26]
0 2 ρ 2 + 1 ρ ρ · f ρ J 0 k ρ · ρ · d ρ = k 2 f ~ k
where f ρ   is considered to be such that the terms f ρ · ρ · J 0 k ρ / ρ and J 0 k ρ · ρ · f ρ / ρ are eliminated at both limits.
Then Equation (2) is transformed into a 1-dimensional Helmholtz equation as
2 z 2 k 2 · Ψ ~ j k ,   z = 0
Here, the root with a positive real part will be taken for k .
From (4), general solutions for the potentials in each layer can be expressed as
Ψ ~ j k ,   z = A j k e k z + B j k e k z
h j z h j + 1
where h 1 , h 0 0 and h 3 . Additionally, A 3 k = B 0 k = 0 as the potential at infinite is zero.
The boundary conditions on electric fields are as follows,
z ^ × E 0 E 1 = 0  
z ^ × E j E j + 1 = 0 ,   f o r   j = 1   a n d   2
z ^ × D 0 D 1 = σ s ρ
z ^ × D j D j + 1 = 0 ,   f o r   j = 1   a n d   2
where σ s ρ   is the free surface charge density on the sensor surface and is only a function of ρ . Applying the HT to the boundary conditions for E and D, the corresponding boundary conditions for the potentials in the spectral domain are expressed as:
Ψ ~ 0 k ,   0 = Ψ ~ 1 k ,   0
ε 1 Ψ ~ 0 k ,   0 z = ε 0 Ψ ~ 0 k ,   0 z + σ ~ s k  
Ψ ~ j k ,   h i = Ψ ~ j + 1 k ,   h i
ε j Ψ ~ j k ,   h i z = ε j + 1 Ψ ~ j + 1 k ,   h i z  
where σ ~ s k is the HT of the spatial domain surface charge density σ s ( ρ ) at z = 0
σ ~ s k = 0 σ s ( ρ ) J 0 k ρ ρ d ρ
Substitute (6) into (11) to (14) to find the coefficient A 0 k as
A 0 k = σ ~ s k ( ε 0 + ε 1 ) k P ( k ) Q ( k )  
P k = 1 β 2 e 2 k h 1 β 3 e 2 k h 2 β 2 · β 3 e 2 k h 2 h 1  
Q k = 1 + β 1 · β 2 e 2 k h 1 + β 1 · β 3 e 2 k h 2 + β 2 · β 3 e 2 k ( h 2 h 1 )  
β j = ε j ε j 1 ε j ε j + 1  
Substitute the value of A 0 k from Equation (16) into Equation (6); the potential in the plane z = 0   is written as
Ψ ~ 0 k ,   0 = σ ~ s k ( ε 0 + ε 1 ) k P ( k ) Q ( k )
The present study employed the Method of Moments (MoM) to derive the capacitance of the sensor, denoted by C. As illustrated in Figure 6, the inner disc (outer annular ring) of the concentric sensor is divided into N (M) circular filaments, each having a width of D1 (D2) and a surface charge density that is invariant to variations in ρ . The expansion for the inner disc is utilized to deduce the sensor’s surface charge distribution, σ s ( ρ ) , through MoM calculations.
σ s ρ = n = 1 N σ n b n ( ρ )
where σ n   is the unknown coefficient, and b n ρ   is the pulse basis function:
b n ρ = 1 n 1 D 1 < ρ < n D 1 0 e l s e w h e r e  
The HT of the spatial domain surface charge density σ s ρ at z = 0   is expressed as
σ ~ s k = n = 1 N σ n b ~ n ( k )
where
b ~ n k = 0 b n ( ρ ) J 0 k ρ ρ d ρ = 1 k   n D 1 J 1 n D 1 k ( n 1 ) D 1 J 1 ( n 1 ) D 1 k
One can expand the surface charge density on the outer annular ring similarly, and (20) is written as
Ψ ~ 0 k ,   0 = n = 1 L σ n b ~ n ( k ) ( ε 0 + ε 1 ) k P ( k ) Q ( k )
where L = m + n. Multiply both sides of (25) by b ~ m k k   and integrate for k from 0 to ; (25) is expressed as the following integral form
1 ε 0 + ε 1 0 P k Q k n = 1 L σ n b ~ n k b ~ m k d k = 0 Ψ ~ 0 k ,   0 b ~ m k k d k  
and can be further discretized into the matrix equation below
G 11 G 11 G 1 L G 21 G 21 G 2 L G L 1 G L 1 G L L σ 1 σ 2 σ L = v ~ 1 v ~ 2 v ~ L
where
G m n = 1 ε 0 + ε 1 0 P k Q k n = 1 L b ~ n k b ~ m k d k
By using Parseval’s theorem, we have
0 Ψ ~ 0 k ,   z b ~ m k k d k = 0 Ψ ρ ,   0 b m ρ ρ d ρ  
and the right-hand side of (27) is written as
v ~ m = 0 Ψ ~ 0 k ,   z b ~ m k k d k = 0 Ψ ρ ,   0 b m ρ ρ d ρ  
To obtain a closed-form expression, we need to consider the constant potential Ψ 0 ρ ,   0   on the sensor surface. Using Equation (27), we can calculate the sensor surface charge distribution. By knowing σ s ρ , we can integrate over the electrode surfaces and obtain the total charge on both driving and sensing electrodes. Finally, the capacitance value ( C ) between the two electrodes, which is the sensor output signal, can be calculated as
C = Q V
Here, Q represents the total charge on each electrode, and V stands for the potential difference between the inner and outer electrodes.

5. Simulation Studies

The simulation investigation was conducted using the electrostatic solver of ANSYS Maxwell 15.0, a commercially accessible finite element software package. Different CFF sensors, such as sensor 1, sensor 2, and sensor 3, are simulated. The dimensions of the simulated sensors are shown in Table 1. The electrode material was copper. Any material under test (MUT) for sample testing was placed in the Teflon container, and the container was placed on the sensor surface, back side touching the Teflon base. When there was a change to the dielectric constant of the MUT, a change in capacitance value was observed in sensor 1 as shown in Figure 7. ANSYS software was used for design, utilizing a triangular mesh grid and an automatic adaptive mesh refinement approach. This gave higher accuracy in comparison to rectangular mesh grids. The voltage excitation applied to the driving electrode was + 3.3 V, and to the sensing electrode it was −3.3 V. Both the shielding electrode and the guarding electrode were connected to the 0 V. The metal cladding on the opposite side of the substrate provided guarding [27].
Field penetration of the sensor in the presence of the seed sample is also shown in Figure 7. The capacitance value of the sensor obtained through simulation results with the variation in moisture content is shown in Figure 8. An increase in the moisture content of a grain sample corresponded to an increase in its dielectric constant and capacitance value. Thus, the sensor’s capacitance value was directly proportional to the dielectric constant of the sample but the dielectric constant was nonlinearly related with moisture content. The effect of the field strength of the sensor decreased with an increase in the gap between the sensor and the test sample (Δh = 0 mm to 10 mm). Therefore, the capacitance value also exponentially decreased, as shown in Figure 9. This capacitive response predicted the behavior of a fringing sensor 1 when the test sample moved away from its surface. As the test sample moved away, the air gap formed a series capacitance, exponentially decreasing overall capacitance. This same behavior was observed with the fringing sensors 2 and 3.

6. Fabrication of the Sensors and Experimental Results

6.1. Sensor Fabrication

These three concentric sensors were fabricated using copper-clad Roger PCB substrates (RO4004) and copper etchant solution (FeCl3). This shows that such sensors can be fabricated at an economical price in bulk. The concentric fringing field sensors were first designed with the help of AUTOCAD software (v2023). The dimensions of the sensors are shown in Table 1. PCB substrates were cleaned thoroughly using acetone and ethanol by keeping the substrates dipped in the solution in an ultrasonic bath. The substrates were cleaned in distilled water and, finally, in sulfuric acid, to remove the oxide layer. The cleaned copper-clad substrates were dried in dry nitrogen gas. The concentric patterns of the electrodes, as shown in the schematic diagram in Figure 3, were printed on photo paper through an inkjet printer. The print was then transferred to the copper layer of the PCB using a thermal heating press. Then, the patterned PCB substrates were dipped in FeCl3 solution for some time. The exposed parts of the copper were etched out. The substrates were then cleaned thoroughly using acetone, ethyl alcohol, and distilled water, and then dried out in nitrogen gas flow [27]. Figure 10 shows the photograph of one of the sensors. BNC connectors were used to make contacts on the electrodes using a shielded coaxial short-length cable.

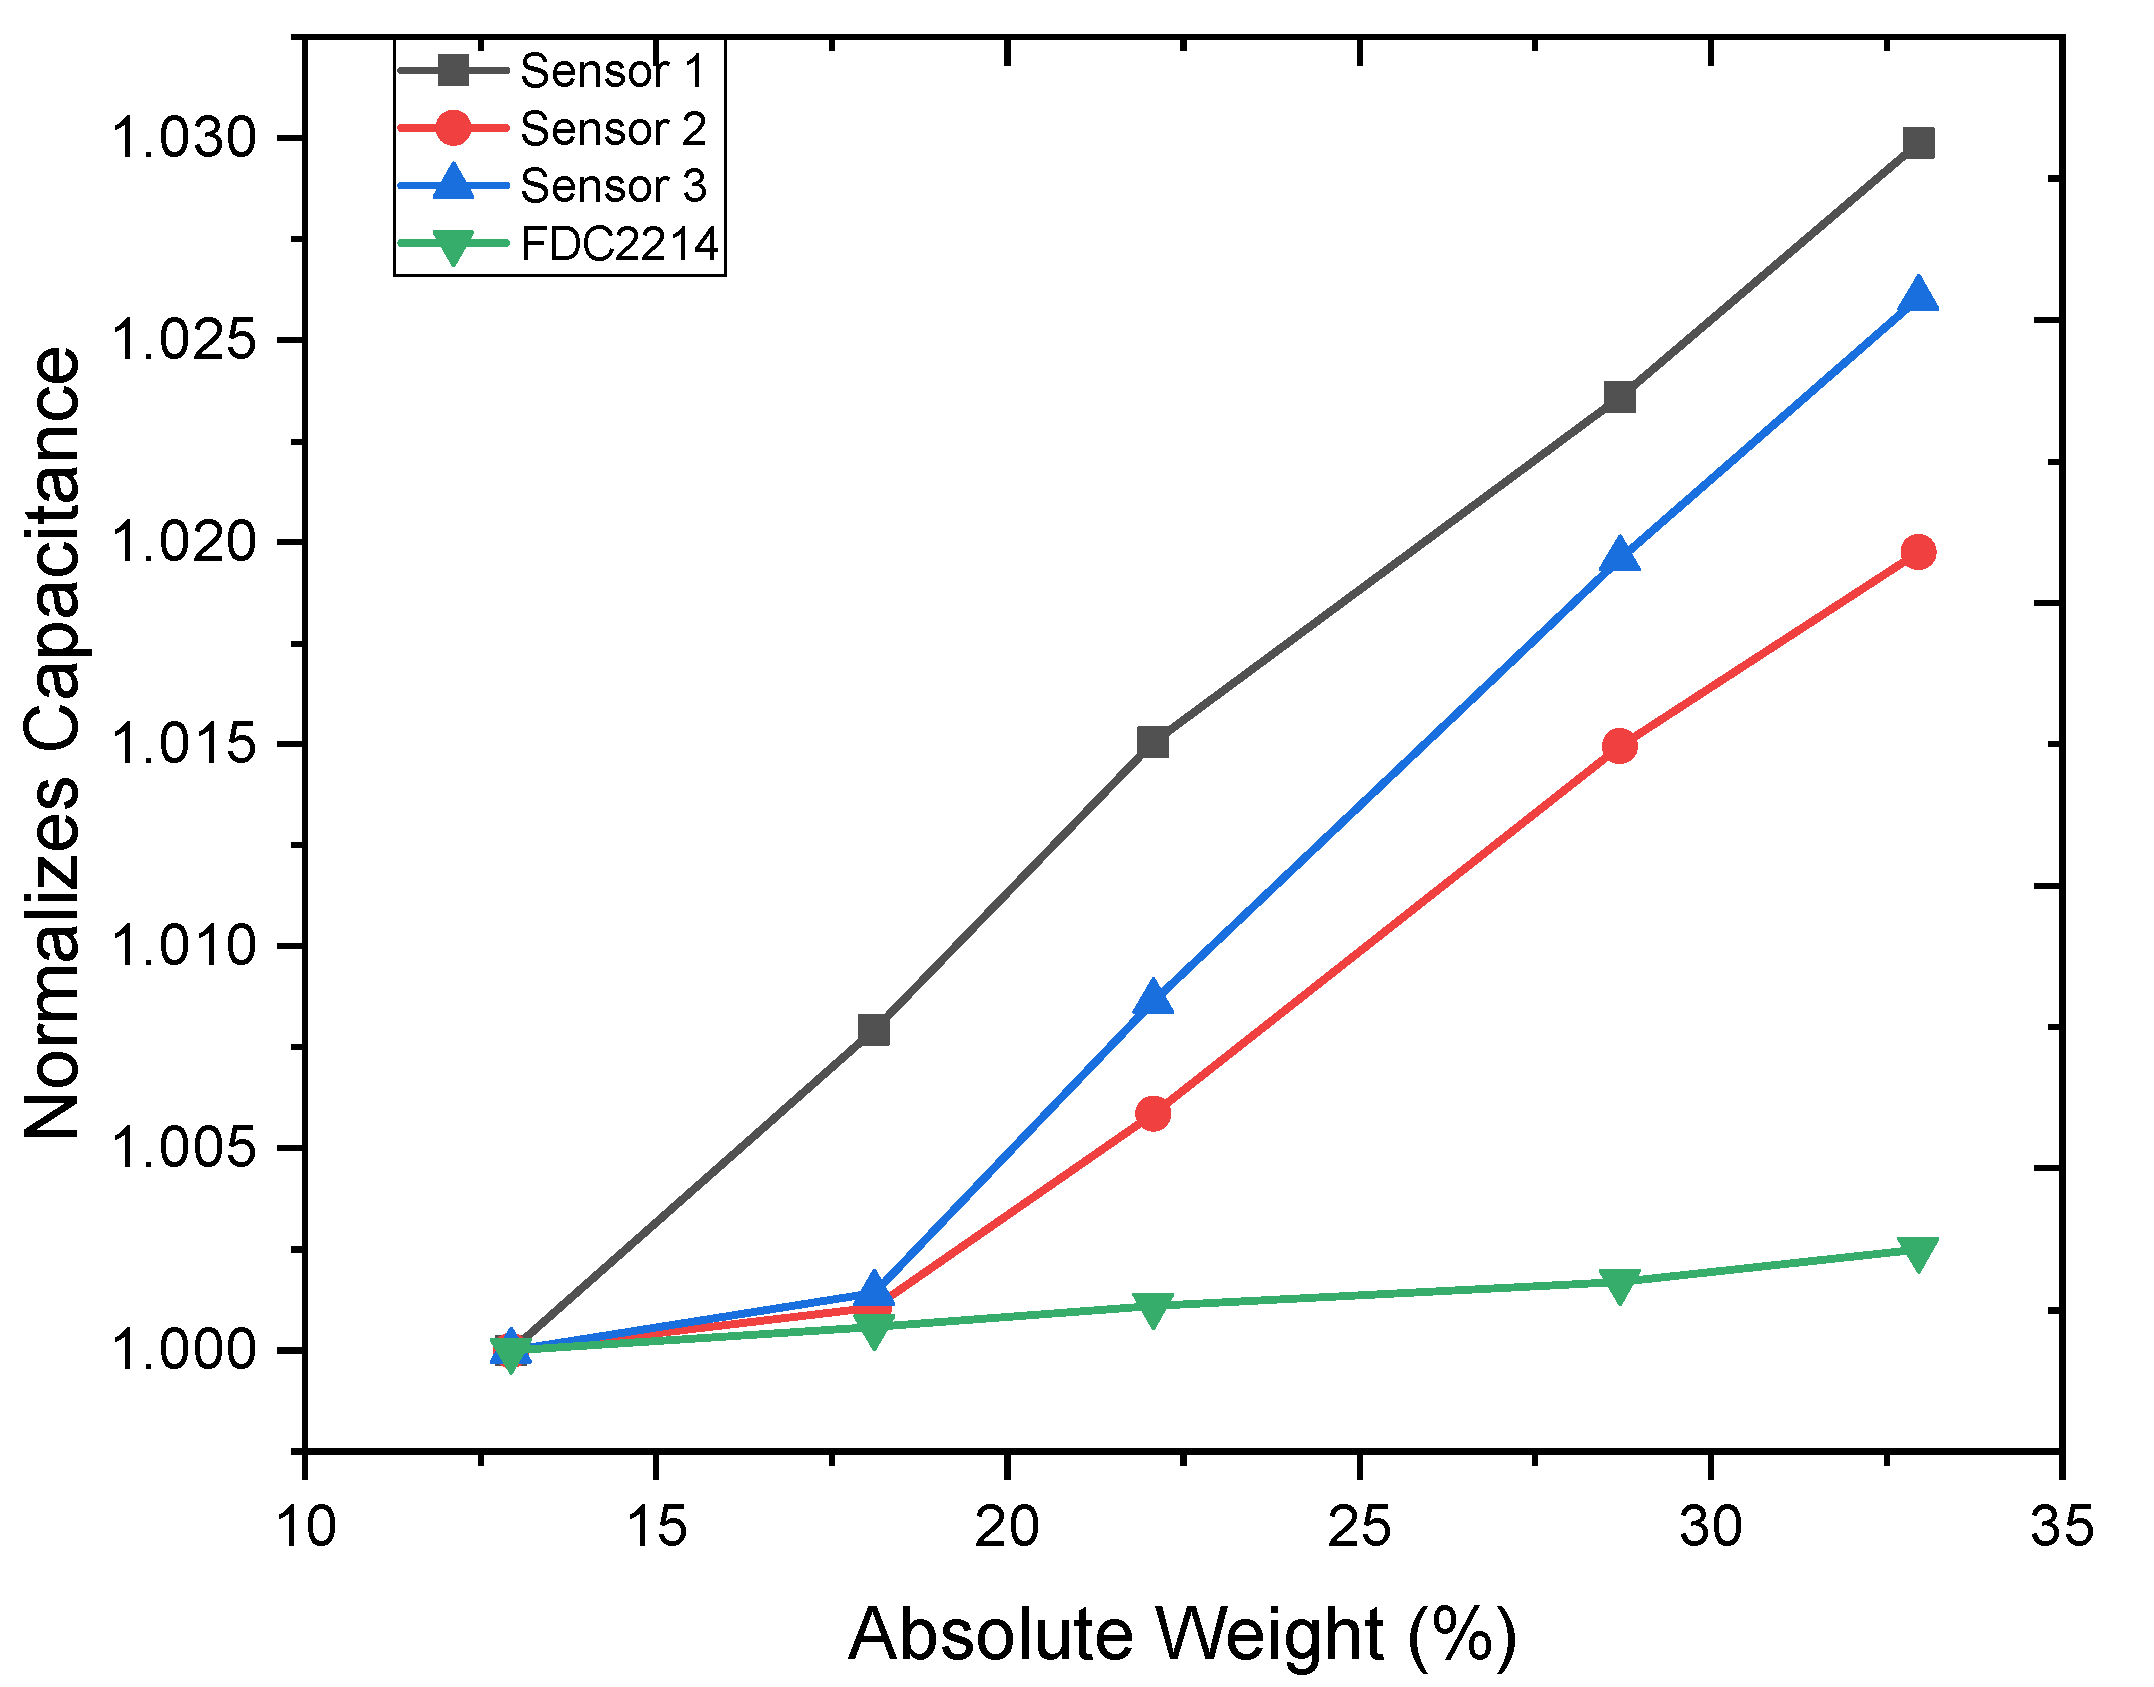
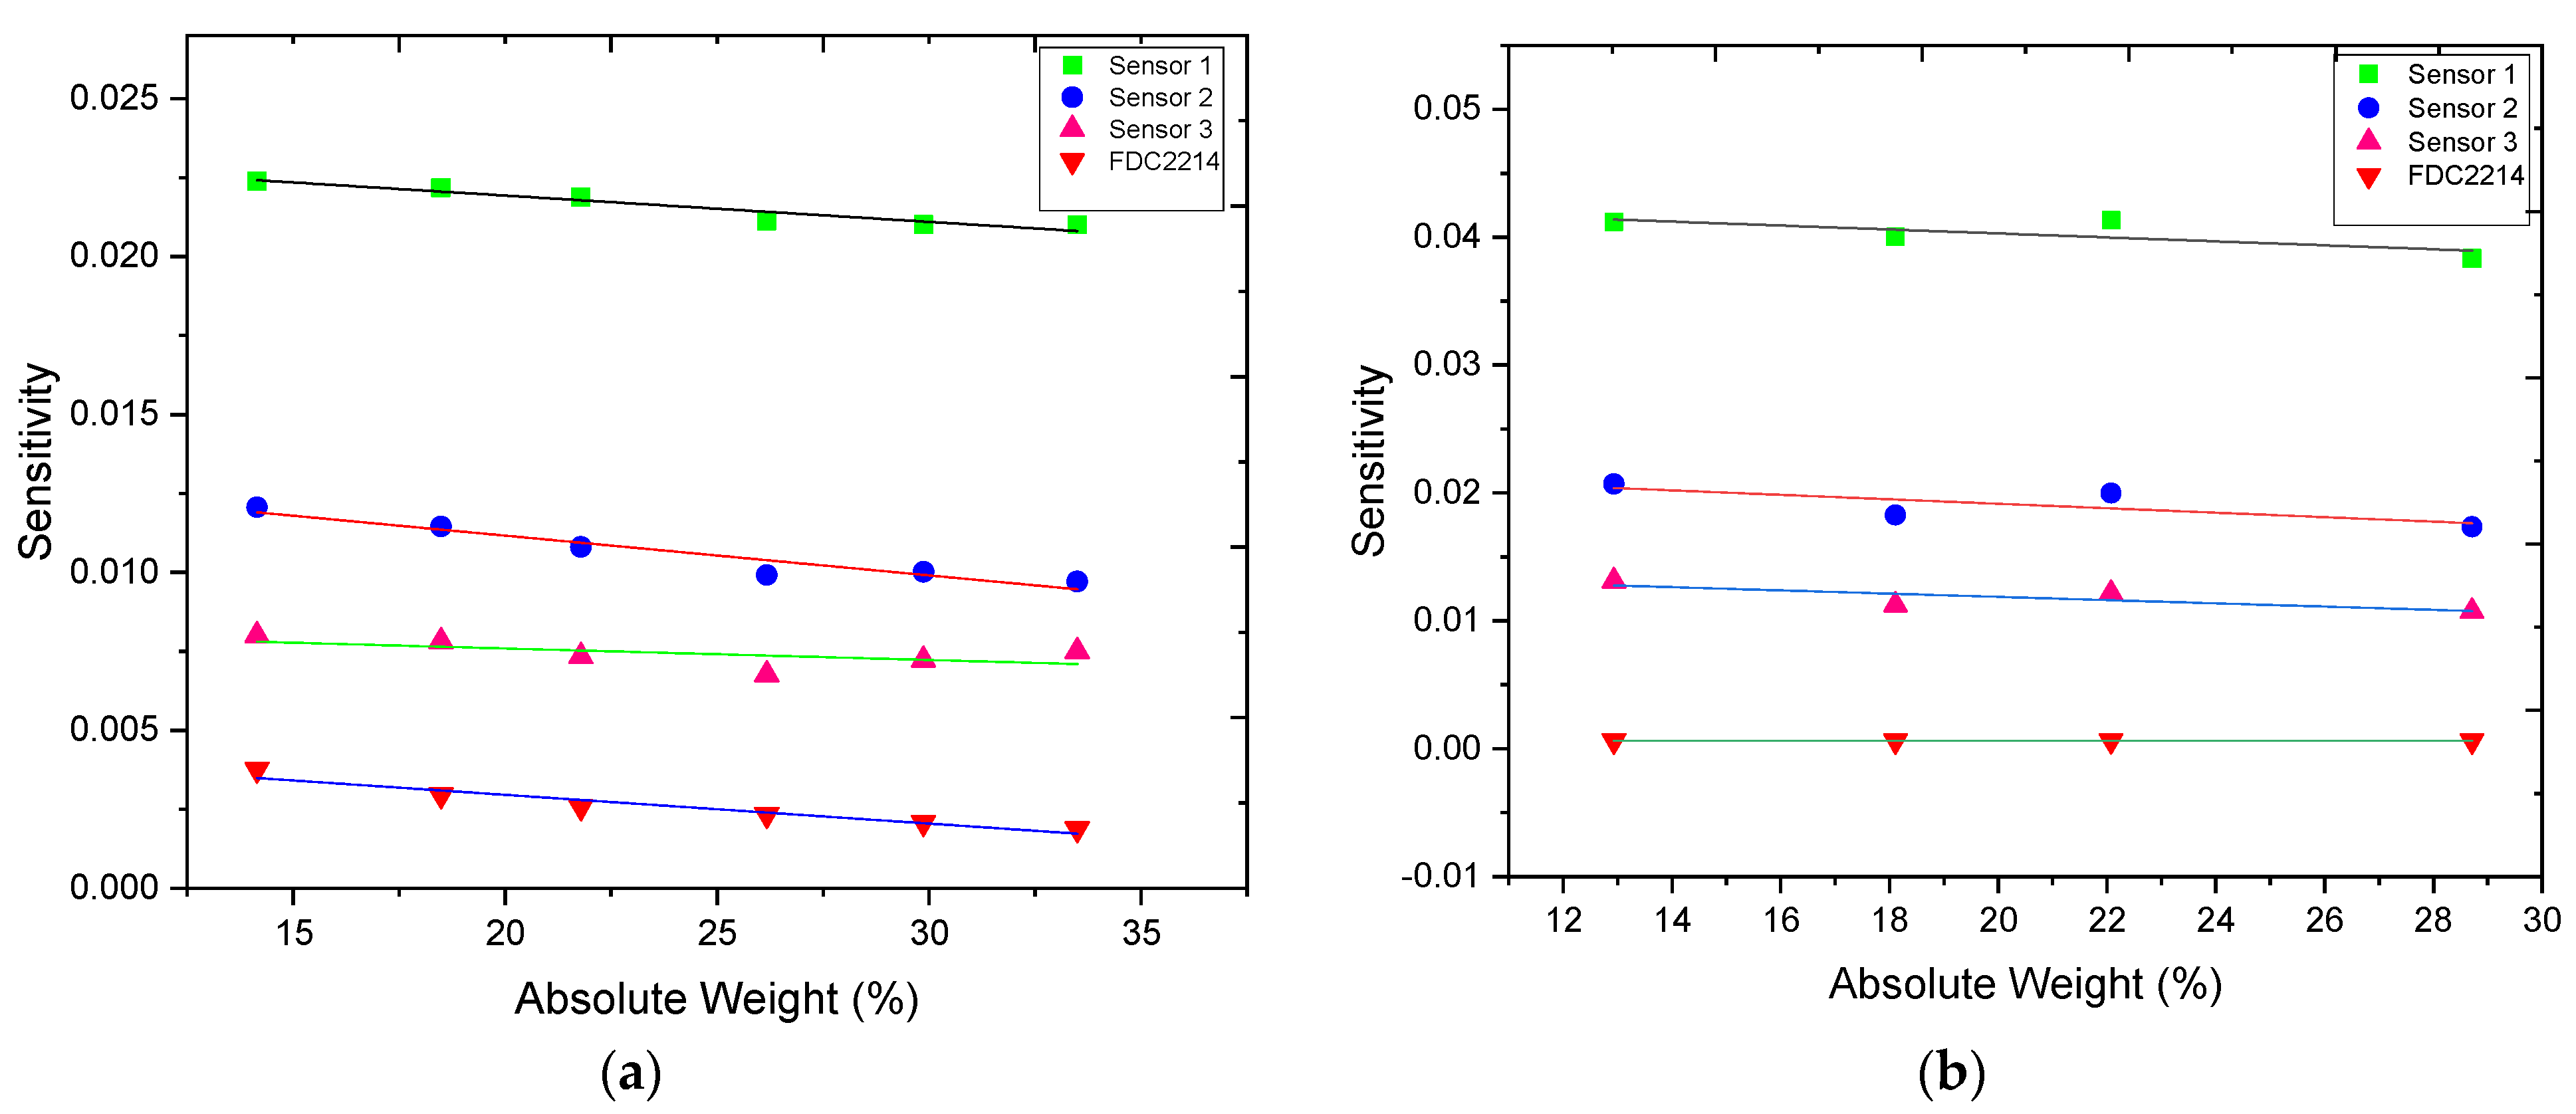
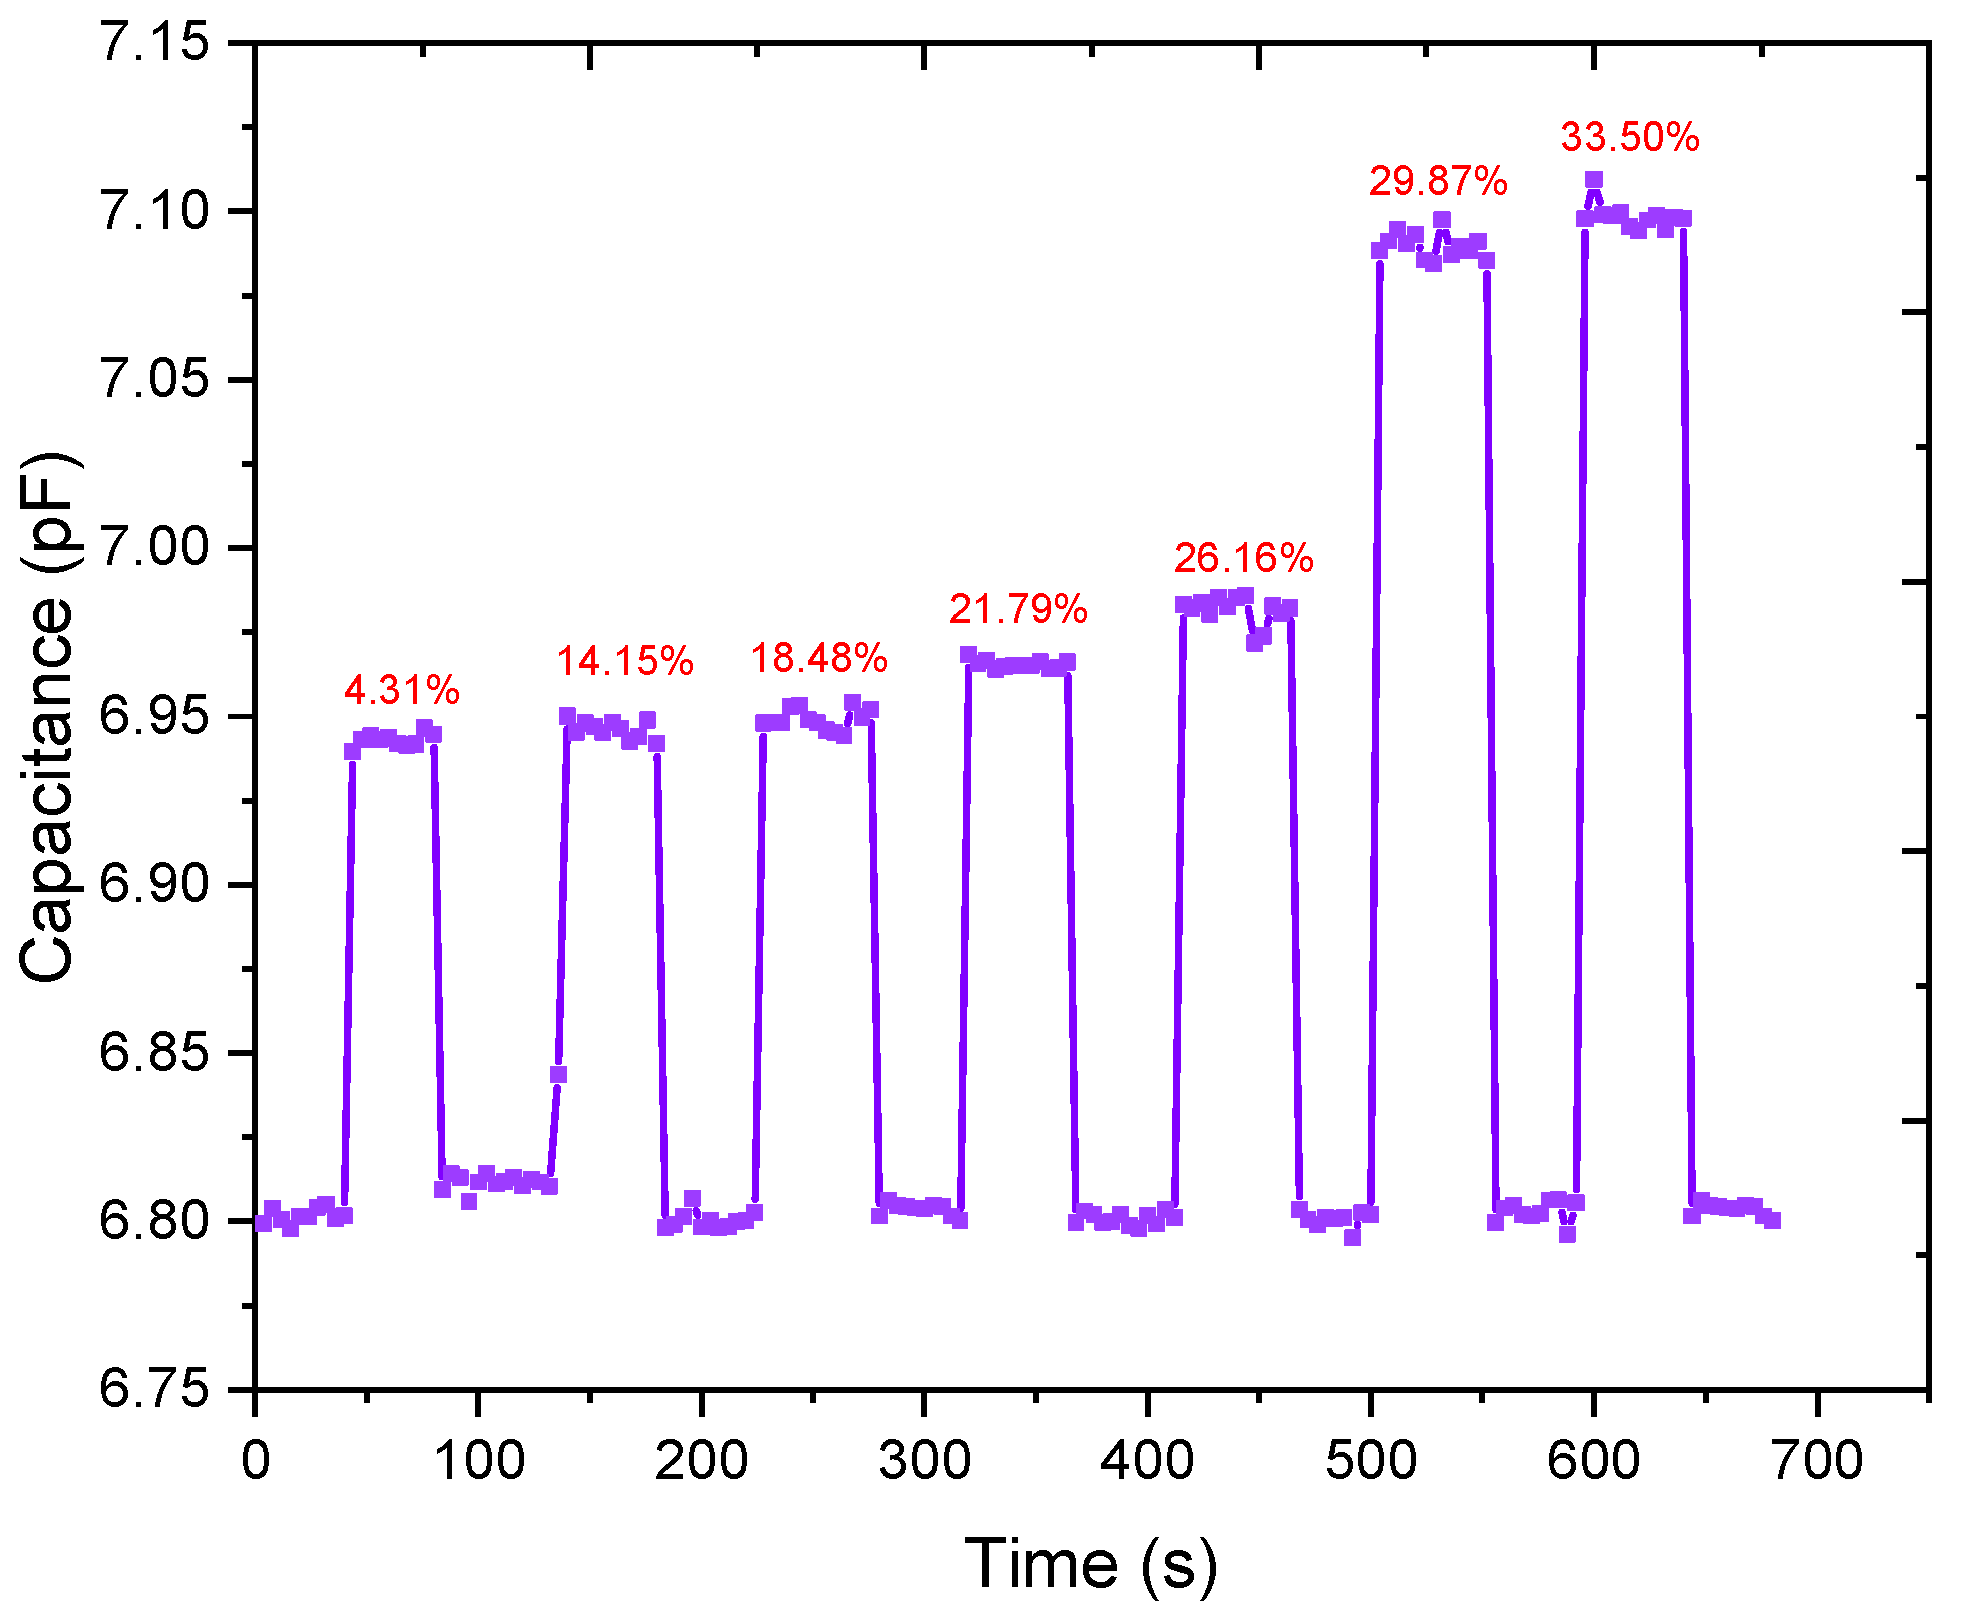
6.2. Experimental Methods and Results

The evaluation module (EVM) for the capacitance to digital converter (CDC) (FDC 1004, Texas Instruments, Dallas, TX, USA) was used to measure the sensors’ capacitance value. The capacitive sensing algorithm utilized in the FDC1004 system employs a switched capacitor circuit to facilitate the transfer of charge from the sensor electrode to the sigma-delta analog-to-digital converter (ADC). A 2.4 V, 25 kHz step waveform is applied to the sensor line for a specific duration to allow for charge accumulation on the electrode. The charge is then transferred to a sample-hold circuit, and the resulting analog voltage is converted to a digital signal by the sigma-delta ADC. The digital signal is then filtered and corrected based on gain and offset calibrations, ensuring accuracy and precision in the final results. The Sensing Solutions EVM GUI (Texas Instruments) provided a comprehensive platform for configuring the registers of FDC1004, displaying measured values graphically, and exporting data in CSV format. This software is an ideal tool for professionals to use when working with FDC1004, as it streamlines the process and ensures accurate results. The sensors’ terminals were connected to the board, which was interfaced with the laptop through the I2C serial interfacing system. The sensor capacitance value was directly converted into digital data, acquired through the interface, and stored in decimal form. The capacitance value corresponding to each decimal datum was obtained using an expression given in the datasheet. It had a resolution of 0.5 fF, with a capacitance range of 0–400 pF. The operating voltage of the board was 3.3 V. Its operating temperature ranged from −40 °C to 125 °C [27].
The experimental setup for the measurement of sensor capacitance using FDC1004 is shown in Figure 11. The CFF sensor was attached to the insulated stand. The sample preparation for testing moisture in grains (chickpea) and mustard seeds is time-consuming. Therefore, different moisture-content grain samples were prepared carefully. Ambient temperature affects the moisture content. Seeds and grains have different absorption rates and water absorption capacities. Understanding water absorption in legumes during soaking is important since it affects succeeding processes and the quality of the final product. We took a fixed amount of samples (15 g of chickpea and 18 g of mustard seed) in different plastic glasses. The digital weighing machine was used to measure the weight of the sample. Then 20 mL water was added to all the samples and kept for soaking for sufficient time. All the samples prepared had different moisture content. During water immersion, water spread slowly into the seeds and eventually reached a constant moisture level. The fixed time interval for the sample was 10 min. Warm water typically reduces the soaking time [28] because higher temperature increases moisture diffusivity, leading to a high hydration rate. Seven moisture-content chickpea grain samples were prepared with moisture variation from 4% to 33% by weight. For mustard seeds, four moisture-content samples were prepared. The fresh chickpea sample had nearly 4% weight moisture.
After the sample preparation, experiments were conducted to measure each sample’s capacitance change. The base capacitance values of the sensors 1, 2, 3, and FDC2214 were 4.4 pF, 8.9 pF, 6.8 pF, and 53.5 pF, respectively. The experiment was conducted with each sample one by one. The first sample with 4.3% moisture, in a Teflon container, was placed on the sensor, and the capacitance value was noted when it was stable. The experiment with each sample was repeated at least five times, and then the average capacitance value of the five experiments was noted. Dedicated software acquired the data after a fixed interval of time. Ambient conditions were kept constant (room temperature 25 ± 2 ℃). Then, the capacitance value of the second sample was measured in the same manner as that of sample one. Experiments were conducted with all three sensors for each sample. Due to the samples’ moisture level variation, the capacitance values were varied. Experiments were also conducted with the FDC2214 proximity sensor supplied with the evaluation board. The moisture content in grains was measured using the following expression
A b s o l u t e   w e i g h t   % = W m W d W d × 100  
where W m   is the weight of the sample with moisture content, and W d is the weight of the dry sample.
Figure 12 shows the normalized capacitance variation of the three sensors and the FDC2214 sensor with moisture variation in chickpea grains from 4% to 33%. Figure 13 shows the normalized capacitance variation of the three sensors and the FDC2214 sensor with moisture variation in mustard seeds from 12% to 29%. The capacitance value of each sensor increased with an increase in moisture, but sensor 1 showed the maximum sensitivity, and the FDC2214 sensor showed the minimum sensitivity.
The normalized capacitance value was taken to observe the significant change in capacitance value. It showed an almost linear relation.
Table 2 and Table 3 show changes in capacitance corresponding to the base values of the sensors at different absolute weight percentages of chickpea and mustard seed, respectively.
Variations of sensitivities of different sensors with moisture variations in chickpea and mustard seed are shown in Figure 14. The sensitivity S   %   is determined by
S = ( C w g C o ) / C o M w g M o
where C o , C w g , M o , and M w g are the capacitances and grain weights of the dry and wet samples, respectively. Since the sensors had different electrode geometries, the capacitance values differed for different dry and wet samples. The sensitivity value of sensor 1 was the maximum for both the chickpea and mustard seed samples, but a minor decrease in sensitivity in the higher moisture content grain samples was due to a more pronounced effect of the fringing field.
It was further shown that the sensitivities of the fabricated sensors were relatively higher compared to the coplanar commercial FDC2214 proximity sensor. The electrode’s suitable dimensions are important for moisture measurement in grain samples. The average sensitivity of sensor 1 was 20.2 fF/absolute weight (percentage) for chickpeas and 31.0 fF/absolute weight percentage for mustard seeds. The repeatability test results for sensor 1 for different moisture content of chickpeas are shown in Figure 15. The transient response of sensor 1 from 1% to 21.79% change in moisture is shown in Figure 16. The response and recovery time were approximately 1.5 s and 2 s, respectively.
Finally, efforts were made to compare the performance of the sensors with other sensors reported in the literature. Different varieties of chickpea grains have various shapes and sizes. Mustard seeds are comparatively hydrophobic. Many works have been reported, but the experimental results on chickpea and mustard grains are limited. These crops are harvested in large quantities in the Indian subcontinent, and most of the time, unskilled or semi-skilled farmers are involved in harvesting them. A user-friendly, cost-effective system will be helpful to them in knowing the exact quality of the seeds. Since there is little work on chickpea/mustard grains using concentric fringing field sensors, a comparison was made with different grain samples. Table 4 compares the moisture measurements of food grains reported in the literature.

7. Conclusions

This work attempted to develop a concentric fringing field capacitive nondestructive sensor to measure moisture in chickpea and mustard seeds. Three concentric fringing field capacitive sensors with different electrodes were modeled, designed, simulated, and fabricated. Simulation results showed that the capacitance value increased with an increase in moisture in seeds due to an increase in the dielectric constant of the seed samples. The experimental results showed that the average sensitivity of sensor 1 was 20.2 fF/absolute weight percentage for chickpeas and 31.0 fF/absolute weight percentage for mustard seeds. The findings indicate that the sensors detected the moisture content of chickpea and mustard seeds with quick response time and acceptable accuracy. The sensor is inexpensive, simple to use, and durable due to its noncontact measurement, but it is effective.

Author Contributions

Conceptualization, G.A., O.P.M. and T.I.; methodology, G.A., O.P.M., R.M. and T.I.; software, G.A., O.P.M. and A.U.K.; validation, O.P.M., T.I. and A.U.K.; formal analysis, T.I., A.U.K. and R.M.; investigation, T.I., A.U.K. and R.M.; resources, T.I.; writing—original draft preparation, T.I., G.A. and O.P.M.; writing—review and editing, T.I. and A.U.K. All authors have read and agreed to the published version of the manuscript.

Funding

This research was funded by the Deputyship for Research & Innovation, Ministry of Education in Saudi Arabia, project number ISP23-53.

Institutional Review Board Statement

Not applicable.

Informed Consent Statement

Not applicable.

Data Availability Statement

Data are contained within the article.

Acknowledgments

The authors extend their appreciation to the Deputyship for Research & Innovation, Ministry of Education in Saudi Arabia for funding this research work through the project number ISP23-53.

Conflicts of Interest

The authors declare no conflicts of interest.

References

  1. Aswani, G.; Islam, T. Capacitive fringing sensor based on PCB for the detection of moisture content in grain. In Proceedings of the 2023 International Conference on Power, Instrumentation, Energy and Control (PIECON), Aligarh, India, 10–12 February 2023; pp. 1–5. [Google Scholar]
  2. Prajapati, A.K.; Chaudhari, P.K.; Pal, D.; Chandrakar, A.; Choudhary, R. Electrocoagulation treatment of rice grain based distillery effluent using copper electrode. J. Water Process Eng. 2016, 11, 1–7. [Google Scholar] [CrossRef]
  3. Li, Z.; Zhang, Y.; Zhang, L. On research of automatic control about moisture content for cereal grains. J. Shenyang Norm. Univ. 2008, 26, 79–81. [Google Scholar]
  4. Cheng, W.; Bai, X.; Shen, J.; Wang, X. An on-line measurement and monitoring system for grain moisture during the drying process. Trans. Chin. Soc. Agric. Mach. 2000, 31, 53–55. [Google Scholar]
  5. Guan, H. Design of Team Economic Accounting Management System in Petrochemical Industry. Int. J. Digit. Content Technol. 2011, 5, 133–149. [Google Scholar]
  6. Baofeng, Z.; Hao, W. Capacitive measuring of grain moisture. J. Liaoning Inst. Technol. 2002, 22, 1–3. [Google Scholar]
  7. Yang, L.; Mao, Z.; Dong, L. Development of plane polar probe of capacitive grain moisture sensor. Trans. Chin. Soc. Agric. Eng. 2010, 26, 185–189. [Google Scholar]
  8. Li, Y.-T.; Chao, C.-M.; Wang, K. A capacitance level sensor design and sensor signal enhancement. In Proceedings of the 2011 6th IEEE International Conference on Nano/Micro Engineered and Molecular Systems, Kaohsiung, Taiwan, 20–23 February 2011; pp. 847–850. [Google Scholar]
  9. Islam, T.; Yousuf, M.; Nauman, M. A highly precise cross-capacitive sensor for metal debris detection in insulating oil. Rev. Sci. Instrum. 2020, 91, 025005. [Google Scholar] [CrossRef]
  10. Jaworski, A.; Bolton, G.T. The design of an electrical capacitance tomography sensor for use with media of high dielectric permittivity. Meas. Sci. 2000, 11, 743. [Google Scholar] [CrossRef]
  11. Li, X.; Zyuzin, A.; Mamishev, A. Measuring moisture content in cookies using dielectric spectroscopy. In Proceedings of the 2003 Annual Report Conference on Electrical Insulation and Dielectric Phenomena, Albuquerque, NM, USA, 19–22 October 2003; pp. 459–462. [Google Scholar]
  12. Craig, D.Q.M. Dielectric spectroscopy as a novel analytical technique within the pharmaceutical sciences. STP Pharma Sci. 1995, 5, 421–428. [Google Scholar]
  13. Sundara-Rajan, K.; Byrd, L.; Mamishev, A.V. Moisture content estimation in paper pulp using fringing field impedance spectroscopy. IEEE Sens. J. 2004, 4, 378–383. [Google Scholar] [CrossRef]
  14. Jabbari, A.; Humayed, A.; Reegu, F.A.; Uddin, M.; Gulzar, Y.; Majid, M. Smart Farming Revolution: Farmer’s Perception and Adoption of Smart IoT Technologies for Crop Health Monitoring and Yield Prediction in Jizan, Saudi Arabia. Sustainability 2023, 15, 14541. [Google Scholar] [CrossRef]
  15. Wahab, S.; Muzammil, K.; Nasir, N.; Khan, M.S.; Ahmad, M.F.; Khalid, M.; Ahmad, W.; Dawria, A.; Reddy, L.K.V.; Busayli, A.M. Advancement and new trends in analysis of pesticide residues in food: A comprehensive review. Plants 2022, 11, 1106. [Google Scholar] [CrossRef]
  16. Al-Harrasi, A.; Bhtaia, S.; Al-Azri, M.S.; Makeen, H.A.; Albratty, M.; Alhazmi, H.A.; Mohan, S.; Sharma, A.; Behl, T. Development and characterization of chitosan and porphyran based composite edible films containing ginger essential oil. Polymers 2022, 14, 1782. [Google Scholar] [CrossRef] [PubMed]
  17. Webster, J.G. Electrical Impedance Tomography; Adam Hilger: New York, NY, USA, 1990. [Google Scholar]
  18. Chen, T.; Bowler, N. Design of interdigital spiral and concentric capacitive sensors for materials evaluation. In AIP Conference Proceedings; American Institute of Physics: College Park, MD, USA, 2013; pp. 1593–1600. [Google Scholar]
  19. Khan, A.U. Expansion of the Analytical Modeling of Capacitance for 1-N-1 Multilayered CID Structures with Monotonically Increasing/Decreasing Permittivity. Sensors 2023, 23, 5838. [Google Scholar] [CrossRef]
  20. Mamishev, A.V.; Lesieutre, B.C.; Zahn, M.; Insulation, E. Optimization of multi-wavelength interdigital dielectrometry instrumentation and algorithms. IEEE Trans. Dielectr. 1998, 5, 408–420. [Google Scholar] [CrossRef]
  21. Mamishev, A.V.; Du, Y.; Bau, J.H.; Lesieutre, B.C.; Zahn, M.; Insulation, E. Evaluation of diffusion-driven material property profiles using three-wavelength interdigital sensor. IEEE Trans. Dielectr. 2001, 8, 785–798. [Google Scholar] [CrossRef]
  22. Gao, X.; Zhao, Y.; Ma, H. Fringing electric field sensors for anti-attack at system-level protection. J. Sens. 2018, 18, 3034. [Google Scholar] [CrossRef]
  23. Li, X.B.; Larson, S.D.; Zyuzin, A.S.; Mamishev, A.V. Design principles for multichannel fringing electric field sensors. IEEE Sens. J. 2006, 6, 434–440. [Google Scholar] [CrossRef]
  24. Chen, T.; Song, J.; Bowler, J.R.; Bowler, N. Analysis of a concentric coplanar capacitive sensor using a spectral domain approach. In AIP Conference Proceedings; American Institute of Physics: College Park, MD, USA, 2011; pp. 1647–1654. [Google Scholar]
  25. Harrington, R.F. Field computation by moment methods. Macmillan Comp. 1968, 130, 276–280. [Google Scholar]
  26. Tranter, C.J. Integral Transforms in Mathematical Physics; Methuen & Co.: London, UK, 1956. [Google Scholar]
  27. Islam, T.; Maurya, O.P.; Khan, A.U. Design and fabrication of fringing field capacitive sensor for non-contact liquid level measurement. IEEE Sens. J. 2021, 21, 24812–24819. [Google Scholar] [CrossRef]
  28. Shafaei, S.; Masoumi, A.; Roshan, H. Analysis of water absorption of bean and chickpea during soaking using Peleg model. J. Saudi Soc. Agric. Sci. 2016, 15, 135–144. [Google Scholar] [CrossRef]
  29. Briggs, L.J. An electrical resistance method for the rapid determination of the moisture content of grain. Science 1908, 28, 810–813. [Google Scholar] [CrossRef]
  30. Okabe, T.; Huang, M.; Okamura, S. A new method for the measurement of grain moisture content by the use of microwaves. J. Agric. Eng. Res. 1973, 18, 59–66. [Google Scholar] [CrossRef]
  31. Nelsont, S. Use of electrical properties for grain-moisture measurement. J. Microw. Power 1977, 12, 67–72. [Google Scholar] [CrossRef]
  32. Tripathi, R.; Gupta, M.; Shukla, J. Capacitance technique for measuring moisture content using dielectric data an immersion method. In Proceedings of the ICDL’96. 12th International Conference on Conduction and Breakdown in Dielectric Liquids, Rome, Italy, 15–19 July 1996; pp. 440–441. [Google Scholar]
  33. Kim, K.-B.; Kim, J.-H.; Lee, S.S.; Noh, S.H. Measurement of grain moisture content using microwave attenuation at 10.5 GHz and moisture density. IEEE Trans. Instrum. 2002, 51, 72–77. [Google Scholar]
  34. Kandala, C.V. Moisture determination in single peanut pods by complex RF impedance measurement. IEEE Trans. Instrum. 2004, 53, 1493–1496. [Google Scholar] [CrossRef]
  35. Mizukami, Y.; Sawai, Y.; Yamaguchi, Y. Moisture content measurement of tea leaves by electrical impedance and capacitance. Biosyst. Eng. 2006, 93, 293–299. [Google Scholar] [CrossRef]
  36. Tsukada, K.; Kiwa, T. Magnetic measurement of moisture content of grain. IEEE Trans. Magn. 2007, 43, 2683–2685. [Google Scholar] [CrossRef]
  37. Kandala, C.V.; Butts, C.L.; Nelson, S.O. Capacitance sensor for nondestructive measurement of moisture content in nuts and grain. IEEE Trans. Instrum. Meas. 2007, 56, 1809–1813. [Google Scholar] [CrossRef]
  38. McIntosh, R.B.; Casada, M.E. Fringing field capacitance sensor for measuring the moisture content of agricultural commodities. IEEE Sens. J. 2008, 8, 240–247. [Google Scholar] [CrossRef]
  39. Klomklao, P.; Kuntinugunetanon, S.; Wongkokua, W. Moisture content measurement in paddy. In Journal of Physics: Conference Series; IOP Publishing: Bristol, UK, 2017; p. 012068. [Google Scholar]
  40. Yigit, E.; Sabanci, K.; Toktas, A.; Ustun, D.; Duysak, H. Grain moisture detection by using a-scan radar measurement. In Proceedings of the 2018 XXIIIrd International Seminar/Workshop on Direct and Inverse Problems of Electromagnetic and Acoustic Wave Theory (DIPED), Tbilisi, Georgia, 24–27 September 2018; pp. 222–224. [Google Scholar]
Figure 1. Sensor designed with interdigitated periodic structures.
Sustainability 16 01847 g001
Figure 2. Estimation of the adequate penetration depth of a fringing field sensor.
Sustainability 16 01847 g002
Figure 3. Concentric fringing field (CFF) capacitive sensors (a) without shield electrode and (b) with shield electrode.
Sustainability 16 01847 g003
Figure 4. Pattern of electric field line distribution illustrating the effect of the additional shielding electrode (a) without shield electrode and (b) with shield electrode.
Sustainability 16 01847 g004
Figure 5. Concentric fringing field (CFF) capacitive sensors with two-layer dielectric (Teflon + SUT).
Sustainability 16 01847 g005
Figure 6. Sensor with ‘n’ circular filaments arranged on the inner disc and ‘m’ circular filaments placed on the outer annular ring.
Sustainability 16 01847 g006
Figure 7. Electric field distribution of a concentric fringing field sensor (a) Δh = 0 mm and (b) Δh = 10 mm.
Sustainability 16 01847 g007
Figure 8. The simulated capacitance value of the sensors with the variation of the dielectric constant of the test sample.
Sustainability 16 01847 g008
Figure 9. Effect of air gap between the sensor and the test sample.
Sustainability 16 01847 g009
Figure 10. Photo of the fabricated sensor 1.
Sustainability 16 01847 g010
Figure 11. Experimental setup for the measurement of sensor capacitance.
Sustainability 16 01847 g011
Figure 12. Normalized capacitance variation with the variation of the moisture in chickpea grains.
Sustainability 16 01847 g012
Figure 13. Normalized capacitance variation with the variation of the moisture in mustard seeds.
Sustainability 16 01847 g013
Figure 14. Sensitivities of the sensors at different moisture levels: (a) chickpea grains (b) mustard seeds.
Sustainability 16 01847 g014
Figure 15. The repeatability test of sensor 1 with different moisture contents of chickpea.
Sustainability 16 01847 g015
Figure 16. Transient response of sensor 1 to 21.79% moisture content of chickpea.
Sustainability 16 01847 g016
Table 1. Dimensions of the sensors.
SensorsElec. Width
(mm)
ThicknessGap
(mm)
Radius of a Central Electrode (mm)Backplane Outer, Inner Radius (mm)Backplane Inner Guard Radius (mm)
13.53512.519.5, 129
23351.5221.5, 85
34352.0325, 128
Table 2. Change in capacitance of the sensors with chickpea samples.
Absolute WeightSensor 1Sensor 2Sensor 3FDC 2214
(%)ΔC (pF)
4.3100.2330.2480.1410.417
14.1500.2450.2670.1450.427
18.4840.2640.2840.1470.438
21.7860.3130.3060.1640.449
26.1670.3800.3180.1750.489
29.8650.4130.3560.2880.499
33.4950.4400.4360.2970.504
Table 3. Change in capacitance of the sensors with mustard seeds samples.
Absolute WeightSensor 1Sensor 2Sensor 3FDC 2214
(%)ΔC (pF)
12.9340.5330.4920.2390.077
18.1080.5710.5020.2490.108
22.0730.6320.5660.3290.136
28.7090.6480.6610.3780.168
Table 4. Comparison of the FFC sensors with other techniques in the literature for food grain moisture.
Ref.Frequency (Hz)YearTechnique UsedTest SampleAdvantages
[29]-1908Grain moisture meterRice and barleyNon-invasive
[30]9.4 G1973MicrowavesGrainsNon-invasive
[31]-1977Electrical resistanceSoil and wheatLow cost
[32]200 K1996Double capacitor cell12 grains were usedNon-invasive
[33]10.5 G2002Differential frequencyBrown riceNon-invasive
[34]1 M to 5 M2004Complex RF impedancePeanutNon–invasive
[35]10 M to 1 M2006Electrical spectroscopyTea leafNon–invasive
[36]-2007Magnetic transducerPeanutsNon–invasive
[37]1 M to 5 M2007RF impedance methodNuts and grainNon–invasive
[38]-2008Fringing field capacitive sensor-Non–invasive
[39]-2017555 timerPaddyNon–invasive
[40]1 G to 6 G2018A scan radarWheatNon–invasive
This work25 K to 400 K2023Concentric FFCChickpea, mustardNon–invasive
Disclaimer/Publisher’s Note: The statements, opinions and data contained in all publications are solely those of the individual author(s) and contributor(s) and not of MDPI and/or the editor(s). MDPI and/or the editor(s) disclaim responsibility for any injury to people or property resulting from any ideas, methods, instructions or products referred to in the content.

