Article

Tri-Objective Vehicle Routing Problem to Optimize the Distribution Process of Sustainable Local E-Commerce Platforms

by
Francesco Pilati
* and
Riccardo Tronconi
Department of Industrial Engineering, University of Trento, Via Sommarive 9, 38123 Trento, Italy
*
Author to whom correspondence should be addressed.
Sustainability 2024, 16(5), 1810; https://doi.org/10.3390/su16051810
Submission received: 11 December 2023 / Revised: 30 January 2024 / Accepted: 20 February 2024 / Published: 22 February 2024

Abstract

:
The dramatic growth of online shopping worldwide in the last few years generated negative consequences for local small retailers who do not adopt information technologies. Furthermore, the e-commerce sector is considered a good opportunity to develop sustainable logistic processes. To reach this goal, the proposed paper presents a mathematical model and a metaheuristic algorithm to solve a multi-objective capacitated vehicle routing problem (CVRP) distinguished by economic, green, and ethical objective functions. The proposed algorithm is a multi-objective simulated annealing (MOSA) that is implemented in a software architecture and validated with real-world instances that differ for the product type delivered and the geographic distribution of customers. The main result of each test is a tri-dimensional Pareto front, i.e., a decision-support system for practitioners in selecting the best solution according to their needs. From these fronts, it can be observed that if the economic and environmental performances slightly deteriorate by 1.6% and 4.5%, respectively, the social one improves by 19.4%. Furthermore, the developed MOSA shows that the environmental and social objective functions depend on the product dimensions and the geographic distribution of customers. Regarding the former aspect, this paper reports that, counter-intuitively, the metabolic energy consumption per driver decreases with bigger products because the number of necessary vehicles (and drivers) increases, and, thus, the workload is divided among more employees. Regarding the geographic distribution, this manuscript illustrates that, despite similar traveled distances, highly variable altitudes cause more carbon emissions compared to flat distributions. Finally, this contribution shows that delivering small goods decreases the distance that vehicles travel empty by 59%, with a consequent cost reduction of 16%.

1. Introduction

During the last 20 years, the percentage of internet users has increased worldwide from 1.32% to 49.72%, with peaks of 90% in North America and Europe [1]. Along with this phenomenon, e-commerce utilization is widely expanding thanks to innovation in information technology. Concerning Europe, 89% of the population uses the internet and 73% buy online; in addition, the trend has been increasing over the years, with a tremendous acceleration since 2020 due to the COVID-19 pandemic [2]. E-commerce is distinguished by both positive and negative impacts on the environment. On the one hand, it could reduce the emissions of product shipment, due to a shared and joint organization of delivery activities that increase the efficiency of the logistic system. On the other hand, further e-commerce aspects, such as the change in consumer behaviors and the consumption geography, could worsen the environmental performance compared to physical shopping [3]. The expansion of online shopping especially distinguishes the most important online marketplaces and delivery applications, like Instacart, which benefitted from a 218% growth in the downloads of its app in 2020 [4]. On the contrary, local small businesses were negatively affected by the pandemic since their consumers were reduced by 35% during the spread of the virus because of lockdown restrictions [5].
Furthermore, another major trend experienced by society in the latest years is the importance and relevance that sustainability concepts gained among companies, governments, and citizens [6]. First of all, in 2015, the United Nations defined 17 Sustainable Development Goals to be reached by 2030. These goals regard different aspects of the Triple Bottom Line, i.e., planet, profit, and people, with the aim of performing sustainable development globally [7]. Indeed, green and social sustainability aspects are becoming more important, even for the general population, and this sustainable consciousness affects the retailer’s behavior [8]. Furthermore, a survey administered in India to report the aspects that guide consumers’ purchasing choices shows that environmental and social sustainability highly influences Indian consumers’ preferences [9]. The three sustainability aspects are also incorporated into the supply chain network to generate a sustainable supply chain. Indeed, a sustainable supply chain implies the optimization of additional aspects besides the economic one, like greenhouse gas emissions or social sustainability themes, and the application of this optimization at all stages of the supply chain, including distribution and transportation [10]. The problem of goods distribution is widely addressed by operation research, as a vehicle routing problem (VRP) that is defined as the problem of distribution of goods between depots and customers to optimize a certain objective function under a specific set of constraints [11]. In particular, companies often rely on external actors, called third-party logistics (3PLs), to obtain support for logistic services like transportation of goods. In recent years, 3PL providers have focused on sustainability for their routing algorithms and, thus, are requiring innovative models that support them in evaluating different aspects of the delivery process [12]. Given the increasing importance of sustainability aspects, VRP models cannot consider just the economic one while optimizing product delivery. In particular, a more appropriate approach should simultaneously consider multiple goals to reach while defining the transportation routes to ensure the overall sustainability of these logistic activities from several points of view, e.g., environmental, social, and economic. This multiplicity of objective functions often generates a tradeoff that must be managed appropriately through multi-objective optimization methods [13]. One of the most adopted approaches is the Pareto front, which represents the set of solutions distinguished by the best tradeoff among all the objective functions considered [14].
This paper aims to fill the gap in the environmental and social sustainability of product delivery for local e-commerce platforms by developing a multi-objective VRP that takes into account not only the economic aspect but also the green and ethical ones. A mathematical formulation of the VRP is provided, and the problem is solved through a multi-objective metaheuristic algorithm that allows the construction of an efficient tri-dimensional Pareto front. This metaheuristic leverages different local search (LS) operators that, at each iteration, are selected through an adaptive algorithm with a probability based on their previous performance. The innovative part is represented by the fact that the adaptive method has not been widely adopted within the literature for a multi-objective problem. Moreover, the developed algorithm is tested with different realistic instances that simulate an e-commerce platform for local small producers and retailers in the region of Trentino (Italy).
The remainder of this paper is structured as follows: Section 2 presents a literature review on VRPs, focusing on environmental and social aspects and multi-objective optimization algorithms. In Section 3, the methodology is explained in detail. In particular, in Section 3.1, the problem is accurately described, and the mathematical optimization model is defined with all its objective functions and constraints, while Section 3.2 proposes the multi-objective heuristic with adaptive features to obtain an optimal Pareto front for such a problem together with all the LS operators tested. Section 4 describes the different instances; Section 5 analyzes the results provided by testing these; and in the last section, some general conclusions and further research are provided.

2. Literature Review

VRPs have been studied for several decades. One of the most common problems is the capacitated VRP (CVRP) in which the only constraint is the capacity, in weight and/or in volume, of the vehicles [15]. This model designs the routes respecting these capacity constraints. Dell’Amico et al. [16] solve CVRPs through an adaptive iterated local search (ILS) whose peculiarity is the dynamic adaptation of the parameters of the algorithm according to the previous results obtained along with the iterations. The ILS is characterized by two phases called exploration and exploitation, which are widely used in neighborhood search heuristics. The former is often performed through inter-route LS operators, which consist of node movements between different routes, and it helps to explore new areas of the solution environment. The latter phase is achieved through intra-route LS operators, which displace nodes inside the same route and help improve the neighborhood solutions of the current one [17,18]. Several contributions that leverage LS operators are distinguished by a blind use of them, that is, they do not consider the performance of the different operators during the algorithm iterations. Ropke and Pisinger [19] propose an adaptive selection of the LS operator to use at each iteration according to the solutions generated by each LS operator in the previous iterations. Although adaptive algorithms are widely adopted in single-objective problems, even when dealing with the latest topics like electric vehicles [20] and parcel lockers [21], they are still rarely implemented to address multiple goals [22].
One gap related to the aforementioned papers is that they only address an economic objective function, while in recent years, sustainability gained great importance both in the scientific community and in public opinion. In detail, a new branch of research defined as “Green VRP” considers the environmental impact of transportation in the formulation of mathematical models. Several contributions only analyze the impact of traveled distance on the environment by applying a constant carbon emission value per kilometer during the computation of the environmental measure [23,24]. However, different studies on vehicle emissions proved that environmental performances depend not only on this aspect but also on vehicle speed and road gradient [25]. Regarding road gradient, Costagliola et al. [26] demonstrate, through several tests on two different vehicles, that CO2 emissions are linearly correlated to road gradient, and Hickman et al. [27] provide detailed equations to evaluate this for different gradient classes. To compute the impact of road gradient on pollutant emissions, Dhital et al. [28] propose adopting the height profile instead of the elevation of each single node, since this latter does not account for the height variation during the path. However, the literature review on routing problems shows that sustainability is mainly considered from the environmental point of view, with limited focus on its social aspects [29]. Some researchers deal with social sustainability in terms of route balancing among drivers [30]. In the literature, this aspect is generally represented by the distance traveled or the number of customers served by each driver, which affect also the economic performance of the logistic process [31,32]. Another area of research focuses on the ergonomic aspects of the VRP, addressing social sustainability as an energy balance among all the drivers. Indeed, drivers can spend at most a certain portion of their daily energy capacity for delivery activities. Moreover, during the workday, they are likely to spend energy by performing two different activities, i.e., goods loading/unloading and vehicle driving. Therefore, the goal of each problem is the delivery node assignment to vehicles to balance the routes in terms of the metabolic energy spent by each driver during a workday [33]. According to the National Institute for Occupational Safety and Health (NIOSH) [34], people are distinguished by different levels of energy capacity according to their physiological characteristics, such as gender and age. This statement suggests that the energy balance of the routes must also take into account the type of driver employed for each vehicle since the working energy capacity varies according to his/her personal characteristics [35]. The major limitation of the aforementioned contributions deals with the fact that they only consider the social dimension of delivery activities, completely ignoring the economic one, which remains an important aspect of any VRP. Halvorsen-Weare and Savelsbergh [36] deal with the equity topic in a bi-objective CVRP to optimize both economic and social objective functions by testing different equity functions and finding the one that could minimize and balance the social performance of the drivers.
This paper deals with three goals, economic, green, and social, to fill the gap of the simultaneous evaluation of multiple aspects. A simplified approach leveraged to manage multiple objectives is the generation of a single objective function that includes all the objectives weighted according to their importance in the tackled problem [37,38]. However, multi-objective optimization is traditionally adopted to solve this kind of problem, and the solution is usually given by the so-called Pareto front. This is the set of all the non-dominated solutions to a problem. A non-dominated solution has no solutions superior to it once all the objective functions are considered. Therefore, with a move along the front, an objective can be improved only by deteriorating another one [39]. The Pareto front contains solutions that can be optimal in relation to the others. Indeed, it represents a tool to detect the possible optimal solution and it does not act as a selector, since the decision concerning which solution to choose is left to the decision-makers [40]. Different methods can be implemented to define the Pareto set of optimal solutions. Matl et al. [41] solve a multi-objective optimization problem by developing heuristics to be embedded into the ε-constraint method, which is a novelty compared to the exact algorithms adopted since then. A trend of algorithms widely used in multi-optimization problems is represented by evolutionary algorithms, like Nondominated Sorting Genetic Algorithm II (NSGA-II) [42,43] or strength Pareto evolutionary algorithm II (SPEA2) [44,45]. In addition, path-dependent search algorithms, like multi-objective simulated annealing (MOSA), are widely adopted in research. For instance, Sekkal and Belkaid [46] propose a MOSA to simultaneously minimize the makespan and the resources cost in a parallel machine scheduling problem.
This paper describes the development of a MOSA algorithm to solve a tri-objective problem that deals with economic, environmental, and social aspects of VRP. The first objective is composed of the cost of fuel consumption, which is dependent on distance traveled, and the cost of vehicles and driver employment, which are dependent on time worked. The second one describes the total quantity of CO2 emitted by the transportation system, which depends on an emission factor adjusted according to vehicle velocity and road slope. The latter objective represents the balance in the energy consumption of operators. Indeed, this objective function tries to minimize the maximum metabolic energy consumption of order delivery and, by doing so, it also balances the metabolic energy load among all the drivers. The generation of a neighborhood solution inside the metaheuristic algorithm is achieved through four different LS operators, which are adaptively chosen during the MOSA iterations according to their performance. The proposed algorithm is validated with two groups of different instances of an e-commerce platform based in the region of Trentino (Italy). The first group contains three instances characterized by a different kind of product delivered. Indeed, the products delivered in the three instances are, respectively, small and light-weight products (such as books), medium-sized products (such as fruit and vegetable boxes), and big and heavy products (such as furniture). On the other hand, the second group of instances is characterized by different geographical distributions of customers. In detail, these instances contain customers located respectively around the city of Trento (Italy), all over the region of Trentino (especially in the most populated cities), and in Trentino’s most remote areas such as mountains and valleys. This research provides different Pareto fronts and key performance indicators (KPIs) for the different instances that support users or practitioners in selecting the solution that most fits their needs.

3. Methodology

The targeted problem is faced through a quantitative method divided into two steps. Firstly, the mathematical model of this CVRP is formulated, including parameters, variables, constraints (especially the capacity one), and the three objective functions that represent the economic, environmental, and social sustainability aspects. Then, since VRP is an NP-hard problem, a multi-objective metaheuristic algorithm is developed and implemented to efficiently solve it. This metaheuristic is based on simulated annealing acceptance and stopping criteria and, at the end of its run, it provides a Pareto front that includes all the non-dominated solutions of the problem since in multi-objective situations there is not a single optimal one. In particular, a solution is non-dominated if it is better than the others in at least one objective function. These two steps of the defined methodology are described more specifically in the next two subsections.

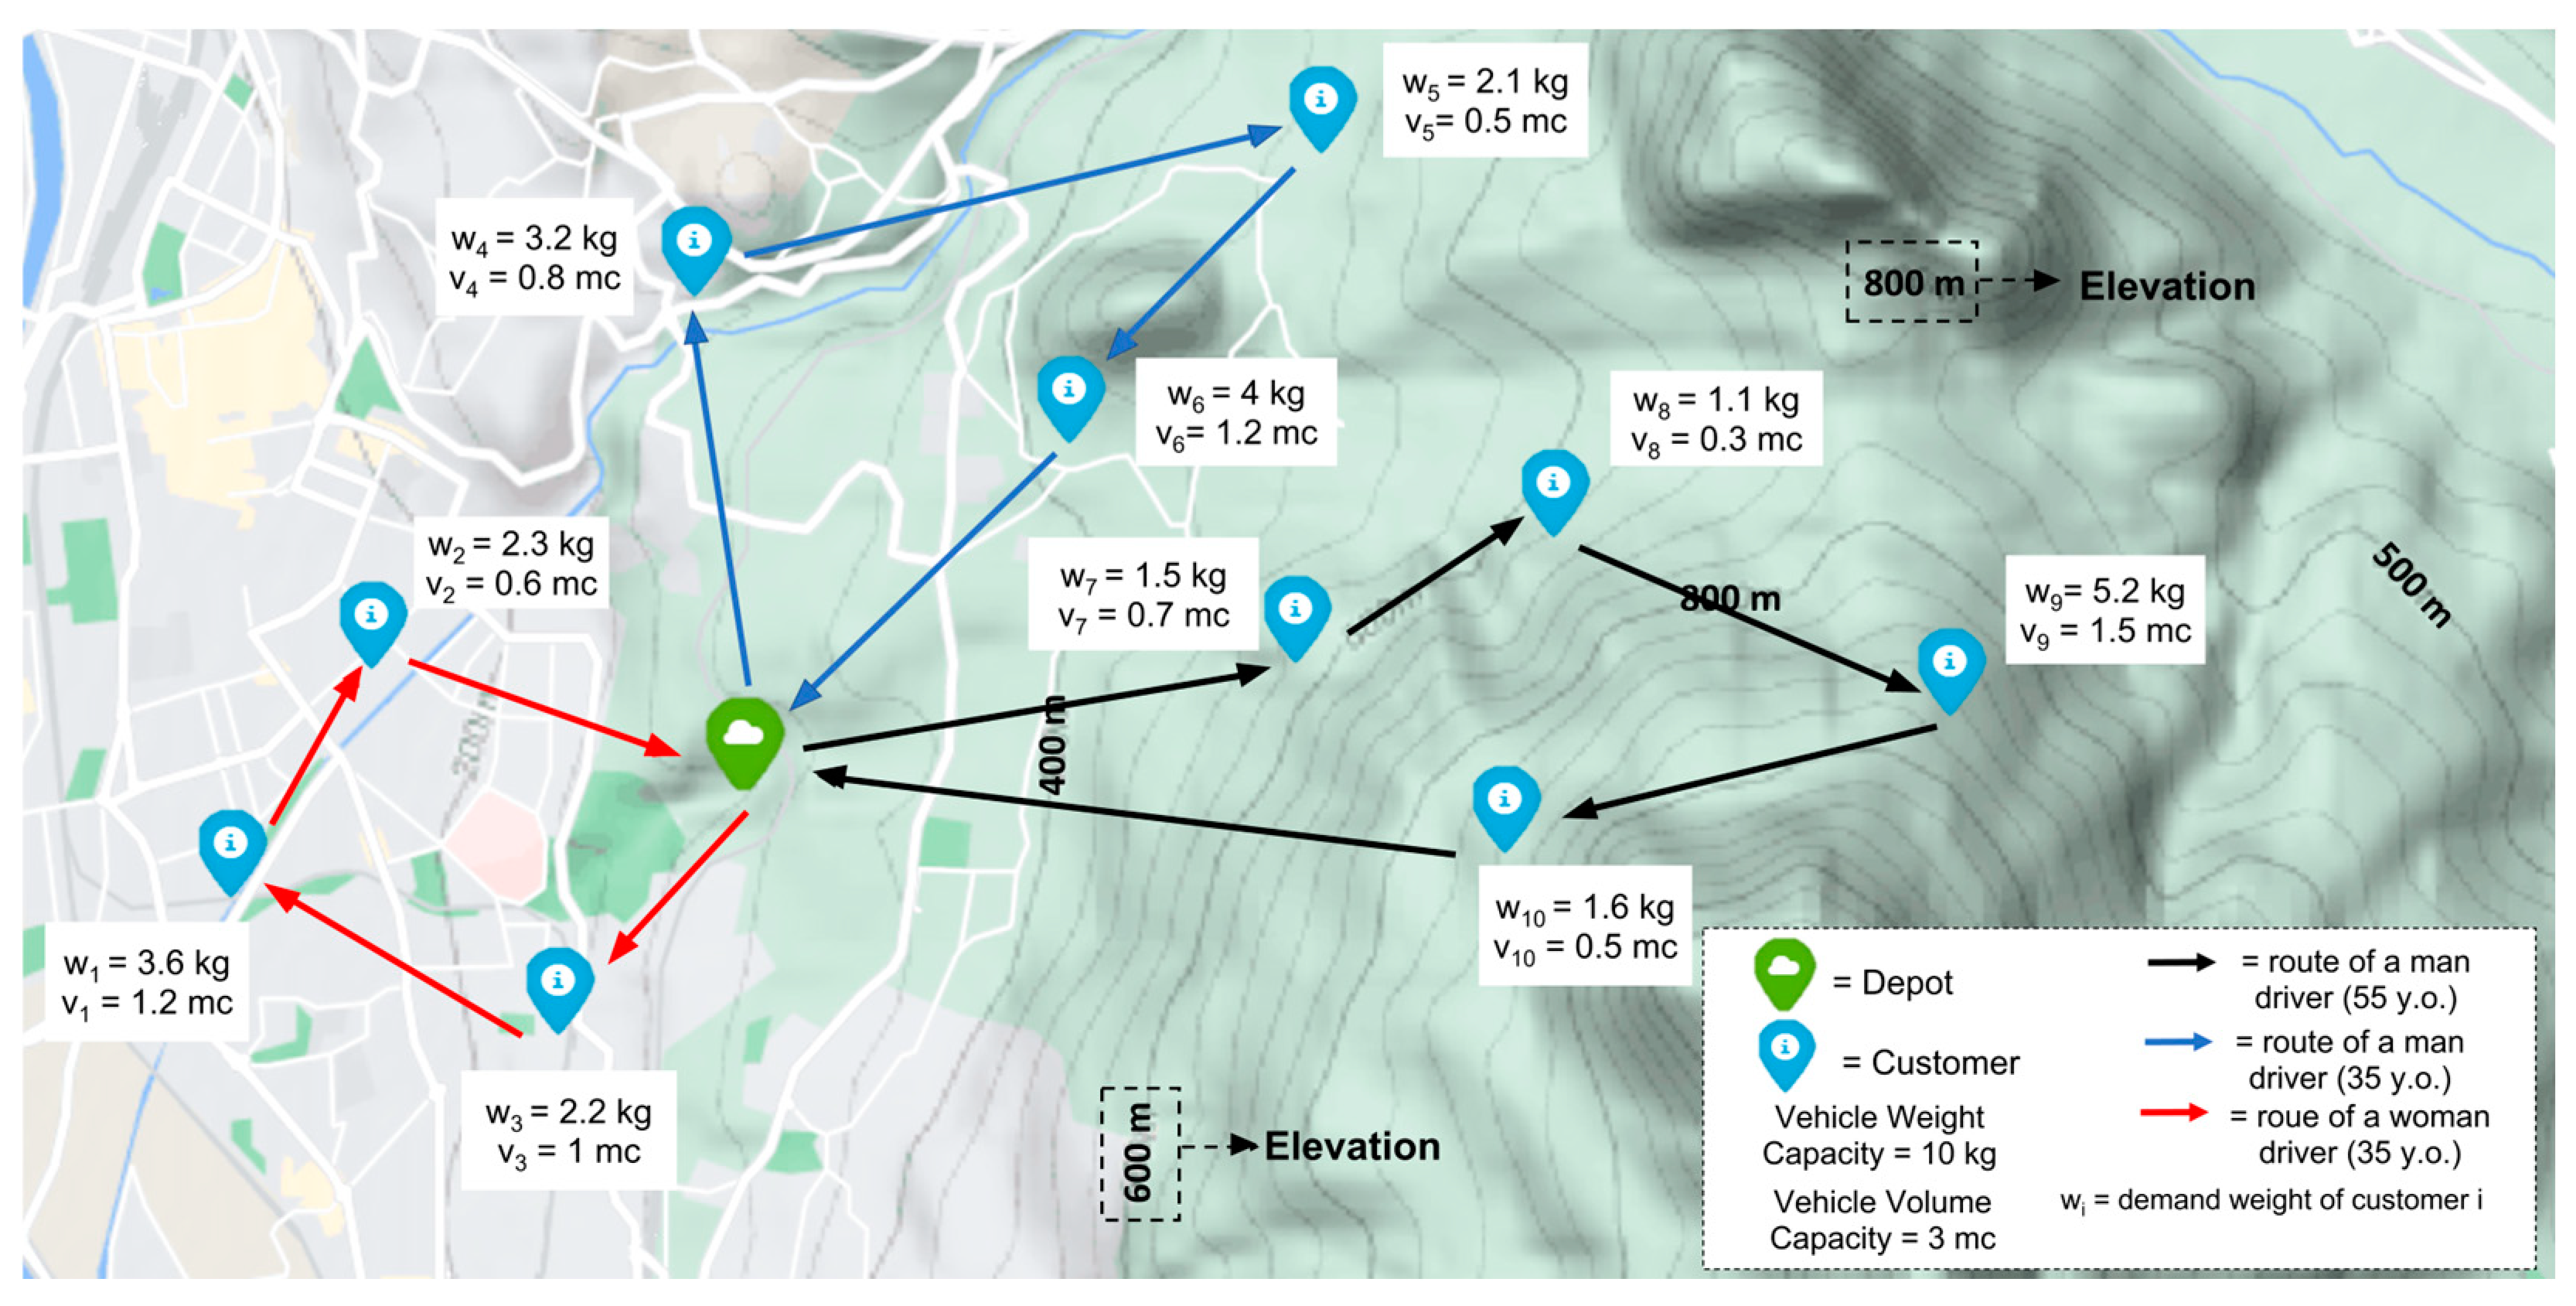
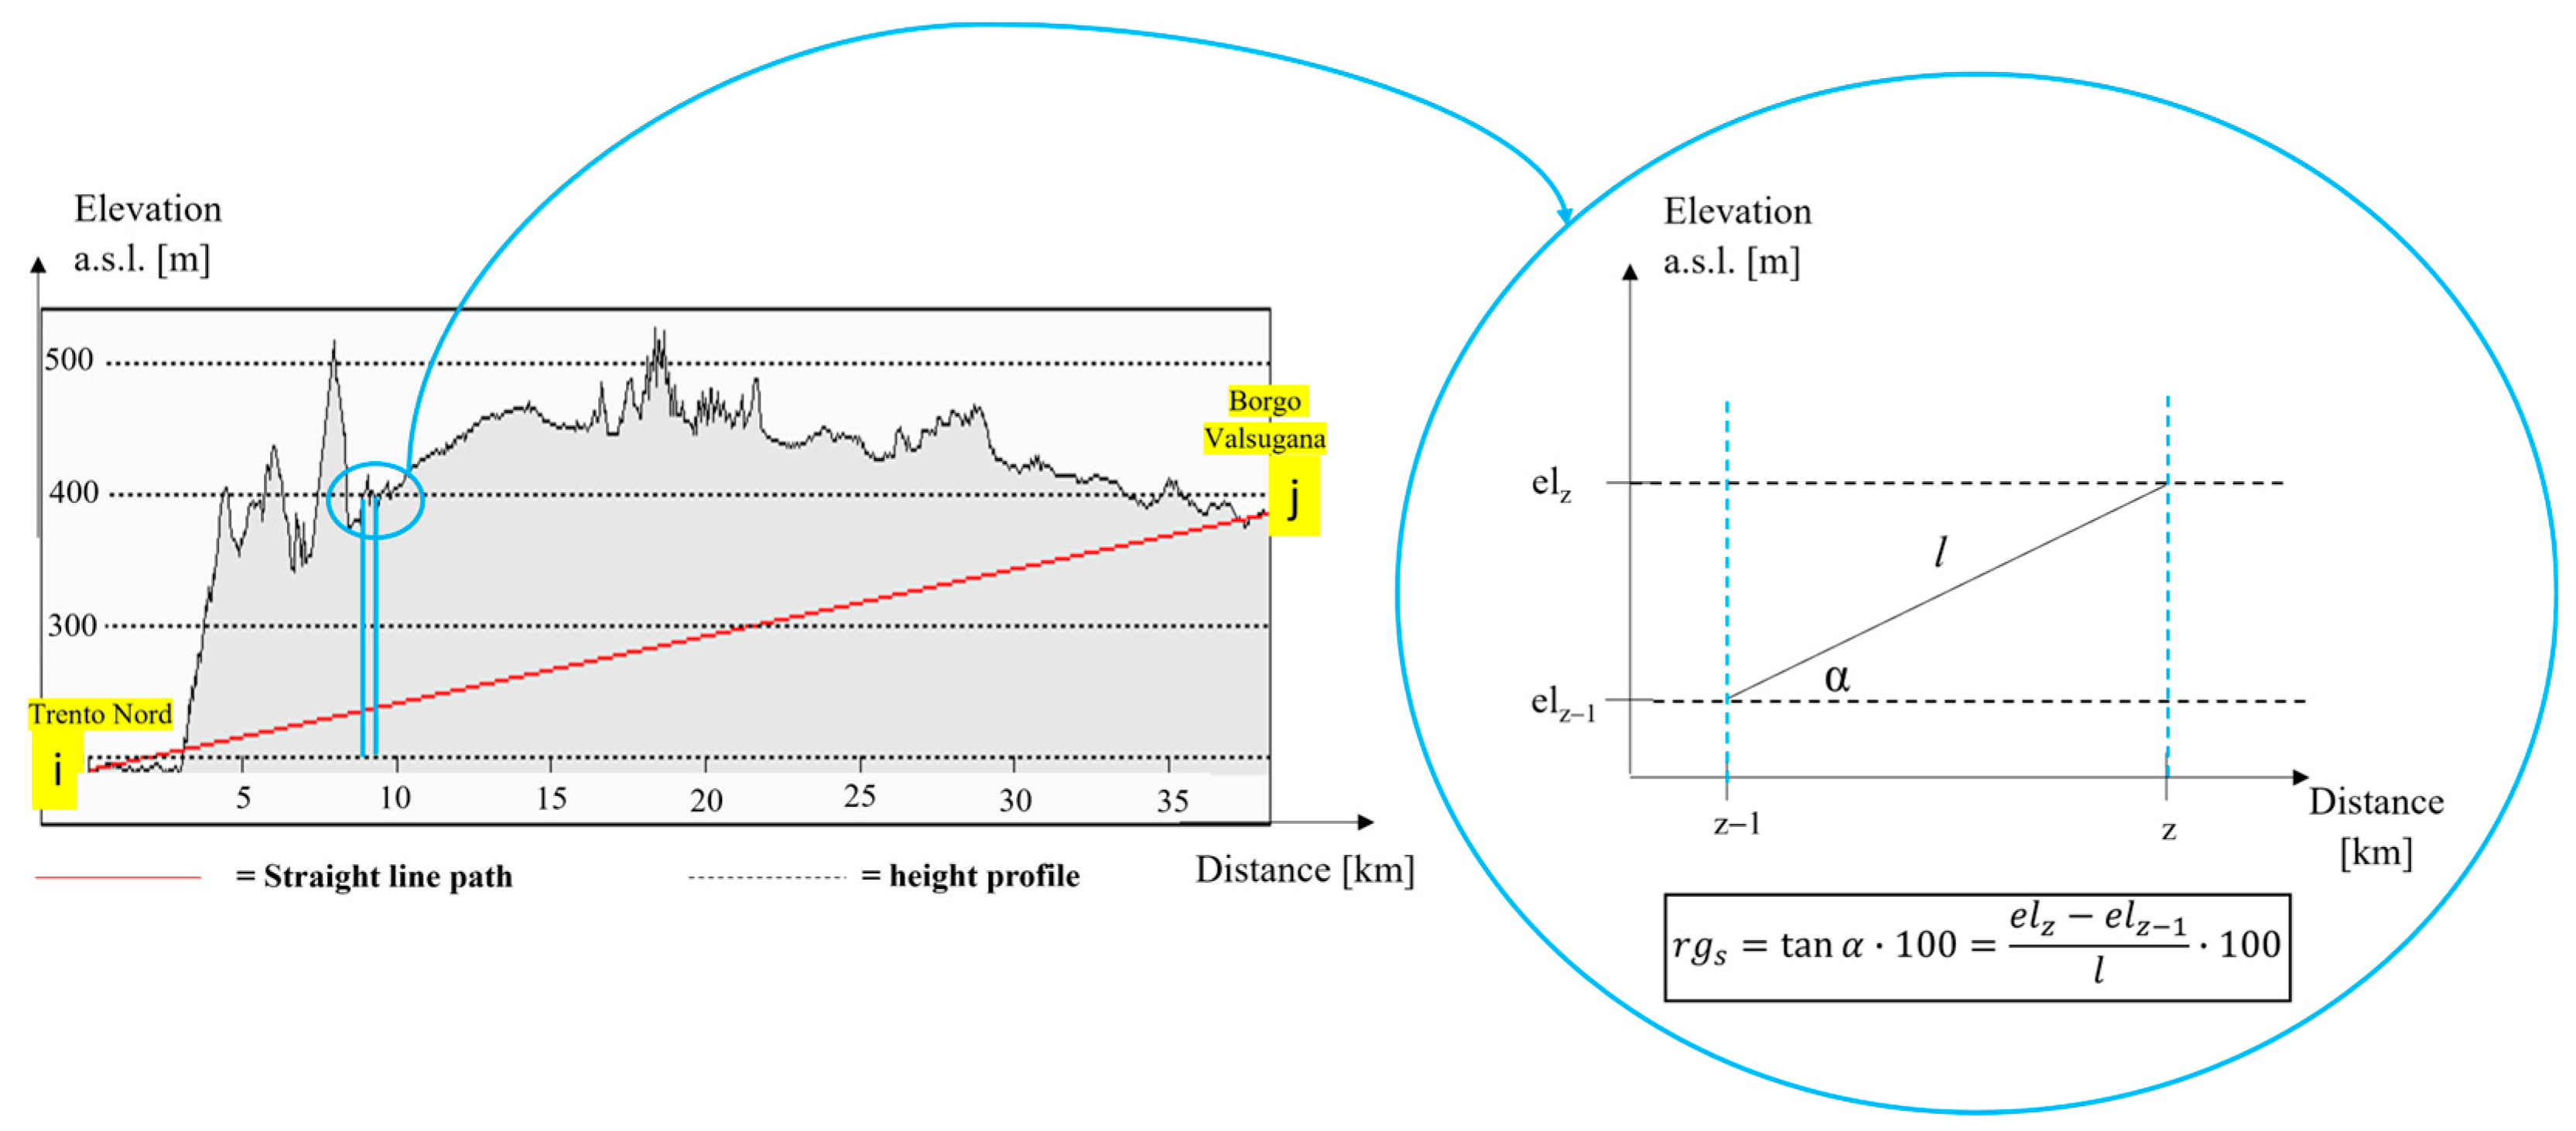
3.1. Problem Definition and Mathematical Model

The problem to address in this research regards the delivery process of a local e-commerce platform, and it consists of a CVRP since it is distinguished by a fleet of vehicles, all departing from and returning to a central depot, which delivers goods to a set of customers in a specific time period without exceeding their weight and volume capacity. Each vehicle is directed by a driver, each customer must be visited by a single vehicle, and all the customers must be serviced within the defined time period, e.g., workday. The peculiarity of the targeted problem is the evaluation of two additional objective functions besides the economic one, which are the environmental and social sustainability of the proposed VRP represented, respectively, by the total amount of CO2 emitted in a workday and the metabolic energy consumption of operators during the activities of driving and delivering goods. Indeed, this problem defines delivery routes that allow vehicles to emit as little emissions as possible by also considering collateral aspects like vehicle speed and height profile of the routes. In addition, the proposed mathematical model suggests distinguishing the drivers by their personal characteristics because, according to multiple physical features, people have different daily metabolic energy capacities and, thus, they can adequately fulfill different energy loads [34]. The specific problem faced is represented in Figure 1 in which the map presents information about elevation and each route is distinguished by the drivers’ personal characteristics; thus, the routes cannot be assigned to any driver indistinctly. This aspect is extremely important to balance the metabolic energy consumption among drivers since the same quantity of absolute metabolic energy spent has a different impact on the different drivers according to this description. The goal of this problem is the optimization of the economic, environmental, and social performances of the targeted CVRP. The economic key performance indicator (KPI) is an average cost per order, and it is determined by variable costs that include the hourly cost of drivers and vehicles, which are dependent on the travel time and the time needed to deliver goods to the final customer, and a fuel consumption cost, which is dependent on the distance traveled. The environmental KPI is determined by an emission factor, which is dependent on the vehicle speed and height profile, multiplied by the distance traveled on each arc because each one of these arcs (i,j) distinguishes different values for the two aforementioned characteristics. Finally, the social KPI is defined as the maximum ratio over the different drivers between the metabolic energy consumption in a time period and his/her available metabolic working energy capacity and this latter KPI should be minimized in order to simultaneously reduce the personal metabolic energy spent for delivery activities and balancing the working energy load among all the drivers of the considered CVRP. An original mathematical model is developed to represent such green, fair, and profitable CVRPs and a multi-objective metaheuristic algorithm is defined and implemented with different LS operators to assign customer orders to vehicles and define their routes to simultaneously optimize the three afore-described KPIs.
In this section, the proposed mathematical model is described in all its components as parameters, variables, objective functions, and constraints. The targeted problem can be defined as a graph G = (N, A), where N = 0, …, n is the set of nodes such that 0 is the depot and 1, …, n are the customers and A = 1, …, a is the set of all possible arcs that connect the nodes such that A = {(i,j): ij  i,j   N}. The arcs are traveled by K light-duty vehicles (LDVs), which also represent the drivers with their specific personal characteristics, e.g., age, gender, and weight. Each arc (i,j) is characterized by a distance dij, a travel time tij, and, consequently, an average speed vij, which depends on which type of streets the arc represents, e.g., primary, secondary, and residential. This average speed determines the reference emission factor εij (gCO2/km) of each arc (i,j) through Equation (1) presented in Hickman et al. [27]:
ε i j = 0.0617 · v i j 2 7.8227 · v i j + 429.51 · ψ ,
where ψ is the parameters that take into account the technological advancement of vehicles in terms of emission rate reduction. The reference emission factor is adjusted with a factor dependent on the road gradient of the street, which is based on the elevation of the starting and ending points. To increase the reliability of this formulation, instead of a constant average slope from the starting point I to the ending point j, the height profile of each arc is considered. Each arc is divided into several links s of constant length l (km) by sampling points of the path at a constant resample distance. Then, the road gradient is computed between each link by taking adjacent points’ elevations and computing the gradient. In addition, these sampled points are matched to a digital road network to locate them on the map [47]. The road gradient rgs in each link s is calculated as follows:
r g s = e l z e l z 1 l · 100   ,
where elz and elz−1 are the altitudes above sea level (a.s.l.) of two consecutive points z and z − 1 of the path (Figure 2). The road gradient rgs is, therefore, used to compute the correction parameter fs due to the road slope of each link s, which are calculated through Equation (3), where coefficients h2, h1, and h0 depend on rgs according to Hickman et al. [27]:
f s = h 2 · v i j 2 + h 1 · v i j + h 0   ,
The presented correction factor is leveraged to assess the emission factor εij and, therefore, calculate the environmental performance of the entire VRP solution. Each customer i requests a delivery order that is distinguished by a specific demand weight wi (kg) and demand volume voli (m3), and which contains a certain number of items ni. These data enable the computation of the average weight of a customer’s single item wsi (kg/item), which is extremely relevant for computing the social performance of this CVRP, particularly for evaluating the operators’ lifting activities. Indeed, it is supposed that the operator lifts each item separately. Furthermore, vehicles are supposed to be identical in type, weight capacity W, and volume capacity V, which cannot be exceeded during the routes of the vehicles. Each vehicle is characterized by an hourly rental cost cf (EUR/h), while the cost of fuel cv (EUR/L) is a variable cost dependent on the distance traveled and the fuel consumption rate γ (L/km) for the adopted vehicle type. Drivers are characterized by a total working period T (h), which cannot be exceeded to perform the assigned delivery activities. Furthermore, an assumption is made that they necessitate a constant amount of time tser (h) to deliver the order to the customer’s door once their vehicle already reached the customer’s address. Moreover, they are distinguished by an hourly cost cop (EUR/h), which also includes their salary. As suggested by Rattanamanee et al. [35], drivers benefit from a daily working energy capacity ECk (Kcal/day), which depends on their personal characteristics, like age and gender. This available energy is required to face the metabolic energy expenditure during his/her activities due to two main components. On one hand, the energy spent in driving (edk), which depends on the unitary value of metabolic energy consumed to drive (δ), the body weight of the driver k (BWk), and the time spent in driving activities during the working day [48], as presented in Equation (12). On the other hand, the second component of the operator k daily energy expenditure derives from lifting the order of customer i (elik), which can be calculated as proposed below [49] in Equation (4):
e i k l = α · β k + α · B W k · α + β k · w s i · α ,
where βk and β″k are coefficients related to the personal features of the driver k, such as age and gender, while α′, …, α′′′′ are general coefficients for the computation of the energy expenditure in lifting goods.
The first variable of the proposed multi-objective optimization problem is xijk, which is a binary one equal to 1 if arc (i,j A is traversed by vehicle k and 0 otherwise. Moreover, yik is a binary variable that is 1 if node i is visited by vehicle k and 0 otherwise. The last variable is Ek, which represents the rate of metabolic energy spent by driver k on his/her total working energy capacity (also called energy consumption rate). The list of parameters and variables of the mathematical model is reported in Table 1.
Once the variables and parameters of the targeted multi-objective CVRP are defined, the mathematical optimization model is represented in the following Equations (5)–(18), with Equations (5)–(7) showing the three objective functions and Equations (8)–(18) showing the problem constraints. Equation (5) defines the economic objective function that represents the average cost per single order. It includes a variable cost due to the hourly cost of vehicles and drivers and a variable cost due to the cost of fuel, due, thereby, to the distance traveled. The former cost depends on the total travel time and tser, which is multiplied by the total number of customers serviced. Equation (6) describes the environmental objective function in which the emission factor, corrected according to the road height profile, is multiplied by the distance of each single link. Equation (7) measures the social objective function that leverages a min–max approach to minimize the maximum energy consumption rate among the different drivers. This approach simultaneously optimizes two aspects because it balances the load assignment to drivers and pushes down the maximum energy expenditure. Constraints (8) and (9) assess that each customer node can be visited by the same vehicle just once since in the same route vehicle delivers all the customer goods in a single visit. Constraints (10) and (11) represent the capacity constraints in terms of the weight and volume of the vehicles. Constraint (12) details the computation of the energy spent in driving activities by each driver k because this value depends on the body weight of the worker. Constraint (13) evaluates the metabolic energy consumption rate of each driver k. In this equation, the metabolic energy spent by driver k for lifting activities (elik) is multiplied by four because it is supposed that each driver performs two lifting activities at the depot (from warehouse to the ground and from the ground to the vehicle) and two lifting activities at the customer node (from vehicle to the ground and from the ground to the customer). Moreover, since elik is the energy expenditure for a single item, it is multiplied by the number of items ordered by the customer. Constraints (14) and (15) ensure that drivers do not exceed their capacity in terms of metabolic energy and time, respectively. Finally, constraints (16) to (18) limit the feasible values of the three variables of the targeted VRP.
min F e c o = c o p + c f · t s e r · n 1 + i , j   N t i j · k = 1 K x i j k + c v · γ · i , j N d i j · k = 1 K x i j k n 1 ,
m i n   F e n v = k = 1 K i , j N s i , j f s · ε i j · l · x i j k ,
min F s o c = max k = 1 , , K E k ,
which are subject to the following:
i N x i j k = 1                                       j N \ 0 ,   k = 1 , ,   K ,
j N x i j k = 1                                       i N \ 0 ,     k = 1 , , K ,
i N w i · y i k W                             k = 1 , , K ,
i N v o l i · y i k V                         k = 1 , , K ,
e k d = δ · B W k · i , j N t i j · x i j k                 k = 1 , ,   K ,
E k = e k d + 4 · i N n i · e i k l · y i k E C k · 100                 k = 1 , , K ,
e k d + 4 · i N n i · e i k l · y i k E C k                     k = 1 , , K ,
t s e r · i ϵ N y i k + i ϵ N j ϵ N ,   i j t i j · x i j k T                 k = 1 , , K ,
x i j k 0 , 1                         i , j N , k = 1 , , K ,
y i k 0 , 1                         i N , k = 1 , , K ,
E k 0                     k = 1 , , K ,
Since classical VRPs are well known for being NP-hard problems, as well as their further multi-objective evolutions, they cannot be solved optimally in a limited time and with limited computational capacities. Indeed, heuristic or metaheuristic algorithms are traditionally implemented to efficiently solve such VRPs. Thus, a customized metaheuristic multi-objective algorithm is developed to solve the targeted CVRP proposed in this research, and it is presented in the following section.

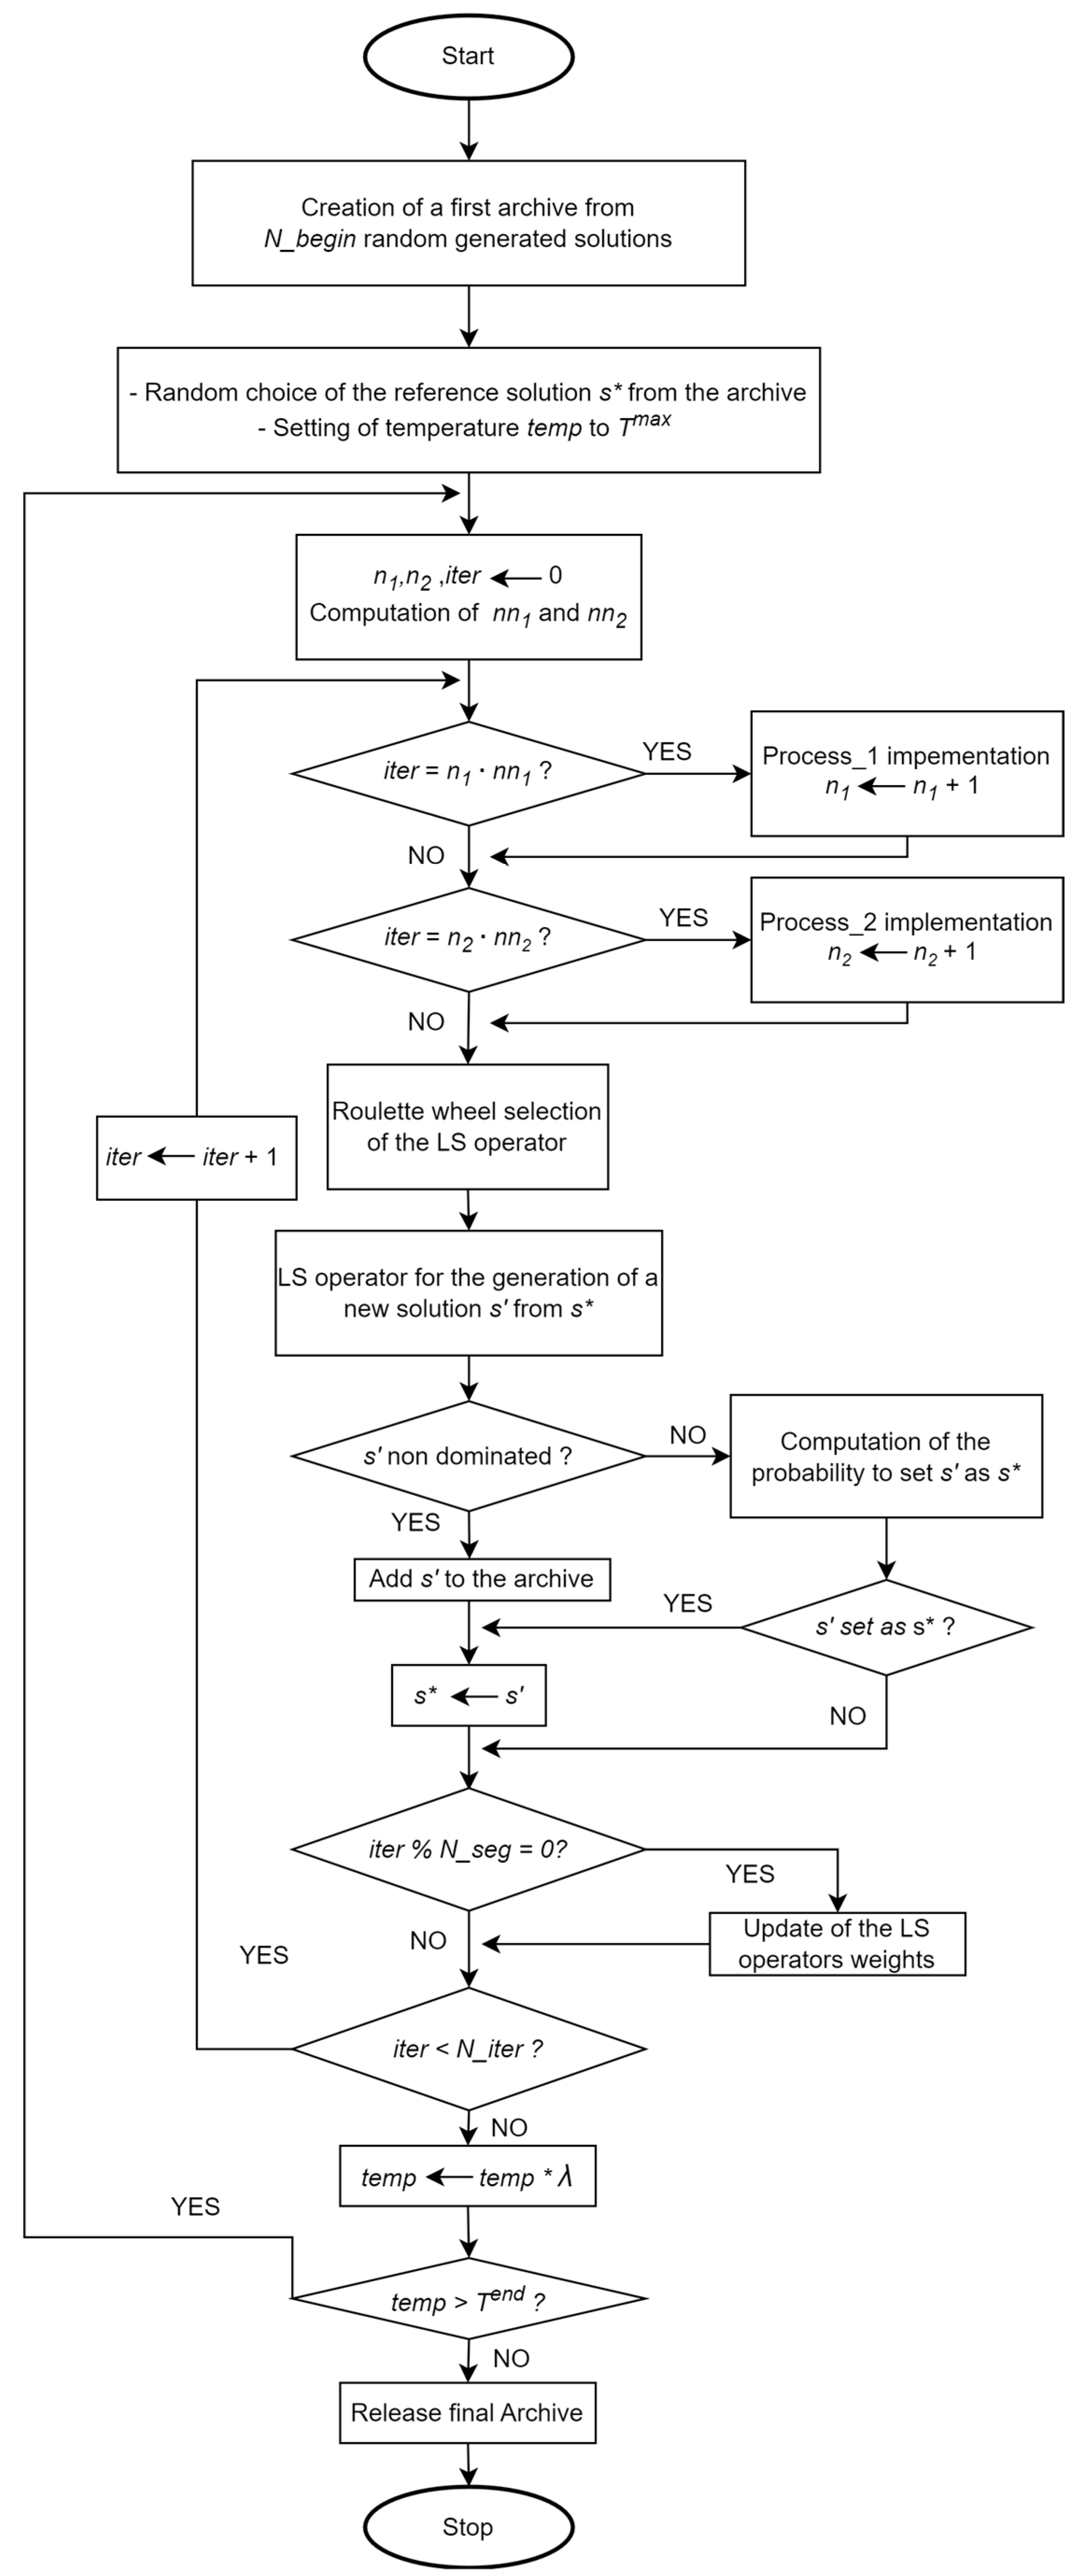
3.2. Adaptive Metaheuristic Algorithm

The presented CVRP includes three different objective functions. Therefore, it is necessary to adopt a multi-objective metaheuristic algorithm to determine not a single optimal solution but a set of non-dominated solutions for the tackled problem. This set represents the Pareto front, which is a useful tool for decision-makers to deal with the trade-off among different objectives of a specific problem. For example, by analyzing this front, it is possible to select a solution that significantly improves a specific function with a limited worsening of another one. The metaheuristic adopted to solve this problem is MOSA, which adapts the simulated annealing (SA) algorithm to a multi-objective context. The flowchart in Figure 3 presents the following steps of the proposed MOSA with adaptive features. In particular, the first step is the initialization of specific parameters and random generation of a predefined number of initial solutions. From this set, MOSA creates the first archive of non-dominated solutions checking the non-domination condition of each of these. In particular, a solution is non-dominated if there are no other solutions that outperform this for all the considered objective functions. The second step of MOSA consists of selecting a random non-dominated solution from the archive as the reference one s* to start the SA loop from a temperature temp equal to Tmax. At each temperature temp, two coefficients nn1 and nn2 are computed through Equations (19) and (20). These coefficients represent the regular intervals at which the selection processes of the reference solution, Process_1 and Process_2, respectively, are executed. In detail, the former process represents a random choice from the archive of the reference solution, while the latter represents the choice as the reference solution of the one with the highest distance from the others. Indeed, Process_2 is adopted to generate solutions around the most uncrowded points of the Pareto front.
n n 1 = i n t a 1 · t e m p + b 1 ,
n n 2 = i n t a 2 · t e m p + b 2 ,
where a1, a2, b1, and b2 depend on the number of iterations in the algorithm. Indeed, at the beginning of the MOSA, Process_1 is more frequently selected than Process_2, and the frequency of the selection of Process_2 increases with the advancement of the MOSA number of iterations. For the other iterations, in which neither Process_1 nor Process_2 are activated, s* results from the previous algorithm iteration.
Once defined, the reference solution s*, an LS operator, is implemented to perturb it and generate a neighbor solution s′. This new solution is compared to each of the solutions in the archive to update it. In detail, s′ is added to the archive if it is non-dominated. Therefore, some of the solutions in the archive could be removed if they are dominated by s′. If one of the Pareto solutions dominates s′, this latter does not concur to define the Pareto front but it could be selected as the reference solution s* for the next iteration of the MOSA with a probability computed in Equation (21). In particular, the probability to select s′ as the new s* is computed as the product, for each objective o ∈ O, of the exponential of the difference between the objective function calculated for s′ (fos) and the objective function calculated for s* (fos*) divided by the current temperature temp.
p r o b = o = 1 O e x p f o s f o s t e m p ,
Once, for each value of temp, the MOSA reaches N_iter iterations, temp is decreased by a reduction rate λ, and as soon as temp reaches the boundary value Tend, the MOSA algorithm stops and it gives, as a result, the final archive of the non-dominated solutions.
In this paper, the generation of a new solution s’ is carried out through four different LS operators, two inter-routes and two intra-routes (Figure 4):
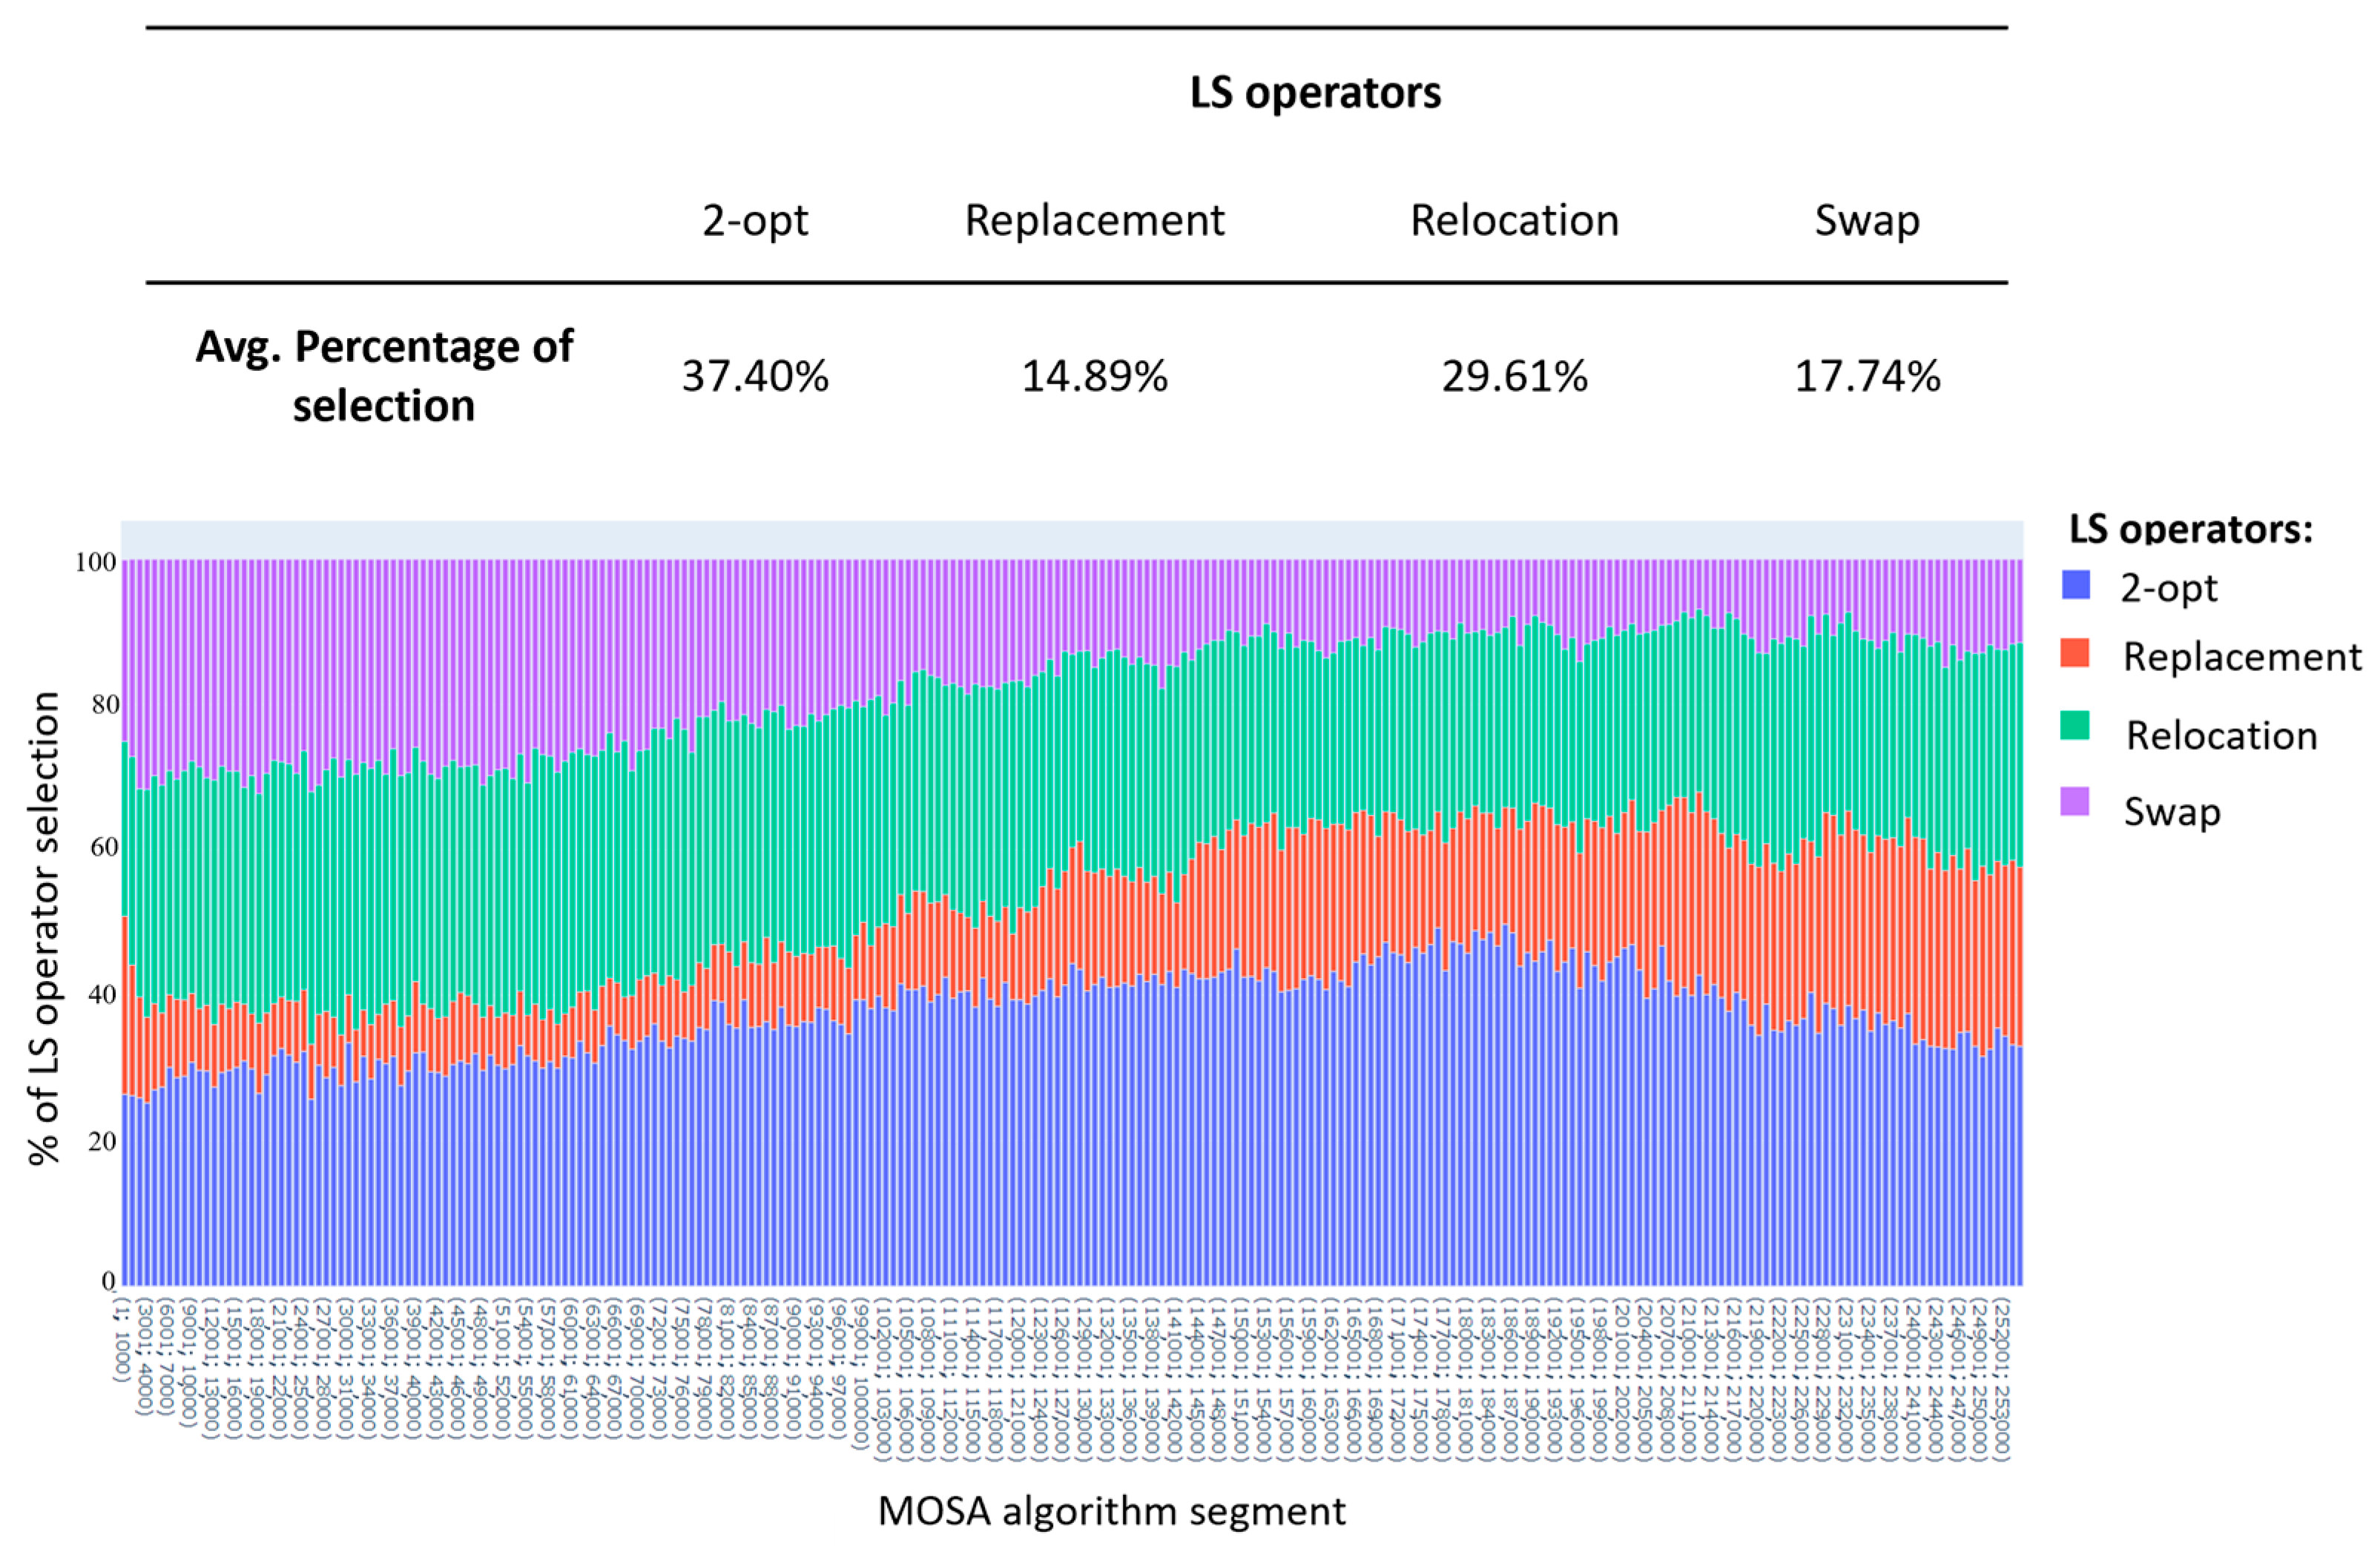
  • Inter-route operators:
    • Relocation: This operator moves a node of a route to a different one. In detail, the removed node, the starting route, and the arrival route are chosen randomly while the position of the node in the arrival route is the one that minimizes the total distance traveled of that route.
    • Swap: This operator swaps two nodes of two different routes. In particular, the routes and the swapped nodes are chosen randomly while the new position on the route is the one that minimizes the total distance traveled of each route.
  • Intra-route operators:
    • Replacement: This operator moves a node of a route to another position of the same route. In particular, it moves the node to a position different from the starting one, which minimizes the total distance traveled on the route.
    • 2-opt: This operator changes the connection of two non-adjacent arcs of a route. In particular, it swaps the final node of the first arc with the beginning node of the second arc and reverses the direction of the arcs between the two selected.
The choice of which LS operator to implement at every iteration of the MOSA is taken adaptively according to the past performance obtained by each LS operator. This adaptive feature proposed is based on the work of Ropke and Pisinger [19] and consists in, firstly, dividing the MOSA iterations into segments, which are represented by a constant number of iterations (N_seg) within which the weights of each LS operator do not change. The score πo of each LS operator o represents its performance in the last N_seg iterations and it is set to zero at the beginning of each segment. At each iteration of a segment, πo of the selected LS operator o is increased by a score-adjustment parameter according to the quality of the new solution obtained by the operator. These score-adjustment parameters have a constant value during the entire MOSA run in such a way that the higher the parameter the better the quality of the solution generated by the LS operator. The peculiarity of the proposed method is the multi-objective nature of the metaheuristic algorithm, which leads to a novel definition of the score-adjustment parameters compared to the literature. Indeed, in a multi-objective problem, there is not a global optimum but a set of non-dominated solutions. Thus, the score-adjustment parameters are set as follows:
  • σ1 → if the new solution s′ identified in the paper is non-dominated and has not been found yet;
  • σ2 → if the new solution s′ identified in the paper is dominated but still accepted as the new reference solution for the following iteration and has not been found yet.
Therefore, the score πo is computed as the sum of the score-adjustment parameters obtained by the LS operator o during the last N_seg iterations based on the quality of its generated solutions. Every N_seg iteration of the segment sg, the weight of each LS operator o for the following segment sg + 1, i.e., po,sg+1, is updated as follows:
p o , s g + 1 = p o , s g · 1 r + r · π o θ o ,
where θo is the number of times the LS operator o is selected during the segment sg while r is the reaction factor, which controls the relevance of the past performance of a LS operator compared to the performance during the last segment. The operator selection at each iteration is performed using a roulette wheel principle. Here, if n LS operators are adopted, the probability Pwo to select a specific operator o is computed according to its relative weight in the current segment:
P o w = p o i = 1 n p i   ,

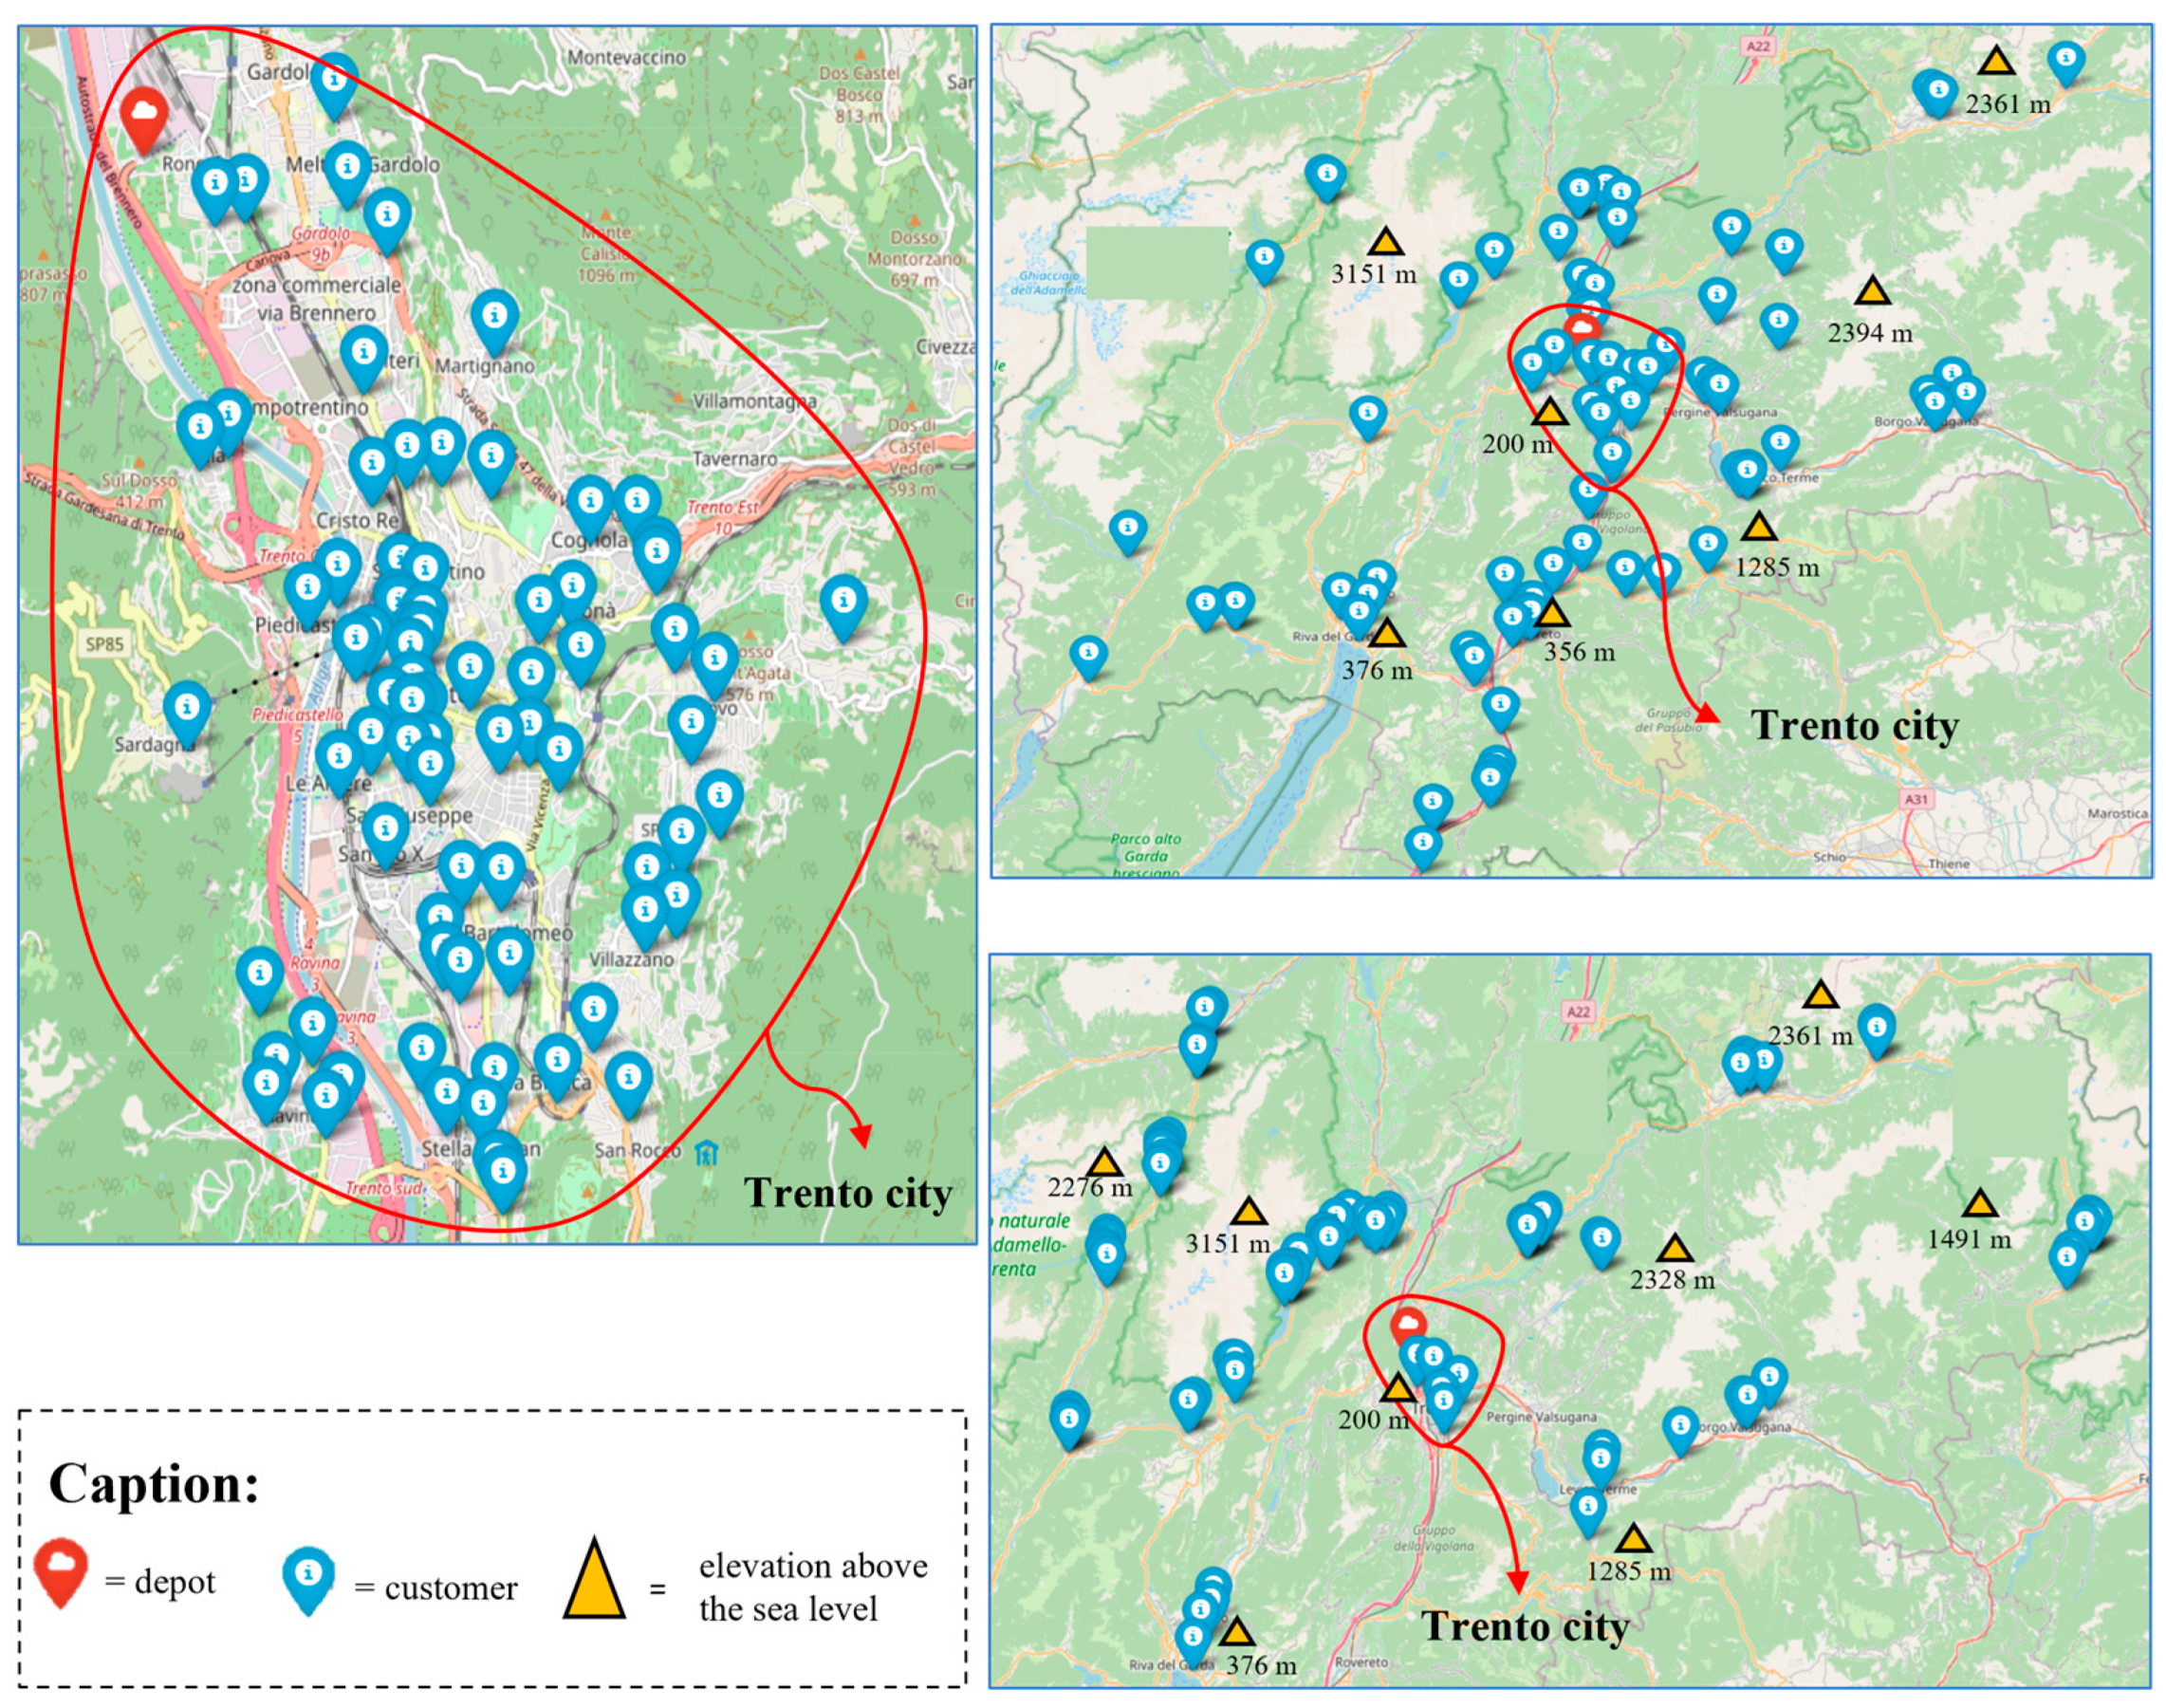
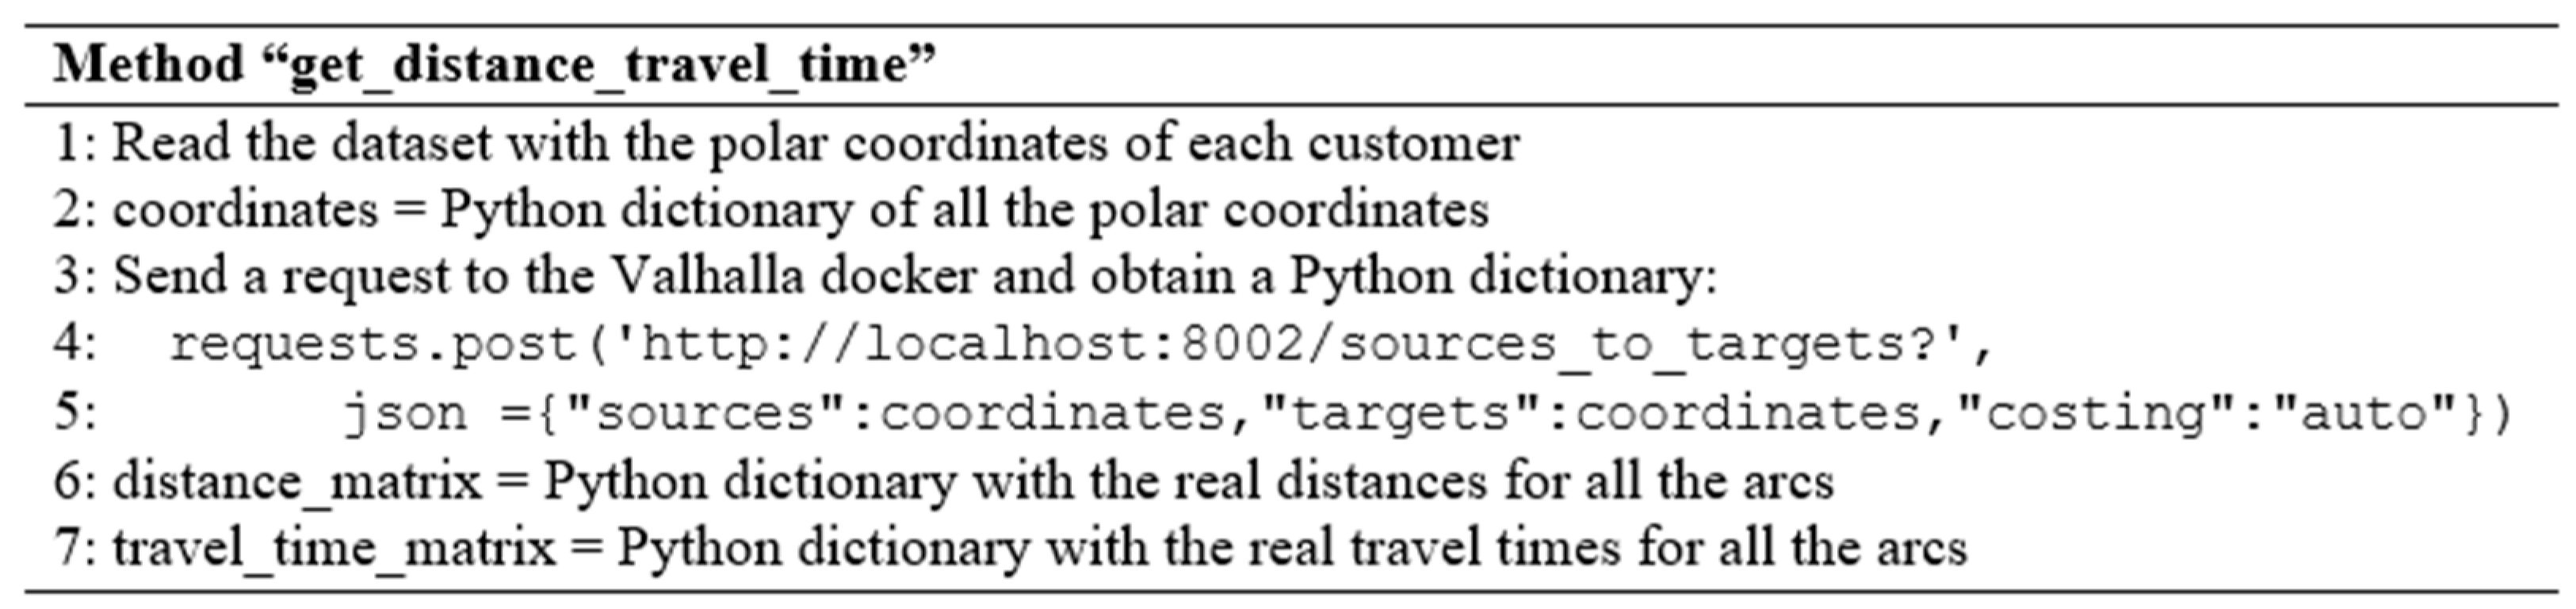
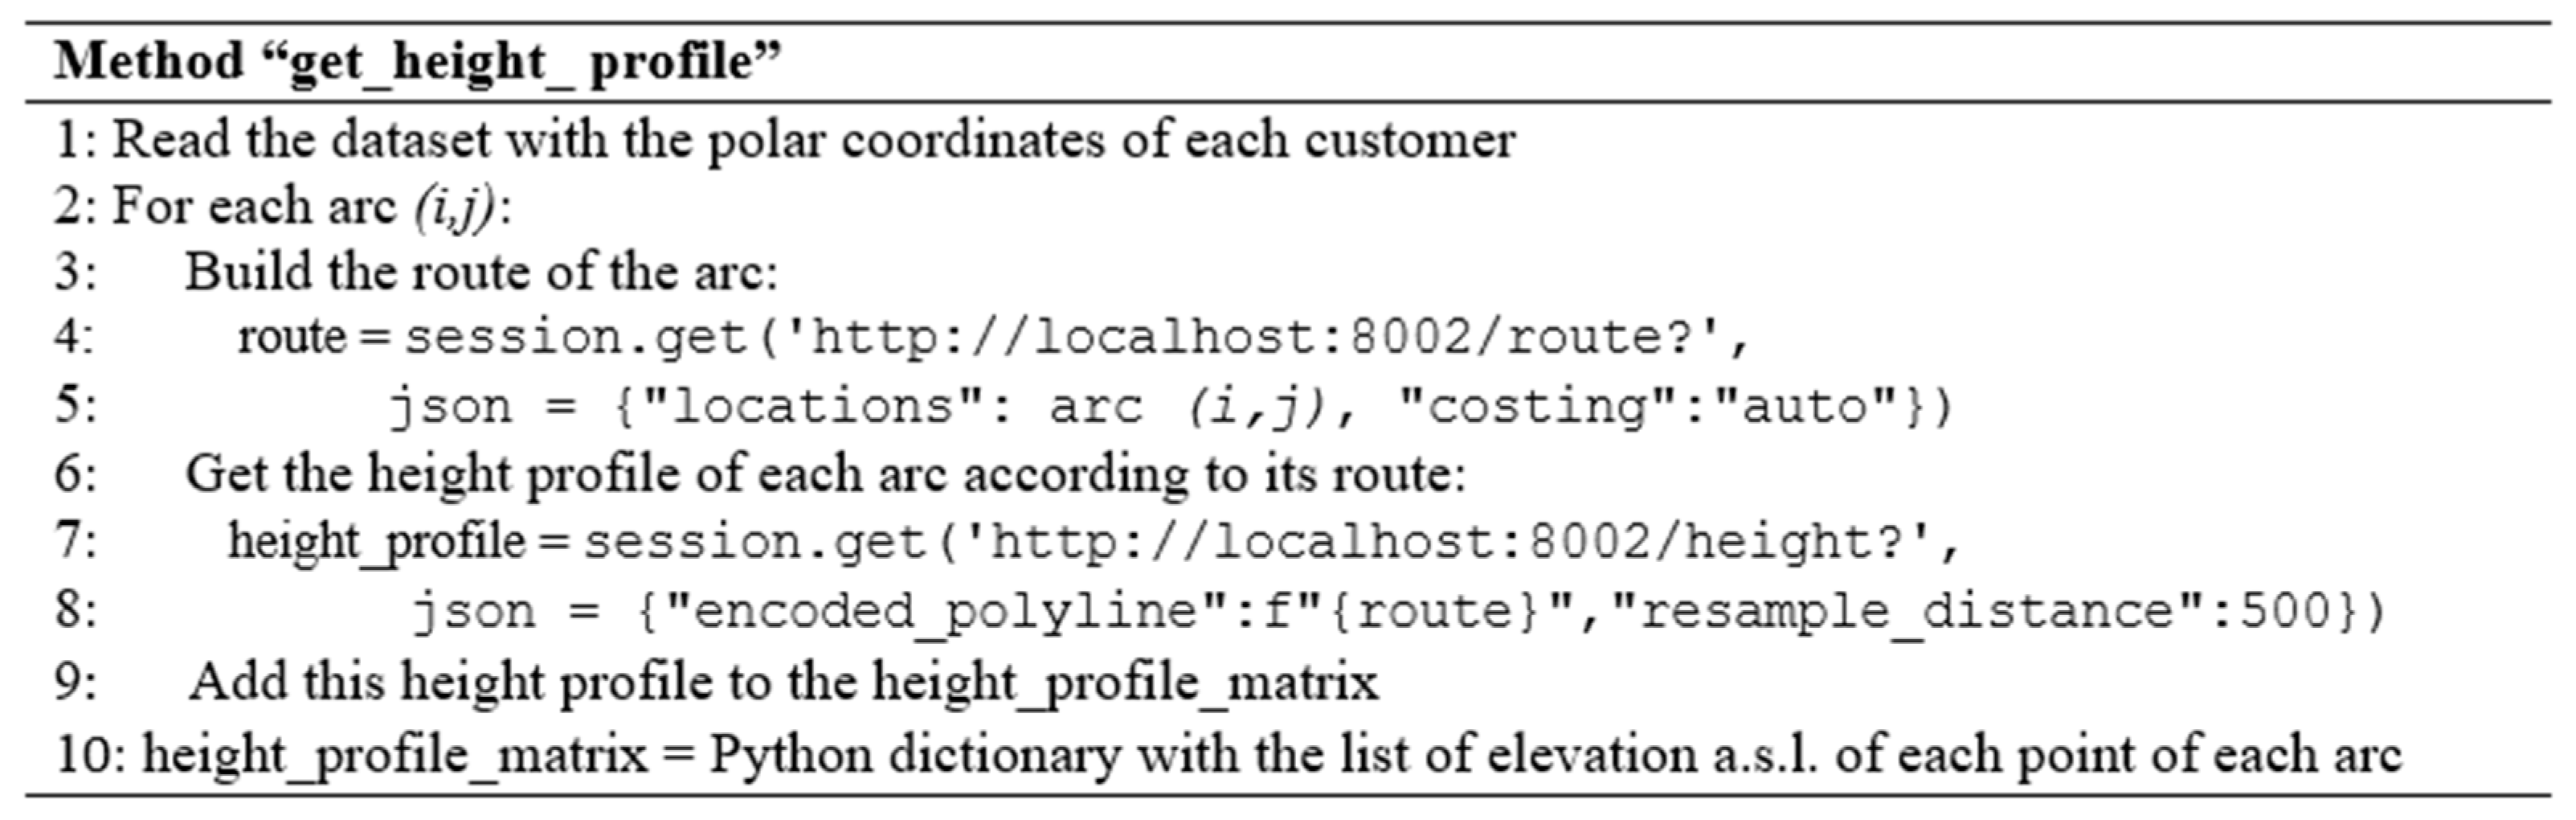
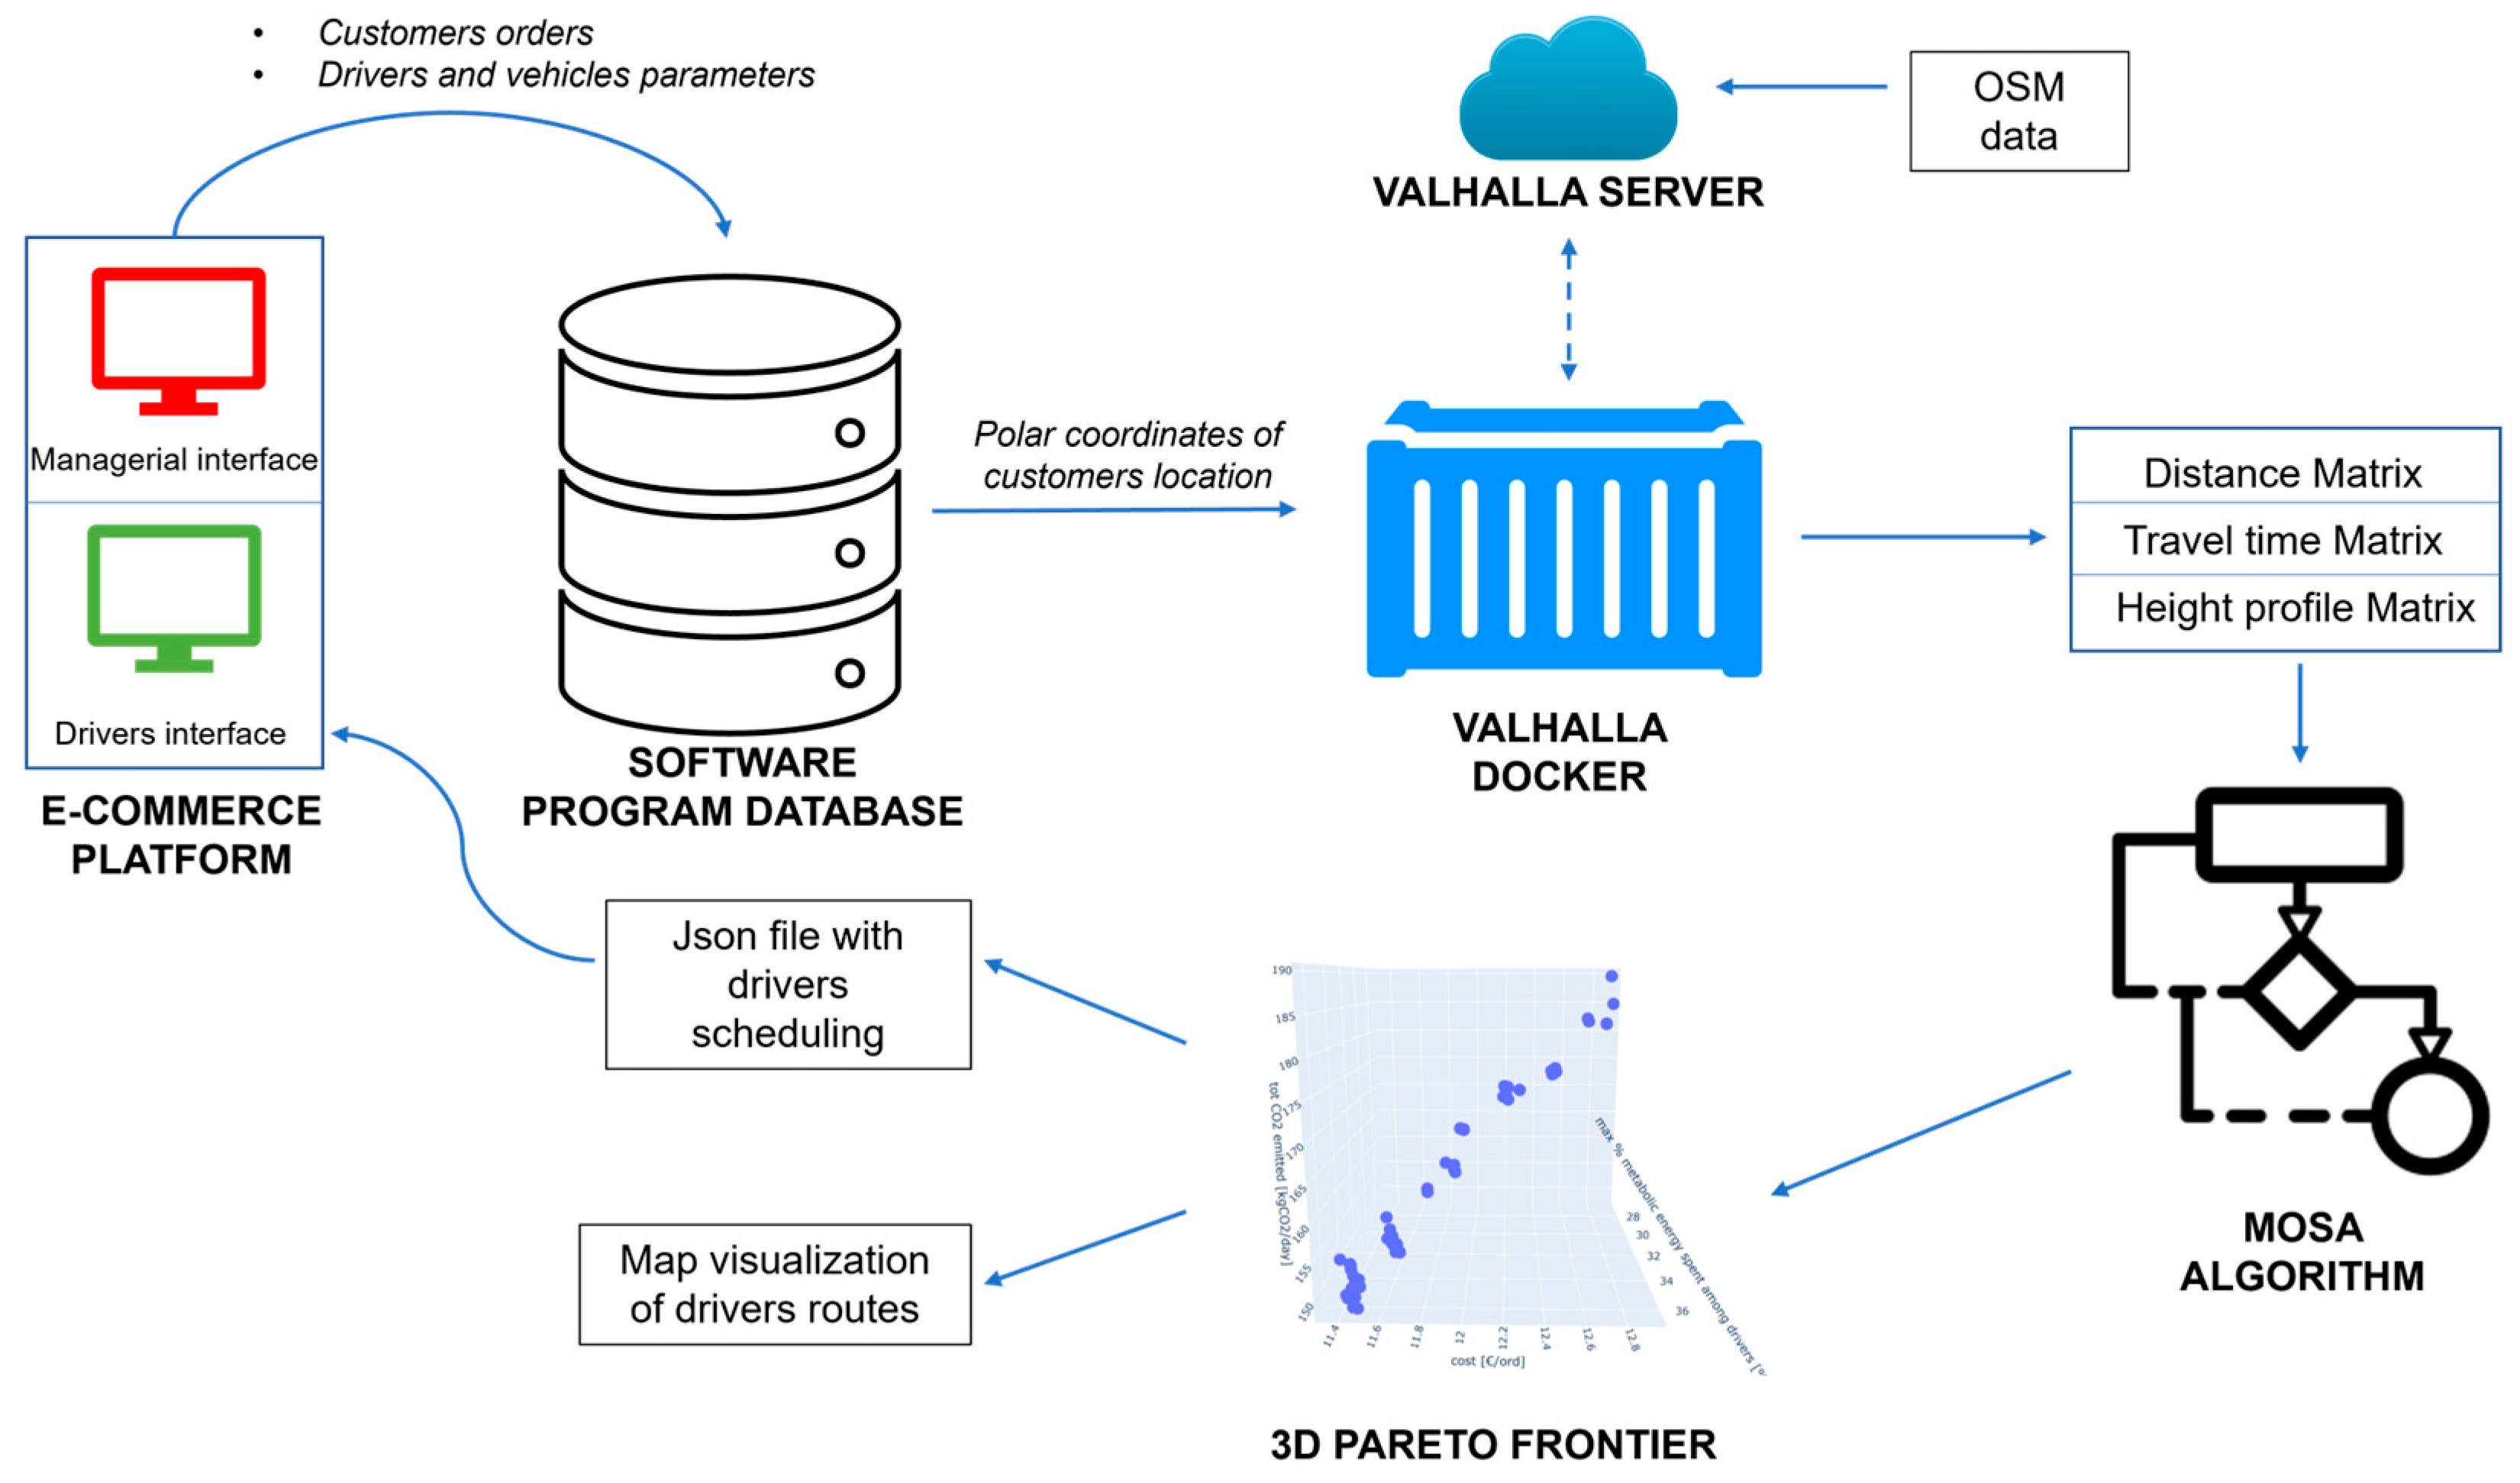
4. Case Study and Developed Software Architecture

The proposed MOSA with adaptive features is validated in multiple case studies distinguished by diverse kinds of products delivered and diverse dimensions of the area where the customers are located.
Indeed, the first group of instances is distinguished by the same set of customers, all located around the city of Trento, but different types of ordered products, and it is defined as Group P (Table 2). The values of the parameters for the three product categories considered are set according to real values of each product category. The first product type is characterized by small dimensions and weight, as well as multiple number of items requested per single order, for example, books and electronic devices (Instance P1). Therefore, a large number of orders of this product type can be transported in a single truck. The second type of product is distinguished by bigger dimensions and weights but a smaller number of items per single order, and typical products that fall into this category are fruit or vegetable boxes (Instance P2). Finally, the third type of product represents typical deliveries of furniture, and, thus, it is characterized by significant dimensions and weight but very small requests per single order (Instance P3). While the first two types of products are usually distinguished by standard dimensions, the furniture is distinguished by different dimensions according to the specific product so the average volume varies within a specific range and it is not a fixed value.
In the second group of instances, the type of product delivered is equal for all the instances, that is, the fruit and vegetable boxes, and the difference lies in the geographical distributions of customers. This group is called Group L and contains three different instances, as shown in Table 3. The first instance presents customers located around the city of Trento, in Italy (Instance L1), the second one is distinguished by customers spread all over the region of Trentino, especially in the most populated areas (Instance L2), while the last one contains customers located in Trentino’s most remote areas such as mountains and valleys (Instance L3). The first instance is distinguished by shorter distances between nodes than the other two due to customer locations in the main city of the region. Furthermore, both the second and the third instance are distinguished by orders placed all over the region of Trentino, while in the third one, customers are located in mountains and valleys areas. Figure 5 graphically illustrates the customers’ locations in the three instances of Group L. Appendix A further details the different tested instances. In particular, Table A1 lists additional information about these instances, such as the minimum and maximum weights or distances among nodes, while Table A2 reports the dataset of the customers’ orders for Instance L1.
To test the proposed metaheuristic algorithm in a realistic environment, all the parameter values of the mathematical model are set through experimental studies or with the support of literature contributions. Appendix B explains in detail the values of the parameters adopted and lists them in Table A3.
The first version of a software program (SWPG) was developed in Python 3.9 language to implement the MOSA algorithm. This SWPG used an Intel(R) Core(TM) i7-11700 @ 2.50 GHz computer to test the different instances with realistic data. For each specific instance, the developed SWPG elaborates several pieces of information and provides different results relevant to the considered e-commerce platform. The SWPG is embedded into a developed architecture composed of several elements necessary to read the needed inputs and print the requested outputs (Figure 6).
The dataset that contains the customers’ orders for a specific day and the dataset that contains the driver and vehicle parameters are provided by the online platform to the database that communicates with the developed SWPG. The polar coordinates of the customer locations are sent to a docker, which is a container that virtualizes the online server in a local computer. In detail, the docker used in this research duplicates the features of the Valhalla server, which is an open-source map service that leverages Open Street Map (OSM) geographical data, in a local computer, and it provides information about distance, time, and elevation a.s.l. of specific locations. Since most of the map services are distinguished by a limit on the number of requests performed by external software and on the dimension of the considered problem in terms of the number of nodes, the adoption of a docker enables overcoming these limits. Therefore, the Valhalla docker elaborates the polar coordinates of the customers and releases three different matrices. The distance matrix contains the travel distance between each node pair. The travel time matrix presents the travel times between each node pair and relies on both the real data about the speed limit on each arc provided by OSM and the related travel distance. These two matrices are computed through the method “get_distance_travel_time” (Figure 7). In lines 4–5, the “costing” attribute represents the mean of transportation according to which the distances and travel times are computed.
Finally, the height profile matrix contains, for each node pair, a list of elevations a.s.l. This is due to the fact that each arc is divided into links of constant length and the elevation is computed for the two extremum points of the link (as exhaustively described in Section 3.1) through the method “get_height_profile (Figure 8). In lines 7–8, the “resample_distance” attribute is the constant length (in meters) of each link into which each arc is divided to compute its height profile. Thus, the output of these lines is a list of elevations a.s.l. of the extremum points of each link.
These three matrices are the input of the MOSA algorithm, which offers a 3D Pareto front with the non-dominated solutions of the tackled optimization problem as output. This front represents a useful tool for users and practitioners who can select the solution that mostly satisfies their needs in terms of preferences for the three different objective functions considered. For the selected solution, the SWPG also offers the users the map of the drivers’ routes and a JavaScript Object Notation (.json) file with the scheduling of the customers’ orders to be fulfilled for each driver. This latter is included in the drivers’ interface of the online e-commerce platform. Consequently, at the beginning of the working day, each driver will receive his/her routing schedule so as to be informed in detail about his/her trip.

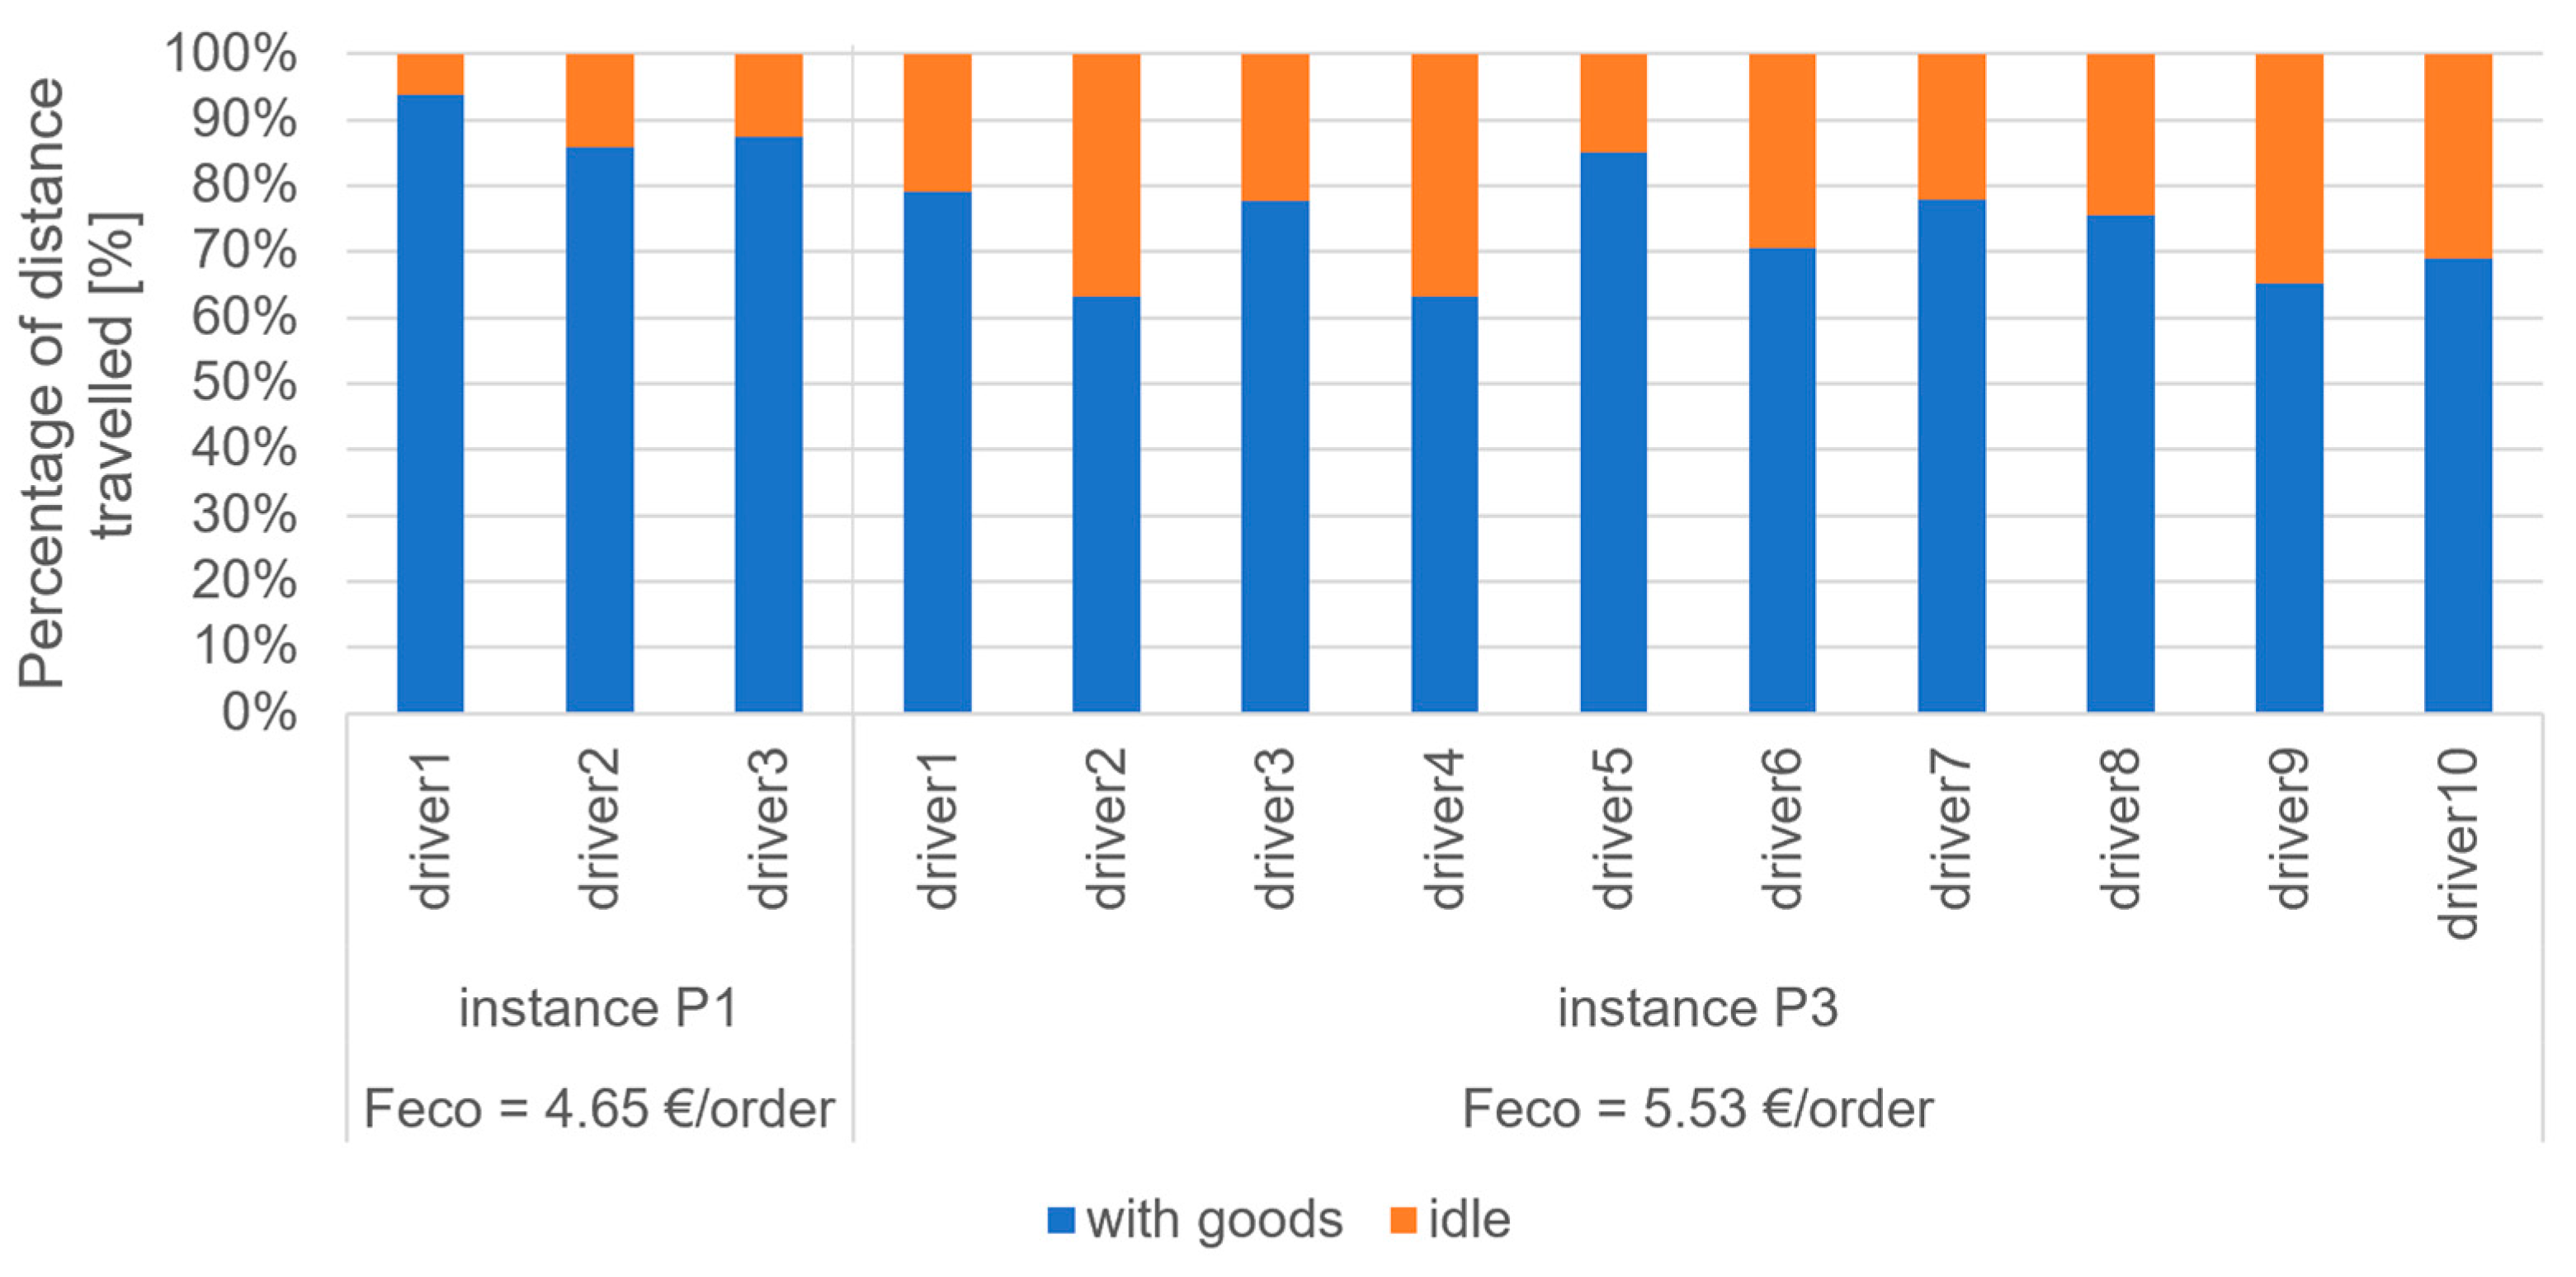
5. Results and Discussion

The execution of the proposed MOSA algorithm through the developed software program for each presented case study generated different 3D Pareto fronts from which several outcomes are obtained. The drawback of this visualization is the difficulty in graphically analyzing the obtained results. For this reason, this front is represented through the three bidimensional views where the objective function that is not in the axes is visualized with a color bar (Figure 9). Since all the solutions that belong to the Pareto front are multi-objective optimal ones, the bidimensional fronts generated from the 3D one are relevant representations for the decision-makers to select an efficient and appropriate solution for their specific requirements, e.g., the one distinguished by the most convenient trade-off among all the objectives according to the relevance given to each of them. For example, Figure 9a,b shows a possible decision taken by a practitioner who analyzes the Pareto front. In detail, if the practitioner assigns equal importance to the three objective functions, a proper approach would be to move from the bottom-right solution, which is distinguished by the best economic and environmental performances but the worst social one, to the central one (both highlighted through a red circle). This is because the central solution drastically improves the social objective function compared to the bottom-right one (19.4%), causing just a slight worsening in the economic and green objective functions (1.6% and 4.5%, respectively). This decision is just one of the potentials that could be defined since the choice of the final solution to adopt depends on the importance that each practitioner assigns to each objective function of the problem.
In a Pareto front, the optimal solutions of the single problem objectives are called anchor points (APs). Thus, the proposed problem is characterized by three APs, corresponding to the three sustainable objective functions. Table 4 lists the value of the three objective functions for each AP of Instance L2 to analyze the differences in all the aspects when considering one AP rather than another one.
As expected, each AP minimizes the corresponding objective function. An interesting aspect is that the economic and environmental APs are very close on the front since the values of each objective function are similar. This outcome suggests that choosing one of these two APs is quite similar in terms of overall performance. On the other hand, the social AP presents very different values for the three objectives compared to the other two APs. In detail, the social AP improves the social performance of the e-commerce platform by 27.7% compared to the other two APs, but it worsens the economic one by 13.5% and the environmental emissions by 25.2%. As already illustrated in Figure 8, two different outcomes can be generated from the Pareto front through the adoption of the generated software. The first one is the map visualization of the drivers’ routes. It helps to visualize a solution and understand the set of clients covered by each driver. Keeping Instance L2 as an example, Figure 10 shows the map of the routes for the social anchor point, e.g., the solution that most balances the routes and, thus, assigns a similar number of nodes to each driver. In this configuration, the customers are represented by a marker with a number, indicating the order of visiting. These numbers are circled with different colors that represent the different drivers (e.g., each driver has a different color) so all the nodes featured with the same color are visited by the same driver. Furthermore, from the overall visualization, it is also possible to filter by driver to analyze in detail every single route.
The second outcome obtained through the software from the 3D Pareto front is the .json file containing the scheduling of each driver. In particular, this file includes the customers’ addresses sorted according to the sequence of visits and several KPIs regarding the drivers’ activity, such as the distance traveled, the hours worked, the metabolic energy consumed, and the number of clients visited. In Table 5, the scheduling of a single driver is reported for the social AP of Instance L2. The entire .json file for this solution is presented in Table A4.
The social AP optimizes the social objective function that leverages a min–max approach. Therefore, the social AP simultaneously minimizes the energy consumption rate and balances the loads among all the drivers. For the sake of exemplification, Figure 11 shows the maximum and minimum values of three different indicators comparing the social and economic APs for Instance L2. In detail, these indicators are the number of clients served by each driver, the total distance traveled by each vehicle, and the energy consumption rate of each driver. The difference between the maximum and the minimum values among the different drivers is much wider for the economic AP than for the social one for all three indicators. For instance, Figure 11a shows that the maximum gap in the number of customers served among all the drivers in the economic AP is 18, while in the social AP, this number decreases to 10. Moreover, the maximum gap in the distance traveled by each vehicle in the economic AP is 182.63 km, while in the social AP, this gap is equal to 60.25 km (Figure 11b). Finally, the gap in the metabolic energy consumption rate among all the drivers in the economic AP is 28.95%, while it is only 2.5% in the social AP (Figure 11c). Indeed, the social AP balances the routes to reach a similar consumption of metabolic energy among all the drivers, independently of their personal characteristics. Therefore, the managerial insight coming from this outcome is that the selection of solutions closer to the social AP leads to more balanced routes in terms of traveled distance, number of customers, and metabolic energy consumption.
After a detailed analysis of the social AP, the focus shifts to the environmental one, which minimizes the total emissions caused by the delivery process. Figure 12 illustrates the range of the environmental objective function for all the Pareto solutions for the three instances of Group L, which are characterized by the same product type delivered but different geographical distributions of customers. Furthermore, this figure shows the range of the total distances traveled by drivers for all the Pareto-optimal solutions. As expected, Instance L1 has the least environmental impact since the geographical area covered by this instance, and, consequently, the traveled distance, is very limited. However, an interesting outcome regards the other two instances, which are located in the same area (Trentino region) but have a different geographical distribution of customers. Indeed, Instance L2 is distinguished by several customers being located in the most populated cities of the region, whereas Instance L3 includes lots of customers in the mountains or valleys of the region. As shown by Figure 12, although the total distance traveled in Instances L2 and L3 is similar, the ranges of the environmental objective function differ drastically. This relevant outcome is determined by the fact that the customers’ locations in Instance L2 are quite at the same elevation a.s.l., while in Instance L3, they are distinguished by very different altitudes, causing an increase in the carbon emissions due to the road gradient. From a managerial point of view, this result confirms that the green aspect of the distribution process of e-commerce platforms significantly depends on the orders’ geographic distribution. Indeed, not just the amount of traveled km but also the characteristics of the traveled road have an effect on the vehicles’ carbon emissions.
Since the environmental AP focuses on reducing CO2 emissions, the drivers’ routes are designed to minimize these ones, favoring the arcs that connect nodes at similar elevations a.s.l. To emphasize this aspect, a specific driver route in the environmental AP is compared to the same route in the social one (Figure 13). In detail, the map visualization of the two APs is accompanied by the corresponding height profile. This figure shows that the height profile in the environmental AP fluctuates between 100 m a.s.l. and 300 m a.s.l., while in the social one, there are very high peaks and very low valleys, and this significant change in road gradient dramatically worsens environmental performance. Through this output, managers can compare the height profile of different routes designed by different solutions and decide to adopt the one that minimizes altitude fluctuations to optimize the environmental sustainability of their vehicles. On the other hand, the social AP improves the social objective function by 26.7%, from 30.06% to 22.06%, compared to the social objective function in the environmental AP.
The results section focused so far on the instances of Group L, which are characterized by a different geographical distribution of customers but the same type of product delivered. The instances of Group P, on the other hand, are distinguished by the same geographical distribution of customers, they are around the city of Trento, but different types of products delivered. These types are distinguished by different weights and dimensions, which are relevant parameters to compute social performance. Indeed, the weight of each item determines the driver’s metabolic energy consumption for lifting activities, while its dimensions affect the vehicle capacity employed. The social objective function, divided between its lifting and driving components, of the social AP is reported in Figure 14 for all three instances of Group P. Counterintuitively, this goal decreases with the increase of the product dimensions and weight. In particular, a significant decrement is experienced comparing the Instances P1 and P2 with P3 since this latter product type is extremely bulky. This is due to the fact that bigger dimensions of items increase the number of vehicles (and drivers) needed to fulfill all the order requests. Therefore, the number of orders per driver is lower in Instance P3 than in the other two instances, and this provides two main consequences. On one hand, in Instance P3, each driver spends less time in driving activity than drivers of Instances P2 and P1. Indeed, Figure 15 reports a significant decrease in the average travel time from 4.55 h/day for Instances P1 and P2 to 1.57 h/day for P3. On the other hand, the number of lifting activities per driver decreases. Consequently, the social goal is reduced from 14.2% in Instance P1 to 5.6% in Instance P3 thanks to the decrease of both the lifting and driving components.
Regarding the economic performance of the considered problem, results report that it worsens with the increase in products’ dimensions and weight. Large dimensions and heavy weight enable fewer orders to be assigned to each driver, and, thus, vehicles travel a non-negligible distance empty to come back to the depot from the last customer to load further big products to be delivered to the following customers. This feature is not experienced when each driver delivers many orders, since during the delivery trip to deliver goods, the vehicle simultaneously comes closer to the depot. To assess this, the economic AP is studied. Figure 15 compares Instance P1, which is characterized by small products, and Instance P3, which is characterized by big ones, both in the economic objective function and in the percentage of distance traveled empty by each vehicle. It illustrates that in Instance P1, the economic objective function is 4.65 EUR/order, with an average percentage of distance traveled empty equal to 11%, whereas in Instance P3, the economic objective function is 5.53 EUR/order due to an average percentage of distance traveled empty equal to 27%. Thus, the delivery of small goods like books or electronic devices generates a decrease of 59% in the average percentage of distance traveled when empty by vehicles and an improvement of 16% in the economic performance compared to the delivery of bigger goods like furniture. Therefore, the managerial implication of this result is that higher economic performances can be reached by minimizing the distance traveled when empty by the vehicles since this does not provide any added value to the e-commerce platform. To accomplish this, small and medium products are preferable since they allow more flexible solutions that can serve customers while simultaneously coming back to the depot.
Furthermore, different general KPIs, not related to the specific objective functions, can be computed. In particular, Table 6 lists, for each tested instance and each anchor point, results regarding the number of vehicles employed as well as the total and average traveled distance. It can be observed that big products need three times the number of vehicles necessary to deliver small and medium ones, and they double the total traveled distance. Furthermore, this table shows that although Instances L2 and L3 cover the same geographic area, the latter needs more vehicles and causes an increase of almost 20% in the total traveled distance. These general KPIs can be useful for practitioners to immediately observe which AP performs better from an operational point of view in each tested instance.
The last outcome proposed in this section deals with the adaptive feature of the developed metaheuristic algorithm. In detail, Figure 16 presents both the average frequency with which each LS operator is selected along the entire MOSA algorithm and the actual number of times in which these operators are chosen in each segment of the algorithm for one of the instances tested (L3 in particular). At the beginning of the algorithm, the two inter-routes operators, namely, swap and relocation, are preferred, while at the end of the same, the two intra-routes operators, e.g., 2-opt and replacement, are selected with a higher frequency. In particular, the average percentage of the swap operator evolves from 30% in the initial stage to 11% in the final stage, whereas the average percentage of the replacement operator evolves from 8% to 25%. This behavior is due to the fact that, in the beginning, the MOSA algorithm explores a wide area of the solution space through the inter-route operators, which determine more drastic changes in the reference solution. On the contrary, in the final steps, it exploits the most promising area of solutions through intra-route operators, which slightly change the reference solution. Through the analysis of the operators’ performance, managers can decide to replace some of them with new ones or add operators with different features that could enhance either the exploration or the exploitation phases.

6. Conclusions

This paper presents the development and implementation of an adaptive MOSA algorithm to deal with a real-world delivery problem of an e-commerce platform based in the region of Trentino (Italy). In detail, the addressed problem is characterized by three objective functions related, respectively, to economic, environmental, and social aspects. The economic one represents the average cost per single order that the platform should consider for the delivery process. The environmental one includes the total carbon dioxide emissions due to delivery activities in a working period. To model the environmental aspect, the authors propose to consider an emission factor dependent on both the speed of the vehicle and the road gradient to adequately model the geographical aspect of this mountain region. Finally, the social objective function consists of the maximum energy consumption rate among all the drivers. After having developed the mathematical formulation of the proposed optimization problem, a MOSA metaheuristic algorithm was developed to solve it. Since four different LS operators are employed, the authors also include an adaptive feature to iteratively choose the best-performer one. A peculiarity of this research deals with the different scores of each LS operator, which are modeled to consider multiple objective functions rather than a single one. The MOSA algorithm is implemented through a Python-developed software program and tested in different instances divided into two groups. Group P includes instances characterized by the same geographical distribution of customers but different types of products delivered, while Group L includes instances characterized by the same product type but different customers’ geographical distribution. The developed software program provides a tri-dimensional Pareto front for each instance. This front represents a useful representation of the solutions for the practitioners who have to make order-to-driver assignment decisions. Since all the solutions of the front are optimal, the decision-maker can select the one that mostly fits with his/her needs, e.g., trade-off solution. Furthermore, an example of a trade-off solution chosen based on the Pareto front is presented that highlights how this solution provides a significant improvement in the social objective function (19.4%) of the e-commerce platform with a very limited deterioration in the economic and environmental ones (1.6% and 4.5%, respectively). After a detailed analysis of the entire Pareto front, the APs are carefully assessed, which are the solutions that optimize a specific objective function. In detail, the work reveals that the social AP balances different aspects of the delivery process compared to the other two APs, such as the number of customers assigned to each vehicle, their traveled distance, and the metabolic energy consumption rate of each driver. For the considered case study, a thorough assessment reveals that the environmental performance depends on the geographical distribution of the nodes since the road gradient could significantly vary among the different instances. In particular, both Instance L2 and Instance L3 cover the entire region of Trentino, but the former includes nodes at similar elevation a.s.l., while the latter is distinguished by more frequent oscillations of the height profile of the routes. This causes a worse environmental performance since the environmental objective function also depends on the road gradient. For the same reason, the environmental AP avoids routes with frequent fluctuations in the height profile compared to the social AP.
Regarding instances of Group P, bigger and heavier items delivered improve the social performance while worsening the economic one. Indeed, since these items need more space to be stored in the vehicle, the overall number of vehicles needed is higher, and, thus, the number of nodes assigned to each vehicle decreases. This implies that the metabolic energy spent by every single driver is reduced, while, on the other hand, since about 30% of the route is traveled empty by each vehicle in order to come back to the depot, the total distance traveled by the fleet of vehicles increases as does the economic objective function.
Further research should include the implementation of the developed adaptive MOSA metaheuristic algorithm for more advanced VRPs, for instance, the one that includes both pickup and delivery nodes. For this problem category, more constraints occur, and, thus, the implementation of the LS operators is much more challenging. An additional future improvement regards the algorithm adopted to solve the targeted problem. Indeed, an adaptive large neighborhood search is particularly promising to solve several types of VRPs, but for the proposed problem, it should be adapted to simultaneously tackle multiple objective functions. Finally, a comparison between different countries can be carried out to check if the characteristics of each case study could affect the performances of the distribution process of the local e-commerce platforms.

Author Contributions

Conceptualization, F.P.; methodology, F.P. and R.T.; software, R.T.; validation, F.P. and R.T.; formal analysis, F.P. and R.T.; investigation, F.P.; resources, F.P.; data curation, R.T.; writing—original draft preparation, R.T.; writing—review and editing, F.P.; visualization, R.T.; supervision, F.P.; project administration, F.P.; funding acquisition, F.P. All authors have read and agreed to the published version of the manuscript.

Funding

This research is supported through co-funding with the call “Bando piattaforma e-commerce Trentino” of the region of Trentino (Italy) with resolution 933 of 2020, according to the Provincial Law 13 May 2020, n°3.

Institutional Review Board Statement

Not applicable.

Informed Consent Statement

Not applicable.

Data Availability Statement

The data that support the findings of this study are available from the corresponding author, F.P., upon reasonable request.

Conflicts of Interest

The authors declare no conflict of interest.

Appendix A

This appendix thoroughly describes the tested instances. In detail, Table A1 lists some additional features of the case study, such as the ranges of customers’ weight and volume or minimum and maximum distance/elevation within the nodes.
Table A1. Additional features of the tested instances.
InstanceRange of Weight [kg]Range of
Volume [m3]
Min Distance [km]Max Distance [km]Min Elevation [m]Max Elevation [m]
P10.4–140.00071–0.00710.06021.169180567
P24–260.048–0.1920.06021.169180567
P317–260.196–0.630.06021.169180567
L14–260.048–0.1920.06021.169180567
L24–280.048–0.1920.163157.641642035
L34–280.048–0.1920.079169.188642035
The dataset of orders and depot for Instance L1 is used to test and validate the developed MOSA algorithm (Table A2). This dataset includes information regarding the address and the polar coordinates for the depot, as well as additional information like the demand total weight and volume and the number of items ordered for each customer.
Table A2. Dataset of customers’ orders for Instance L1.
CustomerCustomer AddressLatitudeLongitudewi [kg]voli [m3]niwsi [kg]
DEPOTVia Innsbruck, 65, 38121 Trento TN46.101870311.09530680000
CLI_1Via Clementino Vannetti, 41, 38122 Trento TN46.072511711.12187215.60.00282441.4
CLI_2Via Calepina, 63, 38122 Trento TN46.06688311.123049730.00211831
CLI_3Via Gianantonio Manci, 6, 38122 Trento TN46.0697811.121726.60.00423661.1
CLI_4Piazza Lodron, 9, 38122 Trento TN46.068006411.12329798.10.00635490.9
CLI_5Via Brigata Acqui, 19, 38122 Trento TN46.0654179211.129158314.90.00494270.7
CLI_6Via Missioni Africane, 13, 38121 Trento TN46.080196511.126250620.00141221
CLI_7Via del Brennero, 113, 38121 Trento TN46.086256711.11824161.60.00141220.8
CLI_8Via Ponte Alto, 79, 38121 Cognola TN46.073646211.14862346.50.0035351.3
CLI_9Via Venezia, 123, 38122 Trento TN46.06972811.13630136.60.00423661.1
CLI_10Piazza Giannantonio Manci, 14, 38123 Povo TN46.065989211.154520185.50.0035351.1
CLI_11Via Mesiano, 40, 38123 Trento TN46.06680811.1405825140.00706101.4
CLI_12Via Aurelio Nicolodi, 36, 38122 Trento TN46.061626211.13532741.60.00141220.8
CLI_13Via Umberto Giordano, 6, 38123 Trento TN46.049463911.14743061.20.00141220.6
CLI_14Via Adalberto Libera, 3, 38122 Trento TN46.0594829511.115553320.80.00070610.8
CLI_15Corso 3 Novembre 1918, 98, 38122 Trento TN46.06076411.1249194.20.00423660.7
CLI_16Via Enrico Fermi, 12, 38123 Trento TN46.046925611.12644450.90.00070610.9
CLI_17Via di Madonna Bianca, 5, 38123 Trento TN46.0331284511.132282591.20.00141220.6
CLI_18Via di Stella di Man, 20, 38123 Trento TN46.0366583211.1305720770.00494271
CLI_19Via Berlina, 5, 38123 Ravina, Trento TN46.039618611.10909946.60.00423661.1
CLI_20Via Stella, 9/E, 38123 Ravina TN46.037158611.1141910.90.00070610.9
CLI_21Via Brescia, 19/A, 38122 Trento TN46.070572411.1123092.20.00141221.1
CLI_22Via Torre Verde, 29, 38122 Trento TN46.071955211.12444055.60.00564880.7
CLI_23Via Hermann Gmeiner, 25, 38122 Trento TN46.059967611.13839210.80.00070610.8
CLI_24Via Ancilla Marighetto Ora, 19, 38123 Trento TN46.038975511.13172920.00141221
CLI_25Via don Alfonso Anselmi, 38121 Trento TN46.076367311.14164644.20.00494270.6
CLI_26Via del Brennero, 142, 38121 Trento TN46.0800657511.122552854.80.00423660.8
CLI_27Via Santi Cosma e Damiano, 21, 38121 Trento TN46.082016411.1040884.20.00494270.6
CLI_28Via Mantova, 19, 38122 Trento TN46.068036811.12401160.90.00070610.9
CLI_29Viale Trieste, 25, 38122 Trento TN46.064958911.1355793.30.00211831.1
CLI_30Via del Bompòrt, 27, 38123 Trento TN46.050396211.15065363.60.00282440.9
CLI_31Via di Madonna Bianca, 3, 38123 Trento TN46.033064411.13183768.40.00423661.4
CLI_32Via Fersina, 15, 38123 Trento TN46.04027911.124190460.00423661
CLI_33Via Santa Croce, 4, 38122 Trento TN46.064717511.12321324.40.00282441.1
CLI_34Via Provina, 2, 38123 Ravina TN46.0383584811.11567862.40.00211830.8
CLI_35Via Gorizia, 60, 38122 Trento TN46.061154211.132291170.00494271
CLI_36Via Sommarive, 9, 38123 Povo, Trento TN46.067866811.15037937.80.00423661.3
CLI_37Via Ponte Alto, 26, 38121 Cognola TN46.073019311.148463350.0035351
CLI_38Via al Vascon, 8, 38122 Trento TN46.070767811.13987332.70.00211830.9
CLI_39Via Luigi Caneppele, 31/A, 38121 Trento TN46.097240911.10276166.30.00635490.7
CLI_40Via Tommaso Gar, 21, 38122 Trento TN46.067316611.11726851.40.00141220.7
CLI_41Via Giuseppe Giusti, 20, 38122 Trento TN46.06106811.11879352.80.00141221.4
CLI_42Via S. Pio X, 53, 38122 Trento TN46.054786311.12042562.40.00141221.2
CLI_43Via Vittorio Veneto, 134, 38122 Trento TN46.058999811.1250541100.00706101
CLI_44Via della Malpensada, 88, 38123 Trento TN46.046530511.13320361.50.00211830.5
CLI_45Via dei Viticoltori, 5, 38123 Trento TN46.0321604611.132648047.70.00494271.1
CLI_46Via Ragazzi del ‘99, 13, 38123 Trento TN46.037382211.1267424120.00706101.2
CLI_47Via S. Rocco, 2, 38123 Trento TN46.038342211.14567828.40.00423661.4
CLI_48Via Alcide Degasperi, 130, 38123 Trento TN46.0488591511.126039332.20.00141221.1
CLI_49Via del Ponte, 15, 38123 Trento TN46.041937711.11283410.40.00564881.3
CLI_50Lungadige Marco Apuleio, 58, 38121 Trento TN46.0721851511.1154182390.00635491
CLI_51Via Vittorio Alfieri, 1/3, 38122 Trento TN46.070190911.12156436.50.0035351.3
CLI_52Via S. Pietro, 38, 38122 Trento TN46.069185611.12427587.70.00494271.1
CLI_53Via Enrico Conci, 76, 38123 Trento TN46.039519911.1381993.50.0035350.7
CLI_54Via Luigi Einaudi, 56, 38123 Trento TN46.052323711.12824683.20.00282440.8
CLI_55Via padre Eusebio Chini, 101/1, 38123 Trento TN46.052140811.13246533.50.00494270.5
CLI_56Via Znojmo, 24, 38123 Povo, Trento TN46.054573211.151123960.00706100.6
CLI_57Via Salè, 7, 38123 Trento TN46.061820811.15220190.90.00070610.9
CLI_58Via Santa Croce, 67, 38100 Trento TN46.063343411.1243886110.00706101.1
CLI_59Via Card. Cristoforo Madruzzo, 24, 38122 Trento TN46.0637392711.120906761.20.00070611.2
CLI_60Via Antonio Rosmini, 24, 38122 Trento TN46.067747611.11865235.40.00635490.6
CLI_61Via Alcide Degasperi, 128, 38123 Trento TN46.046073611.12812796100.00706101
CLI_62Vicolo dalla Piccola, 12/TERZO PIANO, 38122 Trento TN46.0632498511.1230976610.80.00635491.2
CLI_63Via Fratelli Perini, 141, 38122 Trento TN46.0606471311.1227243590.00706100.9
CLI_64Via Bellavista, 2, 38121 Trento TN46.0885739111.131794394.20.00494270.6
CLI_65Via del Dos, 3, 38121 Trento TN46.0793326211.131397551.50.00211830.5
CLI_66Via Gabbiolo, 13, 38123 Trento TN46.0569020511.155136182.20.00141221.1
CLI_67Via Galassa, 12, 38123 Trento TN46.042819711.14196591120.00706101.2
CLI_68Via dei Ronchi, 41, 38123 Trento TN46.069782411.168016492.70.00211830.9
CLI_69Via alla Césa Vècia, 11, 38123 Sardagna TN46.0627940711.0998124811.70.00635491.3
CLI_70Via per Belvedere, 51, 38123 Belvedere TN46.045280711.107335077.20.00635490.8
CLI_71Via IV Novembre, 35/1, 38121 Trento TN46.1041442511.1150460260.0035351.2
CLI_72Via Danilo Paris, 17, 38121 Trento TN46.0975208511.105803990.90.00070610.9
CLI_73Via Centochiavi, 17/19, 38121 Trento TN46.0953043111.120547315.20.00282441.3
CLI_74Via Mansueto Mazzonelli, 38123 Ravina TN46.0379540911.108023771.80.00141220.9
CLI_75Via Valnigra, 69, 38121 Trento TN46.0521963811.147478260.00706100.6
CLI_76Via alla Veduta, 74A, 38121 Cognola TN46.0762986411.146533240.40.00282440.1
CLI_77Località La Vela, 38121 Vela TN46.081206811.1011502311.20.00564881.4
CLI_78Corso degli Alpini, 14, 38121 Trento TN46.0787747511.119005462.10.00211830.7
CLI_79Via 25 Aprile, 4, 38121 Trento TN46.0983864611.1164256630.00141221.5
CLI_80Via Giovanni Borsellino, 3, 38123 Trento TN46.0474863111.129178442.20.00141221.1

Appendix B

This appendix comprehensively describes the values adopted for the parameters of the targeted problem (Table A3). For instance, the values of the parameters used to set the intervals of the selection processes in the MOSA are based on the contribution of Sankararao et al. [50], while the typical simulated annealing parameters, like λ, N_iter, and Tend are fine-tuned through multiple algorithm iterations. The parameters of the considered instances are set according to real data. For the sake of exemplification, the vehicle capacity, both in weight and in volume, is based on typical light-duty vehicle dimensions. In detail, only 70% of the total capacity of these vehicles is considered to be available since trucks cannot be loaded completely due to some intrinsic inefficiencies of this activity. Moreover, the values of the parameters related to operator metabolic energy are based on the literature contributions. Body weight and working energy capacity of drivers according to their personal characteristics are taken from the NIOSH report [34], δ is taken from Martnes and Bere [47], and the values of βk and β″k and α′, …, α′′′′ are obtained with the help of the contribution of Iqbal et al. [48]. For the tested instances, it is supposed that there are three different types of drivers with specific personal characteristics that cover multiple features, i.e., a 35-year-old man, a 35-year-old woman, and a 55-year-old man. Finally, the parameters related to the adaptiveness of the algorithm, like N_seg, r, σ1, and σ2, are tuned based on the contribution of Ropke and Pisinger [19].
Table A3. Values of all the parameters of the proposed metaheuristic algorithm and mathematical model.
ParameterValueUnits of Measure
n80Customer
N_begin1000Iteration
Tmax200°C
Tend0.05°C
N_itern × 40Iteration
a10.1
a20.1
b130
b25
λ0.9
ψ0.85
l0.5km
W434kg
V3.14m3
cf2.9EUR/h
cop23.3EUR/h
cv1.9EUR/L
γ0.07L/km
T8h
tser0.133h
ECkYounger Man (YM):2376;
Woman (W): 1663.2;
Older Man (OM): 1924.6
Kcal/day
BWkYM and OM: 75; W: 60kg
δ2.3Kcal/kg·h
βkYM and OM: −1.7; W: −1.3
βkYM and OM: 2.1; W: 2.3
α0.01
α0.4
α0.76
α′′′′0.23
N_seg1000Iteration
σ133
σ29
r0.1

Appendix C

This appendix shows the .json file containing the scheduling of each driver for the social AP of Instance L2 (Table A4). This file includes the information for each driver ID regarding the number of customers visited, the total distance traveled, the total time spent at work, the total weight lifted, and the metabolic energy consumption rate. Furthermore, this file lists the customers’ addresses sorted according to the sequence of visits during a working shift.
Table A4. Scheduling of drivers in the social AP of Instance L2.
Driver IDN° Visited CustomersDistance Traveled [km/day]Time Spent at Work [h/day]Total Weight Lifted in Loading/Unloading
Activities [kg/day]
% of
Metabolic Energy Spent
Customer Address
#112150.454.1313119.781. Via Tamarisi, 2, 38057 Pergine Valsugana TN (Italy)
2. Viale Dante, 81/G, 38057 Pergine Valsugana TN (Italy)
3. Via Tadesia, 4, 38057 Sant’Orsola TN (Italy)
4. Frazione Piazzo, 21, 38047 Piazzo TN (Italy)
5. P.za Chiesa, 1, 38016 Mezzocorona TN (Italy)
6. Via Dante A., 5, 38016 Mezzocorona TN (Italy)
7. Via Damiano Chiesa, 1, 38017 Mezzolombardo TN (Italy)
8. Via Kufstein, 5, 38121 Trento TN (Italy)
9. Via dei Masadori, 4, 38121 Gardolo di Mezzo TN (Italy)
10. Via del Brennero, 142, 38121 Trento TN (Italy)
11. Via Bolghera, 34, 38122 Trento TN (Italy)
12. Via G. G. Tovazzi, 1, 38060 Volano TN (Italy)
#210145.883.7317122.011. Via della Zarga, 81, 38015 Lavis TN (Italy)
2. Via del Carmine, 7, 38015 Lavis TN (Italy)
3. Piazza SS. Filippo e Giacomo, 2, 38010 Zambana TN (Italy)
4. Via Canè, 136, 38016 Mezzocorona TN (Italy)
5. Via Pizzegoda, 13, 38033 Cavalese TN (Italy)
6. Via Marco, 53, 38033 Cavalese TN (Italy)
7. Via Battisti, 22, 38037 Predazzo TN (Italy)
8. Via Ronchi, 2, 38043 Bedollo TN (Italy)
9. Via del Capitel, 17, 38042 Baselga di Pinè TN (Italy)
10. Piazza S. Maria, 7, 38045 Civezzano TN (Italy)
#313119.494.0014822.281. Via Suor Fabiola Forti, 1, 38010 San Michele All’adige TN (Italy)
2. Via Don A. Tamanini, 38010 San Michele All’adige TN (Italy)
3. Corso Giuseppe Mazzini, 3, 38017 Mezzolombardo TN (Italy)
4. Via Arturo de Varda, 10, 38017 Mezzolombardo TN (Italy)
5. Via Santi Cosma e Damiano, 21, 38121 Trento TN (Italy)
6. Via dei Casai, 1, 38123 Baselga del Bondone TN (Italy)
7. Via di Coltura, 9, 38123 Cadine TN (Italy)
8. Via Alcide Degasperi, 68, 38060 Aldeno TN (Italy)
9. Via Francesco Paoli, 11, 38068 Rovereto TN (Italy)
10. Corso Bettini, 24, 38068 Rovereto TN (Italy)
11. Via della Villa, 28, 38100 Villazzano TN (Italy)
12. Via dei Ronchi, 3, 38123 Povo TN (Italy)
13. Via Ponte Alto, 26, 38121 Cognola TN (Italy)
#416156.564.9118822.231. Via Aldo Moro, 7, 38062 Arco TN (Italy)
2. Via Baltera, 20, 38066 Riva del Garda TN (Italy)
3. Viale Rovereto, 73, 38066 Riva del Garda TN (Italy)
4. Via del Garda, 63, 38065 Mori TN (Italy)
5. Via Cooperazione, 19, 38065 Mori TN (Italy)
6. Via Albino Zenatti, 27, 38061 Chizzola TN (Italy)
7. Via Monte Baldo, 7, 38063 Avio TN (Italy)
8. Via del Lavoro, 18, 38063 Avio TN (Italy)
9. Via XXVII Maggio, 49, 38060 Borghetto TN (Italy)
10. Via del Tambuset, 9, 38061 Ala TN (Italy)
11. Piazza Papa Giovanni XXIII, 13, 38061 Ala TN (Italy)
12. Via Enrico Fermi, 13/15, 38061 Ala TN (Italy)
13. Località Navesel, 7, 38068 Rovereto TN (Italy)
14. Corso Verona, 4, 38068 Rovereto TN (Italy)
15. Via Lungo Leno Sinistro, 64, 38068 Rovereto TN (Italy)
16. Piazza S. Valentino, 4, 38060 Noarna TN (Italy)
#56157.293.228621.211. Via Adamello, 16, 38086 Madonna di Campiglio TN (Italy)
2. Via Vallesinella, 19, 38086 Madonna di Campiglio TN (Italy)
3. Viale Marconi, 15, 38086 Pinzolo TN (Italy)
4. Frazione Godenzo, 38077 Comano Terme TN (Italy)
5. Via per Belvedere, 2, 38123 Ravina TN (Italy)
6. Via Stella, 9/1, 38123 Ravina TN (Italy)
#614126.83.9717121.161. Via Bortolamei, 18, 38057 Pergine Valsugana TN (Italy)
2. Via de Vettorazzi, 2, 38056 Levico Terme TN (Italy)
3. SP31, 32, 38030 Telve TN (Italy)
4. Piazza Municipio, 1, 38050 Castelnuovo TN (Italy)
5. Via Fratelli, 6, 38051 Borgo Valsugana TN (Italy)
6. Via del Moggio, 17, 38051 Borgo Valsugana TN (Italy)
7. Via Bartolomeo Salvadoris, 7, 38052 Caldonazzo TN (Italy)
8. Via Monterovere, 1, 38052 Caldonazzo TN (Italy)
9. Via Guglielmo Marconi, 28, 38052 Caldonazzo TN (Italy)
10. Via Alessandro Manzoni, 63, 38064 Carbonare TN (Italy)
11. Via L. Cadorna, 2, 38064 Folgaria TN (Italy)
12. Frazione Mezzomonte di Sopra, 52, 38064 Folgaria TN (Italy)
13. Via Valentini, 31, 38060 Calliano TN (Italy)
14. Via Giulio Catoni, 106, 38123 Mattarello TN (Italy)
#79179.744.0811722.101. Via Monte Brione, 5, 38062 Arco TN (Italy)
2. Via Pier Antonio Cassoni, 18 Fr. Pieve di Ledro, 38067 Ledro TN (Italy)
3. Via Nuova, 18, 38067 Ledro TN (Italy)
4. Via Santa Lucia, 36, 38067 Bezzecca TN (Italy)
5. Via Giuseppe Garibaldi, 125/C, 38089 Storo TN (Italy)
6. Via Saverio, 46, 38080 Daone TN (Italy)
7. Via Lungo Lago, 7A, 38018 Molveno TN (Italy)
8. Via Ponte Lambin, 9, 38010 Andalo TN (Italy)
9. Piazza Italia Unita, 16, 38010 Fai della Paganella TN (Italy)

References

  1. Yang, H.; Wang, S.; Zheng, Y. Spatial-Temporal Variations and Trends of Internet Users: Assessment from Global Perspective. Inf. Dev. 2021, 39, 136–146. [Google Scholar] [CrossRef]
  2. Global E-Commerce Trends Report. Available online: https://www.jpmorgan.com/solutions/treasury-payments/global-ecommerce-trends-report (accessed on 22 February 2022).
  3. Buldeo Rai, H. The Net Environmental Impact of Online Shopping, beyond the Substitution Bias. J. Transp. Geogr. 2021, 93, 103058. [Google Scholar] [CrossRef]
  4. Lund, S.; Madgavkar, A.; Manyika, J.; Smit, S.; Ellingrud, K.; Meaney, M.; Robinson, O. The Future of Work after COVID-19; Technical Report; McKinsey Global Institute: Washington, DC, USA, 2021. [Google Scholar]
  5. Ha, S.; Childs, M.; Sneed, C.T.; Berry, A. Consumer Sustainable Shopping Practices for Small Business during COVID-19. Sustainability 2021, 13, 12451. [Google Scholar] [CrossRef]
  6. Tang, J.; Ji, S.; Jiang, L. The Design of a Sustainable Location-Routing-Inventory Model Considering Consumer Environmental Behavior. Sustainability 2016, 8, 211. [Google Scholar] [CrossRef]
  7. United Nations (UN). Transforming Our World: The 2030 Agenda for Sustainable Development; Technical Report; United Nations (UN): New York, NY, USA, 2015.
  8. Mondal, C.; Giri, B.C. Analyzing a Manufacturer-Retailer Sustainable Supply Chain under Cap-and-Trade Policy and Revenue Sharing Contract. Oper. Res. 2022, 22, 4057–4092. [Google Scholar] [CrossRef]
  9. Alagarsamy, S.; Mehrolia, S.; Mathew, S. How Green Consumption Value Affects Green Consumer Behaviour: The Mediating Role of Consumer Attitudes Towards Sustainable Food Logistics Practices. Vis. J. Bus. Perspect. 2021, 25, 65–76. [Google Scholar] [CrossRef]
  10. Banasik, A.; Bloemhof-Ruwaard, J.M.; Kanellopoulos, A.; Claassen, G.D.H.; van der Vorst, J.G.A.J. Multi-Criteria Decision Making Approaches for Green Supply Chains: A Review. Flex. Serv. Manuf. J. 2018, 30, 366–396. [Google Scholar] [CrossRef]
  11. Toth, P.; Vigo, D. (Eds.) Vehicle Routing: Problems, Methods, and Applications, 2nd ed.; MOS-SIAM Series on Optimization; Society for Industrial and Applied Mathematics: Philadelphia, PA, USA, 2014; ISBN 978-1-61197-358-7. [Google Scholar]
  12. Pilati, F.; Zennaro, I.; Battini, D.; Persona, A. The Sustainable Parcel Delivery (SPD) Problem: Economic and Environmental Considerations for 3PLs. IEEE Access 2020, 8, 71880–71892. [Google Scholar] [CrossRef]
  13. Jayarathna, C.P.; Agdas, D.; Dawes, L.; Yigitcanlar, T. Multi-Objective Optimization for Sustainable Supply Chain and Logistics: A Review. Sustainability 2021, 13, 13617. [Google Scholar] [CrossRef]
  14. Pereira, J.L.J.; Oliver, G.A.; Francisco, M.B.; Cunha, S.S.; Gomes, G.F. A Review of Multi-Objective Optimization: Methods and Algorithms in Mechanical Engineering Problems. Arch. Comput. Methods Eng. 2022, 29, 2285–2308. [Google Scholar] [CrossRef]
  15. Altabeeb, A.M.; Mohsen, A.M.; Abualigah, L.; Ghallab, A. Solving Capacitated Vehicle Routing Problem Using Cooperative Firefly Algorithm. Appl. Soft Comput. 2021, 108, 107403. [Google Scholar] [CrossRef]
  16. Dell’Amico, M.; Díaz, J.C.D.; Hasle, G.; Iori, M. An Adaptive Iterated Local Search for the Mixed Capacitated General Routing Problem. Transp. Sci. 2016, 50, 1223–1238. [Google Scholar] [CrossRef]
  17. Peng, B.; Zhang, Y.; Gajpal, Y.; Chen, X. A Memetic Algorithm for the Green Vehicle Routing Problem. Sustainability 2019, 11, 6055. [Google Scholar] [CrossRef]
  18. Ozcetin, E.; Ozturk, G. A Variable Neighborhood Search for Open Vehicle Routing Problem. Concurr. Comput. Pract. Exp. 2023, 35, e7598. [Google Scholar] [CrossRef]
  19. Ropke, S.; Pisinger, D. An Adaptive Large Neighborhood Search Heuristic for the Pickup and Delivery Problem with Time Windows. Transp. Sci. 2006, 40, 455–472. [Google Scholar] [CrossRef]
  20. Han, H.; Chen, L.; Fang, S.; Liu, Y. The Routing Problem for Electric Truck with Partial Nonlinear Charging and Battery Swapping. Sustainability 2023, 15, 13752. [Google Scholar] [CrossRef]
  21. Saker, A.; Eltawil, A.; Ali, I. Adaptive Large Neighborhood Search Metaheuristic for the Capacitated Vehicle Routing Problem with Parcel Lockers. Logistics 2023, 7, 72. [Google Scholar] [CrossRef]
  22. Deng, W.; Zhang, X.; Zhou, Y.; Liu, Y.; Zhou, X.; Chen, H.; Zhao, H. An Enhanced Fast Non-Dominated Solution Sorting Genetic Algorithm for Multi-Objective Problems. Inf. Sci. 2022, 585, 441–453. [Google Scholar] [CrossRef]
  23. Zhang, W.; Gajpal, Y.; Appadoo, S.S.; Wei, Q. Multi-Depot Green Vehicle Routing Problem to Minimize Carbon Emissions. Sustainability 2020, 12, 3500. [Google Scholar] [CrossRef]
  24. Ganji, M.; Kazemipoor, H.; Hadji Molana, S.M.; Sajadi, S.M. A Green Multi-Objective Integrated Scheduling of Production and Distribution with Heterogeneous Fleet Vehicle Routing and Time Windows. J. Clean. Prod. 2020, 259, 120824. [Google Scholar] [CrossRef]
  25. Bektaş, T.; Ehmke, J.F.; Psaraftis, H.N.; Puchinger, J. The Role of Operational Research in Green Freight Transportation. Eur. J. Oper. Res. 2019, 274, 807–823. [Google Scholar] [CrossRef]
  26. Costagliola, M.A.; Costabile, M.; Prati, M.V. Impact of Road Grade on Real Driving Emissions from Two Euro 5 Diesel Vehicles. Appl. Energy 2018, 231, 586–593. [Google Scholar] [CrossRef]
  27. Hickman, J.; Hassel, D.; Joumard, R.; Samaras, Z.; Sorenson, S. Methodology for Calculating Transport Emissions and Energy Consumption; Technical Report; Transportation Research Laboratory: Berkshire, UK, 1999. [Google Scholar]
  28. Dhital, N.B.; Wang, S.-X.; Lee, C.-H.; Su, J.; Tsai, M.-Y.; Jhou, Y.-J.; Yang, H.-H. Effects of Driving Behavior on Real-World Emissions of Particulate Matter, Gaseous Pollutants and Particle-Bound PAHs for Diesel Trucks. Environ. Pollut. 2021, 286, 117292. [Google Scholar] [CrossRef] [PubMed]
  29. Shahrabi, F.; Tavakkoli-Moghaddam, R.; Triki, C.; Pahlevani, M.; Rahimi, Y. Modelling and Solving the Bi-Objective Production–Transportation Problem with Time Windows and Social Sustainability. IMA J. Manag. Math. 2021, 33, 637–662. [Google Scholar] [CrossRef]
  30. Matl, P.; Hartl, R.F.; Vidal, T. Workload Equity in Vehicle Routing Problems: A Survey and Analysis. Transp. Sci. 2018, 52, 239–260. [Google Scholar] [CrossRef]
  31. Książek, R.; Gdowska, K.; Korcyl, A. Recyclables Collection Route Balancing Problem with Heterogeneous Fleet. Energies 2021, 14, 7406. [Google Scholar] [CrossRef]
  32. Linfati, R.; Yáñez-Concha, F.; Escobar, J.W. Mathematical Models for the Vehicle Routing Problem by Considering Balancing Load and Customer Compactness. Sustainability 2022, 14, 12937. [Google Scholar] [CrossRef]
  33. Nanthavanij, S.; Chalidabhongse, J. Ergonomics scheduling of delivery crew for the vehicle routing problem with manual materials handling. In Proceedings of the 2nd International Conference on Operations and Supply Chain Management. University of the Thai Chamber of Commerce, Bangkok, Thailand, 18–20 May 2007. [Google Scholar]
  34. National Institute for Occupational Safety and Health (NIOSH). Work Practices Guide for the Design of Manual Handling Task; Technical Report; National Institute for Occupational Safety and Health (NIOSH): Washington, DC, USA, 1981.
  35. Rattanamanee, T.; Nanthavanij, S.; Dumrongsiri, A. Multi-Workday Vehicle Routing Problem with Ergonomic Consideration of Physical Workload. Int. J. Adv. Manuf. Technol. 2015, 76, 2015–2026. [Google Scholar] [CrossRef]
  36. Halvorsen-Weare, E.E.; Savelsbergh, M.W.P. The Bi-Objective Mixed Capacitated General Routing Problem with Different Route Balance Criteria. Eur. J. Oper. Res. 2016, 251, 451–465. [Google Scholar] [CrossRef]
  37. Bortolini, M.; Faccio, M.; Gamberi, M.; Pilati, F. Multi-Objective Design of Multi-Modal Fresh Food Distribution Networks. Int. J. Logist. Syst. Manag. 2016, 24, 155. [Google Scholar] [CrossRef]
  38. Islam, M.Z.; Wahab, N.I.A.; Veerasamy, V.; Hizam, H.; Mailah, N.F.; Guerrero, J.M.; Mohd Nasir, M.N. A Harris Hawks Optimization Based Single- and Multi-Objective Optimal Power Flow Considering Environmental Emission. Sustainability 2020, 12, 5248. [Google Scholar] [CrossRef]
  39. Cui, W.; Lu, B. A Bi-Objective Approach to Minimize Makespan and Energy Consumption in Flow Shops with Peak Demand Constraint. Sustainability 2020, 12, 4110. [Google Scholar] [CrossRef]
  40. Mayer, M.J.; Szilágyi, A.; Gróf, G. Environmental and Economic Multi-Objective Optimization of a Household Level Hybrid Renewable Energy System by Genetic Algorithm. Appl. Energy 2020, 269, 115058. [Google Scholar] [CrossRef]
  41. Matl, P.; Hartl, R.F.; Vidal, T. Leveraging Single-objective Heuristics to Solve Biobjective Problems: Heuristic Box Splitting and Its Application to Vehicle Routing. Networks 2019, 73, 382–400. [Google Scholar] [CrossRef]
  42. Chobar, A.P.; Adibi, M.A.; Kazemi, A. Multi-Objective Hub-Spoke Network Design of Perishable Tourism Products Using Combination Machine Learning and Meta-Heuristic Algorithms. Environ. Dev. Sustain. 2022, 1–28. [Google Scholar] [CrossRef]
  43. Sathiya, V.; Chinnadurai, M.; Ramabalan, S.; Appolloni, A. Mobile Robots and Evolutionary Optimization Algorithms for Green Supply Chain Management in a Used-Car Resale Company. Environ. Dev. Sustain. 2021, 23, 9110–9138. [Google Scholar] [CrossRef]
  44. Guan, Y.; Chu, Y.; Lv, M.; Li, S.; Li, H.; Dong, S.; Su, Y. Application of Strength Pareto Evolutionary Algorithm II in Multi-Objective Water Supply Optimization Model Design for Mountainous Complex Terrain. Sustainability 2023, 15, 12091. [Google Scholar] [CrossRef]
  45. Kaur, M.; Kumar, V.; Yadav, V.; Singh, D.; Kumar, N.; Das, N.N. Metaheuristic-Based Deep COVID-19 Screening Model from Chest X-Ray Images. J. Healthc. Eng. 2021, 2021, 8829829. [Google Scholar] [CrossRef] [PubMed]
  46. Sekkal, N.; Belkaid, F. A Multi-Objective Simulated Annealing to Solve an Identical Parallel Machine Scheduling Problem with Deterioration Effect and Resources Consumption Constraints. J. Comb. Optim. 2020, 40, 660–696. [Google Scholar] [CrossRef]
  47. Holden, J.; Van Til, H.; Wood, E.; Zhu, L.; Gonder, J.; Shirk, M. Trip Energy Estimation Methodology and Model Based on Real-World Driving Data for Green-Routing Applications. Transp. Res. Rec. J. Transp. Res. Board 2018, 2672, 41–48. [Google Scholar] [CrossRef]
  48. Martnes, J.J.; Bere, E. Physical Activity When Riding an Electric-Assisted Bicycle with and without Cargo. Front. Sports Act. Living 2023, 5, 1179043. [Google Scholar] [CrossRef] [PubMed]
  49. Iqbal, M.; Tadjuddin, M.; Hasanuddin, I. Mathematical Models to Determine the Metabolic Energy Consumption of Stoop and Squat Lifting. In Proceedings of the 2nd International Conference on Natural and Environmental Sciences (ICONES), Banda Aceh, Indonesia, 9–11 September 2014; ISSN 2407-2389. [Google Scholar]
  50. Sankararao, B.; Yoo, C.K. Development of a Robust Multiobjective Simulated Annealing Algorithm for Solving Multiobjective Optimization Problems. Ind. Eng. Chem. Res. 2011, 50, 6728–6742. [Google Scholar] [CrossRef]
Figure 1. Representation of a possible instance of the proposed CVRP.
Sustainability 16 01810 g001
Figure 2. Graphical representation of the road gradient calculation based on the height profile.
Sustainability 16 01810 g002
Figure 3. Flowchart of the MOSA metaheuristic algorithm with adaptive features.
Sustainability 16 01810 g003
Figure 4. LS operators implemented in the proposed MOSA: (a) relocation; (b) swap; (c) replacement; (d) 2-opt.
Sustainability 16 01810 g004
Figure 5. Different customer locations in the instances of Group L: urban distribution on the left and regional (up) and mountain (down) distributions on the right.
Sustainability 16 01810 g005
Figure 6. Scheme of the developed software architecture from the input data management to the output file generation.
Sustainability 16 01810 g006
Figure 7. Method “get_distance_travel_time”.
Sustainability 16 01810 g007
Figure 8. Method “get_heigth_profile”.
Sustainability 16 01810 g008
Figure 9. Bidimensional representation of the 3D Pareto front of Instance L2: representation with the environmental (a), economic (b), and social (c) objective function defined through a color bar.
Sustainability 16 01810 g009
Figure 10. Map visualization of the drivers’ paths in the social AP of Instance L2.
Sustainability 16 01810 g010
Figure 11. Differences between the social and the economic APs of Instance L2: (a) n° of customers visited by each driver; (b) distance traveled by each vehicle; (c) metabolic energy consumption rate of each driver.
Sustainability 16 01810 g011
Figure 12. Environmental objective function and total distance traveled in the 3 instances of Group L.
Sustainability 16 01810 g012
Figure 13. Map visualization and corresponding height profile of the same driver route of Instance L2: (a) environmental AP; (b) social AP.
Sustainability 16 01810 g013
Figure 14. Social objective function and average travel time in the three instances of Group P.
Sustainability 16 01810 g014
Figure 15. Percentage of distance traveled empty by each vehicle for Instances P1 and P3.
Sustainability 16 01810 g015
Figure 16. Adaptive choice of the 4 LS operators of the developed metaheuristic algorithm for Instance L3.
Sustainability 16 01810 g016
Table 1. List of parameters and variables of the proposed multi-objective CVRP.
ParameterDescriptionUnits of Measure
N = 0, …, nSet of nodes, including depot {0}
A = 1, …, aSet of arcs
sIndex for the links that compose an arc
KFleet size (and n° of drivers)
i,jIndices which represent the nodes
zIndex which represent the sampled points within an arc
kIndex which represents a specific vehicle (and its corresponding driver)
dijDistance of arc (i,j)km
tijTravel time of arc (i,j)h
vijAverage speed of arc (i,j)km/h
εijEmission factor of arc (i,j)gCO2/km
ψActualization coefficient for the emission factor
lConstant length of each link skm
rgsRoad gradient of the link s%
elzElevation a.s.l. of the point zm
fsRoad-gradient correction parameter for link s
wiDemand weight of the order placed by customer ikg
voliDemand volume of the order placed by customer im3
niNumber of items ordered by customer iitems
wsiAverage weight of the customer i single itemkg/item
WWeight capacity of the vehiclekg
VVolume capacity of the vehiclem3
cfHourly cost for fleet rentalEUR/h
copHourly cost of the operatorEUR/h
cvCost of fuelEUR/L
γFuel consumption rateL/km
TTotal working periodh
tserService time to deliver the order to the customer door, once the vehicle already reached the customer addressh
ECkWorking energy capacity of driver kKcal/day
BWkMass of driver kkg
δEnergy unit expenditure to driveKcal/kg·h
edkMetabolic energy consumed by driver k in drivingKcal/day
elikMetabolic energy consumed by driver k to load/unload the items of the order placed by customer iKcal/day
βk, βkCoefficients related to the personal features of the driver k, as age and gender
α′, …, α′′′′General coefficients to compute the energy consumption due to lifting activities
VariableDescriptionUnits of Measure
xijk1 if vehicle k travels arc (i,j); 0 otherwise
yik1 if vehicle k visits node i; 0 otherwise
EkEnergy consumption rate%
Table 2. Instances of group P and the values of weight, dimensions, and number of items for each of them.
InstanceProduct TypeAverage Single Weight per Item [kg]Average Single Volume per Item [m3]ni [unit]
P1Books and electronic devicesNormally distributed between 0.6 and 1.57.06 × 10−4Normally distributed between 1 and 10
P2Fruit and vegetable boxesNormally distributed between 4 and 74.80 × 10⁻²Normally distributed between 1 and 4
P3FurnitureNormally distributed between 18 and 25Normally distributed between 1.12 × 10⁻¹ and 5.99 × 10⁻¹¹
Table 3. Instances of Group L, which are characterized by the same type of product ordered but different customer locations.
InstanceCustomers Locations
L1Trento city
L2Trentino’s most populated cities
L3Trentino’s most remote areas, like mountains and valleys
Table 4. Value of the objective functions for each anchor point of Instance L2.
APFeco [EUR/ord]Fenv [kgCO2/day]Fsoc [%]
Economic9.57144.830.59
Environmental9.60144.530.98
Social10.91181.122.28
Table 5. Scheduling of driver #5 in the social AP of Instance L2.
Driver IDN° Visited CustomersDistance Traveled [km/day]Time Spent at Work [h/day]Total Weight Lifted in Loading/Unloading Activities [kg/day]% of Metabolic Energy SpentCustomer Address
#56157.293.228621.211. Via Adamello, 16, 38086 Madonna di Campiglio TN (Italy)
2. Via Vallesinella, 19, 38086 Madonna di Campiglio TN (Italy)
3. Viale Marconi, 15, 38086 Pinzolo TN (Italy)
4. Frazione Godenzo, 38077 Comano Terme TN (Italy)
5. Via per Belvedere, 2, 38123 Ravina TN (Italy)
6. Via Stella, 9/1, 38123 Ravina TN (Italy)
11. Via Bolghera, 34, 38122 Trento TN (Italy)
12. Via G. G. Tovazzi, 1, 38060 Volano TN (Italy)
Table 6. Summary of general KPIs of the tested instances.
InstanceEconomic APEnvironmental APSocial AP
N° Veh.TOT Dist.AVG Dist.N° Veh.TOT Dist.AVG Dist.N° Veh.TOT Dist.AVG Dist.
P13114.5038.173122.0240.673116.2738.76
P23118.3839.463118.1139.373118.0139.34
P310233.5023.3510235.5023.5510236.0023.60
L13118.3839.463118.1139.373118.0139.34
L27815.25116.467818.86116.9871036.29148.04
L39977.35108.599977.35108.5991196.76132.97
Disclaimer/Publisher’s Note: The statements, opinions and data contained in all publications are solely those of the individual author(s) and contributor(s) and not of MDPI and/or the editor(s). MDPI and/or the editor(s) disclaim responsibility for any injury to people or property resulting from any ideas, methods, instructions or products referred to in the content.

