Article

Drivers of Tree Canopy Loss in a Mid-Sized Growing City: Case Study in Portland, OR (USA)

1
Toulan School of Urban Studies and Planning, Portland State University, Portland, OR 97201, USA
2
Department of Geography, Portland State University, Portland, OR 97201, USA
3
Institute for Sustainable Solutions, Portland State University, Portland, OR 97201, USA
*
Author to whom correspondence should be addressed.
Sustainability 2024, 16(5), 1803; https://doi.org/10.3390/su16051803
Submission received: 2 December 2023 / Revised: 7 February 2024 / Accepted: 16 February 2024 / Published: 22 February 2024
(This article belongs to the Section Sustainable Urban and Rural Development)

Abstract

:
The benefits of the urban tree and tree canopy (UTC) are increasingly crucial in addressing urban sustainability. Yet, increasingly evident from earlier research is the distributional inequities of UTC and active efforts to expand tree plantings. Less is known about the dynamics of UTC loss over time and location. This study aims to understand the dynamics of UTC change, especially canopy loss, and to investigate the drivers of the loss. This study draws on a high–resolution dataset of an urban canopy in Portland, Oregon, USA, assessing changes in UTC from 2014 to 2020. By integrating demographic, biophysical, and policy data with UTC information, we use a spatial autoregressive model to identify the drivers of UTC loss. The results reveal an unexpected spatial distribution of UTC change: less gain in the neighborhoods with the least UTC, and greater loss in the neighborhoods with moderate UTC. This study identifies four primary drivers of UTC loss: socioeconomic characteristics, urban form, activities on trees, and residential status. Factors such as population density, race, and income have an impact on canopy loss, as well as the building footprint and the number of multifamily housing units; residential statuses, such as the proportion of owner-occupied housing and residential stability, impact canopy loss.

1. Introduction

The significance and benefits of urban trees and tree canopy on urban sustainability have been deeply investigated for over two decades. Through various economic, ecological, and social benefits, urban trees promote sustainability in urban areas. For example, urban tree canopy (UTC) enhances human health through various economic, social, and environmental benefits [1,2]. It also contributes to increased property values [3,4,5,6,7], creating a valuable community resource [1,8] and promoting safety [9,10]. Furthermore, it enhances the well-being of the community [11] and can be an essential asset during crises such as a pandemic [12]. Collectively referred to as ecosystem services and ecological resources, urban trees and their canopies play a crucial role in purifying air and water, sequestering carbon, reducing energy consumption, mitigating urban heat, and capturing stormwater [13,14,15,16,17,18]. With the increasing frequency and intensity of climate-induced stressors, such as heat waves, flooding, and climate grief, UTC provides a cost-effective solution as a frontline defense for improving the quality of the environment, which directly contributes to the sustainability of cities and their residents [19,20,21].
In response, federal and local government officials are developing plans to rapidly expand the tree canopy. For example, in 2022, the United States Federal government passed the Inflation Reduction Act, aimed at providing urban forestry organizations with an additional USD 1.5 billion in resources to expand urban tree canopy [22], particularly in historically disadvantaged neighborhoods. The current investments in urban forestry aim to address past and present planning practices—such as redlining, exclusionary zoning, and racial covenants—that have created existing inequities in UTC [23,24,25]. Locally, many cities have established tree planting and tree canopy goals and have implemented tree programs to emphasize tree planting in historically disinvested neighborhoods. These programs include initiatives such as the ‘Tree for Neighborhood program (Seattle)’, ‘90,000 tree program (Las Angeles)’, ‘20 Million Trees program (New York)’, ‘Planting a more Equitable Urban Forest (Portland)’, and other similar programs. In addition, such programs are often accompanied by changes in urban forest management plans that include delineating planting priorities, making amendments to local ‘tree code’, and implementing protective measures to ensure that existing trees remain in place [26].
While many of these programs aim to expand and preserve UTC, recent findings suggest that trees and tree canopy are declining in urban areas across the U.S. [13,27], and that this trend is not limited to the U.S. [28]. For instance, Nowak and Greenfield (2018) found that UTC has declined over time (2009–2014) by a rate of about 175,000 acres per year, which corresponds to approximately 36 million trees per year. Across individual cities, research indicates a decades-long loss of UTC and that the persistence of UTC is greatly influenced by homeownership, income, and the educational attainment of city neighborhoods. Others argue that the loss of existing trees outpaces planting efforts [13]. However, some suggest that these losses can be mitigated through strategic and effective urban forestry management policies, along with maintaining the UTC [15,29,30]. Nevertheless, existing studies primarily describe overall loss, with few providing a comprehensive link between the loss of UTC and specific sociodemographic, land use, and planning and development policies that explain the multi-faceted reasons for these losses.
Extensive studies on UTC have focused on the distribution of UTC and its implications. Research has shown that UTC is disproportionately distributed both geographically and socioeconomically, raising concerns about geographical and social equity [31]. This body of work reveals that communities of color and lower-income communities tend to have less tree cover and accessibility to UTC [32,33]. Consequently, UTC distribution is directly associated with issues of social equity, environmental justice, and past practices that have led to disinvestment in specific areas of cities [23,34,35,36]. Not only do low-socioeconomic groups have less UTC and limited access to it, but they also miss out on the benefits of UTC in neighborhoods with larger proportions of white and wealthy populations. While the spatial and socioeconomic distribution of UTC has been underscored, limited attention has been given to the process of UTC change that contributes to this unequal distribution. Comprehension of the process of UTC distribution can provide an understanding of the structural factors that amplify these inequities [35].
In terms of UTC change, socioeconomic variables have been highlighted as an important factor [37]. For instance, demographic characteristics, such as population and income, have been identified as influential in UTC change [38,39]. Chaung et al. (2017) found that stable-wealthy communities, with no significant income change, were more likely to exhibit greater and more consistent tree canopy. Additionally, higher-income communities tended to boast greater tree canopies and experience less loss of canopy over time [32,38]. Moreover, using geospatial assessments, Locke et al. (2017) observed that communities with a low income and non-white families with children tend to have the lowest tree canopy, and that they are also experiencing more canopy loss. A recent study showed that neighborhoods with higher homeownership, greater income, and higher education attainment have a higher probability of having stable tree canopy [37]. But, still, they found that similar land cover change implies the same socioeconomic condition of the community. Also, Healy et al. (2022) found that, in two industrial cities, more UTC loss occurred during economic prosperity while UTC had increased during an economic depression period [40]. So, the relationship between demographic characteristics, socioeconomic conditions, and canopy cover remains uncertain, and some studies report mixed results regarding this relationship [39] on a national scale. This suggests a need to consider other local conditions that explain UTC change.
Scholars argue that urban expansion converts agricultural and forest lands into developed areas by reducing UTC [41]. In some cases, the expansion of low-density residential land reduces tree cover [42]. Other than expanding urban areas, redevelopment and infill development can further drive changes in canopy loss [29,43,44,45]. The demolition of existing urban development, and redevelopment into larger buildings, often results in the removal of trees on individual properties [45]. Even though these studies identify the different development activities that result in UTC change, there is still a limited understanding of the combination of factors driving UTC change, including demography, development, policy, and planning.
Needed are studies that simultaneously describe changes in UTC and elucidate the factors contributing to these changes. Studies relying on a single point in time for assessing tree canopy can overlook the process of tree canopy variation [29,39,41], specifically the planning and policy factors that drive loss. This oversight can lead to a policy response that pushes more trees into tree-deficient areas—potentially increasing the already existing distrust of government programs and leading to a lack of involvement with residents [46]—rather than identifying the structural elements of the development code and other factors that can help to slow the loss of UTC. These may include strategies such as reducing residential turnover [38,43], developing planning instruments [13], and providing a spatial context of UTC, especially where canopy loss is occurring.
To address this gap, by focusing on the UTC loss side, we propose an integrated approach that entails a simultaneous examination of the location of loss, the factors that contribute to those losses, and the potential implications for the development of policies aimed at preserving UTC. Recently, Locke et al. (2023) investigated the UTC change in a mid-sized US city by integrating socioeconomic variables; while the authors highlighted the significance of preserving existing UTC, they did not delve into the structural elements that enable the preservation of UTC. Only through directly understanding the primary co-determinants driving UTC loss can planners more effectively and proactively develop urban forestry policies aimed at safeguarding against the loss and improving the preservation of urban trees.
Here, we examine the changes in UTC by identifying the planning, policy, and community-based factors that help to explain UTC in a case study city of Portland, OR (U.S.). We ask two research questions: (1) Which areas in the study region experience the greatest gains and losses of UTC? (2) What social and institutional factors contribute to the loss of UTC? These questions are addressed through assessing highly resolved geospatial tree canopy data from 2014 and 2020 in the study area. We employ a multivariate spatial regression model incorporating sociodemographic and planning policy predictors of UTC change, as well as a spatial error model to identify statistically significant clusters of changes to tree canopy. To provide context, we begin by discussing our current understanding of changes in UTC and the factors impacting the changes.

2. Materials and Methods

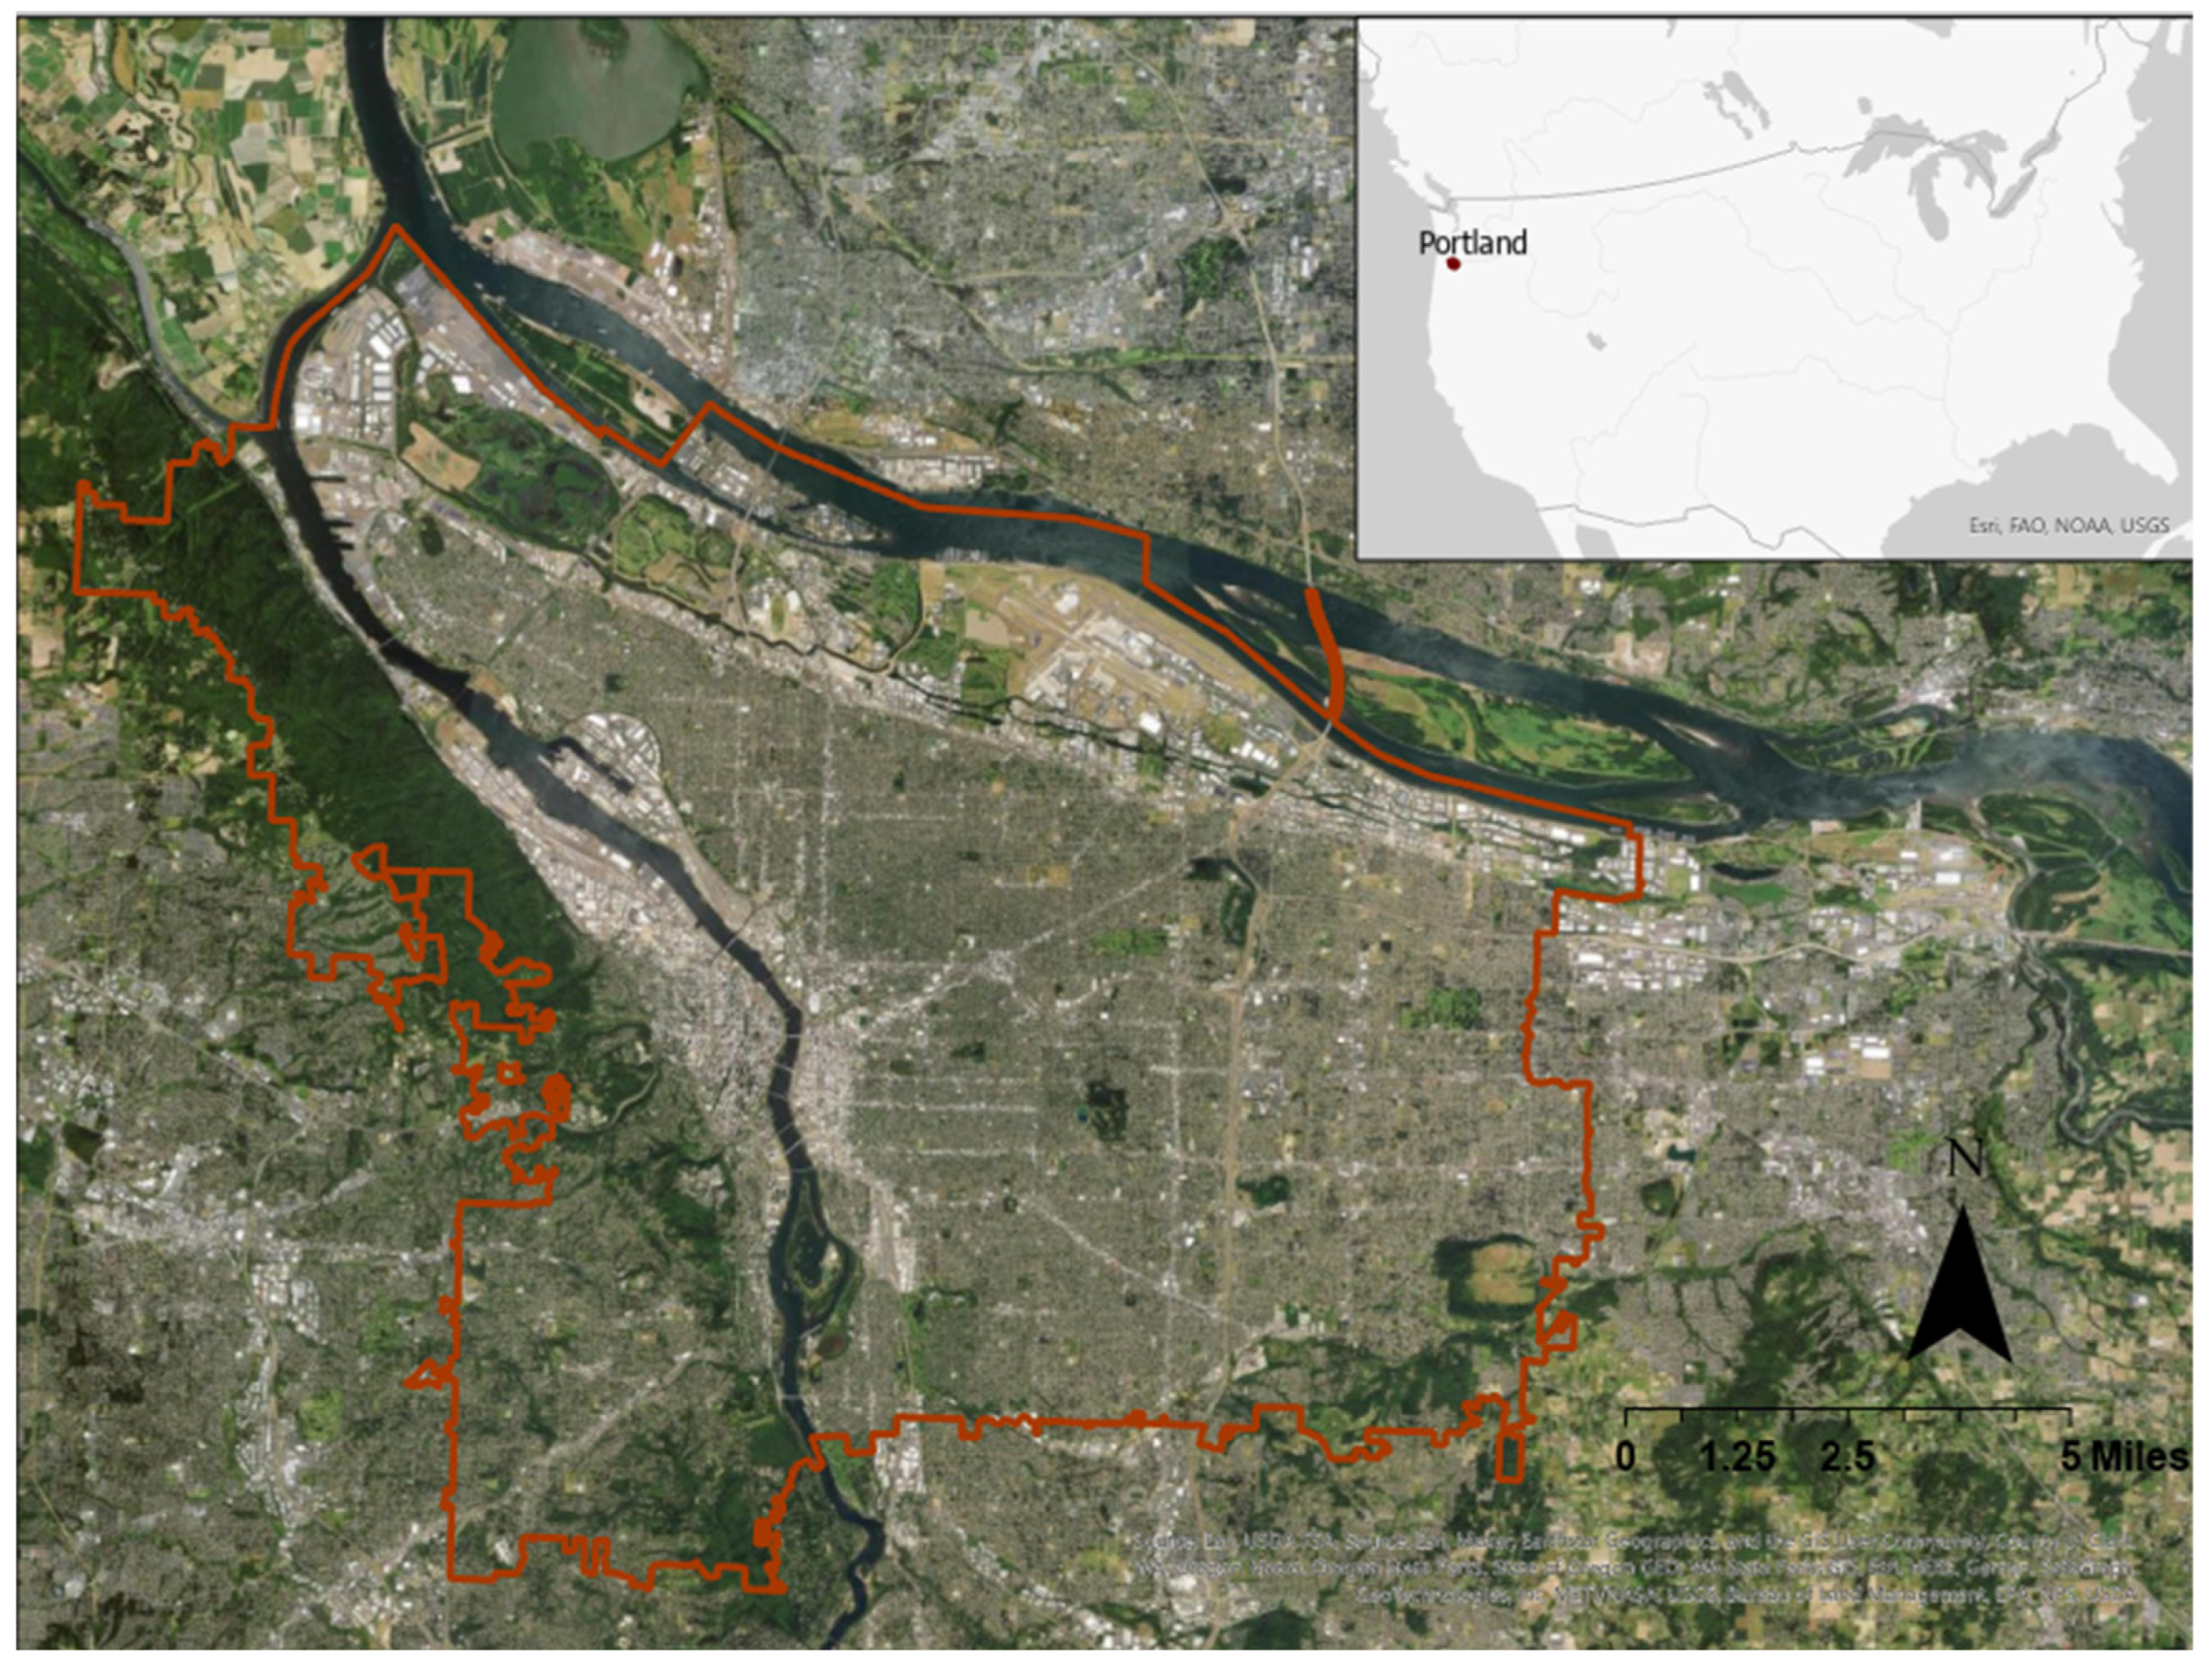
2.1. Study Area: City of Portland, Oregon

Our case study focuses on the City of Portland, a mid-sized city in the United States (population of 652,503, U.S. Census 2020), and the largest city in the state of Oregon (Figure 1). The city is located at the confluence of the Willamette and Columbia river, approximately 45.5° North, 122.6° West. The city is in the warm-summer Mediterranean climate, with a rainy winter and warm and dry summer, although the summer temperature increases with frequent hotter days [47]. Recently, the mean August temperature has been constantly increasing: 71.1° F (2020), 72.5° F (2021), 75.1° F (2022), and 75.4° F (2023) [48].
This selection offers several advantages for understanding the drivers and implications of canopy change, including a diverse range of income and demographics [49]. The distribution of population and income showed disparity (Figure 2). In particular, eastern Portland has a low income compared to its population density. East Portland has been known for a higher poverty rate and a greater proportion of people of color [50]. In terms of zoning, more than half of the City land is zoned as residential (51.9%), followed by industrial (23.2%), open space (18.1%), and commercial (6.7%) [51]. Additionally, the city actively manages its tree canopy and has set a goal to increase UTC to 33% by 2035 [49], which represents a 3% increase from current estimates. However, it is important to note that these estimates vary by location within the city and the existing land uses. For instance, commercial areas have a canopy cover of 13%, industrial areas have 8.7%, open spaces have 54.2%, and residential areas have 32.9% [51].
Portland also has existing programs and policies in place to plant new trees and manage existing ones, which are coordinated across various city bureaus. Currently, the Bureau of Parks and Recreation is the administrator of the forestry planning efforts, and oversees the implementation of a tree code known as “Title 11 Trees”, which provides a direct mechanism to “protect the health, safety, and general welfare of the citizens of Portland” by “enhancing the quality of the urban forest and optimizing the benefits that trees provide”. The tree code encourages both the planting of new trees and the management and maintenance of existing trees and tree canopies in the city. Another City bureau, Environmental Services, offers a ‘TreeBate’ program that offers credits for residential stormwater costs to residents who purchase and plant trees. Through various programs, the City also provides free trees for various types of properties, including residential, streets, multifamily, commercial, and industrial.

2.2. Data and Variables

To understand the dynamics of changes in UTC, we divided the city into geographic units consisting of census block groups (CBGs), a consistent unit provided by the Federal U.S. Census Bureau (2020). The CBG allows for the integration of all relevant variables, which can then be normalized by area. We used the acre as a normalization unit, which is 4047 square meters, for consistency. Normalizing with other units, such as square meters and/or square kilometers, makes the value of variables too small or large, so we used the acre as a normalization unit. For example, population change from 2014 to 2019 was normalized by the size of the CBG, providing an indication of population change ‘density’, which is the change in the number of residents per acre. During the interpretation of the result, the “canopy density” variable was also re-stated by percentage via a conversion function. For the study period, UTC change was measured from June 2014 to June 2020 (Table 1).

2.2.1. Urban Tree Canopy

UTC change was measured by creating tree canopy data for two periods: 2014 and 2020. The method for detecting urban tree canopy was based on a previous study [31], and relied on remote sensing imagery from the U.S. Department of Agriculture’s 1 m spatial resolution aerial imagery program, known as the National Agriculture Imagery Program (NAIP). This program provides a multispectral image with four bands: blue, green, red, and infrared. The machine learning technique employed a random forest (RF) algorithm to classify areas as tree or non-tree. For this method, a total of ten band images were used for the analysis. These included four bands from NAIP imagery and six derived bands, which incorporated commonly used remote sensing indices like the Normalized Difference Vegetation Index (NDVI), Normalized Difference Water Index (NDWI), and Green Normalized Difference Vegetation Index (GNDVI). Together, these datasets and analysis allowed the trees to be distinguished from other land cover categories with a high level of accuracy [31].

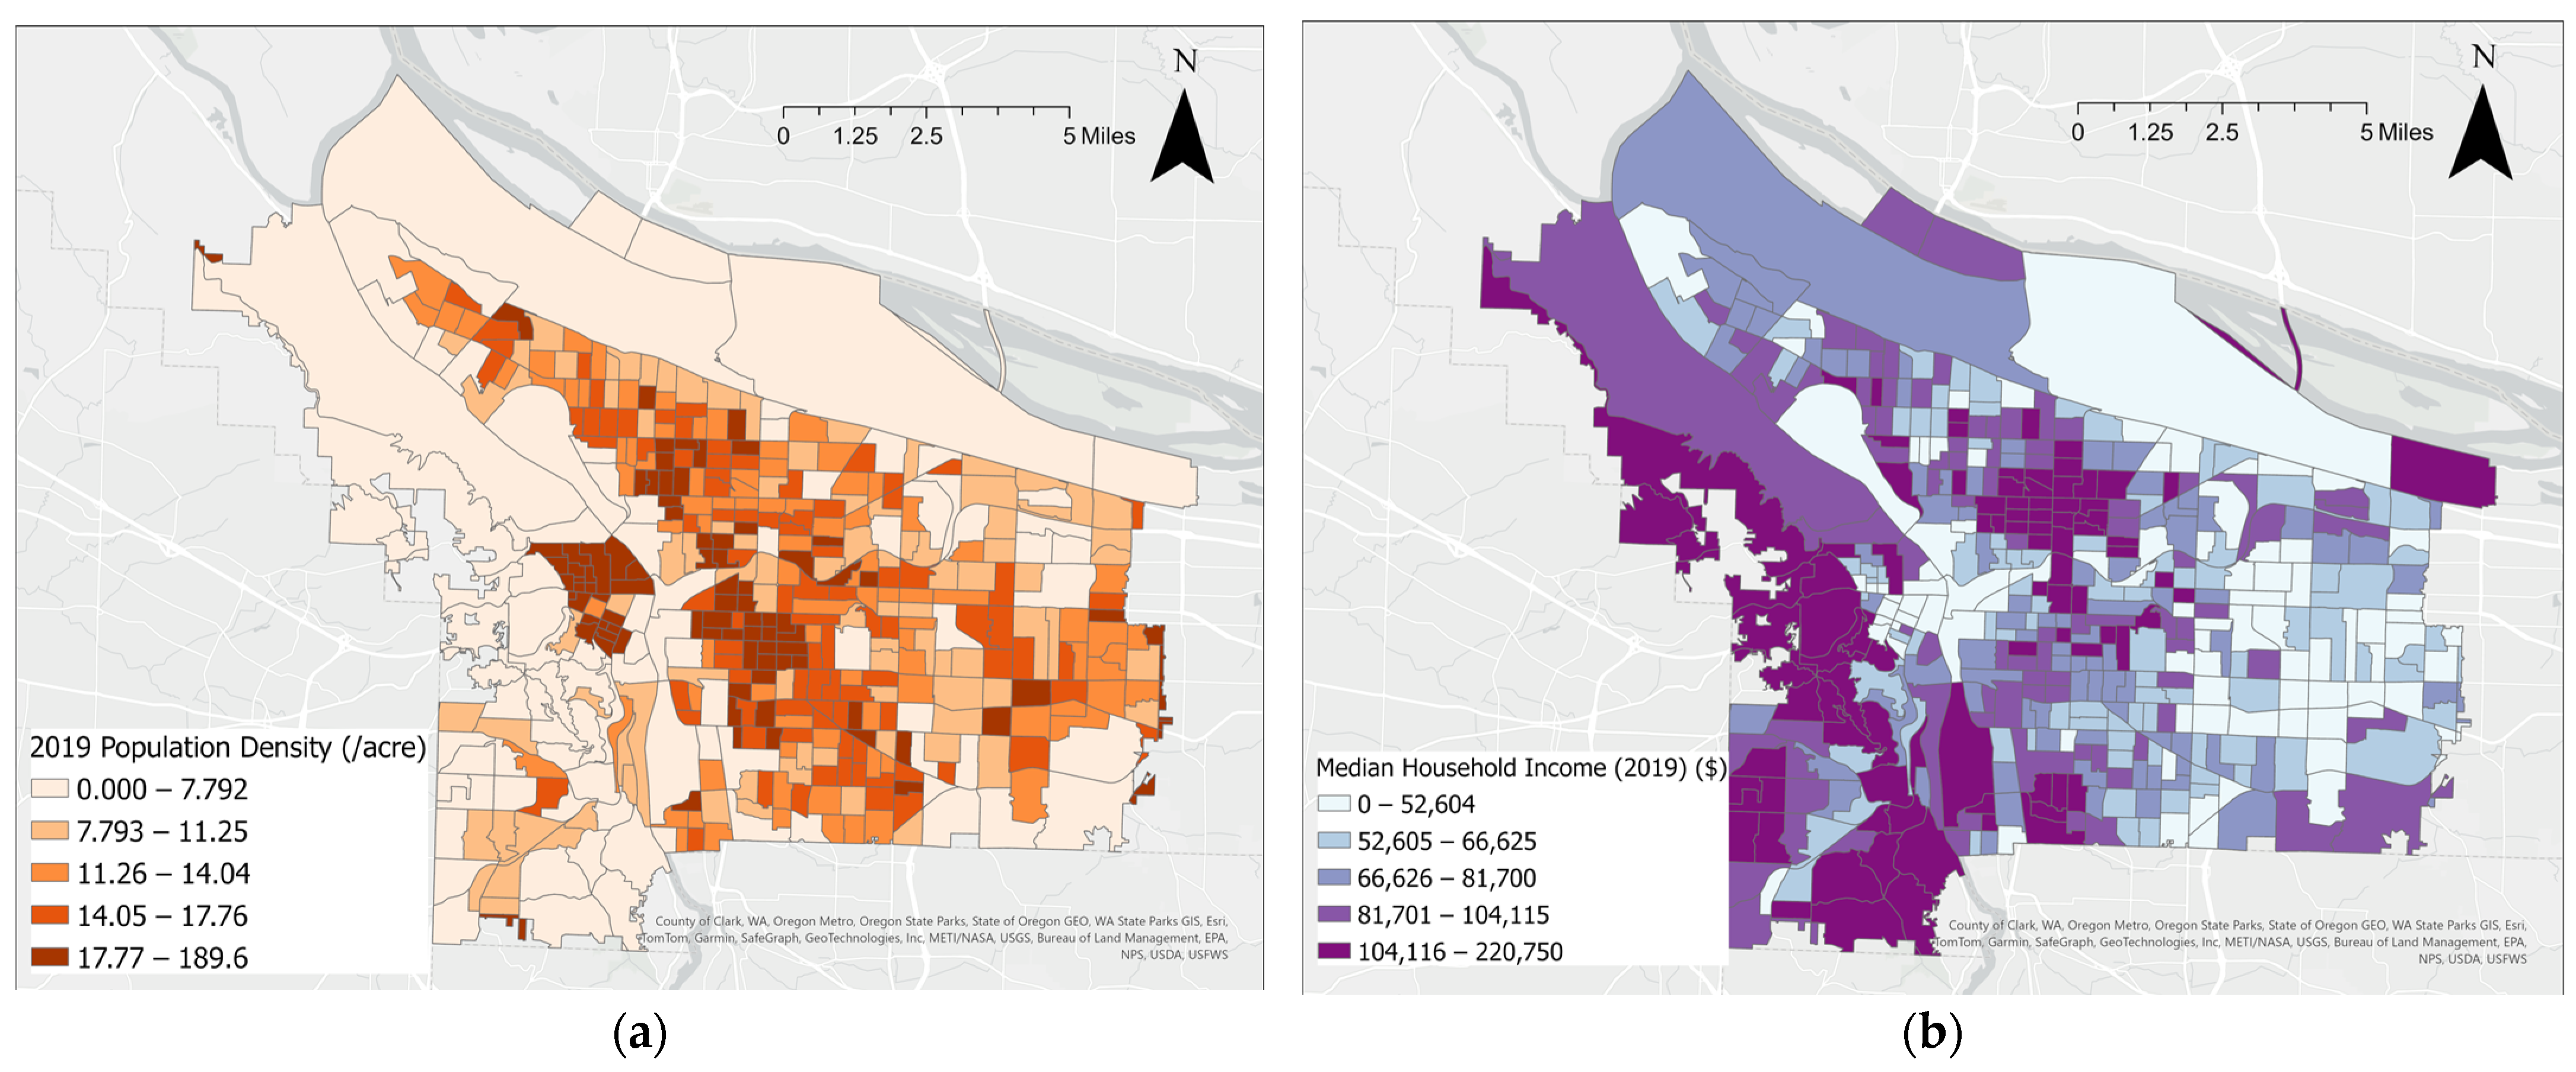
2.2.2. Demographic Data

Building on earlier studies indicating a direct correlation between certain demographic characteristics, such as population and income, and the presence of UTC, we selected specific variables already known to be associated with UTC. To ensure we captured changes over time, we also applied dynamic measures such as population growth [13]. Additionally, we selected other demographic variables, including the percentage of people of color, median household income [32,38,39] and total population (five-year estimates of American Community Service (ACS) of 2019 and 2014). Subsequently, all data were aggregated and averaged to the CBG for their respective years, which were either 2014 or 2019.

2.2.3. Development Data

Development-related variables describe the influence of housing and other land uses on tree canopy change. It is well established that development changes the physical landscape, subsequently impacting the extent of UTC [45,52]. Data pertaining to development-related variables were collected during the years 2014 and 2019. This dataset includes residential permits and residential demolitions, sourced from the ‘PortlandMaps—Opendata’ [53] direct portal and the county tax assessors’ files.
Our focus on residential properties (i.e., zoned residential and multifamily residential) is due to the fact that they tend to exhibit the highest UTC [15,54]. Moreover, different levels of development density are known to impact UTC [45]. In this study, we considered two types of density: horizontal density and vertical density. While studies tend to focus solely on overall development density—measured as the number of residential units per unit area—we believe that the density could be described in a more specific way. Horizontal densification is characterized using building footprint data, while vertical densification is assessed using the multifamily housing inventory. A higher building footprint density in a CBG suggests a greater number of buildings covering the land, potentially leaving less land for tree planting. Conversely, a higher multifamily housing unit density could describe a structural shift toward taller buildings, which are likely to leave areas unbuilt with an opportunity for open space and UTC. Both data sets are obtained from RLIS (Regional Land Information System), a data repository administered by the regional government, Portland Metro [55].

2.2.4. Planning

To represent tree policy, we employ data on planted and fallen trees. The information on permitted trees includes the specific latitude–longitude (e.g., point data) of both planted trees and fallen trees, which have been obtained from the city database. The records of planted and fallen trees vary by year, and to remain consistent with our analysis, we selected only those beginning in 2015 and ending in 2020. Since the points are not the exact location of trees and may have overlapping trees in one point, we applied the kernel density tool in ArcGIS to generate permitted tree density maps, with both planted and fallen trees used as sperate layers. Subsequently, these permitted tree density maps were aggregated to CBGs using the zonal statistics by table tool in ArcGIS.

2.2.5. Residential Turnover

Residential turnover variables aim to address the ownership changes in residential buildings. Similar to Locke et al. (2017), it is posited that residential ownership changes may have an impact on the dynamics of UTC loss, potentially leading to disturbances related to change-induced loss. The housing ownership ratio was obtained through ACS in the U.S. Census in two time periods: 2014 and 2019.
Another important variable in assessing residential turnover characteristics is the count of single-family housing units during the study period. Housing sales data were obtained using tax lot data from RLIS. This dataset provides information on the most recent sale date for each single-family housing unit. Consequently, we were able to extract and aggregate data for houses sold between 2014 and 2019, categorizing them by each CBG. This count was then normalized by the size of each CBG, providing the number of single-family housing units sold between 2014 and 2019 per acre.

2.3. Analysis

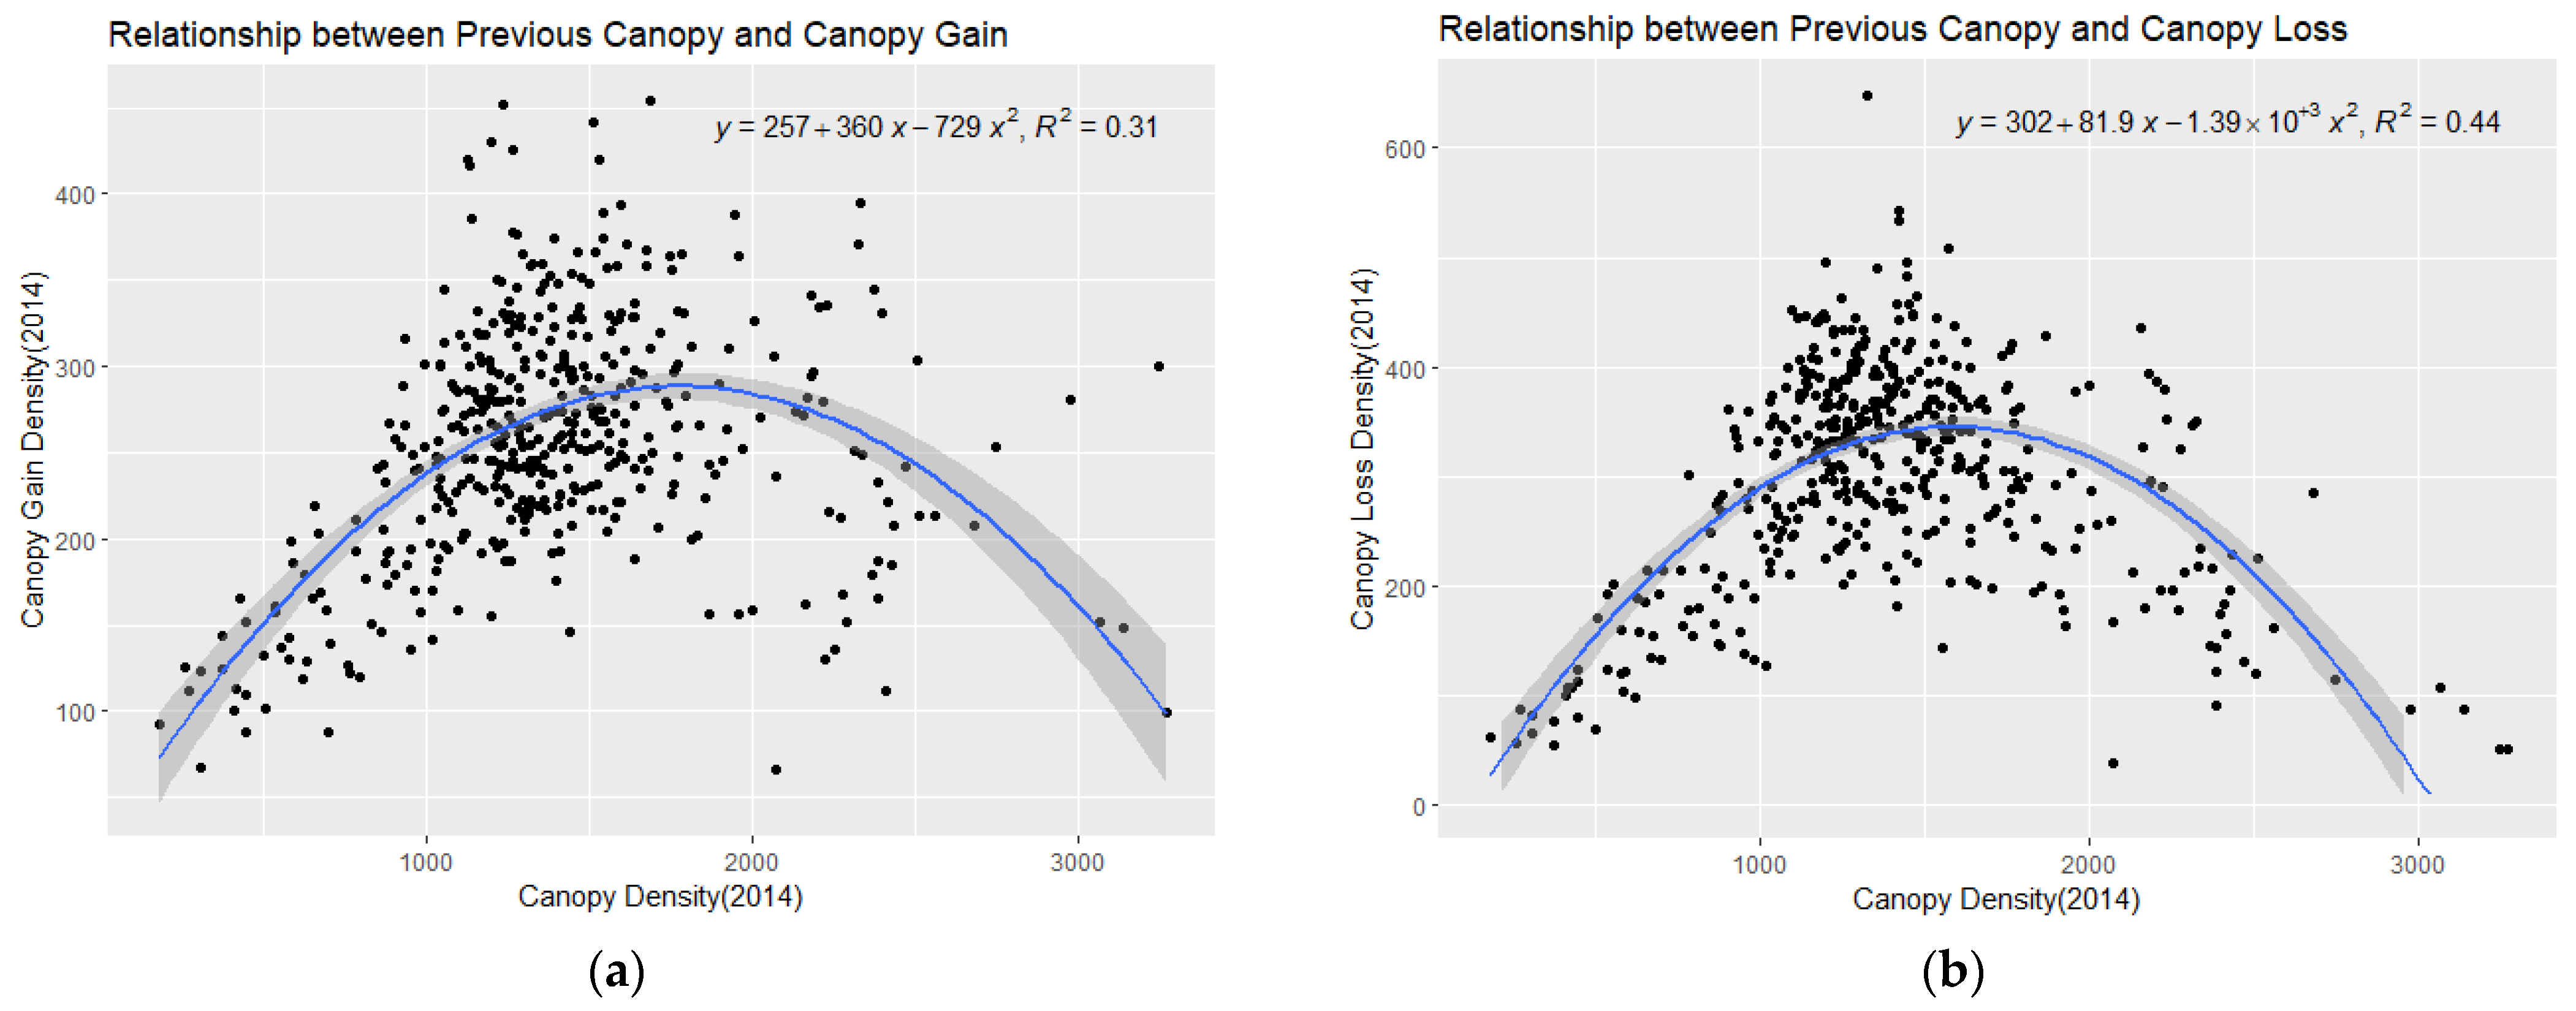
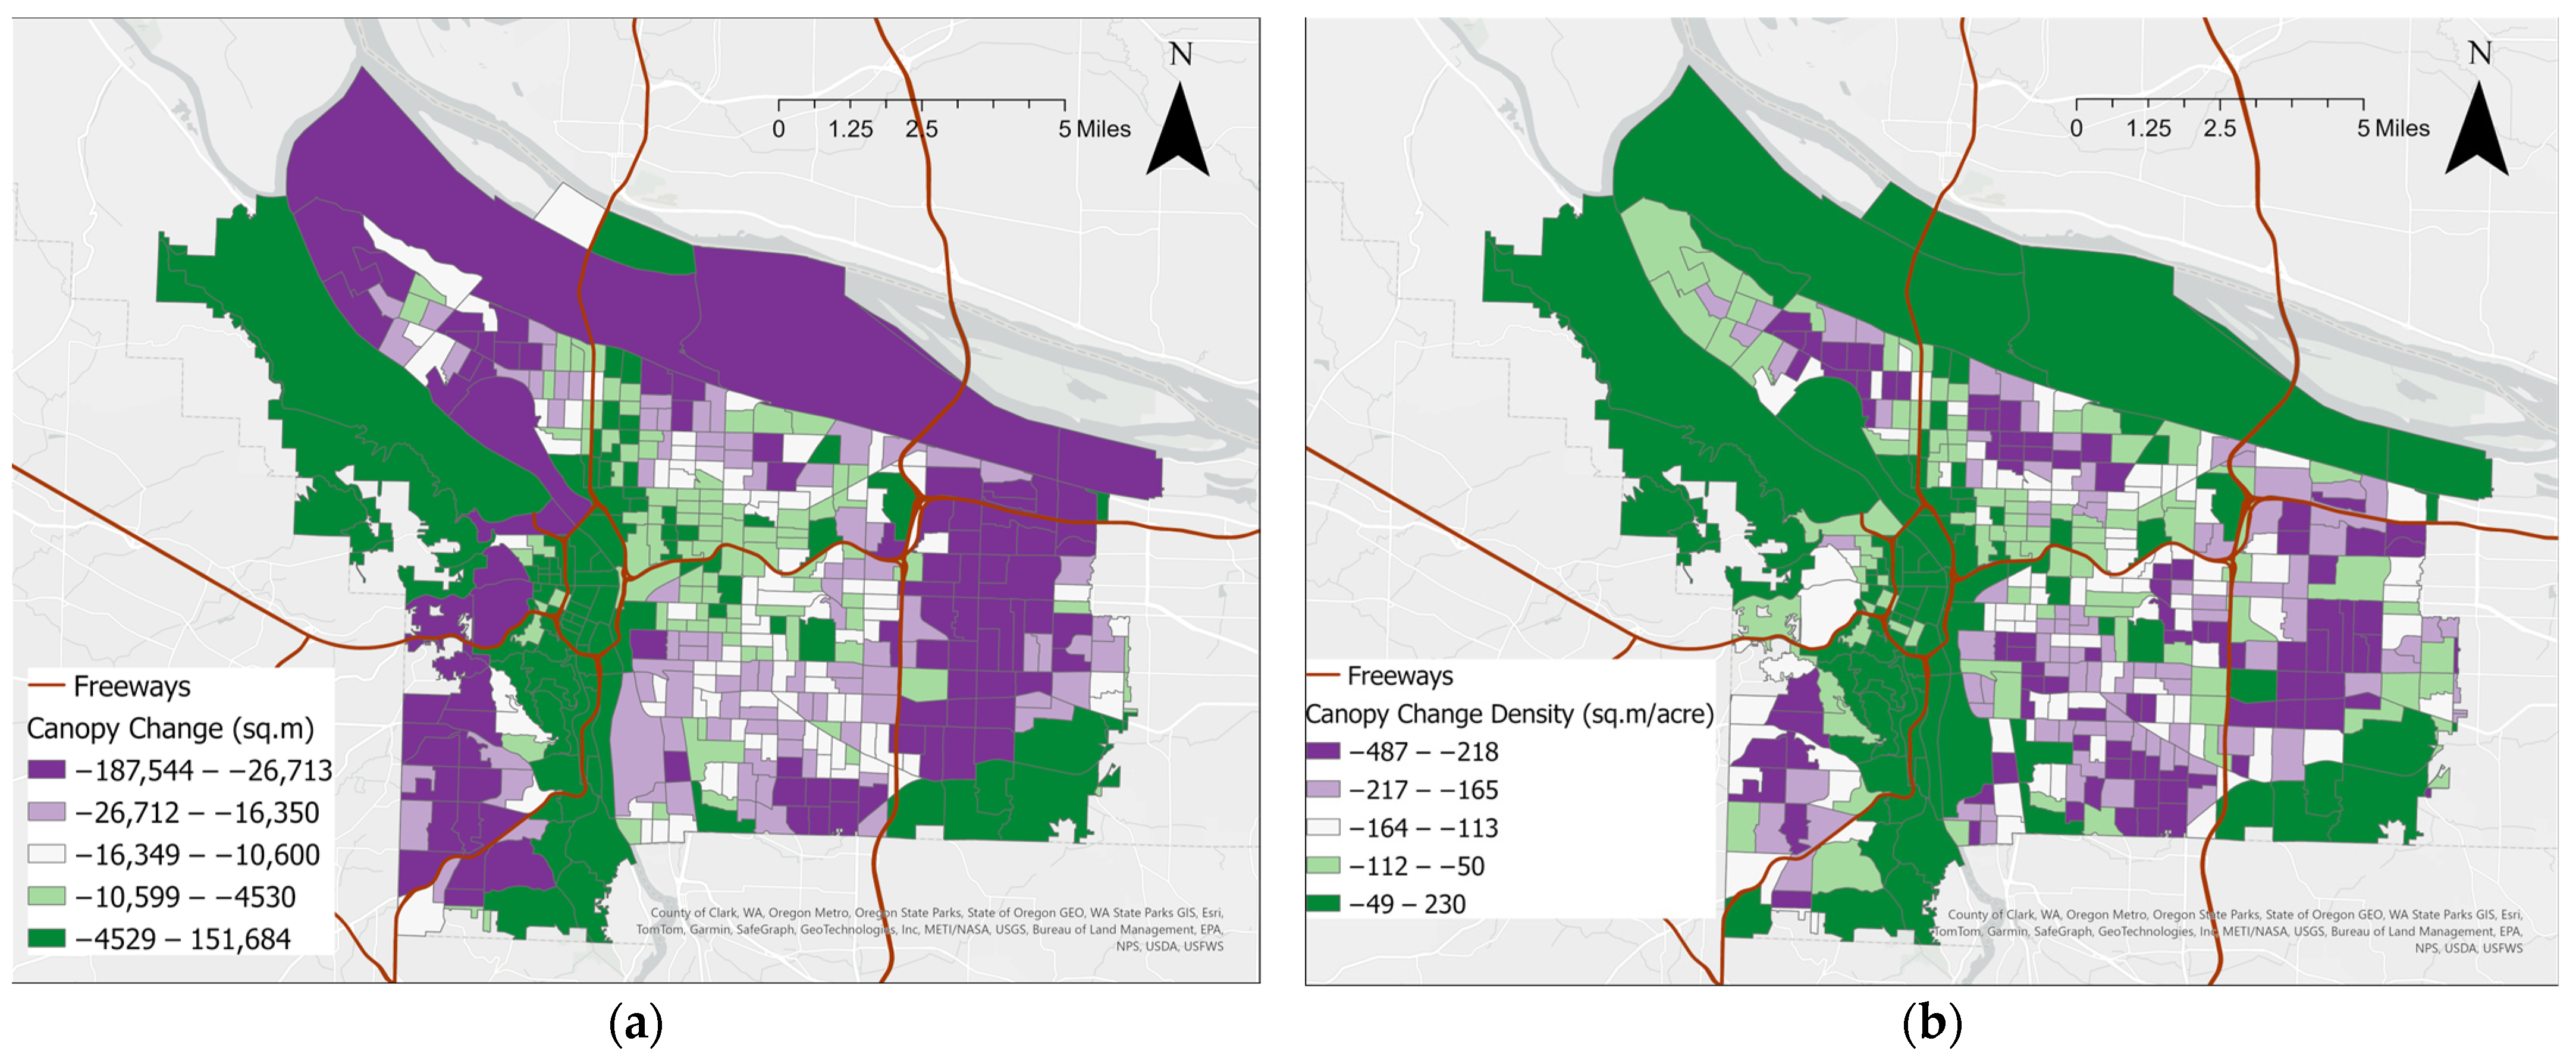
2.3.1. Urban Canopy Change Distribution

To address the research questions, we begin by quantifying the distribution of UTC change and the relationships between existing UTC and UTC change, employing a correlation analysis that included both Pearson and Polynomial methods; this was accompanied by scatter plots, which were used to visually represent the relationship between the existing canopy levels and the magnitude of gain and loss. This analysis shed light on which neighborhoods experienced gains or losses in the canopy cover based on their initial canopy level. Next, the spatial distribution of UTC change from 2014 to 2020 was mapped across the city of Portland. This was performed to describe the geographical locations of where UTC gain and loss occurred.
Subsequently, the global Moran’s I test was conducted to identify the presence of spatial autocorrelation regarding UTC change [56]. Spatial autocorrelation refers to the spatial dependency of variables, in this case, UTC change (both gain and loss). The test endeavors to determine whether there is a relationship between the UTC change in a particular location and the UTC change observed in a neighboring location [57]. Consequently, the global Moran’s I test aids in revealing the potential existence of spatial clustering of canopy change across the overall study area [58].

2.3.2. Spatial Error Model

The regression analysis focuses on the urban canopy loss, a factor that has not received significant attention in urban tree policy. With urban canopy loss as a dependent variable, this study aimed to find the key drivers behind canopy loss. Through Moran’s I test, urban canopy loss exhibits spatial autocorrelation, signifying a spatial dependency effect in the urban canopy loss. Ignoring spatial autocorrelation would result in inefficient coefficient estimates in the regression model [59].
To address this issue, this study advocates for a spatial autoregressive (SAR) model. The two models commonly employed for handling spatial autocorrelation are the spatial error model and spatial lag model [60]. The spatial lag model is better suited to accessing the existence and strength of spatial dependence, while the spatial error model is more apt for correcting the potential influence of spatial autocorrelation in the regression model [57]. Consequently, this study incorporates the spatial error model as part of the SAR model to rectify the spatial autocorrelation of the model and discover the drivers of canopy loss. The spatial autoregression analysis is conducted using the R software version 4.2.1 with the “spatialreg” package.

3. Results

3.1. Urban Canopy Change Distribution

The distribution of and change in UTC can be initially evaluated using a scatter plot and by examining the relationships between trees in 2014 and the extent of gains and losses between 2014 and 2020 (Figure 3). Each data point represents a CBG in Portland, and the unit of the value is the density measure, normalized by the size of each CBG. Given the city’s efforts to address disparities in urban UTC by extensively planting trees in low-canopy, low-income areas, the anticipated outcome was counter to the prevailing expectation: most canopy gains did not occur in the neighborhoods with the lowest initial canopy levels. In fact, the results indicate an overall decrease through 2020 in canopy loss in neighborhoods with the lowest canopy levels in 2014.
Instead, a polynomial relationship between gain and existing UTC (with an R-squared value of 0.31) demonstrated that more canopy growth was observed in neighborhoods with moderate or mid-range canopy levels. Furthermore, neighborhoods with high UTC did not experience a notable increase in UTC. Similarly, UTC loss exhibited a similar yet stronger relationship. The correlation between canopy loss and existing greenery followed a polynomial relationship, akin to a bell-shaped curve, with an R-squared value of 0.44. Interestingly, both neighborhoods with the least and most tree canopy in 2014 did not experience significant canopy loss. On the other hand, communities with moderate canopy levels (20–25%) experienced extensive canopy loss.
When comparing the two relationships, it was evident that UTC loss and previous UTC exhibited a stronger polynomial correlation compared to gain and previous UTC. Specifically, UTC gain and previous canopy demonstrated a relatively small linear correlation, with a Pearson correlation coefficient of 0.25. Conversely, UTC loss and previous canopy did not display a linear correlation. Additionally, an observation of the y-axis values on the plots revealed that UTC gain was concentrated between 200 m2/acre (0.49%) and 300 m2/acre (0.74%), while UTC loss was concentrated between 300 m2/acre (0.74%) and 400 m2/acre (0.99%). This observation provided insight into the declining UTC in Portland from 2014 to 2020, highlighting that the gain in UTC did not outweigh the loss.
In spatial terms, the distribution of canopy change was calculated as the gain minus the loss during the study period (Figure 4). The figure on the left represents the absolute UTC change in square meters for each CBG, while the figure on the right is the density measure of UTC change, which is the absolute UTC change normalized by the area of CBGs, expressed in square meters per acre. These results suggest that a majority of areas in the City of Portland experienced a net loss of UTC. Only a limited number of CBGs demonstrated a gain in UTC, while a majority saw a decrease in UTC from 2014 to 2020. Although the trend generally leans towards UTC loss, it is crucial to note that the magnitude of UTC loss varies across the city. Both maps in Figure 4 indicate that western areas of Portland did not experience a significant loss of UTC, while east Portland witnessed a more pronounced canopy loss in terms of UTC change—Dark Purple; 0.54% to 1.15% of overall canopy loss.
It is important to clarify that the primary focus of this study is canopy loss, rather than the overall canopy change (gain minus loss) within each block group. As a result, we conducted further investigations to delve into the specific pattern of canopy loss in each area. The spatial distribution of canopy loss density reveals an uneven pattern (Figure 5). The CBGs with the least canopy loss lost less than 0.62% of the tree canopy, while the CBGs that lost the most saw a 1.09% decrease in the tree canopy. Central Portland and downtown Portland exhibit less canopy loss, whereas east Portland and south Portland experience a greater loss of UTC, in absolute terms. Additionally, the global Moran’s I test indicates a spatial clustering of UTC loss in the city. This finding supports the notion that UTC loss occurs disparately, with some places experiencing more significant loss than others.

3.2. Drivers of Urban Canopy Loss; Spatial Error Model Result

This study is primarily concerned with the factors influencing canopy loss, and for this purpose, a spatial error model was selected to correct spatial autocorrelation. Before applying the error model, we conducted Lagrange multiplier tests to determine which SAR model was more suitable. The results indicated that both models exhibited statistically significant robustness. To determine the most fitting model, we compared the Akaike Information Criterion (AIC), which aids in evaluating the fit of different regression models. The model with the lowest AIC is considered the best fit. In this case, the spatial error model emerged as the most suitable for our study, as it exhibited the lowest AIC.
The model had a relatively high explanatory power, with a pseudo-R square value of 0.8001. This indicates that the model effectively explained the canopy loss density between 2014 and 2020 in the City of Portland, incorporating both explanatory and control variables. The dataset for the model consisted of 443 observations, corresponding to the CBGs. The number of CBGs was determined after excluding block groups smaller than 20 acres and those lacking data from the ACS. As indicated in Table 2, statistically significant values of Lambda and Wald statistics affirm that the spatial error model is an improvement over the OLS model. Moreover, the lower AIC suggests that the spatial error model improves the analysis, making it a superior choice compared to the OLS. It is worth noting that, apart from the median household income change and median household income (2014), all variables are based on a density measure, which is normalized by the size of each block group (per acre).
The dependent variable, urban canopy loss, is measured as square meters of canopy loss per acre. The inclusion of existing canopy data for 2014 as a control variable, despite their lack of statistical significance, is noteworthy. This suggests that CBGs with higher levels of existing canopy in 2014 do not necessarily experience more canopy loss. This observation aligns with the earlier scatter plot results depicting a bell curve relationship between the existing canopy and canopy loss density.
In terms of demographic characteristics, all five variables exhibit statistically significant p-values. The positive coefficient of population change (5.53) suggests that a higher population density leads to increased canopy loss density. More specifically, if the population in an acre within the city increases by 100 people, the CBG would lose 553 m2 UTC in an acre, which is 1.36% canopy loss. Similarly, the positive coefficient (4.62) for non-white population density in 2014 indicates that CBGs with a higher non-white population tend to experience greater canopy loss. Conversely, the negative coefficient (−3.81) for white population change implies that CBGs with decreasing white population densities also experience greater tree canopy loss. Finally, both income variables, static (−3.76 × 10⁻⁴) and dynamic (−2.08 × 10⁻⁴), exhibit statistically significant and negative coefficients, indicating an inverse relationship between income or economic status and canopy loss. The CBGs with higher median household incomes in 2014 and those with increasing median household incomes experience lesser tree canopy loss.
Among the development characteristic variables, holding a demolition permit does not demonstrate a statistically significant p-value. The residential permit data were omitted from the model due to their high correlation (0.82) with demolition permits, which introduced issues of multicollinearity. On the other hand, both building footprint change and multifamily housing unit change exhibit statistically significant p-values. An interesting observation is that two density variables, namely building footprint change (3.46 × 10⁻²) and multifamily housing unit change (−4.36), show coefficients in opposite directions. CBGs with an increase in the building footprint would experience greater canopy loss, while CBGs with an increase in multifamily housing units would experience less canopy loss. Specifically, a 1000 square foot increase in the building footprint would reduce tree canopy by 35 m2, while an increase of 10 multifamily housing units in the same acre increases tree canopy by 43.6 m2 per acre.
In terms of planning factors, residential zoning change does not yield a statistically significant p-value. However, both planted trees and fallen tree locations demonstrate statistically significant p-values. These variables exhibit positive coefficients, suggesting that CBGs with more planted tree points and more fallen trees tended to experience greater canopy loss. Unexpected is that CBGs with more planted trees tend to have more canopy loss; based on the coefficient of the analysis, CBGs that had 100 more trees planted in an acre saw 78 m2 of canopy loss, which is a 0.2% loss in CBGs. The “tree code” policy may provide insight into this result and will be elaborated upon further in the discussion section.
For the residential status characteristic, all three variables exhibit statistically significant p-values: single-family housing sale (8.19 × 101), 2014 housing owner ratio (6.64 × 101), and housing owner ratio change (4.88 × 101). The positive coefficient of single-family housing sales indicates that CBGs with more housing sales tend to have greater canopy loss; that is, 10 single-family housing sales in an acre would result in 819 m2 of UTC loss, which is a 2.02% canopy loss. Additionally, the positive coefficients of the two variables in owner-occupied housing suggest that CBGs with a higher owner-occupied housing ratio in 2014, as well as CBGs that saw and increase in the owner-occupied housing ratio from 2014 to 2019, tend to have greater canopy loss. These variables indicate that residential turnover, particularly changes in housing ownership, contribute to UTC loss.

4. Discussion

In Portland, the city has endeavored to manage and increase tree cover through tree-planting initiatives, such as the Grey to Green program (2010) and the Planting a More Equitable Urban Forest (2018) project, which have led to the planting of approximately 3000 trees annually. Despite these endeavors, reports from the City’s division of urban forestry indicate that UTC decreased from 30.7% in 2015 to 29.8% in 2020 [51]. Notably, the majority of this tree canopy loss occurred in residential areas, accounting for 523 acres [51]. Our assessment of UTC change, drawing on a different methodology, found a parallel result, indicating a small decrease (−6854 m2) in UTC in Portland from 2014 to 2020. Our results go further to describe the factors that help to explain some of the factors that contribute to these consistent patterns. Given these findings, there is a need for a comprehensive understanding of UTC change, especially in the context of canopy loss.
We posit that understanding the process of canopy change would not only be beneficial for cities with declining UTC. The distribution of UTC is generally changing for all cities undergoing development, and there is a general need for policies that help to manage the change. For example, Merry et al. (2014) studied the UTC changes in Detroit, MI, and Atlanta, GA, over time (1951–2010), and found that while the overall canopy cover in the study area remained stable, the spatial distribution of UTC changed [61]. Also, the study of canopy change is not limited to the U.S.; it is studied globally, such as in Canada [41], Australia [62], and Europe [63]. Therefore, understanding the process behind these spatial changes is an international issue, and this study could provide insight on the process of UTC change. The results of this study revealed an unforeseen spatial pattern of UTC changes between 2014 and 2020, along with four distinct drivers or indicators of canopy loss: socioeconomic factors, urban form, tree-related activities, and residential status.

4.1. Urban Canopy Change Distribution

Achieving equitable tree distribution has been a central concern for cities around the U.S. Research has shown a clear correlation between income and the uneven distribution of tree canopy across the city and county [27,46,64]. For instance, the western part of Portland enjoys 56% of the tree canopy, while the eastern side has 21% of the tree canopy [65]. When examined at the neighborhood level, the tree canopy cover varies widely from 5% to 70% [65]. This uneven distribution of trees results in communities disproportionately experiencing the benefits of the tree canopy.
Recognizing this disparity, the city has made efforts to address the barriers to tree planting in low-income communities and communities of color. Initiatives have been put in place to prioritize these areas and collaborate with community-based organizations like Friends of Trees (FOT), Verde, and The Blueprint Foundation. At the time of the writing of this paper, the City is moving forward in the revision of its 2004 Urban Forestry Management Plan, with an emphasis on collaboration and prioritizing low-income, low-canopy areas. However, since 2015, there has been a reduction in UTC, including a decrease in the number of trees planted in low-income and low-canopy neighborhoods [66]. The findings regarding canopy change distribution between 2014 and 2020 further emphasize that UTC change has not been distributed uniformly.
Despite the city’s efforts to address the uneven distribution of tree canopy, particularly in marginalized neighborhoods, the results reveal that between 2014 and 2020, UTC had not changed as intended. The neighborhoods with the least canopy experienced the lowest canopy gains, while those with moderate canopy levels saw extensive canopy loss. This dynamic could exacerbate the existing disproportionate distribution of UTC. This underscores the ongoing need to preserve UTC in low-income areas, while increase UTC in neighborhoods with low existing canopy levels. Our findings are consistent with a few other studies noting that canopy change is associated with socioeconomic status, indicating that canopy change is not distributed evenly across the space [13,38,67,68]. Also, additional efforts will be needed to protect UTC against canopy loss in neighborhoods with moderate canopy cover. Understanding the drivers of UTC loss is a crucial first step for implementing targeted policy interventions.

4.2. Demographic Characteristics

The regression analysis highlights that demographic characteristics, specifically socioeconomic indicators, are significant drivers of UTC loss. While some studies have indicated that factors such as population, race, and wealth may not consistently predict UTC change, and that the relationship can vary depending on local conditions [13], this study’s findings point to the importance of demographic factors in UTC loss dynamics.
The analysis reveals that population growth is associated with canopy loss, suggesting that cities with a growing population are more likely to face canopy reduction. This emphasizes the need for a heightened focus on preserving the existing canopy amidst urban growth. For example, establishing more stringent codes and policies that ban the removal of large-form trees in cities with rapidly increasing populations should be considered.
The socioeconomic variables align with the results of Locke et al. (2017), indicating that communities with higher income levels tend to have more initial tree canopy and experience less canopy loss over time. Conversely, areas with increasing proportions of non-white and low-income populations typically have lower initial UTC and undergo greater canopy loss. This underscores an environmental justice concern, as access to green spaces and the benefits of trees are often disproportionately distributed, predominantly benefiting wealthier and predominately white communities [69]. This study suggests that the existing inequities in UTC distribution may be exacerbated by uneven canopy loss across communities. This unequal canopy loss potentially compounds the environmental justice issue. With rising temperatures, the increasing frequency of flooding, and challenges relating to mental health, if these trends are not reversed, then communities who have less access to green spaces may face greater climate-induced burdens in the coming decades. Prioritizing policies that generally preserve UTC, first and foremost, in historically disinvested areas and those with larger proportions of non-white populations can help to reduce these inequities.

4.3. Development Characteristics

Changes in urban form, particularly density, emerge as significant drivers of canopy loss. Previous research has established a link between residential redevelopment and demolition, resulting in tree canopy loss [29,45]. However, the findings of this study indicate that residential demolition does not yield statistically significant results. This suggests that the redevelopment and demolition of residential buildings alone might not be a reliable indicator of UTC loss. Instead, it is the structural transformation of the urban environment that drives UTC change. This study identifies two distinct structural factors: building footprint, representing horizontal density, and multifamily housing units, signifying vertical density. Both building footprint changes and multifamily housing unit changes exhibit a statistically significant relationship with canopy loss.
The increase in building footprint within the CBGs corresponds to a higher degree of canopy loss. This finding aligns with previous studies indicating that urban development, such as infill greenfield development, contributes to a reduction in UTC and urban green space [29,52,70]. Moreover, a greater building footprint ratio is associated with reduced UTC [71]. This analysis underscores that an expansion in the building footprint results in diminished space for trees, ultimately leading to a decrease in UTC due to the removal of existing trees.
On the contrary, an increase in multifamily housing units—as measured by the total number of residential units in 2014 and 2019 in a CBG—is associated with a lower loss of UTC. Understanding the relationship with multifamily housing units may require more research since the process of urban densification might also lead to a reduction in urban green spaces [44]. However, it is important to note that urban densification encompasses both compact and infill development, so the study’s focus on the increase in multifamily housing units is crucial. Additionally, some studies have indicated that densification itself does not necessarily lead to a reduction in urban green spaces, but it may have a negative impact on private gardens [72]. Therefore, in concentrating on multifamily housing units and their impact on UTC, the analysis suggests that augmenting the number of multifamily housing units—specifically through more vertical development and leaving open space for the preservation and planting of trees—would result in a lesser loss of UTC. Urban forestry policies that involve land use planning considerations, such as bonuses for greater vertical density with the availability of green space, would benefit UTC, especially in low-income and low-canopy neighborhoods.

4.4. Planning Characteristic

From a planning perspective, greater activity involving trees, encompassing both planting and cutting, serves as an indicator of UTC loss. Surprisingly, this study found that residential zoning change was not a significant factor in UTC loss, which contrasts with other studies in which residential land use emerged as a significant indicator of UTC [15,42,54]. This discrepancy could stem from our utilization of “change” in residential zoning as a variable to explain UTC loss, and it is possible that five years may not be sufficient to detect the effects of such zoning alterations.
The data on planted and fallen tree points, reported and permitted by the city, reflect the activities related to trees. The positive correlation between fallen trees (permitted tree felling) and UTC loss is straightforward: communities with more tree removals experience greater canopy loss; hence, tree cutting stands as a significant driver of this loss. However, the association between planted trees and canopy loss might seem counterintuitive. The findings suggest that communities with more planted trees tend to experience greater canopy loss. This can be elucidated by the city’s endeavor to plant trees in communities facing tree loss. According to the tree policy “Title 11 Trees”, property owners who remove trees are obligated to replace them with new ones. Consequently, the positive relationship between planted trees and canopy loss can be interpreted as an effect of the tree code policy. Under this policy, even though fallen trees are replaced with new ones, the canopy cover in the neighborhood may decrease as planted trees require time to grow to provide substantial canopy cover [3,13], alongside the inherent mortality rate of young trees [73,74].
Hence, in Portland, active tree-related actions—both planting and cutting—appear to serve as indicators of UTC loss. Another critical concern regarding tree activity revolves around unreported tree cuts that have not been permitted by the city. As individuals are required to either replace a felled tree or pay a fine, there exists the potential for unreported tree cuts, potentially resulting in greater canopy loss in the community as they are not adequately replaced. Therefore, a comprehensive tree monitoring system, encompassing both the growth of planted trees and the oversight of unreported tree cuts, is imperative for effective tree management and preservation.

4.5. Residential Characteristics

Lastly, the significant drivers of canopy loss were residential characteristics, which include housing ownership and residential stability. Two variables relating to housing ownership show that the ownership of housing has an impact on tree canopy loss. CBGs that have higher rates of owner-occupied housing in the initial year (2014), and that have seen an increase in housing ownership, tend to experience greater canopy loss. This implies that one of the important factors driving canopy loss is the homeowner’s decisions regarding the tree canopy. Notable is the fact that owner-occupied housing is also positively associated with tree canopy cover [75], which is the opposite result of this study. This might be because renters are more hesitant to participate in public and private tree-planting initiatives [76]. Also, homeownership was associated with a greater possibility of UTC preservation compared to vacant lands [37]. Therefore, it is possible to say that residents in owner-occupied houses have greater control over the canopy on their land and are more actively involved in tree management practices, which may also include the active removal of trees.
However, studies have shown that the local government’s efforts regarding tree planting cannot fully counterbalance the extensive canopy loss occurring on private lands [30]. This is because, in terms of tree management, residents’ decisions do not always align with the local government’s goals regarding tree management. Residents often make decisions based on personal preferences, particularly related to the aesthetics of their landscape [77]. Therefore, there is a need for long-range tree programs that guide housing owners to align with the city’s long-term tree management plan and help control the potential for canopy loss in owner-occupied housing. Another critical driver of canopy loss in residential areas is residential stability, which is represented by the number of single-family housing sales. Communities that experience higher rates of single-family housing sales tend to have greater canopy loss. Simply put, this occurs because, when a house is sold, there is a higher probability of redevelopment and renovation, which can result in the removal of trees and alterations to the landscape based on new preferences.
Conversely, the regression results indicate that CBGs with fewer housing sales, reflecting neighborhoods with higher residential stability, tend to experience less UTC loss. This aligns with studies suggesting that residential stability can be a predictor of successful tree establishment [74] and the abundance of neighborhood green spaces [78]. Additionally, neighborhoods with higher residential stability tend to exhibit greater support for environmental preservation activities [79]. Residential stability promotes continuous land management activities that shape the residential landscape [80] while reducing the potential for UTC loss. Policies that reduce the displacement of communities would benefit more than just tree canopy, while other approaches that expand the engagement of communities in preservation education could help to improve owner acceptance of existing private property trees [80].

4.6. Policy Recommendations and Limitations

Using an urban canopy ‘equity lens’, the city of Portland employs a targeted universalism approach: “Within this framework, universal goals are established for all groups involved. The strategies developed to achieve those goals are then tailored based on how different groups are situated within structures, cultures, and across geographies to attain the universal goal” [81]. Following this approach, to reach the 2035 canopy goal of 33.3% across the city, the focus should be on communities with low canopy cover, which often correspond to low socioeconomic neighborhoods. In addition to planting new trees in these areas, the city should emphasize effective canopy preservation efforts. Mitigating canopy loss should be a priority in moderate canopy neighborhoods.
Several recommendations can be derived from the results to address canopy loss in the city of Portland. First, in Portland, residential developments with more multifamily housing units and a higher floor area ratio should be encouraged, while developments that require more single-family lot footprints should be restricted. For more than a decade, Portland has been known as a compact city [82,83,84], which is an urban form that could enhance urban sustainability [85,86,87]. The compact city concept encourages high-rise residential, mixed land use, and efficient energy use, including extensive public transportation [87,88]. Therefore, Portland has characteristics of the compact urban form with high-rise housing, and the results of the study recommend increasing multi-family housing. However, in other places, this recommendation would not be generalizable and simply adapted, as urban forestry planning should be carefully integrated into the different types of urban forms [85]. At last, the results of this study suggest that two types of density—horizontal and vertical density—could have different impacts on canopy change, and so should be considered separately.
Second, as residential turnover increases canopy loss, strategies should be put in place to preserve existing trees when new owners move into new housing. Providing educational programs and expanding incentives to follow the city’s tree management goals can also ensure that residents’ decisions align with the city’s objectives. Additionally, strong stewardship programs, coupled with adherence to the tree code, are crucial, as stewardship activities play a vital role in the survival of young trees [74]. Finally, monitoring tree cuts, both reported (permitted) cuts and unreported ones, is essential to managing the canopy effectively.
Overall, greater consideration of UTC loss is necessary, as the focus often centers on planting more trees, while the management of existing trees is overlooked. When UTC is removed, there is a longer period for new trees to grow, and increased stewardship efforts are needed to nurture their growth compared to managing existing trees. Notable is the fact that, during the development of the present study, the city of Portland began to revise the 2004 urban forest management plan. The consultant hired will conduct extensive outreach and review research on changes in UTC, and provide recommendations to the City through the creation of a new management plan. These findings may provide a timely means of updating the management plan since the city has undergone extensive landscape changes since 2004.

5. Conclusions

In summary, this study delves into the co-determinants of canopy loss in Portland. It brings attention to the significant issue of canopy loss, a facet often overlooked in previous studies predominantly focusing on increasing UTC. This study encompasses various drivers that could potentially impact canopy loss. While our findings align with previous research in some respects, such as demographic characteristics [38] and development characteristics [29,70,71], it also sheds light on previously unexplored results. The study identifies that two distinct density measures, both horizontal and vertical, can yield different effects on UTC loss. Additionally, residential stability emerges as a significant driver of UTC loss.
While this study delves into the spatial distribution of UTC change and identifies potential drivers of canopy loss, it is important to acknowledge certain limitations. For instance, it can be challenging to establish causality between the identified drivers and canopy loss definitively. For example, consider the scenario in which the analysis suggests that a decrease in the white population leads to more canopy loss. However, it is equally plausible that, within the six-year study period, the reduction in the white population is a consequence of diminishing canopy cover in the neighborhood.
Additionally, the measure of residential stability, represented by the number of housing sales during the study period, may not capture the intricacies of multiple sales over time. The data only reflect the most recent transaction date, potentially overlooking another aspect of residential stability—the occurrence of multiple sales during the study period. Furthermore, the tree data points obtained from FOT do not differentiate between street trees and private trees. Since changes in trees on public and private lands often counterbalance each other [30], discerning between public and private tree planting and removal could offer alternative interpretations.
Despite these limitations, the findings hold substantial implications for understanding UTC change, particularly in terms of canopy loss. Achieving the city’s 2035 canopy goal hinges not only on planting new trees but also on preserving existing UTC. Understanding the dynamics of UTC loss is imperative in formulating a more effective tree management policy. The findings of this study contribute to the ongoing development of policies aimed at preserving existing UTC. Future studies may explore the broader contextual factors linked to canopy change. For instance, examining topics like green gentrification within the context of gentrification [3] or considering climate change impacts such as urban heat [89] could provide valuable insights.

Author Contributions

Conceptualization, V.S. and Y.O.; methodology, F.R., N.Y. and Y.O.; software, F.R., N.Y. and Y.O.; validation, F.R., N.Y. and Y.O.; formal analysis, Y.O.; investigation, Y.O. and V.S.; resources, V.S.; data curation, F.R., N.Y. and Y.O.; writing—original draft preparation, Y.O.; writing—review and editing, V.S.; visualization, Y.O.; supervision, V.S.; project administration, V.S.; funding acquisition, V.S. All authors have read and agreed to the published version of the manuscript.

Funding

This research was funded by National Science Foundation, grant number 2010014, US Forest Service’s National Urban and Community Forestry Challenge Grant (17-DG-11132544-014), Portland State University’s Digital City Testbed Center, and The Nature Conservancy, Oregon Chapter.

Institutional Review Board Statement

Not applicable.

Informed Consent Statement

Not applicable.

Data Availability Statement

The data presented in this study are available upon request from the corresponding author. The data are not publicly available due to the lack of storage location to house the volume of data and the use of detailed land use information.

Acknowledgments

We would like to thank the anonymous editor and reviewers of the full manuscript.

Conflicts of Interest

The authors declare no conflicts of interest.

References

  1. Brunner, J.; Cozens, P. ‘Where Have All the Trees Gone?’ Urban Consolidation and the Demise of Urban Vegetation: A Case Study from Western Australia. Plan. Pract. Res. 2013, 28, 231–255. [Google Scholar] [CrossRef]
  2. Roy, S.; Byrne, J.; Pickering, C. A Systematic Quantitative Review of Urban Tree Benefits, Costs, and Assessment Methods across Cities in Different Climatic Zones. Urban For. Urban Green. 2012, 11, 351–363. [Google Scholar] [CrossRef]
  3. Donovan, G.H.; Prestemon, J.P.; Butry, D.T.; Kaminski, A.R.; Monleon, V.J. The Politics of Urban Trees: Tree Planting Is Associated with Gentrification in Portland, Oregon. For. Policy Econ. 2021, 124, 102387. [Google Scholar] [CrossRef]
  4. Donovan, G.H.; Butry, D.T. Trees in the City: Valuing Street Trees in Portland, Oregon. Landsc. Urban Plan. 2010, 94, 77–83. [Google Scholar] [CrossRef]
  5. Netusil, N.R.; Levin, Z.; Shandas, V.; Hart, T. Valuing Green Infrastructure in Portland, Oregon. Landsc. Urban Plan. 2014, 124, 14–21. [Google Scholar] [CrossRef]
  6. Sander, H.; Polasky, S.; Haight, R.G. The Value of Urban Tree Cover: A Hedonic Property Price Model in Ramsey and Dakota Counties, Minnesota, USA. Ecol. Econ. 2010, 69, 1646–1656. [Google Scholar] [CrossRef]
  7. Seo, Y. Varying Effects of Urban Tree Canopies on Residential Property Values across Neighborhoods. Sustainability 2020, 12, 4331. [Google Scholar] [CrossRef]
  8. Shandas, V. Neighborhood Change and the Role of Environmental Stewardship: A Case Study of Green Infrastructure for Stormwater in the City of Portland, Oregon, USA. Ecol. Soc. 2015, 20, art16. [Google Scholar] [CrossRef]
  9. Donovan, G.H.; Prestemon, J.P. The Effect of Trees on Crime in Portland, Oregon. Environ. Behav. 2012, 44, 3–30. [Google Scholar] [CrossRef]
  10. Kuo, F.E.; Sullivan, W.C. Environment and Crime in the Inner City: Does Vegetation Reduce Crime? Environ. Behav. 2001, 33, 343–367. [Google Scholar] [CrossRef]
  11. Elmendorf, W. The Importance of Trees and Nature in Community: A Review of the Relative Literature. AUF 2008, 34, 152–156. [Google Scholar] [CrossRef]
  12. Grima, N.; Corcoran, W.; Hill-James, C.; Langton, B.; Sommer, H.; Fisher, B. The Importance of Urban Natural Areas and Urban Ecosystem Services during the COVID-19 Pandemic. PLoS ONE 2020, 15, e0243344. [Google Scholar] [CrossRef]
  13. Chuang, W.-C.; Boone, C.G.; Locke, D.H.; Grove, J.M.; Whitmer, A.; Buckley, G.; Zhang, S. Tree Canopy Change and Neighborhood Stability: A Comparative Analysis of Washington, D.C. and Baltimore, MD. Urban For. Urban Green. 2017, 27, 363–372. [Google Scholar] [CrossRef]
  14. Dwivedi, P.; Rathore, C.S.; Dubey, Y. Ecological Benefits of Urban Forestry: The Case of Kerwa Forest Area (KFA), Bhopal, India. Appl. Geogr. 2009, 29, 194–200. [Google Scholar] [CrossRef]
  15. Hill, E.; Dorfman, J.H.; Kramer, E. Evaluating the Impact of Government Land Use Policies on Tree Canopy Coverage. Land Use Policy 2010, 27, 407–414. [Google Scholar] [CrossRef]
  16. Nowak, D.J.; Greenfield, E.J.; Hoehn, R.E.; Lapoint, E. Carbon Storage and Sequestration by Trees in Urban and Community Areas of the United States. Environ. Pollut. 2013, 178, 229–236. [Google Scholar] [CrossRef]
  17. Walton, J.; Nowak, D.; Greenfield, E. Assessing Urban Forest Canopy Cover Using Airborne or Satellite Imagery. AUF 2008, 34, 334–340. [Google Scholar] [CrossRef]
  18. Yang, B.; Lee, D.K. Planning Strategy for the Reduction of Runoff Using Urban Green Space. Sustainability 2021, 13, 2238. [Google Scholar] [CrossRef]
  19. Knight, T.; Price, S.; Bowler, D.; Hookway, A.; King, S.; Konno, K.; Richter, R.L. How Effective Is ‘Greening’ of Urban Areas in Reducing Human Exposure to Ground-Level Ozone Concentrations, U.V. Exposure and the ‘Urban Heat Island Effect’? An Updated Systematic Review. Environ. Evid. 2021, 10, 12. [Google Scholar] [CrossRef]
  20. Mcpherson, G.; Farmer, J.R.; Peper, P.J.; Maco, S.E.; Xiao, Q. Municipal Forest Benefits and Costs in Five U.S. Cities. J. For. 2005, 103, 411–416. [Google Scholar]
  21. Tamaskani Esfehankalateh, A.; Ngarambe, J.; Yun, G.Y. Influence of Tree Canopy Coverage and Leaf Area Density on Urban Heat Island Mitigation. Sustainability 2021, 13, 7496. [Google Scholar] [CrossRef]
  22. USDA Biden-Harris Administration Announces Historic Funding to Expand Access to Trees and Green Spaces in Disadvantaged Urban Communities|USDA 2023. Available online: https://www.usda.gov/media/press-releases/2023/04/12/biden-harris-administration-announces-historic-funding-expand (accessed on 17 February 2024).
  23. Hoffman, J.S.; Shandas, V.; Pendleton, N. The Effects of Historical Housing Policies on Resident Exposure to Intra-Urban Heat: A Study of 108 US Urban Areas. Climate 2020, 8, 12. [Google Scholar] [CrossRef]
  24. Locke, D.H.; Hall, B.; Grove, J.M.; Pickett, S.T.A.; Ogden, L.A.; Aoki, C.; Boone, C.G.; O’Neil-Dunne, J.P.M. Residential Housing Segregation and Urban Tree Canopy in 37 U.S. Cities. npj Urban Sustain. 2021, 1, 15. [Google Scholar] [CrossRef]
  25. Nardone, A.; Rudolph, K.E.; Morello-Frosch, R.; Casey, J.A. Redlines and Greenspace: The Relationship between Historical Redlining and 2010 Greenspace across the United States. Environ. Health Perspect. 2021, 129, 017006. [Google Scholar] [CrossRef] [PubMed]
  26. Hargrave, J.R.; Harper, R.W.; Butler, B.J.; Mullins, J.T. Municipal Forest Program Management in the United States of America: A Systematic Review. Forests 2022, 14, 35. [Google Scholar] [CrossRef]
  27. Nowak, D.J.; Greenfield, E.J. Declining Urban and Community Tree Cover in the United States. Urban For. Urban Green. 2018, 32, 32–55. [Google Scholar] [CrossRef]
  28. Nowak, D.J.; Greenfield, E.J. The Increase of Impervious Cover and Decrease of Tree Cover within Urban Areas Globally (2012–2017). Urban For. Urban Green. 2020, 49, 126638. [Google Scholar] [CrossRef]
  29. Guo, T.; Morgenroth, J.; Conway, T.; Xu, C. City-Wide Canopy Cover Decline Due to Residential Property Redevelopment in Christchurch, New Zealand. Sci. Total Environ. 2019, 681, 202–210. [Google Scholar] [CrossRef]
  30. Kaspar, J.; Kendal, D.; Sore, R.; Livesley, S.J. Random Point Sampling to Detect Gain and Loss in Tree Canopy Cover in Response to Urban Densification. Urban For. Urban Green. 2017, 24, 26–34. [Google Scholar] [CrossRef]
  31. McDonald, R.I.; Biswas, T.; Sachar, C.; Housman, I.; Boucher, T.M.; Balk, D.; Nowak, D.; Spotswood, E.; Stanley, C.K.; Leyk, S. The Tree Cover and Temperature Disparity in U.S. Urbanized Areas: Quantifying the Association with Income across 5723 Communities. PLoS ONE 2021, 16, e0249715. [Google Scholar] [CrossRef]
  32. Schwarz, K.; Fragkias, M.; Boone, C.G.; Zhou, W.; McHale, M.; Grove, J.M.; O’Neil-Dunne, J.; McFadden, J.P.; Buckley, G.L.; Childers, D.; et al. Trees Grow on Money: Urban Tree Canopy Cover and Environmental Justice. PLoS ONE 2015, 10, e0122051. [Google Scholar] [CrossRef]
  33. Greene, C.S.; Robinson, P.J.; Millward, A.A. Canopy of Advantage: Who Benefits Most from City Trees? J. Environ. Manag. 2018, 208, 24–35. [Google Scholar] [CrossRef] [PubMed]
  34. Berland, A.; Schwarz, K.; Herrmann, D.L.; Hopton, M.E. How Environmental Justice Patterns Are Shaped by Place: Terrain and Tree Canopy in Cincinnati, Ohio, USA. Cities Environ. (CATE) 2015, 8, 17. [Google Scholar]
  35. Riley, C.B.; Gardiner, M.M. Examining the Distributional Equity of Urban Tree Canopy Cover and Ecosystem Services across United States Cities. PLoS ONE 2020, 15, e0228499. [Google Scholar] [CrossRef]
  36. Watkins, S.L.; Mincey, S.K.; Vogt, J.; Sweeney, S.P. Is Planting Equitable? An Examination of the Spatial Distribution of Nonprofit Urban Tree-Planting Programs by Canopy Cover, Income, Race, and Ethnicity. Environ. Behav. 2017, 49, 452–482. [Google Scholar] [CrossRef]
  37. Locke, D.H.; Roman, L.A.; Henning, J.G.; Healy, M. Four Decades of Urban Land Cover Change in Philadelphia. Landsc. Urban Plan. 2023, 236, 104764. [Google Scholar] [CrossRef]
  38. Locke, D.H.; Romolini, M.; Galvin, M.; O’Neil-Dunne, J.P.M.; Strauss, E.G. Tree Canopy Change in Coastal Los Angeles, 2009–2014. Cities Environ. (CATE) 2017, 10, 28. [Google Scholar]
  39. Locke, D.H.; Grove, J.M. Doing the Hard Work Where It’s Easiest? Examining the Relationships Between Urban Greening Programs and Social and Ecological Characteristics. Appl. Spat. Anal. 2016, 9, 77–96. [Google Scholar] [CrossRef]
  40. Healy, M.; Rogan, J.; Roman, L.A.; Nix, S.; Martin, D.G.; Geron, N. Historical Urban Tree Canopy Cover Change in Two Post-Industrial Cities. Environ. Manag. 2022, 70, 16–34. [Google Scholar] [CrossRef]
  41. McGovern, M.; Pasher, J. Canadian Urban Tree Canopy Cover and Carbon Sequestration Status and Change 1990–2012. Urban For. Urban Green. 2016, 20, 227–232. [Google Scholar] [CrossRef]
  42. Hostetler, A.E.; Rogan, J.; Martin, D.; DeLauer, V.; O’Neil-Dunne, J. Characterizing Tree Canopy Loss Using Multi-Source GIS Data in Central Massachusetts, USA. Remote Sens. Lett. 2013, 4, 1137–1146. [Google Scholar] [CrossRef]
  43. Guo, T.; Morgenroth, J.; Conway, T. Redeveloping the Urban Forest: The Effect of Redevelopment and Property-Scale Variables on Tree Removal and Retention. Urban For. Urban Green. 2018, 35, 192–201. [Google Scholar] [CrossRef]
  44. Haaland, C.; van den Bosch, C.K. Challenges and Strategies for Urban Green-Space Planning in Cities Undergoing Densification: A Review. Urban For. Urban Green. 2015, 14, 760–771. [Google Scholar] [CrossRef]
  45. Morgenroth, J.; O’Neil-Dunne, J.; Apiolaza, L.A. Redevelopment and the Urban Forest: A Study of Tree Removal and Retention during Demolition Activities. Appl. Geogr. 2017, 82, 1–10. [Google Scholar] [CrossRef]
  46. Alves Carvalho Nascimento, L.; Shandas, V. Integrating Diverse Perspectives for Managing Neighborhood Trees and Urban Ecosystem Services in Portland, OR (U.S.). Land 2021, 10, 48. [Google Scholar] [CrossRef]
  47. Makido, Y.; Hellman, D.; Shandas, V. Nature-Based Designs to Mitigate Urban Heat: The Efficacy of Green Infrastructure Treatments in Portland, Oregon. Atmosphere 2019, 10, 282. [Google Scholar] [CrossRef]
  48. National Weather Service Climatological Report. Available online: https://forecast.weather.gov/product.php?site=NWS&issuedby=PDX&product=CLA&format=CI&version=1&glossary=0 (accessed on 6 February 2024).
  49. Wiewel, W.; Kafoury, D. The Portland Plan; Bureau of Planning and Sustainability, City of Portland: Portland, OR, USA, 2012.
  50. Goodling, E.; Green, J.; McClintock, N. Uneven Development of the Sustainable City: Shifting Capital in Portland, Oregon. Urban Geogr. 2015, 36, 504–527. [Google Scholar] [CrossRef]
  51. DiSalvo, A.; Ramsey, J.; Rossmiller, N. Tree Canopy Monitoring: Protocol and Monitoring from 2000–2020; Portland Parks & Recreation: Portland, OR, USA, 2022.
  52. Byrne, J.; Sipe, N.; Searle, G. Green around the Gills? The Challenge of Density for Urban Greenspace Planning in SEQ. Aust. Plan. 2010, 47, 162–177. [Google Scholar] [CrossRef]
  53. Portland Maps Open Data. Available online: https://gis-pdx.opendata.arcgis.com/ (accessed on 26 November 2023).
  54. Mincey, S.K.; Schmitt-Harsh, M.; Thurau, R. Zoning, Land Use, and Urban Tree Canopy Cover: The Importance of Scale. Urban For. Urban Green. 2013, 12, 191–199. [Google Scholar] [CrossRef]
  55. RLIS Discovery. Available online: https://rlisdiscovery.oregonmetro.gov/ (accessed on 26 November 2023).
  56. Getis, A. Reflections on Spatial Autocorrelation. Reg. Sci. Urban Econ. 2007, 37, 491–496. [Google Scholar] [CrossRef]
  57. Zhang, L.; Ma, Z.; Guo, L. An Evaluation of Spatial Autocorrelation and Heterogeneity in the Residuals of Six Regression Models. For. Sci. 2009, 55, 533–548. [Google Scholar]
  58. Lee, S.-I. Developing a Bivariate Spatial Association Measure: An Integration of Pearson’s r and Moran’s I. J. Geogr. Syst. 2001, 3, 369–385. [Google Scholar] [CrossRef]
  59. Conway, D.; Li, C.Q.; Wolch, J.; Kahle, C.; Jerrett, M. A Spatial Autocorrelation Approach for Examining the Effects of Urban Greenspace on Residential Property Values. J. Real Estate Financ. Econ. 2010, 41, 150–169. [Google Scholar] [CrossRef]
  60. Liu, J.H.; Shi, W. Impact of Bike Facilities on Residential Property Prices. Transp. Res. Rec. 2017, 2662, 50–58. [Google Scholar] [CrossRef]
  61. Merry, K.; Siry, J.; Bettinger, P.; Bowker, J.M. Urban Tree Cover Change in Detroit and Atlanta, USA, 1951–2010. Cities 2014, 41, 123–131. [Google Scholar] [CrossRef]
  62. Croeser, T.; Ordóñez, C.; Threlfall, C.; Kendal, D.; van der Ree, R.; Callow, D.; Livesley, S.J. Patterns of Tree Removal and Canopy Change on Public and Private Land in the City of Melbourne. Sustain. Cities Soc. 2020, 56, 102096. [Google Scholar] [CrossRef]
  63. Turubanova, S.; Potapov, P.; Hansen, M.C.; Li, X.; Tyukavina, A.; Pickens, A.H.; Hernandez-Serna, A.; Arranz, A.P.; Guerra-Hernandez, J.; Senf, C.; et al. Tree Canopy Extent and Height Change in Europe, 2001–2021, Quantified Using Landsat Data Archive. Remote Sens. Environ. 2023, 298, 113797. [Google Scholar] [CrossRef]
  64. Nesbitt, L.; Meitner, M. Exploring Relationships between Socioeconomic Background and Urban Greenery in Portland, OR. Forests 2016, 7, 162. [Google Scholar] [CrossRef]
  65. Disalvo, A.; Hsiao, C.Y.; Wells, L. Growing a More Equitable Urban Forest: Portland’s Citywide Tree Planting Strategy; Portland Parks & Recreation: Portland, OR, USA, 2018.
  66. Carney, C. Urban Forest Action Plan: 2020 Implementation Update; Portland Parks & Recreation: Portland, OR, USA, 2021.
  67. Foster, A.; Dunham, I.M.; Bukowska, A. An Environmental Justice Analysis of Urban Tree Canopy Distribution and Change. J. Urban Aff. 2022, 1–16. [Google Scholar] [CrossRef]
  68. Koo, B.W.; Boyd, N.; Botchwey, N.; Guhathakurta, S. Environmental Equity and Spatiotemporal Patterns of Urban Tree Canopy in Atlanta. J. Plan. Educ. Res. 2023, 43, 166–181. [Google Scholar] [CrossRef]
  69. Wolch, J.R.; Byrne, J.; Newell, J.P. Urban Green Space, Public Health, and Environmental Justice: The Challenge of Making Cities ‘Just Green Enough’. Landsc. Urban Plan. 2014, 125, 234–244. [Google Scholar] [CrossRef]
  70. Steenberg, J.W.N.; Millward, A.A.; Duinker, P.N.; Nowak, D.J.; Robinson, P.J. Neighbourhood-Scale Urban Forest Ecosystem Classification. J. Environ. Manag. 2015, 163, 134–145. [Google Scholar] [CrossRef] [PubMed]
  71. Saunders, A.; Duncan, J.; Hurley, J.; Amati, M.; Caccetta, P.; Chia, J.; Boruff, B. Leaf My Neighbourhood Alone! Predicting the Influence of Densification on Residential Tree Canopy Cover in Perth. Landsc. Urban Plan. 2020, 199, 103804. [Google Scholar] [CrossRef]
  72. Smith, C.; Clayden, A.; Dunnett, N. An Exploration of the Effect of Housing Unit Density on Aspects of Residential Landscape Sustainability in England. J. Urban Des. 2009, 14, 163–187. [Google Scholar] [CrossRef]
  73. Hilbert, D.; Roman, L.; Koeser, A.; Vogt, J.; van Doorn, N. Urban Tree Mortality: A Literature Review. AUF 2019, 45, 167–200. [Google Scholar] [CrossRef]
  74. Roman, L.A.; Battles, J.J.; McBride, J.R. Determinants of Establishment Survival for Residential Trees in Sacramento County, CA. Landsc. Urban Plan. 2014, 129, 22–31. [Google Scholar] [CrossRef]
  75. Landry, S.M.; Chakraborty, J. Street Trees and Equity: Evaluating the Spatial Distribution of an Urban Amenity. Environ. Plan. A 2009, 41, 2651–2670. [Google Scholar] [CrossRef]
  76. Perkins, H.A.; Heynen, N.; Wilson, J. Inequitable Access to Urban Reforestation: The Impact of Urban Political Economy on Housing Tenure and Urban Forests. Cities 2004, 21, 291–299. [Google Scholar] [CrossRef]
  77. Conway, T.M. Tending Their Urban Forest: Residents’ Motivations for Tree Planting and Removal. Urban For. Urban Green. 2016, 17, 23–32. [Google Scholar] [CrossRef]
  78. Kimpton, A. A Spatial Analytic Approach for Classifying Greenspace and Comparing Greenspace Social Equity. Appl. Geogr. 2017, 82, 129–142. [Google Scholar] [CrossRef]
  79. Oishi, S.; Rothman, A.J.; Snyder, M.; Su, J.; Zehm, K.; Hertel, A.W.; Gonzales, M.H.; Sherman, G.D. The Socioecological Model of Procommunity Action: The Benefits of Residential Stability. J. Personal. Soc. Psychol. 2007, 93, 831–844. [Google Scholar] [CrossRef] [PubMed]
  80. Chowdhury, R.R.; Larson, K.; Grove, M.; Polsky, C.; Cook, E.; Onsted, J.; Ogden, L. A Multi-Scalar Approach to Theorizing Socio-Ecological Dynamics of Urban Residential Landscapes. CATE 2011, 4, 6. [Google Scholar] [CrossRef]
  81. Powell, J.A.; Ake, W.; Menendian, S. Targeted Universalism: Policy & Practice; Haas Institute for a Fair and Inclusive Soceity, University of California, Berkeley: Berkeley, CA, USA, 2019. [Google Scholar]
  82. Dieleman, F.; Wegener, M. Compact City and Urban Sprawl. Built Environ. 2004, 30, 308–323. [Google Scholar] [CrossRef]
  83. Yang, Y. A Tale of Two Cities: Physical Form and Neighborhood Satisfaction in Metropolitan Portland and Charlotte. J. Am. Plan. Assoc. 2008, 74, 307–323. [Google Scholar] [CrossRef]
  84. Kelley, G.; Martin, S.A.; Mylott, E. Achieving Sustainable, Compact Development in the Portland Metropolitan Area: New Tools and Approaches for Developing Centers and Corridors; Institute of Portland Metropolitan Studies: Portland, OR, USA, 2009. [Google Scholar]
  85. Jim, C.Y.; Konijnendijk Van Den Bosch, C.; Chen, W.Y. Acute Challenges and Solutions for Urban Forestry in Compact and Densifying Cities. J. Urban Plann. Dev. 2018, 144, 04018025. [Google Scholar] [CrossRef]
  86. Artmann, M.; Kohler, M.; Meinel, G.; Gan, J.; Ioja, I.-C. How Smart Growth and Green Infrastructure Can Mutually Support Each Other—A Conceptual Framework for Compact and Green Cities. Ecol. Indic. 2019, 96, 10–22. [Google Scholar] [CrossRef]
  87. Bibri, S.E.; Krogstie, J.; Kärrholm, M. Compact City Planning and Development: Emerging Practices and Strategies for Achieving the Goals of Sustainability. Dev. Built Environ. 2020, 4, 100021. [Google Scholar] [CrossRef]
  88. OECD. Compact City Policies: A Comparative Assessment; OECD Green Growth Studies; OECD: Paris, France, 2012; ISBN 978-92-64-16784-1. [Google Scholar]
  89. Venter, Z.S.; Krog, N.H.; Barton, D.N. Linking Green Infrastructure to Urban Heat and Human Health Risk Mitigation in Oslo, Norway. Sci. Total Environ. 2020, 709, 136193. [Google Scholar] [CrossRef]
Figure 1. The study area: Portland, Oregon. USGS NAIP Image.
Sustainability 16 01803 g001
Figure 2. Sociodemographic distribution of Portland (2019): (a) population density by acre; (b) median household income (USD). Source: 2019 5-year American Community Survey.
Sustainability 16 01803 g002
Figure 3. Relationship between previous canopy (2014) and canopy change (2014–2020); Unit: Square meter per acre—all canopy data (m2) is normalized by the size of the size of census block group (acre): (a) relationship between previous canopy (2014) and gain; (b) relationship between previous canopy (2014) and loss.
Sustainability 16 01803 g003
Figure 4. Spatial distribution of canopy change in Portland: (a) the overall canopy change (m2) in the city; (b) shows the “density (m2/acre)” measure of change, which is normalized by the size of Census Blackgroup (acre).
Sustainability 16 01803 g004
Figure 5. Spatial distribution of canopy loss density (m2/acre) in Portland.
Sustainability 16 01803 g005
Table 1. Data and variables description.
CategoryVariableDescriptionUnit **SourceYear
DemographicPopulation ChangePopulation change by CBG, normalized by size of CBGPeople per AcreACS *2014–2019
Median Household IncomeMedian household income of CBGDollar (USD)ACS2014
Median Household Income ChangeMedian household income changeDollar (USD)ACS2014–2019
Non-White PopulationDensity measure of non-white population for CBGPeople per AcreACS2014
White Population ChangeWhite population density change during study time range.People per AcreACS2014–2019
DevelopmentResidential Building PermitPermits that have created one or more new residential unitsPermits per AcrePortlandMaps—Opendata2014–2019
Residential Demolition PermitPermits for the demolition of residential one and two family structuresPermits per AcrePortlandMaps—Opendata2014–2019
Building Footprint ChangeBuilding footprint change, which indicates the horizontal density changeSquare Foot per AcreRLIS2014–2019
Number of Multifamilty Housing Unit ChangeChange in number of multifamily housing unit, indicates vertical density changeUnit per AcreRLIS2014–2019
PlanningZoning Change—ResidentialChange in residential zoned area during 2014 to 2019. Measured in density.Foot per AcreRLIS2014–2019
Planted TreeEstimated number of trees that were planted by Bureau of Environmental Services and Friends of TreesTrees per AcreBES and FoT2014–2019
Fallen TreeEstimated number of trees that were permitted to be cut downTrees per AcreBES and FoT2015–2019
Residential StatusHousing SaleNumber of single-family housing units that had sold during study time frameHousing Sale per AcreRLIS2014–2019
Change of Owner-occupied HousingChange of owner-occupied housing unit proportion.RatioACS2014
Owner-occupied HousingProportion of owner-occupied housing unit (owner occupied/Total)RatioACS2014
Tree CanopyExisting CanopyExisting tree canopy density in 2014, measured through NAIP imagerySquare Meter per AcreNAIP2014
Tree Canopy LossMeasure of tree canopy loss in density during 2014 to 2019. Using NAIP imageriesSquare Meter per AcreNAIP2014–2020
* Abbr. ACS (American Community Survey), RLIS (Regional Land Information System), BES (Bureau of Environmental Service), FoT (Friends of Trees), NAIP (National Agriculture Imagery Program). ** Unit Per Acre represents the normalized density measure which ‘Acre’ is 4047 square meters.
Table 2. Spatial error model result.
CharacteristicsEstimates (Coefficient)
Number of Observations443
Existing Canopy (2014)1.2212 × 10⁻²
Demographic Characteristics
Population Change5.5341 ***
White Population Change−3.8055 ***
Non-White Population (2014)4.6213 ***
Median Household Income Change−2.0791 × 10⁻⁴ *
Median Household Income (2014)−3.7607 × 10⁻⁴ **
Development Characteristics
Demolition Permit5.4162 × 10
Building Footprint Change3.4611 × 10−2 ***
Multifamily Housing Unit Change−4.3621 ***
Policy/Planning Characteristic
Residential Zoning Change2.7841
Planted Tree7.7974 × 101 ***
Fallen Tree5.6761 × 101 ***
Residential Turnover Characteristic
Single-Family Housing Sales8.1917 × 101 ***
Housing Owner Ratio Change4.8822 × 101 **
Housing Owner Ratio (2014)6.6368 × 101 ***
Constant (Intercept)1.4364 × 10² ***
Log-likelihood−2308.485
Nagelkerke pseudo-R-Squared0.80007
AIC (AIC for OLS)4653 (4903.1)
Lambda0.85952 ***
Wald Statistics970.17 ***
NOTE: AIC = Akaike information criterion. Significant at * 10%, ** 5%, *** 1% level.
Disclaimer/Publisher’s Note: The statements, opinions and data contained in all publications are solely those of the individual author(s) and contributor(s) and not of MDPI and/or the editor(s). MDPI and/or the editor(s) disclaim responsibility for any injury to people or property resulting from any ideas, methods, instructions or products referred to in the content.

