Article

Research on Life Cycle Assessment and Performance Comparison of Bioethanol Production from Various Biomass Feedstocks

1
School of Environmental Science and Engineering, Changzhou University, Changzhou 213164, China
2
National-Local Joint Engineering Research Center of Biomass Refining and High-Quality Utilization, Institute of Urban and Rural Mining, Changzhou Key Laboratory of Biomass Green, Safe & High Value Utilization, Changzhou University, Changzhou 213164, China
*
Authors to whom correspondence should be addressed.
Sustainability 2024, 16(5), 1788; https://doi.org/10.3390/su16051788
Submission received: 30 January 2024 / Revised: 17 February 2024 / Accepted: 19 February 2024 / Published: 22 February 2024

Abstract

:
Bioethanol, as a renewable energy source, has been widely used in the energy sector, particularly in replacing traditional petroleum energy, and holds great potential. This study involves a whole life cycle assessment of bioethanol production and the co-production of high-value by-products—xylose, lignin, and steam—using three types of waste biomass: corn cobs, corn straw, and wheat straw as feedstocks by chopping, pretreatment, hydrolysis, fermentation, and distillation methods. Secondly, the benefits of three raw materials are compared for preparing bioethanol, and their impact on the environment and energy production is analyzed. The comparison indicates that corn cobs offer the best overall benefits, with a net energy balance (NEB) of 6902 MJ/Mg of ethanol and a net energy ratio (NER) of 1.30. The global warming potential (GWP) is 1.75 × 10⁻², acidification potential (AP) is 1.02 × 10⁻², eutrophication potential (EP) is 2.63 × 10⁻⁴, photochemical ozone creation potential (POCP) is 3.19 × 10⁻⁸, and human toxicity potential (HTP) is 1.52 × 10⁻⁴. This paper can provide a theoretical reference and data supporting the green refining of bioethanol and the high-value utilization of by-products, and broaden its application prospects.

1. Introduction

The extensive use of fossil fuels causes environmental pollution and global climate change, leading to a significant demand for the development and utilization of renewable resources [1]. The use of renewable resources such as solar energy, hydropower, wind energy, geothermal energy, tidal energy, and bioenergy has gained momentum in replacing non-renewable energy [2]. Biomass, as a renewable energy feedstock, can be transformed into energy through physical, chemical, and biochemical processes [3]. Agricultural waste (AW), such as straw, is increasing in quantity with the growth in crop planting and yield, reaching almost a billion tons per year worldwide [4]. China, a major agricultural nation, has abundant biomass resources, including an annual production of more than 700 million tons of straw. The improper handling of straw can lead to negative environmental impacts and is also a serious waste of resources. For example, burning straw can emit significant greenhouse gases, nitrogen oxides (NOx), and other pollutants. Bioethanol, as a renewable energy source, has been widely used in the energy sector, particularly in replacing traditional petroleum energy, and holds great potential [5]. Therefore, converting straw into bioethanol has significant environmental and economic value.
Due to seasonal variations in crop types, the raw materials for bioethanol production differ, and the production processes also vary, so analyzing and comparing these processes is necessary. Therefore, this work conducts a lifecycle assessment (LCA) of bioethanol production using different types of straw as feedstocks. LCA is a tool used to evaluate the effect on the environment, energy, and materials caused by production process [6,7]. Employing the LCA method to evaluate the bioethanol production process is significant.
The production of bioethanol faces challenges such as high energy consumption, low yield, and low saccharification rates [8]. In addition to bioethanol, lignocellulosic biomass also generates the by-products lignin and hemicellulose, which can provide better economic benefits. With the development of biomass-based materials, the utilization of lignin and hemicellulose has increased, enhancing their economic value. Hemicellulose can be processed into xylose, while lignin can be used to produce additives, adhesives, renewable composite materials, etc. [9]. Compared to traditional processes that burn lignin for energy, calculating the economic and environmental benefits of producing high-value by-products is significant.
In this study, three types of lignocellulosic biomass (corn cobs, corn straw, and wheat straw) were selected as feedstocks for bioethanol production, and the LCA of these three processes was analyzed and compared. Firstly, the feedstocks are processed and separated to obtain bioethanol, lignin, and xylose, ensuring the full utilization of each component of the biomass and maximizing the value of the products [10]. Subsequently, the bioethanol production process is divided into three stages: the cultivation and collection of raw materials, transportation of raw materials, and ethanol production (chopping, pretreatment, hydrolysis, fermentation, and distillation). The life cycle of each stage is evaluated based on energy benefits (net energy balance and net energy ratio) and environmental benefits (global warming potential, acidification, eutrophication, and carbon reduction). Finally, the economic, energy, and environmental impacts of using lignin as a product versus its use in electricity generation in boilers are calculated and compared. This work offers guidance for seasonal production and theoretical support for the utilization of by-products.

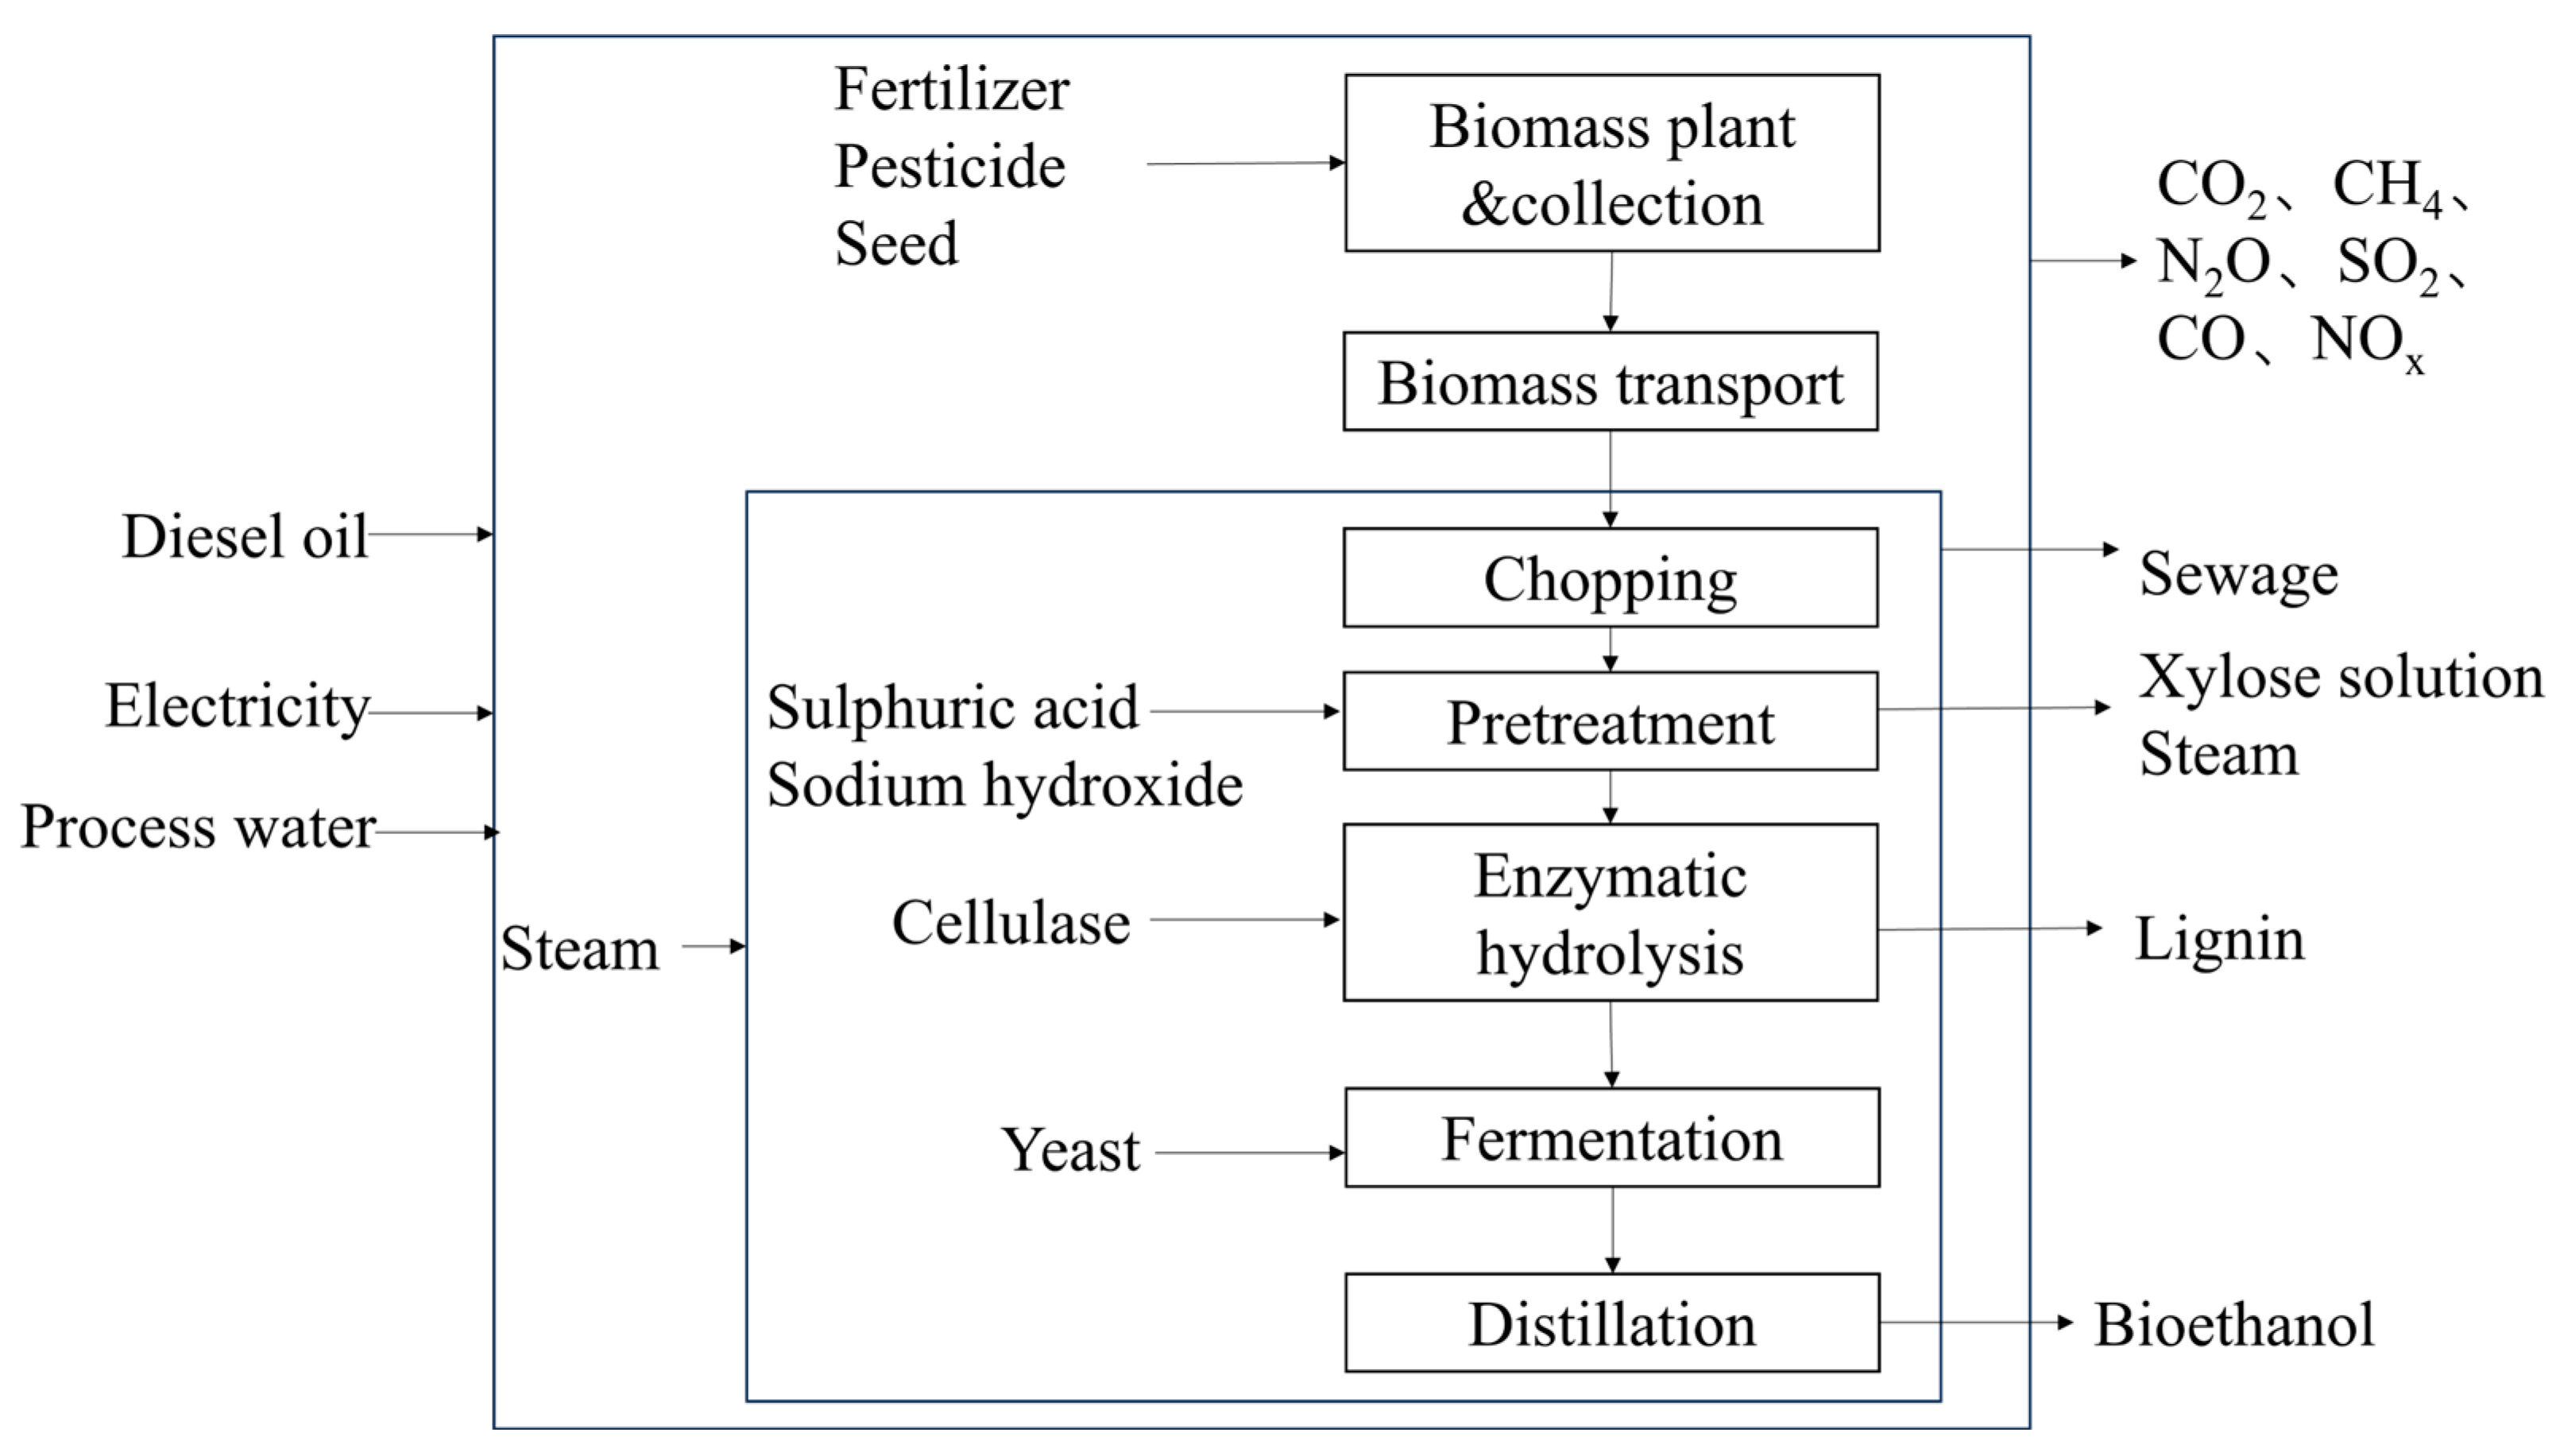
2. Life Cycle System of Bioethanol

Emissions and energy use during transportation in the life cycle are analyzed using GREET®2022 software [11]. Some background data are derived from literature that is duly cited below, and life cycle inventory data are sourced from a company in Hebei.

2.1. Purpose and Boundary Condition

This study is based on the life cycle assessment method, using corn cob, corn straw, and wheat straw as raw materials to produce bioethanol as the pointcut, carrying out the whole life cycle emission and energy analysis of the system of the large-scale production of bioethanol from 20,000 Mg per year, aiming to identify areas of improvement throughout the whole life cycle of bioethanol. The scope of this study encompasses the entire life cycle of bioethanol, including the cultivation of biomass feedstocks, transportation of these materials, and production of high-value by-products and bioethanol [12]. The functional unit of this study is the production of 1 Mg bioethanol [13]. The system boundary (Figure 1) includes the following units: the cultivation and collection of raw materials, transportation of raw materials, and ethanol production.

2.2. The Assumptions in Calculation

The system includes indirect life cycle environmental assessment flows related to the raw materials, chemicals, nutrients, and fuels used at each lifecycle stage. The changes in land use, and the construction of equipment, buildings, and other fundamental infrastructure elements are not considered in this assessment [14].

2.3. Inventory Data and Source

2.3.1. Cultivation and Collection of Feedstocks

In the production of bioethanol from lignocellulosic biomass, the selected raw materials are corn cobs, corn straw, and wheat straw. The allocation of grain and biomass feedstocks (corn cobs, corn straw, wheat straw) is determined by dividing them according to calculated parameters based on the grass grain ratio and price ratio, and the data are shown in Table 1 [15,16].
R = Y 2 × P 2 Y 1 × P 1 + Y 2 × P 2
where Y and P are the grass grain ratio and price, respectively.
The cultivation process of wheat and corn involves seeds, fertilizers, and electricity; specific data presented in Table 2, and the data are sourced from the National Bureau of Statistics and the statistical yearbook of Hebei province. The relevant data are from the National Bureau of Statistics and the statistical yearbook of Hebei province. Both the grain and biomass feedstocks are harvested mechanically. The stubble height for the mechanically harvested straw is maintained at 15 cm to ensure that the soil carbon content remains unaffected [18]. The yields of wheat and corn are 7502 kg/ha and 7448 kg/ha, respectively, resulting in yields of wheat straw, corn straw, and corn cobs of 10,052.81 kg/ha, 12,885.21 kg/ha, and 1117.21 kg/ha, respectively [19,20].

2.3.2. Calculation of Transport

The collected biomass feedstocks are dried, packaged, and transported to the bioethanol processing factory as feedstocks [21]. The radius of feedstock collection is defined as [22]
R = ( F π f a f b Y ) 1 / 2
where F represents the annual demand for the dry weight of biomass feedstocks; fa is the collection coefficient of the raw material; fb is the cultivation coefficient; Y represents the yield of biomass. Taking corn straw as an example, the dry weight is set at 113,792 Mg/year, the collection coefficient at 0.85, the cultivation coefficient at 0.5, and the biomass yield at 12.89 Mg/(ha·year). This results in a calculated radius of 81.34 km, and a collection radius of 100 km is assumed. The diesel consumption for transporting the corn cobs, corn straw, and wheat straw is 2.21 × 10⁻² Mg, 2.42 × 10⁻² Mg, and 2.42 × 10⁻² Mg, respectively (Table 3).

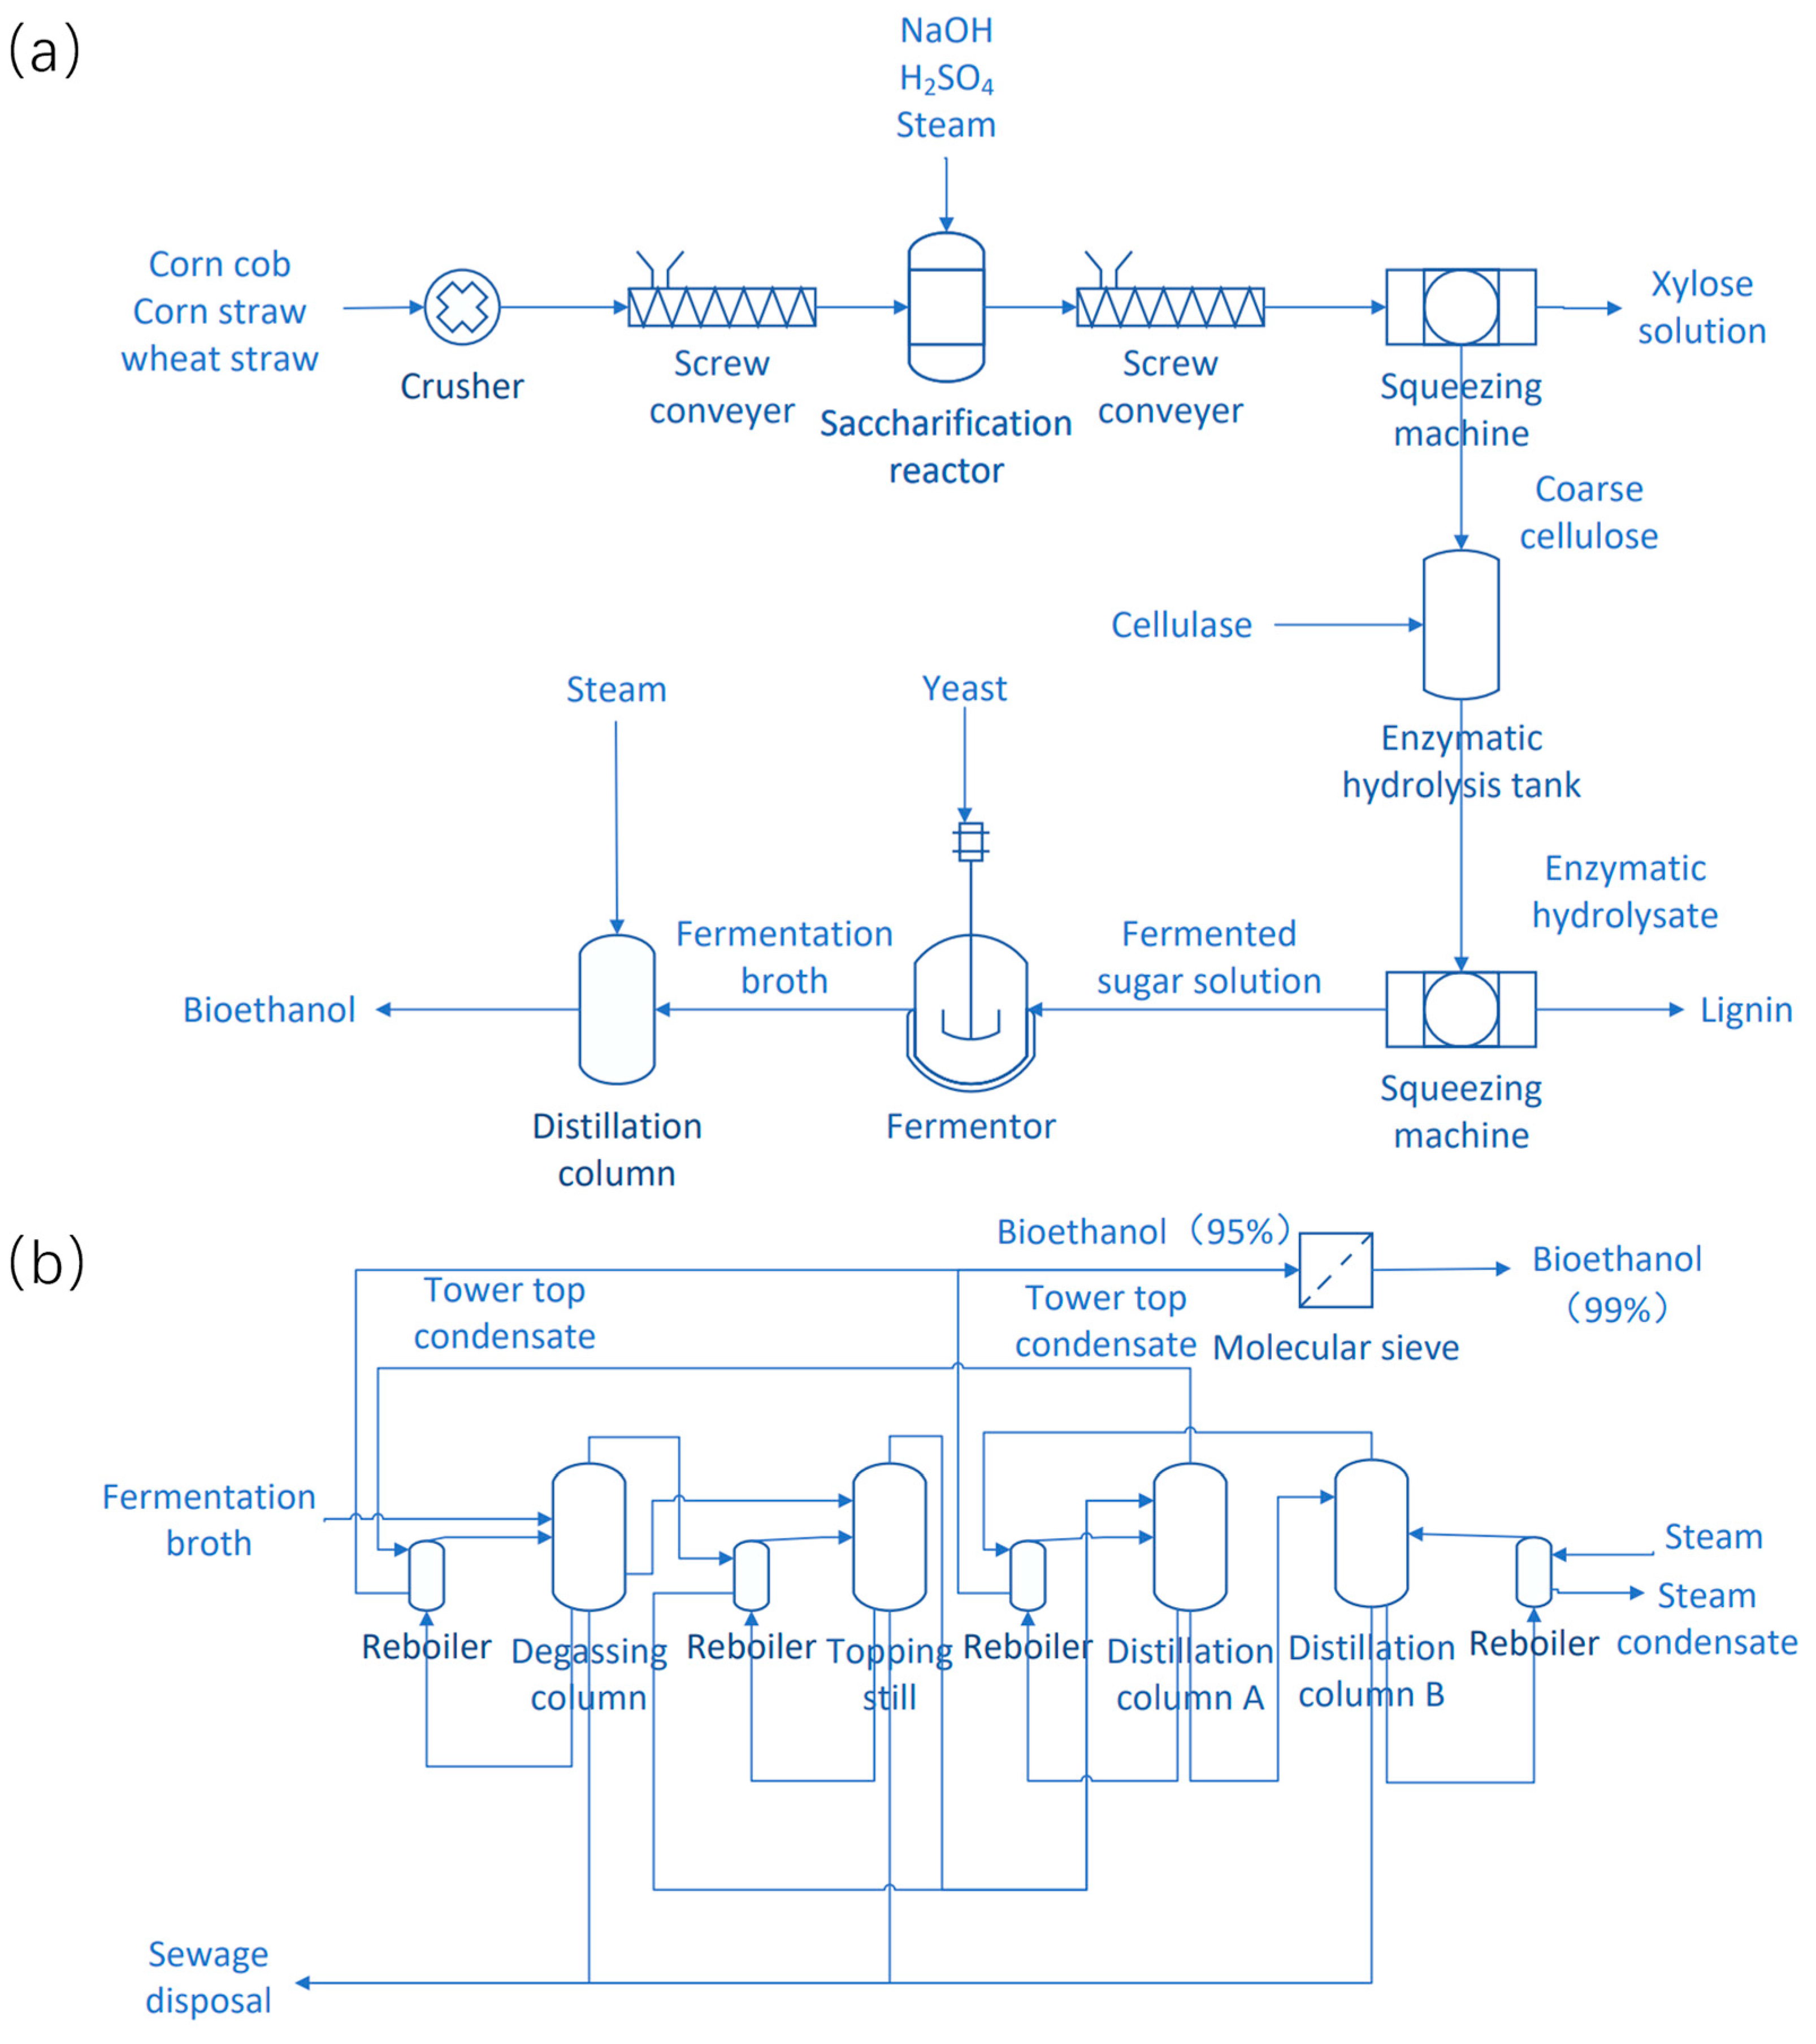
2.3.3. Transforming Cellulose to Bioethanol

The process of producing bioethanol from biomass consists of five main subprocesses: milling, pretreatment, enzymatic hydrolysis, fermentation, and distillation (Figure 2a) [24]. The production data and technology for bioethanol are derived from a company in Hebei province, China. Table 4 presents the inventory for producing 1 Mg bioethanol.
(1)
Chopping
Biomass feedstocks are conveyed to a crusher via a belt, where they are crushed to a size of 20–50 mm to increase the reaction surface area and reaction efficiency [25]. The crushed material is then transported to the pretreatment process via a screw feeder and belt.
(2)
Pretreatment
Pretreatment is a crucial step in the production of bioethanol. This process utilizes steam explosion (SE) pretreatment, where biomass is subjected to explosive decompression under the conditions of hot steam (180–240 °C) and 1–3.5 MPa [26]. This can cause the rigid structure of biomass fibers to rupture and turn the material into fibrous dispersed solids.
The sudden release of pressure creates shear forces that break chemical bonds between hemicellulose and lignin, as well as hydrogen bonds between hemicellulose and cellulose, further enhancing the conversion efficiency of cellulose in subsequent enzymatic hydrolysis.
H2SO4 solution is added as a liquid catalyst to the saccharification reactor, followed by the introduction of steam. Hemicellulose in the biomass undergoes a saccharification reaction under the catalysis of H2SO4 solution (0.3–3% w/w), producing monosaccharides. After the reaction, the material is depressurized using a spray pot and then passed through a screw conveyor to a dewatering machine for solid–liquid separation, yielding xylose liquid and crude cellulose. The xylose liquid undergoes purification, concentration, and crystallization to achieve its production. The crude cellulose is then diluted with water in the crude cellulose tank and pumped into the enzymatic hydrolysis section.
(3)
Enzymatic Hydrolysis and Fermentation
Enzymatic hydrolysis is a crucial stage in the production of ethanol from biomass materials [27]. Enzymatic hydrolysis is the process of using cellulase produced by microorganisms to hydrolyze cellulose and hemicellulose into fermentable sugars. Enzymes are proteins that can accelerate various biochemical reactions, also known as biocatalysts, and are the prerequisite and core of the entire production process of bioethanol. This process adopts a separate hydrolysis and fermentation (SHF) process, which first converts the pretreated lignocellulose into glucose through enzymatic hydrolysis, and then ferments it in another reactor to convert it into ethanol [28,29]. Its main advantage is that both saccharification and fermentation can be carried out under their respective optimal conditions.
The crude cellulose obtained from the saccharification process is sent to a raw material buffer tank. It is mixed with water to form a pulp with a concentration of 18–23wt% and maintained at a temperature of 48–53 °C. The pH is adjusted to 4.8–5.5 using aqueous ammonia, and a quantified amount of cellulase is added. After continuous feeding and 72 h of enzymatic hydrolysis, the hydrolysate is obtained. The hydrolysate is then sent to a dewatering machine for solid–liquid separation. The liquid phase yields a fermentation sugar solution, and the solid phase yields the by-product lignin. The sugar solution from the enzymatic hydrolysis section, along with yeast and nutrients, is fermented in a fermentation tank at 30–32 °C and pH 4.7–5.1 for 72 h, resulting in an ethanol concentration of 58–68 g/L in the fermented broth.
(4)
Distillation
The mature fermented broth is measured and preheated before entering the degassing tower. In the degassing tower, CO2, low-boiling-point impurities, and wastewater are produced from the fermented broth. CO2 and low-boiling-point impurities are separated by flash evaporation, and wastewater is discharged to the wastewater treatment system from the bottom of the tower. A portion of the crude alcohol is extracted from a side-stream of the degassing tower to the distillation column for further dehydration, while another portion of the crude alcohol vapor phase enters the reboiler of the crude distillation column to provide a heat source. The condensed vapor phase of crude alcohol is collected with the top liquid from the crude distillation column into the crude alcohol tank.
The crude alcohol is preheated in the crude alcohol tank before entering distillation towers A and B for further distillation. At the top of the towers, 95wt% alcohol is obtained, which is then dehydrated in a molecular sieve section to produce pure bioethanol. The distillation process flow diagram is illustrated in Figure 2b.

2.4. Assessment Methods

The assessment of bioethanol focuses on energy usage and environmental impacts, including global warming, acidification, and eutrophication potential.

2.4.1. Energy Impact

The net energy input and output are calculated to assess the net energy indicator, evaluating the energy sustainability of the considered lifecycle of bioethanol production. This study determines the input and output energy based on the requirements for electricity, diesel, steam, and manufacturing, with the output energy being the energy generated by the main product, bioethanol [30]. Table 5 presents the energy input of different materials.
The net energy balance (NEB) is the difference between the total energy inputs and outputs, and net energy ratio (NER) is the ratio of the total energy outputs to net energy inputs. The formulas for the net energy balance (NEB) and net energy ratio (NER) are as follows [18]:
NEB = Total Output Energy - Total Input Energy
NER = Total   Output   Energy Total   Input   Energy
where the total energy output is the Higher Heating Value of ethanol, which is 29.7 MJ/kg [32].
Equation (5) is used to calculate the total input energy; throughout the whole process, the energy input includes electricity, diesel, and steam. Equation (5) is used to illustrate that the energy input for each stage is the product of matter and its energy intensity.
E = i j E i j E I i j
where Eij represents the consumption of the j process in the i life cycle stage, and EIij is the energy intensity of various forms of energy [33]. The total energy input is the sum of the energy consumption from the cultivation of biomass feedstock to the production of bioethanol.

2.4.2. Environment Impact

This study selected environmental impacts such as the global warming potential (GWP), acidification potential (AP), eutrophication potential (EP), photochemical ozone creation potential (POCP), and human toxicity potential (HTP), and assessed these impacts using characterization, normalization, and weighting methods [34]. Characterization uses the equivalent factor method, with the following equation:
C j = x z X j
where C represents the characterization result; x is the emission quantity of pollutants per functional unit; X is the equivalent factor (see Table 6); j represents the type of environmental impact; z refers to different substances that belong to the same type of environmental impact.
Through the methods of normalization and weighting, the characterization results of each system become the dimensionless environmental impact potential, enabling horizontal and vertical comparison and the analysis of the environmental impacts generated.
The normalization calculation formula is
N j = C j S j
The weighting calculation formula is
R = N j × weight   coefficient
where N represents the normalization result; C is the characterization result; S is the reference value; R is the environmental impact index; j represents the type of environmental impact.
The reduction in greenhouse gas (GHG) emissions is calculated based on the equivalent CO2 emissions and compared with the CO2 emissions of 1 MJ of gasoline. The calculation formula is as follows [18]:
r e d u c t i o n ( % ) = GHG   emissions g a s o l i n e GHG   emissions e t h a n o l GHG   emissions g a s o l i n e

3. Assessment of Process

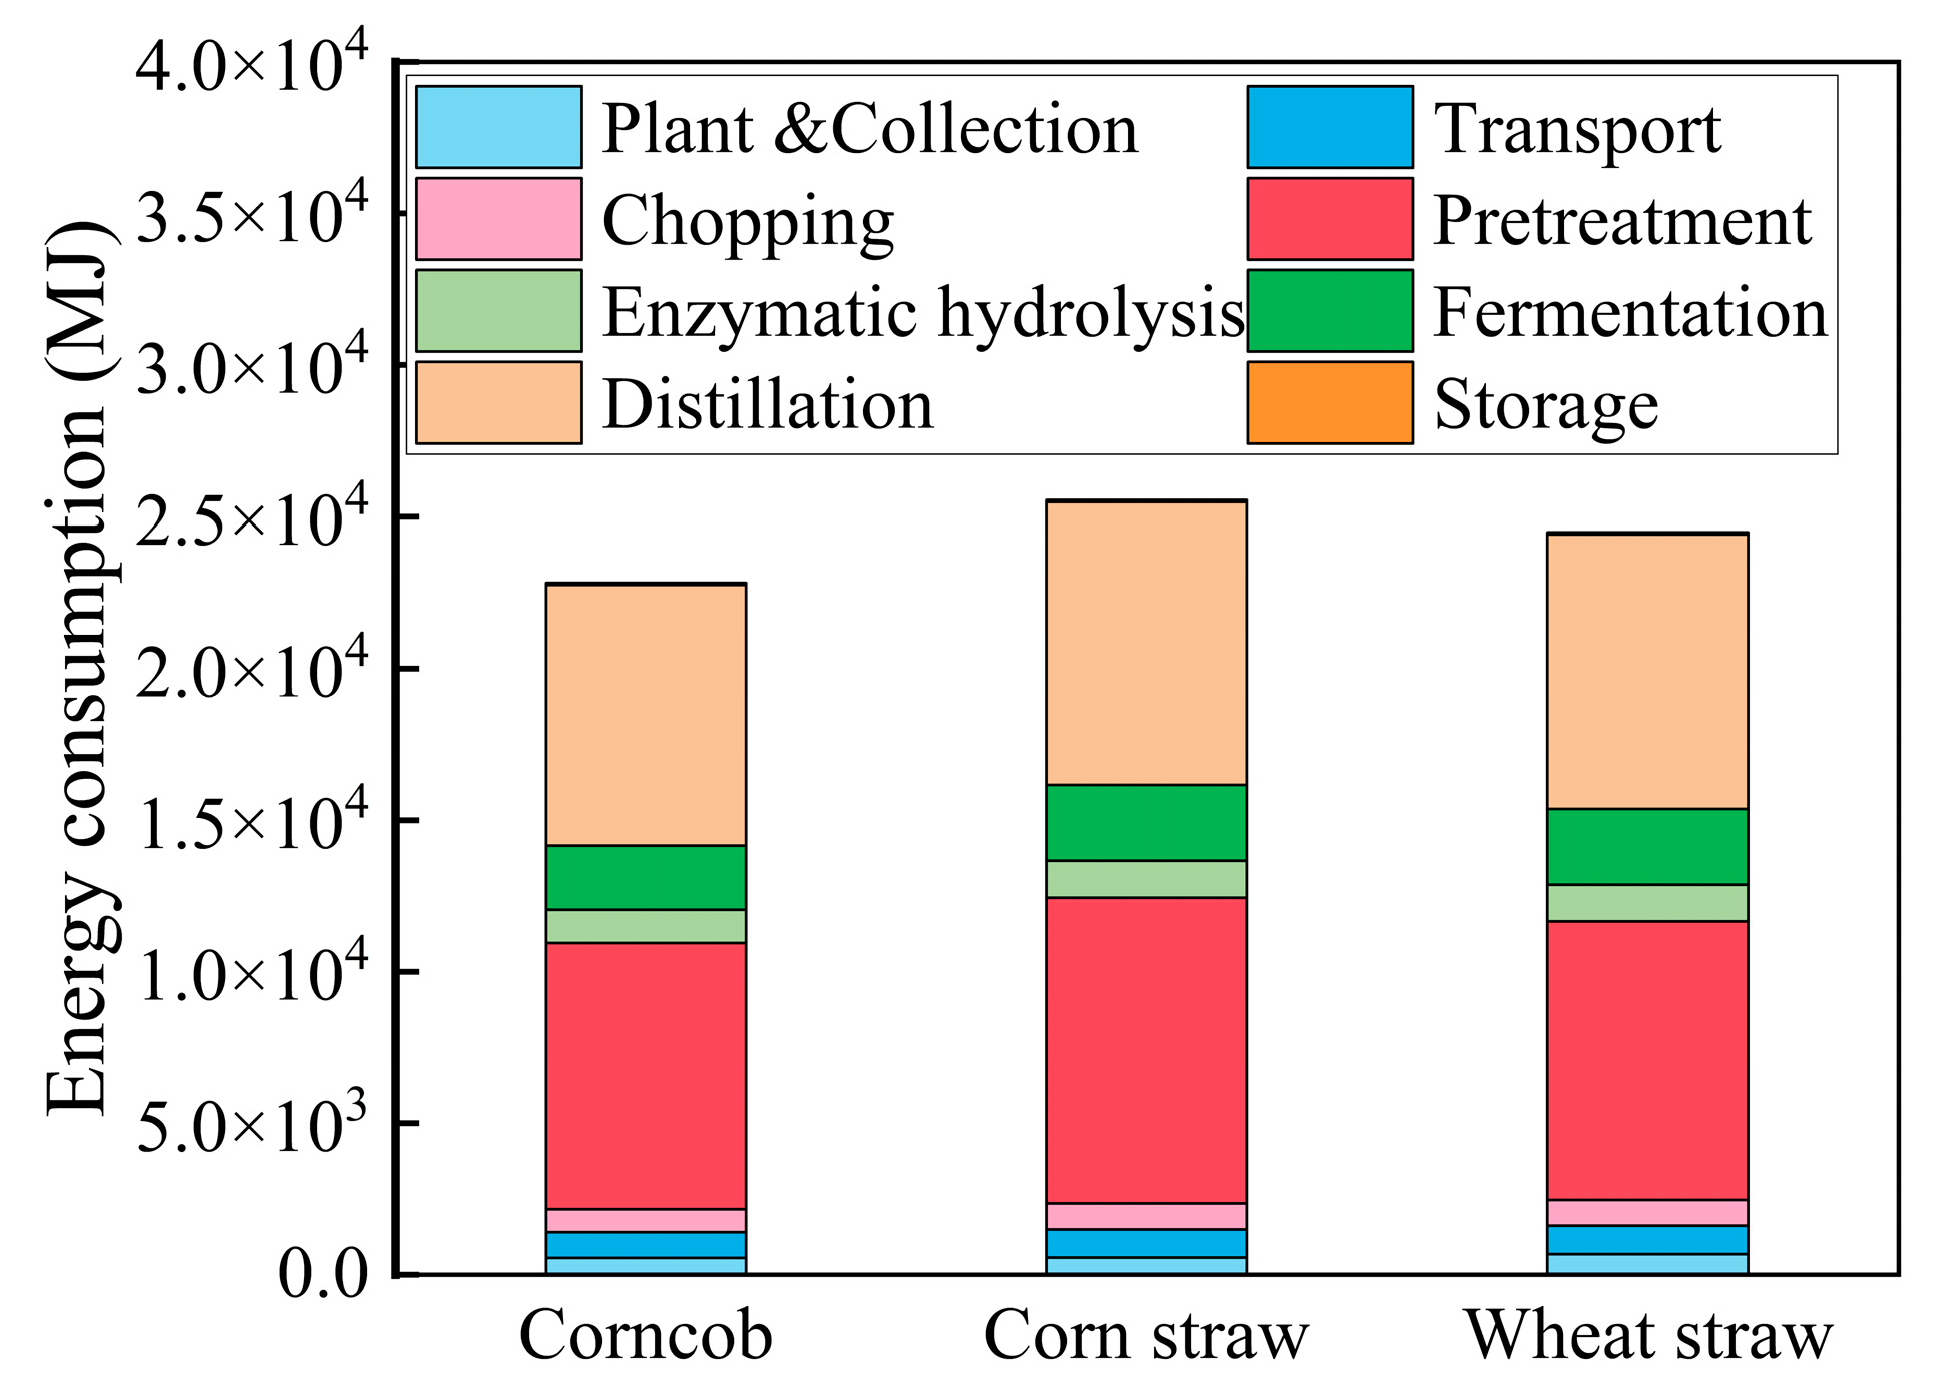
3.1. Energy Efficiency

As shown in Figure 3, the energy input for each unit process of bioethanol production is displayed. The energy calculation for each route is derived by summing up the total energy used in raw material cultivation and collection, raw material transportation, and bioethanol production. The energy input for producing bioethanol using corn cobs as a raw material is the smallest (22,797.90 MJ/Mg bioethanol), followed by wheat straw (24,463.94 MJ/Mg bioethanol), and corn straw (25,527.04 MJ/Mg bioethanol), which requires the most energy. This is because the process of producing bioethanol from corn stover requires the most steam, resulting in the input of the most energy.
Among them, the highest energy input occurs in the bioethanol production stage, because electricity and steam are required in the production process to maintain equipment operation and biomass conversion to produce bioethanol.
The energy generated by steam and electricity input in various stages of bioethanol production are compared. The pretreatment stage requires the most energy (accounting for 33.42–38.34% of the production stage), possibly due to the steam explosion of biomass to decompose cellulose, hemicellulose, and lignin. The next highest is the distillation stage (accounting for 32.68–35.40% of the production stage), as the distillation workshop needs a substantial amount of steam for distillation to purify bioethanol.
Table 7 shows that bioethanol produced from corn cobs has the highest net energy and net energy ratio. However, the net energy ratio is lower than that reported in the literature (NER:1.7–4.5), possibly because lignin and hemicellulose residues are converted into xylose and lignin products instead of being burnt to generate surplus electricity [18,37].

3.2. Environment Efficiency

The environmental impacts of bioethanol include the global warming potential (GWP), acidification potential (AP), eutrophication potential (EP), photochemical ozone creation potential (POCP), and human toxicity potential (HTP), with the assessment covering the cultivation and collection of biomass feedstocks, transportation, and production of bioethanol. Environmental impacts during the cultivation process are emissions generated from fertilizers, electricity, and diesel; during transportation, impacts arise from emissions due to diesel consumption; and during the production process, impacts are associated with the input of chemicals, electricity, and emissions involved in the production of bioethanol and high-value by-products.
The GWP has the greatest impact among the three types of environmental impacts. Figure 4a shows the impact of three raw materials on the GWP in the production of bioethanol. Among them, corn cobs as the raw material has the smallest impact on the GWP (1.75 × 10⁻²), followed by corn straw (1.96 × 10⁻²), and wheat straw (1.99 × 10⁻²), which has the greatest impact. The reason for this is that using corn cobs to produce bioethanol requires the least amount of chemicals and diesel input, resulting in lower CO2 and CH4 production. The GWP impact generated during the production stage of bioethanol is the greatest throughout the whole bioethanol process. Due to the indirect emissions of electricity, chemicals, and cellulase during the production process, as well as the direct emissions of CO2 during the production process, the CO2 emissions in bioethanol production increase. These are the main influencing factors that lead to an increased GWP. In the production of bioethanol, the pretreatment stage has the greatest impact (accounting for 34.10–38.84% of the production stage) due to the addition of chemicals and the use of electricity during the pretreatment process.
Figure 4b shows the impact of three raw materials on the production of bioethanol, with corn cobs as the raw material having the least impact on the AP (2.63 × 10⁻⁴), followed by corn straw (2.91 × 10⁻⁴), and wheat straw (2.98 × 10⁻⁴), which has the greatest impact. During this whole process, the production stage of bioethanol has the greatest impact on the AP. In the production of bioethanol, the pretreatment stage has the greatest impact (accounting for 40.92–41.39% of the production stage) due to the addition of chemicals during the pretreatment process.
Figure 4c shows the impact of three types of raw materials on the production of bioethanol, with corn cobs having the smallest impact on the production of bioethanol (1.02 × 10⁻²), followed by corn straw (1.15 × 10⁻²), and wheat straw (1.17 × 10⁻²), which has the greatest impact. During the whole process of bioethanol production, the EP has the greatest impact. In the production of bioethanol, the enzymatic hydrolysis stage has the greatest impact (accounting for 52.13–53.26% of the production stage), which is caused by the addition of cellulase during the enzymatic hydrolysis process [38]. Unlike with the GWP and AP, the proportion of corn cobs in the enzymatic hydrolysis stage of bioethanol production is the highest (53.26%), accounting for 49.00% of the whole process, fitting within the 40–50% range described by Espada et al. [39].
POCP has the smallest impact among the three types of environmental impacts. Figure 4d shows the impact of three types of raw material on the photochemical ozone creation potential (POCP) in the production of bioethanol. The production of bioethanol from corn cobs has the smallest impact on the POCP (3.19 × 10⁻⁸), followed by corn straw (3.43 × 10⁻⁸), and wheat straw (3.82 × 10⁻⁸), which has the greatest impact. During this whole process, the production stage of bioethanol has the greatest impact on POCP. In the production of bioethanol, the environmental impact of corn cob bioethanol production is greatest in the enzymatic hydrolysis stage (the enzymatic hydrolysis stage accounts for 36.13% of the production stage; the pretreatment stage accounts for 35.07% of the production stage); with corn straw, is in the pretreatment stage (pretreatment stage accounts for 35.60% of the production stage, enzymatic hydrolysis stage accounts for 35.29% of the production stage); and with wheat straw, pretreatment and enzymatic hydrolysis are basically the same (accounting for 35.34% of the production stage). This may be due to differences in the content of input chemicals and cellulase, with little difference in the environmental impact between pretreatment and enzymatic hydrolysis.
Figure 4e shows the impact of three types of raw materials on the production of bioethanol, with corn cobs having the smallest impact on the production of bioethanol (1.52 × 10⁻⁴), followed by corn straw (1.71 × 10⁻⁴), and wheat straw (1.74 × 10⁻⁴), which has the greatest impact. During the whole process, the stage of bioethanol production has the greatest impact on human toxicity potential (HTP). In the production of bioethanol, this stage has the greatest impact (accounting for 39.61–40.10% of the production stage) due to the addition of chemicals during the pretreatment process.
Calculations show that producing 1 Mg of bioethanol from corn cobs, corn straw, and wheat straw emits 1267.58 kg, 1418.36 kg, and 1444.30 kg of CO2, respectively. Comparing these emissions to those of gasoline products (94 gCO2/MJ), the greenhouse gas reductions are 54%, 49%, and 48%, respectively, similar to the 57% reduction calculated by Soam and 52–55% by Zhao et al. [14], and meeting the EU’s sustainability standard of an at least 35% reduction [7]. The calculations do not account for the carbon sequestration effect of the by-products (lignin and xylose). If the carbon content fixed by lignin and xylose is deducted, the reduction in greenhouse gases for bioethanol could reach 82%, exceeding the 60% reduction requirement proposed by the U.S. Environmental Protection Agency (EPA). The distribution of greenhouse gas emissions throughout the entire process of bioethanol production is illustrated in Figure 5.

3.3. Sensitivity Analysis and Uncertainty Analysis

The results of the life cycle assessment can be interpreted and improved through sensitivity analysis and uncertainty analysis [40].
The uncertainty in this study’s results is mainly from the uncertainty of the original data [41]. First, data uncertainty exists due to different sources of data acquisition. Data on fertilizers, diesel, electricity, and emissions are secondary data obtained from literature and yearbook reports, and these research data have inherent uncertainties that also exist in this study. Second, this study assumes that 1 MJ of bioethanol can replace 1 MJ of traditional fossil fuel, which may overestimate the carbon reduction amount due to the complexity of market mechanisms and human behavior, making it difficult to achieve a one-to-one replacement rate of bioethanol for gasoline [42]. Third, there are allocation challenges in the calculations; different allocation methods lead to variations in input–output results, thus affecting the accuracy of the results.
In a biorefinery, besides the main product bioethanol, xylose liquid, lignin, and steam are also produced, improving the economic efficiency of the biorefinery. Therefore, allocation is conducted during the production process, and different allocation methods can lead to varying results. The choice of allocation basis is a sensitive issue in life cycle assessment studies [43]. The main allocation methods include substitution, based on different characteristics of products (mass, energy, economic value), and a combined method [44]. Adopting economic allocation can yield more reasonable results. First, the market prices of lignin, xylose liquid, and ethanol were compared, with ethanol accounting for 87% in all cases. Then, a comprehensive economic allocation (market price × quantity) was adopted, with ethanol’s share being 70.5%, 69.52%, and 69.52%, respectively. Table 8 and Table 9 present the calculations of the environmental and energy impacts for ethanol production without allocation and with two different economic allocation methods. From the table, it can be seen that the comprehensive economic allocation method yields better environmental and energy benefits.

3.4. Comparison to the Combined Heat and Power Generation of Lignin

Due to the complex and stable chemical structure of lignin, its conversion into high-value chemicals is a challenging task. Therefore, most lignin is burned in boilers to recover heat and electricity, providing energy for the manufacturing process. Lignin residues can generate electricity and steam through a combined heat and power (CHP) system for the biorefinery’s own needs, with surplus energy (e.g., electricity) sold for economic gain. This also reduces the use of fossil fuels and lessens the environmental impact during the biorefining process [45].
As research on lignin intensifies and lignin conversion technologies improve, lignin can be processed into products for economic benefits. This process converts lignin into high-value products instead of burning it for energy in CHP systems, assuming only the electricity generated by the thermal power system is compared. The heating value of lignin is 22.9 MJ/kg, and the electricity heating value is 3.6 MJ/kWh with a 40% efficiency, requiring 0.11 kWh/kWh of electricity for heat and power equipment, generating 1159.17 kWh, 1407.56 kWh, and 1407.56 kWh of electricity [35,43,46]. The CO2 emissions from lignin combustion are calculated based on its chemical formula (C6H10O5)n with a 44% carbon content, and a C to CO2 ratio of 12/44, considering a lignin (65wt%) production of 1.4 Mg, 1.7 Mg, and 1.7 Mg in the three feedstocks, respectively. The CO2 emissions are calculated based on comprehensive economic allocation shares of 85.48%, 86.22%, and 86.47%.
According to Table 10, the energy efficiency of the lignin CHP system is comparable to using lignin as a product, slightly lower than the NER of 1.6 reported by LIU [47]. In terms of the economic and carbon reduction benefits, using lignin as a product is clearly superior to the CHP system, achieving a higher value utilization of biomass.

4. Conclusions

Through the calculation of the entire lifecycle of bioethanol, using corn cobs as feedstock for bioethanol production yields the best overall benefits, with a net energy balance (NEB) of 6902 MJ/Mg bioethanol and a net energy ratio (NER) of 1.30. The global warming potential (GWP) is 1.75 × 10⁻², acidification potential (AP) is 1.02 × 10⁻², eutrophication potential (EP) is 2.63 × 10⁻⁴, photochemical ozone creation potential (POCP) is 3.19 × 10⁻⁸, and human toxicity potential (HTP) is 1.52 × 10⁻⁴. The allocation during the calculation process influences the results. Using a comprehensive allocation method to distribute the cellulose and by-products yields the best overall benefits. Taking corn cobs as an example, the NEB is 13,213 MJ/Mg bioethanol, and the NER is 1.80. The GWP is 1.23 × 10⁻², AP is 7.19 × 10⁻³, EP is 1.85 × 10⁻⁴, POCP is 2.38 × 10⁻⁸, and HTP is 1.10 × 10⁻⁴.
Lignin from biomass, as a high-value product, not only has good economic benefits but also better energy and environmental benefits compared to the combined heat and power system, thereby achieving the efficient and sustainable utilization of biomass.
Overall, corn cobs offer the best environmental and energy benefits, but their annual production and utilization are much lower than straw. The environmental and energy benefits of bioethanol produced from corn straw and wheat straw are not significantly different from those of corn cobs. Therefore, straw and corn cobs can be mixed in proportion to achieve high-value utilization and comprehensive benefits. Based on the harvesting time (such as straw harvesting from June to July), a life cycle assessment model was constructed through statistical data. This study has achieved the high-value utilization of straw as agricultural and forestry waste and the green development of the bioethanol industry chain, with broad prospects.

Author Contributions

Conceptualization, T.H. and Z.Z.; methodology, T.Y. and X.L.; software, T.Y.; validation, X.L.; formal analysis, T.L. and Q.W.; investigation, T.Y. and X.L.; resources, T.H. and Z.Z.; data curation, T.Y.; writing—original draft preparation, T.Y. and Q.W.; writing—review and editing, T.H. and Z.Z.; visualization, T.Y.; supervision, T.H. and Z.Z.; project administration, T.H. and Z.Z.; funding acquisition, T.H. and Z.Z. All authors have read and agreed to the published version of the manuscript.

Funding

This research was funded by the National Key R&D Program of China (2021YFC2101605), Chinese Academy of Engineering (2022-PP-03).

Institutional Review Board Statement

Not applicable.

Informed Consent Statement

Informed consent was obtained from all subjects involved in the study.

Data Availability Statement

The data presented in this study are available on request from the corresponding author.

Conflicts of Interest

The authors declare no conflicts of interest.

References

  1. Hu, Y.; Du, H.; Xu, L.; Liang, C.; Zhang, Y.; Sun, Z.; Lin, C.S.K.; Wang, W.; Qi, W. Life cycle environmental benefits of recycling waste liquor and chemicals in production of lignocellulosic bioethanol. Bioresour. Technol. 2023, 390, 129855. [Google Scholar] [CrossRef]
  2. Yao, Y.; Xu, J.; Sun, D. Untangling global levelised cost of electricity based on multi-factor learning curve for renewable energy: Wind, solar, geothermal, hydropower and bioenergy. J. Clean. Prod. 2021, 285, 124827. [Google Scholar] [CrossRef]
  3. Zhou, X.; Li, G.; Liu, F.; Li, N. Production of ethanol from corn straw based on chemical looping gasification: Economic analysis. Bioresour. Technol. 2022, 360, 127568. [Google Scholar] [CrossRef]
  4. Feng, J.; Techapun, C.; Phimolsiripol, Y.; Phongthai, S.; Khemacheewakul, J.; Taesuwan, S.; Mahakuntha, C.; Porninta, K.; Htike, S.L.; Kumar, A.; et al. Utilization of agricultural wastes for co-production of xylitol, ethanol, and phenylacetylcarbinol: A review. Bioresour. Technol. 2024, 392, 129926. [Google Scholar] [CrossRef] [PubMed]
  5. Liu, F.; Guo, X.; Wang, Y.; Chen, G.; Hou, L. Process simulation and economic and environmental evaluation of a corncob-based biorefinery system. J. Clean. Prod. 2021, 329, 129707. [Google Scholar] [CrossRef]
  6. Prasad, S.; Singh, A.; Korres, N.E.; Rathore, D.; Sevda, S.; Pant, D. Sustainable utilization of crop residues for energy generation: A life cycle assessment (LCA) perspective. Bioresour. Technol. 2020, 303, 122964. [Google Scholar] [CrossRef] [PubMed]
  7. Zucaro, A.; Forte, A.; Fierro, A. Life cycle assessment of wheat straw lignocellulosic bio-ethanol fuel in a local biorefinery prospective. J. Clean. Prod. 2018, 194, 138–149. [Google Scholar] [CrossRef]
  8. Liu, F.; Short, M.D.; Alvarez-Gaitan, J.P.; Guo, X.; Duan, J.; Saint, C.; Chen, G.; Hou, L.A. Environmental life cycle assessment of lignocellulosic ethanol-blended fuels: A case study. J. Clean. Prod. 2020, 245, 118933. [Google Scholar] [CrossRef]
  9. Sivagurunathan, P.; Raj, T.; Mohanta, C.S.; Semwal, S.; Satlewal, A.; Gupta, R.P.; Puri, S.K.; Ramakumar, S.S.V.; Kumar, R. 2G waste lignin to fuel and high value-added chemicals: Approaches, challenges and future outlook for sustainable development. Chemosphere 2021, 268, 129326. [Google Scholar] [CrossRef]
  10. Morales, M.; Arvesen, A.; Cherubini, F. Integrated process simulation for bioethanol production: Effects of varying lignocellulosic feedstocks on technical performance. Bioresour. Technol. 2021, 328, 124833. [Google Scholar] [CrossRef]
  11. Rinke Dias De Souza, N.; Colling Klein, B.; Ferreira Chagas, M.; Cavalett, O.; Bonomi, A. Towards Comparable Carbon Credits: Harmonization of LCA Models of Cellulosic Biofuels. Sustainability 2021, 13, 10371. [Google Scholar] [CrossRef]
  12. Wang, X.; Guo, L.; Lv, J.; Li, M.; Huang, S.; Wang, Y.; Ma, X. Process design, modeling and life cycle analysis of energy consumption and GHG emission for jet fuel production from bioethanol in China. J. Clean. Prod. 2023, 389, 136027. [Google Scholar] [CrossRef]
  13. Borrion, A.L.; McManus, M.C.; Hammond, G.P. Environmental life cycle assessment of lignocellulosic conversion to ethanol: A review. Renew. Sust. Energy Rev. 2012, 16, 4638–4650. [Google Scholar] [CrossRef]
  14. Zhao, L.; Ou, X.; Chang, S. Life-cycle greenhouse gas emission and energy use of bioethanol produced from corn stover in China: Current perspectives and future prospectives. Energy 2016, 115, 303–313. [Google Scholar] [CrossRef]
  15. Wei, L.; Yang, H.; Niu, Y.; Zhang, Y.; Xu, L.; Chai, X. Wheat biomass, yield, and straw-grain ratio estimation from multi-temporal UAV-based RGB and multispectral images. Biosyst. Eng. 2023, 234, 187–205. [Google Scholar] [CrossRef]
  16. Lyu, H.; Zhang, J.; Zhai, Z.; Feng, Y.; Geng, Z. Life cycle assessment for bioethanol production from whole plant cassava by integrated process. J. Clean. Prod. 2020, 269, 121902. [Google Scholar] [CrossRef]
  17. Pang, B.; Sun, Z.; Wang, L.; Chen, W.; Sun, Q.; Cao, X.; Shen, X.; Xiao, L.; Yan, J.; Deuss, P.J.; et al. Improved value and carbon footprint by complete utilization of corncob lignocellulose. Chem. Eng. J. 2021, 419, 129565. [Google Scholar] [CrossRef]
  18. Soam, S.; Kapoor, M.; Kumar, R.; Borjesson, P.; Gupta, R.P.; Tuli, D.K. Global warming potential and energy analysis of second generation ethanol production from rice straw in India. Appl. Energy 2016, 184, 353–364. [Google Scholar] [CrossRef]
  19. Nation Development and Reform Commission. Compilation of National Agricultural Product Cost Benefit Information 2022; China Statistics Press: Beijing, China, 2022; pp. 128–134. [Google Scholar]
  20. He, R.; Dong, J.; Zhang, X.; Zheng, F.; Hu, Z. Dynamic Analysis of the Carbon Footprint in Winter Wheat Production Based on Lifecycle Assessment and the LMDI Model: A Case Study of Jiangsu Province in China. Sustainability 2023, 15, 12396. [Google Scholar] [CrossRef]
  21. Jayasundara, P.M.; Jayasinghe, T.K.; Rathnayake, M. Process Simulation Integrated Life Cycle Net Energy Analysis and GHG Assessment of Fuel-Grade Bioethanol Production from Unutilized Rice Straw. Waste Biomass Valori. 2022, 13, 3689–3705. [Google Scholar] [CrossRef]
  22. Huang, H.; Ramaswamy, S.; Al-Dajani, W.; Tschirner, U.; Cairncross, R.A. Effect of biomass species and plant size on cellulosic ethanol: A comparative process and economic analysis. Biomass Bioenergy 2009, 33, 234–246. [Google Scholar] [CrossRef]
  23. Miao, B. Life cycle energy efficiency evaluation of cellulose ethanol. Biotechnol. Bus. 2018, 41–44. [Google Scholar] [CrossRef]
  24. Toor, M.; Kumar, S.S.; Malyan, S.K.; Bishnoi, N.R.; Mathimani, T.; Rajendran, K.; Pugazhendhi, A. An overview on bioethanol production from lignocellulosic feedstocks. Chemosphere 2020, 242, 125080. [Google Scholar] [CrossRef] [PubMed]
  25. Sreekumar, A.; Shastri, Y.; Wadekar, P.; Patil, M.; Lali, A. Life cycle assessment of ethanol production in a rice-straw-based biorefinery in India. Clean. Technol. Environ. 2020, 22, 409–422. [Google Scholar] [CrossRef]
  26. Yu, Y.; Wu, J.; Ren, X.; Lau, A.; Rezaei, H.; Takada, M.; Bi, X.; Sokhansanj, S. Steam explosion of lignocellulosic biomass for multiple advanced bioenergy processes: A review. Renew. Sust. Energy Rev. 2022, 154, 111871. [Google Scholar] [CrossRef]
  27. Candido, R.G.; Mori, N.R.; Gonçalves, A.R. Sugarcane straw as feedstock for 2G ethanol: Evaluation of pretreatments and enzymatic hydrolysis. Ind. Crop Prod. 2019, 142, 111845. [Google Scholar] [CrossRef]
  28. Cotana, F.; Cavalaglio, G.; Gelosia, M.; Coccia, V.; Petrozzi, A.; Ingles, D.; Pompili, E. A comparison between SHF and SSSF processes from cardoon for ethanol production. Ind. Crop Prod. 2015, 69, 424–432. [Google Scholar] [CrossRef]
  29. Paulova, L.; Patakova, P.; Branska, B.; Rychtera, M.; Melzoch, K. Lignocellulosic ethanol: Technology design and its impact on process efficiency. Biotechnol. Adv. 2015, 33, 1091–1107. [Google Scholar] [CrossRef]
  30. Hossain, N.; Zaini, J.; Indra Mahlia, T.M. Life cycle assessment, energy balance and sensitivity analysis of bioethanol production from microalgae in a tropical country. Renew. Sustain. Energy Rev. 2019, 115, 109371. [Google Scholar] [CrossRef]
  31. Soam, S.; Kumar, R.; Gupta, R.P.; Sharma, P.K.; Tuli, D.K.; Das, B. Life cycle assessment of fuel ethanol from sugarcane molasses in northern and western India and its impact on Indian biofuel programme. Energy 2015, 83, 307–315. [Google Scholar] [CrossRef]
  32. Cueva Zepeda, L.; Griffin, G.; Shah, K.; Al-Waili, I.; Parthasarathy, R. Energy potential, flow characteristics and stability of water and alcohol-based rice-straw biochar slurry fuel. Renew. Energy 2023, 207, 60–72. [Google Scholar] [CrossRef]
  33. Jiao, J.; Li, J.; Bai, Y. Uncertainty analysis in the life cycle assessment of cassava ethanol in China. J. Clean. Prod. 2019, 206, 438–451. [Google Scholar] [CrossRef]
  34. Rodrigues, T.G.; Machado, R.L. Life Cycle Assessment of the Sugarcane Supply Chain in the Brazilian Midwest Region. Sustainability 2024, 16, 285. [Google Scholar] [CrossRef]
  35. Martinez-Hernandez, E.; Ibrahim, M.H.; Leach, M.; Sinclair, P.; Campbell, G.M.; Sadhukhan, J. Environmental sustainability analysis of UK whole-wheat bioethanol and CHP systems. Biomass Bioenergy 2013, 50, 52–64. [Google Scholar] [CrossRef]
  36. Xunfeng, X.; Jun, Z.; Beidou, X. Evaluation and Policy Research of Fuel Ethanol Based on Life Cycle; China Environmental Press: Beijing, China, 2011; pp. 77–81. [Google Scholar]
  37. Wang, M.; Han, J.; Dunn, J.B.; Cai, H.; Elgowainy, A. Well-to-wheels energy use and greenhouse gas emissions of ethanol from corn, sugarcane and cellulosic biomass for US use. Environ. Res. Lett. 2012, 7, 45905–45913. [Google Scholar] [CrossRef]
  38. Nogueira, G.P.; Capaz, R.S.; Franco, T.T.; Dias, M.O.S.; Cavaliero, C.K.N. Enzymes as an environmental bottleneck in cellulosic ethanol production: Does on-site production solve it? J. Clean. Prod. 2022, 369, 133314. [Google Scholar] [CrossRef]
  39. Espada, J.J.; Villalobos, H.; Rodríguez, R. Environmental assessment of different technologies for bioethanol production from Cynara cardunculus: A Life Cycle Assessment study. Biomass Bioenergy 2021, 144, 105910. [Google Scholar] [CrossRef]
  40. Li, J.; Tian, Y.; Xie, K. Coupling big data and life cycle assessment: A review, recommendations, and prospects. Ecol. Indic. 2023, 153, 110455. [Google Scholar] [CrossRef]
  41. Yang, Y.; Liang, S.; Yang, Y.; Xie, G.H.; Zhao, W. Spatial disparity of life-cycle greenhouse gas emissions from corn straw-based bioenergy production in China. Appl. Energy 2022, 305, 117854. [Google Scholar] [CrossRef]
  42. Yang, Y. Two sides of the same coin: Consequential life cycle assessment based on the attributional framework. J. Clean. Prod. 2016, 127, 274–281. [Google Scholar] [CrossRef]
  43. Hiloidhari, M.; Haran, S.; Banerjee, R.; Rao, A.B. Life cycle energy–carbon–water footprints of sugar, ethanol and electricity from sugarcane. Bioresour. Technol. 2021, 330, 125012. [Google Scholar] [CrossRef] [PubMed]
  44. Cherubini, F.; Strømman, A.H.; Ulgiati, S. Influence of allocation methods on the environmental performance of biorefinery products—A case study. Resour. Conserv. Recycl. 2011, 55, 1070–1077. [Google Scholar] [CrossRef]
  45. Awasthi, M.K.; Sindhu, R.; Sirohi, R.; Kumar, V.; Ahluwalia, V.; Binod, P.; Juneja, A.; Kumar, D.; Yan, B.; Sarsaiya, S.; et al. Agricultural waste biorefinery development towards circular bioeconomy. Renew. Sustain. Energy Rev. 2022, 158, 112122. [Google Scholar] [CrossRef]
  46. Cherubini, F.; Ulgiati, S. Crop residues as raw materials for biorefinery systems—A LCA case study. Appl. Energy 2010, 87, 47–57. [Google Scholar] [CrossRef]
  47. Liu, F.; Chen, G.; Yan, B.; Ma, W.; Cheng, Z.; Hou, L. Exergy analysis of a new lignocellulosic biomass-based polygeneration system. Energy 2017, 140, 1087–1095. [Google Scholar] [CrossRef]
Figure 1. System boundary diagram.
Sustainability 16 01788 g001
Figure 2. Process flowchart. (a) Ethanol production process flowchart, (b) distillation process flowchart.
Sustainability 16 01788 g002
Figure 3. Energy consumption in the ethanol production process.
Sustainability 16 01788 g003
Figure 4. Environmental impact of each stage. (a) GWP, (b) AP, (c) EP, (d) POCP, (e) HTP.
Sustainability 16 01788 g004
Figure 5. Greenhouse gas emissions in each stages.
Sustainability 16 01788 g005
Table 1. Calculation of distribution ratio.
Price
($)
Grass Grain RatioRatio
Corn356.32 72.65%
Corn straw70.901.73 *25.01%
Corn cob76.460.15 [17]2.34%
Wheat347.56 78.21%
Wheat straw70.901.34 *21.79%
* from moa.gov.cn (format: 12 July 2023).
Table 2. Input list for planting and collecting phase of production of 1 t bioethanol.
Raw MaterialsCorn CobCorn StrawWheat Straw
Nitrogenous fertilizer
(kg)
8.238.3622.61
Phosphate fertilizer
(kg)
0.610.620.75
Potassium fertilizer
(kg)
0.040.050.05
Diesel fuel
(kg)
11.2011.3813.29
Electricity
(kWh)
33.7334.2647.39
Insecticide
(kg)
0.150.150.27
Herbicide
(kg)
0.410.410.24
Table 3. The amount of diesel required for transporting the raw materials for producing 1 Mg bioethanol [23].
Transportation Volume
(Mg)
Distance
(km)
Consumption
(L)
Density
(kg/L)
Fuel Volume
(Mg)
Corn cob5.241000.050.852.21 × 10−2
Corn straw5.691000.050.852.42 × 10−2
Wheat straw5.711000.050.852.42 × 10−2
Table 4. Input and output of bioethanol production.
Corn CobCorn StrawWheat Straw
Input
Biomass raw materials
(dry basis)
(Mg)
5.245.695.71
Sulfuric acid
(Mg)
0.0470.0550.053
Primary steam
(Mg)
8.338.978.76
Process water
(Mg)
29.4430.8330.92
Sodium hydroxide
(Mg)
0.0390.0450.043
Cellulase
(Mg)
0.0790.0850.085
Yeast
(Mg)
0.0003400.0003500.000345
Electricity
(kWh)
110012501250
Output
Ethanol
(Mg)
1.001.001.00
Lignin (dry basis)
(Mg)
1.431.711.73
Xylose solution
(Mg)
18.8119.1418.81
Recycling water vapor
(Mg)
1.821.741.98
Wastewater
(Mg)
19.5221.3121.38
CO2
(Mg)
0.960.960.96
Table 5. Energy efficiency for the bioethanol production [18,31].
Energy
(MJ/Mg)
Diesel fuel3.86 × 104
Primary steam2.69 × 103
Electricity
(kWh)
3.60
Table 6. Common substances and characterization factors for impact categories used [35,36].
SubstanceGWP
(kg CO2 eq) a
AP
(kg SO2 eq) b
EP
(kg PO43− eq) c
POCP
(kg C2H4 eq) d
HTP
(kg 1,4-DB eq) e
CO21
CH425 0.007
N2O298 0.27
CO2 0.012
NOX 0.70.1 0.78
SOX 2 1.2
SO2 1
PO43- 1
eq: equivalent; a: GWP uses CO2 as a reference, with a CO2 coefficient of 1. b: AP uses SO2 as a reference, with a SO2 coefficient of 1. c: EP uses PO43− as a reference, with a PO43− coefficient of 1. d: POCP uses C2H4 as a reference, with a coefficient of 1. e: HTP uses 1,4-DB as a reference.
Table 7. Ethanol net energy and net energy ratio.
Corn CobCorn StrawWheat Straw
NEB
(MJ/Mg)
6902.104172.965236.06
NER1.301.161.21
Table 8. Energy benefit comparison.
Distribution Method:Corn CobCorn StrawWheat Straw
NEB
(MJ/Mg)
NERNEB
(MJ/Mg)
NERNEB
(MJ/Mg)
NER
Unallocated69021.3041721.1652361.21
Economic distribution11,0901.6087941.4298241.49
Comprehensive allocation13,2131.8011,4971.6312,1991.70
Table 9. Comparison of environmental impact.
Distribution Method:GWPGHG ReductionAPEPPOCPHTP
Corn cobUnallocated1.75 × 10−254%1.02 × 10−22.63 × 10−43.19 × 10−81.52 × 10−4
Economic distribution1.53 × 10−260%8.90 × 10−32.30 × 10−42.83 × 10−81.33 × 10−4
Comprehensive allocation1.23 × 10−266%7.19 × 10−31.85 × 10−42.38 × 10−81.10 × 10−4
Corn strawUnallocated1.96 × 10−249%1.15 × 10−22.91 × 10−43.43 × 10−81.71 × 10−4
Economic distribution1.71 × 10−255%1.00 × 10−22.54 × 10−43.16 × 10−81.50 × 10−4
Comprehensive allocation1.36 × 10−263%8.00 × 10−32.02 × 10−42.62 × 10−81.22 × 10−4
Wheat strawUnallocated1.99 × 10−248%1.17 × 10−22.98 × 10−43.82 × 10−81.74 × 10−4
Economic distribution1.74 × 10−254%1.02 × 10−22.60 × 10−43.42 × 10−81.53 × 10−4
Comprehensive allocation1.38 × 10−262%8.13 × 10−32.07 × 10−42.89 × 10−81.26 × 10−4
Table 10. Comparison between lignin products and electricity.
Lignin ProductsElectricity
Corn CobCorn StrawWheat StrawCorn CobCorn StrawWheat Straw
NEB
(MJ/Mg)
10,6888797872810,67987368820
NER1.561.421.421.561.411.41
GHG reduction66%63%62%29%19%17%
Economy135916241648811985985
Disclaimer/Publisher’s Note: The statements, opinions and data contained in all publications are solely those of the individual author(s) and contributor(s) and not of MDPI and/or the editor(s). MDPI and/or the editor(s) disclaim responsibility for any injury to people or property resulting from any ideas, methods, instructions or products referred to in the content.

