Article

Resource Intensity Analysis of Producing 21 Types of Plastic in Terms of Mining Activity

1
Department of Mechanical Engineering, College of Science and Engineering, Ritsumeikan University, Shiga 525-8577, Japan
2
Research Institute for Humanity and Nature, Kyoto 603-8047, Japan
3
Global Innovation Research Organization, Ritsumeikan University, Noji-Higashi 1-1-1, Kusatsu-shi, Shiga 525-8577, Japan
*
Author to whom correspondence should be addressed.
Sustainability 2024, 16(7), 2715; https://doi.org/10.3390/su16072715
Submission received: 29 January 2024 / Revised: 18 March 2024 / Accepted: 20 March 2024 / Published: 26 March 2024

Abstract

:
Material flow analysis of plastics has attracted considerable attention for achieving sustainable production and consumption. However, the direct weights of each plastic have been analyzed alone, not considering the amount of natural resources as inputs for plastic production. Therefore, we analyzed the cradle-to-gate resource intensity of 21 types of plastics in terms of mining activity, using the total material requirement under the life cycle concept. It was found that the resource use for plastic production differs by up to approximately 10 times depending on the plastic type. By applying these findings to the material flow analysis of some countries and regions, we found that the quantity of natural resources was more than 20 times the original weight attributed to plastic production. By comparing resource use with greenhouse gas emissions, plastics with higher greenhouse gas emissions were found to have higher resource use, indicating a positive correlation, whereas the opposite trend was also found for some plastics. Considering plastic alternatives, we found that the quantity of natural resources in plastic-based shopping bags is nearly equivalent to that in paper-based bags, whereas that in plastic-based straws is greater than that in paper-based bags. Focusing only on the direct weight of plastic may mislead the decision-making process.

1. Introduction

Industries have contributed to society by producing and supplying high-quality products that meet human demands [1]. However, current production patterns are not environmentally sustainable [2]. Production focusing only on profit has caused many environmental issues, such as the depletion of fossil fuels; anthropogenic environmental deterioration, including water, soil, and air pollution; climate change; and non-degradable solid waste [3]. Material management has received considerable attention in recent years [4].
Plastics are essential materials in modern society owing to their high durability, ease of molding, high corrosion resistance, low cost, light weight, and high machinability [5,6]. Plastics are used in a variety of industries such as packaging, construction, textiles, consumer and institutional products, transportation, electrical and electronics, and industrial machinery. The demand for plastics has increased annually by 4% [7]. Plastic production reached 0.36 billion tons in 2018 and is expected to exceed 0.50 billion tons by 2025 [8], which is 250 times greater than the 20,000 tons of plastic produced in 1950 [9].
The increasing global demand for plastics causes environmental issues, such as the generation of significant amounts of plastic waste and greenhouse gas (GHG) emissions [5,10]. Global plastic waste amounted to 275 million tons in 2010 and is expected to grow [9]. Plastic waste dispersed as garbage eventually flows into the ocean because of unsound waste management practices [11]. Jambeck et al. estimated that 4.8–12.7 Mt of plastic waste entered oceans globally in 2010 [12]. Marine plastic pollution can cause species entanglement, leading to starvation, suffocation, laceration, infection, reduced reproductive success, and mortality [13]. In addition, the petrochemical sector, a producer of plastics, currently accounts for 17% of global industrial GHG emissions [10]. It is the third-largest CO2-emitting industry after steel and cement production [14].
Various policies and actions have been implemented worldwide to mitigate these environmental problems. For example, natural and culturally protected areas in Peru plan to ban single-use plastics, and the European Union Parliament has approved reductions in single-use plastics [15]. The Honolulu Strategy in Canada, the U.S., and other countries has implemented policies, regulations, and legislation to reduce marine plastic pollution [16].
The sustainable production and consumption of plastics is a particularly promising approach to address these environmental problems. Although a new research trend in terms of plastic use in the context of a circular economy [17] (e.g., bioplastics [18], recycling [19], social behavior [20], and design [21]) is in its infancy, the current production and consumption of plastics has remained unsustainable owing to over-production and over-consumption [22,23].
To achieve sustainable production, consumption, and efficient resource consumption, it is necessary to understand the flow of plastics using an economy-wide approach [24]. Material flow analysis (MFA) of plastics has been conducted to analyze a detailed picture of the flow of general plastics in various countries, such as Austria [24], the Netherlands [25], India [26], Serbia [27], Thailand [28], South Africa [29], and Bangladesh [30]. These studies analyzed the flow of plastics from production and consumption to waste management, including recycling, in each country and revealed the percentage of plastic consumption by sector and landfill volume.
The MFA of each plastic type has gained attention as a more detailed flow of general plastics. Plastics can be divided into the following seven major categories: polyethylene terephthalate (PET), high-density polyethylene (HDPE), polyvinyl chloride (PVC), low-density polyethylene (LDPE), polypropylene (PP), polystyrene (PS), and others [31]. Each type of plastic has unique characteristics and uses [32]. MFA has been applied to understand the flow of each type of plastic in various countries and regions, such as the United Kingdom [10], the United States [33], the EU [34], Germany [35], and China [36]. These studies showed that the type of plastic input tends to vary among countries, with many countries having high inputs of PP, PE (including LDPE and HDPE), and PVC, whereas China has the highest input of PET.
However, these studies focused only on the direct weight of each plastic in the production stage, without considering the amount of natural resources required to produce each type of plastic. Because various plastics are made from natural resources, such as crude oil, in different amounts for different types of plastics [33], significant amounts of natural resources have been used as inputs for the production of plastics [37]. Each type of plastic has a different scale of environmental impact, owing to its different production processes [32,38]. Similar to the assessment of environmental impacts, each type of plastic production is expected to require different amounts of natural resources. The lack of consideration of natural resources hidden behind plastic production may not lead to truly sustainable production, consumption, and efficient resource consumption. To identify the difference between each type of plastic’s intensity when considering the resources of plastic production, the amount of natural resources as input for each type of plastic production was considered in this study.
To evaluate the cradle-to-gate natural resources used as inputs for plastic production, the scale of mining activities was measured as an indicator of natural resource use. Because natural resources can be obtained through the exploitation process originating from mining activities, the quantification of the scale of mining activities may reflect the true extent of natural mineral resource extraction [39]. In addition, mining activities involved in the development of natural resources exert significant environmental and ecological pressures through the generation of mine waste, which is defined as unused mining [40,41]. Mining activities are a type of anthropogenic land use [42] that have been widely assessed in terms of land occupation [43,44] and land conversion areas [45,46]. However, this approach does not consider the depth of the mine [39]. The measurement of land area (m2) alone cannot fully quantify the total natural resource exploitation caused by mining activities [40]. The scale of mining activities, expressed in the form of weight, has been used as an indicator to measure the natural resource use caused by mining activities [47].
This is consistent with the concept of total material requirements (TMRs) [40], which is an indicator used to assess resource use. TMR considers not only direct material inputs, but also indirect material inputs and hidden flows, such as mine waste from mining activities [48,49,50,51] and can quantify the amount of mining activities [39]. The inclusion of indirect resources used as inputs and hidden flows generated by the process is based on the concept of life cycle thinking [41]. Although various indicators have been used to measure resource use [52], TMR is considered the most comprehensive because of the wide range of boundaries used for the amount of resources involved [48,53]. Therefore, in this study, TMR was employed to quantify the amount of natural resources required for plastic production.
The objective of this study is to clarify the differences in the amount of natural resources as input for each type of plastic production by analyzing the cradle-to-gate resource intensity of various plastics in terms of mining activity under the life cycle thinking (LCT). This study identified the true burden of natural resource use attributed to plastic production, which assists in developing sustainable patterns of plastic production and consumption.

2. Methodology

2.1. Total Material Requirement

This study is a starting point for a cradle-to-gate LCA of plastics from the perspective of TMR. An overview of the concept of TMR for plastic production is presented in Figure 1.
The T M R of plastics is represented as a functional unit of mass, measured in kilograms. Here, resource intensity refers to the total amount of all resources that need to be input to produce 1 kg of plastic, hereafter referred to as the s p e c i f i c   T M R (kg-TMR/kg). The T M R is expressed using the following equation based on the s p e c i f i c   T M R and the direct amount of material (kg):
T M R = s p e c i f i c   T M R × d i r e c t   q u a n t i t y
The s p e c i f i c   T M R of a given product is then obtained in the following equation.
S y = ( S x × W x ) W y + 1
where the s p e c i f i c   T M R and weight of the input materials are S x and W x , respectively, and the s p e c i f i c   T M R and weight of the output materials are S y and W y , respectively. This equation implies that the s p e c i f i c   T M R is always greater than 1 kg-TMR/kg because the T M R includes the weight of the output material itself.
The data on the specific TMR for the raw materials were obtained from previous studies. The specific TMR for fossil fuels such as oil and natural gas, their combustion energy, and electric power were obtained from a study by Nakajima et al. [54]. Specific TMR data for the metal ores were obtained from Halada et al. [55].
To compare the differences between each plastic in terms of resource intensity and material properties, the specific TMR per tensile strength was calculated. This has attracted attention in the evaluation of environmental impacts on material functions under the life cycle concept [56]. Xia et al. evaluated the environmental impact of plastics from the perspective of tensile strength as a material property [57]. Data on the tensile strength of each plastic were obtained from a previous study [58]. Data on the tensile strength of each plastic were obtained from a previous report [58].

2.2. Inventory Data

In this study, the inventory data used to produce plastics were obtained from Multiple Interface Life Cycle Assessment software (MiLCA) 2.3 (Sustainable), an LCA support software, and the Inventory Database for Environmental Analysis (IDEA) 2.3, which provides an inventory database applied to MiLCA 2.3 as the standard equipment. The IDEA has more than 3800 process data sets based on the Japan Standard Commodity Classification (AIST, 2020), with data on the Japanese average.
Plastics are primarily manufactured from naphtha, which is produced by refining crude oil. The naphtha is then heat-treated in a process called “cracking,” where it is converted primarily into ethylene and propylene [59]. These materials can be combined to form a variety of polymers. For example, polypropylene (PP), one of the main plastics, is produced by polymerizing propylene with a small amount of ethylene in contact with a catalyst with polymerization activity [60]. The polypropylene powder produced during the polymerization was pelletized.
The IDEA models these manufacturing processes using a chemical process simulator and calculates the input amounts of raw materials and energy for plastics. Thus, the use of MiLCA 2.3 and IDEA 2.3 enables us to trace back to the primary source of plastic production.

2.3. Target for Evaluation

In this study, the following 21 types of plastics were evaluated: polypropylene (PP), polyvinyl chloride (PVC), low-density polyethylene (LDPE), polystyrene (PS), high-density polyethylene (HDPE), PET, polycarbonate (PC), phenol resin (PF), polyamide resin (PA), polyvinyl alcohol (PVA), polyurethane (PU), acrylic resin (PMMA), unsaturated polyester resin (UP), epoxy resin (EP), polybutylene terephthalate (PBT), polyacetal (POM), melamine resin (MF), alkyd resin (ALD), urea resin (UF), polyphenylene sulfide (PPS), and fluorine resin (FR).

3. Results

The specific TMR per unit weight for the 21 types of plastics is shown in Figure 2. The specific TMR differed by up to approximately 10 times depending on the type of plastic, such as PA (72.3 kg-TMR/kg) and UF (7.73 kg-TMR/kg). The specific TMRs of PA, PC, and FR were remarkably larger than those of the other plastics. PA production involves large inputs of basic petrochemicals consisting of ethylene, propylene, and aromatics [61], which have a large specific TMR and account for more than 70% of the total. PC production involves large inputs of bisphenol A [62], which has a large specific TMR, accounting for more than 30% of the total. The production of FR involves large inputs of various combustion energies, such as steam coal, petroleum hydrocarbon gas, and fuel oil. The details of the calculation process for the 21 types of plastics are presented in the Supplementary Materials.
Based on the breakdown, crude oil accounts for the largest share of the specific TMR of most plastics, with an average share of over 40%, as plastics are classified as petrochemicals [63]. FR had the largest percentage of steam coal, whereas MF and UF had the largest percentages of natural gas. Natural gas is used to produce urea, a raw material used for UF [64]. EP, ALD, PU, and UP had the largest percentages of limestone compared to the other plastics. Limestone was used to produce epichlorohydrin as a raw material for EP and propylene oxide as a raw material for PU. The other minerals included fluorite. The amount of these natural resources as inputs is not large, whereas FR, for which fluorite is the raw material, has an input volume approximately 20,000 times greater than that of other plastics.
A comparison of the specific TMR per tensile strength with the specific TMR of the 19 types of plastics is shown in Figure 3. Since we thought that it was important to obtain data from the same report, we excluded ALD and PVA from this analysis. A different trend of the specific TMR per tensile strength was observed compared to that of the specific TMR per weight. For instance, the specific TMR per weight of PA is the highest among all plastics, whereas the specific TMR per tensile strength of PA is relatively low. The PA (PA 6 and PA 6.6) exhibited excellent physical and mechanical properties, including tensile strength [65]. Owing to these characteristics, PA is a major engineering thermoplastic produced primarily for the mass consumption of fibers [66]. Considering the tensile strength, the resources used for the production of PA should be acceptable. PVC, LDPE, and HDPE, which are often consumed, are more intensive in terms of resource use when tensile strength is considered. The specific TMR per tensile strength differs by up to about 15 times depending on the types of plastic, such as FR (1.28 kg-TMR/kg/MPa) and UF (0.0869 kg-TMR/kg/MPa). The specific TMR per unit tensile strength of FR, which has a greater specific TMR and a relatively small tensile strength, is the highest, and that of UF, which has the smallest specific TMR, is the lowest.

4. Discussion

It was found that natural resource use as an input for production differs depending on the type of plastic, with, at most, a 10-fold difference. This result was further examined in terms of economy-wide material flow, greenhouse gas emissions, and plastic alternatives.

4.1. Application of TMR to Material Flow Analysis

In most existing studies, the direct weight was used as an indicator of the MFA of plastics, and the production quantity of different plastics was summed without weighting, whereas the natural resource use as input for plastic production was different. To identify the differences by country in the relationship between direct plastic weight and the amount of natural resources as inputs behind plastic production at the national level, this study conducted a comparative analysis of the direct weight and TMR of plastic. We investigated the direct weight of each type of plastic in China in 2020 [36], Japan in 2021 [67], South Africa in 2017 [29], the EU in 2021 [68], and the world in 2021 [68] and calculated the TMR per direct weight on a national scale, as shown in Figure 4a. Owing to data limitations in the production amount of all types of plastics in various countries, PP, PVC, LDPE, PS, HDPE, and PET, which are the main plastic types, were targeted here.
The economy-wide TMR per direct weight is approximately 20 kg-TMR/kg, which means that the quantity of natural resources that is nearly 20 times as heavy as the original weight can be attributed to plastic production. Because PA, PC, and FR, which are not included in this assessment owing to limitations of accessible data, have greater specific TMR, as shown in Figure 2, it is expected that many more natural resources will be used as input. This means that focusing only on the direct weight of each plastic product may not lead to truly sustainable production and consumption.
Notably, among the assessed countries, China has a relatively large burden of natural resources as inputs for plastic production. The TMR per direct weight in China is 10% higher than that worldwide. This is because, as shown in Figure 4b, compared with the world average, China has a large direct weight of PVC, PS, and PET, which have a relatively high specific TMR; that is, the proportion of PVC, PS, and PET in China is 66.6%, whereas globally, it is 34.6%. This means that a simple summation of the direct weight of various types of production in MFA would be a shortsighted analysis of the environmental impact of plastic production by country because of the differences in the trend of plastic production by country.

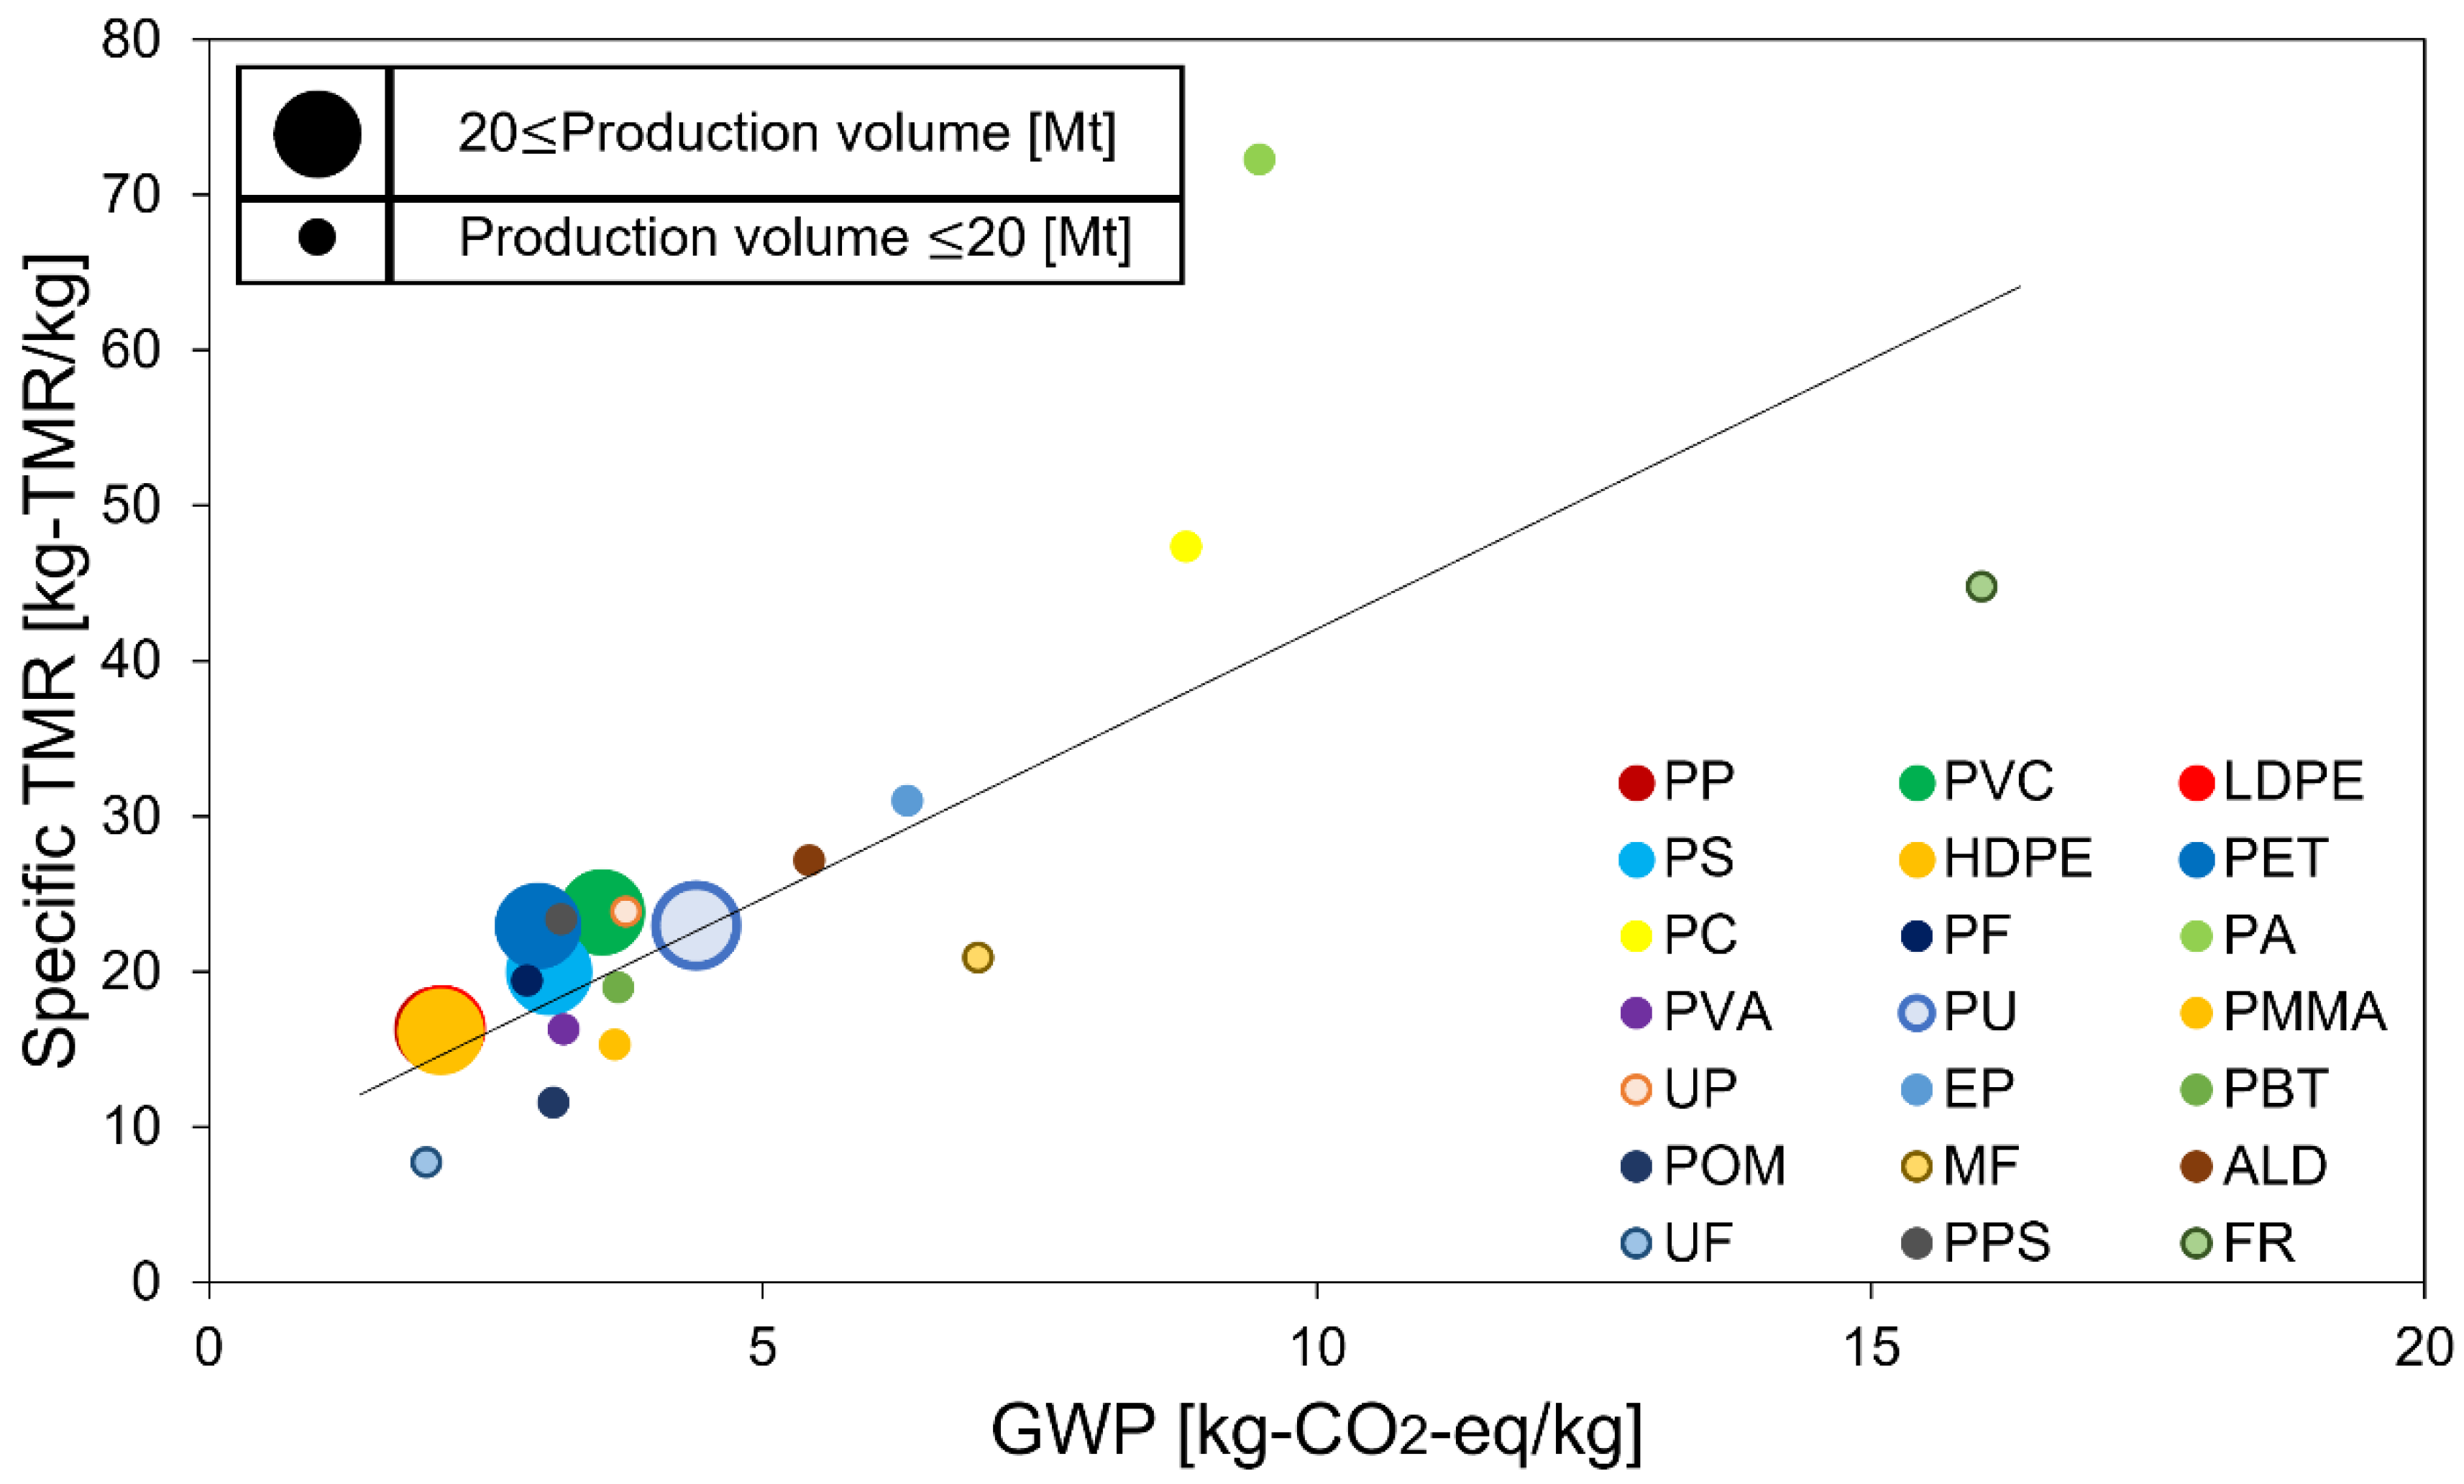
4.2. Relationship between Specific TMR and GWP with Different Plastic Types

To identify the relationship between the environmental impact of mining activities and global warming in plastic production, this study conducted a comparative analysis of the amount of natural resources used as inputs and the amount of greenhouse gas emissions used as outputs. The global warming potential (GWP) of 21 plastics was evaluated, and the relationships between specific TMR and GWP are presented in Figure 5.
Plastics with higher GWPs also had higher specific TMRs, indicating a slightly stronger positive correlation (correlation coefficient: r 1 = 0.763 ). For plastics with a high specific TMR, a significant amount of energy is required during the production phase, resulting in a high GWP.
However, focusing on the GWP without considering the amount of natural resources as input alone may lead to a shortsighted analysis of the environmental impact of plastic production. Plastics do not exhibit a strong relationship between GWP and specific TMR. For instance, PF and MF have similar GWPs, but more than two-fold differences in their specific TMR. POM and PPS have similar GWPs, but more than two-fold differences in their specific TMR.
Figure 5 presents an approximate line between the specific TMR and GWP in plastic production. The region above the straight line indicates a relatively greater burden of natural resources as an input, whereas the region below the straight line indicates a relatively greater burden of greenhouse gas emissions as an output. For instance, PA has a much greater burden of natural resources as an input than greenhouse gas emissions as an output, whereas PC has a much greater burden of greenhouse gas emissions as an output than natural resources as an input. In particular, high-production-volume plastics (PP, PVC, LDPE, PS, HDPE, PET, and PU) are located above the straight line, highlighting the importance of considering the burden of natural resources as inputs.

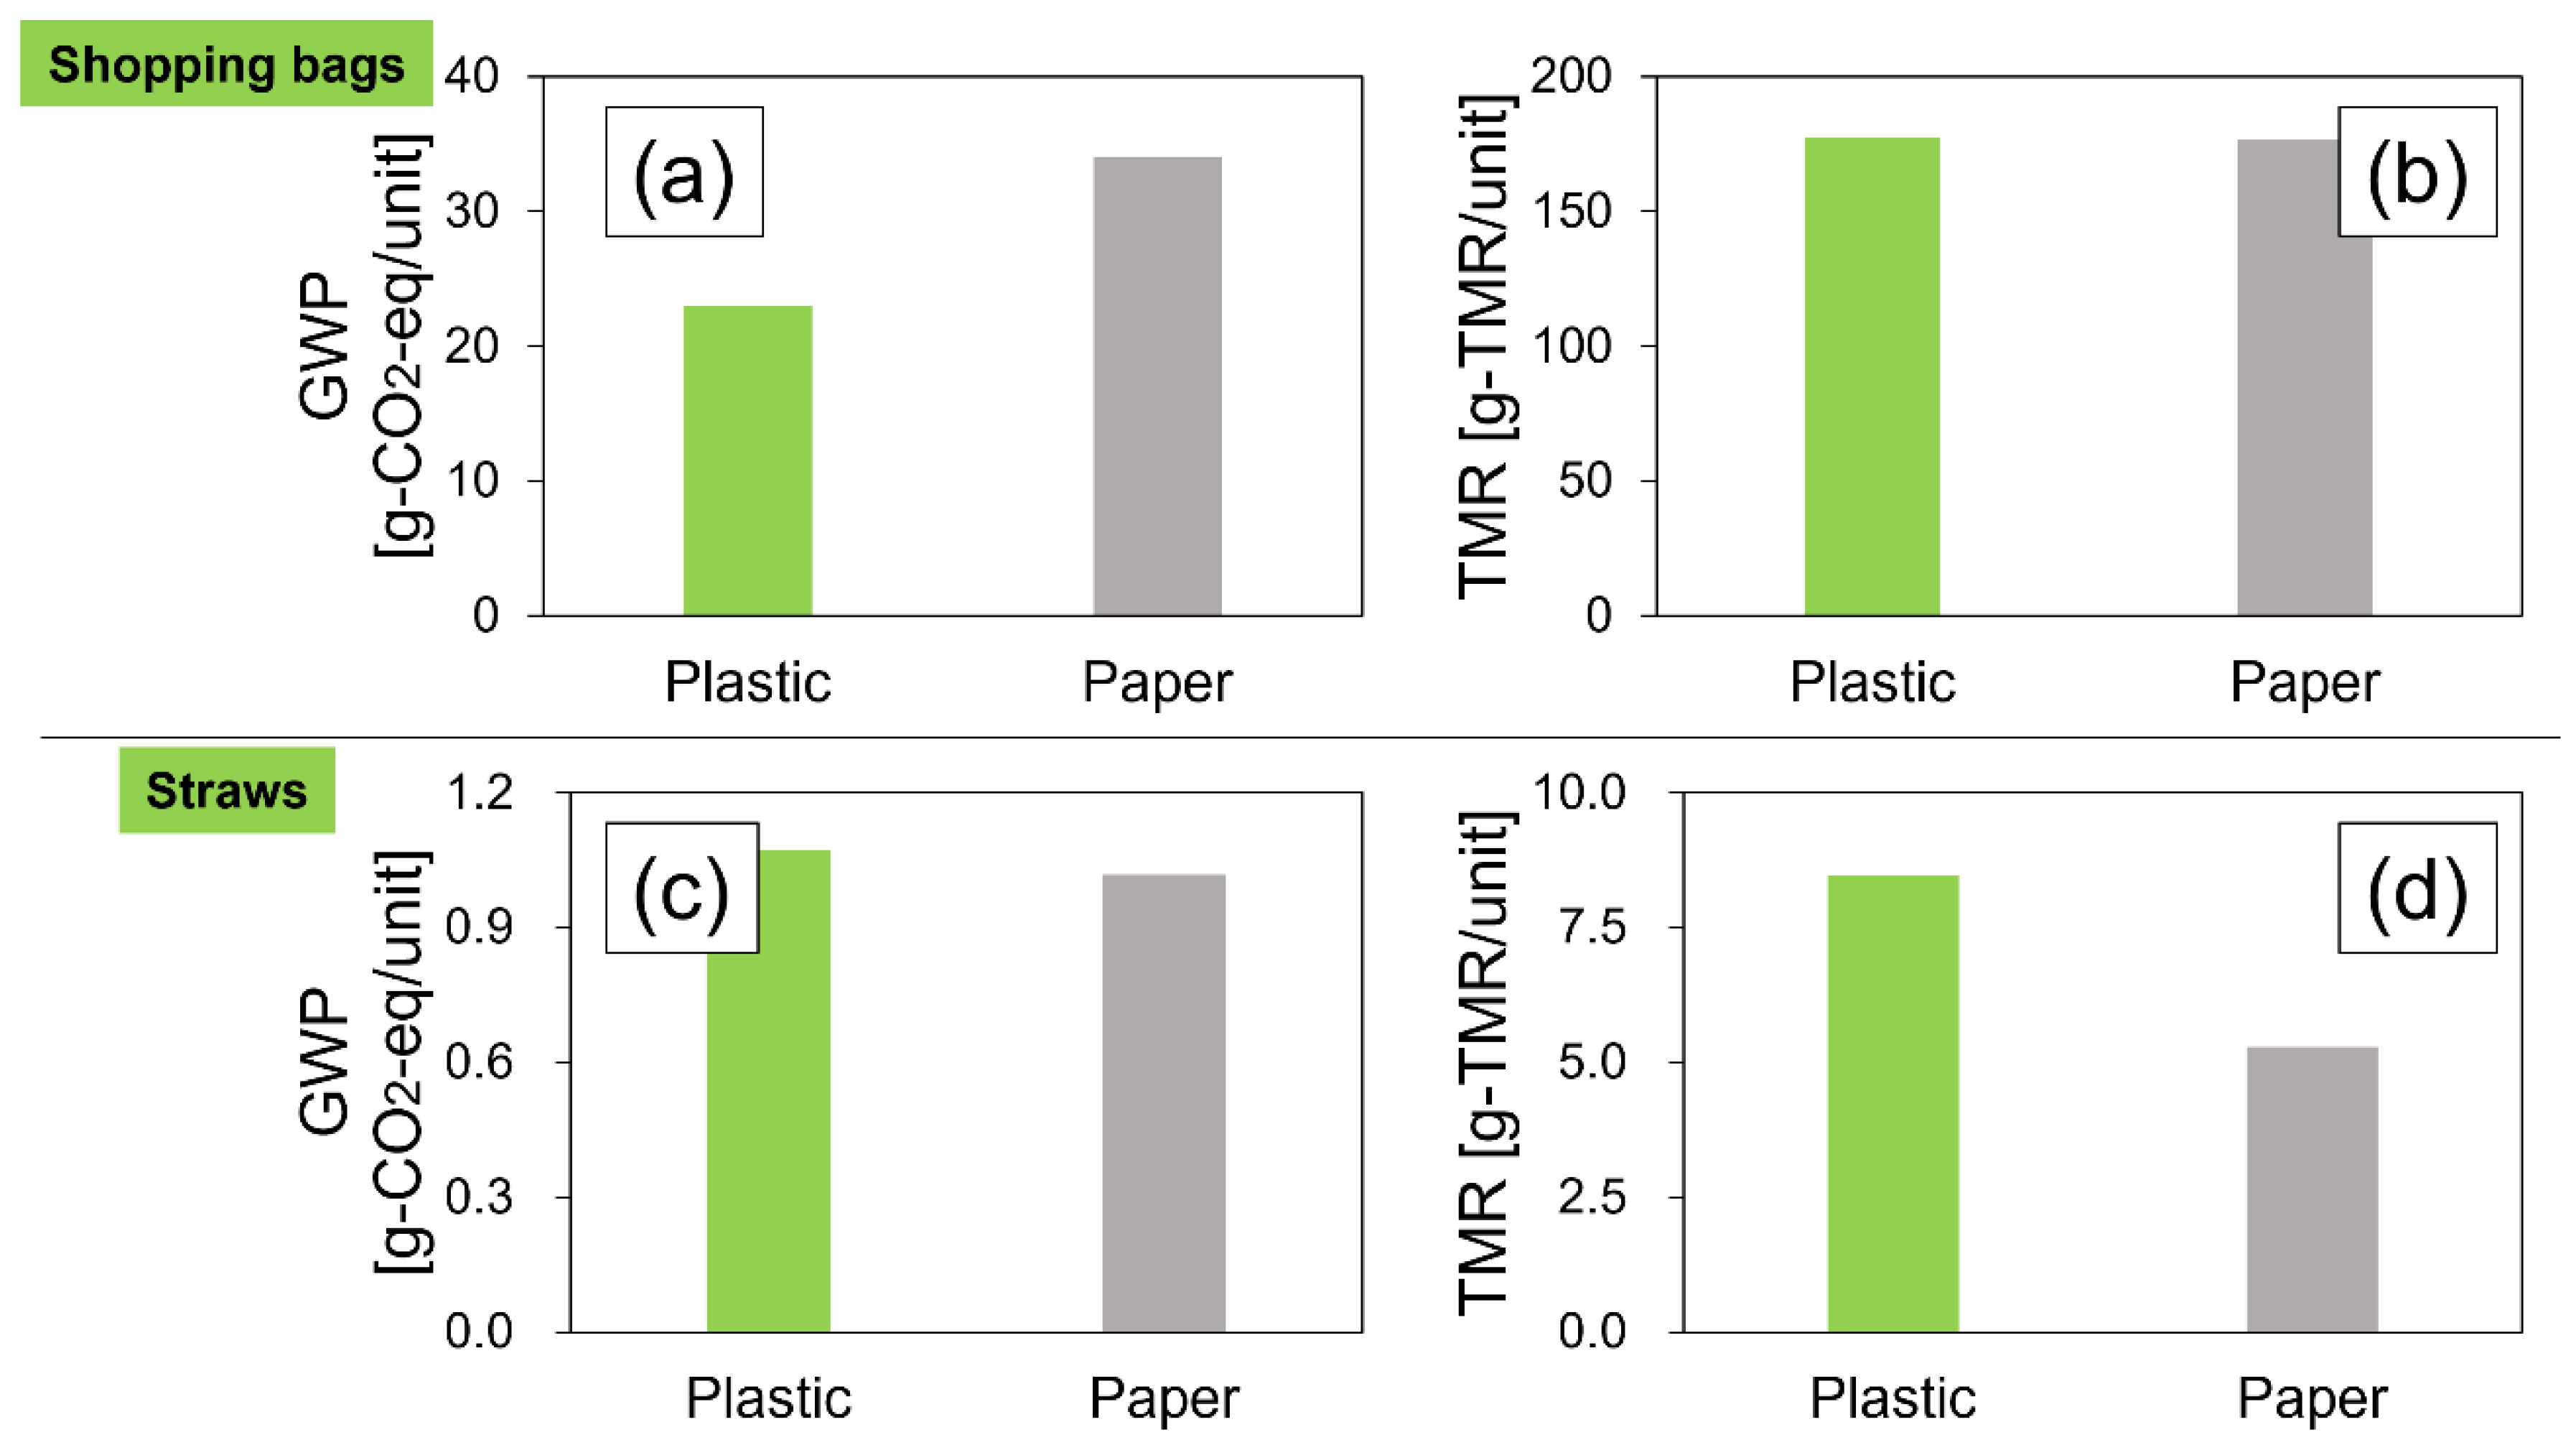
4.3. Plastic Alternative

Public concern about environmental pollution caused by plastic use has grown with an increase in the use of plastic-free products [69]. These plastic-free initiatives have induced a transition to plastic alternatives. The environmental impact of alternative single-use plastic products was analyzed [70].
The transition from plastic to paper, which is an alternative candidate to plastic, has been seen in various industries. Many supermarkets started trading paper bags, while some fast-food chains replaced plastic cups with paper cups [71]. However, it remains unclear whether these transitions are truly more environmentally friendly from the perspectives of cradle-to-gate resource input and greenhouse gas emissions.
Studies have compared plastics based on various indicators, including GWP, under the life cycle notion, especially for shopping bags and straws [72,73]. In these studies, it was found that the GWP for plastic-based shopping bag production was smaller than that for paper-based shopping bag production and that for paper-based straw production was smaller than that for plastic-based straw production. What trends can be observed in natural resource use?
Thus, in this section, natural resource use and greenhouse gas emissions for the production of paper- and plastic-based shopping bags and straws are analyzed. It is assumed that, regarding the shopping bag, the types of plastic and paper are HDPE (11 g), kraft pulp, and KP (38.42 g) [74], and the types of plastic and paper are PP (0.52 g) and KP (1.15 g) [73].
The TMR and greenhouse gas emissions for plastic- and paper-based shopping bags and straws are shown in Figure 6. The GWP of paper-based shopping bags was greater than that of plastic-based bags, which is a similar trend to an existing study, whereas the TMR of paper-based shopping bags was slightly smaller than that of plastic-based shopping bags. The GWP of plastic-based straws was slightly greater than that of paper-based straws, which is also a similar trend to an existing study, whereas the TMR of plastic-based straws was much greater than that of paper-based straws. In these results, the focus on GWP without considering the amount of natural resources as an input alone may lead to a shortsighted analysis when comparing plastics and paper. The relationship between natural resources as inputs and greenhouse gas emissions as outputs varies by product and can be applied to plastic alternatives. This implies that not all single-use plastic products should be replaced by plastic-free products.

4.4. Limitations

Because the system boundary of this study was cradle-to-gate, the focus was only on virgin plastics, and no attention was paid to recycled plastics. In OECD countries, which generate almost half of all plastic waste globally, only 9% of plastic waste is actually recycled. However, the amount of recycled plastic has increased in recent years [75], and the ease of recycling may vary depending on the type of plastic. The amount of natural resources as input for each type of plastic production using secondary materials is the scope for future work.
Because it was important to use the same inventory data, the division of plastic types in this study may differ from that of some previous studies. LDPE and LLDPE are distinguished in some studies [33,76,77], whereas this study does not distinguish both because of the limitation of the inventory data of IDEA 2.3 applied in this study.

4.5. Summary

Considering the material flow analysis of some countries and regions, we determined that the quantity of natural resources attributed to plastic production was more than 20 times the original weight. Through the comparison of resource use with greenhouse gas emissions among 21 types of plastics, plastics with higher GWPs have higher specific TMRs, which indicates a slightly stronger positive correlation between resource use and greenhouse gas emissions, whereas the opposite trend was found for some plastics. For instance, phenol and melamine resins have similar greenhouse gas emissions but more than two-fold differences in resource intensity. Considering plastic alternatives, we found that the quantity of natural resources in plastic-based shopping bags was nearly equivalent to that in paper-based bags, whereas that of plastic-based straws was greater by 1.6 times that of paper-based.
Focusing only on the direct weight of plastic, without considering the amount of natural resources as inputs for production, may mislead the decision-making process regarding plastics. These findings indicate the true burden of natural resource use attributed to plastic production, which assists in identifying hidden factors that were overlooked in the current approach and in developing sustainable patterns of production and consumption of plastics.

Supplementary Materials

The following supporting information can be downloaded at: https://www.mdpi.com/article/10.3390/su16072715/s1.

Author Contributions

Conceptualization, T.U., S.K. (Shoki Kosai), S.K. (Shunsuke Kashiwakura) and E.Y.; Methodology, T.U., S.K. (Shoki Kosai), S.K. (Shunsuke Kashiwakura) and E.Y.; Validation, T.U., S.K. (Shoki Kosai) and S.K. (Shunsuke Kashiwakura); Formal analysis, T.U., S.K. (Shoki Kosai) and S.K. (Shunsuke Kashiwakura); Investigation, T.U., S.K. (Shoki Kosai) and S.K. (Shunsuke Kashiwakura); Writing—original draft, T.U.; Writing—review & editing, S.K. (Shoki Kosai); Supervision, S.K. (Shunsuke Kashiwakura) and E.Y. All authors have read and agreed to the published version of the manuscript.

Funding

This research was partly supported by Research Institute for Humanity and Nature (RIHN: a con-stituent member of NIHU) Project No. RIHN14210156, by the Japan Society for the Promotion of Science (JSPS) KAKENHI Grants 22K18433, 22H03805, 23H00531, by JST Grant Number JPMJPF2204, and by JST-Mirai Program Grant Number JPMJMI21I5.

Institutional Review Board Statement

Not applicable.

Informed Consent Statement

Not applicable.

Data Availability Statement

Data are contained within the article.

Conflicts of Interest

The authors declare no conflict of interest.

References

  1. Bonilla, S.H.; Silva, H.R.O.; da Silva, M.T.; Goncalves, R.F.; Sacomano, J.B. Industry 4.0 and Sustainability Implications: A Scenario-Based Analysis of the Impacts and Challenges. Sustainability 2018, 10, 3740. [Google Scholar] [CrossRef]
  2. Sarkis, J.; Zhu, Q. Environmental sustainability and production: Taking the road less travelled. Int. J. Prod. Res. 2018, 56, 743–759. [Google Scholar] [CrossRef]
  3. Jiang, F.; Li, T.; Li, Y.J.; Zhang, Y.; Gong, A.; Dai, J.Q.; Hitz, E.; Luo, W.; Hu, L.B. Wood-Based Nanotechnologies toward Sustainability. Adv. Mater. 2018, 30, 1703453. [Google Scholar] [CrossRef] [PubMed]
  4. Aydemir, C.; Yenidoğan, S.; Tutak, D. Sustainability in the Print and Packaging Industry. Cellul. Chem. Technol. 2023, 57, 565–577. [Google Scholar] [CrossRef]
  5. Chang, S.H. Plastic waste as pyrolysis feedstock for plastic oil production: A review. Sci. Total Environ. 2023, 877, 162719. [Google Scholar] [CrossRef]
  6. Biegańska, J.; Barański, K.; Hebda, K.; Pytlik, M. Thermodynamic Assessment of the Impact of Selected Plastics on the Energy Parameters of Explosives. Energies 2022, 15, 9583. [Google Scholar] [CrossRef]
  7. Volk, R.; Stallkamp, C.; Steins, J.J.; Yogish, S.P.; Muller, R.C.; Stapf, D.; Schultmann, F. Techno-economic assessment and comparison of different plastic recycling pathways: A German case study. J. Ind. Ecol. 2021, 25, 1318–1337. [Google Scholar] [CrossRef]
  8. Huang, S.M.; Wang, H.C.; Ahmad, W.; Ahmad, A.; Vatin, N.I.; Mohamed, A.M.; Deifalla, A.F.; Mehmood, I. Plastic Waste Management Strategies and Their Environmental Aspects: A Scientometric Analysis and Comprehensive Review. Int. J. Environ. Res. Public Health 2022, 19, 4556. [Google Scholar] [CrossRef]
  9. Hannah, R.; Veronika, S.; Max, R. Plastic Pollution. Our World in Data. 2022. Available online: https://ourworldindata.org/plastic-pollution?utm_source=newsletter (accessed on 1 December 2023).
  10. Drewniok, M.P.; Gao, Y.; Cullen, J.M.; Serrenho, A.C. What to Do about Plastics? Lessons from a Study of United Kingdom Plastics Flows. Environ. Sci. Technol. 2023, 57, 4513–4521. [Google Scholar] [CrossRef]
  11. Cozar, A.; Echevarria, F.; Gonzalez-Gordillo, J.I.; Irigoien, X.; Ubeda, B.; Hernandez-Leon, S.; Palma, A.T.; Navarro, S.; Garcia-de-Lomas, J.; Ruiz, A.; et al. Plastic debris in the open ocean. Proc. Natl. Acad. Sci. USA 2014, 111, 10239–10244. [Google Scholar] [CrossRef]
  12. Jambeck, J.R.; Geyer, R.; Wilcox, C.; Siegler, T.R.; Perryman, M.; Andrady, A.; Narayan, R.; Law, K.L. Plastic waste inputs from land into the ocean. Science 2015, 347, 768–771. [Google Scholar] [CrossRef]
  13. Baulch, S.; Perry, C. Evaluating the impacts of marine debris on cetaceans. Mar. Pollut. Bull. 2014, 80, 210–221. [Google Scholar] [CrossRef] [PubMed]
  14. Kajaste, R.; Oinas, P. Plastics value chain–Abatement of greenhouse gas emissions. AIMS Environ. Sci. 2021, 8, 371–392. [Google Scholar] [CrossRef]
  15. Howard, B.C.; Gibbens, S.; Zachos, E.; Parker, L. A Running List of Action on Plastic Pollution; National Geographic Society: Washington, DC, USA, 2019. [Google Scholar]
  16. Pettipas, S.; Bernier, M.; Walker, T.R. A Canadian policy framework to mitigate plastic marine pollution. Mar. Policy 2016, 68, 117–122. [Google Scholar] [CrossRef]
  17. Walker, T.R.; Fequet, L. Current trends of unsustainable plastic production and micro(nano)plastic pollution. TrAC Trends Anal. Chem. 2023, 160, 116984. [Google Scholar] [CrossRef]
  18. Dietrich, K.; Dumont, M.-J.; Del Rio, L.F.; Orsat, V. Producing PHAs in the bioeconomy—Towards a sustainable bioplastic. Sustain. Prod. Consum. 2017, 9, 58–70. [Google Scholar] [CrossRef]
  19. Vanapalli, K.R.; Sharma, H.B.; Ranjan, V.P.; Samal, B.; Bhattacharya, J.; Dubey, B.K.; Goel, S. Challenges and strategies for effective plastic waste management during and post COVID-19 pandemic. Sci. Total Environ. 2021, 750, 141514. [Google Scholar] [CrossRef]
  20. Wu, C.Y.; Hu, M.C.; Ni, F.C. Supporting a circular economy: Insights from Taiwan’s plastic waste sector and lessons for developing countries. Sustain. Prod. Consum. 2021, 26, 228–238. [Google Scholar] [CrossRef] [PubMed]
  21. Zhu, Z.; Liu, W.; Ye, S.; Batista, L. Packaging design for the circular economy: A systematic review. Sustain. Prod. Consum. 2022, 32, 817–832. [Google Scholar] [CrossRef]
  22. Khan, O.; Daddi, T.; Slabbinck, H.; Kleinhans, K.; Vazquez-Brust, D.; De Meester, S. Assessing the determinants of intentions and behaviors of organizations towards a circular economy for plastics. Resour. Conserv. Recycl. 2020, 163, 105069. [Google Scholar] [CrossRef]
  23. van Oosterhout, L.; Dijkstra, H.; Borst, D.; Duijndam, S.; Rehdanz, K.; van Beukering, P. Triggering sustainable plastics consumption behavior: Identifying consumer profiles across Europe and designing strategies to engage them. Sustain. Prod. Consum. 2023, 36, 148–160. [Google Scholar] [CrossRef]
  24. Van Eygen, E.; Feketitsch, J.; Laner, D.; Rechberger, H.; Fellner, J. Comprehensive analysis and quantification of national plastic flows: The case of Austria. Resour. Conserv. Recycl. 2017, 117, 183–194. [Google Scholar] [CrossRef]
  25. Joosten, L.; Hekkert, M.; Worrell, E. Assessment of the plastic flows in The Netherlands using STREAMS. Resour. Conserv. Recycl. 2000, 30, 135–161. [Google Scholar] [CrossRef]
  26. Mutha, N.H.; Patel, M.; Premnath, V. Plastics materials flow analysis for India. Resour. Conserv. Recycl. 2006, 47, 222–244. [Google Scholar] [CrossRef]
  27. Vujic, G.; Jovicic, N.; Babic, M.; Stanisavljevic, N.; Batinic, B.; Pavlovic, A. Assessment of plastic flows and stocks in Serbia using material flow analysis. Therm. Sci. 2010, 14, 89–95. [Google Scholar] [CrossRef]
  28. Bureecam, C.; Chaisomphob, T.; Sungsomboon, P.-Y. Material flows analysis of plastic in Thailand. Therm. Sci. 2018, 22, 2379–2388. [Google Scholar] [CrossRef]
  29. Olatayo, K.I.; Mativenga, P.T.; Marnewick, A.L. Comprehensive evaluation of plastic flows and stocks in South Africa. Resour. Conserv. Recycl. 2021, 170, 105567. [Google Scholar] [CrossRef]
  30. Siddique, S.; Roy, B.B.; Zaman, S.; Khan, A.; Al Alam, A.; Chowdhury, R.B.; Biswas, K.F.; Hossain, M.M.; Murakami, S.; Sujauddin, M. Discerning the circularity of the plastic industry in Bangladesh through the lens of material flow analysis. Sustain. Prod. Consum. 2022, 33, 700–715. [Google Scholar] [CrossRef]
  31. Tod, H.; Plastic: It’s Not All the Same. Plastic Oceans. 2021. Available online: https://plasticoceans.org/7-types-of-plastic/ (accessed on 1 December 2023).
  32. Plastics for Change. The 7 Different Types of Plastic. Plastics for Change. 2021. Available online: https://www.plasticsforchange.org/blog/different-types-of-plastic (accessed on 1 December 2023).
  33. Heller, M.C.; Mazor, M.H.; Keoleian, G.A. Plastics in the US: Toward a material flow characterization of pro-duction, markets and end of life. Environ. Res. Lett. 2020, 15, 094034. [Google Scholar] [CrossRef]
  34. Hsu, W.-T.; Domenech, T.; McDowall, W. How circular are plastics in the EU?: MFA of plastics in the EU and pathways to circularity. Clean. Environ. Syst. 2020, 2, 100004. [Google Scholar] [CrossRef]
  35. Patel, M.K.; Jochem, E.; Radgen, P.; Worrell, E. Plastics streams in Germany–An analysis of production, consumption and waste generation. Resour. Conserv. Recycl. 1998, 24, 191–215. [Google Scholar] [CrossRef]
  36. Luan, X.; Cui, X.; Zhang, L.; Chen, X.; Li, X.; Feng, X.; Chen, L.; Liu, W.; Cui, Z. Dynamic material flow analysis of plastics in China from 1950 to 2050. J. Clean. Prod. 2021, 327, 129492. [Google Scholar] [CrossRef]
  37. Muise, I.; Adams, M.; Côté, R.; Price, G. Attitudes to the recovery and recycling of agricultural plastics waste: A case study of Nova Scotia, Canada. Resour. Conserv. Recycl. 2016, 109, 137–145. [Google Scholar] [CrossRef]
  38. Dunkelberg, H.; Weiß, T.; Mazurek, F. Energy- and ecologically-oriented selection of plastic materials. Procedia Manuf. 2019, 33, 240–247. [Google Scholar] [CrossRef]
  39. Kosai, S.; Yamasue, E. Global warming potential and total material requirement in metal production: Identification of changes in environmental impact through metal substitution. Sci. Total Environ. 2019, 651, 1764–1775. [Google Scholar] [CrossRef] [PubMed]
  40. Kosai, S.; Matsui, K.; Matsubae, K.; Yamasue, E.; Nagasaka, T. Natural resource use of gasoline, hybrid, electric and fuel cell vehicles considering land disturbances. Resour. Conserv. Recycl. 2021, 166, 105256. [Google Scholar] [CrossRef]
  41. Nakagawa, N.; Kosai, S.; Yamasue, E. Life cycle resource use of nuclear power generation considering total material requirement. J. Clean. Prod. 2022, 363, 132530. [Google Scholar] [CrossRef]
  42. Taelman, S.E.; Schaubroeck, T.; De Meester, S.; Boone, L.; Dewulf, J. Accounting for land use in life cycle assessment: The value of NPP as a proxy indicator to assess land use impacts on ecosystems. Sci. Total Environ. 2016, 550, 143–156. [Google Scholar] [CrossRef] [PubMed]
  43. Koellner, T.; de Baan, L.; Beck, T.; Brandão, M.; Civit, B.; Margni, M.; Canals, L.M.I.; Saad, R.; de Souza, D.M.; Müller-Wenk, R. UNEP-SETAC guideline on global land use impact assessment on biodiversity and ecosystem services in LCA. Int. J. Life Cycle Assess. 2013, 18, 1188–1202. [Google Scholar] [CrossRef]
  44. Canals, L.M.I.; Bauer, C.; Depestele, J.; Dubreuil, A.; Knuchel, R.F.; Gaillard, G.; Michelsen, O.; Müller-Wenk, R.; Rydgren, B. Key Elements in a Framework for Land Use Impact Assessment within LCA (11 pp). Int. J. Life Cycle Assess. 2007, 12, 5–15. [Google Scholar] [CrossRef]
  45. Mattila, T.; Helin, T.; Antikainen, R. Land use indicators in life cycle assessment: A case study on beer production. Int. J. Life Cycle Assess. 2012, 17, 277–286. [Google Scholar] [CrossRef]
  46. Aleksandrowicz, L.; Green, R.; Joy, E.J.M.; Smith, P.; Haines, A. The Impacts of Dietary Change on Greenhouse Gas Emissions, Land Use, Water Use, and Health: A Systematic Review. PLoS ONE 2016, 11, e0165797. [Google Scholar] [CrossRef]
  47. Kosai, S.; Badin, A.B.; Qiu, Y.; Matsubae, K.; Suh, S.; Yamasue, E. Evaluation of resource use in the household lighting sector in Malaysia considering land disturbances through mining activities. Resour. Conserv. Recycl. 2021, 166, 105343. [Google Scholar] [CrossRef]
  48. Bringezu, S.; Schutz, H.; Steger, S.; Baudisch, J. International comparison of resource use and its relation to economic growth: The development of total material requirement, direct material inputs and hidden flows and the structure of TMR. Ecol. Econ. 2004, 51, 97–124. [Google Scholar] [CrossRef]
  49. Nakajima, K.; Noda, S.; Nansai, K.; Matsubae, K.; Takayanagi, W.; Tomita, M. Global Distribution of Used and Unused Extracted Materials Induced by Consumption of Iron, Copper, and Nickel. Environ. Sci. Technol. 2019, 53, 1555–1563. [Google Scholar] [CrossRef]
  50. Lebre, E.; Corder, G.; Golev, A. The Role of the Mining Industry in a Circular Economy: A Framework for Resource Management at the Mine Site Level. J. Ind. Ecol. 2017, 21, 662–672. [Google Scholar] [CrossRef]
  51. Bridge, G. CONTESTED TERRAIN: Mining and the Environment. Annu. Rev. Environ. Resour. 2004, 29, 205–259. [Google Scholar] [CrossRef]
  52. Schandl, H.; West, J. Resource use and resource efficiency in the Asia–Pacific region. Glob. Environ. Chang. 2010, 20, 636–647. [Google Scholar] [CrossRef]
  53. Fischer-Kowalski, M.; Krausmann, F.; Giljum, S.; Lutter, S.; Mayer, A.; Bringezu, S.; Moriguchi, Y.; Schütz, H.; Schandl, H.; Weisz, H. Methodology and Indicators of Economy-wide Material Flow Accounting. J. Ind. Ecol. 2011, 15, 855–876. [Google Scholar] [CrossRef]
  54. Nakajima, K.; Halada, K.; Ijima, K.; Nagasaka, T. Estimation of Total Materials Requirement: Energy Resources and Industrial Materials. J. Life Cycle Assess. Jpn. 2006, 2, 152–158. [Google Scholar] [CrossRef]
  55. Halada, K.; Ijima, K.; Katagiri, N.; Okura, T. An Approximate Estimation of Total Materials Requirement of Metals. J. Jpn. Inst. Met. Mater. 2001, 65, 564–570. [Google Scholar] [CrossRef]
  56. Panesar, D.K.; Seto, K.E.; Churchill, C.J. Impact of the selection of functional unit on the life cycle assessment of green concrete. Int. J. Life Cycle Assess. 2017, 22, 1969–1986. [Google Scholar] [CrossRef]
  57. Xia, Q.Q.; Chen, C.J.; Yao, Y.G.; Li, J.G.; He, S.M.; Zhou, Y.B.; Li, T.; Pan, X.J.; Yao, Y.; Hu, L.B. A strong, biodegradable and recyclable lignocellulosic bioplastic. Nat. Sustain. 2021, 4, 627–635. [Google Scholar] [CrossRef]
  58. KDA Corporation. Basic Knowledge of Plastics Physical Properties of Plastics. KDA Corporation. Available online: https://www.kda1969.com/materials/ (accessed on 1 December 2023).
  59. Craig, F.; How Plastics Work. HowStuffWorks. Available online: https://science.howstuffworks.com/plastic.htm/printable (accessed on 1 December 2023).
  60. Sato, H.; Ogawa, H. Review on Development of Polypropylene Manufacturing Process; Sumitomo Chemical Co., Ltd.: Tokyo, Japan, 2009. [Google Scholar]
  61. Ren, T.; Patel, M.K. Basic petrochemicals from natural gas, coal and biomass: Energy use and CO2 emissions. Resour. Conserv. Recycl. 2009, 53, 513–528. [Google Scholar] [CrossRef]
  62. Carwile, J.L.; Luu, H.T.; Bassett, L.S.; Driscoll, D.A.; Yuan, C.; Chang, J.Y.; Ye, X.; Calafat, A.M.; Michels, K.B. Polycarbonate Bottle Use and Urinary Bisphenol A Concentrations. Environ. Health Perspect. 2009, 117, 1368–1372. [Google Scholar] [CrossRef] [PubMed]
  63. Laskar, N.; Kumar, U. Plastics and microplastics: A threat to environment. Environ. Technol. Innov. 2019, 14, 100352. [Google Scholar] [CrossRef]
  64. Antonetti, E.; Iaquaniello, G.; Salladini, A.; Spadaccini, L.; Perathoner, S.; Centi, G. Waste-to-Chemicals for a Circular Economy: The Case of Urea Production (Waste-to-Urea). ChemSusChem 2017, 10, 912–920. [Google Scholar] [CrossRef]
  65. Ferro, W.P.; e Silva, L.G.A.; Wiebeck, H. Uso da cinza da casca de arroz como carga em matrizes de poliamida 6 e poliamida 6.6. Polim.-Cienc. Tecnol. 2007, 17, 240–243. [Google Scholar] [CrossRef]
  66. Zulfiqar, S.; Ahmad, Z.; Ishaq, M.; Sarwar, M.I. Aromatic–aliphatic polyamide/montmorillonite clay nanocomposite materials: Synthesis, nanostructure and properties. Mater. Sci. Eng. A-Struct. Mater. Prop. Microstruct. Process. 2009, 525, 30–36. [Google Scholar] [CrossRef]
  67. Japan Petrochemical Industry Association. Petrochemicals and Plastics; Japan Petrochemical Industry Association: Tokyo, Japan, 2023. [Google Scholar]
  68. Plastics Europe. Plastics–The Facts 2022; Plastics Europe: Nieuwegein, The Netherlands, 2022. [Google Scholar]
  69. Shah, P.; Yang, J.Z. It Takes Two to Tango: How Ability and Morality Shape Consumers’ Willingness to Refill and Reuse. Environ. Manag. 2023, 73, 311–322. [Google Scholar] [CrossRef]
  70. Di Paolo, L.; Abbate, S.; Celani, E.; Di Battista, D.; Candeloro, G. Carbon Footprint of Single-Use Plastic Items and Their Substitution. Sustainability 2022, 14, 16563. [Google Scholar] [CrossRef]
  71. Klemeš, J.J.; Van Fan, Y.; Jiang, P. Plastics: Friends or foes? The circularity and plastic waste footprint. Energy Sources Part A Recover. Util. Environ. Eff. 2021, 43, 1549–1565. [Google Scholar] [CrossRef]
  72. Biona, J.B.M.M.; Gonzaga, J.A.; Ubando, A.T.; Tan, H.C. A comparative life cycle analysis of plastic and paper packaging bags in the Philippines. In Proceedings of the 2015 International Conference on Humanoid, Nanotechnology, Information Technology, Communication and Control, Environment and Management (HNICEM), Cebu, Philippines, 9–12 December 2015; IEEE: Piscataway, NJ, USA, 2015; pp. 1–6. [Google Scholar]
  73. Chitaka, T.Y.; Russo, V.; von Blottnitz, H. In pursuit of environmentally friendly straws: A comparative life cycle assessment of five straw material options in South Africa. Int. J. Life Cycle Assess. 2020, 25, 1818–1832. [Google Scholar] [CrossRef]
  74. Stafford, W.; Russo, V.; Nahman, A. A comparative cradle-to-grave life cycle assessment of single-use plastic shopping bags and various alternatives available in South Africa. Int. J. Life Cycle Assess. 2022, 27, 1213–1227. [Google Scholar] [CrossRef]
  75. OECD. Plastic Pollution Is Growing Relentlessly as Waste Management and Recycling Fall Short, Says OECD; OECD: Paris, France, 2022. [Google Scholar]
  76. American Chemistry Council. US Resin Production & Sales 2022 vs. 2021; American Chemistry Council: Washington, DC, USA, 2023. [Google Scholar]
  77. Lee, M.-Y.; Cho, N.-H.; Lee, S.-J.; Um, N.; Jeon, T.-W.; Kang, Y.-Y. Application of material flow analysis for plastic waste management in the Republic of Korea. J. Environ. Manag. 2021, 299, 113625. [Google Scholar] [CrossRef]
Figure 1. Overview of TMR concept for plastic production.
Sustainability 16 02715 g001
Figure 2. Specific TMR of producing 21 types of plastic.
Sustainability 16 02715 g002
Figure 3. Comparison of specific TMR per tensile strength of plastic.
Sustainability 16 02715 g003
Figure 4. (a) TMR per direct weight of plastic production by country. (b) Direct weight by plastic type in China and world average.
Sustainability 16 02715 g004
Figure 5. Relationship between specific TMR and GWP of 21 types of plastic.
Sustainability 16 02715 g005
Figure 6. (a) GWP and (b) TMR for plastic- and paper-based shopping bag production, (c) GWP and (d) TMR for plastic- and paper-based straws.
Sustainability 16 02715 g006
Disclaimer/Publisher’s Note: The statements, opinions and data contained in all publications are solely those of the individual author(s) and contributor(s) and not of MDPI and/or the editor(s). MDPI and/or the editor(s) disclaim responsibility for any injury to people or property resulting from any ideas, methods, instructions or products referred to in the content.

