Article

A Market Convergence Prediction Framework Based on a Supply Chain Knowledge Graph

1
National Numerical Control Systems Engineering Research Center, School of Mechanical Science and Engineering, Huazhong University of Science and Technology, Wuhan 430074, China
2
The CAE Center for Strategic Studies, Chinese Academy of Engineering, Beijing 100088, China
*
Author to whom correspondence should be addressed.
Sustainability 2024, 16(4), 1696; https://doi.org/10.3390/su16041696
Submission received: 31 December 2023 / Revised: 8 February 2024 / Accepted: 15 February 2024 / Published: 19 February 2024

Abstract

:
Market convergence challenges socially sustainable supply chain management (SSSCM) due to the increasing competition. Identifying market convergence trends allows companies to respond quickly to market changes and improve supply chain resilience (SCR). Conventional approaches are one-sided and biased and cannot predict market convergence trends comprehensively and accurately. To address this issue, we propose a framework based on info2vec that solves the problem of matching multidimensional data by using the technology layer as the focal layer and the supply chain as the supporting layer. The framework enriches the supply chain dimension with the technology dimension. A knowledge graph is constructed to facilitate cross-domain information connectivity by integrating different data sources. The nodes in the knowledge graph were characterized using a representation learning algorithm, which enhanced feature mining during supply chain and market convergence. Changes in market demand were predicted based on link prediction experiments. Market convergence has an impact on firm cooperation and, thus, on SCR. The framework recommends potential technological and innovative cooperation opportunities for firms. In this way, it has been demonstrated to improve SSSCM through network resilience experiments. This method predicts market convergence efficiently based on the supply chain knowledge graph, which provides decision support for enterprise development.

1. Introduction

As technology advances, the established supply chain of a company may be disrupted by the evolving landscape of the industry and the increasing convergence of markets. The example of Kodak illustrates this point, as the company’s reliance on traditional film photography left it unable to keep up with the digital revolution, ultimately leading to its decline [1]. To address this challenge, rapidly adapting and developing SCR and continuously adjusting the supply chain structure to meet market demand and efficiently distribute products and services [2,3] is necessary. The current methodologies fall short of comprehensively anticipating and responding to market convergence trends. Enterprises need to effectively utilize the vast amount of data available within supply chain systems to anticipate and adapt to market convergence, enhancing their SCR and sustainable supply chain management (SSCM) in the context of the rapid development of digital technologies [4,5,6,7,8].
Research in the field of supply chain management (SCM) and market trend analysis has made strides in understanding the dynamics of market changes. However, it falls short in several aspects. Traditional methods are often biased and limited in scope, focusing on singular aspects of the supply chain without accounting for the multidimensional nature of market convergence. The literature suggests the existence of two market-driven convergence processes: one begins with technology convergence, and the other proposes to start with market convergence. For technology convergence, Lee and Cho [9] analyzed technology convergence from product and market perspectives. Zhu and Motohashi [10] identified technology convergence through generating patent and technology keyword vectors through a training graph convolutional network model, and for market convergence, No and Park [11] used nanobiotechnology as an example to analyze technology convergence mechanisms using citation network analysis. Pan et al. [12] found that technology convergence and industry convergence enhanced the competitive advantage of manufacturing companies. However, Klarin et al. [13] do not think that these two optional convergence processes are the only ones that exist. Market convergence is a complex phenomenon that is influenced not only by supply chain demand but also by the technology that drives development. While some approaches have attempted to integrate various data sources, they have not fully leveraged cross-domain connectivity, leading to gaps in predictive accuracy and comprehensive market understanding. Therefore, both supply chain and technology information need to be considered and the multilayer network is an efficient method to represent them [14]. A knowledge graph [15,16] can be a valuable source of various data to facilitate cross-domain information connectivity, and representation learning [17] can effectively capture the characteristics of nodes and connections.
Based on the above approach, a framework is proposed to provide companies with technology cooperation recommendations from market convergence, utilizing a supply chain knowledge graph. Specifically, the computer numerical control (CNC) machine tool and artificial intelligence (AI) fields are taken as examples. The process involves obtaining supply chain and patent data and addressing the data matching problem using the info2vec model [18]. The technology chain is prioritized as the focus layer, supported by the supply chain, facilitating the aggregation of supply chain information to the technology chain. Consequently, a knowledge graph is constructed, simplifying the recognition of market convergence features. Link prediction experiments suggest potential technological cooperation for firms based on the characteristics of the learning results. The effectiveness of the framework in improving company SCR and SSCM is demonstrated through the computation of market convergence and network resilience. This showcases the competence and expertise of the framework, supporting firms’ decision-making and governmental adjustments to supply chain structures. The framework offers a practical solution to the challenges of adapting to market convergence trends.
The remainder of this paper is organized as follows: Section 2 briefly reviews the previous literature on SSCM, market convergence, and representation learning. Section 3 presents the overall research framework and the related analysis steps. Section 4 provides the analysis results, followed by a discussion of the findings. The final section summarizes the major findings and concludes with an outlook on possible future research and implications for the management.

2. Literature Review

2.1. Sustainable Supply Chain Management

SCM involves planning and controlling material, information, and logistics activities within and outside a company to achieve sustainable competitive advantage [19,20]. Global disruptions, such as the 2019 coronavirus pandemic, highlight the importance of resilient supply chains. This period underscored the need for robust and SSCM systems capable of managing such challenges. The evolution of SSCM has been profoundly influenced by the emergence of digital technologies, especially for small- and medium-sized enterprises (SMEs) that are struggling to establish strong supplier relationships [21,22]. Park [23] advocates for the potential of blockchain technology to enhance supply chain sustainability, anticipating its increasing adoption in SCM. Moreover, Reyna’s research [24] underscores the predictive power of social sustainability orientations, while Ye et al. [25] find that companies with extensive deployment of digital technology assets tend to achieve better supply chain performance.
It is important to note that not all companies utilize digital technologies. Companies can choose suppliers and customers to achieve SSCM through various strategies and activities [26,27]. Sánchez-Flores et al. [7] have seen a growing need to understand how companies can work with key parties in their supply chains (SCs) to increase their focus on sustainability. Alghababsheh and Gallear [28] have studied the role of social capital in enhancing the relationship between SSCM practices and suppliers’ social performance. Collaborative practices between buyers and suppliers, fostering mutual learning and knowledge exchange, are pivotal in improving suppliers’ social performance. It is worth investigating intelligent technology support for companies to select partners to improve SSCM.

2.2. Market Convergence

Market convergence [29] is a phenomenon characterized by ongoing changes in market structure and firm behavior. Initially observed in the development of the US machine tool industry, this concept has expanded to encompass the integration of diverse industry sectors, technologies, and markets [30]. Such integration results in transformative changes in the competitive landscape, affecting both upstream and downstream industries in multifaceted ways, and it is essential for addressing economic crises and promoting sustainable development [31]. Emerging technologies like the Internet of Things (IoT), big data, and AI have been instrumental in driving this convergence [32].
Industry 4.0, marked by the fusion of cyber and physical realms through IoT and AI, exemplifies this convergence. Cyber-physical systems (CPSs) can significantly enhance market demand accuracy and influence market trends [33]. Innovation is pivotal for the growth of venture companies, often necessitating external resources, particularly for those with limited internal capacities. Market convergence disrupts traditional value chains, leading to complex chain combinations that transform the industrial ecosystem and dissolve existing business barriers. Aaldering et al. [34] explored market convergence dynamics via merger and acquisition behaviors in companies, applying a link prediction algorithm to forecast future patterns. This analysis demonstrates the evolution from technology to market convergence, informed by competitive advantage theory and patent data analysis.
Despite these developments, gaps remain in the literature, particularly regarding the practical application of market convergence in SCM. There is a pressing need for empirical studies to explore the ways that companies can effectively integrate these convergence trends into their supply chain strategies. The impact of market convergence on small- and medium-sized enterprises (SMEs) and specific industry sectors also warrants further investigation. Future research should aim to develop frameworks and models that facilitate market convergence strategy adoption in various business contexts, enabling companies to fully leverage this phenomenon. Liu et al. [35] proposed a novel framework using a separated three-layer knowledge graph with multiple time slices to monitor the evolutionary path of developed technologies. Zhou et al. [36,37] introduced frameworks for measuring cluster proximity in innovation clusters and revealing the convergence process of scientific knowledge, respectively, utilizing multi-source data and network approaches. Chen et al. [38] proposed an integrated approach combining topic modeling, bibliometrics, trend analysis, and patent analysis to systematically analyze the machine tool field’s development. Kong et al. [39] employed a deep learning approach using graph neural network models to identify technology convergence trajectories and examine dynamic roles in technology subfields.

2.3. Representation Learning

Generally, a graph is used to represent data from the networks. It can be denoted as G = (V, E), where V is the set of vertices and E is the set of edges in the graph. Graphs are categorized into homogeneous and heterogeneous types based on their composition. Homogeneous graphs consist solely of one type of nodes and edges, whereas heterogeneous graphs contain multiple types. An attributed network G = (V, E, A) is a network G endowed with an attribute representation A. Each node in the network has an associated feature vector. Existing graph analysis methods suffer from high computational cost and high spatial complexity, making it difficult to apply them to large-scale networks. Representation learning algorithms [40] can learn the latent information of network nodes and represent vectors in low dimensions, which can preserve the network structure, node characteristics, and other auxiliary information. In this context, the models are divided into four categories: random walk models, neighbor information models, neural network models, and matrix factorization models.
Random walk models aim to generate a node sequence in graphs via random walks, providing context vertex information for each node. The node representation is influenced by the likelihood of these context vertices. Notable examples are DeepWalk [41] and Node2vec [42]. DeepWalk generates a corpus on graphs and then applies a skip-gram model for training. Node2vec introduces two hyperparameters to balance the biases of Breadth-First Search (BFS) and Depth-First Search (DFS) walks, integrating local neighbor and global network structure information effectively.
Neighbor information models leverage the node’s neighbor information, including edges and connectivity, to update its representation. This process stabilizes graph information over iterations. An exemplary model, the LINE algorithm [43], utilizes first- and second-order node proximities for embedding vector learning and introduces edge-sampling for large-scale networks.
Neural network models, characterized by interconnected neurons exchanging information, are versatile across various applications due to their nonlinearity. Effective models include the graph convolution network (GCN) [44], graph auto-encoders (GAE) [45], graph attention network (GAT) [46], and heterogeneous graph attention network (HAN) [47]. GCN integrates neighboring features into node representation using convolutional operations. GAT employs an attention mechanism to compute node hidden states, focusing on neighbors through self-attention. GAE uses a graph convolutional network encoder and a simple inner product decoder for unsupervised learning in graph embedding. HAN builds on the GAT model, maintaining its attention mechanism and addressing heterogeneous graph representation learning.
Matrix factorization models transform network representation into matrix operations, focusing on the adjacency matrix. TADW [48] establishes the equivalence between DeepWalk and matrix factorization, introducing text-associated DeepWalk. TADW incorporates text features of vertices into network representation learning within the matrix factorization framework.

3. Methods

This section discusses the framework presented in this paper. Section 3.1 focuses on a research framework that provides companies with technology cooperation recommendations to further improve their SCR and SSCM. Section 3.2 delves into the acquisition and pre-processing of multi-source data, which is fundamental to the aggregation network in the framework. Section 3.3 provides an in-depth examination of the graph representation learning model, a critical element of the framework. Lastly, Section 3.4 validates the framework’s effectiveness through link prediction exercises based on the characterization results.

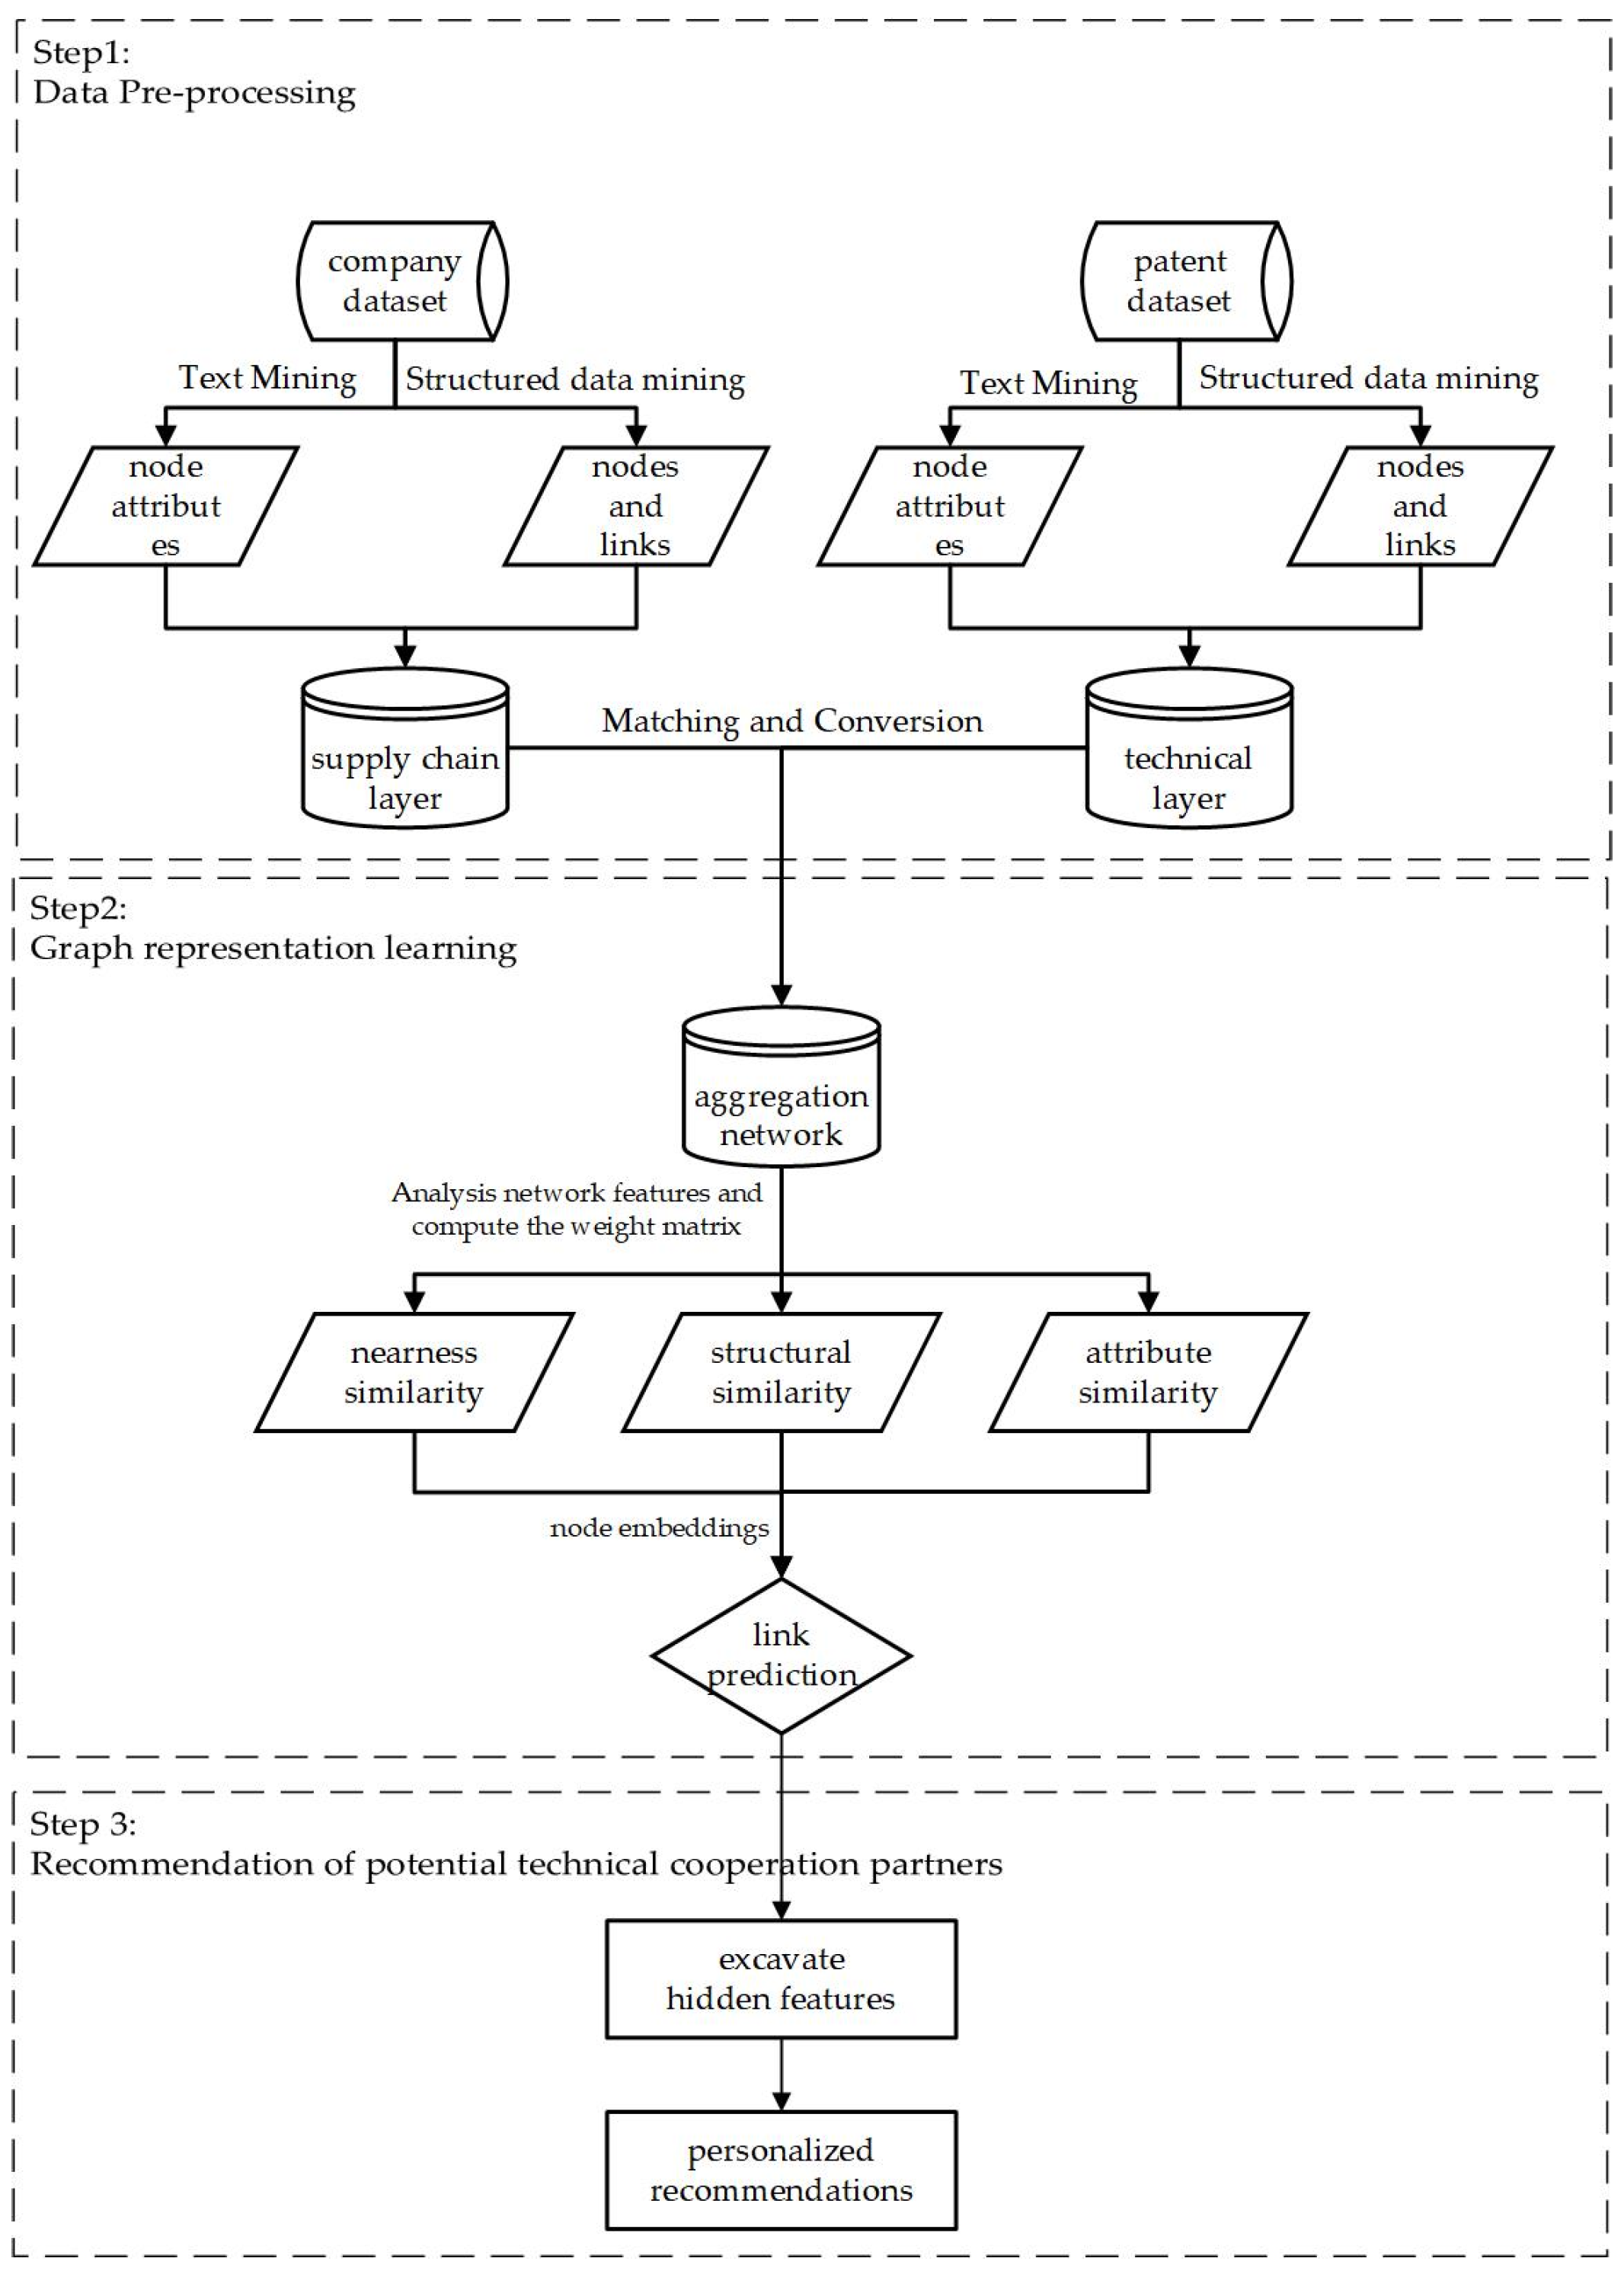
3.1. Method Framework

With the development of market convergence research, it can be used to optimize SSSCM. Therefore, this paper proposes a framework based on multiple approaches, including market convergence analysis, aggregation networks, knowledge graphs, and representational learning, to provide companies with technology cooperation recommendations to further improve their SCR and SSCM, as shown in Figure 1. The framework consists of three main steps. The first step is to collect relevant supply chain data and patents in the field of CNC machine tools and AI, followed by extracting nodes and links from structured data, and node attributes from unstructured textual data, and then using these elements to construct a heterogeneous graph of CNC machine tools and AI, with the technology layer as the focus layer and the supply chain layer as the support layer. The second step is to match companies in the supply chain layer and technology layer to establish connections between the layers. The information in the supply chain layer is focused on the technology layer using graph conversion rules, and the representation learning method is selected from three dimensions: network node information, network structure information, and node attribute information. In the third step, the node embedding vectors derived in the previous step are utilized for link prediction to capture potential market convergence features based on similarities in these vectors and recommend partners to companies accordingly.
The framework explores the development of technology and market convergence in the field of intelligence and CNC machine tools by analyzing data from multiple sources in the field. Specifically, patent data were primarily utilized to analyze the technological convergence of the two domain pieces.
Patents are often identified with practical applications of technological developments [49]. Therefore, they are used to assess trends in the technological development of companies. Supply chain data, representing the supply and demand relationship between companies, are utilized to evaluate the trend of cooperation development between them. The methods for data collection and pre-processing steps will be detailed in Section 3.2.
Specifically, the data are aggregated into an ensemble network using transformation rules. The general attributed multiplex heterogeneous network embedding (GATNE) representation learning method is then employed to characterize the nodes and aid in subsequent computations. This step will be elaborated in Section 3.3.
Finally, the characterization results are utilized for link prediction and company cooperation recommendations to validate the effectiveness of the framework. This will be discussed in detail in Section 3.4.

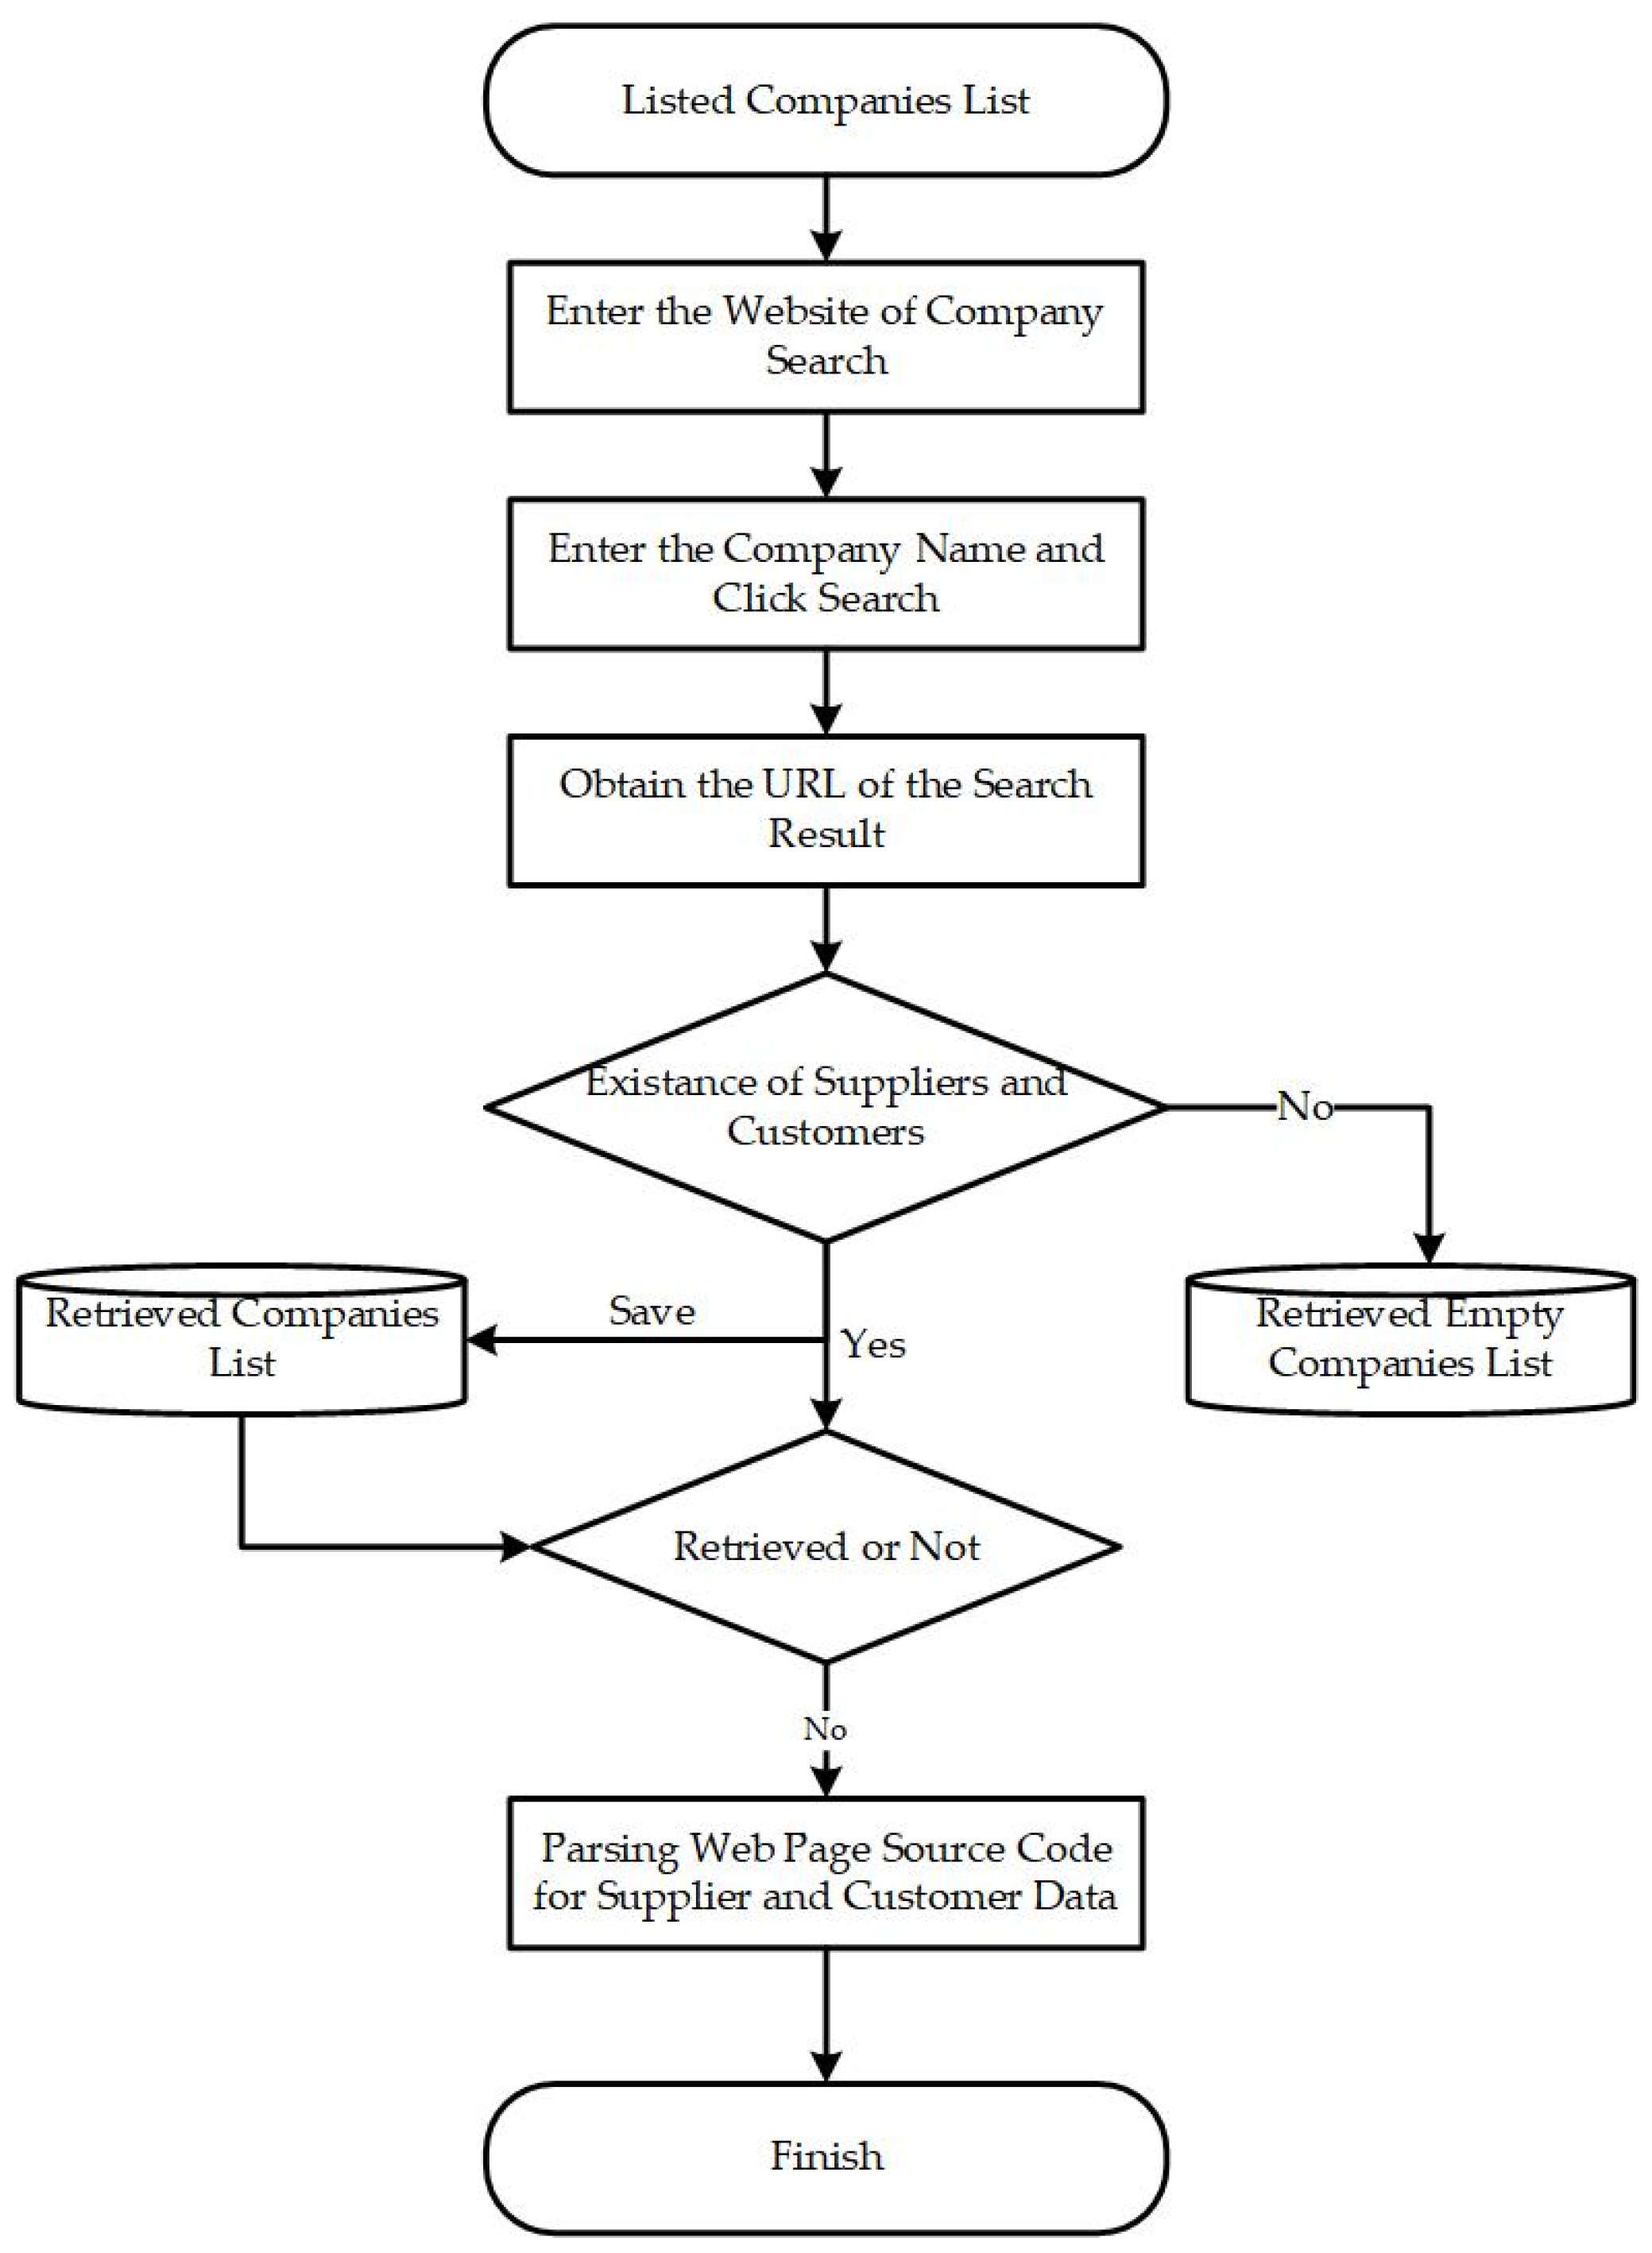
3.2. Data Collection and Pre-Processing

Aaldering et al. [34] suggest that technology convergence drives structural and functional market changes while they use M and A data to analyze market convergence. Giudice et al. [50] explore the impact of technology convergence on the international growth of SMEs. Network analysis based on patent data is also widely used to identify technology convergence [10,51,52]. However, market convergence is a broad concept and using only one dimension of data is not sufficient.
This study aims to explore the relationship between supply chain and technology in the realms of AI and CNC machine tools. For this purpose, patent data from 2000 to 2022 were collected from the Derwent World Patent Index, encompassing key details such as patent number, filing date, international patent classification (IPC), applicant, and others. Additionally, data on organizational affiliations were extracted and analyzed for similarities to compile a list of relevant companies, with each company’s domain being determined by its patent portfolio. We collected the supply chain data of listed Chinese companies from 2001 to 2022. Supply chain data were sourced from a specialized company search website. The acquisition process, as illustrated in Figure 2, involves obtaining corresponding company supply chain data based on the list of companies.
To obtain the supply chain data of listed Chinese companies, it is necessary to unify all company names in English. Because the company names extracted from the patents are in English, it can be considered that the English company names in the patents can be used first to match with the English list of listed companies, and the remaining ones that cannot be matched can be directly translated to obtain the Chinese names of the information of the publishing units in the papers, but there are the following two problems:
(1)
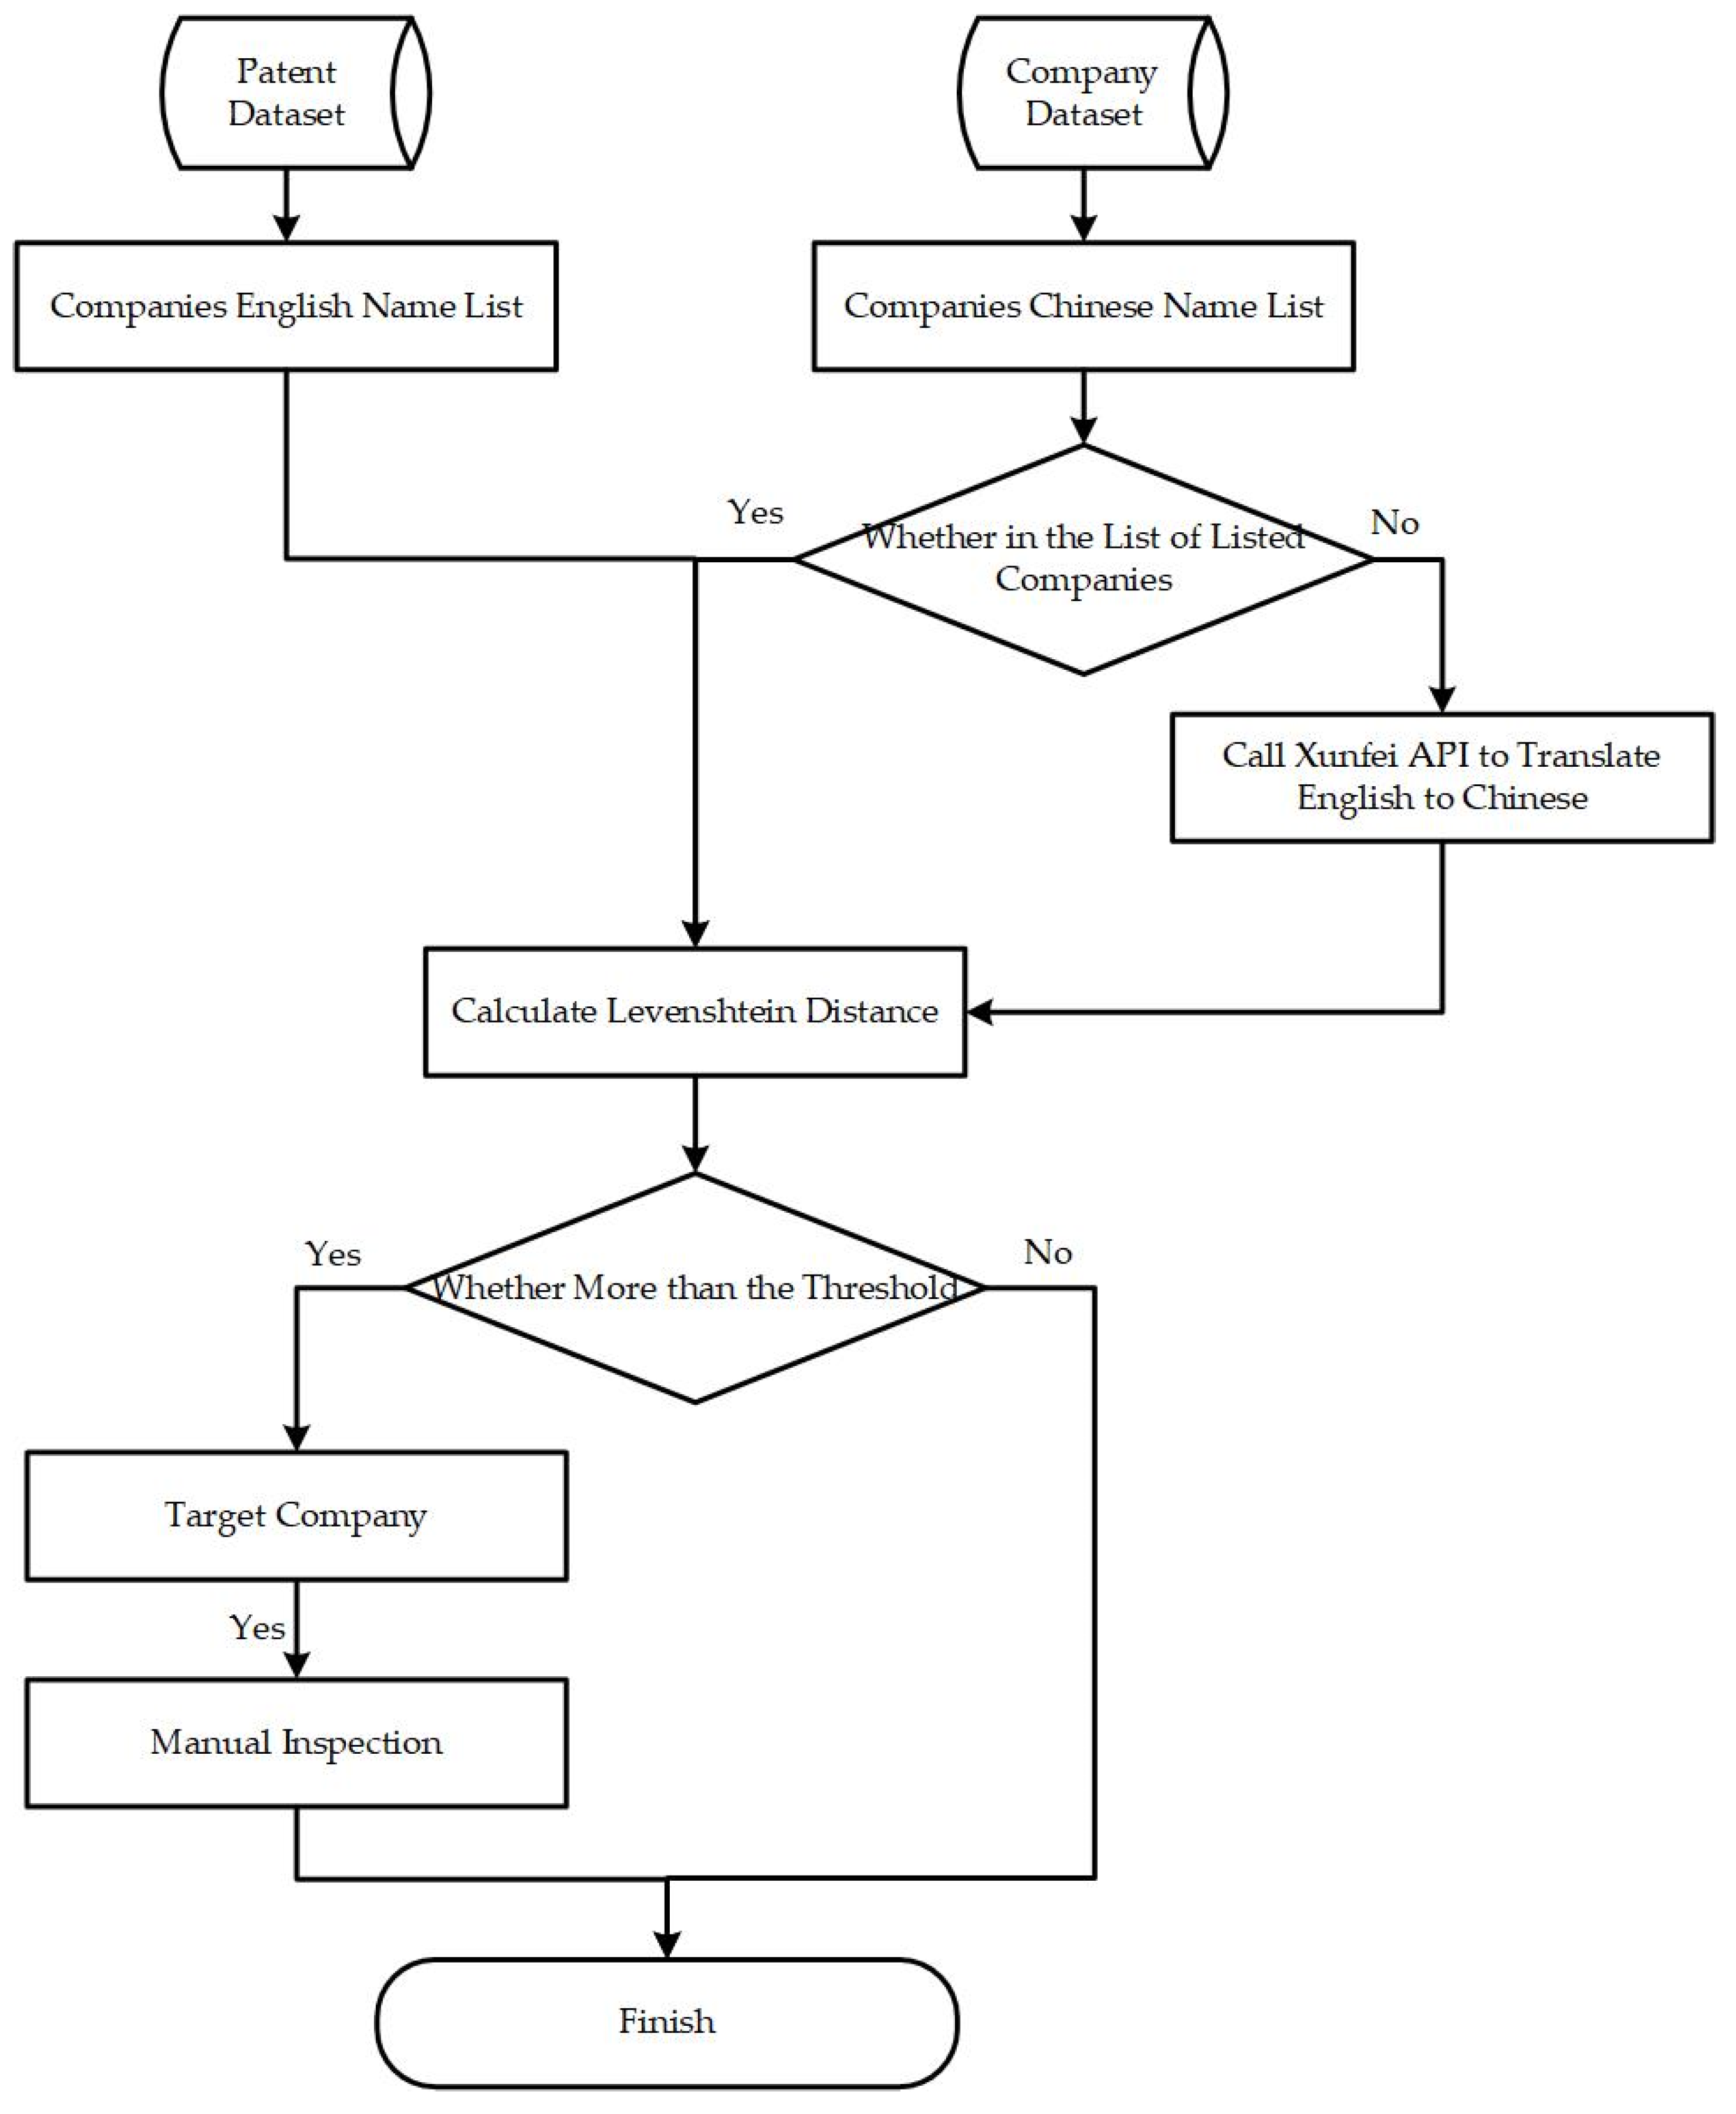
Due to different databases, most of the English names of the same company in the English list of patents and companies are not the same, and there are difficulties in calculating the similarity between the English names, as well as in selecting the threshold value;
(2)
There are many companies in the patent publication unit, and the export field often contains abbreviations. There may be non-directly translated names, so the accuracy of direct translation is difficult to ensure.
Based on the above two problems, this paper designs the data match process based on edit distance, as shown in Figure 3, to minimize the time cost under the premise of ensuring accuracy. The edit distance, i.e., Levenshtein Distance [53], between strings S1 and S2, is calculated as in Equation (1), where i denotes the subscript of string S1 and j denotes the subscript of string S2. The idea of the algorithm is that a minimum number of conversions are required to convert string S1 to string S2, with deletion, insertion, and substitution noted as one. The algorithm can calculate the similarity of strings of unequal length, and the effect is better than the cosine similarity and other traditional similarity calculation methods.
lev s 1 , s 2 ( i , j ) = { max ( i , j ) min ( i , j ) = 0 min { lev s 1 , s 2 ( i 1 , j ) + 1 lev s 1 , s 2 ( i , j 1 ) + 1 lev s 1 , s 2 ( i 1 , j 1 ) + 1 ( s 1 i s 2 j ) otherwise
The network was constructed by extracting nodes and links from the record table, as depicted in Figure 2. Specifically, each record in the table represents a node and the relationships in the table form edges. Nodes and edges can be easily extracted from structured tables using Python 3.6 programs.
According to the process shown in Figure 3, for Chinese companies in the supply chain:
(1)
First, the names are matched with the comparison table of Chinese and English names of listed companies, and a total of 5551 companies’ names can be matched in the table;
(2)
For the 287,173 Chinese company names that are not in the cross-reference table, they are matched again after using the Xunfei translation API;
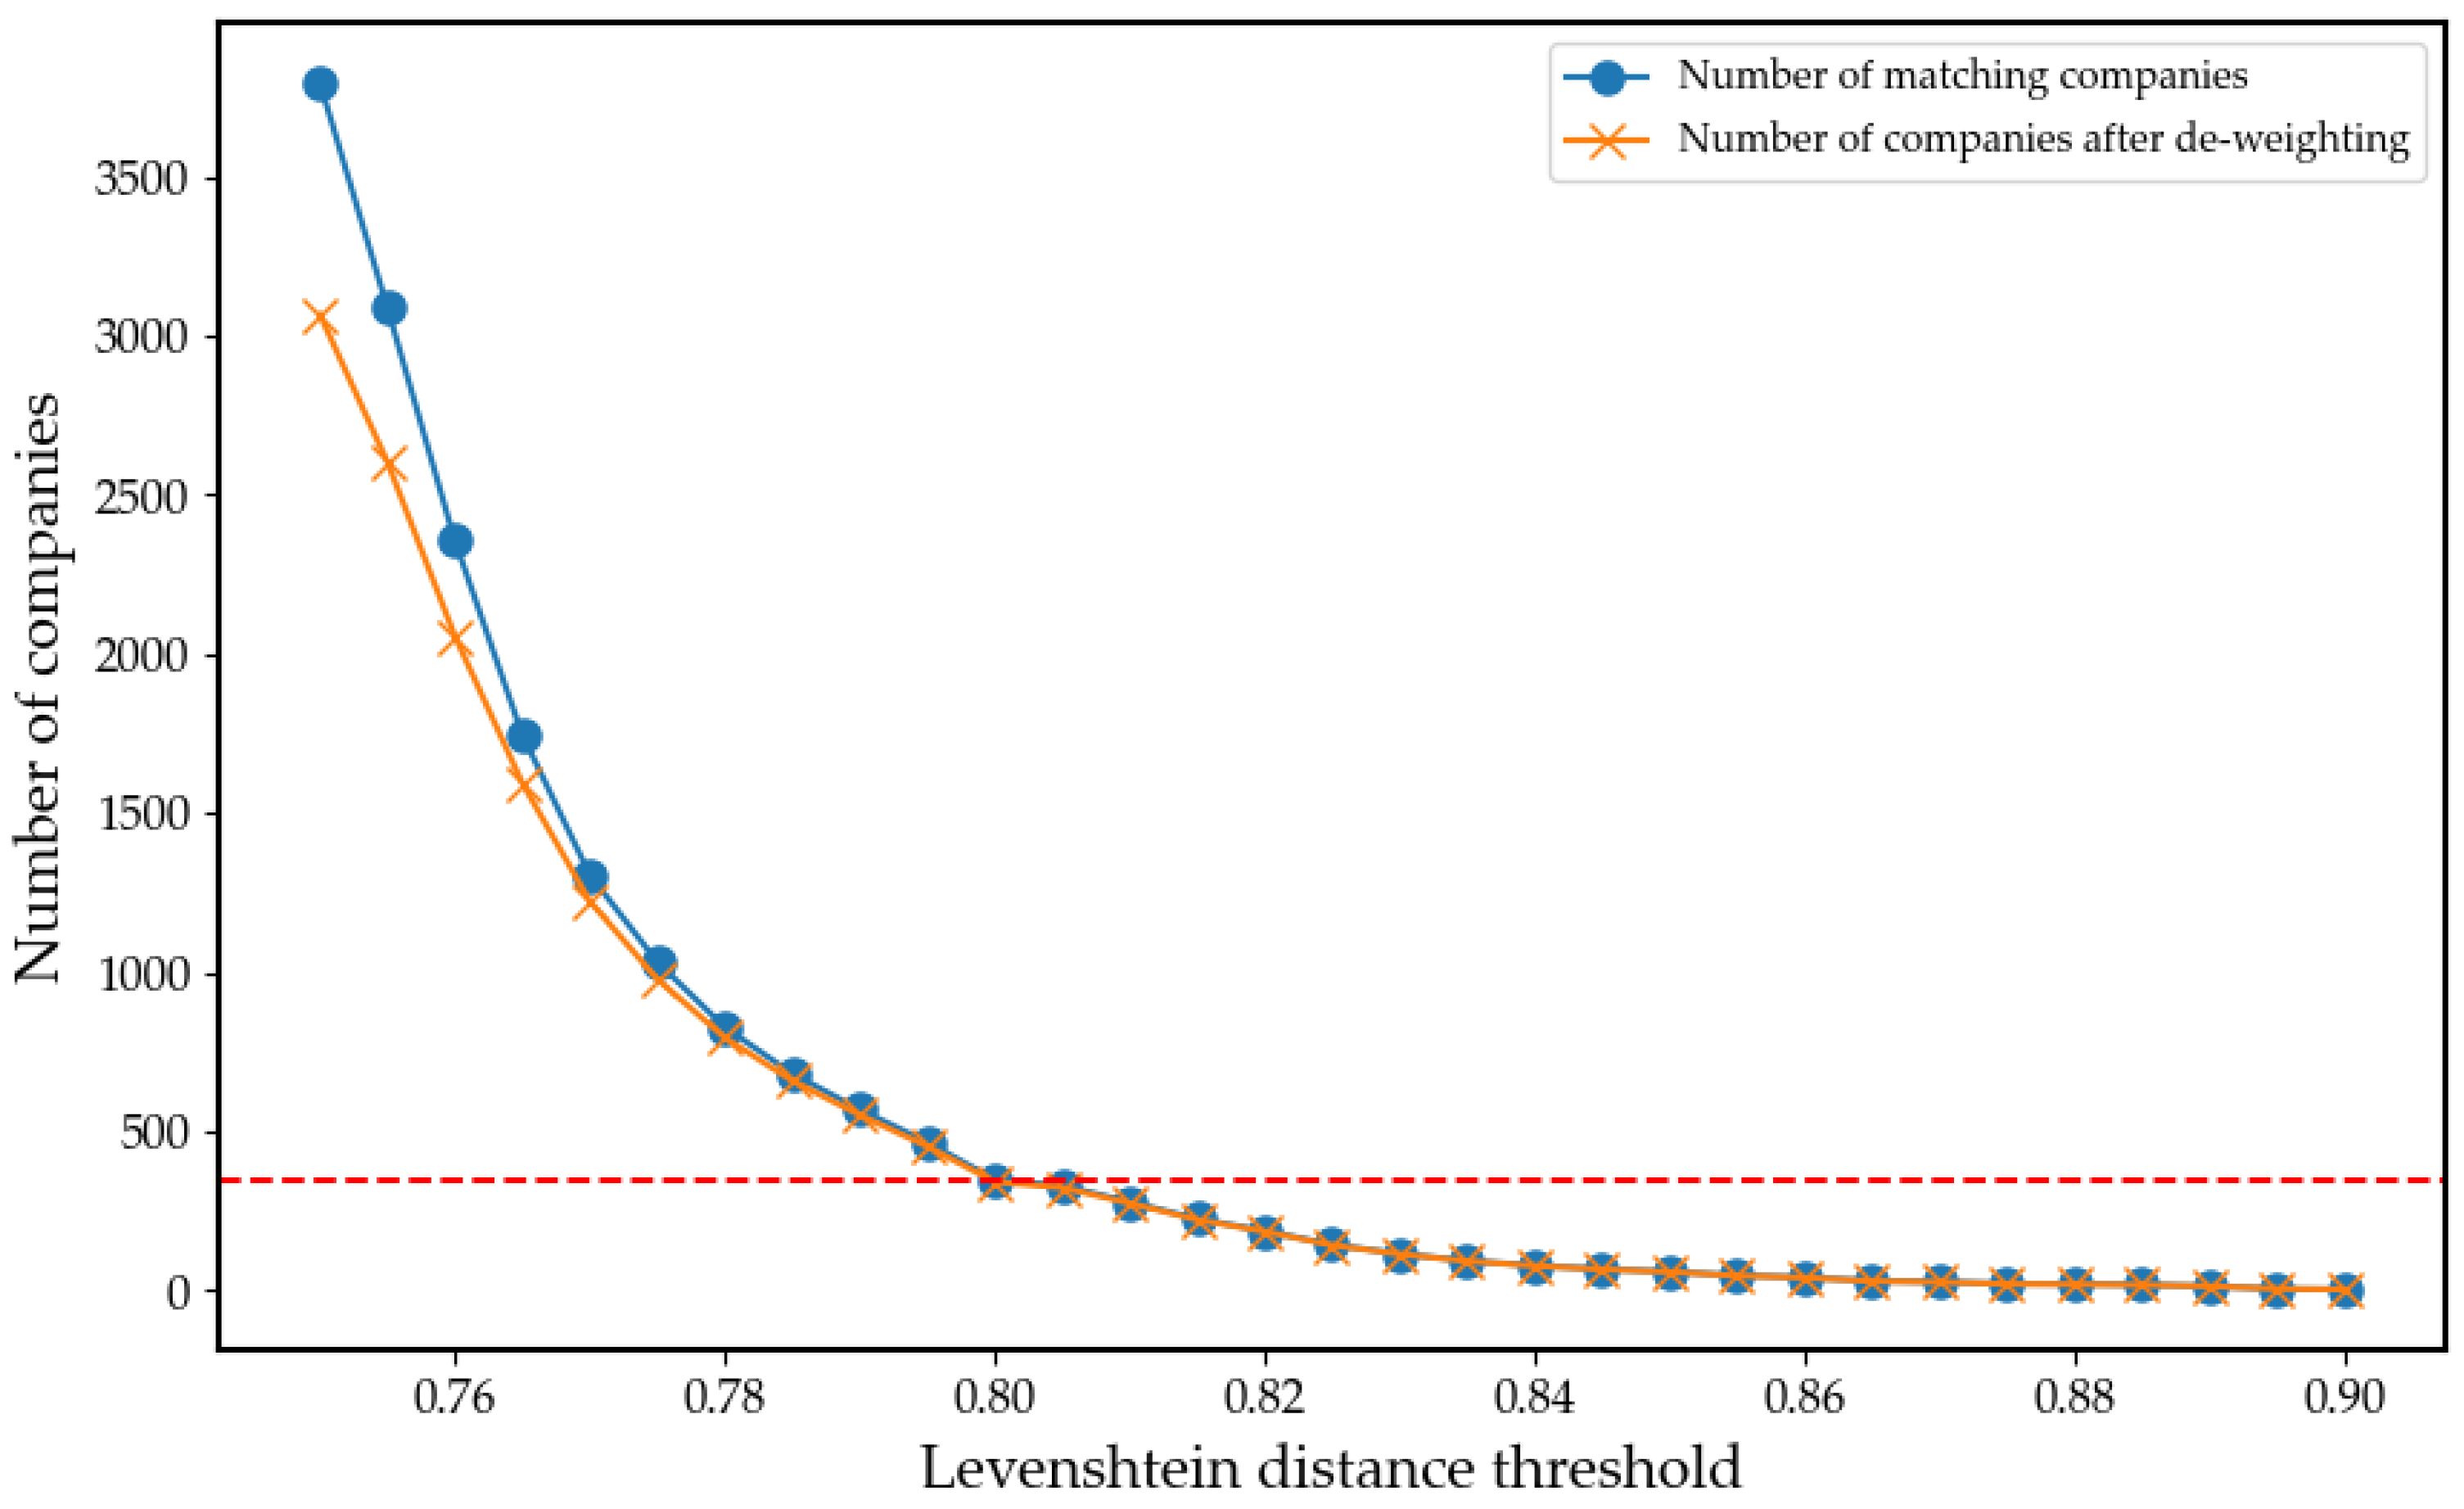
(3)
Then, obtain the curve of the threshold, match out companies, and choose the target threshold. Calculate the editing distance with the list of companies obtained from the patent, which is larger than the threshold value to record the English names in the control table;
(4)
Manually check the matching results and correct 30 incorrect translation results.
After converting all published units in the supply chain into English, de-emphasize them, and finally obtain 341 corporate organizations entities in China’s CNC machine tool and manufacturing-related AI industry, and construct the English and Chinese control table of the corporate organizations for the extraction of the subsequent cooperative relationship.

3.3. Graph Conversion and Representation Learning

Considering the interdependence between links in different layers, Yang et al. [18] argue that two nodes in the focal layer are more likely to interact closely if they have common neighbors or are connected to an edge in the support layer. Specifically, for two nodes that were not originally connected in the focus layer, a new link should be created between them in the aggregation layer. In the following case, a new connection should be established between them in the aggregation network, as shown in Figure 4.
After aggregating the network, there is rich information in the network and we need to consider models related to node information, network structure, and node attributes simultaneously. Therefore, the GATNE model [54] is chosen for representation learning. This model is selected for representation learning based on the aggregated network features. The GATNE model, known for its effectiveness in learning node representations in a multi-relational graph, utilizes attention mechanisms to weigh the importance of different neighbors of a node. This feature is particularly beneficial in context, where nodes can have diverse types of relationships and roles within the network. By leveraging these attention mechanisms, the GATNE model dynamically adjusts the influence of each neighboring node, leading to a more accurate and representative embedding of each node in the 200-dimensional vector space.
These embeddings are crucial for the link prediction task as they encapsulate the essential features and relational dynamics of the nodes within the network. Converting nodes into high-dimensional vectors enhances the model’s ability to discern potential connections and predict new links more precisely. The uncovering of hidden patterns and potential collaborations within the network, which might not be immediately apparent in the raw graph data, is fundamentally enabled by this process, aligning with the central aim of our study.

3.4. Link Prediction

Link prediction is a critical task in both academic and industrial settings. Predicting the likelihood of creating a link between two nodes in a network that have not yet created a connecting edge, by using known information about the network nodes as well as the network structure, is defined as a link prediction problem [55,56]. Link prediction tasks are used in a variety of domains, such as the identification of missing links in criminal networks [57], as well as the prediction of investor behavior [58]. Many economic and social phenomena can be used as network inputs, and similarly, link prediction can be used to predict possible market convergence. As supply chain and technology networks are dynamic and evolve rapidly, predicting future changes is increasingly essential.
Link prediction is a classification problem that neural networks can solve through training. By mining node features after representational learning, the network can accurately predict the appearance or disappearance of a specific link. To predict the market convergence of CNC and AI, a deep learning model is trained to output the embedded vector links of two nodes by inputting vector representations of the two nodes. The model assigns a value of 1 to real and existing links, and a value of 0 to non-existent links.
Network resilience [59,60] refers to the ability of a network to maintain adequate service levels by resisting or quickly recovering from significant network disturbances that impact the user experience. Enhancing network resilience improves SCR and enhances SSCM [61,62]. The calculation of the network robustness before and after the addition of the predicted links proves it.

4. Results and Discussions

In this study, a comprehensive dataset containing supply chain and patent information specific to the field of CNC machine tools and intelligent technologies was used. This data formed the basis for building a detailed knowledge graph of the supply chain, as illustrated in Figure 5. The knowledge graph helps companies make technology collaboration recommendations driven by market convergence.
The main function of our framework is to facilitate a comprehensive and detailed characterization of the nodes in a knowledge graph. This characterization process involves analyzing each node based on its attributes, relationships, and broader context within the network. This approach allows for a meaningful in-depth analysis of each company’s market position, technological capabilities, and innovation potential. This is particularly important for analyzing a company’s potential technological direction of development. In addition, the framework helps to provide personalized decision support to companies in the CNC machine tool industry. This personalized approach ensures that the recommendations are relevant and actionable, thereby improving the company’s SCR and SSCM, helping the organization make informed decisions, and reconciling economic goals with social outcomes, as technological advances are closely linked to supply chain dynamics.

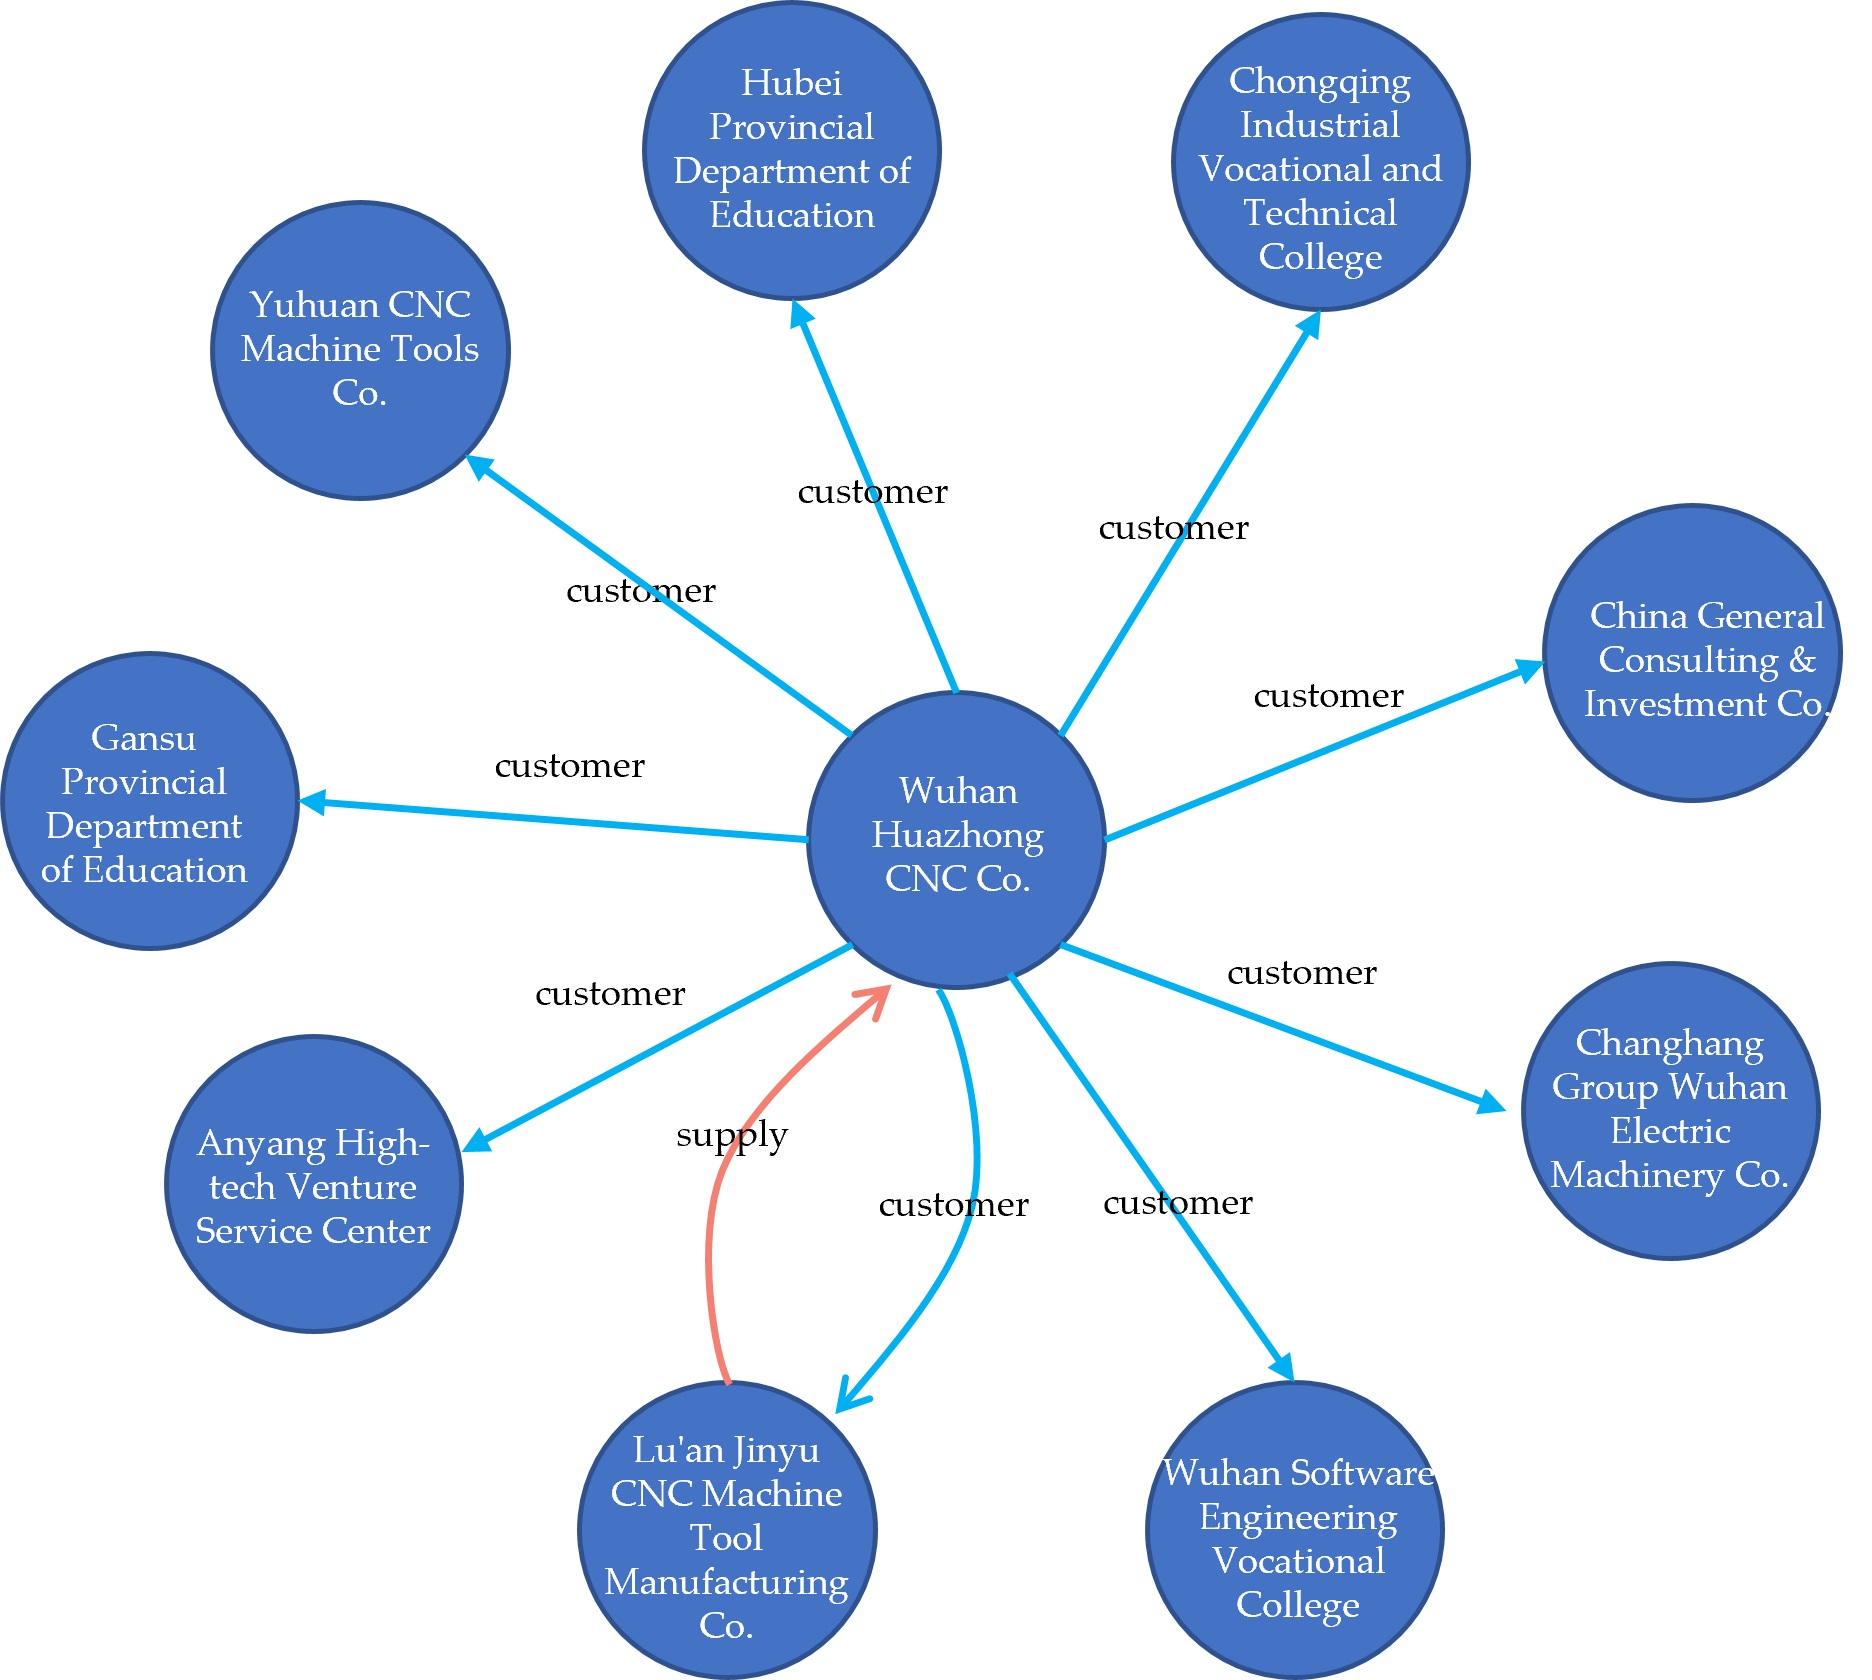
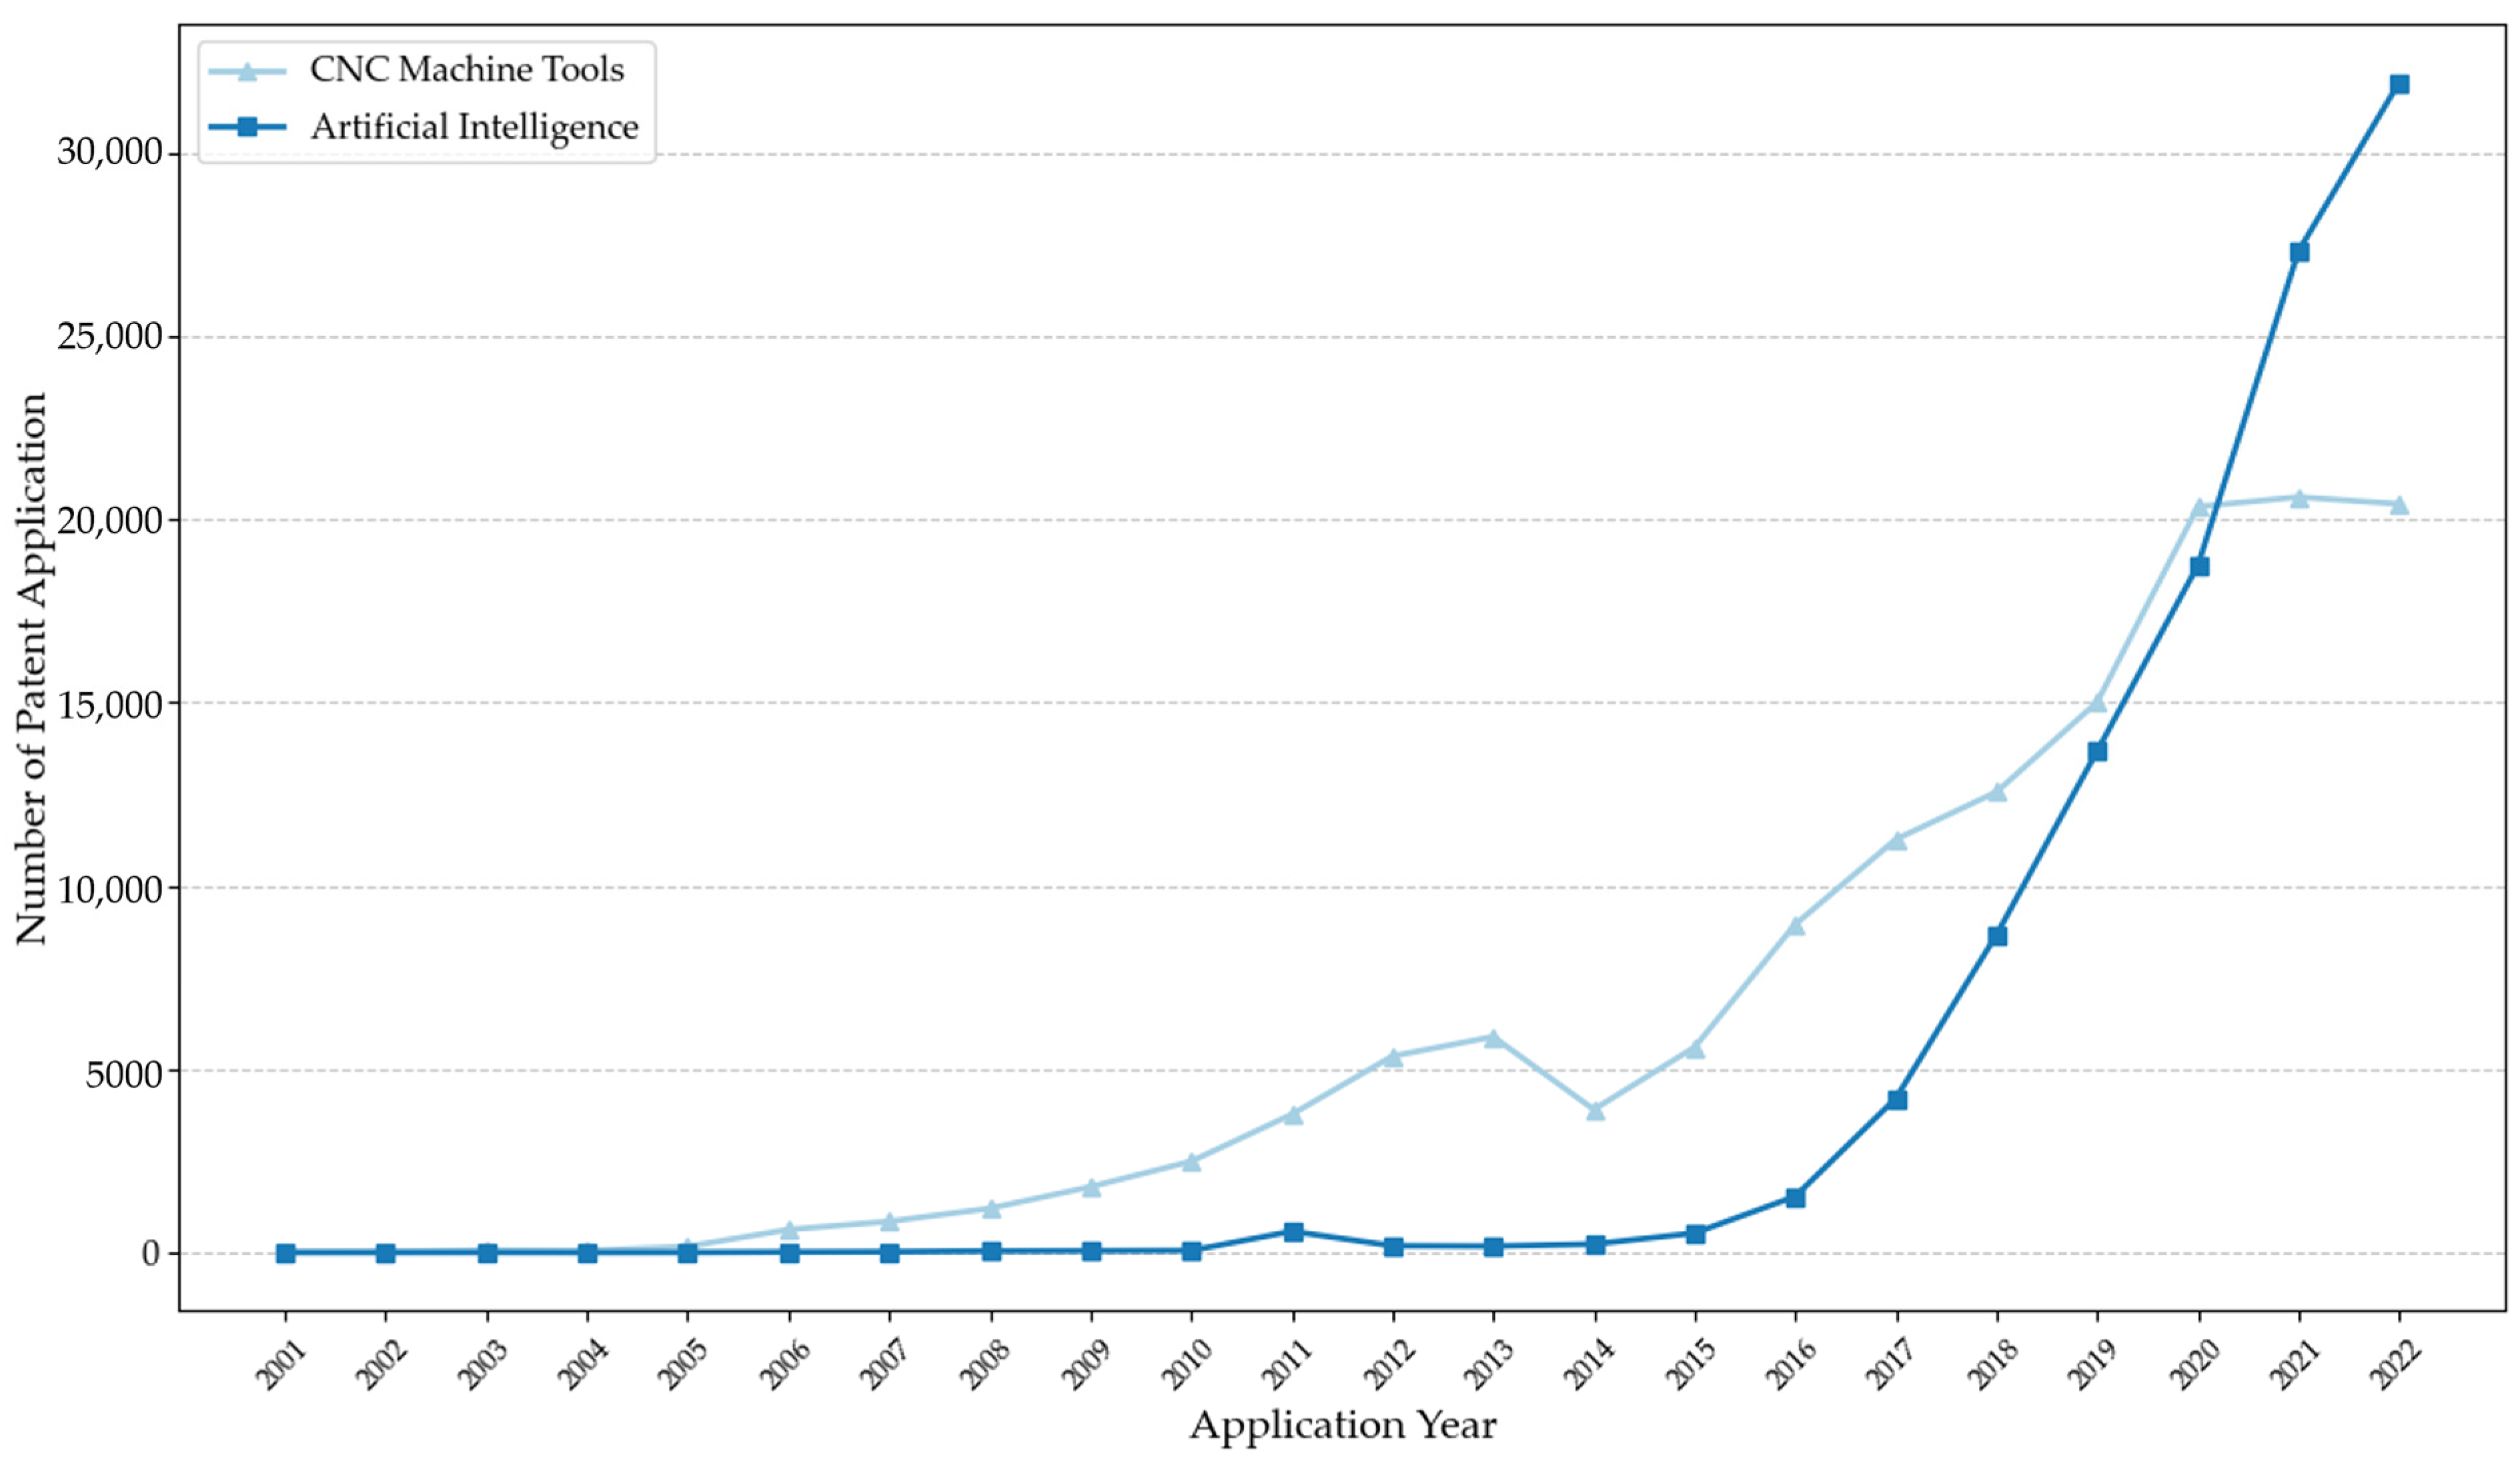
4.1. Descriptive Analysis

The construction of a convergence network for AI and CNC machine tools involved analyzing diverse sources, including patents and supply chain data. The methodology is initiated with the extraction of pertinent technology terms from the existing literature on AI and CNC machines, leading to the development of a comprehensive set of search queries (see Appendix A). These queries facilitated the retrieval of 141,052 patents in CNC machine tools and 108,117 in AI from the Derwent Innovation Index. Each patent record comprised details such as title, publication number, organization, abstract, citations, and publication year. The latest data in these datasets were recorded up to December 2023.
The development of CNC machine tools technology and AI technology is shown in Figure 6. The timeline shows a relatively steady increase in patents for CNC machine tools technology, with a notable increase that has become more pronounced in recent years. In contrast, AI technology shows a more exponential growth pattern, with a sharp increase in patent applications, particularly in the last few years shown. This surge in AI-related innovation coincides with significant advances in computing power and data analysis capabilities. The intersection of CNC machine tools and AI technology is indicative of a growing interest in integrating intelligent automation into manufacturing processes. The accelerated growth in AI patent applications suggests an increasingly important role for AI in enhancing the precision, efficiency, and capabilities of CNC machine tools [63,64].
The steep upward trajectory of AI also reflects broader trends in digital transformation and Industry 4.0, where AI is a key driver of change across various industries [65,66]. Given the critical role of AI in enabling smart manufacturing, the data from Figure 6 underscores the strategic importance of investing in AI research and development to maintain a competitive advantage in the field of advanced manufacturing.
To extract the corporate entities and technology cooperation relationships in the field of CNC machine tools and AI in China, this paper extracts the names of all the corporate organizations from the “Patentee” field of the patents, with a total of 69,989 entries after de-emphasis, and a total of 292,724 companies in the entire supply chain, as shown in Table 1.
The study focused on the evolutionary trend between the number of companies and the Levenshtein distance threshold. The data matching procedure mentioned in Section 3.2 facilitated this study. Figure 7 illustrates the selection of thresholds, which was critical to ensuring the integrity and reliability of the name matching process, as it directly affected the quality of the data aggregation and subsequent analysis. A key conclusion from the analysis is that there is a significant saturation of matching accuracy when the Levenstein distance threshold reaches 0.8 shown as dashed red line in Figure 7, and above this value, while the match rate is higher, the number of companies matched is lower. Therefore, 0.8 has been chosen as the threshold that provides the most reliable matching performance while minimizing false positives.
A two-layer network model was constructed to extract data related to the list of companies accurately matched in the previous analysis across two key networks (the supply chain network and the patent collaboration network). As shown in Figure 8, the model visualizes the interconnections and collaborative relationships between companies in each industry, which informs the recommendation of technology collaboration companies.
The constructed network model consists of two distinct layers: the top layer represents the technology collaboration and the bottom layer symbolizes the supply chain interaction. In this model, nodes are color coded to clearly distinguish between different sectors. Specifically, blue nodes represent companies in the CNC machine tool industry, illustrating their location and linkages in both the technological and supply chain dimensions. Red nodes represent companies operating in the smart sector, highlighting their role and influence in shaping technological collaboration and supply chain dynamics. Yellow nodes represent companies from other different sectors, highlighting the cross-sectoral interactions that exist in these networks.
This color-coded, two-layer network visualization provides a comprehensive and intuitive picture of the complex interactions between technology collaborations and supply chain relationships. It can be used to provide insights into how companies in different industries, particularly the CNC machine tool and intelligence sectors, interact within and across these networks. Mapping these relationships provides valuable insights into structural patterns and collaboration trends in these industries. Such findings are critical for identifying actors in the networks, potential opportunities for collaboration, and strategic tries.
Figure 9 presents a refined network visualization, focusing exclusively on companies that have established cooperative relationships.
A striking observation from Figure 9 is the apparent concentration and intensity of technology cooperation among companies compared to market cooperation. The density and clustering of nodes in the technology layer visually represents this disparity. The nodes in this layer are more closely knit and numerous, indicating a higher degree of collaboration and interconnectedness in technology. This can be attributed to the increasing importance of technological innovation and development in driving competitive advantage and strategic partnerships in modern industries.
In contrast, while still significant, the supply chain layer shows a comparatively sparse and less clustered arrangement of nodes. This suggests that while market cooperation is prevalent, it tends to be more dispersed and possibly involves a wider variety of less intensive partnerships.
The visual comparison of these two layers in Figure 9 provides critical insights into the dynamics of corporate cooperation. It highlights the current trend where technology-driven partnerships are becoming more central to business strategies than traditional market collaborations. This tendency underscores the evolving nature of corporate relationships in the digital age, where technological prowess and innovation are key drivers of business success and industry leadership.

4.2. Graph Conversion

Data from the supply chain layer are integrated into the technology layer through graph transformation rules. As shown in Figure 10, this process is a critical step in understanding the potential intersections and synergies between technological partnerships and supply chain collaborations.
The underlying premise of the approach is based on the hypothesis that supply partnerships between firms can indicate potential technological cooperation opportunities. This assumption is rooted in the observation that companies engaged in technological collaborations often share compatible goals, resources, and capabilities, which could be leveraged in supply chain contexts. Graph transformation rules were applied to operationalize this concept, enabling the inference of potential supply chain relationships from existing technological partnerships.
Figure 10 demonstrates the integration’s manifestation within the network structure. When two firms are connected in the supply chain network, this relationship is transposed into the technology network, suggesting a potential avenue for technology cooperation. This methodology enables us to create a more enriched and interconnected network model, where the lines between technology and supply chain interactions are blurred, reflecting the multidimensional nature of modern business relationships.
This approach has significant implications for strategic planning and decision-making in businesses. Through identifying potential technological cooperation opportunities from supply partnerships, companies can explore new avenues for collaboration, enhance SCR, optimize their SCM, and potentially gain a competitive advantage. It also provides insights into the evolving nature of business ecosystems, where technology and supply chains are increasingly interlinked, driving innovation and efficiency.

4.3. Graph Representation Learning

In preparation for the link prediction task within the study, the GATNE model was set as the default parameter setting. This approach was instrumental in converting the nodes of the graph into 200-dimensional vectors. The selection of 200 dimensions for the vector representations was based on a balance between computational efficiency and the capacity to capture the complex relationships and attributes inherent in the network’s nodes.
The representation learning models are divided into four groups. The inputs for each model were created from the network in a suitable form. Subsequently, the embedding results were collected, and the classification performance of each model was evaluated using a logistic regression classifier. For the DeepWalk and Node2vec models, the walk length was set to 40, the number of walks to 10, and the window size to 5. The number of training epochs for the neural network models was 200, with a learning rate of 0.001. The output dimension for all models was established at 128. The DeepWalk, LINE, and Node2vec models were built using the TensorFlow 1.14 framework, the GATNE model was constructed using PyTorch, and the metrics were developed using the sklearn package in PyCharm. The performance of each model on each dataset is described in Table 2.
A fine-grained breakdown of the performance metrics of the various models within the aggregated network framework is provided in Table 2, with particular emphasis placed on comparative analysis. The empirical results derived from the research clearly show that the GATNE model exhibits a superior performance in terms of both accuracy and efficiency. This finding is crucial as it validates the effectiveness of the proposed framework, especially in the characterization of nodes within the network. The GATNE model, with its advanced architecture, excels in capturing the complex relationships and attributes of the nodes, thus providing a more detailed and accurate characterization of the network. This ability is attributed to its ability to incorporate node- and edge-specific information for enhanced learning dynamically.

4.4. Link Prediction

To improve the company’s SCR and SSCM, we use link prediction to identify defining characteristics, anticipate market convergence, and provide actionable recommendations. Its purpose is to evaluate the effectiveness of a proposed framework that involves training on a residual graph by concealing a set of edges/non-edges. This is achieved by passing through the original network. The dataset is divided into training, testing, and validation sets based on 75%, 15%, and 15%, respectively. The training set randomly selects 5% of positive edges, while the testing set selects 10%. An equal number of opposing edges are chosen randomly for each edge type. The validation set is utilized to fine-tune the hyperparameters and for early stopping. The test set is used for performance evaluation and only runs once with the tuned hyperparameters. The framework’s link prediction accuracy is 98%.
Based on the predictive analysis of the link prediction model, we have identified several prospective technological partnerships between firms, as shown in Table 3. These link predictions highlight the possibility of enhanced technological synergies and reflect the dynamic nature of industry partnerships in a rapidly evolving corporate landscape.
The results of link prediction were evaluated by calculating the network resilience, as demonstrated in Figure 11. This is a conventional measure of network toughness. In Figure 11, the x-axis represents the number of removed nodes, and the y-axis represents the maximum number of connections. The results demonstrate that the inclusion of predicted links enhances network resilience, which is a crucial discovery for network analysis.
Building on the insights gained from the link prediction results, it can offer informed recommendations to organizations aiming to enhance their SCR and SSCM. These recommendations are predicted on the understanding that the strategic insertion of predicted links can substantially reinforce the supply chain network, thereby mitigating risks and vulnerabilities. This approach is particularly relevant in an era where supply chains are increasingly complex and interdependent. By leveraging the findings from our framework, organizations can identify potential weak links in their supply chains and proactively strengthen these areas, ultimately leading to more resilient and sustainable supply chain practices. Moreover, our analysis underscores the importance of adopting advanced analytical tools in SCM, enabling organizations to navigate the challenges of today’s dynamic business environment more effectively.

5. Conclusions

This article introduces a framework based on multi-source data and graph representation learning methods, utilizing AI technologies to improve SSSCM within the context of market convergence, thereby enhancing SCR. To demonstrate the practical application of this framework, we constructed a detailed knowledge graph focusing on China’s CNC machine tool industry. The graph is tailored for convergent innovation decision support and provides a comprehensive picture of industry characteristics and the potential for technological advancement. We conducted link prediction experiments to validate the model’s accuracy in predicting collaborative entities in the supply chain. The results of these experiments confirm the framework’s effectiveness in practical applications and provide valuable insights. The proposed framework is variable and applicable to a wide range of domains and is a valuable tool for industries seeking technological cooperation to achieve SSCM.
Despite its contribution, this study has several limitations that invite further research efforts. On the one hand, it relies only on data from listed companies in China, which may only partially represent global supply chain management practices. However, future researchers can expand on this framework if they collect enough data. On the other hand, the reliance on company-specific dictionaries may limit the breadth of the research findings. In addition, the nature of database access and search queries may also affect the research results. Future research could build on this work by incorporating more diverse data sources and exploring different research streams. These advances will improve the reliability of the findings and provide a more comprehensive understanding of the application of AI in industry-specific supply chain management and SSCM.

Author Contributions

Methodology, S.Z. and Y.L. (Yuhan Liu); validation, S.Z.; data curation, S.Z.; writing—original draft preparation, S.Z.; writing—review and editing, Y.L. (Yufei Liu) and Y.L. (Yuhan Liu); visualization, S.Z.; funding acquisition, Y.L. (Yufei Liu). All authors have read and agreed to the published version of the manuscript.

Funding

This research was funded by the National Natural Science Foundation of China [grant numbers 72104224, 71974107, L2224053, L2224059, L2124002, 91646102, and L1924058] and the Construction Project of China Knowledge Center for Engineering Sciences and Technology [grant number CKCEST-2023-1-7].

Institutional Review Board Statement

Not applicable.

Informed Consent Statement

Not applicable.

Data Availability Statement

Publicly available datasets were analyzed in this study. The data can be found here: https://derwentinnovation.clarivate.com.cn/ui/en/#/home (accessed on 30 November 2023).

Conflicts of Interest

The authors declare no conflicts of interest.

Appendix A

Search query of CNC Machine Tools patents in DI database:
ALLD = ((machin* tool*) OR (machin* cent*) OR (milling cent*) OR (grinding cent*) OR (NC machin*) OR (numerical control machin*) OR (numerical control) OR (computer numerical control) OR (NC system) OR (numerical control system) OR (NC technology) OR (numerical control technology)) AND ALLD = ((open loop) OR (closed loop) OR ((semi-closed loop) OR (half closed loop)) OR (fieldbus OR profibus) OR (motion control card) OR (((pulse string) OR (pulse train)) AND control) OR software OR ((man-machine interaction) OR (human–computer interaction) OR HMI OR HCI) OR (Intelligent servo) OR (Data validation) OR (linear grating) OR (on-machine test) OR (on machine verification) OR OMV OR (PLC AND ((power supply) OR (CPU OR (Central Process Unit)) OR (storage OR memorized OR storer) OR (input unit) OR (output unit)) OR GPU OR NPU) OR (Spindle motor) OR (Feed shaft motor) OR (feed motor) OR (sensor* OR transduc* OR transmitter* OR element* OR transformer* OR synchronizer* OR control* OR motion*) OR (optical-electricity encoder) OR (optical encoder) OR SQP OR (approach switch) OR (proximity switch) OR ecvt OR dapt OR presductors OR (liquid level sensor) OR (level sensing device) OR inducton OR (velocity pickup) OR (MCA-BTA) OR (fieldbus AND protocols) OR ((3-axis) OR (three-axis)) OR ((5-axis) OR (five-axis)) OR (edge AND (intelligent module)) OR ((NI Motion) OR (process monitoring) OR (process management))) AND AD < = (20221230) AND AD > = (20010101) ACB = ((CN) OR (TW) OR (HK) OR (MO))
Search query of artificial intelligence patents in DI database:
ALLD = ((artificial ADJ intelligence) OR (machine ADJ learning) OR (deep ADJ learning) OR (rein-forcement ADJ learning) OR (Transfer ADJ learning)) AND AD < = (20221230) AND AD > = (20010101) AND ACB = ((CN) OR (TW) OR (HK) OR (MO))

References

  1. Lucas, H.C.; Goh, J.M. Disruptive Technology: How Kodak Missed the Digital Photography Revolution. J. Strateg. Inf. Syst. 2009, 18, 46–55. [Google Scholar] [CrossRef]
  2. Gölgeci, I.; Kuivalainen, O. Does Social Capital Matter for Supply Chain Resilience? The Role of Absorptive Capacity and Marketing-Supply Chain Management Alignment. Ind. Mark. Manag. 2020, 84, 63–74. [Google Scholar] [CrossRef]
  3. Sebastiao, H.J.; Golicic, S. Supply chain strategy for nascent firms in emerging technology markets. J. Bus. Logist. 2008, 29, 75–91. [Google Scholar] [CrossRef]
  4. Sarfraz, M.; Khawaja, K.F.; Han, H.; Ariza-Montes, A.; Arjona-Fuentes, J.M. Sustainable Supply Chain, Digital Transformation, and Blockchain Technology Adoption in the Tourism Sector. Humanit. Soc. Sci. Commun. 2023, 10, 557. [Google Scholar] [CrossRef]
  5. Akbari, M.; Hopkins, J.L. Digital Technologies as Enablers of Supply Chain Sustainability in an Emerging Economy. Oper. Manag. Res. 2022, 15, 689–710. [Google Scholar] [CrossRef]
  6. Yu, Z.; Waqas, M.; Tabish, M.; Tanveer, M.; Haq, I.U.; Khan, S.A.R. Sustainable Supply Chain Management and Green Technologies: A Bibliometric Review of Literature. Environ. Sci. Pollut. Res. 2022, 29, 58454–58470. [Google Scholar] [CrossRef] [PubMed]
  7. Sánchez-Flores, R.B.; Cruz-Sotelo, S.E.; Ojeda-Benitez, S.; Ramírez-Barreto, M.E. Sustainable Supply Chain Management—A Literature Review on Emerging Economies. Sustainability 2020, 12, 6972. [Google Scholar] [CrossRef]
  8. Rajeev, A.; Pati, R.K.; Padhi, S.S.; Govindan, K. Evolution of Sustainability in Supply Chain Management: A Literature Review. J. Clean. Prod. 2017, 162, 299–314. [Google Scholar] [CrossRef]
  9. Lee, M.; Cho, Y. Consumer Perception of a New Convergence Product: A Theoretical and Empirical Approach. Technol. Forecast. Soc. Chang. 2015, 92, 312–321. [Google Scholar] [CrossRef]
  10. Zhu, C.; Motohashi, K. Identifying the Technology Convergence Using Patent Text Information: A Graph Convolutional Networks (GCN)-Based Approach. Technol. Forecast. Soc. Chang. 2022, 176, 121477. [Google Scholar] [CrossRef]
  11. No, H.J.; Park, Y. Trajectory Patterns of Technology Fusion: Trend Analysis and Taxonomical Grouping in Nanobiotechnology. Technol. Forecast. Soc. Chang. 2010, 77, 63–75. [Google Scholar] [CrossRef]
  12. Pan, X.; Ai, B.; Li, C.; Pan, X.; Yan, Y. Dynamic Relationship among Environmental Regulation, Technological Innovation and Energy Efficiency Based on Large Scale Provincial Panel Data in China. Technol. Forecast. Soc. Chang. 2019, 144, 428–435. [Google Scholar] [CrossRef]
  13. Klarin, A.; Suseno, Y.; Lajom, J.A.L. Systematic Literature Review of Convergence: A Systems Perspective and Re-Evaluation of the Convergence Process. IEEE Trans. Eng. Manag. 2023, 70, 1531–1543. [Google Scholar] [CrossRef]
  14. Boccaletti, S.; Bianconi, G.; Criado, R.; Del Genio, C.I.; Gómez-Gardeñes, J.; Romance, M.; Sendiña-Nadal, I.; Wang, Z.; Zanin, M. The Structure and Dynamics of Multilayer Networks. Phys. Rep. 2014, 544, 1–122. [Google Scholar] [CrossRef] [PubMed]
  15. Hogan, A.; Blomqvist, E.; Cochez, M.; D’amato, C.; Melo, G.D.; Gutierrez, C.; Kirrane, S.; Gayo, J.E.L.; Navigli, R.; Neumaier, S.; et al. Knowledge Graphs. ACM Comput. Surv. 2022, 54, 71. [Google Scholar] [CrossRef]
  16. Bellomarini, L.; Fayzrakhmanov, R.R.; Gottlob, G.; Kravchenko, A.; Laurenza, E.; Nenov, Y.; Reissfelder, S.; Sallinger, E.; Sherkhonov, E.; Vahdati, S.; et al. Data Science with Vadalog: Knowledge Graphs with Machine Learning and Reasoning in Practice. Future Gener. Comput. Syst. 2022, 129, 407–422. [Google Scholar] [CrossRef]
  17. Wang, X.; Bo, D.; Shi, C.; Fan, S.; Ye, Y.; Yu, P.S. A Survey on Heterogeneous Graph Embedding: Methods, Techniques, Applications and Sources. IEEE Trans. Big Data 2023, 9, 415–436. [Google Scholar] [CrossRef]
  18. Yang, G.; Kang, Y.; Zhu, X.; Zhu, C.; Xiao, G. Info2vec: An Aggregative Representation Method in Multi-Layer and Heterogeneous Networks. Inf. Sci. 2021, 574, 444–460. [Google Scholar] [CrossRef]
  19. Seuring, S.; Müller, M. From a Literature Review to a Conceptual Framework for Sustainable Supply Chain Management. J. Clean. Prod. 2008, 16, 1699–1710. [Google Scholar] [CrossRef]
  20. Ahi, P.; Searcy, C. A Comparative Literature Analysis of Definitions for Green and Sustainable Supply Chain Management. J. Clean. Prod. 2013, 52, 329–341. [Google Scholar] [CrossRef]
  21. Saqib, Z.A.; Qin, L.; Menhas, R.; Lei, G. Strategic Sustainability and Operational Initiatives in Small- and Medium-Sized Manufacturers: An Empirical Analysis. Sustainability 2023, 15, 6330. [Google Scholar] [CrossRef]
  22. Saqib, Z.A.; Zhang, Q. Impact of Sustainable Practices on Sustainable Performance: The Moderating Role of Supply Chain Visibility. J. Manuf. Technol. Manag. 2021, 32, 1421–1443. [Google Scholar] [CrossRef]
  23. Park, A.; Li, H. The Effect of Blockchain Technology on Supply Chain Sustainability Performances. Sustainability 2021, 13, 1726. [Google Scholar] [CrossRef]
  24. Reyna-Castillo, M.; Vera Martínez, P.S.; Farah-Simón, L.; Simón, N. Social Sustainability Orientation and Supply Chain Performance in Mexico, Colombia and Chile: A Social-Resource-Based View (SRBV). Sustainability 2023, 15, 3751. [Google Scholar] [CrossRef]
  25. Ye, F.; Liu, K.; Li, L.; Lai, K.-H.; Zhan, Y.; Kumar, A. Digital Supply Chain Management in the COVID-19 Crisis: An Asset Orchestration Perspective. Int. J. Prod. Econ. 2022, 245, 108396. [Google Scholar] [CrossRef] [PubMed]
  26. Yawar, S.A.; Seuring, S. The Role of Supplier Development in Managing Social and Societal Issues in Supply Chains. J. Clean. Prod. 2018, 182, 227–237. [Google Scholar] [CrossRef]
  27. Klassen, R.D.; Vereecke, A. Social Issues in Supply Chains: Capabilities Link Responsibility, Risk (Opportunity), and Performance. Int. J. Prod. Econ. 2012, 140, 103–115. [Google Scholar] [CrossRef]
  28. Alghababsheh, M.; Gallear, D. Socially Sustainable Supply Chain Management and Suppliers’ Social Performance: The Role of Social Capital. J. Bus. Ethics 2021, 173, 855–875. [Google Scholar] [CrossRef]
  29. Whybark, C. Convergenomics: Strategic Innovation in the Convergence Era. Serv. Bus. 2010, 4, 305–306. [Google Scholar] [CrossRef]
  30. Rosenberg, N. Perspectives on Technology; Cambridge University Press: Cambridge, UK, 1976; ISBN 978-0-521-29011-1. [Google Scholar]
  31. Fernández-Portillo, A.; Almodóvar-González, M.; Hernández-Mogollón, R. Impact of ICT Development on Economic Growth. A Study of OECD European Union Countries. Technol. Soc. 2020, 63, 101420. [Google Scholar] [CrossRef]
  32. Meijers, H. Does the Internet Generate Economic Growth, International Trade, or Both? Int. Econ. Econ. Policy 2014, 11, 137–163. [Google Scholar] [CrossRef]
  33. Park, H.S. Technology Convergence, Open Innovation, and Dynamic Economy. J. Open Innov. Technol. Mark. Complex. 2017, 3, 24. [Google Scholar] [CrossRef]
  34. Aaldering, L.J.; Leker, J.; Song, C.H. Uncovering the Dynamics of Market Convergence through M&A. Technol. Forecast. Soc. Chang. 2019, 138, 95–114. [Google Scholar] [CrossRef]
  35. Liu, Y.; Wang, G.; Zhou, Y.; Liu, Y. Advanced Technology Evolution Pathways of Nanogenerators: A Novel Framework Based on Multi-Source Data and Knowledge Graph. Nanomaterials 2022, 12, 838. [Google Scholar] [CrossRef] [PubMed]
  36. Zhou, Y.; Li, Z.; Liu, Y.; Deng, F. Network Proximity and Communities in Innovation Clusters Across Knowledge, Business, and Geography: Evidence From China. IEEE Trans. Eng. Manag. 2021, 68, 1388–1397. [Google Scholar] [CrossRef]
  37. Zhou, Y.; Dong, F.; Kong, D.; Liu, Y. Unfolding the Convergence Process of Scientific Knowledge for the Early Identification of Emerging Technologies. Technol. Forecast. Soc. Chang. 2019, 144, 205–220. [Google Scholar] [CrossRef]
  38. Chen, J.; Zhang, K.; Zhou, Y.; Liu, Y.; Li, L.; Chen, Z.; Yin, L. Exploring the Development of Research, Technology and Business of Machine Tool Domain in New-Generation Information Technology Environment Based on Machine Learning. Sustainability 2019, 11, 3316. [Google Scholar] [CrossRef]
  39. Kong, D.; Yang, J.; Li, L. Early Identification of Technological Convergence in Numerical Control Machine Tool: A Deep Learning Approach. Scientometrics 2020, 125, 1983–2009. [Google Scholar] [CrossRef]
  40. Liu, X.; Tang, J. Network Representation Learning: A Macro and Micro View. AI Open 2021, 2, 43–64. [Google Scholar] [CrossRef]
  41. Perozzi, B.; Al-Rfou, R.; Skiena, S. DeepWalk: Online Learning of Social Representations. In Proceedings of the 20th ACM SIGKDD International Conference on Knowledge Discovery and Data Mining, New York, NY, USA, 24–27 August 2014; pp. 701–710. [Google Scholar]
  42. Grover, A.; Leskovec, J. Node2vec: Scalable Feature Learning for Networks. In Proceedings of the 22nd ACM SIGKDD International Conference on Knowledge Discovery and Data Mining, San Francisco, CA, USA, 13–17 August 2016; pp. 855–864. [Google Scholar]
  43. Tang, J.; Qu, M.; Wang, M.; Zhang, M.; Yan, J.; Mei, Q. LINE: Large-Scale Information Network Embedding. In Proceedings of the 24th International Conference on World Wide Web, Florence, Italy, 18–22 May 2015; International World Wide Web Conferences Steering Committee: Geneva, Switzerland; 2015; pp. 1067–1077. [Google Scholar]
  44. Kipf, T.N.; Welling, M. Semi-Supervised Classification with Graph Convolutional Networks. In Proceedings of the 5th International Conference on Learning Representations, Toulon, France, 24 April 2017. [Google Scholar]
  45. Kipf, T.N.; Welling, M. Variational Graph Auto-Encoders. In Proceedings of the NIPS Workshop on Bayesian Deep Learning, Barcelona, Spain, 9 December 2016. [Google Scholar]
  46. Veličković, P.; Cucurull, G.; Casanova, A.; Romero, A.; Lio, P.; Bengio, Y. Graph Attention Networks. In Proceedings of the 6th International Conference on Learning Representations, Toulon, France, 30 April 2018. [Google Scholar]
  47. Wang, X.; Ji, H.; Shi, C.; Wang, B.; Ye, Y.; Cui, P.; Yu, P.S. Heterogeneous Graph Attention Network. In Proceedings of the World Wide Web Conference, San Francisco, CA, USA, 13–17 May 2019; Association for Computing Machinery: New York, NY, USA, 2019; pp. 2022–2032. [Google Scholar]
  48. Yang, C.; Liu, Z.; Zhao, D.; Sun, M.; Chang, E.Y. Network Representation Learning with Rich Text Information. In Proceedings of the Twenty-Fourth International Joint Conference on Artificial Intelligence, Buenos Aires, Argentina, 25–31 July 2015; pp. 2111–2117. [Google Scholar]
  49. Li, X.; Xie, Q.; Jiang, J.; Zhou, Y.; Huang, L. Identifying and Monitoring the Development Trends of Emerging Technologies Using Patent Analysis and Twitter Data Mining: The Case of Perovskite Solar Cell Technology. Technol. Forecast. Soc. Chang. 2019, 146, 687–705. [Google Scholar] [CrossRef]
  50. Del Giudice, M.; Scuotto, V.; Garcia-Perez, A.; Messeni Petruzzelli, A. Shifting Wealth II in Chinese Economy. The Effect of the Horizontal Technology Spillover for SMEs for International Growth. Technol. Forecast. Soc. Chang. 2019, 145, 307–316. [Google Scholar] [CrossRef]
  51. Jeong, S.; Kim, J.-C.; Choi, J.Y. Technology Convergence: What Developmental Stage Are We In? Scientometrics 2015, 104, 841–871. [Google Scholar] [CrossRef]
  52. Choi, J.; Jeong, S.; Kim, K. A Study on Diffusion Pattern of Technology Convergence: Patent Analysis for Korea. Sustainability 2015, 7, 11546–11569. [Google Scholar] [CrossRef]
  53. Cao, B.; Li, Y.; Yin, J. Measuring Similarity between Graphs Based on the Levenshtein Distance. Appl. Math. Inf. Sci. 2013, 7, 169–175. [Google Scholar] [CrossRef]
  54. Cen, Y.; Zou, X.; Zhang, J.; Yang, H.; Zhou, J.; Tang, J. Representation Learning for Attributed Multiplex Heterogeneous Network. In Proceedings of the KDD’19: The 25th ACM SIGKDD Conference on Knowledge Discovery and Data Mining, Anchorage, AK, USA, 4–8 August 2019; pp. 1358–1368. [Google Scholar]
  55. Lu, L.; Zhou, T. Link Prediction in Complex Networks: A Survey. Phys. Stat. Mech. Its Appl. 2011, 390, 1150–1170. [Google Scholar] [CrossRef]
  56. Liben-Nowell, D.; Kleinberg, J. The Link Prediction Problem for Social Networks. In Proceedings of the CIKM03: 12th International Conference on Information and Knowledge, New Orleans, LA, USA, 3–8 November 2003; Association for Computing Machinery: New York, NY, USA, 2003; pp. 556–559. [Google Scholar]
  57. Berlusconi, G.; Calderoni, F.; Parolini, N.; Verani, M.; Piccardi, C. Link Prediction in Criminal Networks: A Tool for Criminal Intelligence Analysis. PLoS ONE 2016, 11, e0154244. [Google Scholar] [CrossRef] [PubMed]
  58. Liang, Y.E.; Yuan, S.-T.D. Predicting Investor Funding Behavior Using Crunchbase Social Network Features. Internet Res. 2016, 26, 74–100. [Google Scholar] [CrossRef]
  59. Kakadia, D.; Ramirez-Marquez, D.J.E. Quantitative Approaches for Optimization of User Experience Based on Network Resilience for Wireless Service Provider Networks. Reliab. Eng. Syst. Saf. 2020, 193, 106606. [Google Scholar] [CrossRef]
  60. Alenazi, M.J.F.; Sterbenz, J.P.G. Comprehensive Comparison and Accuracy of Graph Metrics in Predicting Network Resilience. In Proceedings of the 2015 11th International Conference on the Design of Reliable Communication Networks (DRCN), Kansas City, MO, USA, 24–27 March 2015; pp. 157–164. [Google Scholar]
  61. Ahmadian, N.; Lim, G.J.; Cho, J.; Bora, S. A Quantitative Approach for Assessment and Improvement of Network Resilience. Reliab. Eng. Syst. Saf. 2020, 200, 106977. [Google Scholar] [CrossRef]
  62. Xie, X.; Wu, Y.; Blanco-Gonzalez Tejerob, C. How Responsible Innovation Builds Business Network Resilience to Achieve Sustainable Performance During Global Outbreaks: An Extended Resource-Based View. IEEE Trans. Eng. Manag. 2022, 1–15. [Google Scholar] [CrossRef]
  63. Zhou, J.; Li, P.; Zhou, Y.; Wang, B.; Zang, J.; Meng, L. Toward New-Generation Intelligent Manufacturing. Engineering 2018, 4, 11–20. [Google Scholar] [CrossRef]
  64. Chen, J.; Hu, P.; Zhou, H.; Yang, J.; Xie, J.; Jiang, Y.; Gao, Z.; Zhang, C. Toward Intelligent Machine Tool. Engineering 2019, 5, 679–690. [Google Scholar] [CrossRef]
  65. Tien, J.M. Convergence to Real-Time Decision Making. Front. Eng. Manag. 2020, 7, 204–222. [Google Scholar] [CrossRef]
  66. Hakimi, O.; Liu, H.; Abudayyeh, O. Digital Twin-Enabled Smart Facility Management: A Bibliometric Review. Front. Eng. Manag. 2023. [Google Scholar] [CrossRef]
Figure 1. The proposed framework to identify market convergence.
Sustainability 16 01696 g001
Figure 2. Supply chain data collection process.
Sustainability 16 01696 g002
Figure 3. Data pre-processing based on Levenshtein distance.
Sustainability 16 01696 g003
Figure 4. Rules for graph transformation.
Sustainability 16 01696 g004
Figure 5. Supply chain knowledge graph.
Sustainability 16 01696 g005
Figure 6. Trends in CNC machine tools and artificial intelligence.
Sustainability 16 01696 g006
Figure 7. Data matching process based on Levenshtein distance.
Sustainability 16 01696 g007
Figure 8. Supply chain networks and technology networks.
Sustainability 16 01696 g008
Figure 9. Focus on companies and cooperation networks.
Sustainability 16 01696 g009
Figure 10. Converted aggregation network.
Sustainability 16 01696 g010
Figure 11. The network resilience comparison before and after the addition of predictive links.
Sustainability 16 01696 g011
Table 1. Description of networks.
DatasetNetworkNodeLinkNode Type
Supply ChainSupply Chain292,724564,4843
PatentTechnology69,98946443
Table 2. The performance of models on the aggregation network.
NetworkModelAccuracyPrecisionF1AUC
Aggregation
network
DeepWalk0.527240.437480.292690.54342
Node2vec0.516970.421340.280770.54798
LINE0.512150.428300.264680.50672
GATNE0.989720.568000.353680.57948
Table 3. Technological cooperation of potential companies.
NumberCooperative Companies ACooperative Companies B
1Suzhou Newway Valve Co., Ltd.China Oilfield Services Limited
2Guangdong Tongfa Laser Technology Co., Ltd.Zhuhai Gree Electric Appliance Co., Ltd.
3Sichuan Baijixin Petroleum Technology Co., Ltd.China Oilfield Services Limited
4Nanjing Yuzhong Automation Equipment Co., Ltd.Anhui Jianghuai Automobile Group Co., Ltd.
5Beijing Jingwei Hengrun Technology Co., Ltd.Anhui Jianghuai Automobile Group Co., Ltd.
Disclaimer/Publisher’s Note: The statements, opinions and data contained in all publications are solely those of the individual author(s) and contributor(s) and not of MDPI and/or the editor(s). MDPI and/or the editor(s) disclaim responsibility for any injury to people or property resulting from any ideas, methods, instructions or products referred to in the content.

