Article

Structural Response of a Cement Concrete Pavement with a Buffer Layer to Temperature and Moving-Load Effects

Civil Engineering Department, Shandong Jiaotong University, Jinan 250300, China
*
Author to whom correspondence should be addressed.
Sustainability 2024, 16(4), 1608; https://doi.org/10.3390/su16041608
Submission received: 18 December 2023 / Revised: 9 February 2024 / Accepted: 13 February 2024 / Published: 15 February 2024

Abstract

:
The main issues associated with cement concrete pavements are cracks and broken plates that affect driving comfort and road service life. To ensure sustainable use of the cement concrete, a buffer layer (AC-10) can be introduced between the base and the cement concrete panel. In this study, the interlayer shear test was performed, and the interlayer bonding coefficient under different temperature conditions was determined. The creep test of the buffer layer was also conducted, and the four parameters (E1, E2, η1, and η2) of the Burgers model of the buffer layer were analyzed using regression. According to the parameters obtained from the test, the finite-element model was established, and the moving load was applied to analyze the structural model response under high-, medium-, and low-temperature conditions. The results show that the (1) temperature stress is mainly concentrated in the buffer layer and regions above the structural layer. At low temperatures, the maximum stress at the top of the surface layer is 2.16 MPa, and the vertical strain decreases as a function of depth. (2) Under the combined action of temperature and moving load, the variation ranges of tensile and compressive stresses at the top of the surface layer are the largest; the variation range of the buffer layer and the subsequent structure is small; the maximum warpage deformation of the surface layer is 0.453 mm under high-temperature conditions; and the maximum compression deformation is 0.219 mm under low-temperature conditions. (3) The comprehensive coefficient k c of the fatigue equation was modified, and the comprehensive coefficient k c of the fatigue equation under different vehicle speeds was proposed. This study provides a reference for the sustainable development of cement concrete pavements with buffer layers.

1. Introduction

Early damage to cement concrete pavements, mainly caused by overloads and dynamic loads, so that the cement concrete pavement cannot reach its design life, remains a significant concern. To address this issue, many scholars have proposed the inclusion of a buffer layer between the base layer and cement concrete pavement slab [1,2,3]. The buffer layer reduces the temperature stress and enables shock absorption, ultimately enhancing the performance of cement concrete pavements, thus making them sustainable for use.
The mechanical properties of the buffer layer material play a key role in determining the quality of the cement concrete because it serves as a crucial functional material between the surface and base layers [4,5]. Hu et al. [6] investigated the mechanical properties of wax isolation layers between the base and cement surface layers, which yielded mechanical performance parameters for cement concrete pavements. Itani et al. [7] explored the use of geogrids between asphalt and cement concrete surface layers and concluded that the inclusion of such geogrids significantly improves the shear strength between layers, imparting greater ductility to cement concrete pavements. The aforementioned scholars have demonstrated that the setting of a buffer layer can effectively improve the ductility and service life of a cement concrete pavement and verified the feasibility of the buffer layer in cement concrete pavements. The speed of a vehicle on the road significantly influences the dynamic response of the pavement [8,9,10,11]. Wu [12] used finite-element software to analyze the dynamic response of a cement concrete pavement with an asphalt buffer layer under a moving load and observed that the stress and deflection of the concrete slab decreased with an increase in the combined thickness of the isolation layer and the concrete slab. Cai et al. [5,13,14] investigated the impact of material anisotropy and thin interlayers on the mechanical response of layered pavements under moving-load conditions and observed substantial effects on the design life of the pavements. The asphalt material has viscoelasticity and different properties under different temperature conditions. It is not in line with the actual situation to consider the load condition alone. At the same time, temperature has a significant influence on the tensile stress on the pavement’s surface. Qin et al. [15,16] studied the influence of the pavement surface temperature on the performance of concrete pavements under solar radiation and established a theoretical model for predicting the pavement surface temperature. García and Wang [17,18] studied the effects of different temperatures on the mechanical responses of pavement structures. Mackiewicz [19] and Jeong and Zollinger [20] studied the temperature distribution and mechanical response of concrete pavements, which were shown to produce large tensile stresses in environments with large temperature differences. Assogba et al. [21,22,23] analyzed the influence of a non-linear temperature gradient and traffic load on pavements. To be more in line with the actual situation, the temperature and moving-load conditions should be included when setting up the test and constructing the finite-element model.
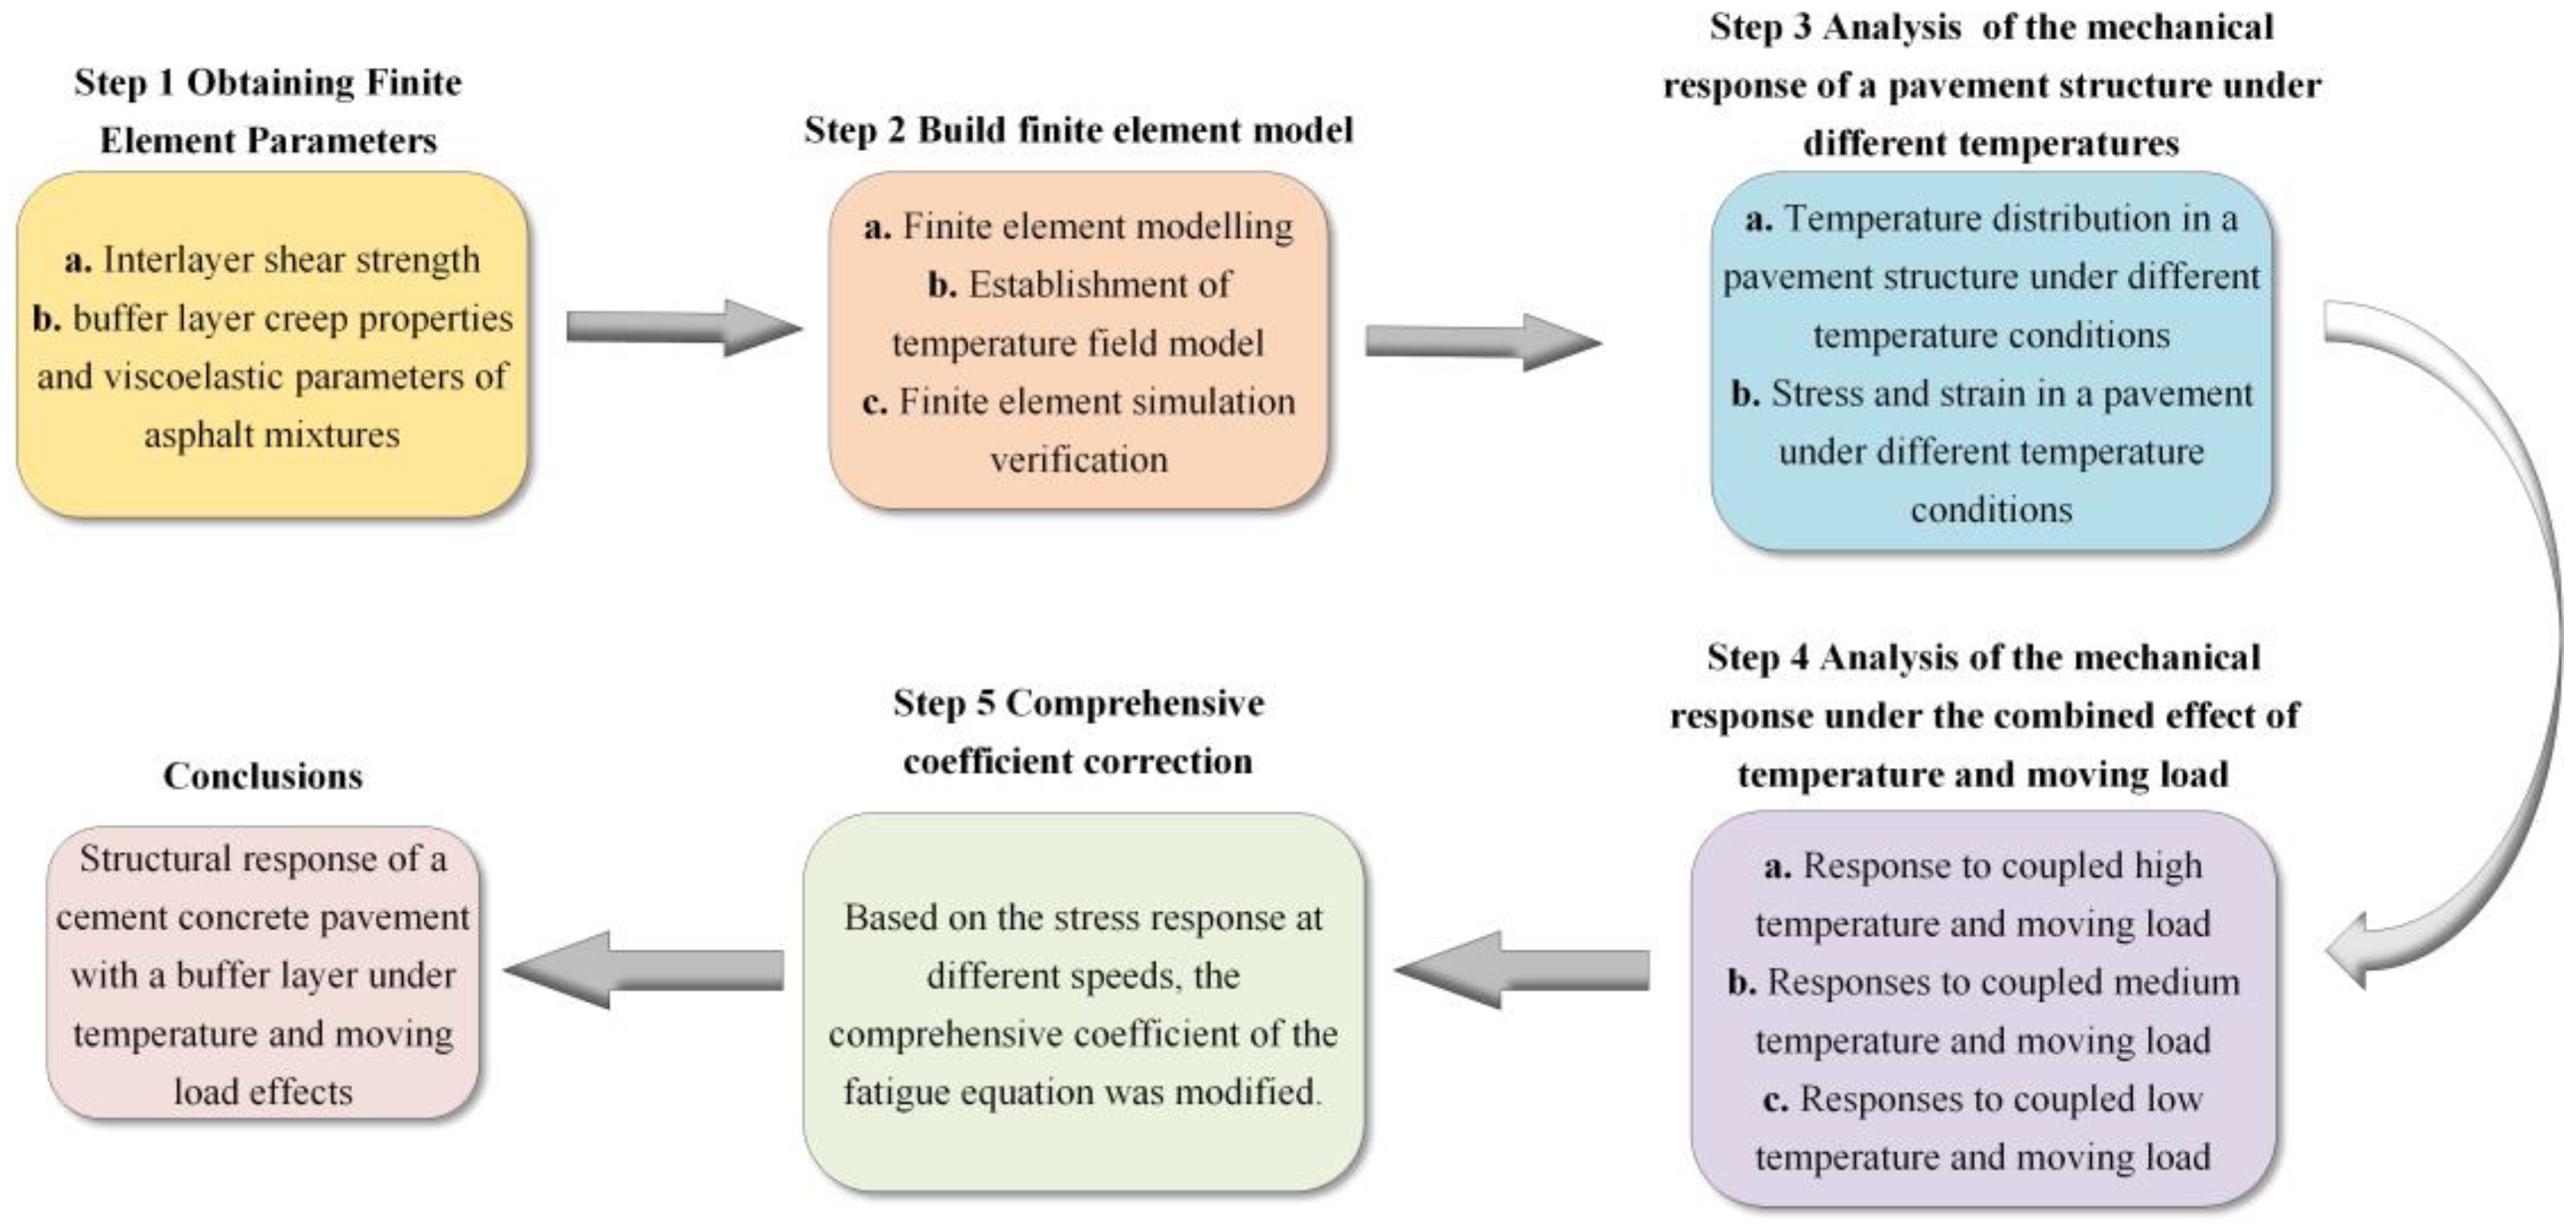
The mechanism of action of buffer layers in cement concrete pavements has received considerable attention. The mechanism of the buffer layer of cement concrete pavement has been widely concerned. There are few studies on the creep properties of an asphalt buffer layer at different temperatures; the mechanical response of these pavements under the combined effect of temperature and moving load requires further investigation. In this study, the interlayer bonding coefficient of the pavement structure was determined through interlayer shear strength tests; creep tests were conducted on the buffer layer of an asphalt mixture, and regression analysis was employed to determine the relevant parameters from the test results. Moreover, finite-element simulation analysis of a cement concrete pavement with a buffer layer was performed to study the influence of temperature and the combined effect of temperature and moving load on the response of the pavement structure. This study aims to provide a theoretical basis for the sustainable use of cement concrete pavements with buffer layers, thereby providing a scientific basis for further research and improvement of cement concrete pavement technology. A flowchart for this research is shown in Figure 1.

2. Materials and Methods Parameter Acquisition and Establishment of Finite-Element Model

2.1. Determination of Interlayer Bonding Coefficient

The shear strength of regions between layers is an important index to evaluate the shear failure capacity. The weakening of the bonding state between layers will reduce the shear strength between them. Therefore, the shear strength of the region between layers has a crucial impact on the service life of the cement concrete pavement. In this study, the interlayer shear test was performed to obtain the shear strength between the cement concrete surface and buffer layer and that between the buffer and cement-stabilized gravel-base layer, and the interlayer bonding coefficient was calculated using the finite-element simulation analysis [24,25].

2.1.1. Testing Material

(1) Cement concrete
The surface layer used C30 cement concrete, as shown in Table 1.
(2) AC-10 buffer layer
The AC-10 asphalt mixture gradation was adjusted according to the median value specified in the “Technical Specification for Construction of Highway Asphalt Pavement” (JTG F40-2004) [26], and the final synthetic gradation was determined with findings listed in Table 2.
(3) Cement-stabilized macadam
The “Technical Rules for Construction of Highway Pavement Base-Implementation Manual” (JTG-TF20-2015) indicates that screening the stones required for the test into a single particle size can avoid the uncertainty of stone sampling, and the accuracy and reliability of the test are better [27]. The stone required for this study was relatively small, and it was suitable for a single particle size ratio. According to the size of the specimen, the maximum particle size of the gravel was 9.5 mm, and the final grading value of the cement-stabilized macadam was calculated according to the recommended grading range of the specification, as summarized in Table 3. The composition of the cement-stabilized crushed stone mixture is listed in Table 4.

2.1.2. Shear Test Scheme

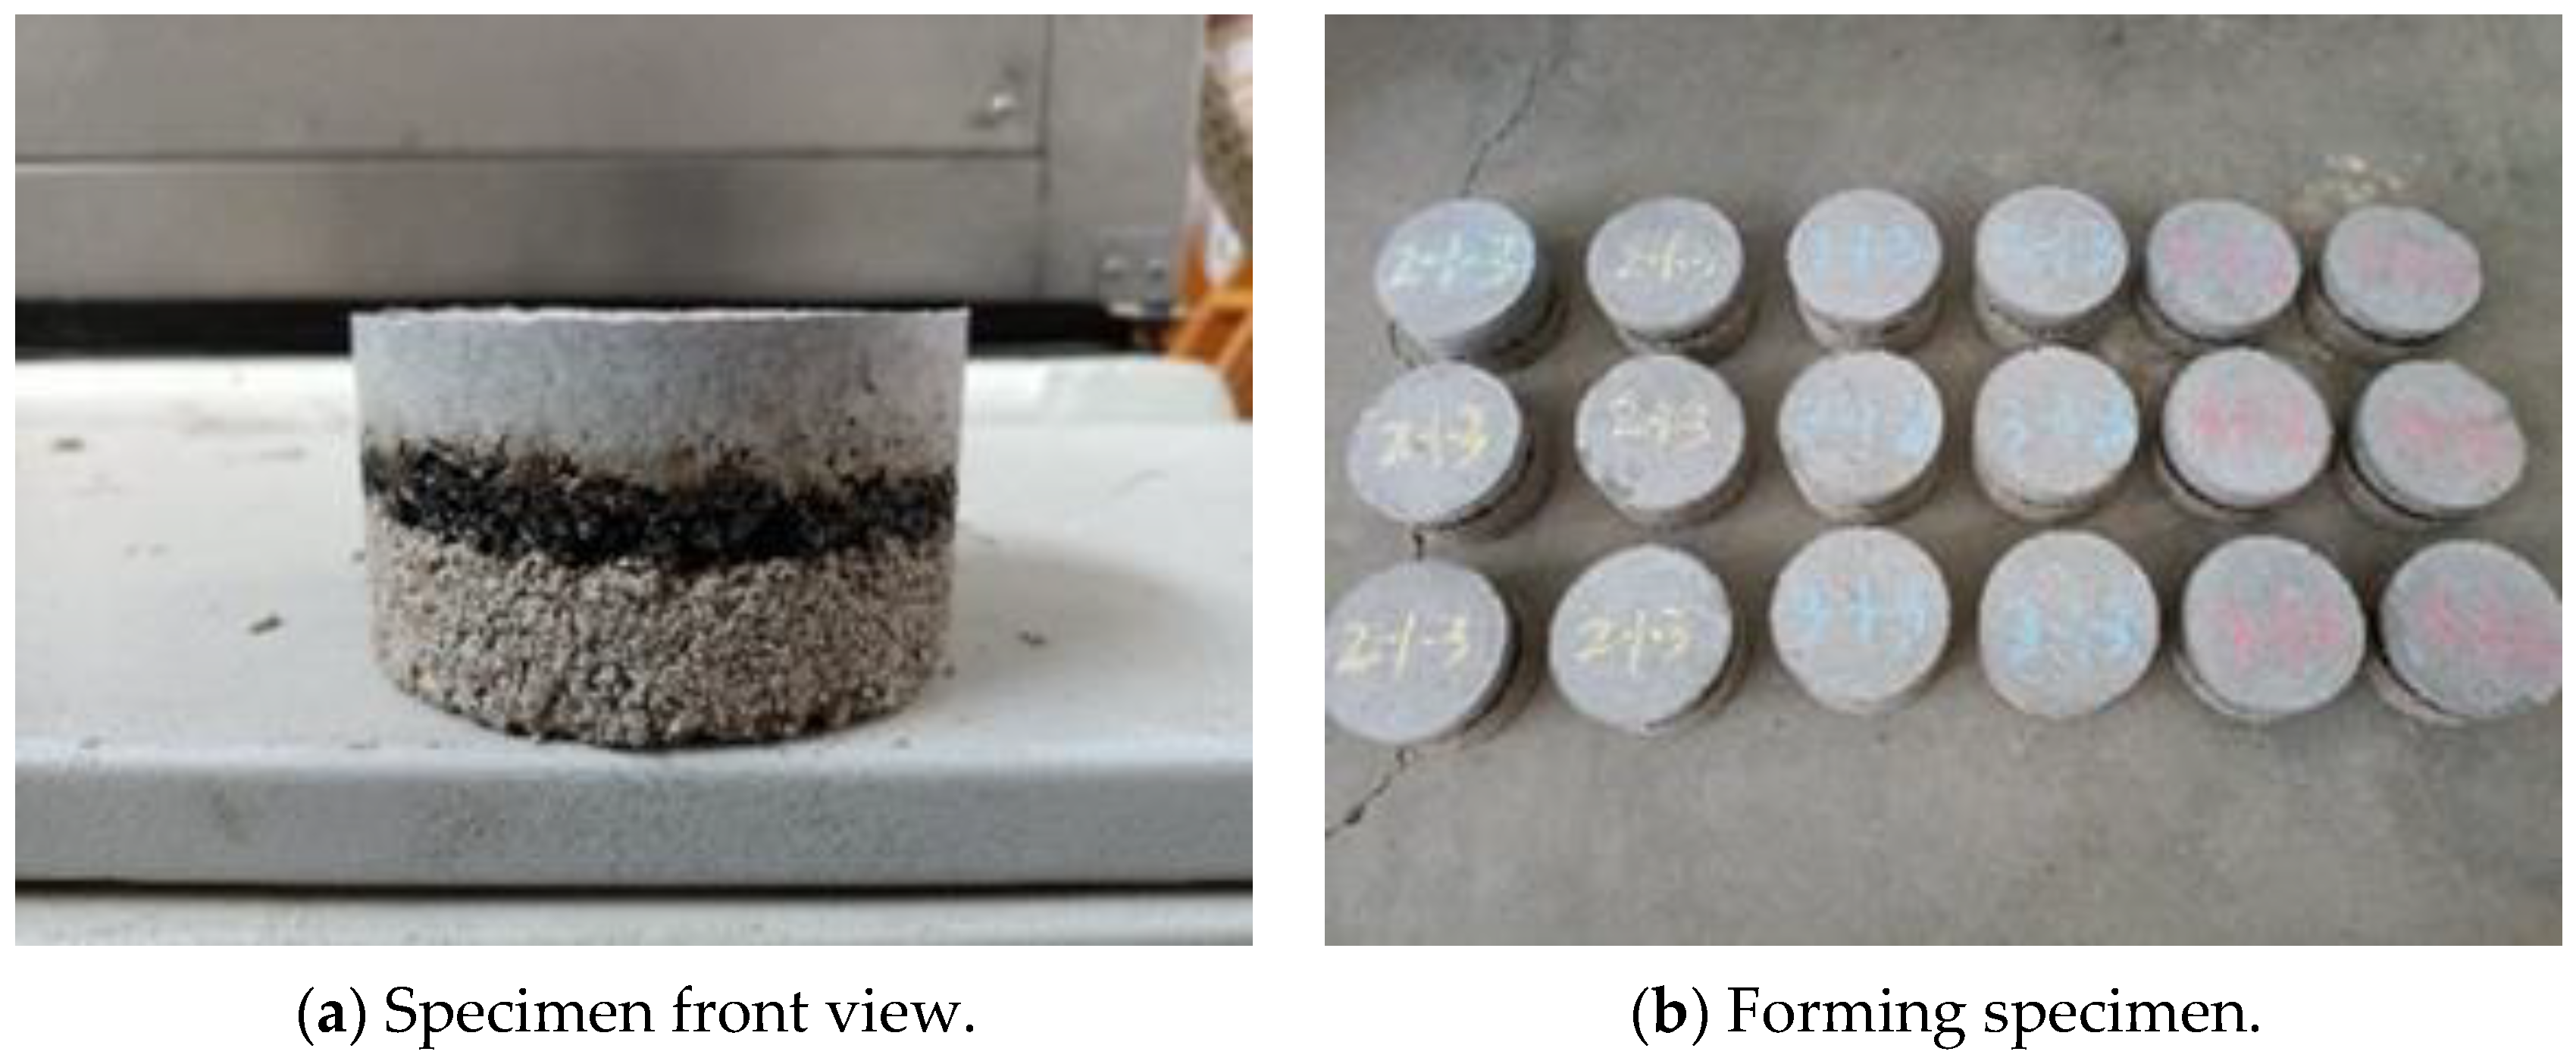
The thickness combination scheme for the shear specimens is listed in Table 5. A mold with an inner diameter and length of 100 mm was prepared and coated with lubricating oil on its inner wall. Subsequently, cement-stabilized gravel was mixed, placed into the mold, compacted to the designed height using a rubber hammer, and then moist-cured for a minimum of seven days. Upon completing the curing process, an AC-10 asphalt mixture and cement concrete were mixed, with the cement concrete being loaded after compacting the asphalt mixture with a hammer. Another curing treatment of at least seven days was performed before demolding. The specimen after demolding is shown in Figure 2.
Before the shear test, the samples were placed in an oven at temperatures of 15, 30, and 60 °C for an average of 4 h. During the shearing process, the specimen was removed from the oven and quickly placed in the shear box to prepare it for shearing. Three parallel specimens were set for each condition, and the data were read and averaged.

2.1.3. Shearing Principle

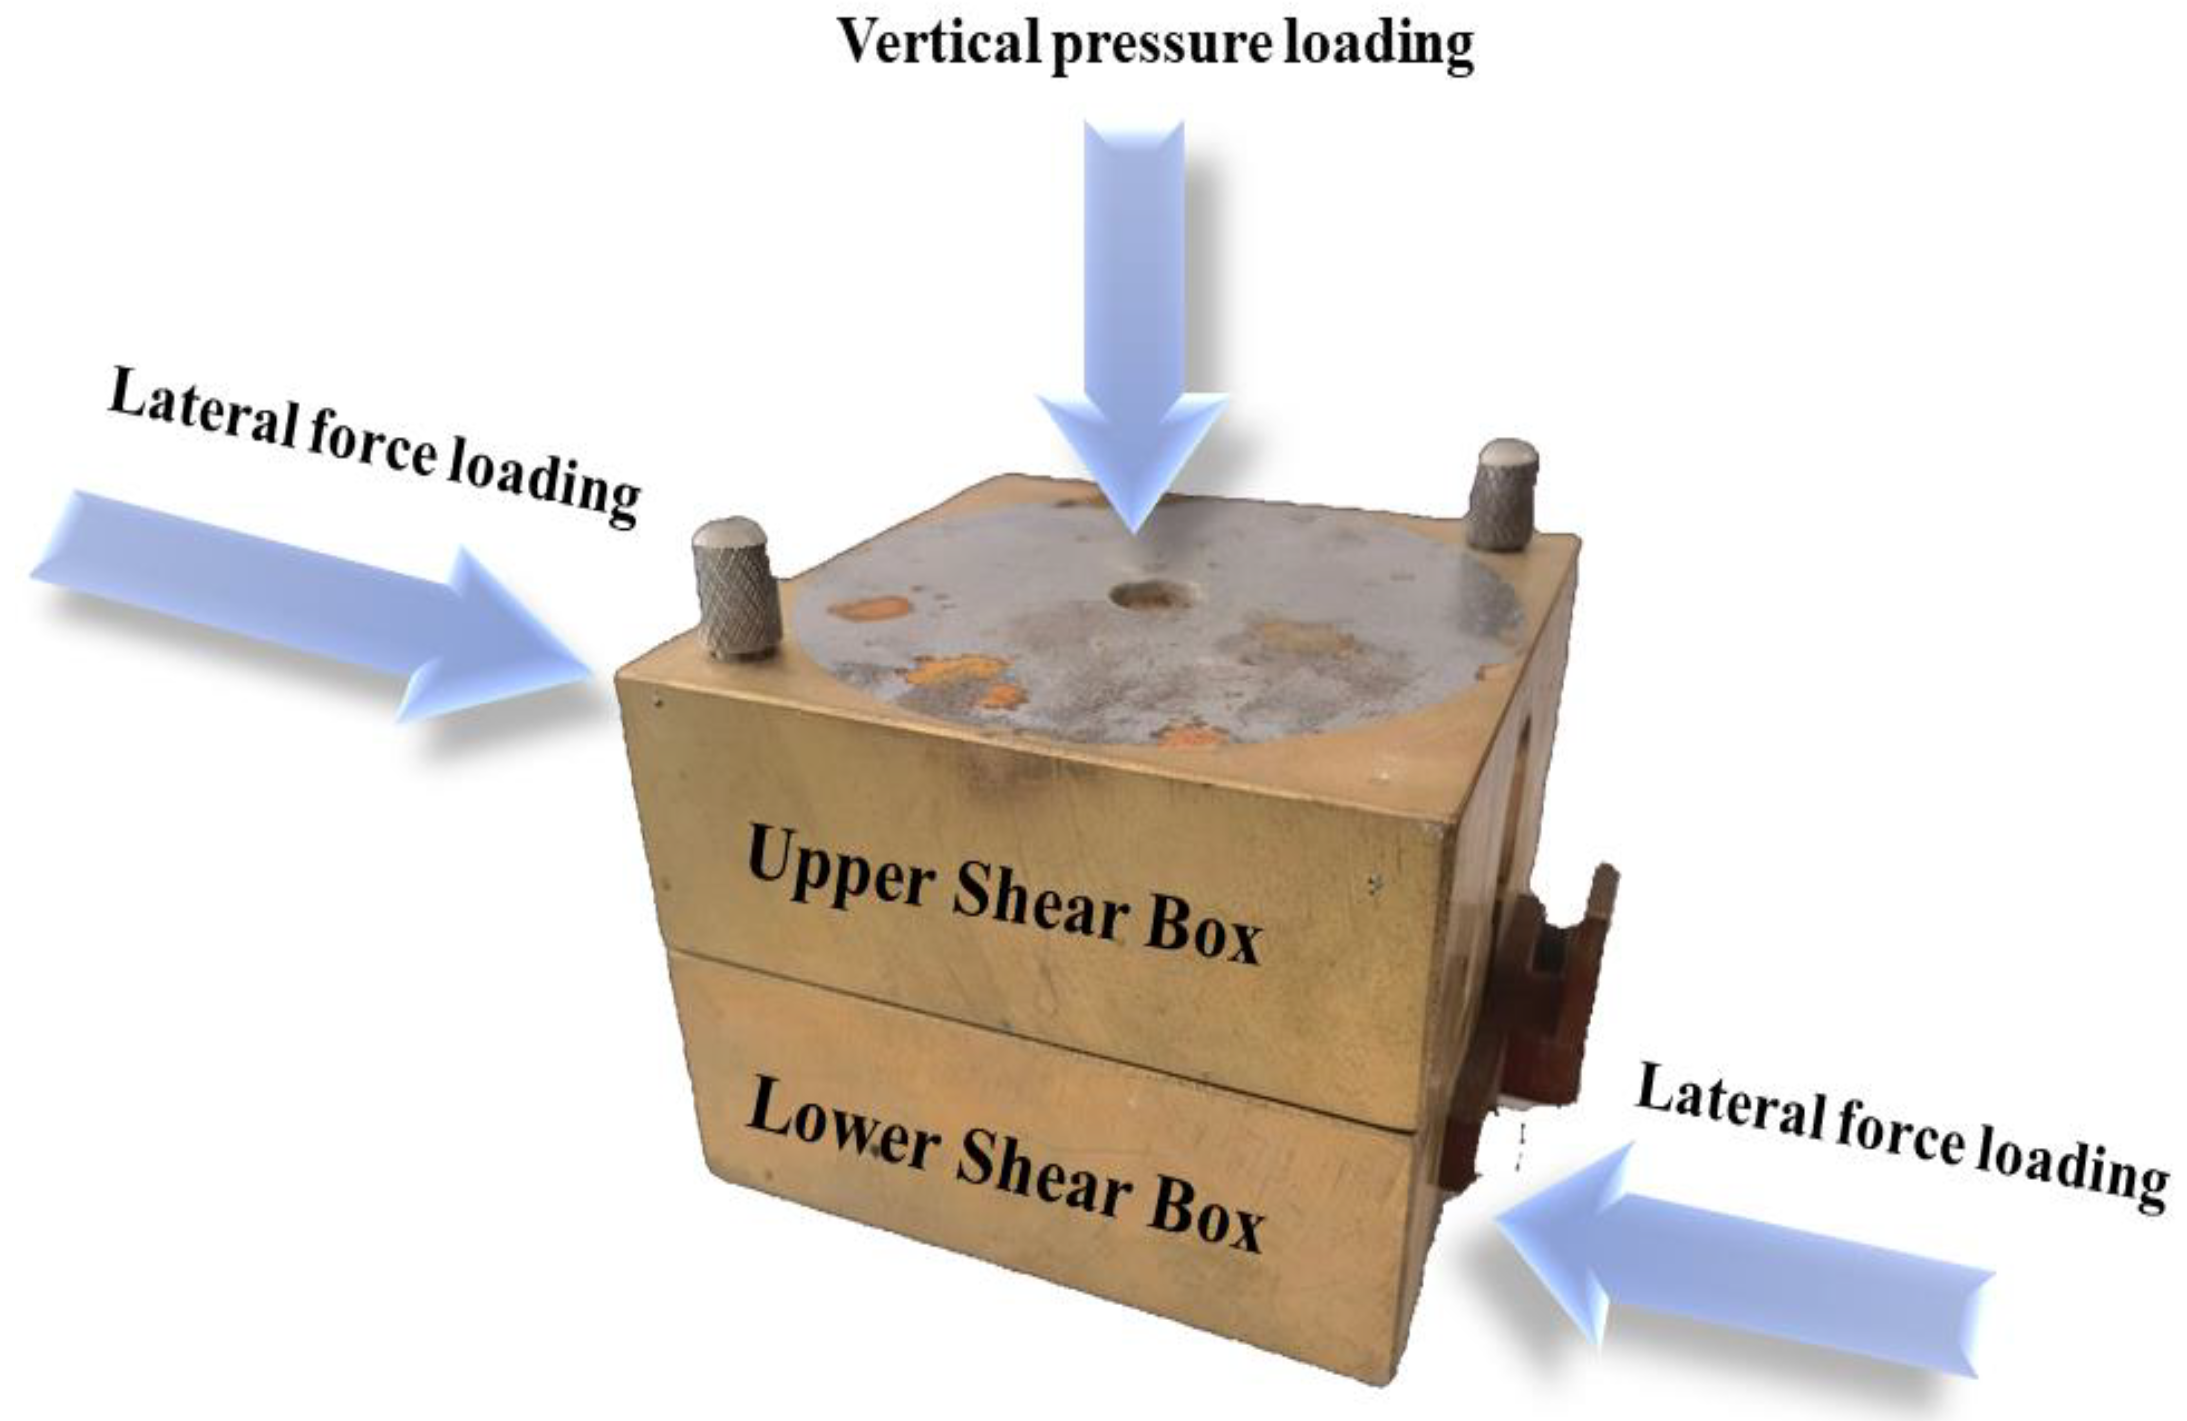
The principle of the shear device used in this study is as follows: firstly, the interfaces of the upper and lower shear boxes were aligned within the vicinity of the test interface, and different vertical pressures were applied to the center of the upper shear box; the lower shear box was fixed; and the horizontal force perpendicular to the upper shear box was applied to make the upper shear box move. The arrangement of the test samples is shown in Figure 3. The shear failure of the specimen was caused by the displacement between the upper and lower shear boxes. The vertical loading was regulated using weights of 2.55, 5.1, 7.65, and 10.2 kg while maintaining a constant shear rate of 12 revolutions/min.
During the test, the reading of the gauge is read, and the shear strength and shear force are calculated using the following formula.
τ = C × S
F S = τ × A
f = F S / F N
where τ is the shear strength; C is the calibration coefficient, and the instrument calibration coefficient used in this paper is 1.571; S is the gauge readings; F s is the shearing force; A is the shear area; f is the interlayer bonding coefficient; and FN is the vertical force.
The following two methods are used to express the interlayer bonding state: (1) The ratio of shear force to vertical force is expressed as the interlayer bonding coefficient and is shown in Formula (3). (2) Because the buffer layer is sticky, the friction coefficient is expressed with t a n φ in the failure formula of Mohr–Coulomb law τ = c + σ tan φ ; c denotes cohesion.

2.1.4. Test Result

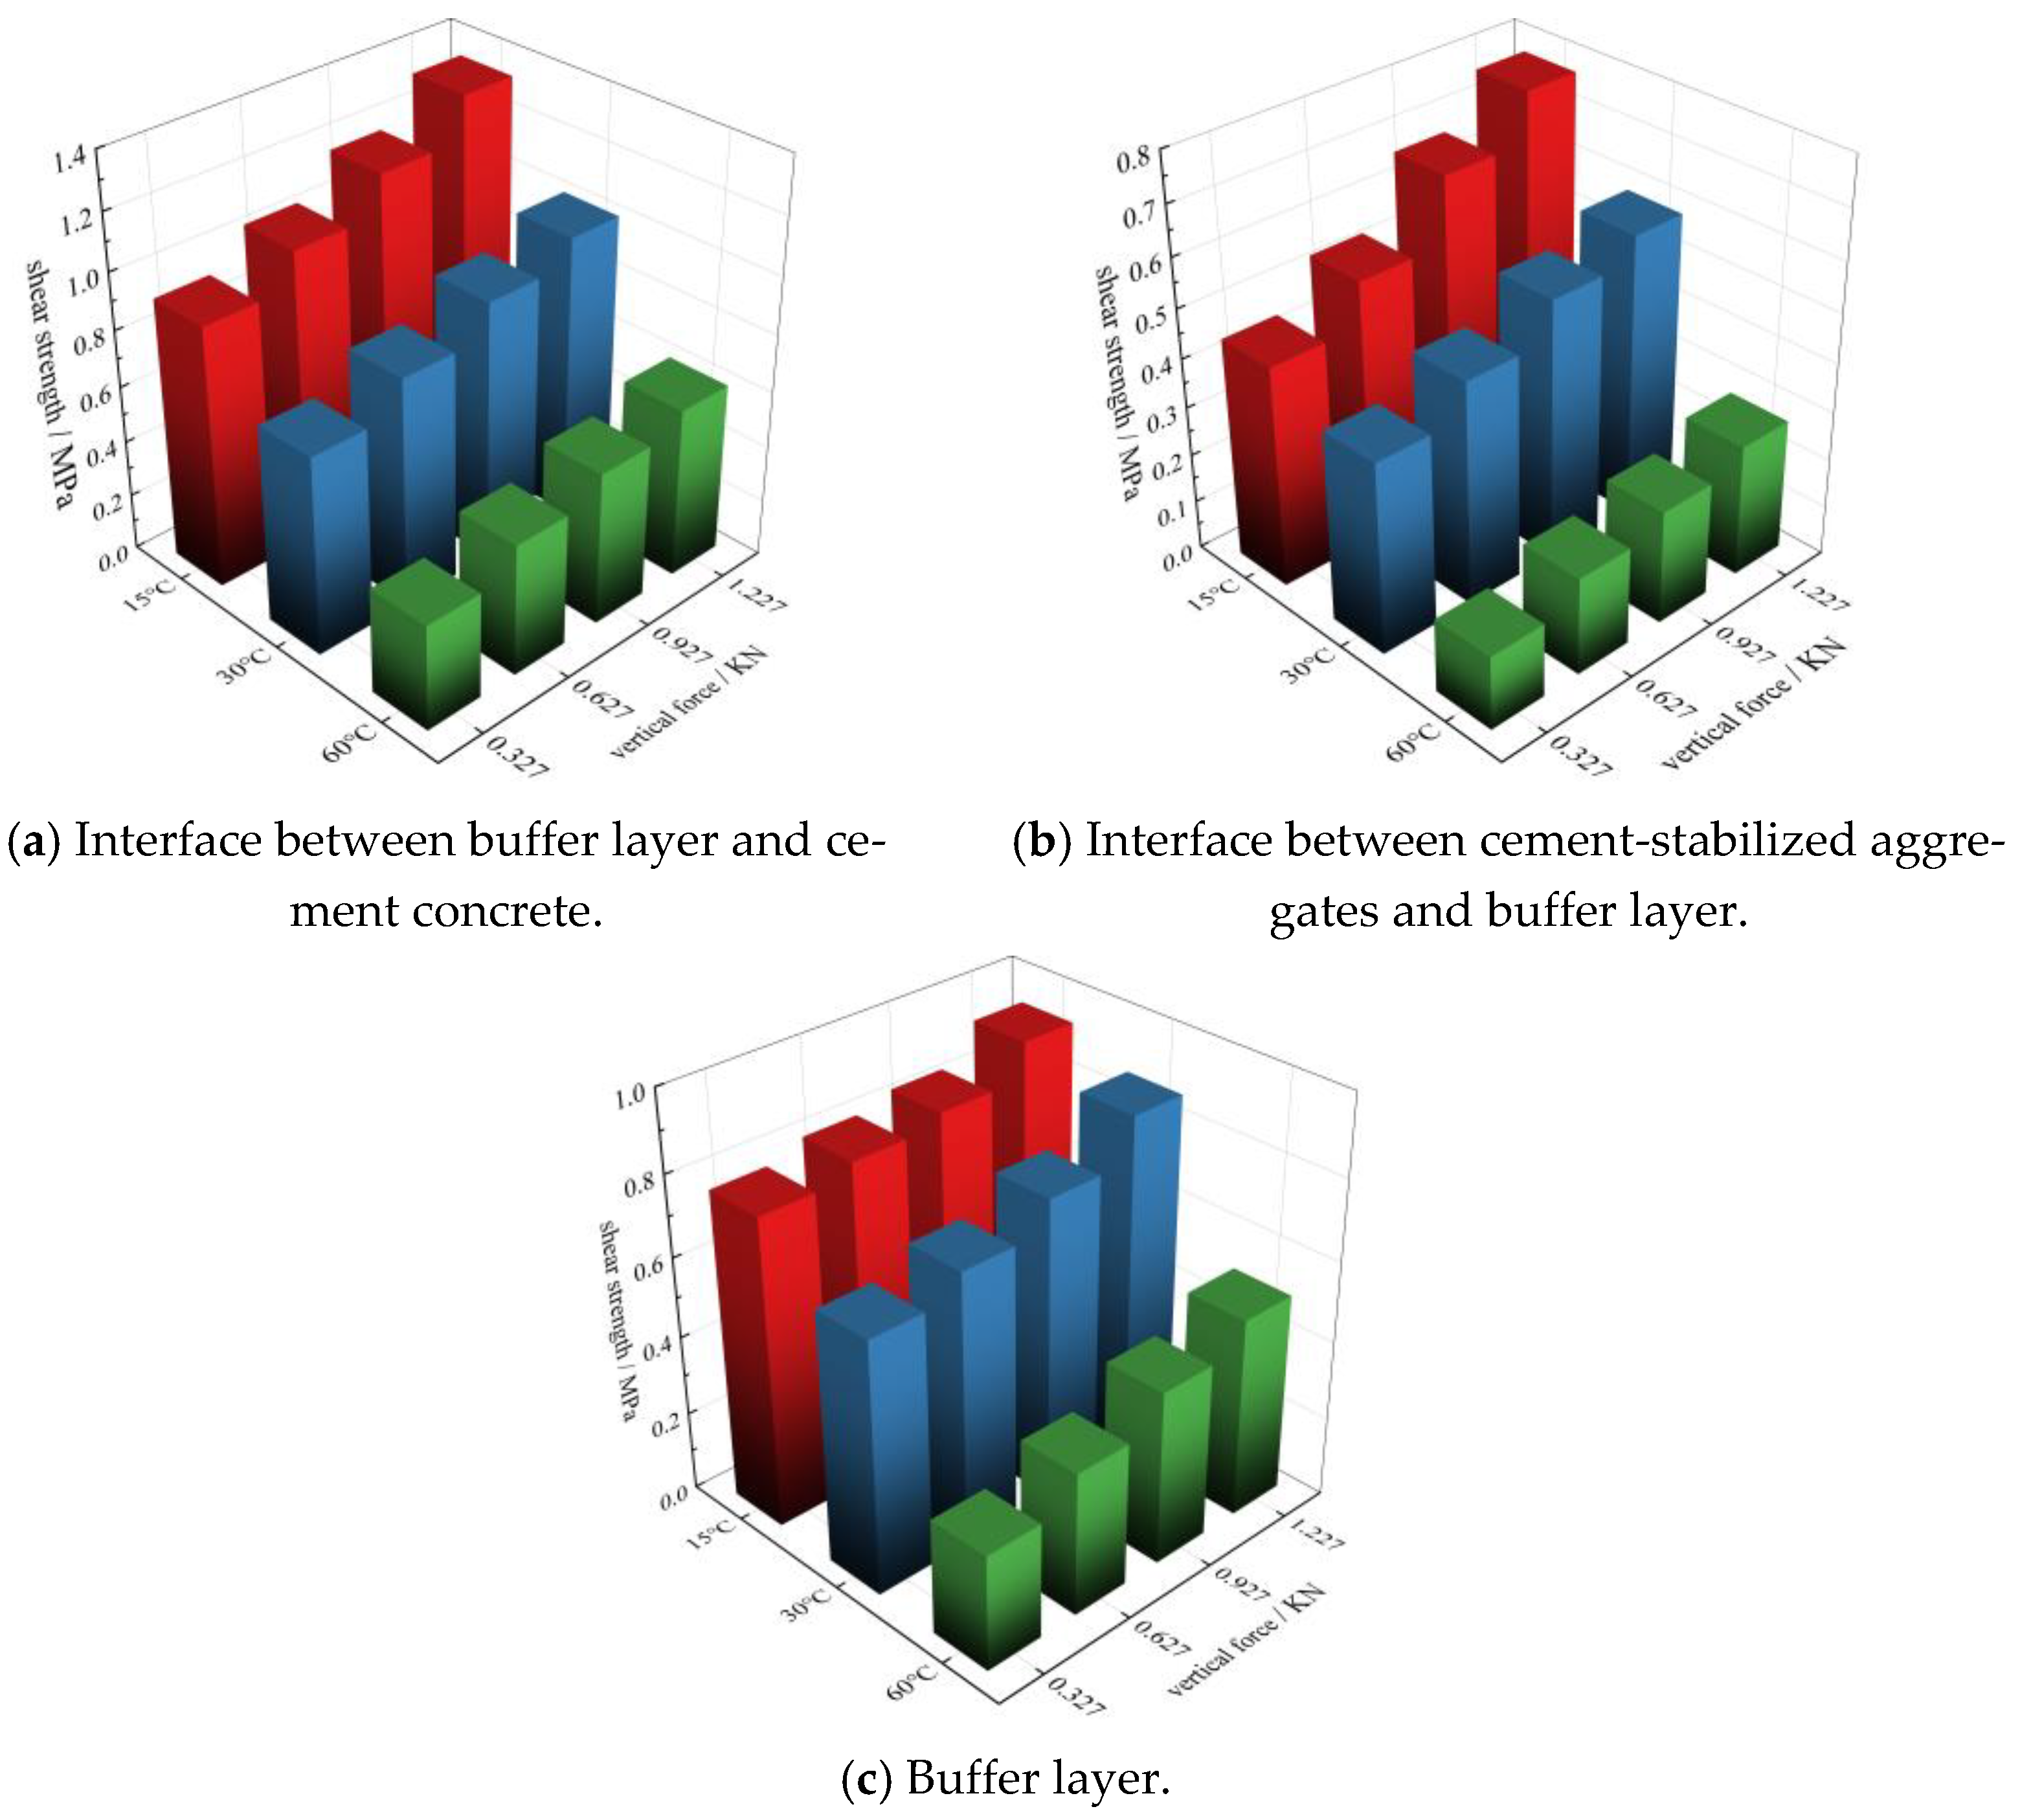
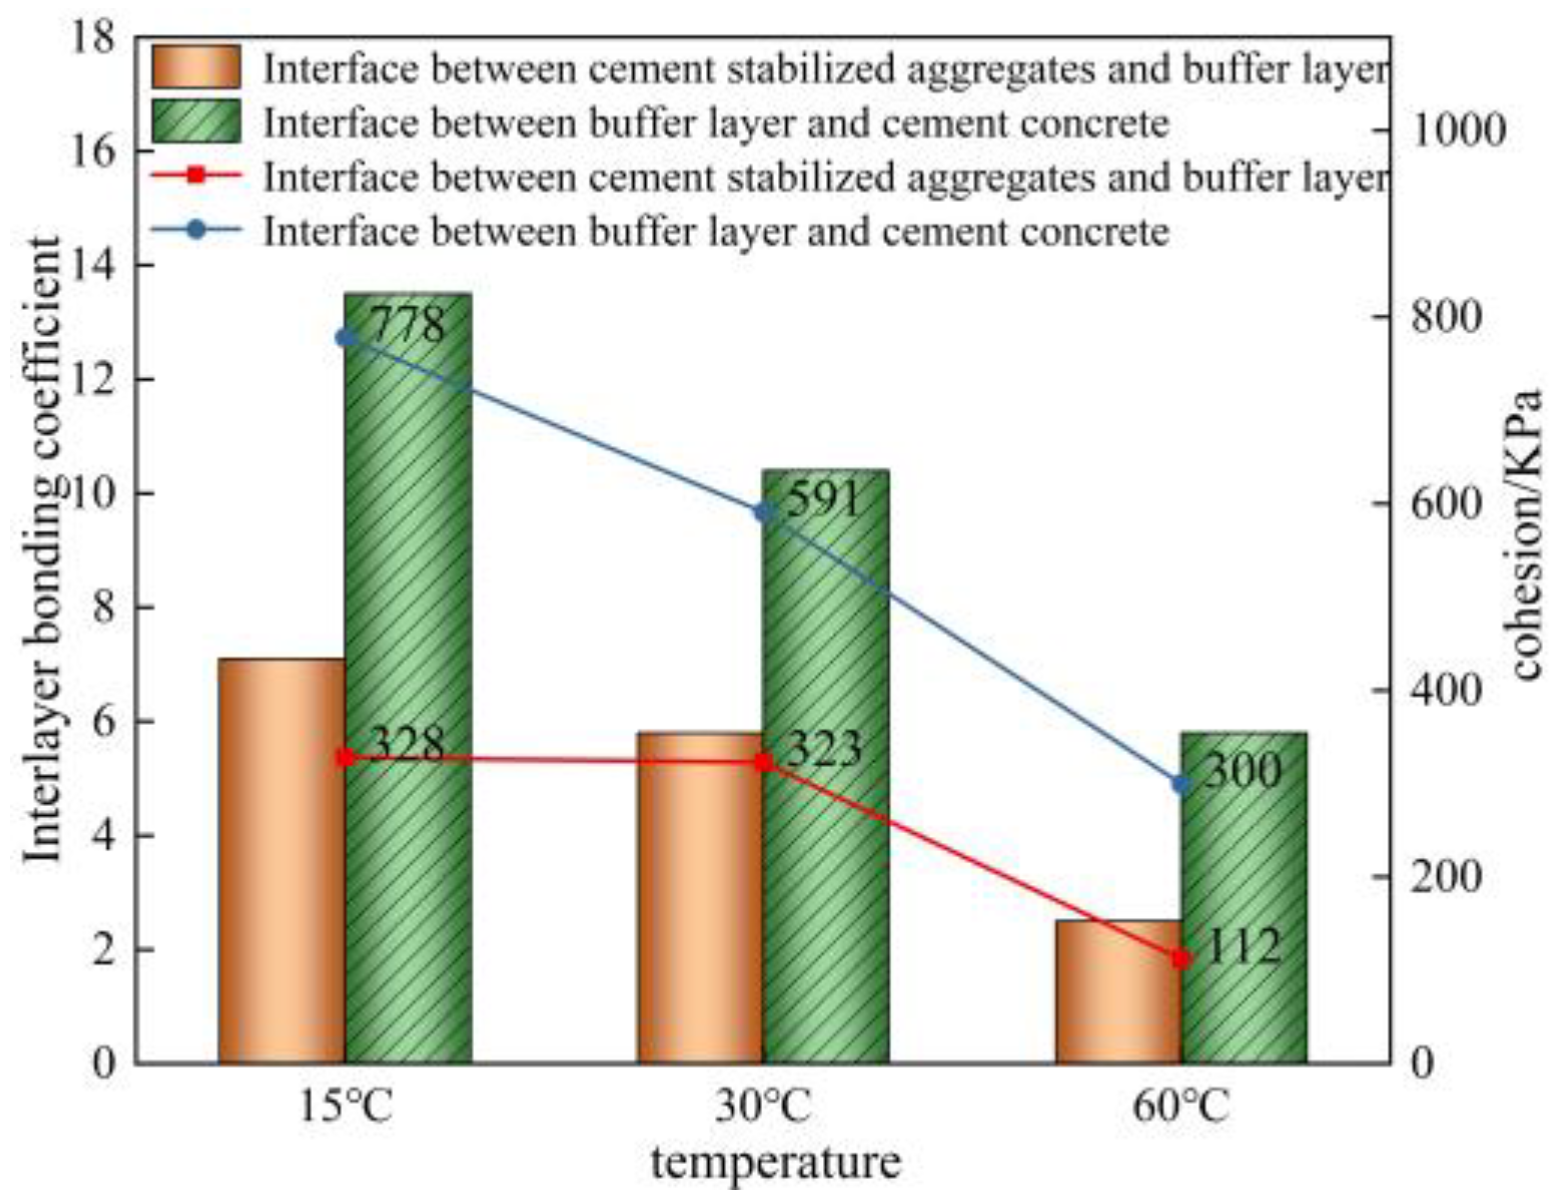
The interlayer bonding coefficient and cohesion of the bonding interface between the cement-stabilized gravel and buffer layer and that between the buffer layer and the cement concrete; the shear strength of the bonding interface between the cement-stabilized gravel and buffer layer; the bonding interface between the buffer layer and the cement concrete; and the buffer layer were determined using the shear test. In total, 36 specimens were prepared. Three groups of parallel tests were performed for each working condition. The results were recorded and the averages were calculated. The results are shown in Figure 4 and Figure 5.
Figure 4 and Figure 5 show that the shear strength between cement-stabilized crushed stone and buffer layer, and that between the buffer layer and cement concrete decreases gradually as the temperature increases. As the vertical pressure increases, the shear strength increases gradually. Evaluation of the shear strength shows that its value at the interface between the buffer layer and the cement concrete is greater.

2.2. Creep Characteristics’ and Viscoelastic Parameters’ Acquisition for Asphalt Mixture

The research object of this study is the cement concrete pavement with a buffer layer. The temperatures of the interior parts of the pavement structure can reach 40–50 °C in the summer. The asphalt mixture is a typical viscoelastic material, which is greatly affected by temperature. It is necessary to study the creep performance of the buffer layer at different deformation resistances at different temperatures. The creep test was performed using a small MTS, and the creep curve of the buffer layer material was obtained. The Burgers model was fitted to the creep curve, and the four parameters were converted into Prony-series parameters; these were then used as material parameters for the finite-element simulation analysis.

2.2.1. Uniaxial Dynamic Creep Tests

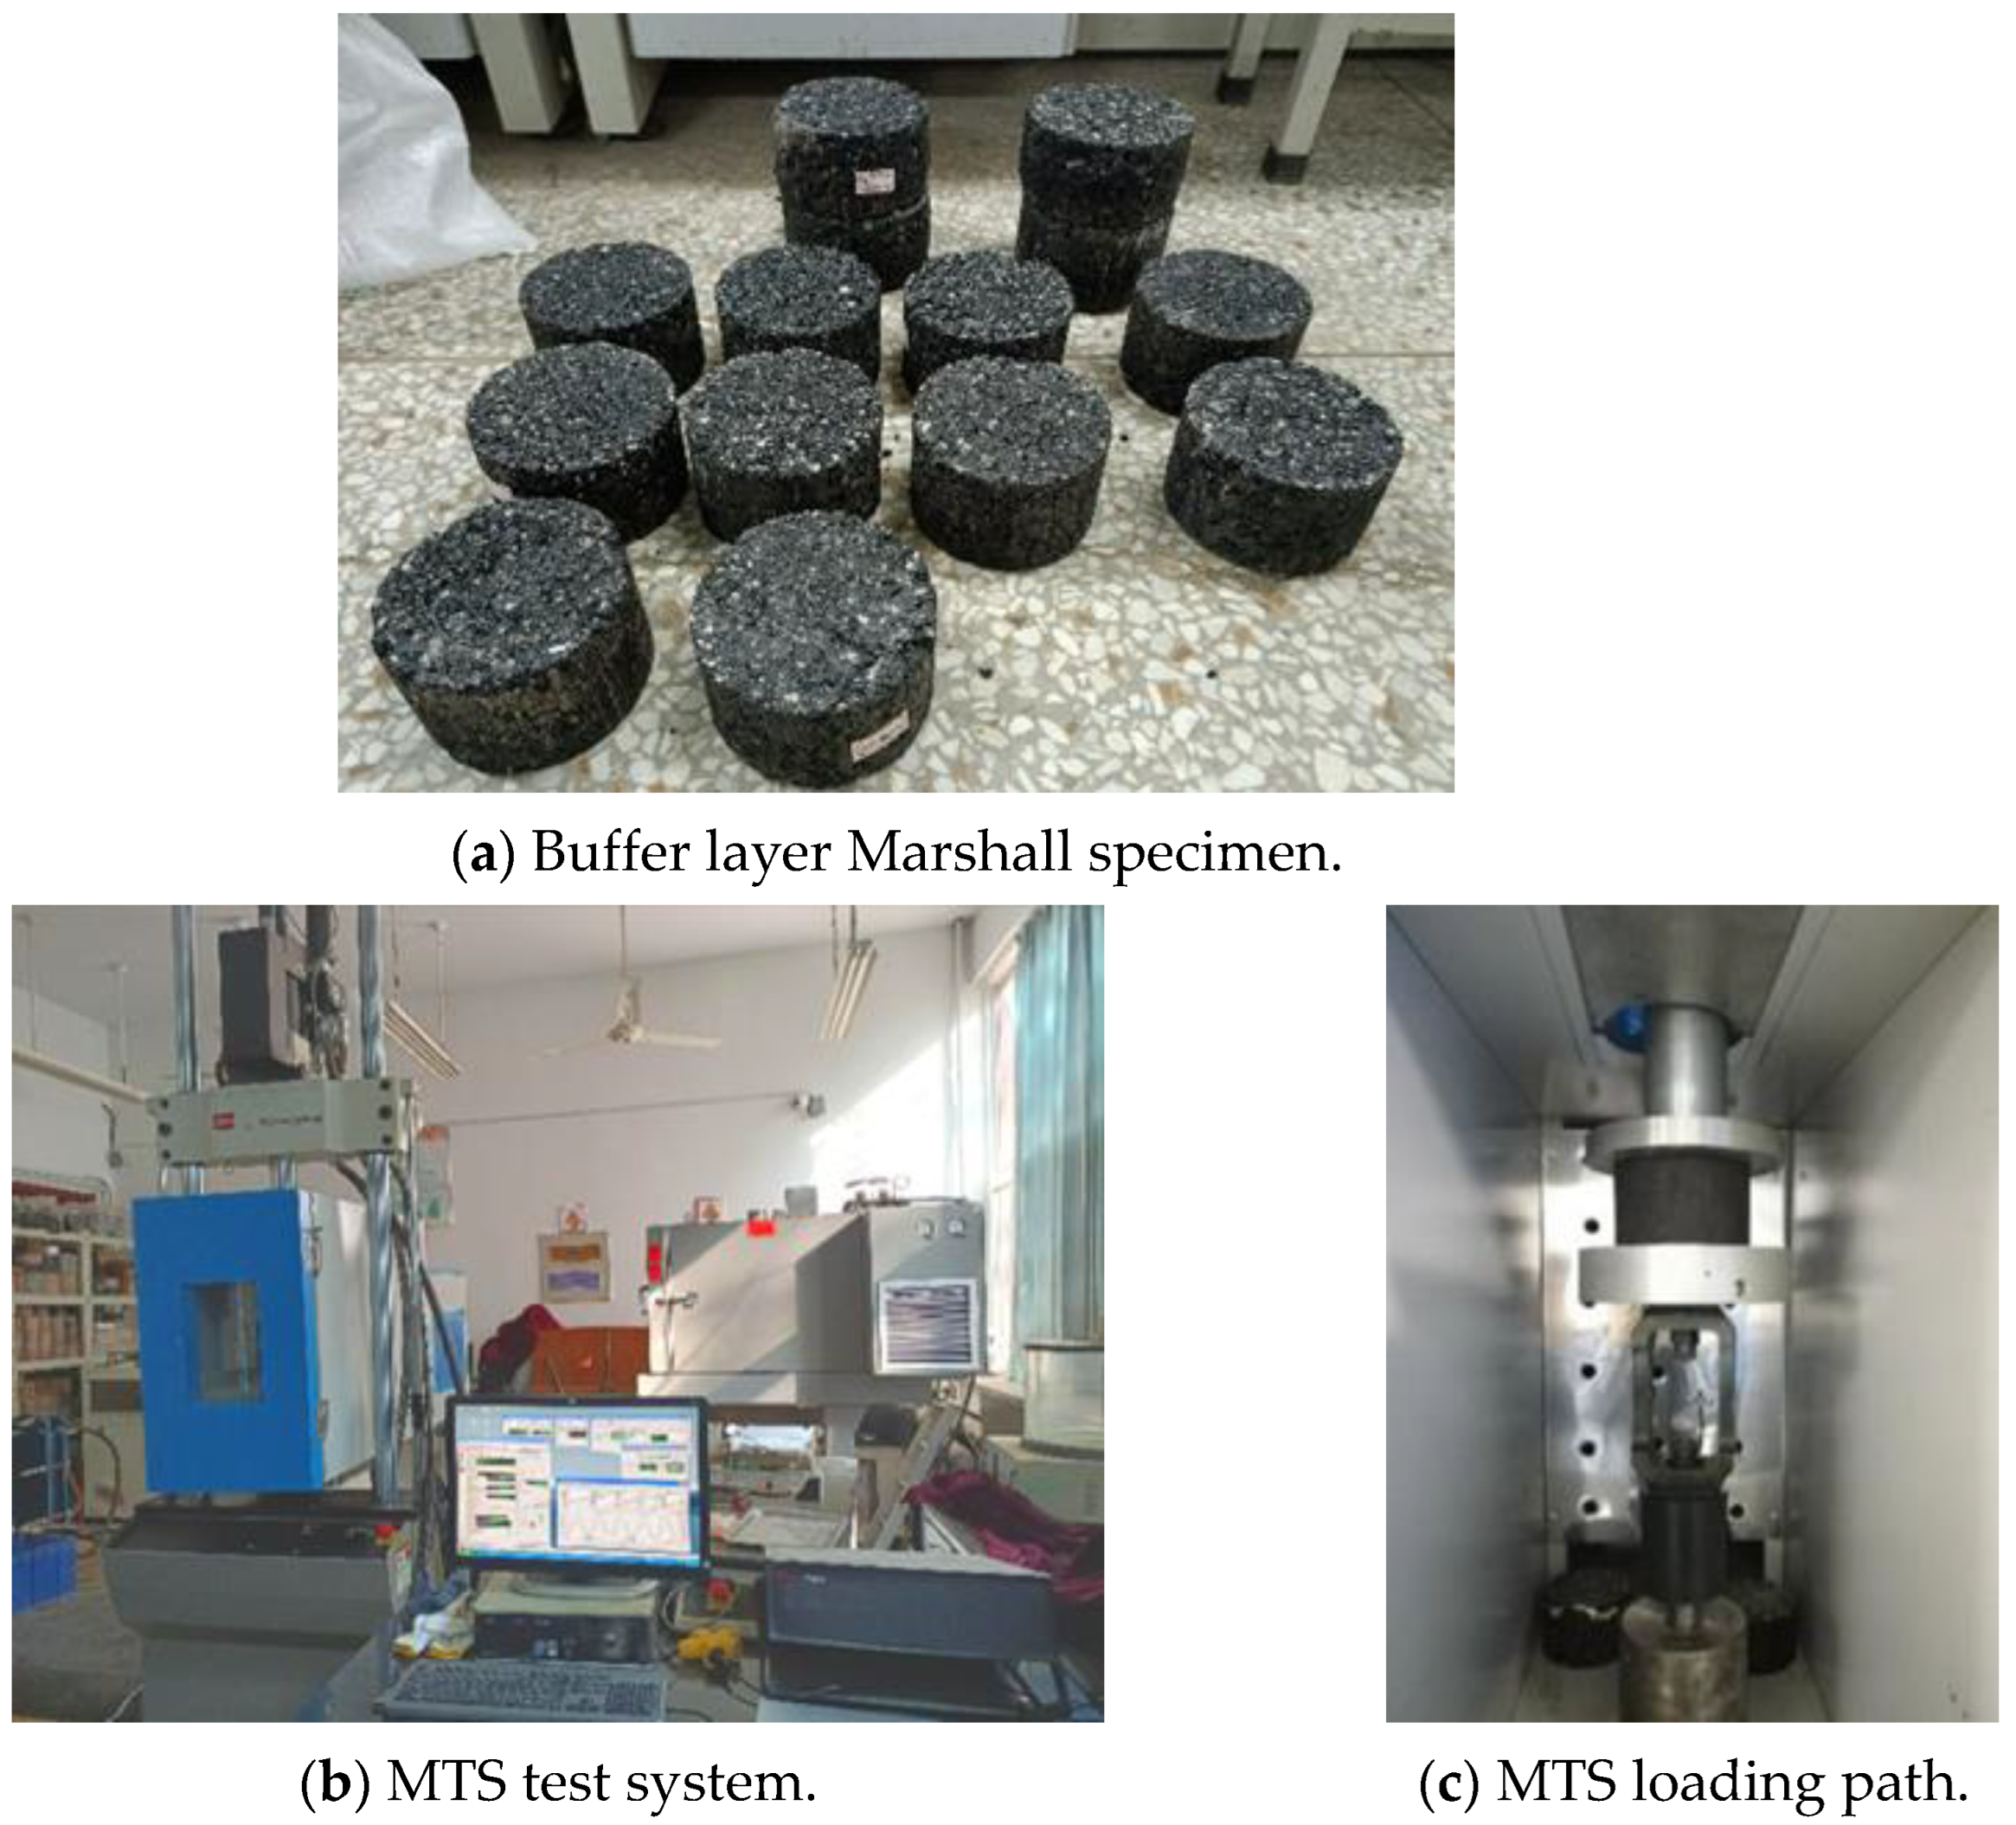
Marshall specimens were prepared according to the buffer layer mix ratio listed in Table 2. The specimens were placed in an environmental chamber and maintained at the test temperature (30, 40, and 50 °C) for 6 h to uniformize the temperature inside and outside the specimen. Uniaxial dynamic creep tests were performed on the specimens at different temperatures using an MTS-810 hydraulic servo universal testing machine. In this test, the half-sine wave loading method was adopted at a frequency of 5 Hz. The test loads were 1, 1.5, 2 and 2.5 MPa. A total of 36 Marshall specimens were prepared in the test. Three groups of parallel tests were carried out under each working condition. The results were recorded and the average value was calculated. Figure 6 is the uniaxial dynamic creep test.
Using the uniaxial dynamic creep test, the creep curves under different temperatures and stresses were obtained, and the results are shown in Figure 7.

2.2.2. Burgers Model

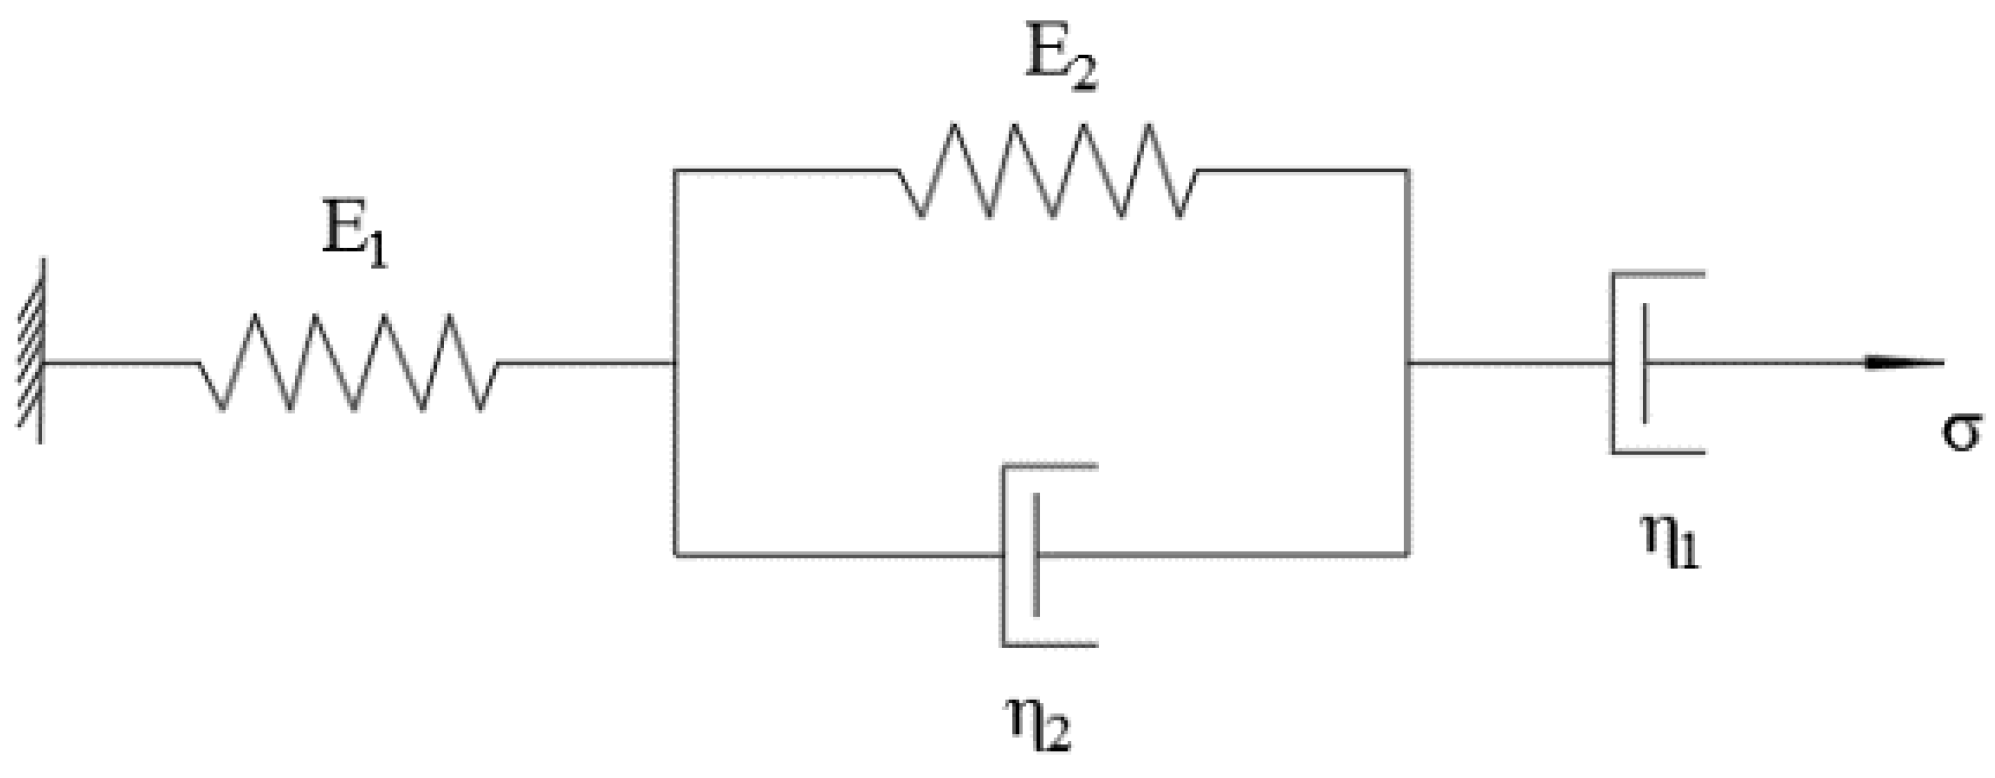
The classical Burgers model, comprising the Maxwell and Kelvin models in series, contains two elastic elements and two sticky pots, as shown in Figure 8.
The Burgers model can describe the mechanical properties of viscoelastic materials more effectively to facilitate the Prony level conversion. Accordingly, the finite-element calculations and analyses performed in this study adopted the Burgers model.
The creep strain expression is Equation (4):
ε t = σ 0 1 E 1 + t η 1 + 1 E 2 1 e E 2 η 2 t
where E 1 and η 1 are the elastic modulus (stiffness coefficient) and viscosity coefficient of the Maxwell model, respectively; E 2 , and η 2 are the elastic modulus and viscosity coefficient of the Kelvin model; σ 0 is the constant stress applied in the test; and ε is strain.

2.2.3. Viscoelastic Parameter

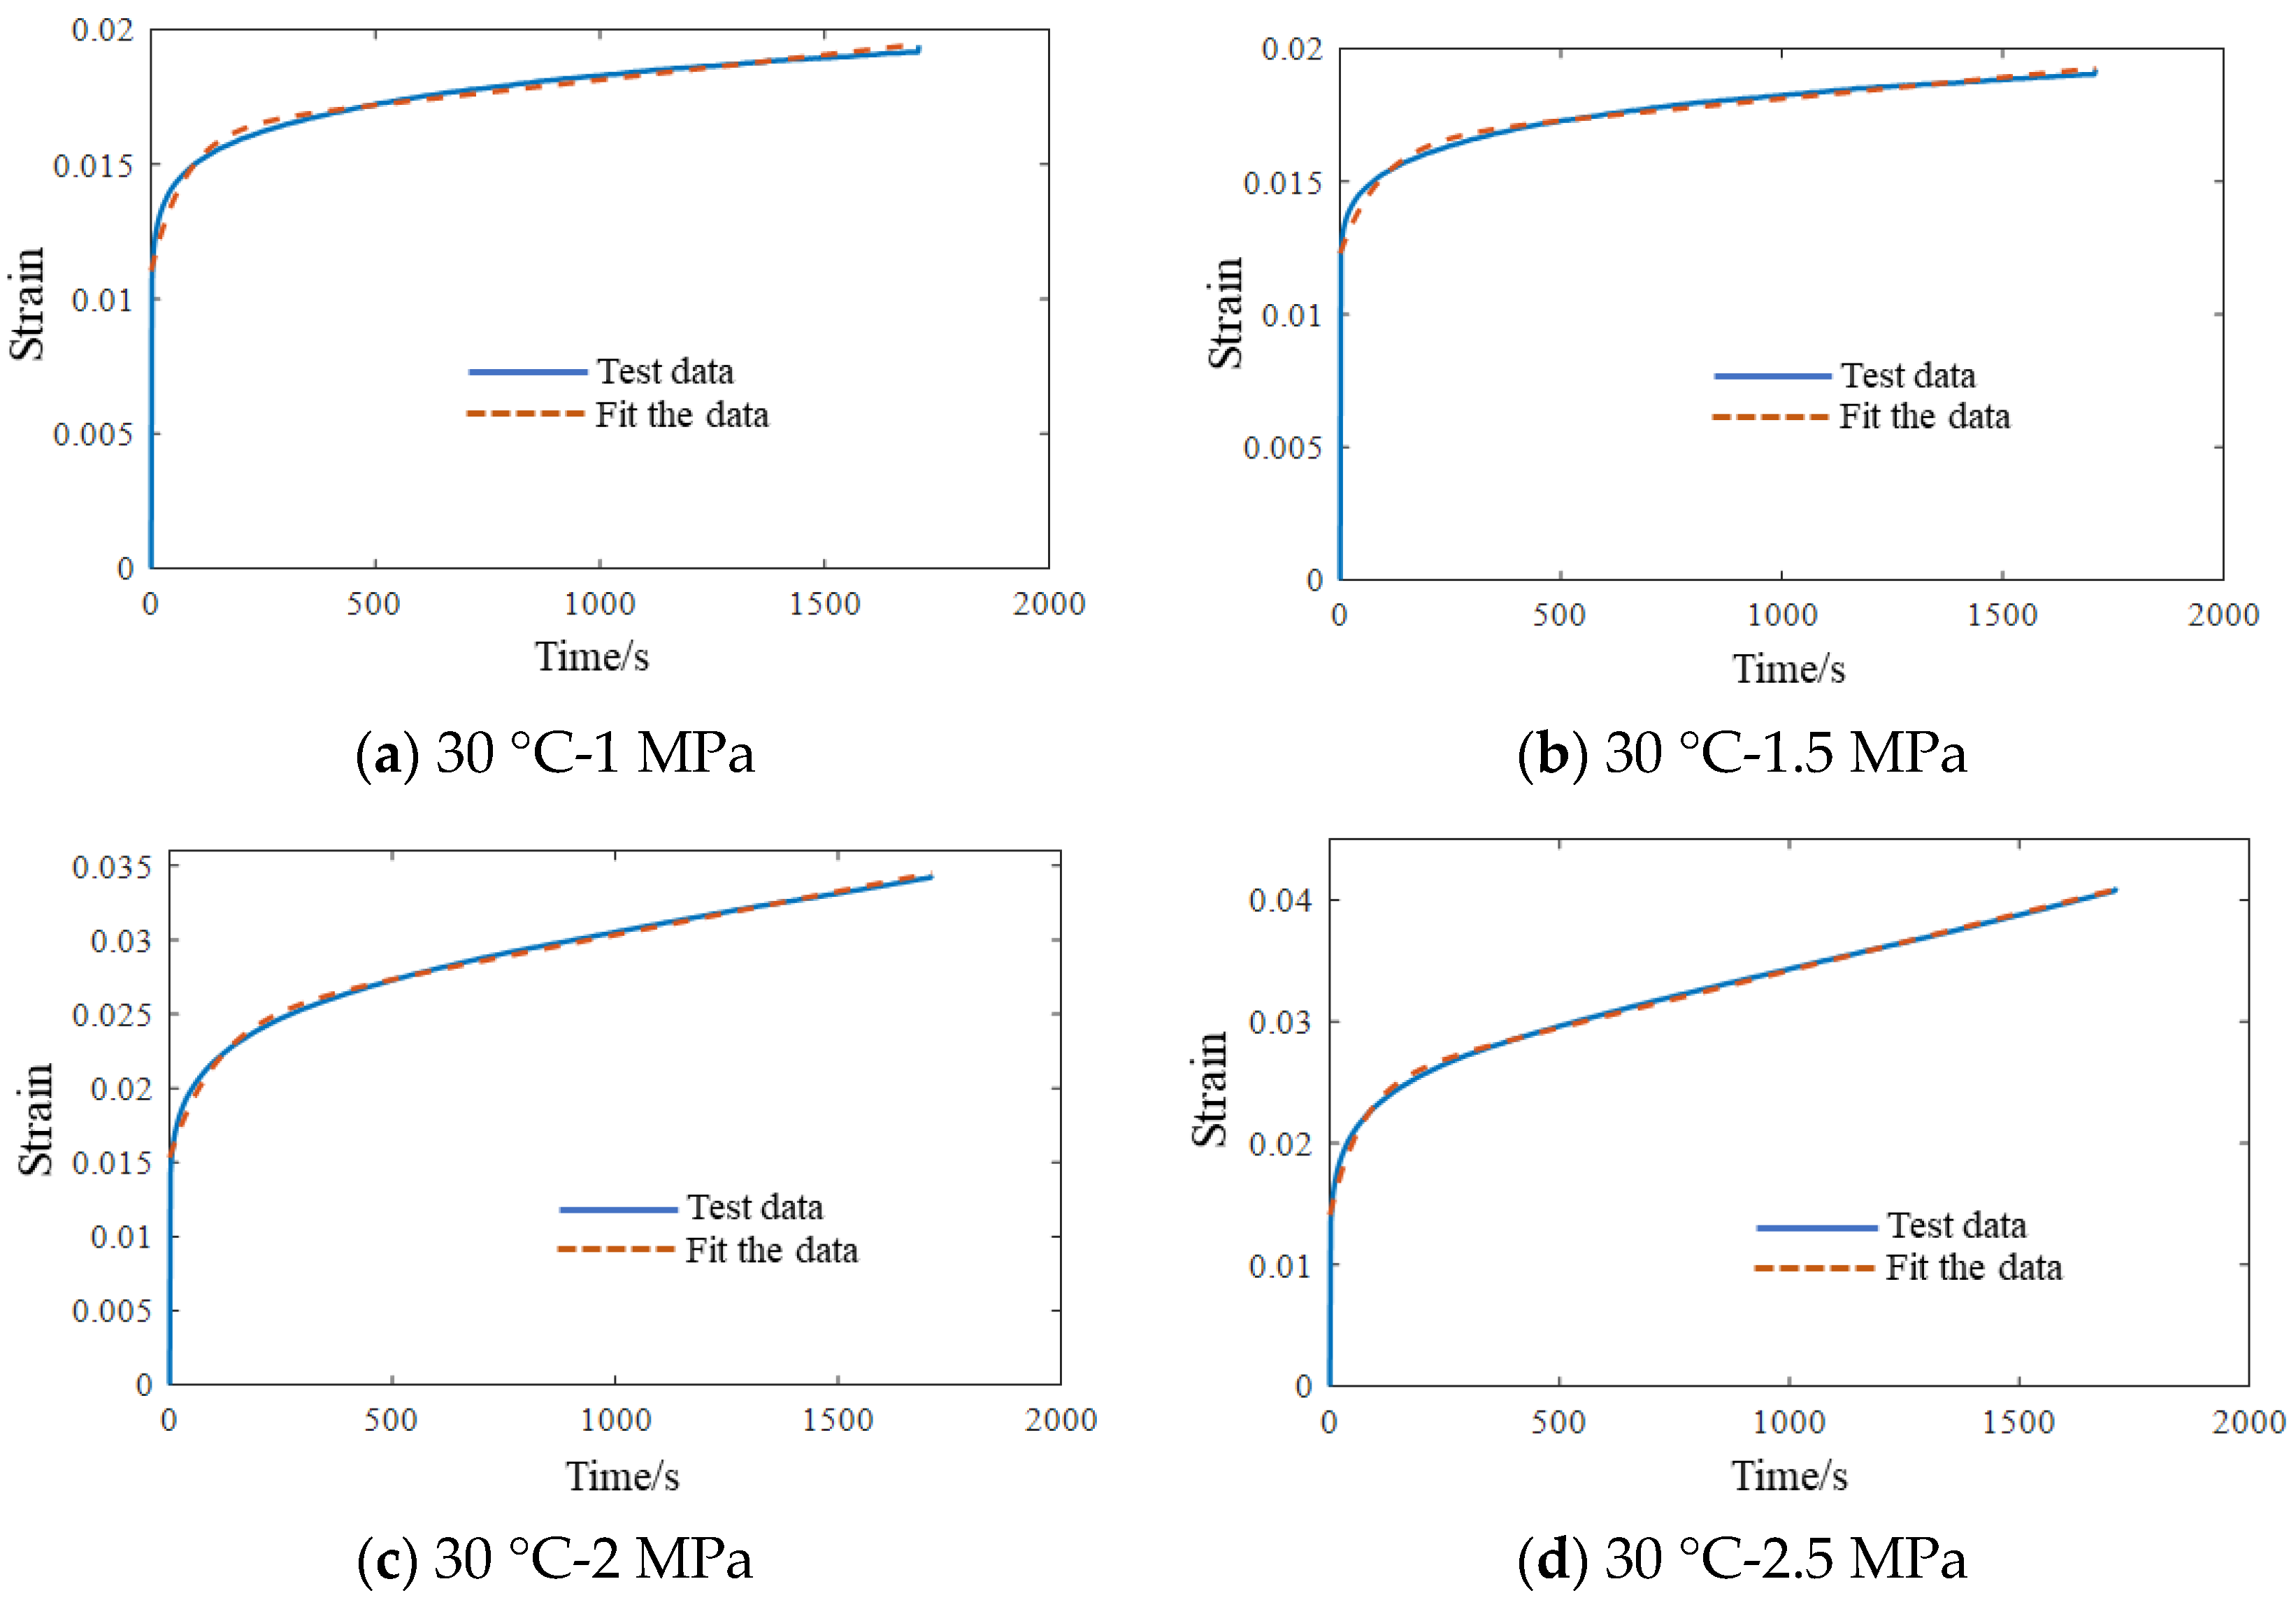
The stresses at different temperatures and their corresponding strains were introduced into the Burgers equation. Using MATLAB 2021b, the ‘Levenberg-Marquardt + general global optimization’ algorithm was selected for parameter regression. The Burgers equation parameters E1, E2, η1, and η2 were determined, and the minimum correlation coefficient of the fitting result was 94%.
Using the value of 30 °C as an example, the fitting results were compared with the creep curves obtained from the experimental data. As shown in Figure 9, the creep curves generated using the experimental data and the regression parameters are very similar.
They were then converted into Prony series parameters that could be directly input into the finite-element calculation as follows:
The expressions for the Prony shear and volume relaxation moduli in the finite-element calculation are G(t) and K(t) in Equations (5) and (6):
G t = G 0 α G + i = 1 n G α i G e x p t τ i G
K t = K 0 α K + i = 1 n K α i K e x p t τ i K
where G 0 and K 0 are the transient moduli at t = 0, n G and n K are the number of Prony terms, α i G and α i K are relative moduli, and τ i G and τ i K are relaxation times.
α 1 , α 2 , τ 1 , and τ 2 are the parameters of the Prony series. The calculation results are presented in Table 6.

2.3. Structural Model of the Cement Concrete Pavement

2.3.1. Finite-Element Model Size and Material Parameters

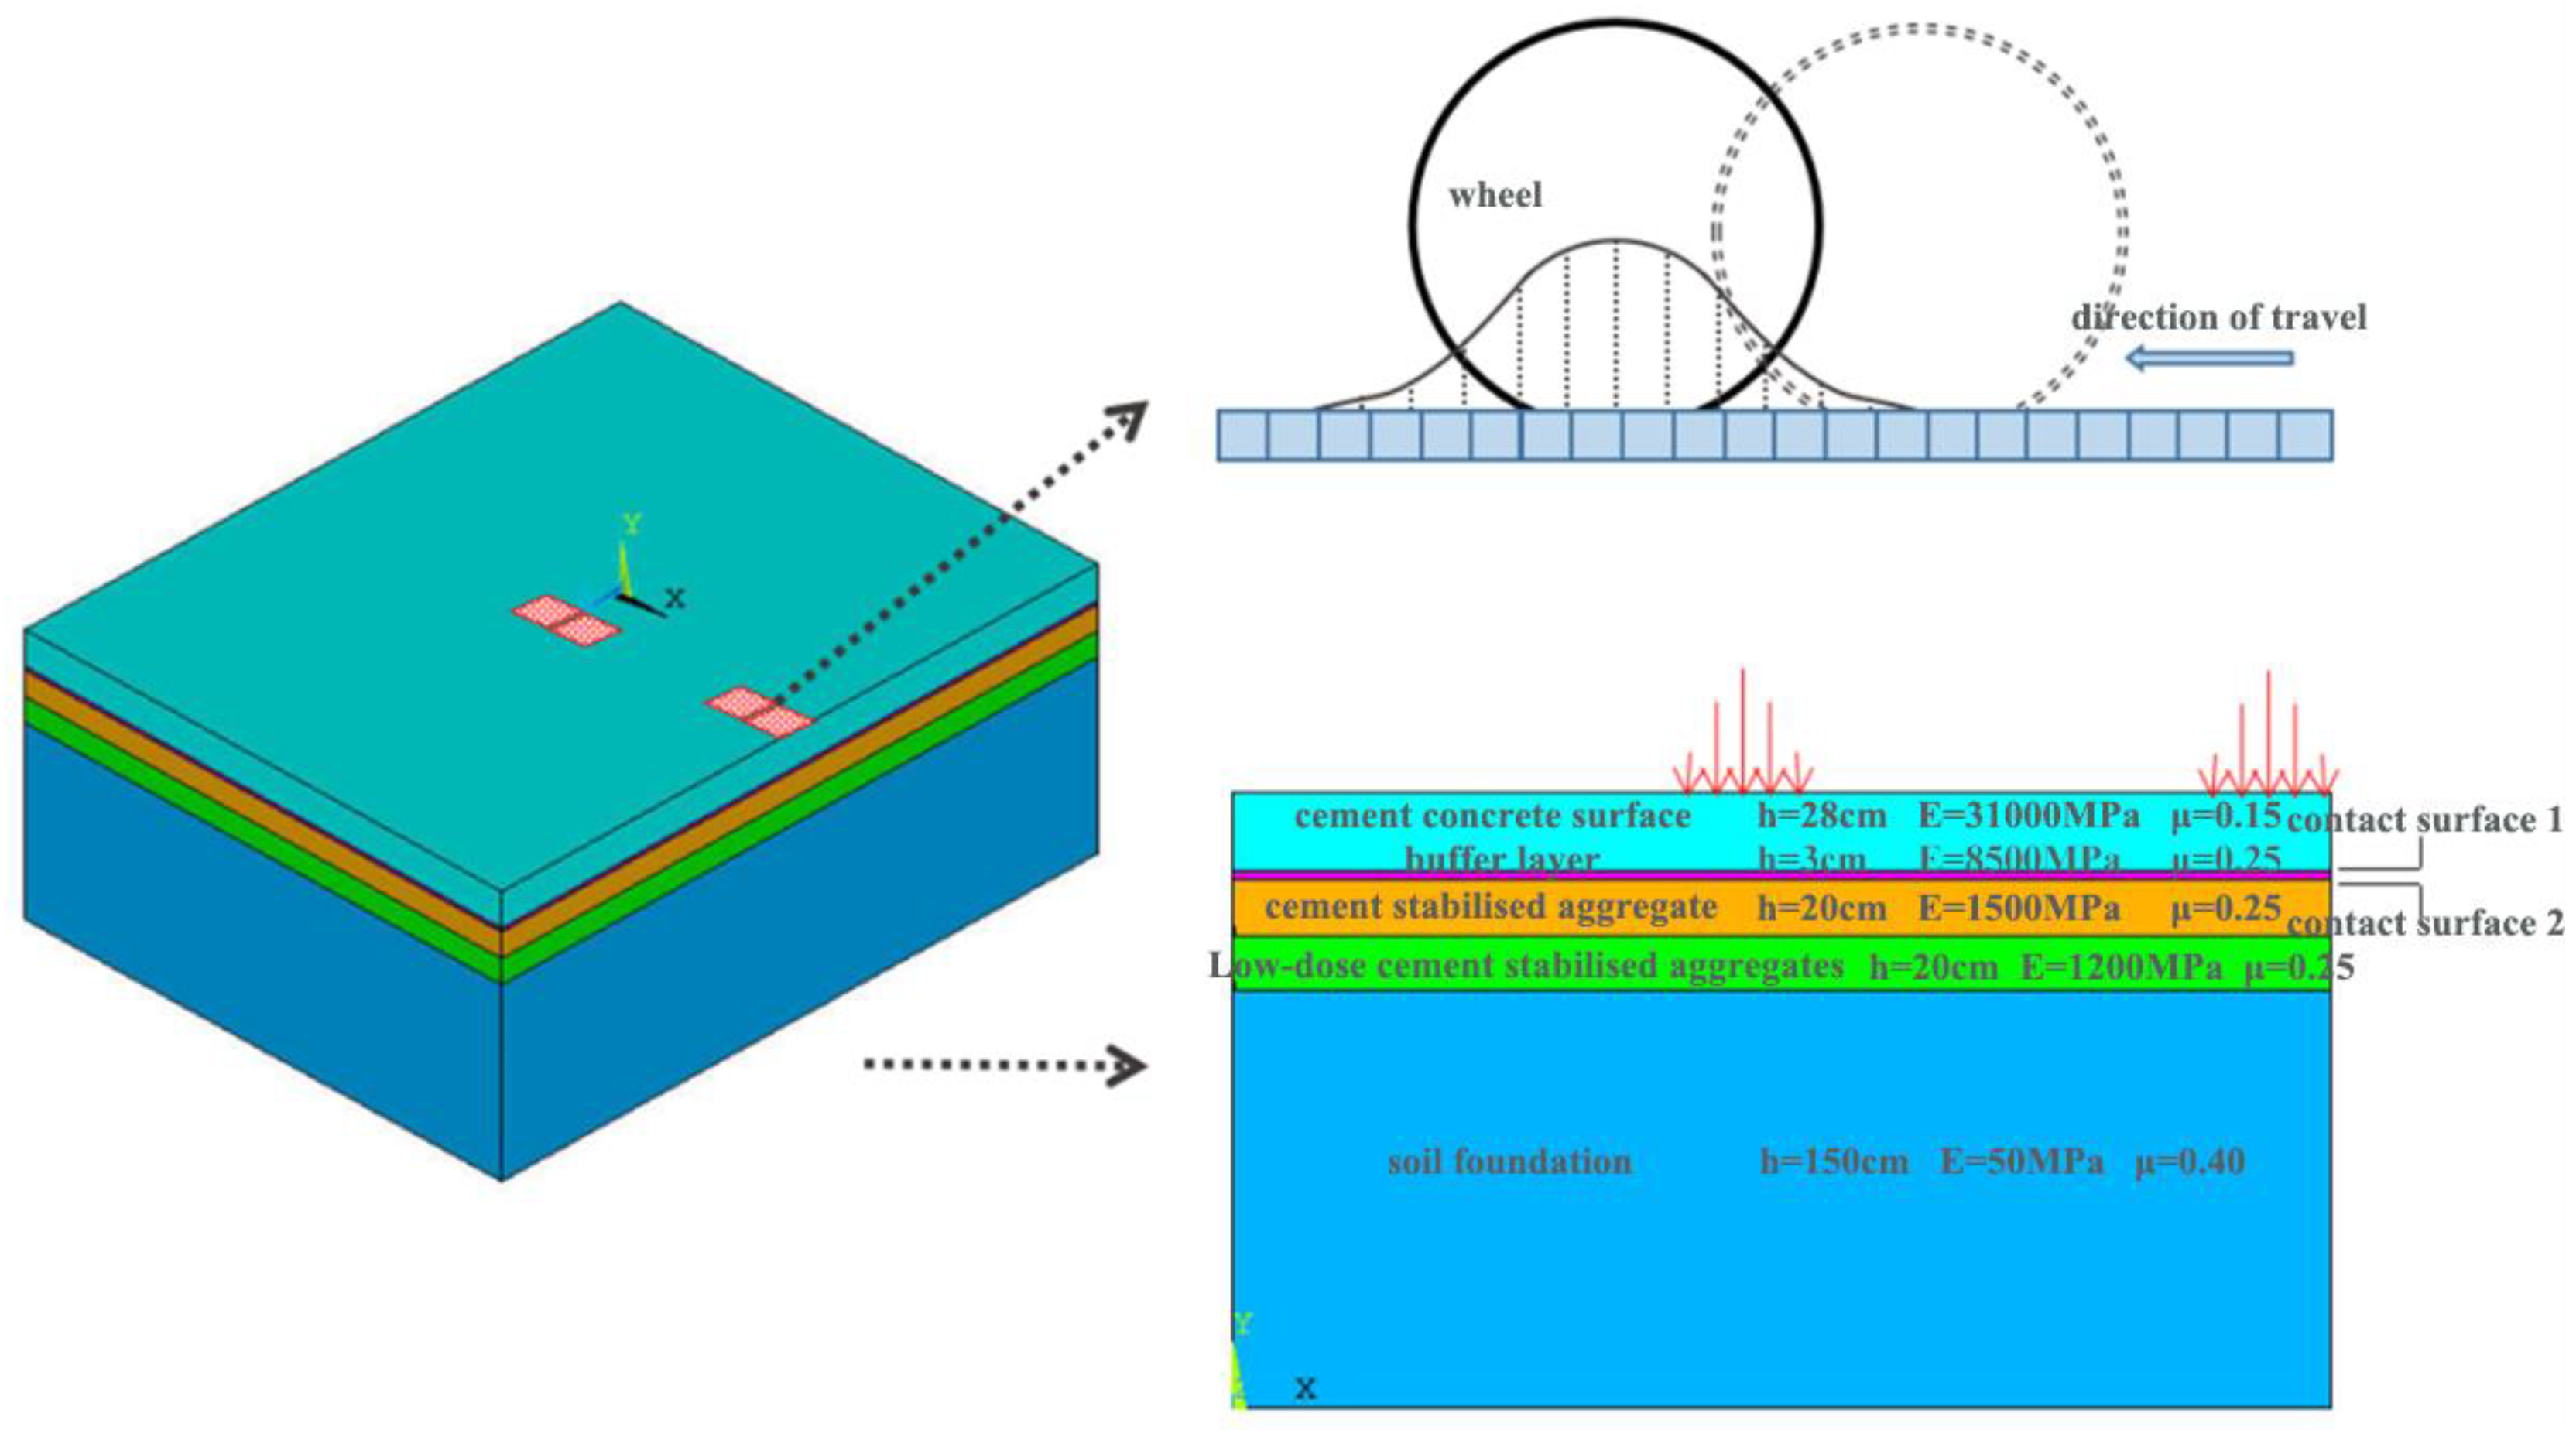
An ‘elastic cement concrete panel + viscoelastic buffer layer + elastic base + elastic subbase + elastic foundation’ model was established. The material parameters of each pavement structure are listed in Table 7.

2.3.2. Mesh Subdivision

The calculation accuracy of the software ANSYS 2021 is related to the thickness of the mesh division. The finer the division is, the easier it is to converge. At the same time, it is related to the shape of the division unit, and the aspect ratio should be kept as equal as possible [28]. The model plane was divided into 5 × 5 cm grids, with each layer (from the top to the bottom surfaces) divided vertically into 4, 1, 2, 2, and 3 parts.

2.3.3. Interlayer Contact Setting

When the contact was set between the surface and buffer layers, and the buffer and base layer, a large stiffness was set as the target surface, and a smaller stiffness was set as the contact surface. The interlayer bonding coefficient indicates the interlayer bonding state. In this study, when the finite-element model was set, the interlayer bonding coefficient was calculated as summarized with the results in Section 2.1.4.

2.3.4. Moving-Load Effect

The degree of freedom of the soil base surface of the model was fully constrained, and normal constraints were applied to the surrounding of each structural layer. A dynamic load in the form of a half-sine wave load was applied to the model, and the full complete analysis method was adopted in the transient analysis.
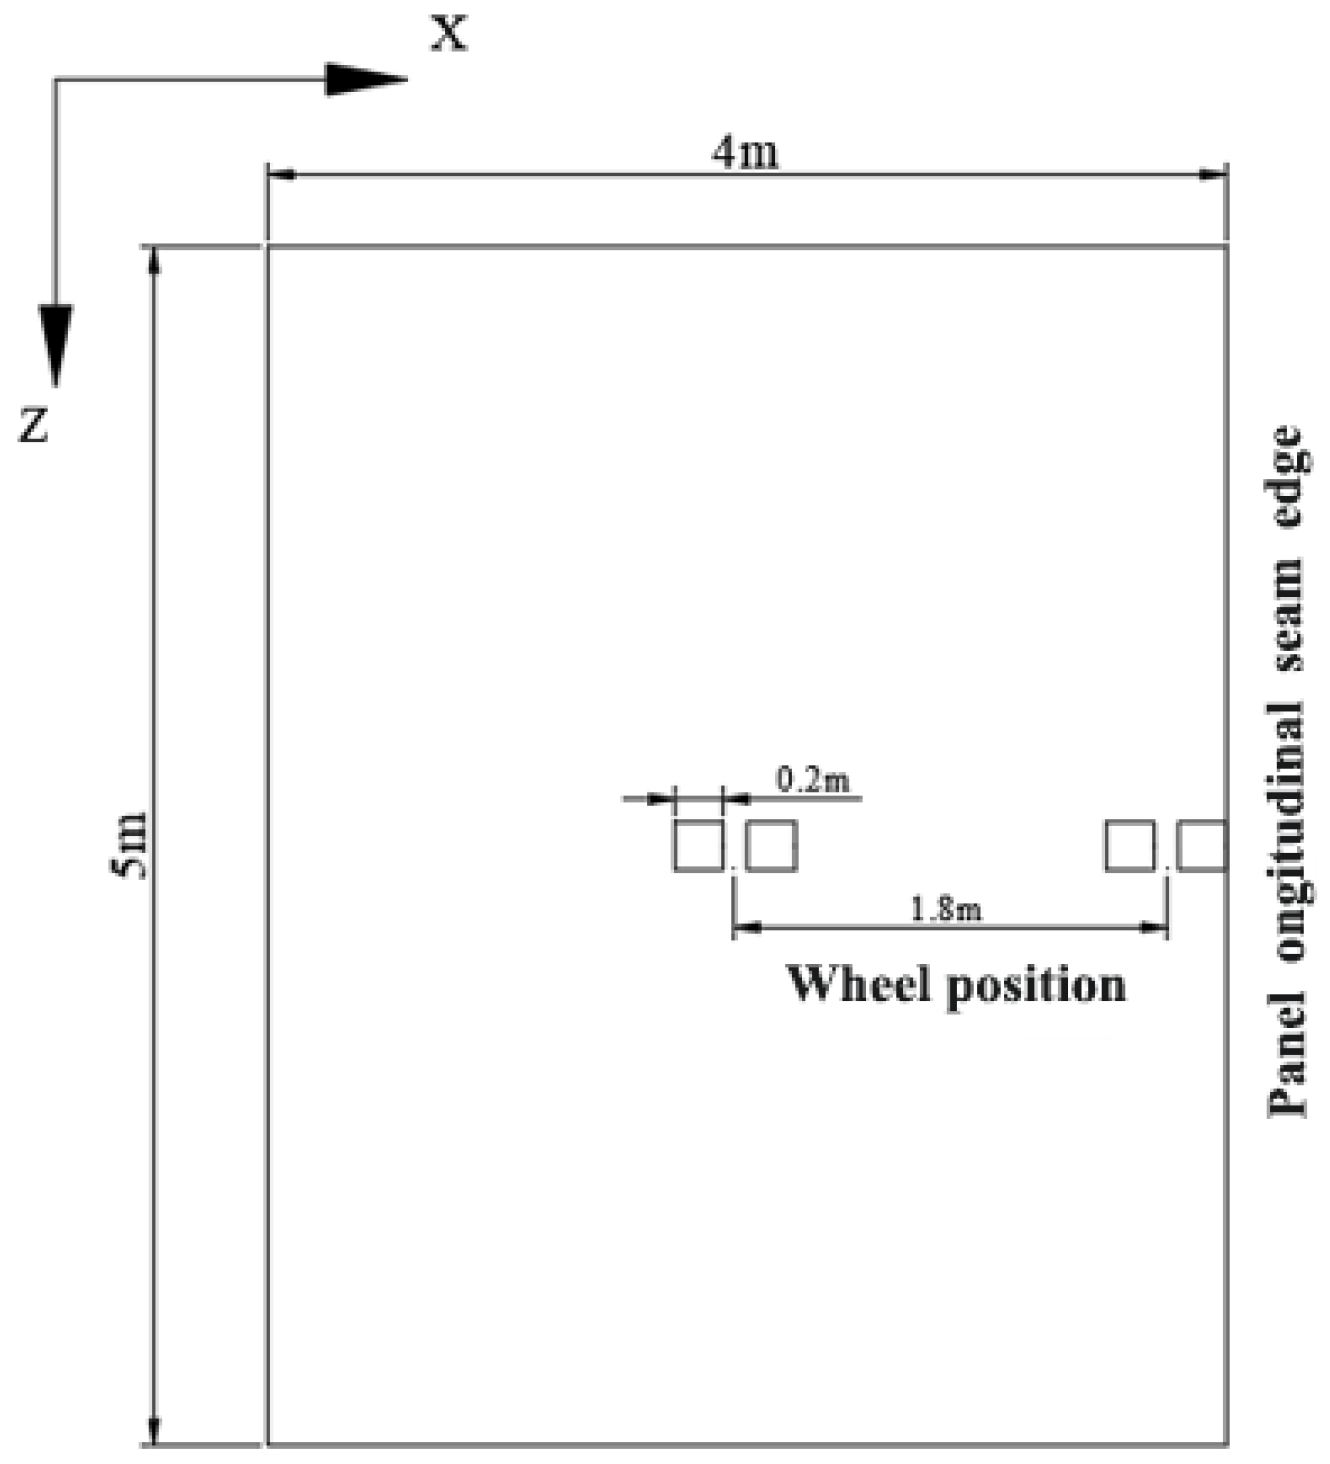
When analyzing the mechanical response, the load was applied to the middle of the longitudinal joint edge. The loading position is shown in Figure 10, and the load is applied along the -y axis. The square in the diagram represents the loaded position of the wheel, and the driving direction of the vehicle is assumed to be in the positive Z direction.
In this study, the standard axle loads for the structural design of asphalt pavements in China were used, and the vehicle load is a uniaxial-double load, and the axle load is 100 KN. The vehicle load is generally assumed to be a circular uniform load, which is equivalent to 16 elements (25 nodes) in this study, and the load applied by each node is expressed as a half-sine wave function. The calculation process of the node equivalent force is as follows:
As shown in Figure 11, Figure 11b–d are representative units in Figure 11a, and 2a is the side length of a unit. Figure 11a is the load loading diagram, Figure 11b is the DEIJ square load, Figure 11c is the CDHI square load, and Figure 11d is the HIMN square load.
The superposition calculation method for the node force and the equivalent load of each node are shown in Table 8.
The formula for calculating the equivalent node force of the surface load is shown in Equation (7):
F p e = δ N T p d s
where F p e is equivalent nodal force, N T is column vector composed of the shape function of each node in an 8-node hexahedron element, and P denotes the load density.
Huang [29] proposed a corresponding relationship between the vehicle loading frequency and vehicle speed, as shown in Table 9.
The total action time of the vehicle load corresponds to a half-sine wave loading period. The finite-element model and load form are illustrated in Figure 12.

2.3.5. Representative Temperature Selection

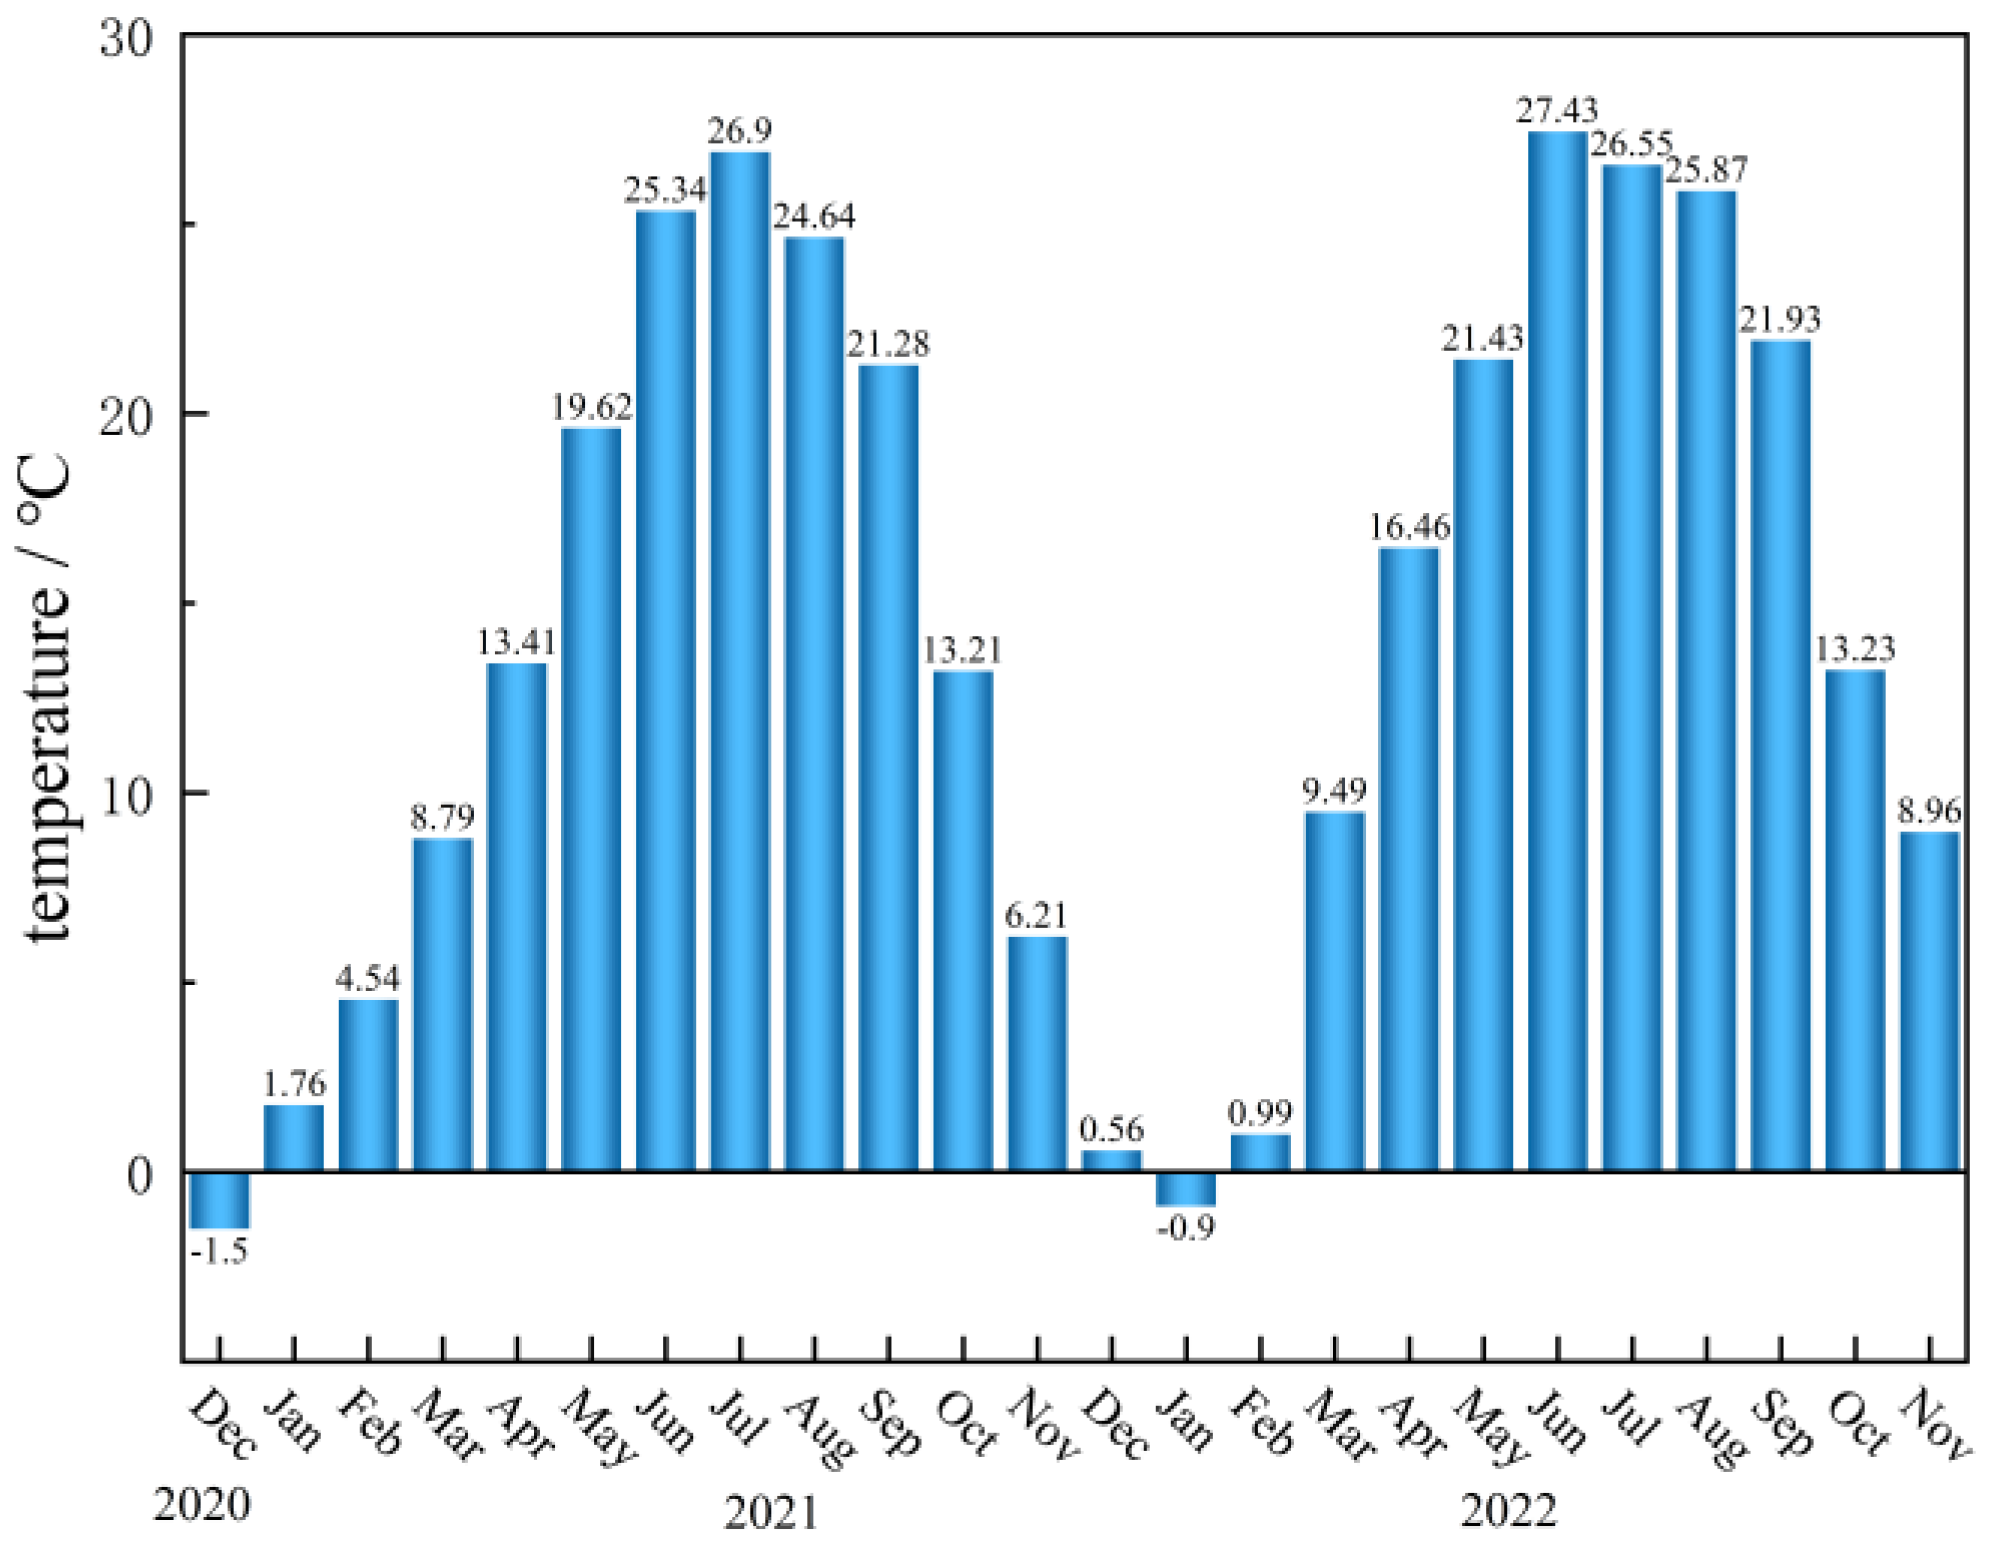
This study collected meteorological temperature data for Jinan City, Shandong province, China, from December 2020 to November 2022. The monthly average near-surface-temperature data are shown in Figure 13.
The temperature on June 20, the day with the highest near-surface temperature in June 2022, was selected to simulate the high-temperature weather, and the temperature on December 30, the day with the lowest near-surface temperature in December 2020, was selected to simulate the low-temperature weather. In addition, the temperature on 1 May 2022, was selected as the medium-temperature weather for comparison. The near-surface temperatures on the three representative days are presented in Table 10, Table 11 and Table 12.

2.3.6. Temperature Boundary Condition

(1) Heat exchange coefficient
Heat exchange at the road surface refers to the conduction and convection of temperature between the road surface and the atmosphere due to the temperature difference between the two [30,31,32]. The heat exchange coefficient indicates the strength of the temperature exchange effect [33,34], and its size is mainly related to the wind speed. The recommended values of the heat exchange coefficient at different wind speeds are listed in Table 13 [35].
The calculated heat exchange coefficients for the three representative weather conditions studied herein are summarized in Table 14, Table 15 and Table 16.
(2) Applied temperature
When thermal analyses of a pavement structure are conducted, it is not reasonable to perform simulations for short periods because the weather undergoes cyclical changes and the pavement structure has a certain thickness. Heat transfer is a long-term process, while failure to fully simulate environmental factors in the modeling process can also cause errors in the results.
This study conducted a temperature field response analysis of the pavement structure by performing hour-by-hour transient analyses of temperatures on the selected date (in Section 2.3.5) to improve the accuracy of the results. First, steady-state thermal analysis was performed followed by a transient thermal analysis with the steady-state thermal analysis results used as the initial values. The transient thermal analysis method was used to analyze the temperature field, and the temperature calculation result of the first hour was considered as the initial temperature for the subsequent transient analysis. The table method was used to input the near-surface temperature and heat exchange coefficient, and the substep time of each temperature change was 3600 s.

2.3.7. Finite-Element Simulation Verification

The finite-element simulation analysis results are verified using the stress-calculation formula of the double-layer plate in the “Code for Design of Highway Cement Concrete Pavement” (JTG D40-2011) [26]. The calculated position is located at point M in Figure 11. The calculation results are listed in Table 17, and the stress cloud diagram of the simulation analysis is shown in Figure 14.
The listings in Table 17 indicate that when constraints are set around the panel, the stress value obtained using the simulation analysis is the closest to the theoretical calculation result (with a difference of 3.7%). This finding proves that the simulation analysis results are reliable and can be used for stress–strain response analysis, and the constraint form of the panel is the most suitable for setting normal constraints. Figure 13 shows that the maximum tensile and compressive stresses in the structure are located within the panels.

3. Results

3.1. Analysis of the Mechanical Response of a Pavement Structure under Different Temperatures

3.1.1. Temperature Distribution in a Pavement Structure under Different Temperature Conditions

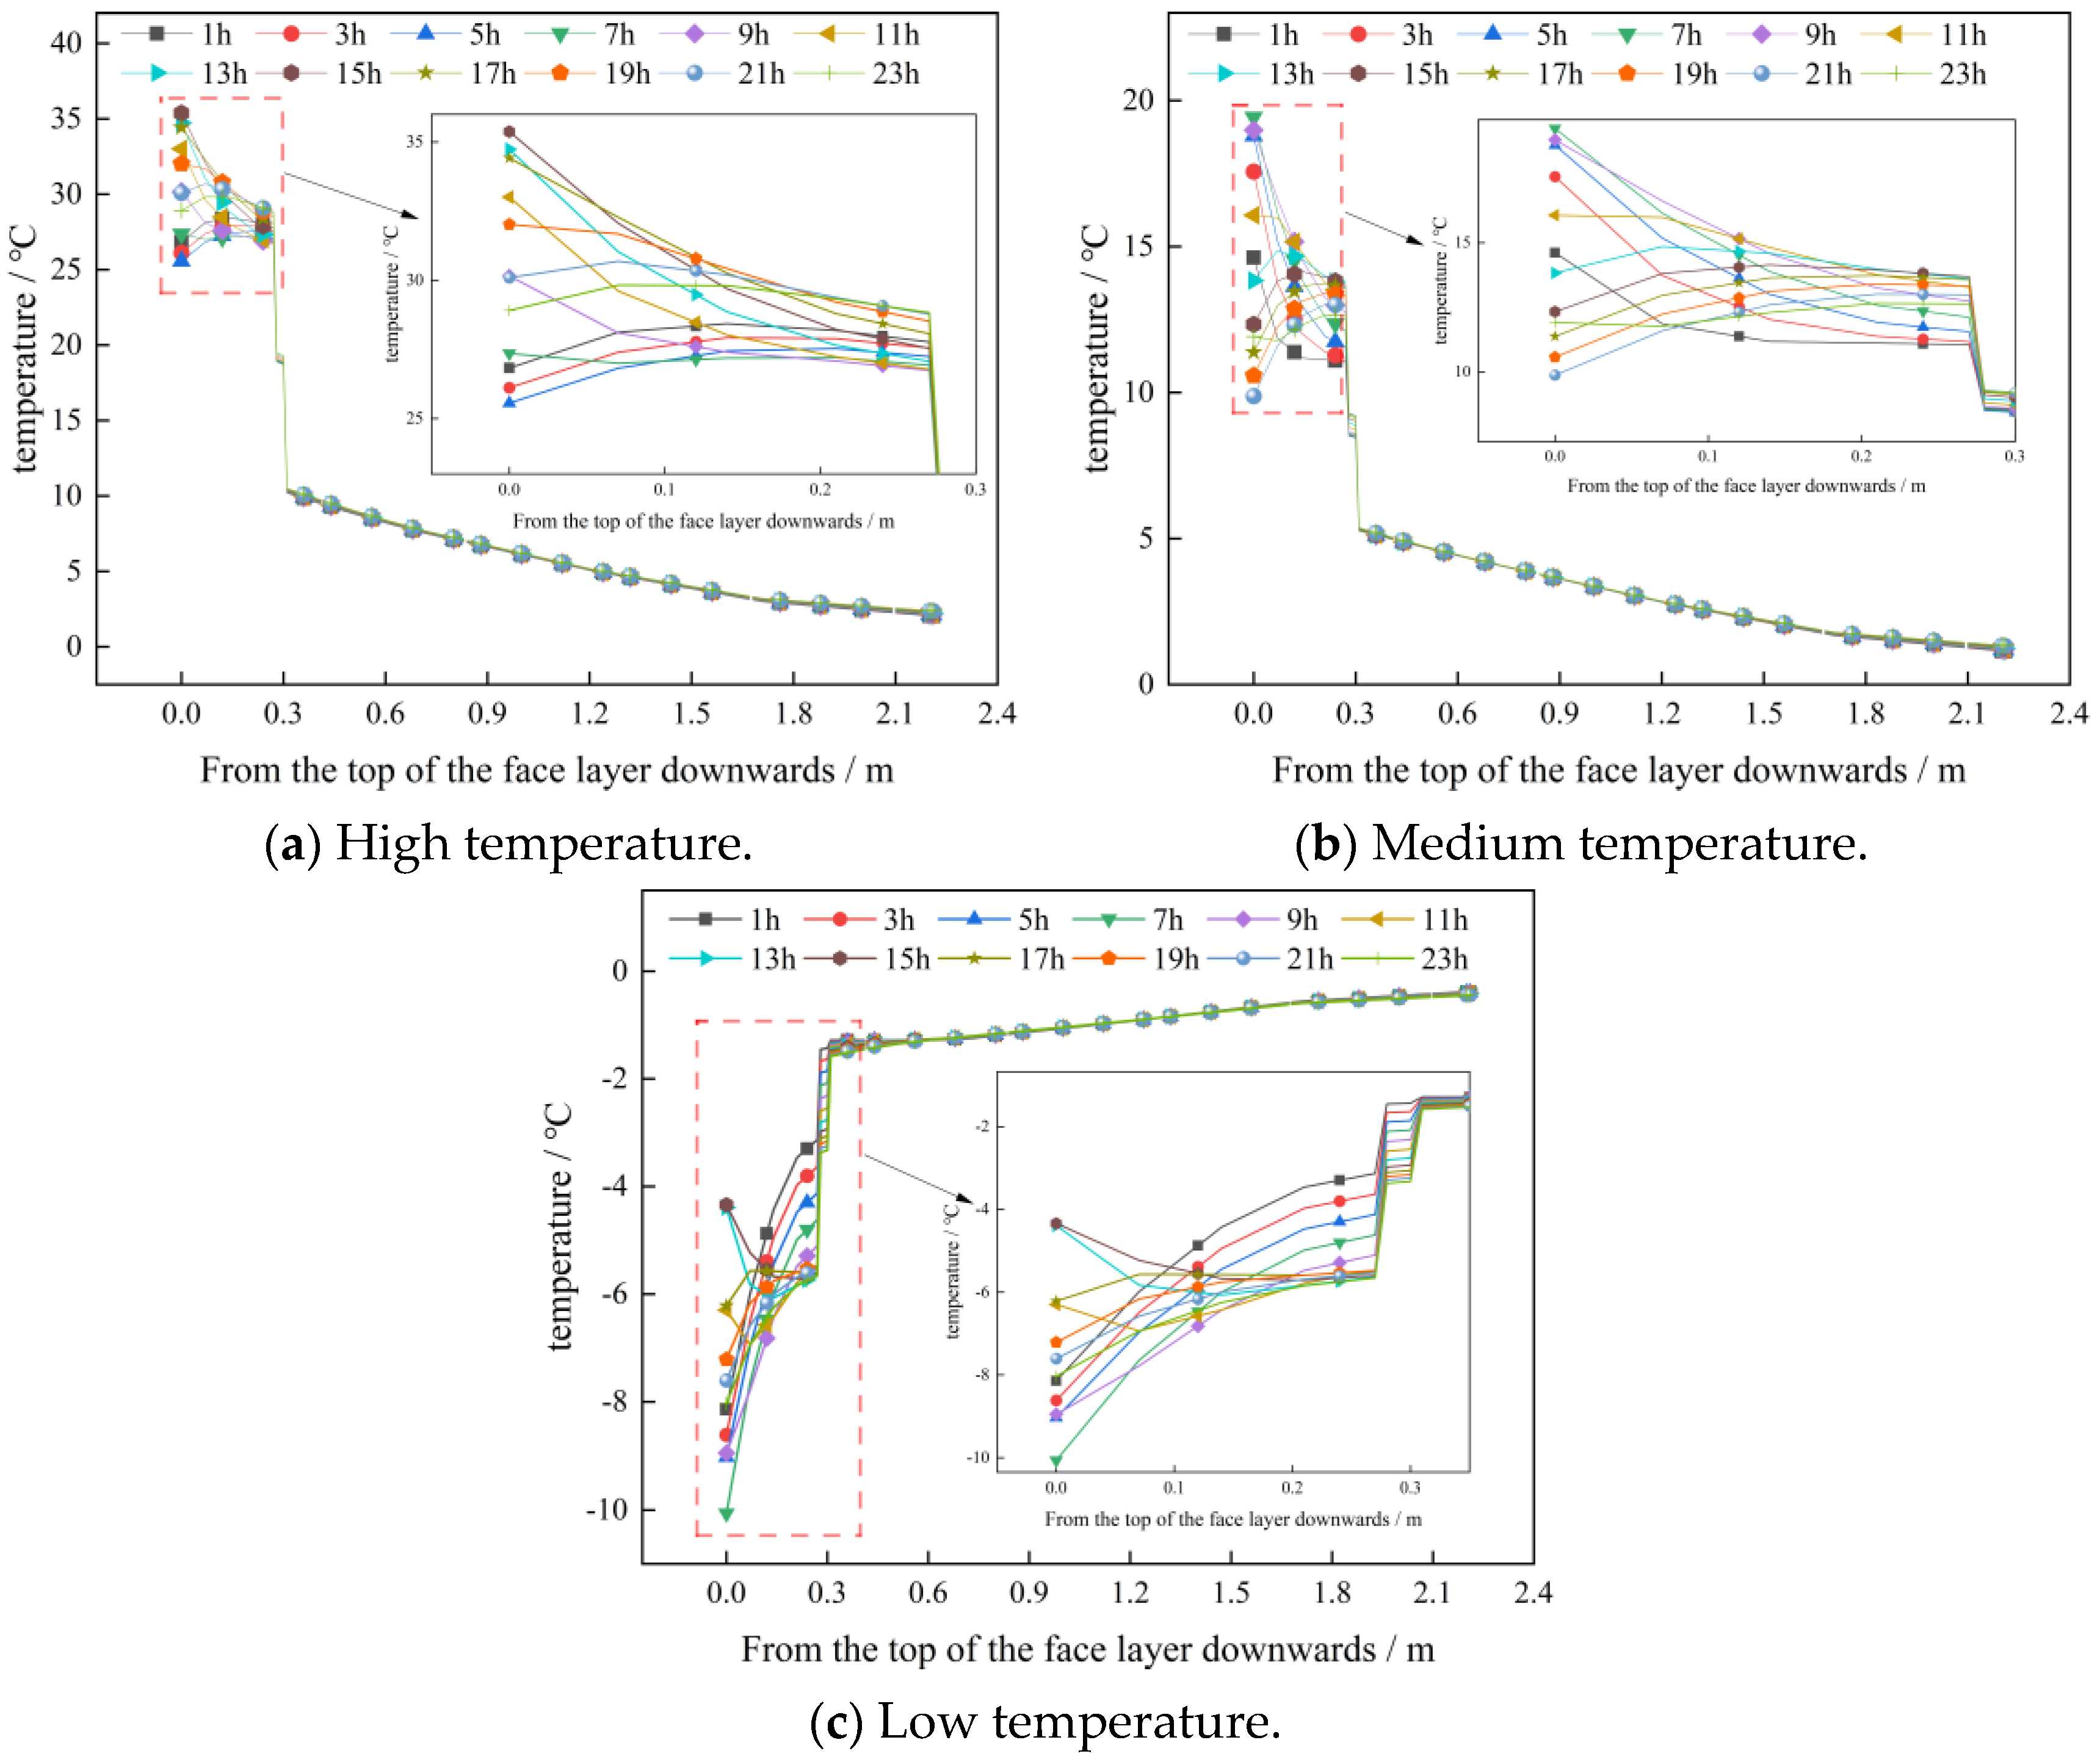
The calculation results for the daily temperature changes in each structural layer of the pavement at different temperatures are shown in Figure 15.
As shown in Figure 15, under different temperature conditions, the temperature changes at different times mainly occur in the surface layer, and the temperature changes abruptly in the buffer layer. Compared to the test results of Jeong [36], it was found that, for a cement pavement structure without a buffer layer, the temperature change in the depth direction of the pavement structure layer was a smooth curve, and the buffer layer caused the temperature to change abruptly, indicating that the buffer layer hinders the downward transmission of temperature. This is similar to the insulation-layer effect in Huang’s work [37], which influences the use of the pavement structure.

3.1.2. Stress and Strain in a Pavement under Different Temperature Conditions

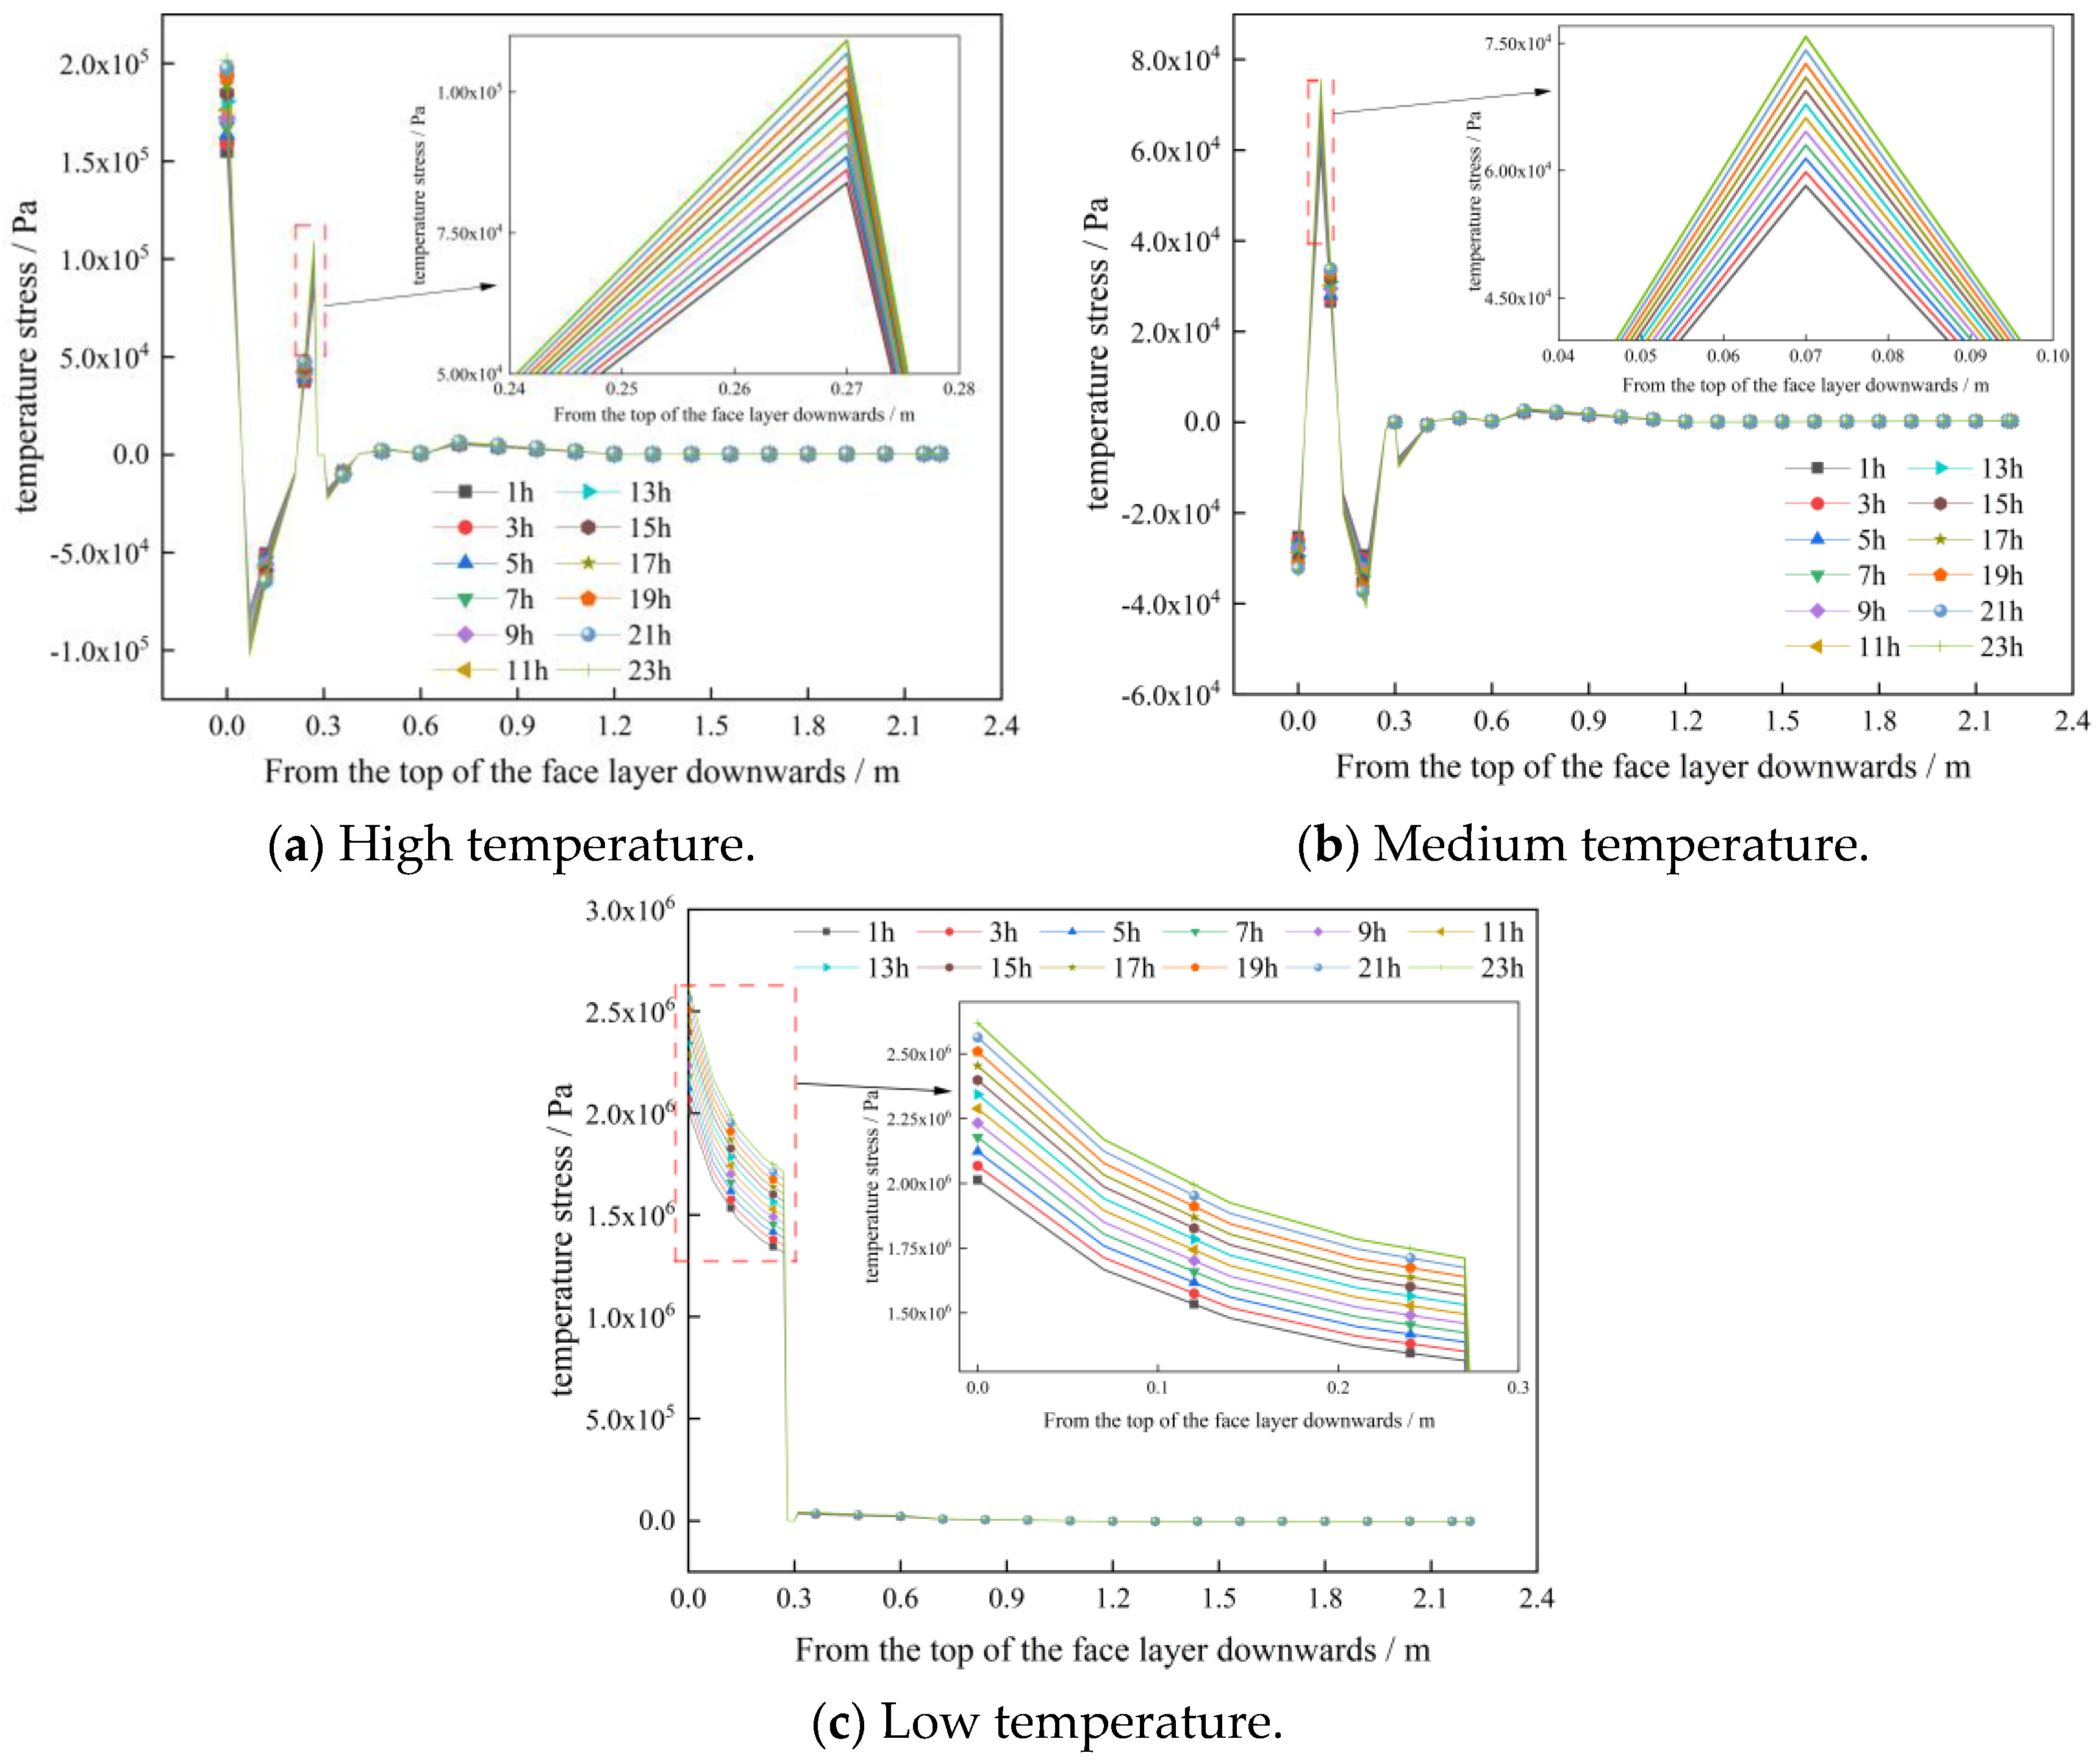
The calculation results for the daily temperature, stress, and strain changes in each structural layer of the pavement at different temperatures are shown in Figure 16.
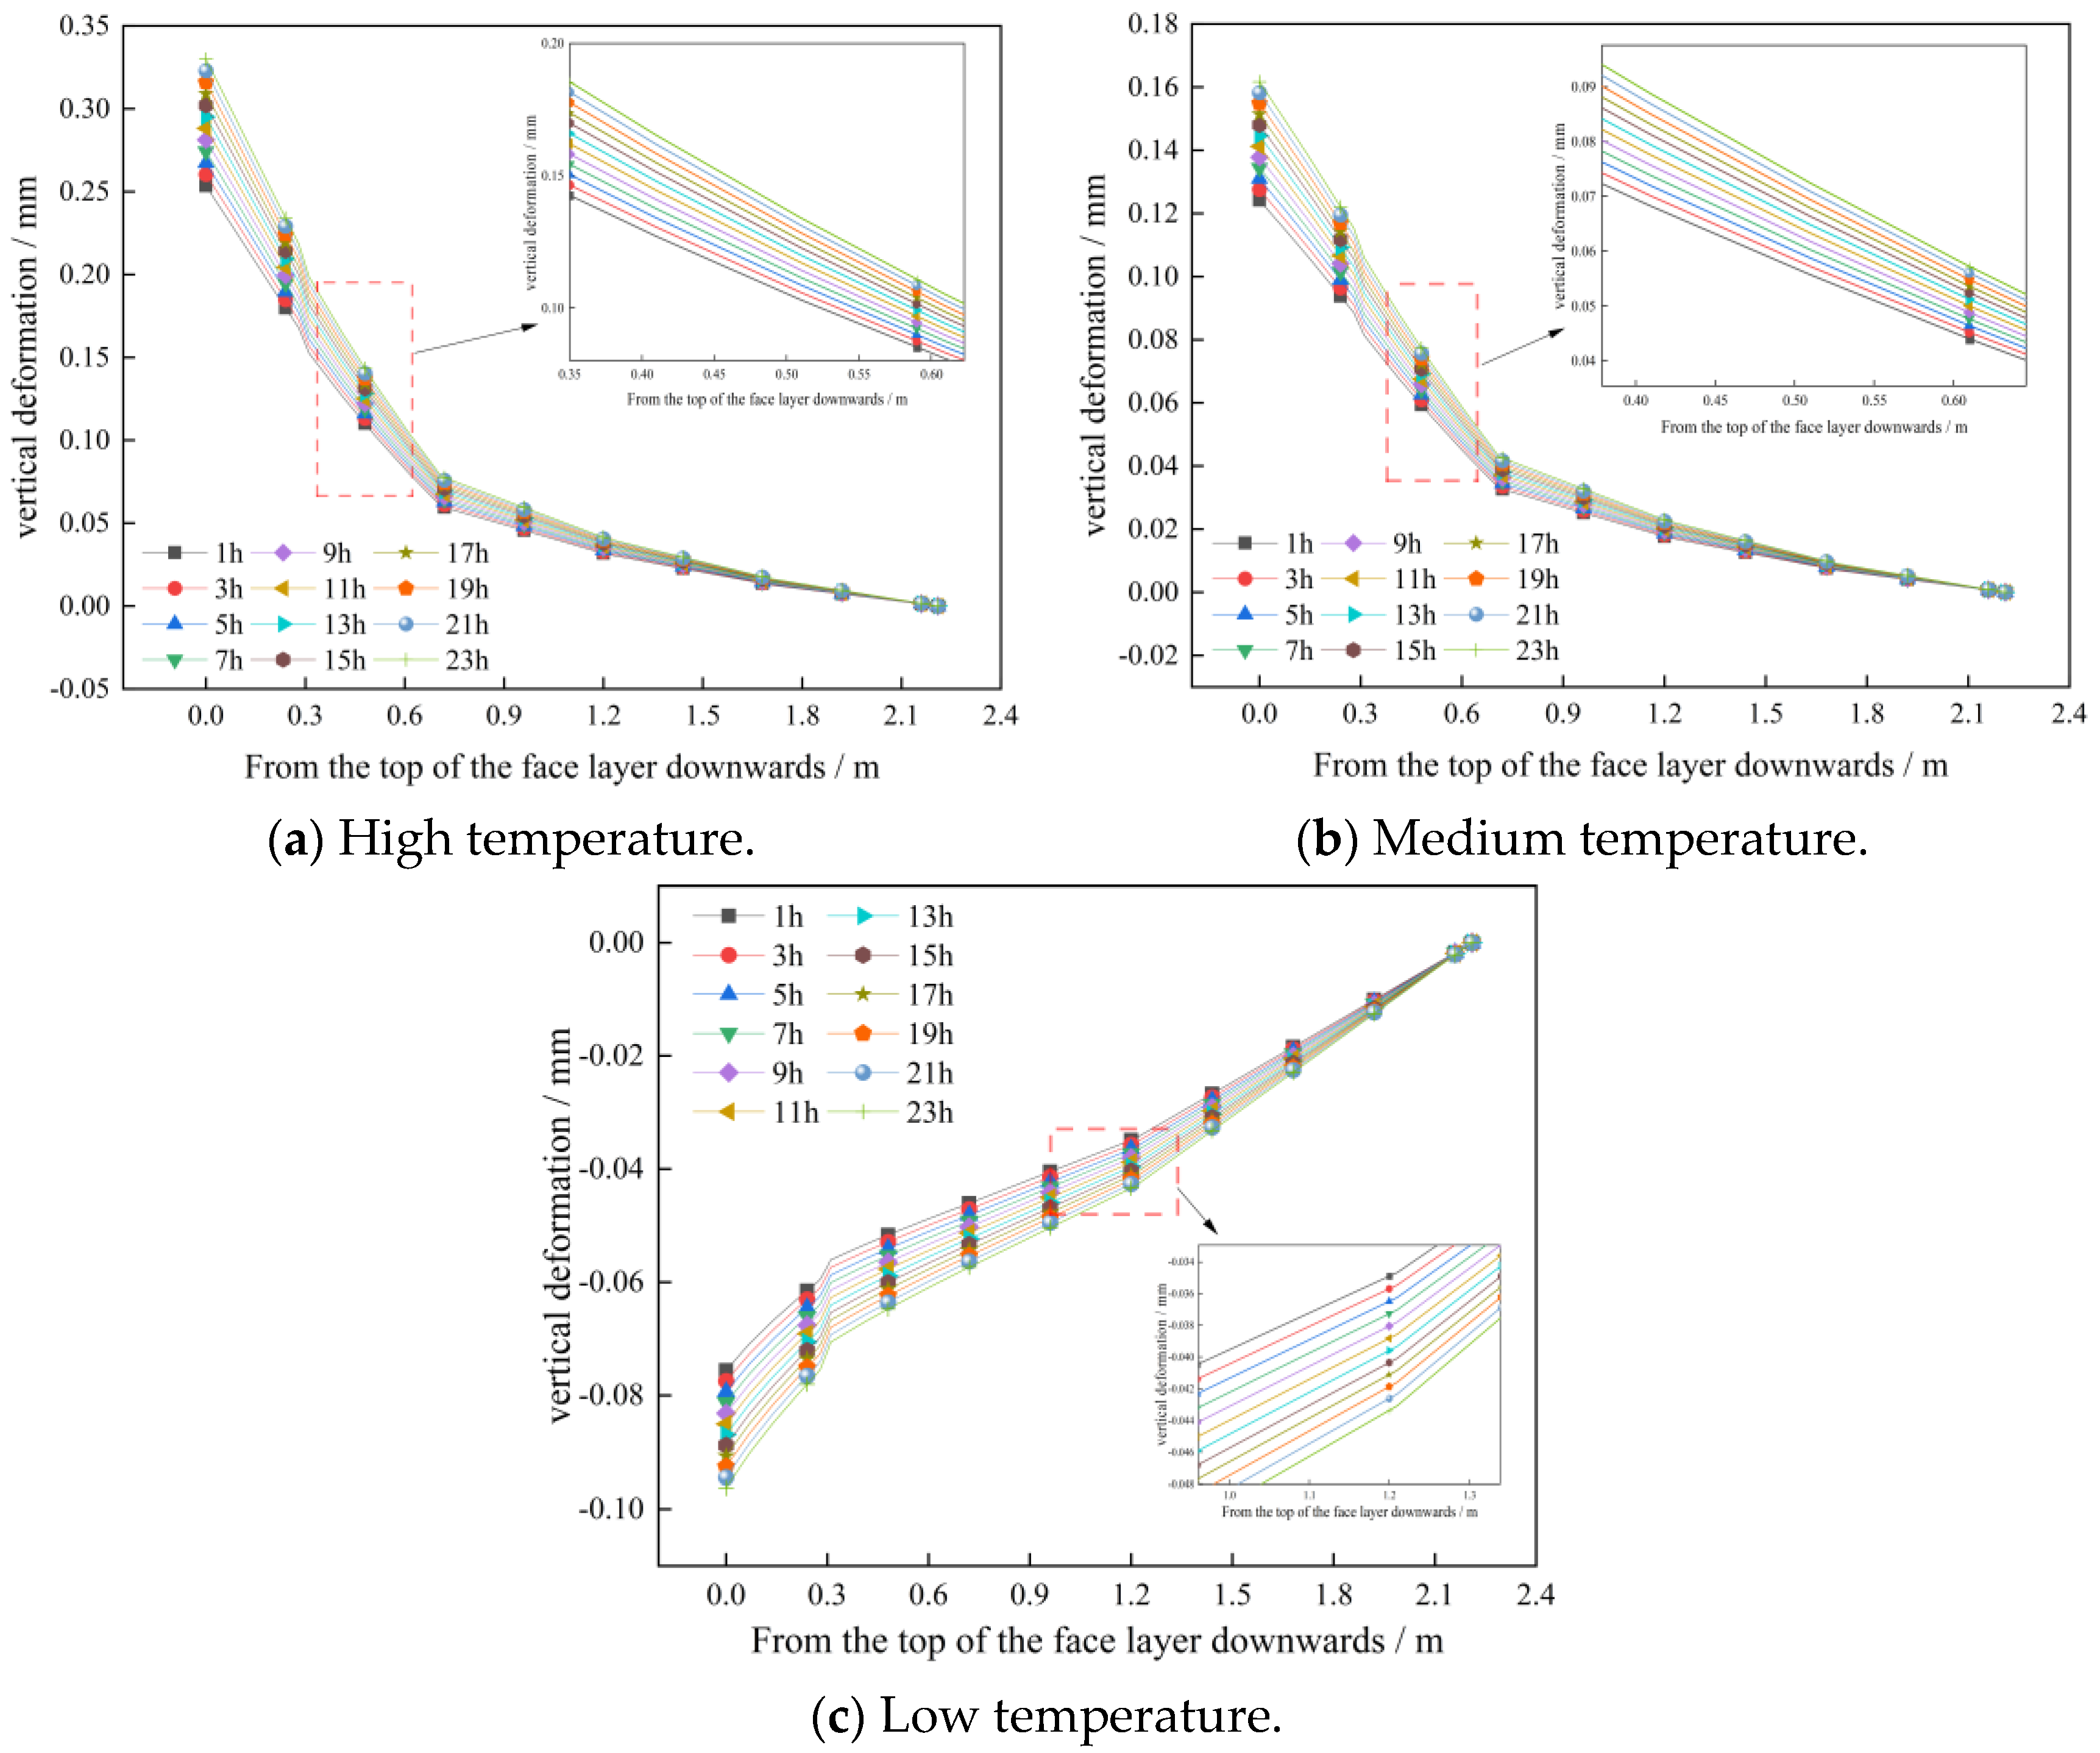
Figure 16 shows that the temperature stress in the surface layer changes to a ‘Z’ shape in high- and medium-temperature environments. The stresses from top to bottom are ‘tension–compression–tension’ at high temperatures and ‘compression–tension–compression’ at medium temperatures. At low temperatures, the temperature stress in the surface layer decreases slowly from top to bottom, and an abrupt change occurs in the temperature stress in the buffer layer.
Figure 17 shows the calculation results for the daily temperature-induced deformation in each structural layer of the pavement at different temperatures. As shown in Figure 17, under the three temperature conditions, the vertical deformation of the road center exhibits the same change form in depth and time. The panel remains flat at high and medium temperatures, and it exhibits evident corner warping at low temperatures.

3.2. Analysis of the Mechanical Response under the Combined Effect of Temperature and Moving Load

The finite-element coupling analysis includes both direct and indirect coupling methods. In this study, an indirect coupling method was used to introduce the temperature field analysis results as body loads to the coupling analysis model. The temperature fields at the highest temperature moment (15 o’clock) in high-temperature weather, average temperature moment (9 o’clock) in medium-temperature weather, and lowest temperature moment (7 o’clock) in low-temperature weather are selected as the body loads at high, medium, and low temperatures, respectively. Considering a vehicle speed of 60 km/h as an example, the response to the coupling of the temperature and moving load at different temperatures was determined.

3.2.1. Responses to Coupled High Temperature and Moving Load

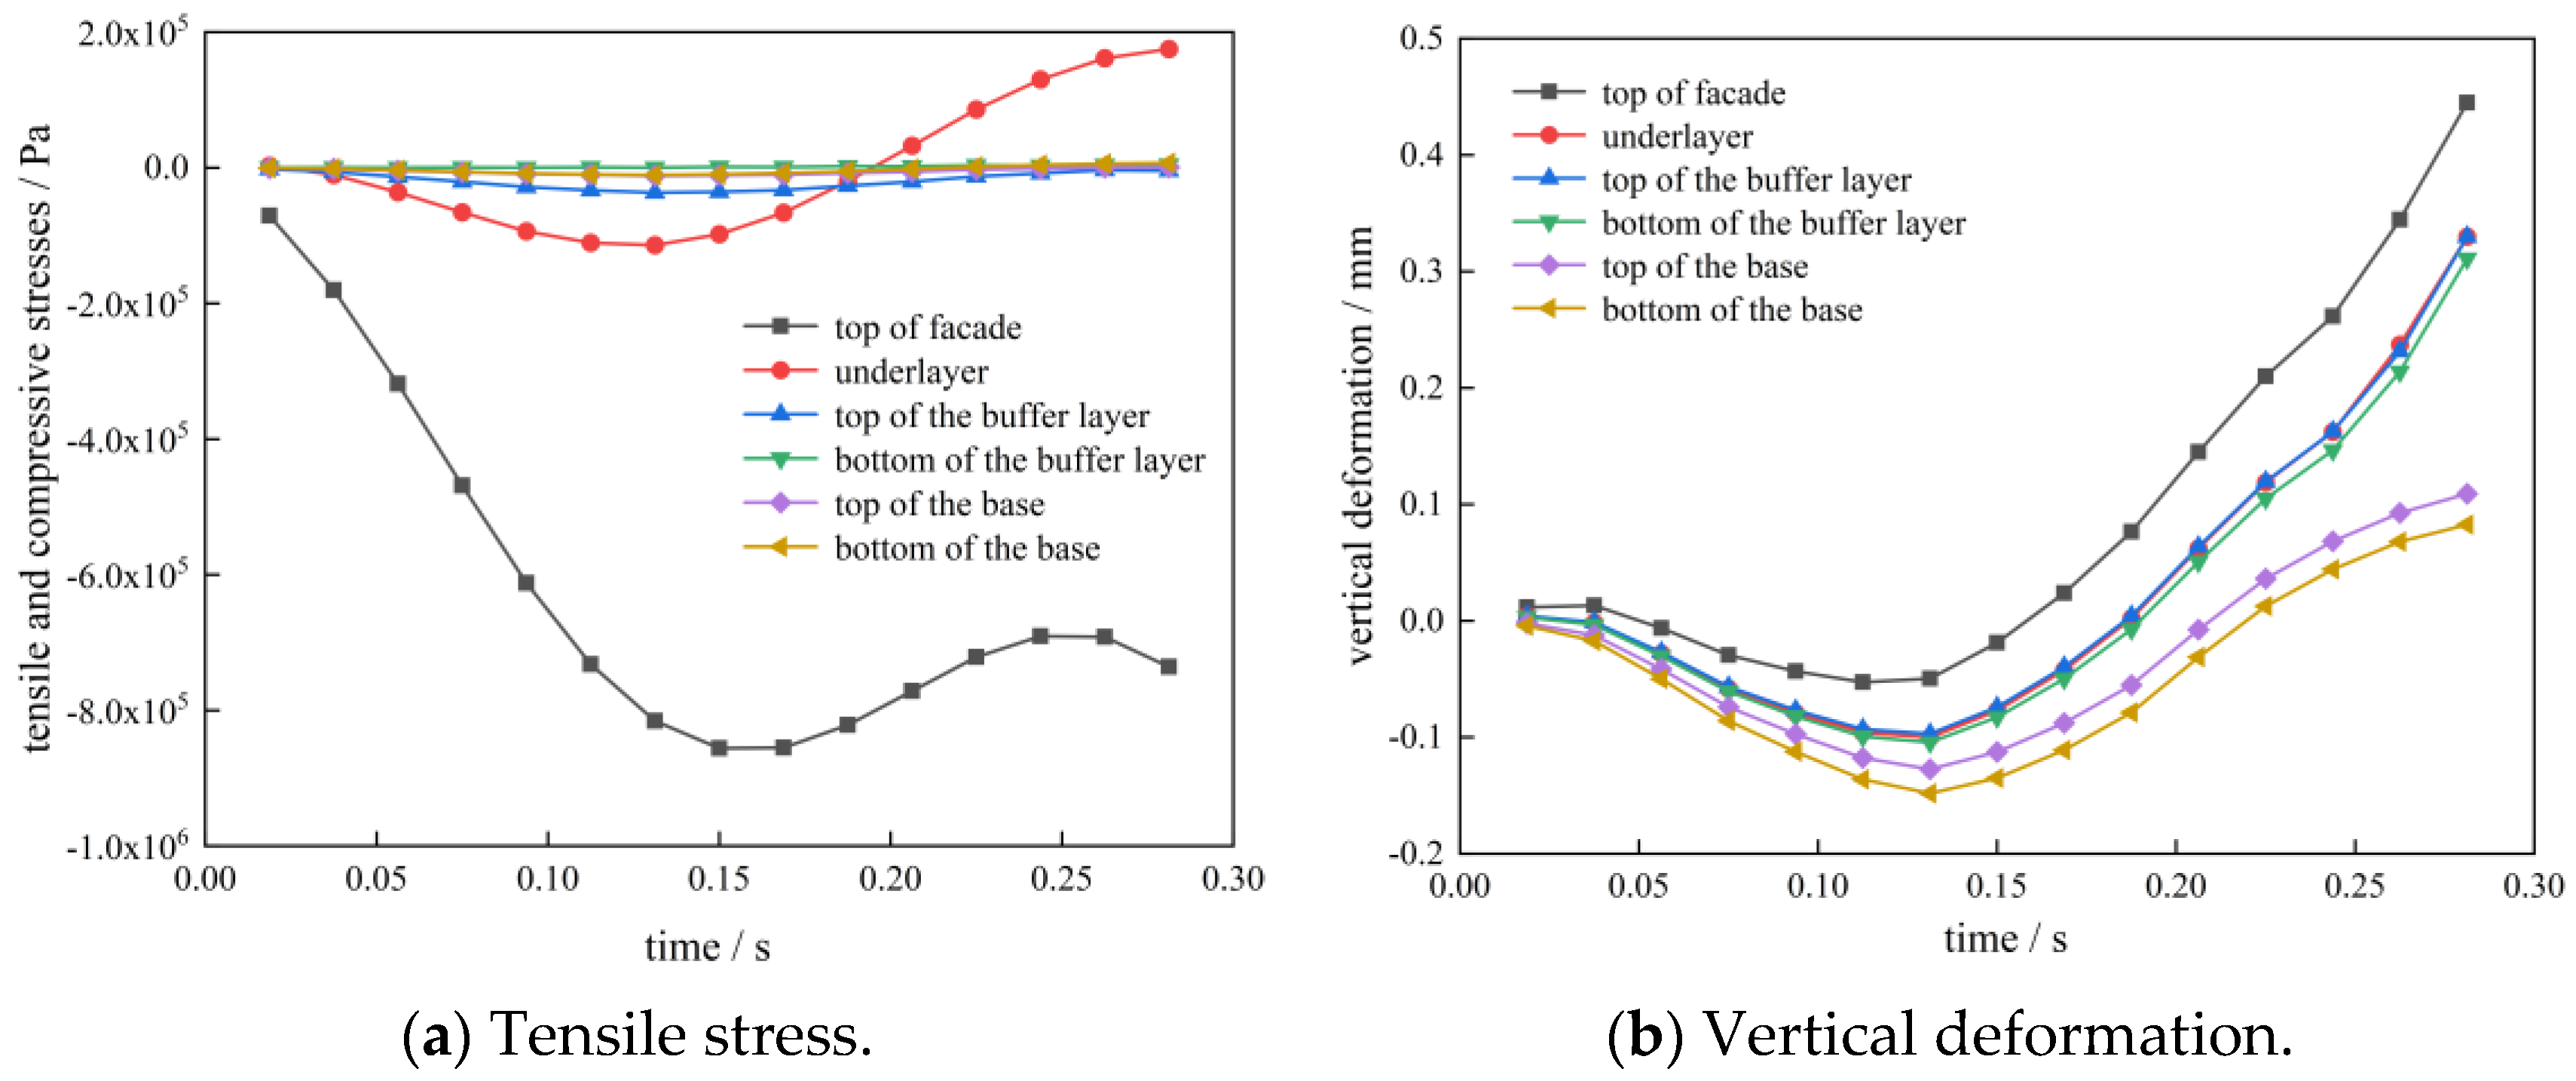
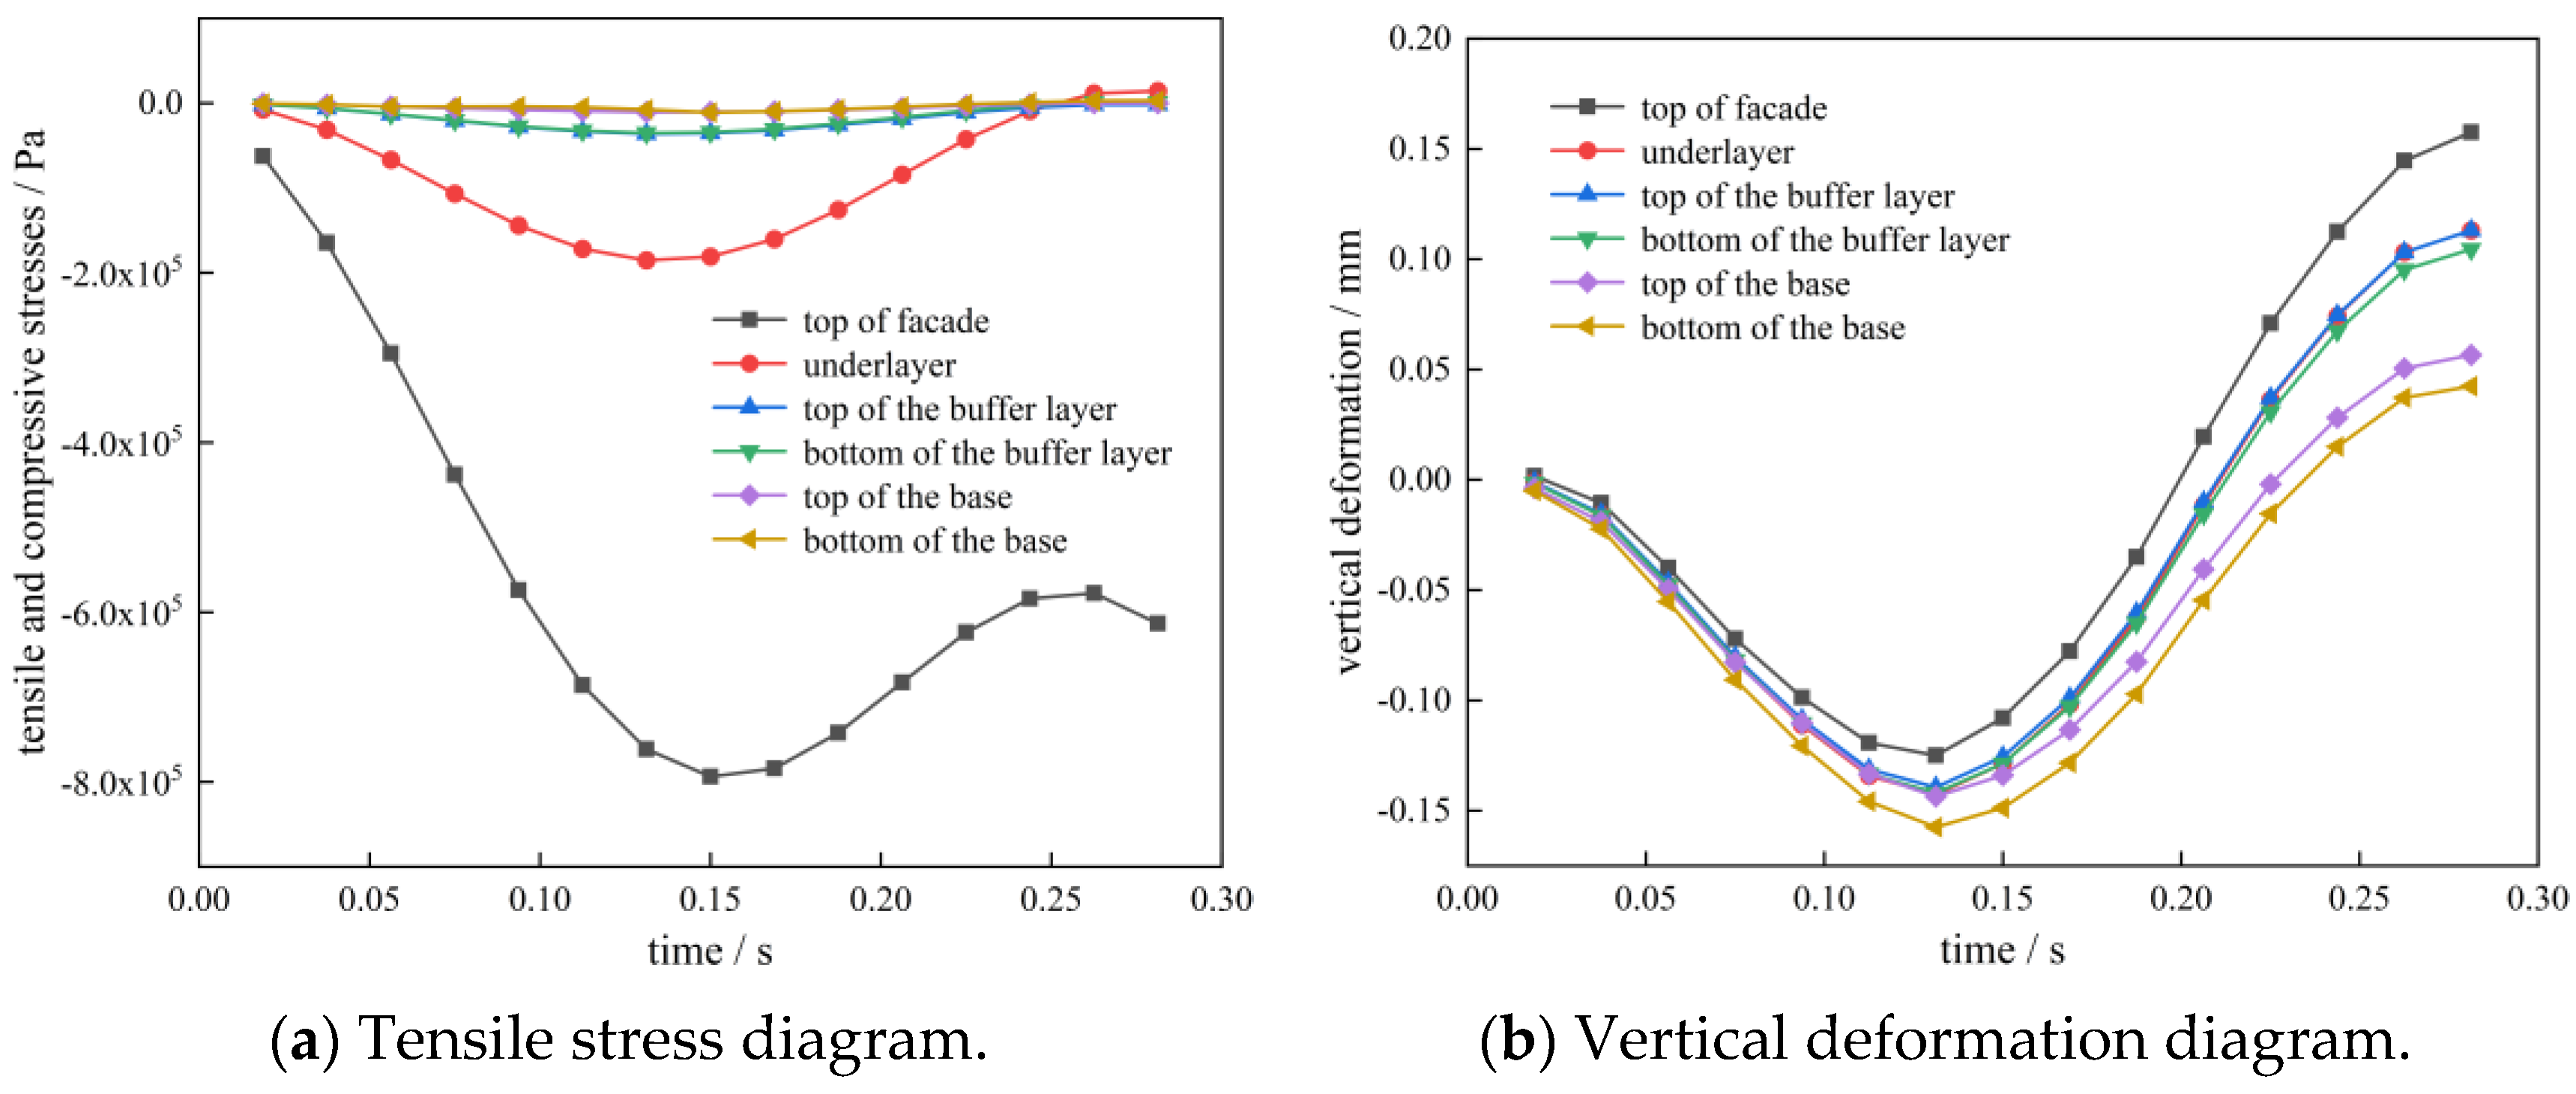
The time-dependent curves of the tensile stress, compressive stress, and vertical deformation in each structural layer of the pavement are shown in Figure 18.
Figure 18a shows that under high-temperature weather conditions, when the vehicle passes through the middle of the panel, the top of the surface layer remains subjected to compressive stress, and the stress value first increases and then decreases. The bottom of the panel is first compressed and then pulled. The stresses in the buffer and base layers are small.
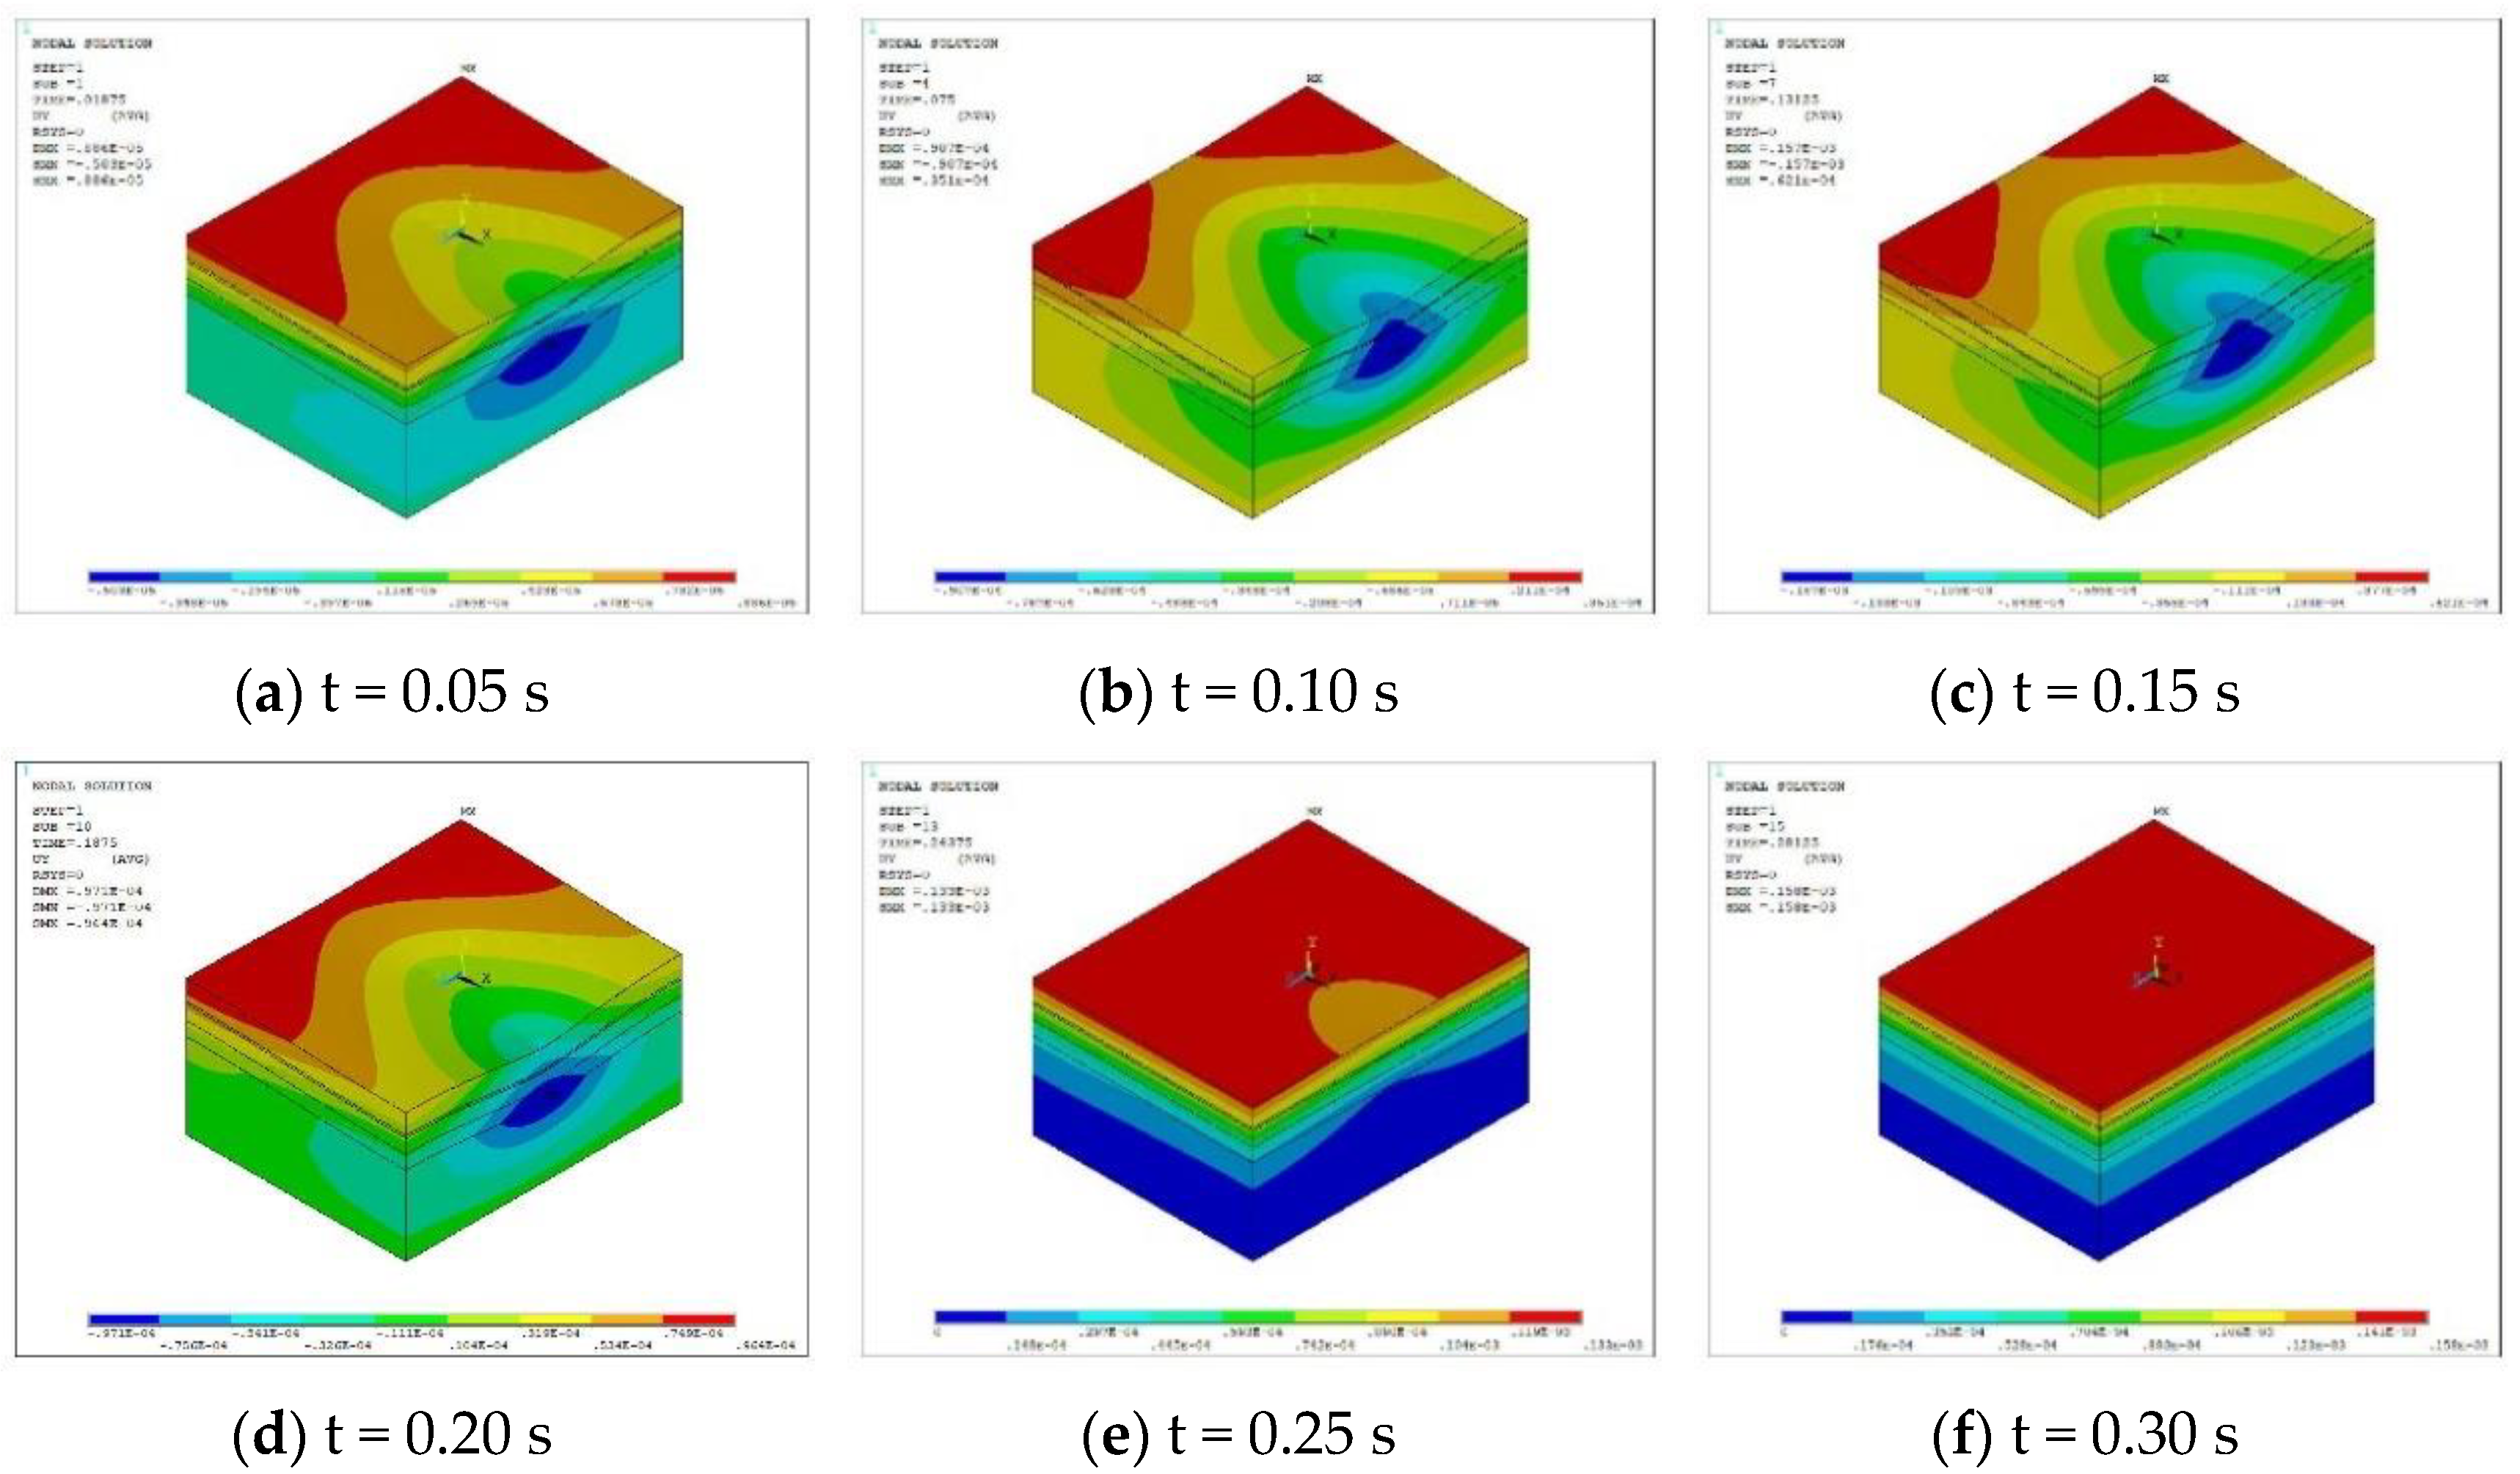
As shown in Figure 18b, under the coupling of a high temperature and moving load, the vertical deformations in each structural layer have the same form. Owing to the viscoelastic properties of the buffer layer, when the vehicle leaves the middle of the longitudinal seam edge, the compression deformation gradually recovers, continues to arch upward under the influence of temperature, and finally produces a 0.445 mm deformation in the middle of the longitudinal seam edge.
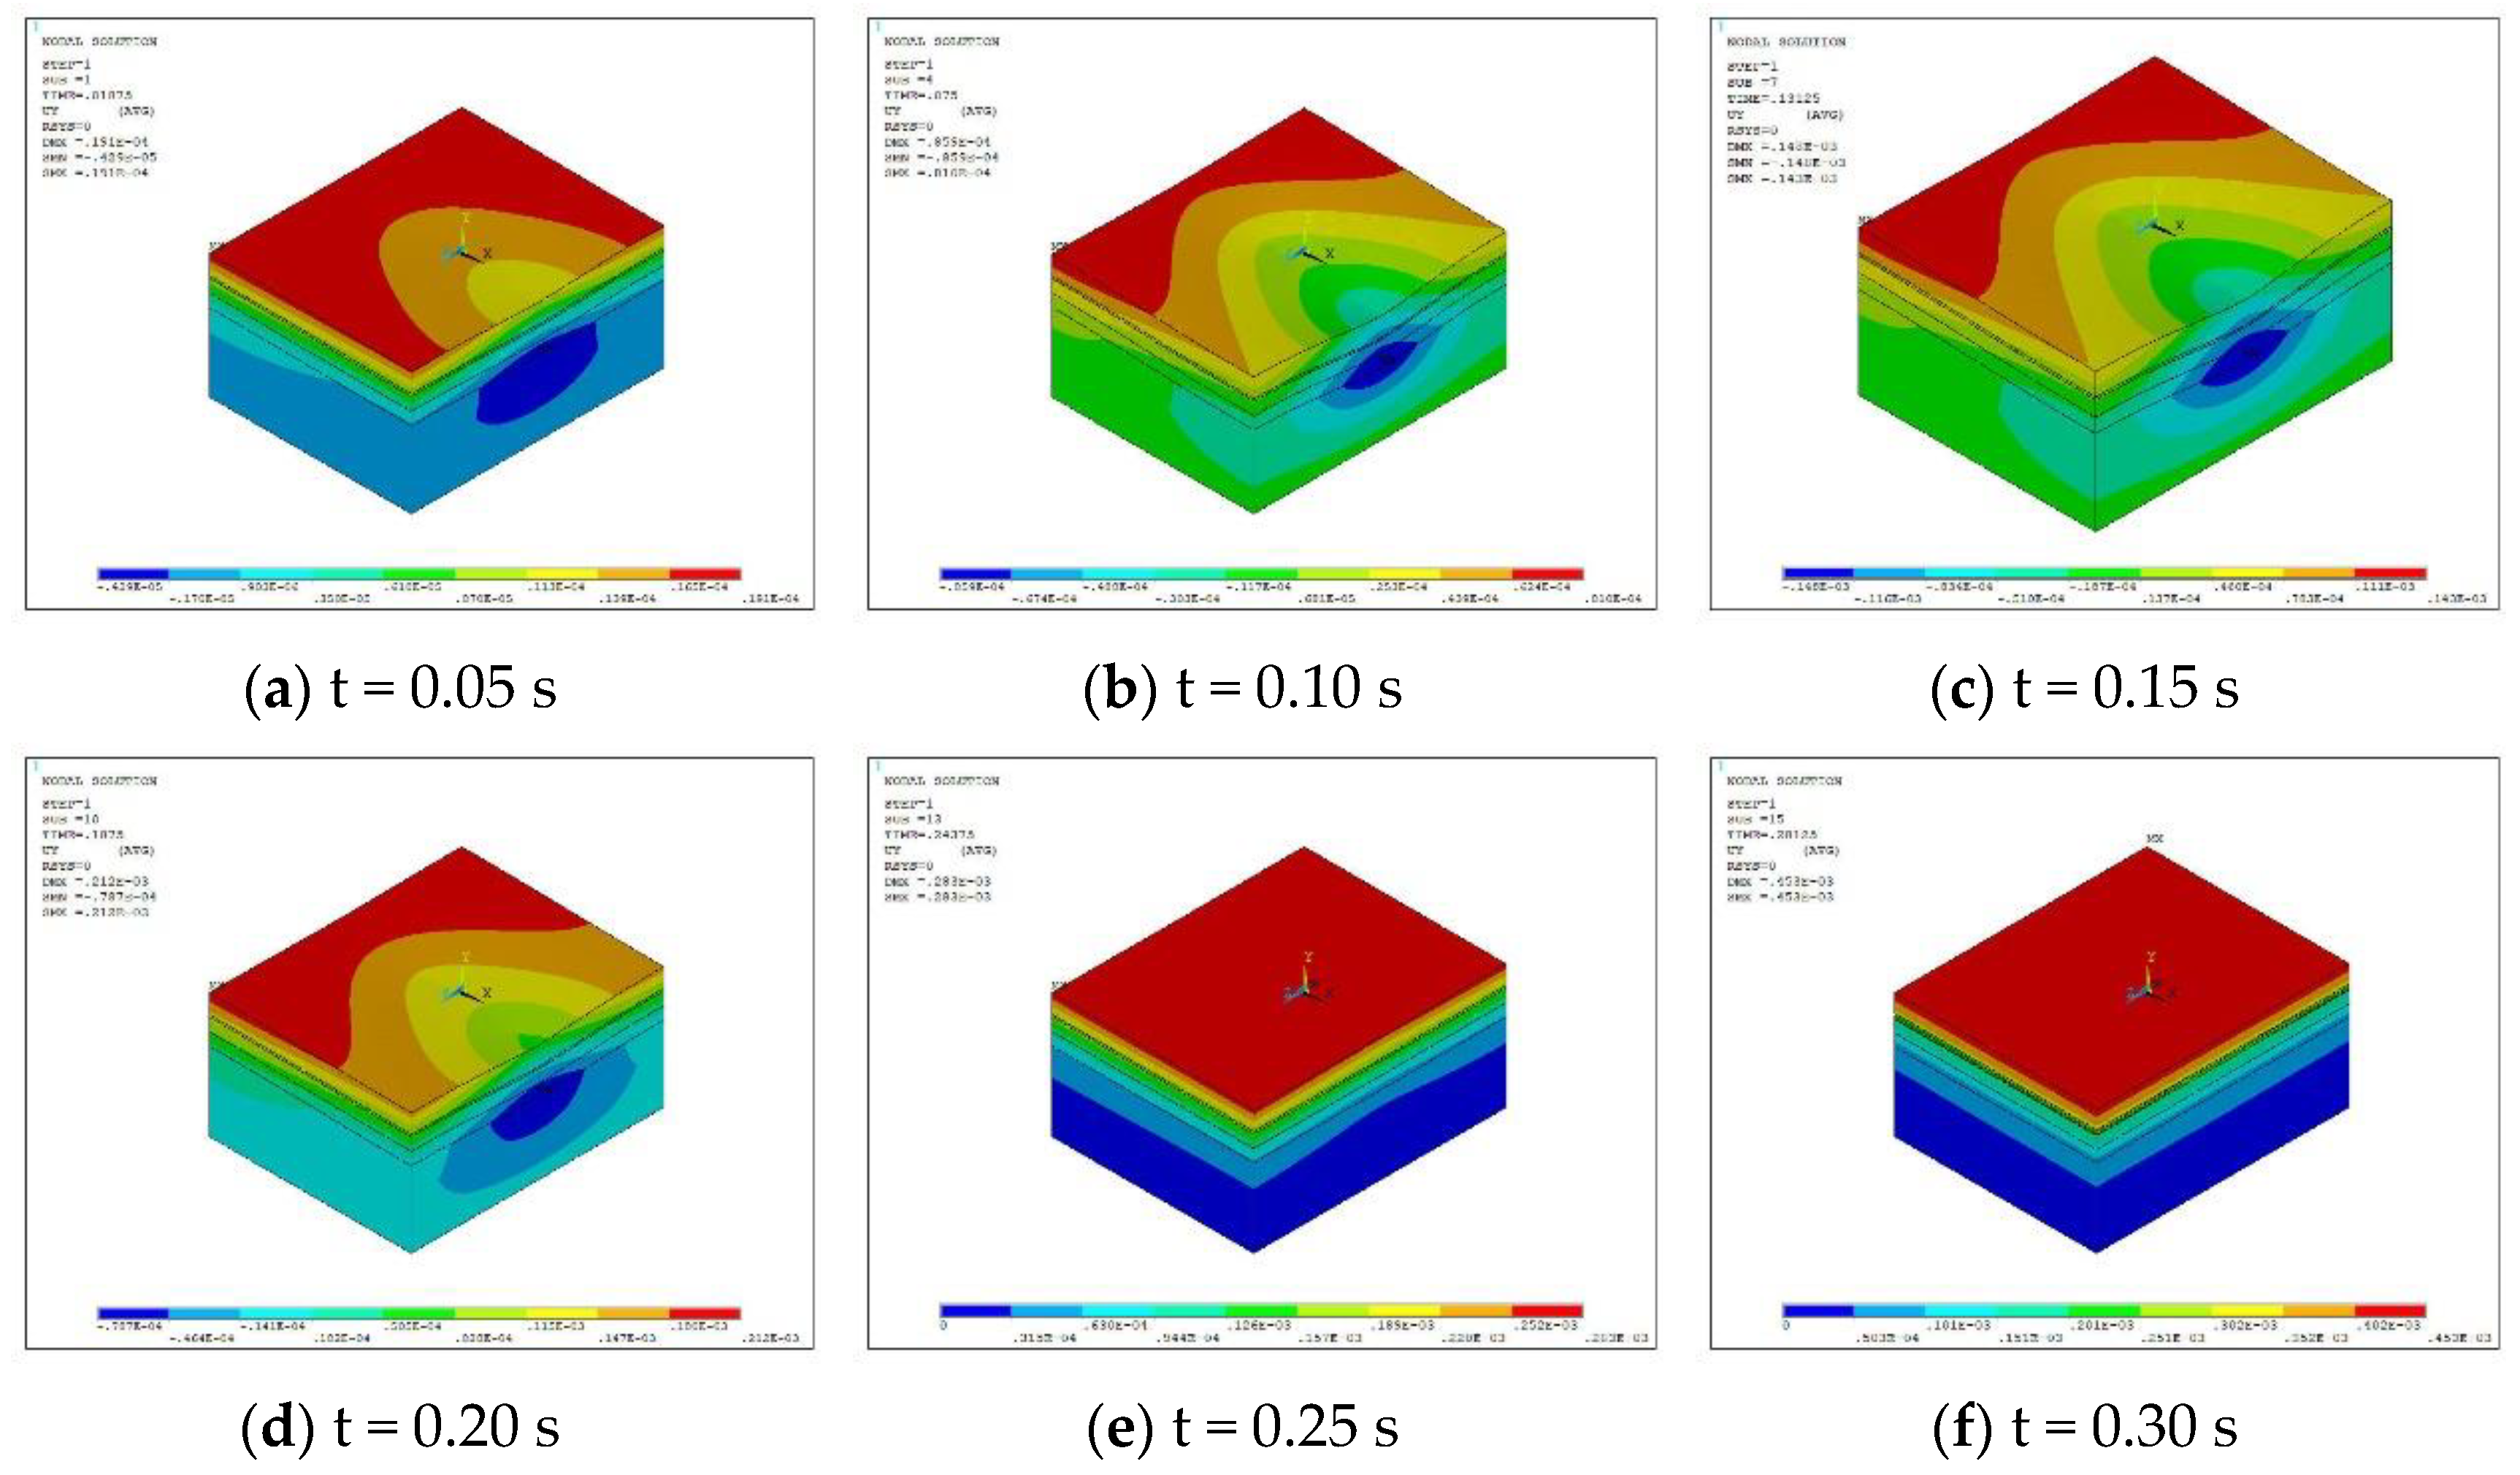
Figure 19 shows the structural deformation cloud map of different load times when the vehicle passes through the middle of the panel under high-temperature weather conditions. As shown in Figure 19, the maximum compression deformation occurs at the bottom of the longitudinal joint base, and the maximum warping deformation occurs at the plate angle away from the longitudinal joint. During the movement of the vehicle, the compression deformation first increases and then decreases, and the compression deformation is largest when the vehicle acts on the middle of the longitudinal seam edge, which is 0.148 mm, and the warpage deformation gradually increases, and the maximum warpage deformation is 0.453 mm.

3.2.2. Responses to Coupled Medium Temperature and Moving Load

The time-dependent curves of the tensile stress, compressive stress, and vertical deformation in each structural layer of the pavement are shown in Figure 20.
Figure 20 reveals that the tensile and compressive stresses and vertical deformation changes due to a moving load under a medium temperature are similar to those under a high temperature. However, under a medium temperature, the compressive stress of the top surface layer is relatively small, and no tensile stress exists at the bottom of the surface layer.
Under medium-temperature weather conditions, the structural deformation nephogram of different load times when the vehicle passes through the middle of the panel is shown in Figure 21.
It can be seen from Figure 21 that the vertical deformation of the medium temperature-wheel load coupling is also similar to that of the high temperature–wheel load coupling. However, the compression deformation increases slightly at a medium temperature. The maximum compression deformation of the surface layer is 0.125 mm, and the maximum compression deformation of the base layer is 0.157 mm. The arch deformation decreases compared with that at a high temperature, and finally the road surface produces 0.158 mm arch.

3.2.3. Responses to Coupled Low Temperature and Moving Load

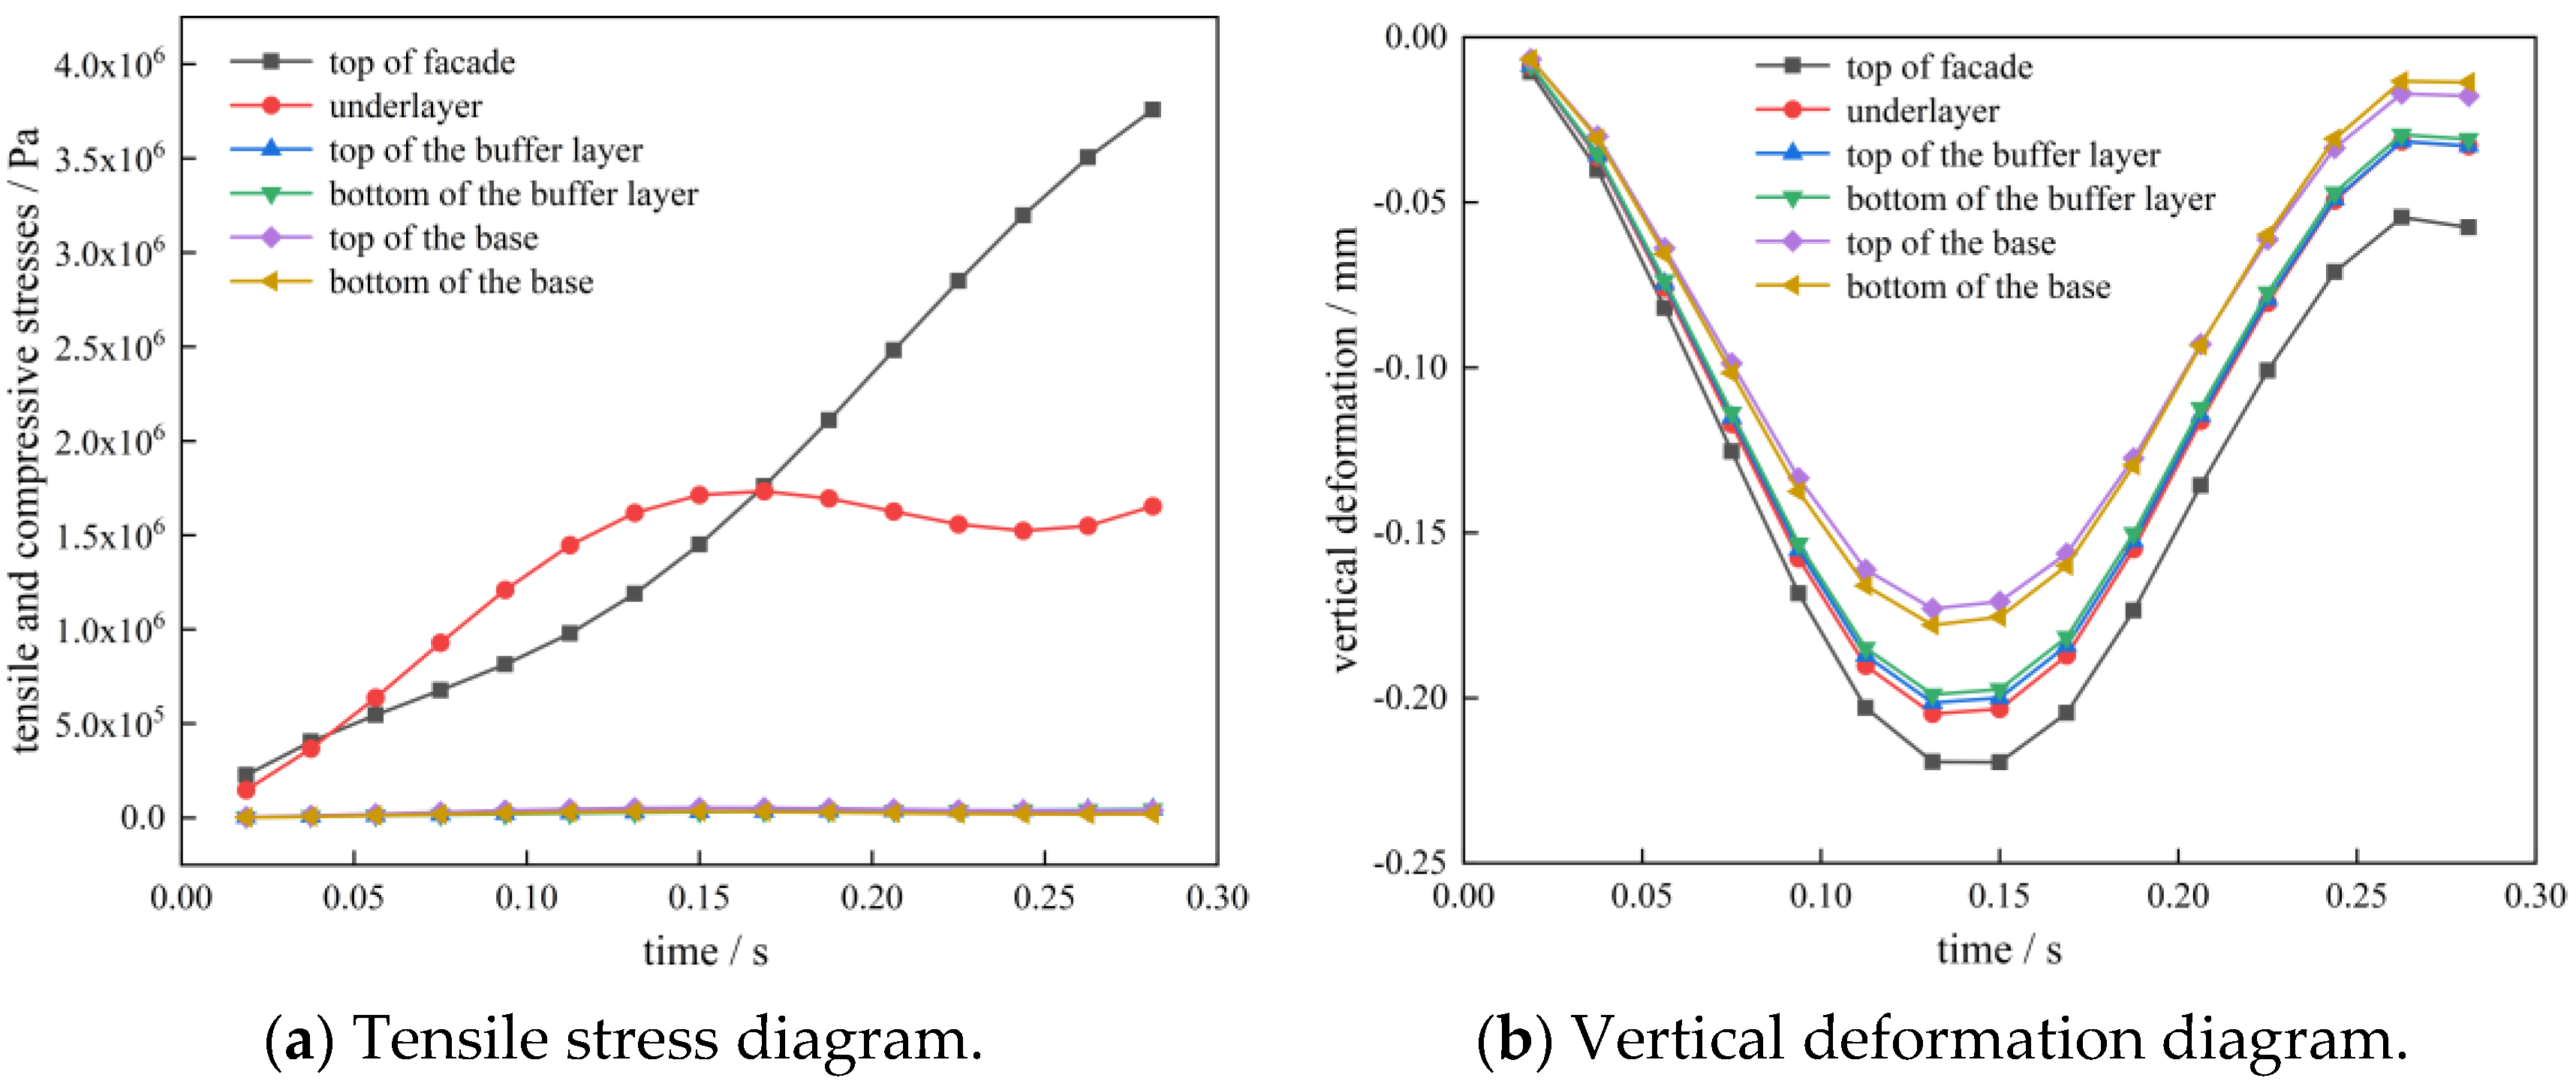
The time-dependent curves of the tensile stress, compressive stress, and vertical deformation in each structural layer of the pavement are shown in Figure 22.
As shown in Figure 22a, under low-temperature weather conditions, clear tensile stress is generated in the surface layer when the vehicle passes through the middle of the panel. The maximum tensile stresses at the top and bottom of the surface layer are 3.77 and 1.73 MPa, respectively.
As shown in Figure 22b, when low temperature is coupled with a moving load, only compression deformation occurs in each structural layer, and the deformation curve is symmetrical. When the vehicle is driven to the middle of the panel, the deformation is largest. Compression deformation is recovered gradually after the vehicle leaves.
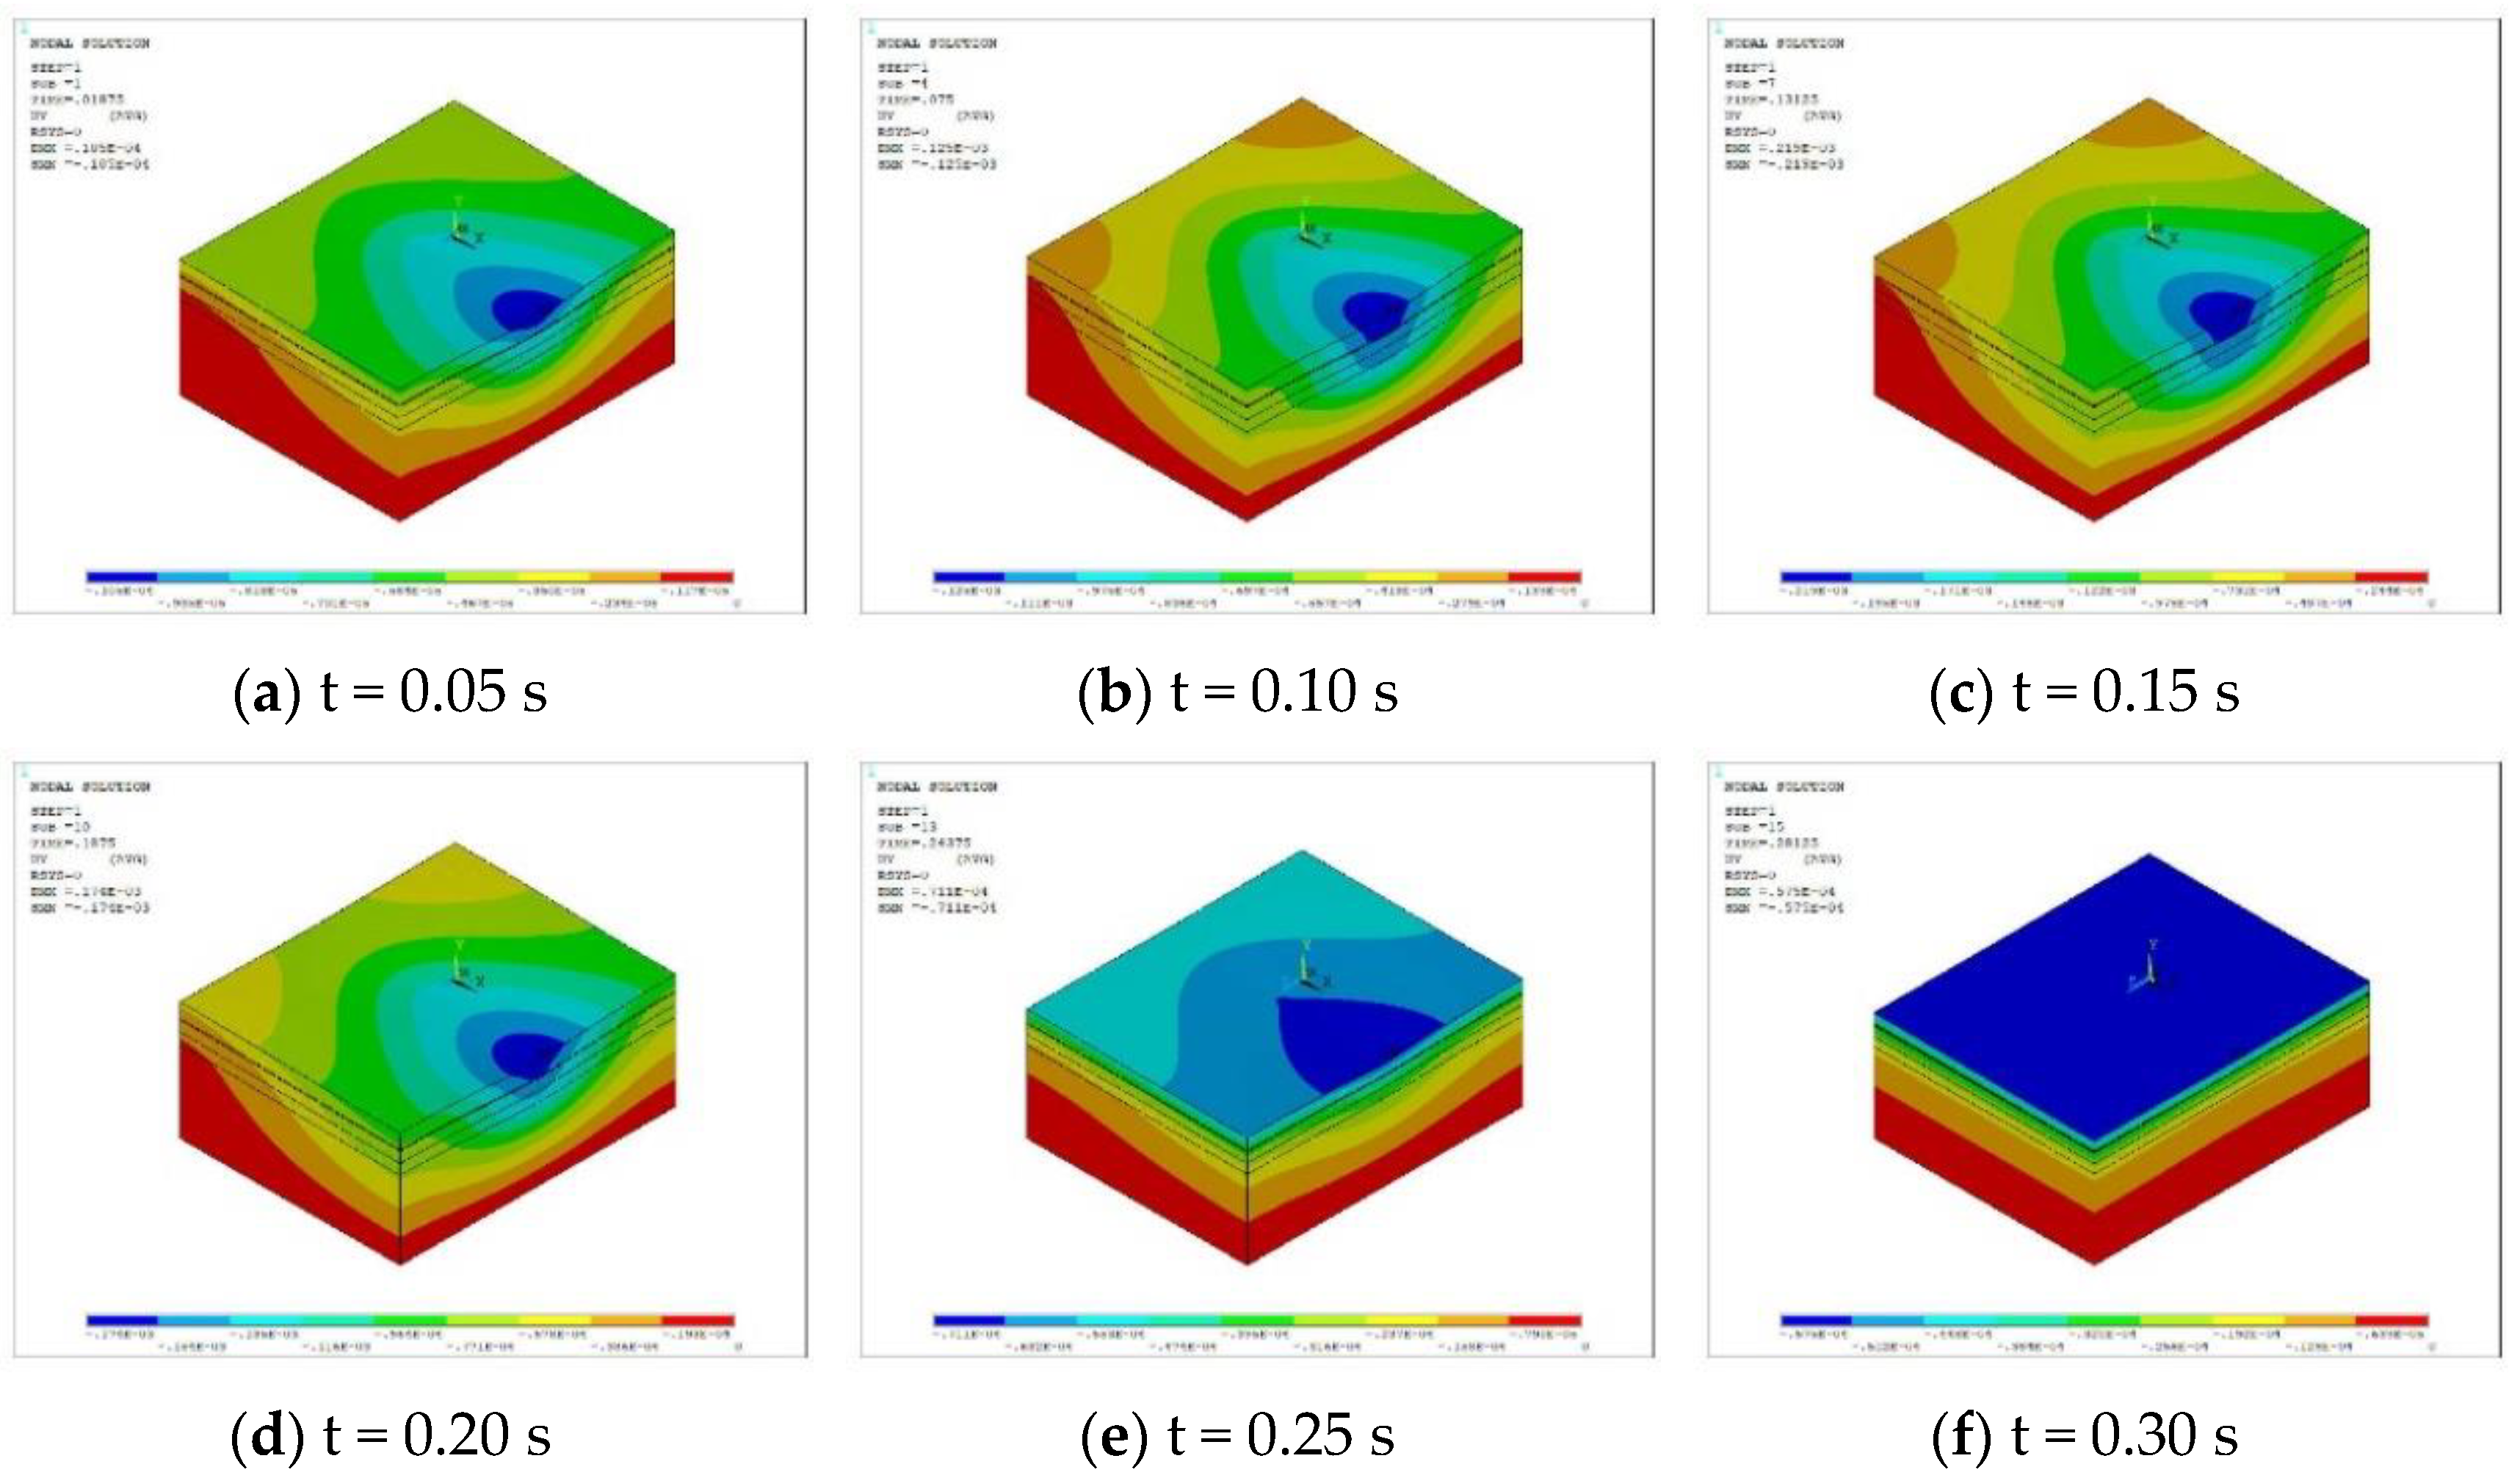
Figure 23 shows the structural deformation cloud diagrams of different load times when the vehicle passes through the middle of the panel under low-temperature weather conditions. As shown in Figure 23, when the low temperature–wheel load is coupled, only compression deformation is generated in the pavement. The deformation of the middle plate top at the edge of the longitudinal joint is the largest. When the vehicle passes through this position, the deformation increases first and then decreases. The deformation is the largest when it acts there, and the deformation is 0.219 mm.
Comparing the stress outcomes corresponding to the three coupling effects, it is found that the changes in the tensile and compressive stresses only occur in the panel. Under the coupling conditions of high, medium, and low temperatures, the maximum tensile stress was respectively localized at the bottom, middle, and top of the plate near the load position. The maximum tensile stress was located at the corner of the plate at high and low temperatures, and the tensile stress at low temperatures was much larger than that at high and medium temperatures. Considering the location and size of tensile stress, the pavement structure was the least likely to be damaged subject to the action of medium-temperature coupling effects.
By comparing and analyzing the deformation owing to the three coupling effects, it was found that there were compression and warping deformations in the structure at high and medium temperatures, but only compression deformation occurred in the pavement at low-temperature wheel–load-coupling conditions. The warpage deformation is the largest at high temperatures, and the compression deformation is the largest at low temperatures. When the vehicle passes by, the deformation caused by low temperatures can be completely restored, and the pavement will continue to expand upward after the compression deformation is restored under high- and medium-temperature conditions. Considering these outcomes, it is inferred that this type of pavement structure is suitable for use in areas with moderate temperatures.

4. Discussion

In this study, the mechanical response of a cement concrete pavement structure with a buffer layer under temperature and moving-load conditions is investigated. By comparing the temperature-induced stresses under three different temperature scenarios, it is found that the surface layer experiences the most significant changes in temperature-induced stress. In addition, the longer the temperature variation time, the higher the stress within the pavement structure. Specifically, under low-temperature conditions, the temperature-induced stress at the top of the pavement panel reached its peak, with maximum stress values ranging from 2 to 2.36 MPa. Notably, this closely agrees with the maximum temperature stress of 2.17 MPa calculated in [26]. However, the maximum temperature stress of concrete pavement under a low temperature is 2.6 MPa, which leads to obvious corner warping.
Furthermore, by comparing the maximum stress values under the coupling of three temperature conditions and moving load, it can be found that the maximum tensile stress at the top of the surface layer under low-temperature conditions was 3.77 MPa, slightly exceeding the 3.43 MPa calculated in [27], with a relative error of 9.91%. Based on the temperature field and mechanical response under the coupling of temperature and moving load, low-temperature conditions are the most unfavorable environment for cement concrete pavements with a buffer layer, therefore, necessitating an increase in the thickness of the cement concrete surface layer in the pavement structure design.
Numerous research findings have corroborated that the stress experienced by cement concrete pavements under moving loads surpasses that under static loads [38,39,40], which is the same as the calculation of the maximum stress under different vehicle speeds in this study. The results are shown in Table 18.
The fatigue stress σ p r generated at the critical load position in the specification [27] is shown in Equation (8):
σ p r = k r k c k f σ p s
where k c is a comprehensive coefficient that considers the difference between the calculation theory and practice and the influence of the dynamic load and other factors. The recommended values of the comprehensive coefficient k c in the specifications are listed in Table 19.
As shown in Table 19, under the same speed conditions, the road grade decreases, the maximum stress of the road surface increases, and the dynamic load coefficient increases. The k c value in Table 19 is opposite to the above law; therefore, the k c value needs to be corrected.
Based on the stress response at different speeds, the comprehensive coefficient k c of the fatigue equation was modified, and the recommended values are listed in Table 20.
Owing to the limited experience, there are still some deficiencies in the research, which need to be further studied:
(1) It is necessary to analyze further the failure mechanism of this type of pavement.
(2) Only the asphalt mixture was considered for the buffer layer material, and other materials were not screened. Subsequently, the material screening range of the buffer layer material can be expanded.

5. Conclusions

This study investigated the mechanical response of cement concrete pavement structures with buffer layers under the combined effect of temperature and moving loads. The temperature in a cement concrete pavement with a buffer layer exhibits periodic changes and a non-linear distribution along the depth. Through interlayer shear and buffer layer creep tests, the mechanical behavior of the pavement was analyzed using finite-element numerical calculations. The main conclusions drawn from this study are as follows:
(1) Under different temperature conditions, temperature-induced stress is primarily concentrated in the buffer layer and above the structural layer. At high temperatures, the stress is tension–compression–tension from top to bottom; at medium temperatures, it is compression–tension–compression; and at low temperatures, it decreases gradually. The vertical strain varies similarly with depth and time, and the pavement exhibits pronounced corner warping at low temperatures.
(2) Under the combined effect of temperature and moving load, the stress, vertical deformation, and structural deformation of the cement concrete pavement structure layer first increase, then decrease during the load-moving process, and reach a maximum when the load moves directly above the calculation point. The warpage deformation of the pavement is most pronounced at high temperatures, and the compression deformation is most significant at low temperatures.
(3) The combined effect of temperature and moving load results in the most significant changes in the tensile and compressive stresses at the surface layer, particularly at the top. In contrast, changes in the buffer layer and underlying structure are comparatively smaller. Notably, under low-temperature conditions, the top of the surface layer experiences maximum tensile stress, with an error of 9.91% relative to the calculations in the literature. Consequently, an increase in the thickness of the cement concrete surface layer is recommended when designing cement concrete pavement structures with buffer layers.

Author Contributions

The authors confirm that the contributions to the paper are as follows: study conception and design: K.W., X.L. and P.H.; laboratory test: H.X. and L.Q.; finite-element calculation: L.F.; analysis and interpretation of results: K.W., X.L. and P.H.; draft manuscript preparation: K.W., X.L. and P.H. All authors have read and agreed to the published version of the manuscript.

Funding

The research of this paper was financially supported by the Science and Technology Program of Shandong Provincial Department of Transportation of China (Grant No. 2022B109).

Institutional Review Board Statement

Not applicable.

Informed Consent Statement

Not applicable.

Data Availability Statement

The table data used to support the findings of this study are included within the article. The image data used to support the findings of this study are available from the corresponding author upon request.

Acknowledgments

The authors are grateful to the School of Transportation and Civil Engineering in Shandong Jiaotong University for providing the experimental equipment and materials used in this study.

Conflicts of Interest

The authors declare no conflicts of interest.

References

  1. Kazmierowski, T.J.; Sturm, H. Performance of unbonded concrete overlay project in Canada. Transp. Res. Rec. 1994, 169–173. Available online: https://trid.trb.org/View/424657 (accessed on 18 December 2023).
  2. Eacker, M.J.; Bennett, A. Unbonded Concrete Overlay Demonstration Project on I-75 in Ogemaw County; Michigan Department of Transportation: Lansing, MI, USA, 2005; pp. 1–33.
  3. Kim, J.; Buttlar, W.G. Analysis of reflective crack control system involving reinforcing grid over base-isolating interlayer mixture. J. Transp. Eng. 2002, 128, 375–384. [Google Scholar] [CrossRef]
  4. Rith, M.; Kim, Y.K.; Lee, S.W.; Park, J.Y.; Han, S.H. Analysis of in situ bond strength of bonded concrete overlay. Constr. Build. Mater. 2016, 111, 111–118. [Google Scholar] [CrossRef]
  5. Cai, Y.; Sangghaleh, A.; Pan, E. Effect of anisotropic base/interlayer on the mechanistic responses of layered pavements. Comput. Geotech. 2015, 65, 250–257. [Google Scholar] [CrossRef]
  6. Hu, L.; Yao, J.; Wang, Z. Interlaminar Mechanical Properties of Cement Concrete Pavement Structures with Isolation Layer. J. Perform. Constr. Facil. 2021, 35, 04021093. [Google Scholar] [CrossRef]
  7. Itani, H.; Saad, G.; Chehab, G. The use of geogrid reinforcement for enhancing the performance of concrete overlays: An experimental and numerical assessment. Constr. Build. Mater. 2016, 124, 826–837. [Google Scholar] [CrossRef]
  8. Wang, J.C.; Zeng, X.; Mullen, R.L. Three-dimensional finite element simulations of ground vibration generated by high-speed trains and engineering countermeasures. J. Vib. Control 2005, 11, 1437–1453. [Google Scholar] [CrossRef]
  9. Zaman, M.; Taheri, M.R.; Alvappillai, A. Dynamic response of a thick plate on viscoelastic foundation to moving loads. Int. J. Numer. Anal. Methods Geomech. 1991, 15, 627–647. [Google Scholar] [CrossRef]
  10. Hardy, M.S.A.; Cebon, D. Importance of speed and frequency in flexible pavement response. J. Eng. Mech. 1994, 120, 463–482. [Google Scholar] [CrossRef]
  11. Deng, Y.; Luo, X.; Gu, F.; Zhang, Y.; Lytton, R.L. 3D simulation of deflection basin of pavements under high-speed moving loads. Constr. Build. Mater. 2019, 226, 868–878. [Google Scholar] [CrossRef]
  12. Wu, J.; Liang, J.; Adhikari, S. Dynamic response of concrete pavement structure with asphalt isolating layer under moving loads. J. Traffic Transp. Eng. (Engl. Ed.) 2014, 1, 439–447. [Google Scholar] [CrossRef]
  13. Zhang, Z.; Pan, E. Time-harmonic response of transversely isotropic and layered poroelastic half-spaces under general buried loads. Appl. Math. Model. 2020, 80, 426–453. [Google Scholar] [CrossRef]
  14. Ai, Z.Y.; Ren, G.P. Dynamic analysis of a transversely isotropic multilayered half-plane subjected to a moving load. Soil Dyn. Earthq. Eng. 2016, 83, 162–166. [Google Scholar] [CrossRef]
  15. Qin, Y. Pavement surface maximum temperature increases linearly with solar absorption and reciprocal thermal inertial. Int. J. Heat Mass Transf. 2016, 97, 391–399. [Google Scholar] [CrossRef]
  16. Qin, Y.; Hiller, J.E. Modeling the temperature and stress distributions in rigid pavements: Impact of solar radiation absorption and heat history development. KSCE J. Civ. Eng. 2011, 15, 1361–1371. [Google Scholar] [CrossRef]
  17. García, J.A.R.; Castro, M. Analysis of the temperature influence on flexible pavement deflection. Constr. Build. Mater. 2011, 25, 3530–3539. [Google Scholar] [CrossRef]
  18. Wang, X.; Li, K.; Zhong, Y.; Xu, Q.; Li, C. XFEM simulation of reflective crack in asphalt pavement structure under cyclic temperature. Constr. Build. Mater. 2018, 189, 1035–1044. [Google Scholar] [CrossRef]
  19. Mackiewicz, P. Thermal stress analysis of jointed plane in concrete pavements. Appl. Therm. Eng. 2014, 73, 1169–1176. [Google Scholar] [CrossRef]
  20. Jeong, J.H.; Zollinger, D.G. Environmental effects on the behavior of jointed plain concrete pavements. J. Transp. Eng. 2005, 131, 140–148. [Google Scholar] [CrossRef]
  21. Assogba, O.C.; Tan, Y.; Zhou, X.; Zhang, C.; Anato, J.N. Numerical investigation of the mechanical response of semi-rigid base asphalt pavement under traffic load and nonlinear temperature gradient effect. Constr. Build. Mater. 2020, 235, 117406. [Google Scholar] [CrossRef]
  22. Tautou, R.; Picoux, B.; Petit, C. Temperature influence in a dynamic viscoelastic modeling of a pavement structure. J. Transp. Eng. Part B Pavements 2017, 143, 04017012. [Google Scholar] [CrossRef]
  23. Assogba, O.C.; Tan, Y.; Sun, Z.; Lushinga, N.; Bin, Z. Effect of vehicle speed and overload on dynamic response of semi-rigid base asphalt pavement. Road Mater. Pavement Des. 2021, 22, 572–602. [Google Scholar] [CrossRef]
  24. Tarr, S.M.; Okamoto, P.A.; Sheehan, M.J.; Packard, R.G. Bond interaction between concrete pavement and lean concrete base. Transp. Res. Rec. 1999, 1668, 9–16. [Google Scholar] [CrossRef]
  25. Chan Suh, Y.; Woo Lee, S.; Soo Kang, M. Evaluation of subbase friction for typical Korean concrete pavement. Transp. Res. Rec. 2002, 1809, 66–73. [Google Scholar] [CrossRef]
  26. JTG D40-2011; Code for Design of Cement Concrete Pavement of Highway. China Communications Press: Beijing, China, 2011.
  27. JTG F40-2004; Standard Specification for Construction and Acceptance of Highway Asphalt Pavement. China Communications Press: Beijing, China, 2011.
  28. ANSYS Incorporation. ANSYS Structural Analysis Guidesrelease 10.0; ANSYS Incorporation: Canonsburg, PA, USA, 2005. [Google Scholar]
  29. Huang, Y.H. Pavement Analysis and Design; Pearson Prentice Hall: Upper Saddle River, NJ, USA, 2004. [Google Scholar]
  30. Guan, Y.; Gao, Y.; Sun, R.; Won, M.C.; Ge, Z. Experimental study and field application of calcium sulfoaluminate cement for rapid repair of concrete pavements. Front. Struct. Civ. Eng. 2017, 11, 338–345. [Google Scholar] [CrossRef]
  31. Qin, Y.; Hiller, J.E. Modeling temperature distribution in rigid pavement slabs: Impact of air temperature. Constr. Build. Mater. 2011, 25, 3753–3761. [Google Scholar] [CrossRef]
  32. Schindler, A.; Ruiz, J.; Rasmussen, R.; Chang, G.; Wathne, L. Concrete pavement temperature prediction and case studies with the FHWA HIPERPAV models. Cem. Concr. Compos. 2004, 26, 463–471. [Google Scholar] [CrossRef]
  33. Hermansson, Å. Mathematical model for calculation of pavement temperatures: Comparison of calculated and measured temperatures. Transp. Res. Rec. 2001, 1764, 180–188. [Google Scholar] [CrossRef]
  34. Lee, Y.; Choi, M.S.; Yi, S.T.; Kim, J.K. Experimental study on the convective heat transfer coefficient of early-age concrete. Cem. Concr. Compos. 2009, 31, 60–71. [Google Scholar] [CrossRef]
  35. Wu, G. Temperature Stress Analysis of Semi-Rigid Pavement; Scientific Press: Christchurch, New Zealand, 1995; p. 10. [Google Scholar]
  36. Jeong, J.H.; Zollinger, D.G. Finite-element modeling and calibration of temperature prediction of hydrating Portland cement concrete pavements. J. Mater. Civ. Eng. 2006, 18, 317–324. [Google Scholar] [CrossRef]
  37. Huang, Y.; Nojumi, M.M.; Hashemian, L.; Bayat, A. Evaluation of a machine learning approach for temperature prediction in pavement base and subgrade layers in Alberta, Canada. J. Transp. Eng. Part B Pavements 2023, 149, 04022076. [Google Scholar] [CrossRef]
  38. Khavassefat, P.; Jelagin, D.; Birgisson, B. Dynamic response of flexible pavements at vehicle–road interaction. Road Mater. Pavement Des. 2015, 16, 256–276. [Google Scholar] [CrossRef]
  39. Khavassefat, P.; Jelagin, D.; Birgisson, B. The non-stationary response of flexible pavements to moving loads. Int. J. Pavement Eng. 2015, 17, 458–470. [Google Scholar] [CrossRef]
  40. Lu, Z.; Hu, Z.; Yao, H.-L.; Liu, J. Field evaluation and analysis of road subgrade dynamic responses under heavy duty vehicle. Int. J. Pavement Eng. 2016, 19, 1077–1086. [Google Scholar] [CrossRef]
Figure 1. Flowchart of the research.
Sustainability 16 01608 g001
Figure 2. Test specimen.
Sustainability 16 01608 g002
Figure 3. Shearing principle diagram.
Sustainability 16 01608 g003
Figure 4. Shear strength.
Sustainability 16 01608 g004
Figure 5. Interlayer bonding coefficient and cohesion.
Sustainability 16 01608 g005
Figure 6. Uniaxial dynamic creep test.
Sustainability 16 01608 g006
Figure 7. Dynamic creep test results.
Sustainability 16 01608 g007
Figure 8. Burgers model.
Sustainability 16 01608 g008
Figure 9. Comparison of experimental data and fitting curve.
Sustainability 16 01608 g009
Figure 10. Load location schematic.
Sustainability 16 01608 g010
Figure 11. Equivalent nodal force calculation schematic.
Sustainability 16 01608 g011
Figure 12. Finite-element modelling and load forms.
Sustainability 16 01608 g012
Figure 13. Average near-surface temperature from December 2020 to November 2022.
Sustainability 16 01608 g013
Figure 14. Stress-distribution diagram under three kinds of panel constraints.
Sustainability 16 01608 g014
Figure 15. Temperature change curve of pavement structure.
Sustainability 16 01608 g015
Figure 16. Stress variation curve of pavement structure.
Sustainability 16 01608 g016
Figure 17. Strain change curve for the pavement structure.
Sustainability 16 01608 g017
Figure 18. Stress–strain curves under high temperature coupled with moving loads.
Sustainability 16 01608 g018
Figure 19. Deformation cloud diagram under the coupling of high temperature and moving load.
Sustainability 16 01608 g019
Figure 20. Stress–strain curves of medium temperature with moving loads.
Sustainability 16 01608 g020
Figure 21. Deformation cloud diagram under the coupling of medium temperature and moving load.
Sustainability 16 01608 g021
Figure 22. Stress–strain curves of low temperature coupled with moving loads.
Sustainability 16 01608 g022
Figure 23. Deformation cloud diagram under the coupling of low temperature and moving load.
Sustainability 16 01608 g023
Table 1. Mix proportions of cement concrete surface layer.
MaterialWaterCementSandPebble
Amount/(kg/m3)1654305611244
Table 2. AC-10 buffer layer.
Type of GradingMass Percentage (%) Passing through the Following Sieve Holes (mm)
13.29.54.752.361.180.60.30.150.075
AC-10Limit1001007558443223168
Lower limit1009045302013964
Synthetic grade10096.852.535.324.616.712.68.46.3
Table 3. Cement-stabilized gravel gradation.
Type of GradingMass Percentage (%) Passing through the Following Sieve Holes (mm)
191613.29.54.752.361.180.60.30.150.075
C-B-2Limit100938672453122151075
Lower limit1008876593522138532
Synthetic grade10090.58165.54026.517.511.57.553.5
Actual gradation value10010010010061.140.526.717.611.57.63.8
Table 4. Composition of cement-stabilized crushed stone mixture.
CompositionCrushed Stone:SandCement Content (%)Moisture Content (%)
Dosage ratio61:3967
Table 5. Combined shear specimen program.
Combined ProgramHeight of Each Level (cm)Sheared Surface
Cement-Stabilized AggregatesBuffer LayerCement Concrete
Option 1624Cement-stabilized aggregates in contact with buffer layer
Option 2426Buffer layer in contact with concrete
Option 3626Buffer layer
Table 6. Prony series calculation results.
Temperature (°C)Loading (MPa)α1α2τ1τ2
3010.67430.32578769.425250.9225
1.50.74110.258910,289.416969.4683
20.61390.38614214.841764.7026
2.50.55400.44602673.298338.6277
4010.66780.33228827.420943.8048
1.50.64280.35726631.798172.5826
20.35940.6406851.62996.9557
2.50.24790.7521410.29731.9592
5010.59980.40029473.241341.1912
1.50.62830.37176849.131554.1239
20.24130.7587497.22641.9139
2.50.30850.69151325.13772.5628
Table 7. Pavement structure material parameters.
Structural LayerThicknesses (cm)Modulus of Elasticity (MPa)Poisson’s RatioDensity (kg·m−3)Thermal Conductivity
(W/(m·°C))
Specific Heat Capacity (J/(kg·°C))Thermal Expansion (1/°C)
Cement concrete surface2831,0000.1524501.38791 × 10−5
Buffer layer385000.2523501.08942 × 10−5
Cement-stabilized aggregates2015000.2520001.28172 × 10−5
Low-dose cement-stabilized aggregate base2012000.2523001.28172 × 10−5
Soil foundation150500.418001.210205 × 10−6
Table 8. Superposition method and equivalent load of the node force.
Load PointsA/E/U/YB/D/F/J/P/T/V/XC/K/O/WG/I/Q/SH/L/N/RM
Node stacking method34 + 78 + 81 + 6 + 6 + 99 + 5 + 5 + 94 × 9
Loading(N)30481884181720322040
Table 9. Correspondence between vehicle loading frequency and vehicle speed.
Vehicle loading frequency (Hz)2520105210.5
Speed (km/h)137.2109.754.927.4115.52.7
Table 10. Hot weather (20 June 2022) near-surface temperature.
TimesNear-Surface Temperature (°C)TimesNear-Surface Temperature (°C)TimesNear-Surface Temperature (°C)
00:0024.808:0033.6316:0038.7
01:0024.4709:0036.6517:0036.52
02:0024.5310:0038.8818:0033.4
03:0024.311:0040.5319:0030.91
04:0024.0312:0041.9720:0029.32
05:0023.5513:0042.6621:0028.71
06:0026.0814:0042.1422:0027.96
07:0029.8315:0040.9623:0027.48
Table 11. Moderate weather (1 May 2022) near-surface temperature.
TimesNear-Surface Temperature (°C)TimesNear-Surface Temperature (°C)TimesNear-Surface Temperature (°C)
00:0016.5908:0024.0516:009.2
01:0019.9409:0021.8917:008.83
02:0022.7110:0017.9318:008.42
03:0024.8111:0013.8719:007.97
04:0026.0212:0012.520:007.47
05:0026.4813:0011.321:006.98
06:0026.3514:0010.4522:009.19
07:0025.5415:009.3923:0014.78
Table 12. Cold weather (30 December 2020) near-surface temperature.
TimesNear-Surface Temperature (°C)TimesNear-Surface Temperature (°C)TimesNear-Surface Temperature (°C)
00:00−9.8808:00−12.0616:00−5.65
01:00−10.0909:00−8.9917:00−8.32
02:00−10.3110:00−6.6318:00−9.04
03:00−10.5311:00−4.6619:00−9.62
04:00−10.7412:00−3.3120:00−9.81
05:00−10.9413:00−2.6621:00−9.84
06:00−12.814:00−2.8422:00−10.02
07:00−13.0815:00−3.8323:00−10.11
Table 13. Recommended values of heat exchange coefficients at different wind speeds.
Air velocity (m/s)012345678910……
Heat exchange coefficient (W/m2·°C)9.413.216.820.624.32831.735.439.142.846.5……
Table 14. Road surface heat exchange coefficient for hot weather (20 June 2022).
TimesAir Velocity (m/s)Heat Exchange Coefficient (W/m2·°C)TimesAir Velocity (m/s)Heat Exchange Coefficient (W/m2·°C)
00:001.1113.50712:000.3810.806
01:001.7415.83813:000.3610.732
02:002.1417.31814:000.7612.212
03:00216.815:000.4411.028
04:001.6715.57916:000.019.437
05:001.4414.72817:001.514.95
06:001.3914.54318:002.0617.022
07:001.0313.21119:002.6719.279
08:000.6611.84220:002.8219.834
09:000.1910.10321:002.7419.538
10:000.4611.10222:002.719.39
11:000.812.3623:002.7119.427
Table 15. Road surface heat exchange coefficient for moderate weather (1 May 2022).
TimesAir Velocity (m/s)Heat Exchange Coefficient (W/m2·°C)TimesAir Velocity (m/s)Heat Exchange Coefficient (W/m2·°C)
00:002.6719.27912:001.6915.653
01:002.2217.61413:001.7515.875
02:001.2714.09914:001.6115.357
03:001.2413.98815:001.3714.469
04:000.5711.50916:001.2914.173
05:000.129.84417:001.6715.579
06:000.029.47418:001.6715.579
07:000.4811.17619:001.4814.876
08:000.6211.69420:001.2714.099
09:000.7212.06421:001.1213.544
10:000.9712.98922:001.2413.988
11:001.8316.17123:001.0213.174
Table 16. Road surface heat exchange coefficient for cold weather (30 December 2020).
TimesAir Velocity (m/s)Heat Exchange Coefficient (W/m2·°C)TimesAir Velocity (m/s)Heat Exchange Coefficient (W/m2·°C)
00:003.7623.31212:004.2325.051
01:003.6522.90513:004.1424.718
02:003.6122.75714:003.9223.904
03:003.7423.23815:003.7223.164
04:003.6322.83116:003.3321.721
05:003.4422.12817:002.0416.948
06:002.418.2818:001.2313.951
07:002.217.5419:000.5311.361
08:002.1417.31820:000.059.585
09:002.920.1321:000.2510.325
10:003.7823.38622:000.4210.954
11:004.0824.49623:000.6511.805
Table 17. Validation of simulation analysis results.
Type of ConstraintSimulation Analysis Results (MPa)Normative Calculations (MPa) [26]Relative Error (%)
Constraints around the panel1.091.0513.7
Constraints to the panel travel direction’s degrees of freedom1.1913.2
No constraints around the panel1.2115.2
Table 18. Maximum tensile and horizontal shear stresses at different vehicle speeds.
Type of RoadSpeed (km/h)Maximum Tensile Stress (Pa)Maximum Horizontal Shear Stress (Pa)
-0819,177160,100
Low-grade roads30873,397170,841
40898,354175,298
50912,525178,027
60926,458180,466
High-grade roads40873,161170,385
50881,928173,990
60900,641175,531
70916,189179,604
80922,953180,609
Table 19. Comprehensive coefficient ( k c ).
Class of RoadMotorwayClass I RoadsClass II RoadsClass III and IV Roads
k c 1.101.051.000.95
Table 20. Recommended values of the comprehensive coefficient ( k c ).
Class of RoadLow-Grade RoadsHigh-Grade Roads
Speed (km/h) 304050604050607080
k c 1.071.101.111.131.071.081.101.121.13
Disclaimer/Publisher’s Note: The statements, opinions and data contained in all publications are solely those of the individual author(s) and contributor(s) and not of MDPI and/or the editor(s). MDPI and/or the editor(s) disclaim responsibility for any injury to people or property resulting from any ideas, methods, instructions or products referred to in the content.